Final Report WP4 – Comparison between natural and synthetic polymers Cefic‐LRI ECO52 project Sponsor European Chemicals Industry Council (Cefic) Authors Dr. Stefan Hahn Fraunhofer Institute for Toxicology and Experimental Medicine (ITEM) Nikolai‐Fuchs‐Strasse 1, 30625 Hannover, Germany [email protected] Dr. Dieter Hennecke Fraunhofer Institute for Molecular Biology and Applied Ecology (IME) Auf dem Aberg 1, 57392 Schmallenberg, Germany [email protected] Date: May 2022

Welcome message from author
This document is posted to help you gain knowledge. Please leave a comment to let me know what you think about it! Share it to your friends and learn new things together.
Transcript
Final Report
WP4 – Comparison between natural and synthetic
polymers Cefic‐LRI ECO52 project
Sponsor
European Chemicals Industry Council (Cefic)
Authors
Dr. Stefan Hahn
Fraunhofer Institute for Toxicology and
Experimental Medicine (ITEM)
Nikolai‐Fuchs‐Strasse 1, 30625 Hannover,
Germany
Dr. Dieter Hennecke
Fraunhofer Institute for Molecular Biology
and Applied Ecology (IME)
Auf dem Aberg 1, 57392 Schmallenberg,
Germany
Date: May 2022

Fraunhofer ITEM Report: WP4 Comparison Polymer page 2 of 36
Fraunhofer ITEM Report: WP4 Comparison Polymer page 3 of 36
Content Acronyms and Abbreviations .................................................................................................................. 4
1 Introduction and objectives ............................................................................................................ 5
2 Types of polymers ........................................................................................................................... 7
2.1 Natural polymers ..................................................................................................................... 8
2.2 Modified biopolymers ............................................................................................................. 9
2.3 Synthetic polymers .................................................................................................................. 9
2.4 Summary................................................................................................................................ 10
3 Specific standardized methods for testing degradability of plastics and polymers ...................... 11
3.1 Weathering ............................................................................................................................ 12
3.2 Freshwater ............................................................................................................................. 12
3.3 Soil ......................................................................................................................................... 13
3.4 Marine environment ............................................................................................................. 13
3.5 Combination of weathering and biodegradation .................................................................. 15
3.6 Summary................................................................................................................................ 15
4 Fate of polymers in the environment ............................................................................................ 17
4.1 Polymers in the environment ................................................................................................ 17
4.2 Distribution and Degradation pathway of particulate polymer substances ......................... 18
4.3 Degradation data ................................................................................................................... 19
4.3.1 Natural polymers ........................................................................................................... 20
4.3.2 Modified biopolymers ................................................................................................... 22
4.3.3 Synthetic polymers ........................................................................................................ 22
4.3.4 Examples for comparison of degradation data ............................................................. 23
4.3.5 Summary ........................................................................................................................ 24
5 Comparison natural and synthetic polymers ................................................................................ 25
6 Conclusion ..................................................................................................................................... 28
7 Acknowledgements ....................................................................................................................... 30
8 References ..................................................................................................................................... 31
Annex: Degradation data ...................................................................................................................... 36
Fraunhofer ITEM Report: WP4 Comparison Polymer page 4 of 36
Acronyms and Abbreviations
DegT50 Degradation time 50
DT50 Disappearance time 50
ISO International Organization for Standardization
MP Microplastics
NP Nanoplastics
OECD Organization for Economic Co‐operation and Development
P persistent
PAM Cationic polyacrylamide copolymers
PBS Polybutylensuccinat
PBSA Poly(butylene succinate‐co‐butylene adipate)
PBT persistent, bioaccumulative, toxic
PCL Polycaprolactone
PE Polyethylene
PEG Polyethyleneglycols
PET Poly(ethylene terephthalate)
PHB Poly(3‐hydroxybutyrate)
PHBV Poly(3‐hydroxybutyrate‐co‐3‐hydroxyvalerate)
PLA or PLLA Polylactic acid
PQ Polyquaternium
PP Polypropylene
PS Polystyrene
PVC Poly(vinyl chloride)
PVA Poly(vinyl alcohol)
PVP Poly(vinyl pyrrolidone)
RAC Risk Assessment Committee
UVCB Substances of unknown or variable composition, complex reaction products
or biological materials
vP very persistent
vPvB very persistent, very bioaccumulative

Fraunhofer ITEM Report: WP4 Comparison Polymer page 5 of 36
1 Introduction and objectives
Polymers1 are “a class of natural or synthetic substances composed of very large molecules, called
macromolecules, that are multiples of simpler chemical units called monomers”. According to IUPAC2
polymers are: "Substances composed of macromolecules, very large molecules with molecular weights
ranging from a few thousand to as high as millions of grams/mole.” And OECD3 defines a polymer as:
“A 'POLYMER' means a substance consisting of molecules characterized by the sequence of one or more
types of monomer units and comprising a simple weight majority of molecules containing at least three
monomer units which are covalently bound to at least one other monomer unit or other reactant and
consists of less than a simple weight majority of molecules of the same molecular weight. Such
molecules must be distributed over a range of molecular weights wherein differences in the molecular
weight are primarily attributable to differences in the number of monomer units. In the context of this
definition a 'MONOMER UNIT' means the reacted form of a monomer in a polymer."
A similar definition as published by OECD is also used under REACH. In accordance with REACH (Article
3(5)), a polymer is defined as a substance meeting the following criteria (ECHA, 2012): “...
(a) Over 50 percent of the weight for that substance consists of polymer molecules; and,
(b) The amount of polymer molecules presenting the same molecular weight must be less than 50
weight percent of the substance.
In the context of this definition: a "polymer molecule" is a molecule that contains a sequence of at
least 3 monomer units, which are covalently bound to at least one other monomer unit or other
reactant. …”
In addition, polymers make up many of the materials in living organisms. These so‐called natural
polymers are for example, cellulose, chitin, protein, carbohydrates such as starches etc. Natural
polymers are regarded as no concern for the environment. Natural polymers are integral parts of the
environment and though they might not meet current regulatory requirements, e.g. with regard to
degradability, it is proven that they don´t accumulate there over time.
In this report it will be evaluated how natural polymers behave under standard laboratory degradation
conditions and providing potential benchmarks for man‐made polymers. Further, the similarities and
differences between natural and synthetic polymers are in the focus. The available information on
degradation of some natural and synthetic polymers under different conditions are compared,
whereby literature data are preferred using standardized testing methods, and which compares the
degradation potential of different polymer sources using the same method.
The following questions are considered:
Which are the mechanisms to break down natural or synthetic polymers under environmental
conditions?
Can results from standard ready biodegradability tests or simulation tests for these substance
groups be extrapolated to real environmental conditions, and is this different for natural vs
synthetic polymers? Which adaptations are necessary?
Is the bioavailability (or surface area) as most important factor influencing test results on
degradation different for natural vs synthetic polymers?
How this matches with the protection goal and criteria for the persistence framework.
1 https://www.britannica.com/science/polymer 2 https://iupac.org/polymer‐edu/what‐are‐polymers 3 http://www.oecd.org/env/ehs/oecddefinitionofpolymer.htm
Fraunhofer ITEM Report: WP4 Comparison Polymer page 6 of 36
This document is part of a series of reports produced as part of the Cefic‐LRI ECO52 project: ‘Expanding
the conceptual principles and applicability domain of persistence screening and prioritization
frameworks, including single constituents, polymers, and UVCBs.’

Fraunhofer ITEM Report: WP4 Comparison Polymer page 7 of 36
2 Types of polymers
Generally, polymeric substances and materials can be grouped on their chemistry or structure.
Structural descriptors are for example chemical formula, degree of substitution, tacticity, weight‐
average molecular weight (Mw), polydispersity, number‐average molecular weight (Mn), and reactive
functional groups (ECETOC, 2020). Main types of polymers are Polyolefine, Polyester, Polyether,
Polyurethane, etc.. However, even one class of substance such as Polyethylene (PE) could be divided
in several sub‐groups such as low density PE (LDPE) or high‐density PE (HDPE) with significant different
properties (Andrady, 2017).
Another option to categorize the polymers is based on morphological descriptors (e.g. physical state,
shape, degree of crystallinity, particle size, etc) or on physico‐chemical properties (e.g. water
solubility, viscosity / melt‐flow index / glass transition temperature, density, etc.).
Overall, the nature of a polymer product having multiple components drives the determination of all
structural and morphological descriptors and physico‐chemical properties of polymers (ECETOC, 2020).
Finally, polymers can roughly be divided into fossil‐based and bio‐based polymers, i.e. polymers for
which bioresources have been used for manufacturing. Bioplastics are either bio‐based or
biodegradable, or both (European Bioplastics, 2018), which can be illustrated in a material coordinate
system of plastics as given in Figure 1. An additional group are natural polymers or biopolymers, i.e.
polymers which are made in nature. These natural polymers are expected to be biodegradable under
environmental conditions, and thus are mostly part of the group of biodegradable bioplastics.
Figure 1: Material coordinate system of plastics according to European Bioplastics (2018)
Fraunhofer ITEM Report: WP4 Comparison Polymer page 8 of 36
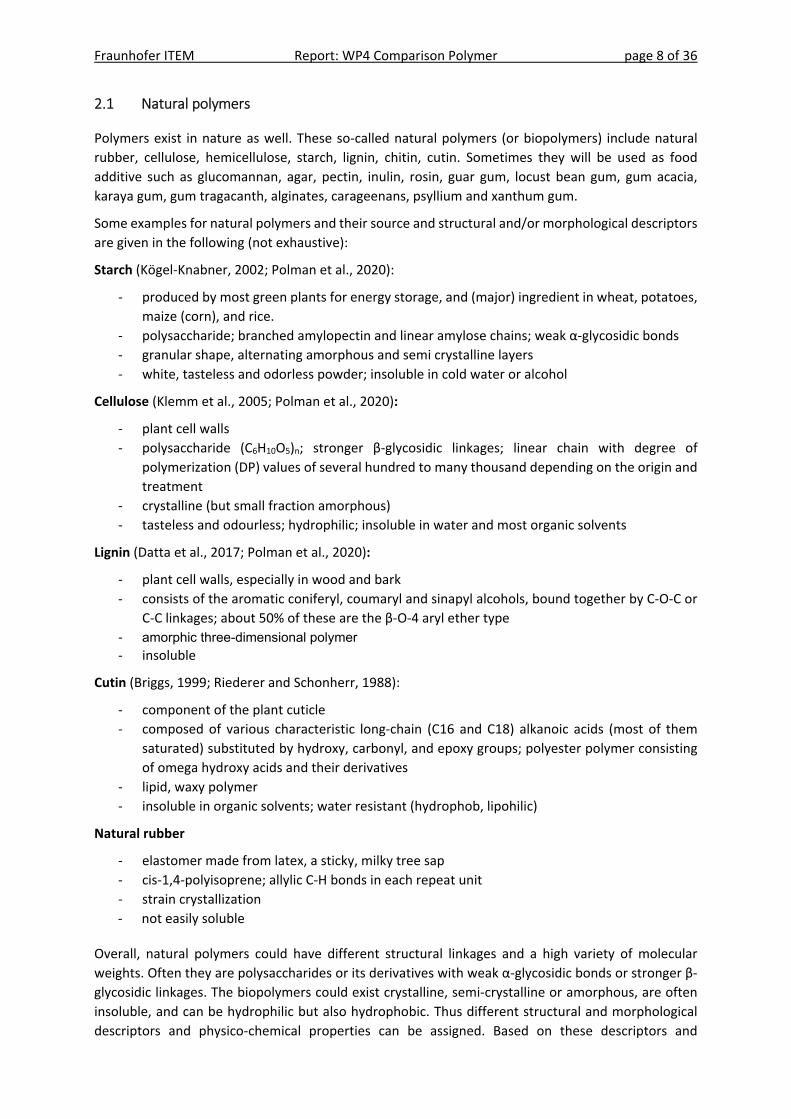
2.1 Natural polymers
Polymers exist in nature as well. These so‐called natural polymers (or biopolymers) include natural
rubber, cellulose, hemicellulose, starch, lignin, chitin, cutin. Sometimes they will be used as food
additive such as glucomannan, agar, pectin, inulin, rosin, guar gum, locust bean gum, gum acacia,
karaya gum, gum tragacanth, alginates, carageenans, psyllium and xanthum gum.
Some examples for natural polymers and their source and structural and/or morphological descriptors
are given in the following (not exhaustive):
Starch (Kögel‐Knabner, 2002; Polman et al., 2020):
‐ produced by most green plants for energy storage, and (major) ingredient in wheat, potatoes,
maize (corn), and rice.
‐ polysaccharide; branched amylopectin and linear amylose chains; weak α‐glycosidic bonds
‐ granular shape, alternating amorphous and semi crystalline layers
‐ white, tasteless and odorless powder; insoluble in cold water or alcohol
Cellulose (Klemm et al., 2005; Polman et al., 2020):
‐ plant cell walls
‐ polysaccharide (C6H10O5)n; stronger β‐glycosidic linkages; linear chain with degree of
polymerization (DP) values of several hundred to many thousand depending on the origin and
treatment
‐ crystalline (but small fraction amorphous)
‐ tasteless and odourless; hydrophilic; insoluble in water and most organic solvents
Lignin (Datta et al., 2017; Polman et al., 2020):
‐ plant cell walls, especially in wood and bark
‐ consists of the aromatic coniferyl, coumaryl and sinapyl alcohols, bound together by C‐O‐C or
C‐C linkages; about 50% of these are the β‐O‐4 aryl ether type
‐ amorphic three-dimensional polymer ‐ insoluble
Cutin (Briggs, 1999; Riederer and Schonherr, 1988):
‐ component of the plant cuticle
‐ composed of various characteristic long‐chain (C16 and C18) alkanoic acids (most of them
saturated) substituted by hydroxy, carbonyl, and epoxy groups; polyester polymer consisting
of omega hydroxy acids and their derivatives
‐ lipid, waxy polymer
‐ insoluble in organic solvents; water resistant (hydrophob, lipohilic)
Natural rubber
‐ elastomer made from latex, a sticky, milky tree sap
‐ cis‐1,4‐polyisoprene; allylic C‐H bonds in each repeat unit
‐ strain crystallization
‐ not easily soluble
Overall, natural polymers could have different structural linkages and a high variety of molecular
weights. Often they are polysaccharides or its derivatives with weak α‐glycosidic bonds or stronger β‐
glycosidic linkages. The biopolymers could exist crystalline, semi‐crystalline or amorphous, are often
insoluble, and can be hydrophilic but also hydrophobic. Thus different structural and morphological
descriptors and physico‐chemical properties can be assigned. Based on these descriptors and

Fraunhofer ITEM Report: WP4 Comparison Polymer page 9 of 36
properties, some polymers are expected to be hydrolytically more stable than others, and it is obvious
that they will have different potential for (bio)degradation.
2.2 Modified biopolymers
Natural polymers are often modified to get higher stability for (industrial) uses. These type of
bioplastics are produced from a range of natural resources, such as corn, cassava, cotton linters, or flax
fibres, and agricultural by‐products such as rice straw (Polman et al., 2020). The structure resemble
the biopolymers they are based on.
Commonly used modified biopolymers are for example thermoplastic starch (TPS), cellulose acetate
(CA) and lignin‐based polymers (Polman et al., 2020).
Thermoplastic starch and starch blends:
Starch is renewable, cheap, and abundantly available biopolymer. However, the intermolecular forces
and hydrogen bonds in starch resist it to be processed as a thermoplastic material (Khan et al., 2017).
To overcome this issue, starch will be modified to get a material called thermoplastic starches (TPSs).
During the TPS production process starch loses its natural granular shape and crystalline structure
(Polman et al., 2020). This process of destructuration is achieved by exposing starch grains to heat and
shear in combination with the addition of a plasticizer. The plasticizer breaks and replaces the
hydrogen bonds between the starch polymers, which enables the polymer chains to move more freely
(Nafchi et al., 2013; Polman et al., 2020).
Starch blends are often mentioned in the literature as well. These are usually blends of TPS with
traditional polymers. These were prepared in efforts to obtain new materials with low cost and high
biodegradability (Kaseem et al., 2012). Please note, these are also blends with non‐biodegradable
polymers such as PE, PP or PS, but also biodegradable polymers such as polylactic acid (PLA) will be
used.
Cellulose acetate
Cellulose acetate (CA) is an organic polyester produced by the acetylation of cellulose fibres from
different plant residues such as rye, rice straw, cotton, wheat or wood fibre (Polman et al., 2020).
During the acetylation, a hydrogen atom in the cellulose is replaced with an acetyl group. The extent
to which substitution takes place is called the degree of substitution (DS), which is the amount of acetyl
groups per monomer (Haske‐Cornelius et al., 2017). The DS has a significant influence on the properties
of CA, and probably also on the potential for biodegradation.
Lignin‐based polymers:
Lignin is subject to condensation reactions under high temperatures, which gives the material
thermosetting properties (Polman et al., 2020). At the moment, a first generation of lignin‐based
thermoplastics is commercially available (Wang et al., 2016), which consists of lignin, cellulose and
natural additives. In addition, lignin containing fibres are used in other bioplastics such as TPS.
2.3 Synthetic polymers
Synthetic polymers are intentionally produced as such in factory to take advantage of their properties
during use. They could be fossil‐based or bio‐based. If the identical synthetic polymer is manufactured
from either natural sources or from petroleum, the same biodegradability is expected due to the same
chemical properties.
Fraunhofer ITEM Report: WP4 Comparison Polymer page 10 of 36
The synthetic polymers cover a wide range of structural possibilities. These could be carbohydrates
polymers such as polyolefines (PE, PP), or polystyrol (PS), but also with heteroatoms, such as
polyvinylchloride (PVC), polyesters such as polyethyleneterephthalate (PET), polyether, polyamide
such as Nylon 6, etc.
Plastic materials have a wide range of densities (0.01 to 2.3 g/cm3; (Duis and Coors, 2016), although it
is worth noting that densities of plastic items can be modified by additives and environmental
processes such as weathering and fouling. Although the majority of polymers (e.g. plastics) are
immiscible in water, there are some water soluble polymers such as Polyethyleneglycols [PEG],
Poly(vinyl alcohol) [PVA] or Poly(vinyl pyrrolidone) [PVP], anionic homo‐ and copolymers of acrylic acid,
and cationic polyquaterniums [PQs] (Bernhard et al., 2008; Duis et al., 2021; Eubeler, 2010).
Finally, there are also synthetic polymers on the market which are assumed to be biodegradable such
as the polyesters polyhydroxyalkanoates (PHAs), of which polyhydroxybutyrate (PHB) is most
commonly used, polylactic acid (PLA), polycaprolactone (PCL), or polybutylene succinate (PBS). PHA
are also biopolymers, but made in factory as well.
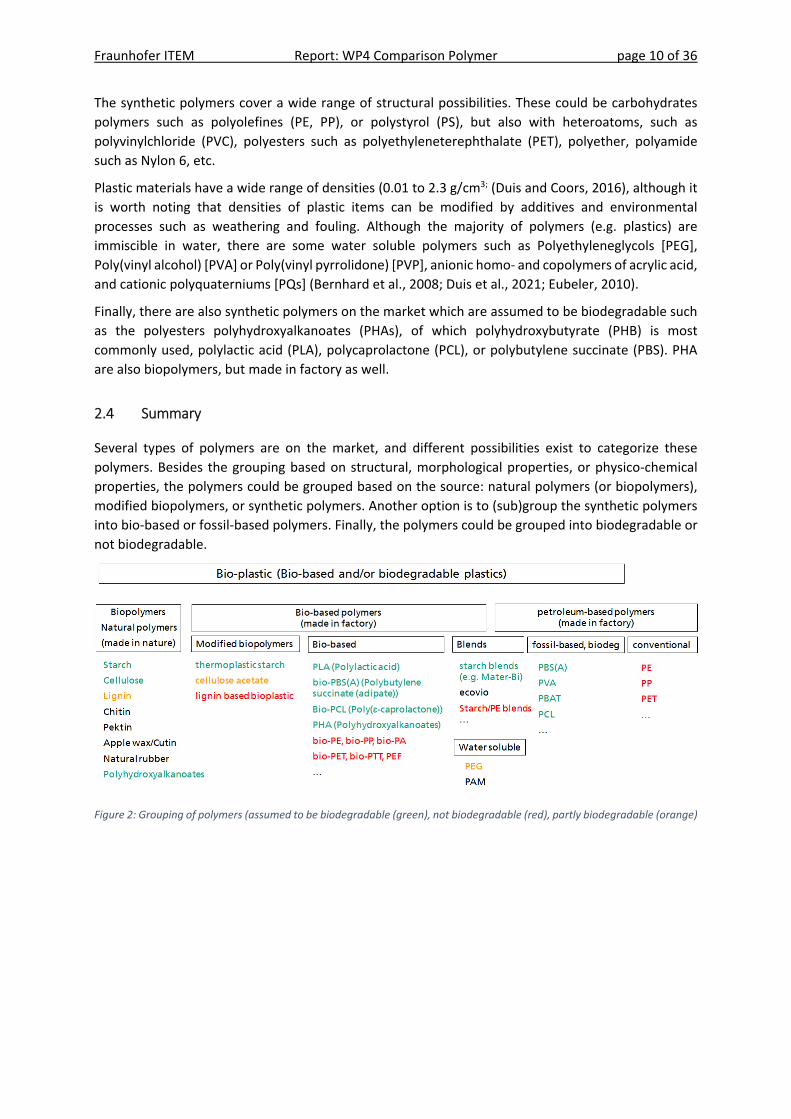
2.4 Summary
Several types of polymers are on the market, and different possibilities exist to categorize these
polymers. Besides the grouping based on structural, morphological properties, or physico‐chemical
properties, the polymers could be grouped based on the source: natural polymers (or biopolymers),
modified biopolymers, or synthetic polymers. Another option is to (sub)group the synthetic polymers
into bio‐based or fossil‐based polymers. Finally, the polymers could be grouped into biodegradable or
not biodegradable.
Figure 2: Grouping of polymers (assumed to be biodegradable (green), not biodegradable (red), partly biodegradable (orange)

Fraunhofer ITEM Report: WP4 Comparison Polymer page 11 of 36
3 Specific standardized methods for testing degradability of plastics and polymers
Recommended OECD guidelines for measurement of biodegradability were developed to assess small,
soluble molecules, and not developed to measure the biodegradation of polymers. Polymers are
usually not used in interlaboratory validation studies for those guidelines nor are polymers
recommended as reference substances. Further validation needs to be undertaken and appropriate
reference substances (e.g. natural polymers such as cellulose as performance benchmarkers) are
required if such tests should get any value in assessing the persistence of polymers. It is recognized
that sometimes information on conditions how to apply solid materials is given, for example in OECD
301 Annex III (OECD, 1992) “it is recommended that solid materials be homogenised by appropriate
means to avoid errors due to non‐homogeneity”. However, for polymers more detailed
recommendations on preparation methods and assessment of influence of particle size after
homogenisation is required.
In recent years several specific standard protocols have been adapted or developed for
(bio)degradability testing of plastic materials. These specific standards have already been reviewed in
several reports and articles (Briassoulis and Dejean, 2010; ECETOC, 2020; ECHA, 2020; Eubeler, 2010;
Eubeler et al., 2009; Kjeldsen et al., 2019; Ruggero et al., 2019). The available standards are mainly ISO
or ASTM guidelines, which are often to a large extent identical and very similar.
With focus on ISO guidelines the relevant guidelines are:
Specific guidance for test sample preparation is given in ISO 10210 (ISO, 2012).
Guidance to calculate the mineralization rate considering specific surface area is given in ISO
5148 (ISO, 2021a).
ISO/TS 19022 (ISO, 2016b) presents a method of controlled acceleration of laboratory
weathering by increased irradiance. Changes in colour can be determining using ISO 4582 (ISO,
2017); tensile properties can be determined using ISO 527 (ISO, 2019a). Chemical changes are
analysed primarily by IR spectroscopy, with additional analyses using UV/visible spectroscopy
during the photoageing of polymers (ISO 10640; ISO (2011)).
Biodegradability of plastic materials in an aqueous medium is given in ISO 14851 and ISO
14852 (ISO, 2018, 2019b).
Biodegradability of plastic materials in soil is given in ISO 17566 (ISO, 2019c). Additionally ISO
23517 (ISO, 2021b) or DIN EN 17033 (DIN, 2018) specify test methods and evaluation criteria
for the ultimate aerobic biodegradation of mulch films.
ISO 22403 (ISO, 2020b) specifies test methods and evaluation criteria for the marine
environment. Biodegradability of plastic materials in seawater is given in ISO 23977 (ISO,
2020d, e) or seawater/sediment interface in ISO 18830 and 19679 (ISO, 2016a, 2020a) or
sediment in ISO 22404 (ISO, 2019d). Additionally, ISO 23832 (ISO, 2021c) determines the
degradation rate and the disintegration degree, and ISO 22766 (ISO, 2020c) gives information
for testing under real field conditions.
Combination of weathering and (bio)degradation has been described for example in ASTM
D7991‐15. Framework is given in ASTM D6954‐18 (ASTM, 2018a).
In addition, several guidelines are available to determine the biodegradation of plastic materials under
anaerobic conditions, in sewage treatment plants, or during composting.

Fraunhofer ITEM Report: WP4 Comparison Polymer page 12 of 36
3.1 Weathering
When a polymeric material is exposed under natural outdoor weathering or artificial weathering
conditions, UV radiation and other moderate environmental stresses can result in a chemical ageing,
and a change in physical properties.
Several standard test systems (ISO and ASTM) have been developed to consider and evaluate the
effects of weathering. For example ISO/TS 19022 presents a method of controlled acceleration of
laboratory weathering by increased irradiance.
In ISO/TS 19022 (ISO, 2016b), “the base level test shall use weathering parameters (irradiance,
temperatures, relative humidity) which are not above a maximum natural level (e.g. irradiance in the
wavelength range 300 nm to 400 nm smaller than 66 W/m2). As a second step, the irradiance is
increased step by step above the natural level.” In this test the test results (property changes) should
be plotted as a function of the radiant exposure.
The changes during photoageing can be followed by determining
changes in colour (ISO 4582; ISO (2017))
other methods for appearance, mechanical or other properties; for example tensile properties
can be determined using ISO 527 (ISO, 2019a).
chemical changes by weathering are analysed primarily by IR spectroscopy, with additional
analyses using UV/visible spectroscopy during the photoageing of polymers (ISO 10640; ISO
(2011)).
3.2 Freshwater
Biodegradability of plastic materials in an aqueous medium can be determined according to ISO 14851
and ISO 14852. The first one is using oxygen consumption and the second one carbon dioxide
evolution, but the guidelines are in principle equivalent.
ISO 14851 (BOD) or 14852 (CO2):
20–25 °C (±1 °C),
inoculum from WWTP, use suspended solids in the range of 30 mg/l to 1000 mg/L in the final
mixture
duration: maximum 2 month
test material: 100 mg/l TOC; preferably powder (< 250 µm) but also films, pieces, fragments
and shaped articles
reference material: aniline and/or well‐defined biodegradable polymer (microcrystalline
cellulose, ashless cellulose filters, or poly‐β‐hydroxybutyrate): validity criteria > 60% at end,
negative control: non-biodegradable polymer (e.g. PE) result: degree of mineralization

Fraunhofer ITEM Report: WP4 Comparison Polymer page 13 of 36
3.3 Soil
Guideline for measurement of biodegradability of plastic materials in soil is available with ISO 17566
(ISO, 2019c) and ASTM 5998 (ASTM, 2018b). Both guidelines are similar; in the ASTM it is mentioned
that it is equivalent to ISO 17556. Biodegradation is determined by measuring oxygen demand in a
respirometer or the amount of carbon dioxide evolved.
ISO 17556 (BOD or CO2):
20‐28 °C (±2 °C)
mature compost added to increase biomass (40 g/kg)
duration: typically 6 month (up to 2 years);
test material: 200 mg test material on 200 g soil, preferably powder (< 250 µm) but also films
(5x5 mm), fragments and shaped articles
reference material: well‐defined biodegradable polymer {microcrystalline‐cellulose powder,
ashless cellulose filters or poly‐(R)‐3‐hydroxybutyrate [(R)‐PHB]): validity criteria: > 60% at
plateau (ISO), > 70% in 120 days (ASTM), negative control non-biodegradable polymer (e.g. PE)
result: degree of mineralization
Additionally ISO 23517 (ISO, 2021b) or DIN EN 17033 (DIN, 2018) specify test methods and evaluation
criteria for the ultimate aerobic biodegradation of mulch films. It should be noted that mulch films are
(finished) articles not a substance.
ISO 23517 or ISO 17033 (biodegradable mulch films):
reference to ISO 17556
without pre‐treatment by heat and or an exposure to radiation exposure
result: > 90% absolute or relative to reference material
ISO 23517 and ISO 17033 are not describing the test method in detail. They give reference to ISO
17566, and added only information on the evaluation criteria and requirements regarding
constituents. They address additionally the benchmarking to reference material such as cellulose. If
possible, the physical form and size of the reference material should be comparable to that of the test
material. Both the reference material and the test item shall be tested for the same length of time and
the results compared at the same point in time.
3.4 Marine environment
Test methods and evaluation criteria for the assessment of the intrinsic biodegradability of plastic
materials exposed to marine inocula under mesophilic aerobic laboratory conditions is specified in ISO
22403 (ISO, 2020b). The plastic material, polymer or each organic constituent separately shall be
tested together with reference material and negative control according to one of the following marine
biodegradation test methods: ISO 18830, ISO 19679, ISO 22404, ASTM D6691‐17, ISO 23977‐1, ISO
23977‐2. Biodegradability is proven if mineralisation absolute or relative to reference material is at
least 90 %.
In ISO 23977 (ISO, 2020d, e) the methods are described for seawater. Part 1 determines the aerobic
biodegradability by analysing the evolved carbon dioxide, whereas Part 2 measures the oxygen
demand.

Fraunhofer ITEM Report: WP4 Comparison Polymer page 14 of 36
ISO 23977 (BOD or CO2):
preferably between 15 °C to 25 °C, but not exceeding 28 °C, to an accuracy of ±1 °C, in the dark
or diffused light
inoculum: 90 ml of natural seawater (“pelagic seawater test”) or 90 ml of natural seawater to
which sediment of 0,1 g/l to 1,0 g/l (wet weight) has added (“suspended sediment seawater
test”)
test material: at least 100 mg/L (60 mg/L TOC); powder (< 250 µm) or film. Similar particle sizes
of powder should preferably be used in the test; similar shapes and thicknesses of the films
should preferably be used if different kinds of plastic materials are to be compared.
reference material: microcrystalline cellulose or ashless cellulose filters, TOC, form, and size
should be comparable to that of the test material, validity criteria > 60% after 180 days;
negative control: non‐biodegradable polymer (e.g. PE), same form as test material, validity
criteria < 10% after 180 days
duration: typically not exceed 1 year ( test may be extended, but not to longer than 2 years)
result: degree of mineralization (mean value at plateau or highest value)
ISO 18830 and 19679 (ISO, 2016a, 2020a) contain the methods for the measurement of the
biodegradation of non‐floating plastic material in seawater/sediment interface. Again, one for carbon
dioxide evolved and one for oxygen demand. A standard for sediment is given with ISO 22404 (ISO,
2019d), and this method uses the analysis of the carbon dioxide evolved.
ISO 18830 (BOD), ISO 19679 (CO2):
preferably between 15 °C to 25 °C, but not exceeding 28 °C, to an accuracy of ±2 °C, in the dark
or diffused light
inoculum: natural seawater and sediment with a water/sediment volume ratio between 3:1
and 5:1 and a sediment layer of about 0.3 cm to 0.5 cm depending on the granulometry
test material: at least 100 mg/L (ThOD 170 mg/L or TOC 60 mg/L), 150 – 300 mg/L
recommended; film or sheet, similar shapes and thicknesses should preferably be used if
different kinds of plastic materials are to be compared. (powder may be used but critical as
difficult to keep the powder settled)
reference material: ashless cellulose filters, TOC, form, and size should be comparable to that
of the test material, validity criteria > 60% after 180 days; optionally negative control: non‐
biodegradable polymer (e.g. PE), same form as test material, validity criteria no significant
amount of BOD or < 10% after 180 days
duration: typically not exceed 1 year (test may be extended, but not to longer than 2 years)
result: degree of mineralization (mean value at plateau or highest value)
ISO 22404 (CO2):
preferably between 15 °C to 25 °C, but not exceeding 28 °C, to an accuracy of ±2 °C, in the dark
inoculum: natural seawater/sediment and eliminate excess seawater before test
test material: at least 25 mg/100g (TOC 15 mg/kg), 40‐75 mg/100 g recommended; preferably
powder (< 250 µm) or as film or sheet, similar shapes and thicknesses should preferably be
used if different kinds of plastic materials are to be compared.
reference material: microcrystalline cellulose or ashless cellulose filters, TOC, form, and size
should be comparable to that of the test material, validity criteria > 60% after 180 days;
optionally negative control: non‐biodegradable polymer (e.g. PE), same form as test material,
validity criteria no significant amount (< 10%) after 180 days
duration: maximum 2 years
result: degree of mineralization (mean value at plateau or highest value)

Fraunhofer ITEM Report: WP4 Comparison Polymer page 15 of 36
Additionally, ISO 23832 (ISO, 2021c) gives information about the test methods for determination of
the degradation rate and the disintegration degree.
Degradation rates are determined by linear regression of the plot of the measurements (mass,
thickness or tensile strength at break) referred to the respective sampling time for each
sample. The regression shall be determined considering a period of at least 6 months with a
minimum of 3 measured data points. All or one endpoint is used: erosion rate as decrease of
thickness (µm/d), or the mass loss rate as decrease of mass per unit time (μg/day) or the
decrease of mass per unit time per unit surface area (μg/day/cm2), or the loss of tensile
properties rate as the decrease of strength at break per unit time (Pa/day).
Assessment of disintegration is carried out with samples protected within a pocket made with
a <2 mm mesh non‐degradable net. The net prevents the loss of particles with dimensions
higher than 2 mm. Sampling at regular intervals over testing period of 2 years; at least three
replicates. Degree of disintegration is calculated based on the percent of surface area loss and
mass loss.
Finally, ISO 22766 (ISO, 2020c) gives information for testing under real field conditions.
3.5 Combination of weathering and biodegradation
In a limited number of standards weathering and (bio)degradation has been combined. But usually,
the standards recommend to measure biodegradation, physical degradation and/or mass loss in
absence of sunlight.
Standard Guide for Exposing and Testing Plastics that Degrade in the Environment by a Combination
of Oxidation and Biodegradation is given in ASTM D6954‐18 (ASTM, 2018a). This guide presents a
framework in which established ASTM standards are used in three tiers for accelerating and measuring
the loss in properties and molecular weight by thermal and photooxidation processes.
In addition, ASTM D7991‐15, which is the Standard Test Method for Determining Aerobic
Biodegradation of Plastics Buried in Sandy Marine Sediment under Controlled Laboratory Conditions,
requires plastics in a combination of water and sediment, with the option of light imitating day light
and a temperature of 15–25 ± 2 °C (Meereboer et al., 2020).
3.6 Summary
Several standards have been developed to consider the specific needs of plastic and polymeric
material. These are mainly ISO or ASTM guidelines, which are often to a large extent identical and very
similar. Thereby guidelines for measurement of the biodegradation of plastic material include different
compartments, e.g. aqueous medium/surface water, marine water and sediment, and soil.
The ISO (and ASTM) test guidelines are usually following the degradation via indirect sum parameters
such as O2 consumption or CO2 evolution, i.e. mineralization. Relative high concentration of substance
is used, and incubation at temperatures between 15 and 28 °C. Testing reference material is prescribed
as validation criteria, e.g. cellulose is recommended in same shape and size comparable to that of the
test material. As result, these standards provide the degree of mineralization at the plateaus or after
a specific time; in addition, ISO 23517 and ISO 22403 give a benchmarking to reference material.
The main message can be summarized as follows:
Metrics used in weathering (accelerated aging): usually based on changes in colour or
functionality such as tensile test. Chemical changes are measured via IR or UV/VIS

Fraunhofer ITEM Report: WP4 Comparison Polymer page 16 of 36
Standard methods on biodegradation of plastic materials usually based on mineralization
(respirometry)
Some standards available with further metrics on degradation rate (erosion rate, mass loss
rate (mass or surface area), loss of tensile properties
Limited standards available for combination of weathering with biodegradation or for real field
conditions

Fraunhofer ITEM Report: WP4 Comparison Polymer page 17 of 36
4 Fate of polymers in the environment
Natural polymers are part of the environment, whereas synthetic polymers are intentionally produced
by mankind as such to take advantage of their properties during use and they can reach the
environment (intentionally or unintentionally) after this use. In this chapter the fate of the polymers
in the environment under different conditions are in the focus, especially the similarities and
differences between natural and synthetic polymers. In the following available information on the
presence, the distribution and degradation pathway, as well as (bio)degradation data using
standardized methods or non‐guideline methods will be presented and discussed.
The biodegradation of unmodified, naturally occurring biopolymers in soils has long been a research
interest. The biodegradation of modified biopolymers in soils has also been investigated, but not as
extensively as the degradation of unmodified biopolymers (Polman et al., 2020). For synthetic
polymers, research was historically on the stability during use, but in recent years also many studies
have been done on the (bio)degradation in different environmental compartments.
4.1 Polymers in the environment
As mentioned above and in the chapter types of polymers, natural polymers are part of the
environment, e.g. starch is produced for energy storage, chitin is part of the insect exosceleton, and
cellulose, lignin, cutin are part of cell walls or plant cuticles, etc. For this reason, in the environment
these biopolymers and/or their transformation products will be found in the top layer of soil. The
absolute amount is a result of the equilibrium between emission to the soil and the degradation
processes.
In recent years, synthetic polymers have been found in the environment in varying concentrations by
several monitoring studies. For example, in a study on German rivers microplastic particle numbers
varies from 2.9‐214 per m3, but in other studies values up to > 104 per m3 are possible (Burns and
Boxall, 2018; Triebskorn et al., 2019). Microplastic was found in surface waters of urban rivers
upstream and downstream of WWTP in mean particle number concentrations of 2.355 (±0.375) per m3
and 5.733 (±0.850) per m3, respectively (McCormick et al., 2016). However, these numbers have to be
considered with care because a recent interlaboratory study with more than 100 laboratories
organised by JRC (Belz et al., 2021) proved that there is very high variability by quantification of
microplastic from aqueous samples. Results obtained in the study on a reference sample don´t even
show a common trend, which questions the general reliability of current microplastic quantification.
Microplastic concentrations in sediment were 600,000‐fold higher than in water (Scherer et al., 2020).
In the marine environment floating MP counts as high as 103‐104 per m3 are not uncommon in coastal
regions (Andrady, 2017). Topsoils near roads and industrial areas around Sydney (Australia) might
contain up to ~7% of microplastics by weight (Chae and An, 2018; Fuller and Gautam, 2016; Machado
et al., 2018). No nanoplastics have been detected in natural environments to date (Jakubowicz et al.,
2021). In contrast Ali et al. (2021) concluded that some studies are available which reported the
occurrence of nanoplastics.
Generally, the nature of polymers being multi‐constituent substances, or even UVCBs, makes
quantification extremely challenging. Relatively few examples exist of the quantification of specific
polymers in environmental media, either in the laboratory or the field (ECETOC, 2020).
Fraunhofer ITEM Report: WP4 Comparison Polymer page 18 of 36
4.2 Distribution and Degradation pathway of particulate polymer substances
In the environment polymeric materials are often confronted to mechanical forces and/or weathering
(UV, heat, water). Weathering of plastics eventually leads to fragmentation and the creation of
secondary microplastic (Andrady, 2017). Environmental weathering promotes formation of C‐O bonds,
which promote fragmentation or further degradation. Consequences of weathering is a yellowing
discoloration, accumulation of oxidized moieties, and changes in crystallinity, which results finally in a
change of mechanical properties (Andrady, 2017).
These solid polymeric substances will behave and distribute differently to (single) soluble substances.
If the density is lower than or near that of water it will float on the surface or marine water. However,
the plastic particles (debris) becomes encrusted with foulants, increasing in density as fouling
progresses. Once the density exceeds that of (sea) water it can sink well below the water surface
(Andrady, 2011). In addition, atmospheric transport plays also a role in the distribution of microplastic
particles (Allen et al., 2020; Allen et al., 2019; Lehmann et al., 2021; Trainic et al., 2020).
Degradation of a particle is usually understood to be the shrinking of the mass of a particle, and
complete degradation of the particle occurs if the particle completely disappears. Thereby, the
compounds are sometimes not completely mineralized but transformation products will be released
into the matrix. Moreover, for macromolecules built by recurring building blocks, we can expect
probably a sequential degradation of chain length resulting in similar transformation products (e.g.
oligomere, monomere, etc.). On the other hand, we can expect also a disintegration or fragmentation
of particles. In addition, change of the surface properties could be assigned to degradation of particles
as well.
According to RAC (ECHA, 2020), “mechanical degradation or fragmentation leads to decreased particle
size and increased surface area but cannot be counted as biodegradation. As a result of mechanical
degradation plastic particles still remain and may accumulate in the environment.” If it can be shown
that disintegration will result in biodegradable non‐persistent particles, fragmentation can be
considered as a first step of plastic removal and accumulation may not be expected.
One key point is that the starting point of polymer fragmentation and degradation is often photolysis
and/or hydrolysis.
Photolysis (UV radiation) is the most important process of weathering (Andrady, 2017). In this process
the polymer or the additives such as the stabiliser can be oxidised especially in the early phases of
weathering. Oxidative degradation in weathering also occurs primarily in the amorphous fraction of
the plastic, and thus fragmentation tends to be in the amorphous fraction (Andrady, 2017). Weathering
result also in cross‐linking or chain scission, which will result in a decrease and increase of partial
crystallinity, respectively (Andrady, 2017). Clearly, most conducive to rapid weathering degradation is
exposure in the beach zone; compared to exposures on beach the weathering of floating plastics is
considerably slower (Andrady, 2011, 2017). Even an extensively weathered, embrittled plastic material
is no guarantee of subsequent biodegradability of the meso‐ or microplastic fragments (Andrady,
2011).
Hydrolysis as initial degradation step for biodegradable polymers can be divided in chemical and
enzymatic hydrolysis (Brueckner et al., 2008; Su et al., 2019). Enzymes preferentially attack the
amorphous parts (Brueckner et al., 2008), and amorphous or less‐ordered regions degrade more easily
than crystalline regions (Su et al., 2019). For Poly(3‐hydroxybutyrate‐co‐3‐hydroxyvalerate) (PHBV) the
introduction of 3‐hydroxyvalerate has a greater amorphous region, resulting in an increased
degradation rate (Meereboer et al., 2020). Enhancing the wettability by blending the matrix, may
accelerate the hydrolytic degradation process. In conclusion, crystallinity and wettability will influence
the biodegradation potential.

Fraunhofer ITEM Report: WP4 Comparison Polymer page 19 of 36
In general, the process of polymer (bio)degradation can be divided into four steps: i) biodeterioration,
ii) depolymerisation, iii) bioassimilation, and iv) mineralisation (Haider et al., 2019). The first step
results in fragmentation of the polymer into smaller particles. Microbial enzymes then in turn catalyse
the depolymerisation of the polymer chain into oligomers, dimers, or monomers. These smaller
molecules can then be taken up into microbial cells and degraded further (Wood, 2020).
Degradation of any solid polymer can be divided into two types: bulk erosion and surface erosion
(Albright and Chai, 2021; Haider et al., 2019; Meereboer et al., 2020; Su et al., 2019). In slow bulk
degradation processes caused by chemical reactions like hydrolysis, small catalysts (e.g., organic acids)
and reagents (here, water) diffuse into polymer systems (Su et al., 2019). This abiotic degradation
functions as both bulk and surface degradation and is often used as a pre‐treatment to biodegradation.
In general, bulk erosion is used for breaking the sample apart into smaller pieces (which enhances the
rate of surface erosion) and for molecular weight reduction (Meereboer et al., 2020). The biotic
(enzymatic) degradation is mainly at the surface. The reason is that enzymes are relatively large
particles and are unable to permeate the structure of polymers, in comparison to smaller chemicals,
free radicals etc. (Meereboer et al., 2020; Su et al., 2019). Zumstein et al. (2018) presents an
experimental approach to study polymer biodegradation in soils and to assess the key steps involved
in this process: microbial polymer colonization, enzymatic depolymerisation on the polymer surface,
and microbial uptake and utilization of the released low–molecular weight compounds.
Recently it is also discussed the influence of fungal enzymes by biodegradation of plastic material
(ECETOC, 2020; Gladfelter et al., 2019; Kang et al., 2019; Sánchez, 2020; Zumstein et al., 2018) in both
aquatic (marine) and terrestrial environments. A brief review on the degradation of plastics using
enzymes from various sources are given by (Kaushal et al., 2021).
Fungal enzymes play also a major role in the (bio)degradation of natural polymers. For example, starch
is degraded by glycoside hydrolases, such as α‐amylase, β‐amylase, glucoamylase and α‐glucosidase,
which are all specialised in hydrolysing α‐ glycosidic bonds (Polman et al., 2020; Warren, 1996). In
addition, starch can be made more susceptible to biodegradation by gelatinisation (Polman et al.,
2020). Fungi and eubacteria form the largest share of the cellulolytic (cellulose‐degrading)
microorganisms as well (Kögel‐Knabner, 2002; Polman et al., 2020). The group of enzymes most
responsible for extracellular cellulose degradation are cellulases, which will break the β‐glycosidic links
(Warren, 1996). For the degradation of lignin many organisms and enzymes are involved, which
reflects the complexity of lignin molecules (Polman et al., 2020). For this reason it is obvious that the
biodegradation rate is slower.
In addition, the four steps (i) biodeterioration, ii) depolymerisation, iii) bioassimilation, and iv)
mineralisation) presented by Haider et al. (2019) are relevant for natural polymers or natural polymeric
material as well. Thereby different processes including several enzymatic processes, photolyse/‐aging,
hydrolyse, as well as bulk and surface erosion will be important to shorten and fragment the polymeric
material, and finally mineralize natural polymeric material and substances. An important factor is
expected to be the wettability of the material.
4.3 Degradation data
Degradation data will usually obtained performing standardized test systems such as the OECD testing
guidelines. For polymeric substances availability of studies following these standard biodegradation
tests using OECD guidelines are limited. Screening tests such as ready biodegradable test systems
according to OECD 301 are rare. Data on simulation studies according to OECD 307, 308 or 309 are not
available or at least scarce.

Fraunhofer ITEM Report: WP4 Comparison Polymer page 20 of 36
Several studies are available following ISO or ASTM standards, especially for biodegradable synthetic
polymers. In ISO standards, reference substance are for example microcrystalline cellulose or ashless
cellulose filters and polyethylene (PE) is suggested as negative control. For this reason for these
substances many study results may be available.
Non‐guideline studies often only provide results on mass loss, or loss of functionality as indication for
degradation.
Several compilations of available degradation data have been presented in recent reviews such as
Kjeldsen et al. (2019) based on data compilation from Emadian et al. (2017)
Burgstaller et al. (2018), which is a UBA report (cited in EPA network report (EPA network ‐
Interest group on Plastics, 2018))
Polman et al. (2020) covering natural polymers and modified biopolymers
Some further degradation data from primary literature partly cited in these reviews are available as
well (e.g., Arcos‐Hernandez et al. (2012); Gómez and Michel (2013); Hashimoto et al. (2002); Kögel‐
Knabner (2002); Meereboer et al. (2020); Thevenot et al. (2010), etc.)
Further relevant literature data using standardized methods in soil are available from Novamont
(Briassoulis et al., 2020; Chinaglia et al., 2018; Pischedda et al., 2019; Tosin et al., 2019) and EU projects
(KBBPPS, 2015; Open‐Bio, 2016). These studies investigated:
Starch based (Mater‐Bi), PHB, PBSe
ASTM 5998 and ISO 17556 (mineralization in soil)
Influence of surface area, temperature
Data for water soluble polymers such as PEGs and some blends are available from Bernhard et al.
(2008), Eubeler et al. (2010), Duis et al. (2021).
Direct comparison between different natural and synthetic materials using the same test set‐up are
available from Gómez and Michel (2013) and McDonough et al. (2017).
An overview of available field/mesocosms studies for soil, freshwater and marine water is given in
Burgstaller et al. (2018). This includes for example also information from the Open‐Bio project (Open‐
Bio, 2016; Tosin et al., 2012). As any transformation product or CO2 cannot be captured, in such test
systems mostly only disintegration is measured, followed by mass loss, change of the surface of the
particles, or by visual inspection. However, Hennecke et al. (2018) presented a lysimeter study of
cationic polyacrylamide copolymers (PAMs) using radiolabelled polymer and thus mass balance was
possible. This study shows that there was practically no vertical movement of polymer but a significant
reduction of the polymer backbone chain length could be measured over time, which would not be
detectable by any of the current ISO standard tests.
Available degradation data (using standardized methods) has been compiled in an excel file (see
Annex).
4.3.1 Natural polymers
The (bio)degradation of unmodified, naturally occurring biopolymers in soils has long been a research
interest. However, results from OECD testing guidelines (screening and simulation studies) are scarce
and mainly information using ISO tests or non‐guideline studies are available. Nevertheless some data
on natural polymers have been compiled in reviews on bioplastics especially for cellulose and starch.
In addition, cellulose (microcrystalline of as ashless filter material) is the reference material for ISO
tests.
Fraunhofer ITEM Report: WP4 Comparison Polymer page 21 of 36
Overview about degradation pathway and available data for natural polymers (starch, cellulose, lignin)
are given by Polman et al. (2020). The review by Kögel‐Knabner (2002) contains a table with
information on biodegradability (percentage mineralization at different time points up to 28 weeks) of
natural substances in soil. Detailed information on the method is missing. Review of the fate of lignin
in soil is presented by Thevenot et al. (2010). In addition, some data are available for natural products,
e.g., rice hull, coconut coir, wheats straw, walnut shells, etc. (Gómez and Michel, 2013; Kögel‐Knabner,
2002; McDonough et al., 2017).
Following results can be summarized for selected natural polymers:
Cellulose
Degradation studies in freshwater (activated sludge), seawater or soil available
Recommended reference substance for ISO tests (validity criterion > 60% in 6 month, results
usually higher)
Relative fast degrading natural polymer
Some laboratory studies in soil exist with plateau at about 70% mineralization (Gómez and
Michel, 2013); other result in higher values (Briassoulis et al., 2020; Chinaglia et al., 2018;
Kögel‐Knabner, 2002; Martin and Haider, 1986; Pischedda et al., 2019; Tosin et al., 2019)
Starch:
Biodegradation asymptotic; large fraction already degrades in soil within 3 days, but can take
several weeks to year to be degraded entirely
In the laboratory starch disappeared (only partly mineralized) within 35 days in soil after
incubation (Cheshire et al., 1969; Polman et al., 2020). Other studies show high mineralization
(> 80%) in 12 weeks (Kögel‐Knabner, 2002; Martin and Haider, 1986).
Degradation rates may be dependent on concentration; decreasing up to 50% when the starch
present is <10% of the soil organic matter (SOM). Low starch concentrations, in combination
with low activity of starch degrading organisms could lead to stabilisation of starch in the SOM
fraction (German et al., 2011; Polman et al., 2020).
Lignin:
The information in the literature leads to slower degradation rates in comparison to cellulose
or starch: 19–60% degradation has been observed in laboratory experiments for 13 weeks to
2 years. Information on field studies is given with degradation up to 5 years. Other literature
reported that lignin degradation takes years or decades (Polman et al., 2020; Thevenot et al.,
2010).
Various variables and processes such as degradation or mineralization, as well as incorporation
into SOM. Lignin turnover in soils could be faster than that of the total SOM. Degradation is
related to the nature of vegetation and land‐use, but also to the climate and soil characteristics
(Thevenot et al., 2010).
Co‐metabolism with easily degradable carbon sources (sufficient energy, nutrients, enzymes)
The complex structure of lignin makes it recalcitrant to most degradation methods and
continues to pose a critical challenge (Datta et al., 2017)

Fraunhofer ITEM Report: WP4 Comparison Polymer page 22 of 36
In conclusion, the presented data about biodegradability of natural polymers are varying. The studies
are often on composting or field studies in soil, and thus are not according to standardized test
systems. As endpoint often mineralization, but also other endpoints such as mass loss. Nevertheless,
natural polymers are usually more or less biodegradable. However, rate can vary and some are more
difficult to be degraded (e.g. lignin, etc) reflecting the complexity of the substance. Information for all
three compartments (soil, aqueous, marine) for the same polymer are scarce; information on
degradation in sediment are often lacking.
Natural products has been measured in some test systems as well. In most cases these are less
degradable in the test systems used in comparison to cellulose or starch.
The review by Kögel‐Knabner (2002) presents for natural materials mineralization data (CO2 evolved)
in soil at different time points up to 28 weeks. Whereas natural substances as glycine, glucose, cellulose
or starch resulted in high mineralization (> 80%), other natural material such as walnut wood, almond
shells, pine needles resulted in significant lower biodegradation potential (< 60%). Wheat straw shows
a mineralization of about 67%, which confirms the lower potential of lignin in comparison to cellulose.
Although it seems that it is more a screening test, the kinetic verifies that starch takes longer for the
biodegradation in comparison to glucose.
Additional results about natural products are presented below (chapter 4.3.4)
4.3.2 Modified biopolymers
Overview about degradation pathway and available data for modified natural polymers (Thermoplastic
starch (TBS), Cellulose acetate (CA), Lignin‐based polymers) in comparison to the corresponding
natural polymers (starch, cellulose, lignin) are given by Polman et al. (2020). In addition, some
degradation data are available for starch blends.
Polman et al. (2020) concluded that especially in TPS, where only a higher level structural change
occurs during the bioplastic making process, biodegradation mechanisms and rates are virtually
similar. Changes in the biodegradation process are caused by changes in the chemical structure of
biopolymers, as occurs during the acetylation of cellulose to produce CA.
In conclusion, modifications of natural polymers can result in intended significant structural and
morphological changes, which may have a significant influence on the necessary processes (enzymes)
and thus on the biodegradation potential.
4.3.3 Synthetic polymers
Limited information is available using specific standards (ISO, ASTM) for classical polymers such as
polyolefins (PE, PP), PS or PET etc. However, several non‐guideline studies and field studies are
additionally available suggesting that these substances are only marginal biodegradable.
For water soluble polymers, the degradation potential depends on the molecular weight, as shown for
polyethyleneglycols (Bernhard et al., 2008; Eubeler, 2010). PEGs are more accessible to biodegradation
than Homo- and copolymers of acrylic acid or Polyquaterniums (Duis et al., 2021).
As a good overview about biodegradable synthetic polymers, Burgstaller et al. (2018) summarized
following information:
Time of biodegradation strongly depends on the environmental conditions:
Biodegradable under conditions of “industrial compostability“ (58 ± 2 °C, max. 6 month):
TPS, PHA, PCL: ca. 4‐6 weeks

Fraunhofer ITEM Report: WP4 Comparison Polymer page 23 of 36
PLA, PBAT, PBST: ca. 6‐9 weeks
PBS: ca. 21 weeks
Biodegradable in soil (20‐28 °C, max. 2 years):
TPS, PHA, PBSe, PBSeT, PBAT, PCL: ca. 7‐12 month
PLA: no degradation after 1 year
Biodegradable in fresh water (20‐25 °C, max. 56 days)
TPS, PCL, PHA: <56 days
PBS, PBSA: ca. 3 month
PLA, PBAT: >1,5 years
Biodegradable in seawater (30 °C, max. 6 month)
PHA, PCL, TPS, PBSe: <6 month
PLA, PBAT: >1,5 years
4.3.4 Examples for comparison of degradation data
In the chapters above, available degradation data for natural and synthetic polymers using
standardized methods have been presented. For comparing natural and synthetic polymers, literature
data are preferred, which compares the degradation potential using the same method. The number of
studies are very limited. Direct comparison between different natural and synthetic materials using
the same test set‐up are available from Gómez and Michel (2013) and McDonough et al. (2017). In
addition, the review by Kögel‐Knabner (2002) contains a table with information on biodegradability of
natural materials in soil (see above).
McDonough et al., 2017: (modified) OECD 301B, activated sludge
McDonough et al. (2017) investigated the degradation potential of natural materials and PHBV as a
synthetic polymer using a (modified) OECD 301 B test system.
The natural material were applied as microparticles, milled, or as powder. The organic carbon content
and the particle size of the different materials have been specified. Some of the natural materials show
significantly different degradation kinetics than others. Although the particle size of blueberry seed
was larger (100% > 500 µm), the material shows a higher degradation potential than walnut shells with
the main particle fraction between 250 – 500 µm, for which negligible mineralization has been
observed in this test system. In contrast, the results indicate a very high degradation potential for
jojoba wax of a similar particle size as walnut shells.
The synthetic PHBV has been applied in different particle sizes. As a fine powder the biodegradation is
similar to the reference substance sodium benzoate, whereas with higher particle sizes the adaptation
phase is a slightly prolonged, but the substance is still well biodegradable.
Gomez and Michel, 2013: Biodegradability in soil
The biodegradation of natural materials in soils was determined based on ASTM 5998‐03 by Gómez
and Michel (2013). Although the guideline was meanwhile revised, the test results produced some
interesting conclusions.
The biodegradation potential of the reference material (cellulose paper) was relatively high (with
about 60‐70% within 300 days). In contrast using the same test system, coconut coir, rice hull or peat

Fraunhofer ITEM Report: WP4 Comparison Polymer page 24 of 36
fibre + wood pulp show only a plateau between 10‐40%, which was reached relatively quickly (< 100
days). This indicates that the slow degrading material contains some constituents which are hardly
mineralized, and thus will be potentially persistent or incorporated into the biomass.
For PHA a similar maximum biodegradation value within the incubation of 660 days has been observed
as for the reference cellulose. The blends of synthetic polyesters with corn starch such as Plastarch
have shown a lower biodegradation potential. And the classical polymers such as PP, PS and PET have
shown no significant biodegradation.
4.3.5 Summary
The available data indicate that the result are varying on the structural and morphological properties
of the polymers. Thereby it doesn’t matter if natural, modified, or synthetic. Synthetic polymers are
often not biodegradable in sufficient time in terms of the protection goal especially the classical
polymers, but can be in some cases ready biodegradable as well, whilst natural polymers are often
relatively fast degrading. However, some natural polymeric materials are relatively stable reflecting
the complexity of the respective substance and the intended function in nature.
The main data are available on ISO or ASTM methods (mineralization) or using non‐guideline studies.
The latter studies often only provide results on mass loss, or loss of functionality (indication for
degradation). Some data are available for natural polymers such as cellulose or starch, due to the fact
that these materials are used as positive reference in the ISO or ASTM test systems. For synthetic
polymers data are usually available rather for biodegradable polymers than for clearly expected non‐
biodegradable polymers. Especially for presumably (very) stable polymers, biodegradation data are
rare. Often only non‐guideline studies to consider effect of weathering and disintegration are available.
Fraunhofer ITEM Report: WP4 Comparison Polymer page 25 of 36
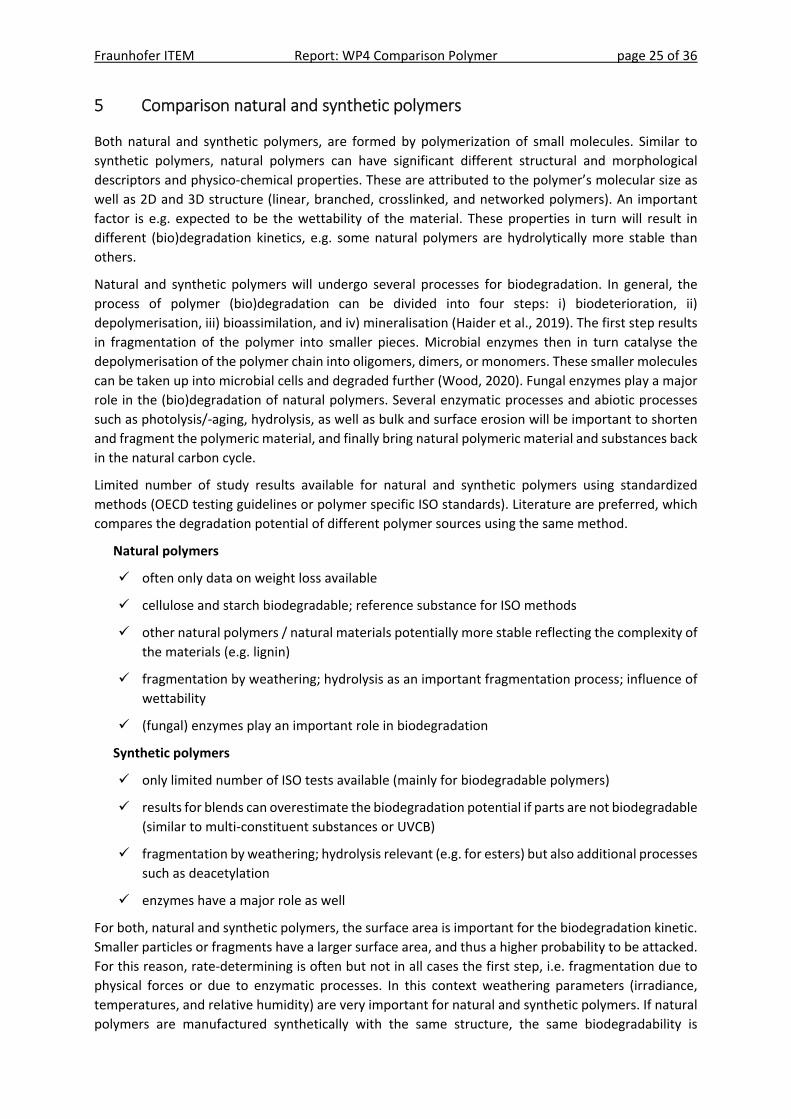
5 Comparison natural and synthetic polymers
Both natural and synthetic polymers, are formed by polymerization of small molecules. Similar to
synthetic polymers, natural polymers can have significant different structural and morphological
descriptors and physico‐chemical properties. These are attributed to the polymer’s molecular size as
well as 2D and 3D structure (linear, branched, crosslinked, and networked polymers). An important
factor is e.g. expected to be the wettability of the material. These properties in turn will result in
different (bio)degradation kinetics, e.g. some natural polymers are hydrolytically more stable than
others.
Natural and synthetic polymers will undergo several processes for biodegradation. In general, the
process of polymer (bio)degradation can be divided into four steps: i) biodeterioration, ii)
depolymerisation, iii) bioassimilation, and iv) mineralisation (Haider et al., 2019). The first step results
in fragmentation of the polymer into smaller pieces. Microbial enzymes then in turn catalyse the
depolymerisation of the polymer chain into oligomers, dimers, or monomers. These smaller molecules
can be taken up into microbial cells and degraded further (Wood, 2020). Fungal enzymes play a major
role in the (bio)degradation of natural polymers. Several enzymatic processes and abiotic processes
such as photolysis/‐aging, hydrolysis, as well as bulk and surface erosion will be important to shorten
and fragment the polymeric material, and finally bring natural polymeric material and substances back
in the natural carbon cycle.
Limited number of study results available for natural and synthetic polymers using standardized
methods (OECD testing guidelines or polymer specific ISO standards). Literature are preferred, which
compares the degradation potential of different polymer sources using the same method.
Natural polymers
often only data on weight loss available
cellulose and starch biodegradable; reference substance for ISO methods
other natural polymers / natural materials potentially more stable reflecting the complexity of
the materials (e.g. lignin)
fragmentation by weathering; hydrolysis as an important fragmentation process; influence of
wettability
(fungal) enzymes play an important role in biodegradation
Synthetic polymers
only limited number of ISO tests available (mainly for biodegradable polymers)
results for blends can overestimate the biodegradation potential if parts are not biodegradable
(similar to multi‐constituent substances or UVCB)
fragmentation by weathering; hydrolysis relevant (e.g. for esters) but also additional processes
such as deacetylation
enzymes have a major role as well
For both, natural and synthetic polymers, the surface area is important for the biodegradation kinetic.
Smaller particles or fragments have a larger surface area, and thus a higher probability to be attacked.
For this reason, rate‐determining is often but not in all cases the first step, i.e. fragmentation due to
physical forces or due to enzymatic processes. In this context weathering parameters (irradiance,
temperatures, and relative humidity) are very important for natural and synthetic polymers. If natural
polymers are manufactured synthetically with the same structure, the same biodegradability is
Fraunhofer ITEM Report: WP4 Comparison Polymer page 26 of 36
expected. In this special case biodegradability is not a question of natural or synthetic
“manufacturing”.
Natural polymers are regarded as no concern in the environment. Thus, natural polymers are excluded
from the restriction proposal for intentionally added microplastic. As stated in the Annex to the Annex
XV report “Polymers that occur in nature can, by default, be considered to be inherently
(bio)degradable in the environment and not contribute to the microplastic concern” (ECHA, 2020). The
available results on biodegradation indicate that some natural polymers might be even ready
biodegradable as sufficiently shown for microcrystalline cellulose. However, it is expected that many
natural polymers will not be mineralized in sufficient time to meet Annex XIII persistence criteria. The
timeframe of the presence in different compartments could be also highly variable depending on the
type of polymer and the environmental conditions.
In conclusion, natural polymers are considered inherently biodegradable by default by ECHA (see
above) and Annex XIII persistence criteria don´t apply to natural polymers. That makes it difficult to
use natural polymers as reference for testing of synthetic polymers, because even if the synthetic
polymer degrades faster than a natural reference polymer, it might fail the persistency criteria that
does not apply to the natural reference polymer. In such case the faster degrading synthetic polymer
might be assessed persistent while the natural reference polymer that degrades much slower at the
same conditions is not considered an environmental concern.
What can we learn from natural polymers?
Structures of the natural polymers are often hydrolytically instable, e.g. esters. The hydrolysis is
fostered by specific enzymes, so that the microorganism or fungi can use the polymers as energy
source or for its biomass. All polymers which are hydrolytically more stable needs additional factors
(e.g. specific enzymes) to be degraded in sufficient time in terms of the protection goal. If the effort to
get this energy with specific enzymes is unfavourable, for example as long as other sources are
available, biodegradation of the polymer will slow down.
Biodegradation is a stepwise process. After biotic and/or abiotic fragmentation, conversion into
oligomers, dimers, or monomers by depolymerisation occurs, which will be degraded further by
microorganisms and fungi.
In the environment natural polymers (biopolymers) and/or their transformation products will be
mostly found in the top layer of soil. The absolute amount is a result of the equilibrium between
emission to the soil and the degradation processes. The emission depends on the vegetation, and
degradation potential is related to the nature of vegetation, climate and land‐use as well. Adapted
microorganism, i.e. bacteria and fungi will be found depending on the sources of energy, the climate
and soil characteristics.
For natural polymeric materials such as wood, the degradation will be longer than for the polymer
(substance) itself such as cellulose or lignin. The reason is the unfavourable surface to volume ratio
and thus limited accessibility to be attacked by UV, water, temperature, or microorganism. As soon as
the natural materials are fragmented to small pieces (e.g. chipped wood, sawdust etc.) the degradation
time will decrease. However, wood and even leaves can exist in forest for years after a tree has died
in dry conditions and it is typically removed by fungal degradation. Furthermore even chipped wood
will exceed ECHA persistence criteria. This is due to the intended function of wood in nature as skeletal
material. Rapid degradation would not allow trees to grow as they are found in nature. Lignin even
protects woody cell walls against microbial attack (Kögel‐Knabner 2002).
This is backed up by the literature on comparison studies of milled natural material with synthetic
polymers (see chapter 4.3.4) which indicate that in some cases the natural polymer and material will
be ultimately biodegradable, and in other cases not. Often slow degrading material contains some

Fraunhofer ITEM Report: WP4 Comparison Polymer page 27 of 36
constituents which are hardly mineralized, and thus will be potentially persistent or incorporated into
the biomass.

Fraunhofer ITEM Report: WP4 Comparison Polymer page 28 of 36
6 Conclusion
Several types of polymers are on the market and different possibilities exist to categorize these
polymers. Besides the grouping based on structural, morphological properties, or physico‐chemical
properties, the polymers could be grouped based on the source: natural polymers (or biopolymers),
modified biopolymers and synthetic polymers. Another option is to (sub)group the synthetic polymers
into bio‐based and fossil‐based polymers. Finally, the polymers could be grouped into biodegradable
and not biodegradable. Thereby grouping as bioplastic is misleading. Bioplastics are bio‐based or
biodegradable or both (European Bioplastics, 2018). For this reason not all bioplastic are biodegradable
per definition.
Polymers exist in nature as well. These so called natural polymers (or biopolymers) include natural
rubber, cellulose, hemicellulose, starch, lignin, chitin, cutin. Sometimes natural polymers are used as
food additives such as glucomannan, agar, pectin, inulin, rosin, guar gum, locust bean gum, gum acacia,
karaya gum, gum tragacanth, alginates, carageenans, psyllium and xanthum gum. Natural polymers
are often polysaccharides or its derivatives with weak α‐glycosidic bonds or stronger β‐glycosidic
linkages, but could have also different structural linkages and a high variety of molecular weights, i.e.
more complex polymers are available such as lignin. The natural polymers could exist crystalline, semi‐
crystalline or amorphous, are often insoluble, and can be hydrophilic but also hydrophobic. Thus,
different structural and morphological descriptors and physico‐chemical properties can be assigned.
Based on these descriptors and properties, some natural polymers are expected to be hydrolytically
more stable than others. It is obvious that they will have different potential for (bio)degradation.
Natural and synthetic polymers undergo several processes for biodegradation. In general, the process
of polymer (bio)degradation can be divided into four steps: i) biodeterioration, ii) depolymerisation,
iii) bioassimilation, and iv) mineralisation (Haider et al., 2019).
Large number of studies have been carried out to investigate biodegradation of polymeric substances
and material using non‐guideline methods. These studies often only provide results on mass loss, or
loss of functionality, which both are indeed an indication for degradation. In recent years, several
standards have been developed to consider the specific needs of testing plastic and polymeric
material. These are mainly ISO or ASTM guidelines, which are often very similar. Thereby guidelines
for measurement of the biodegradation of plastic material include different compartments, e.g.
aqueous medium/surface water, marine water and sediment, and soil. The ISO (and ASTM) test
guidelines are usually following the degradation via indirect sum parameters such as O2 consumption
or CO2 evolution(=mineralization). Relative high concentration of substance is used and incubation at
temperatures between 15 and 28 °C. Testing reference material is prescribed as validation criteria, e.g.
cellulose is recommended in same shape and size comparable to that of the test material. As result,
these standards provide the degree of mineralization at the plateaus or after a specific time; in
addition, ISO 23517 and ISO 22403 give a benchmarking to reference material. These standards can be
regarded as similar to screening test systems, especially enhanced test systems, under the standard
persistence assessment scheme. ISO methods (or ASTM) are also available to consider the weathering
processes, or real field conditions, and frameworks to combine weathering and biodegradation. Some
standards are available with further metrics on degradation rate such as erosion rate, mass loss rate
(mass or surface area), loss of tensile properties.
Based on these standards, the available information and understanding of biodegradation of polymeric
substances and materials is increasing. Some data are available for natural polymers such as cellulose
or starch, due to the fact that these materials are used as positive reference in the ISO or ASTM test
systems. For synthetic polymers data are usually available rather for biodegradable polymers than for
clearly expected non‐biodegradable polymers. For the latter polymers, often only non‐guideline

Fraunhofer ITEM Report: WP4 Comparison Polymer page 29 of 36
studies are available to consider effect of weathering and disintegration. Especially for (very) stable
polymers, biodegradation data are rare.
The main message on data availability can be summarized as follows:
Metrics used for available (bio)degradation data (laboratory as well as mesocosm/field tests):
respirometry, mass loss or specific surface degradation rate (SSDR), tensile test.
Standard methods on biodegradation of polymers are usually based on mineralization
(respirometry) only
Limited number of studies according to ISO methods (soil or water), very limited data for
sediment
Data with simulation studies are rare
The available data indicate that the result are varying on the structural and morphological properties
of the polymers. Thereby it doesn’t matter if the polymer origin is natural, modified natural, or
synthetic. Synthetic polymers are often not biodegradable in short time especially the classical
polymers, but can be in some cases readily biodegradable as well, whilst natural polymers are often
relatively fast degrading. However, some natural polymeric materials are very stable against
biodegradation reflecting the complexity of natural polymers and its function in natural systems.
The results of actual available screening tests indicate that many natural polymers must be regarded
as being not readily biodegradable or even not inherently biodegradable, in the sense of an inherent
biodegradation test (OECD 302). Indeed, current simulation tests are missing and thus the ability to
come to a final conclusion on persistency for such materials. However, there is no doubt that many
natural polymeric materials will fail the persistence trigger values for PBT assessment given in Annex
XIII of the REACH regulation (EC, 2011). It is the intention of nature to form resilient materials for
example for protection or skeletal constructions of organisms. Natural polymers are not considered an
environmental concern and they are not subject to persistency assessment. Additional properties such
as the emission pattern, (bio)accessibility or bioavailability, and a host of real life factors which are not
currently included in (bio)degradation studies (e.g. light, temperature extremes, physical damage,
ingestion, inadvertent exclusion of competent fungal organisms, etc.) play a major role in the fate of
these natural polymers.
The conclusion which can be drawn is that, applying the REACH Annex XIII criteria many natural
polymers have to be regarded as P/vP. But those criteria don´t apply and they are considered no
concern for the environment for good reasons. But this needs to be recognized when assessing
synthetic polymers, many of which would fulfil the P/vP criteria as well. For such synthetic polymers it
would be important to establish polymer specific criteria to enable an adequate hazard assessment.
This document is part of a series of reports produced as part of the Cefic‐LRI ECO52 project: ‘Expanding
the conceptual principles and applicability domain of persistence screening and prioritization
frameworks, including single constituents, polymers, and UVCBs.’

Fraunhofer ITEM Report: WP4 Comparison Polymer page 30 of 36
7 Acknowledgements
We would like to thank members of the project research team Graham Whale (Whale Environmental
Consultancy Ltd), Michael Klein and Judith Klein (Fraunhofer IME), Chris Hughes (Ricardo Energy &
Environment) for their valuable contributions to this work. We would also like to thank the monitoring
team for their oversight and helpful input to the project.
Fraunhofer ITEM Report: WP4 Comparison Polymer page 31 of 36
8 References
Albright, V.C., 3rd, Chai, Y., 2021. Knowledge Gaps in Polymer Biodegradation Research. Environ Sci Technol 55, 11476‐11488.
Ali, I., Cheng, Q., Ding, T., Yiguang, Q., Yuechao, Z., Sun, H., Peng, C., Naz, I., Li, J., Liu, J., 2021. Micro‐ and nanoplastics in the environment: Occurrence, detection, characterization and toxicity – A critical review. Journal of Cleaner Production 313.
Allen, S., Allen, D., Moss, K., Le Roux, G., Phoenix, V.R., Sonke, J.E., 2020. Examination of the ocean as a source for atmospheric microplastics. PLoS One 15, e0232746.
Allen, S., Allen, D., Phoenix, V.R., Le Roux, G., Durántez Jiménez, P., Simonneau, A., Binet, S., Galop, D., 2019. Atmospheric transport and deposition of microplastics in a remote mountain catchment. Nature Geoscience 12, 339‐344.
Andrady, A.L., 2011. Microplastics in the marine environment. Mar Pollut Bull 62, 1596‐1605. Andrady, A.L., 2017. The plastic in microplastics: A review. Mar Pollut Bull 119, 12‐22. Arcos‐Hernandez, M.V., Laycock, B., Pratt, S., Donose, B.C., Nikolić, M.A.L., Luckman, P., Werker, A.,
Lant, P.A., 2012. Biodegradation in a soil environment of activated sludge derived polyhydroxyalkanoate (PHBV). Polymer Degradation and Stability 97, 2301‐2312.
ASTM, 2018a. ASTM D6954‐18 ‐ Standard Guide for Exposing and Testing Plastics that Degrade in the Environment by a Combination of Oxidation and Biodegradation.
ASTM, 2018b. D5988 ‐ 18 ‐ Standard Test Method For Determining Aerobic Biodegradation of Plastic Materials in Soil.
Belz, S., Bianchi, I., Cella, C., Emteborg, H., Fumagalli, F., Geiss, O., Gilliland, D., Held, A., Jakobsson, U., La Spina, R., Mėhn, D., Ramaye, Y., Robouch, P., Seghers, J., Sokull‐Kluettgen, B., Stefaniak, E., Stroka, J., 2021. Current status of the quantification of microplastics in water ‐ Results of a JRC/BAM inter‐laboratory comparison study on PET in water, EUR 30799 EN. Publications Office of the European Union, Luxembourg, 2021, ISBN 978‐92‐76‐40957‐1, doi:10.2760/27641, JRC125383.
Bernhard, M., Eubeler, J.P., Zok, S., Knepper, T.P., 2008. Aerobic biodegradation of polyethylene glycols of different molecular weights in wastewater and seawater. Water Res 42, 4791‐4801.
Briassoulis, D., Dejean, C., 2010. Critical Review of Norms and Standards for Biodegradable Agricultural Plastics Part Ι. Biodegradation in Soil. Journal of Polymers and the Environment 18, 384‐400.
Briassoulis, D., Mistriotis, A., Mortier, N., Tosin, M., 2020. A horizontal test method for biodegradation in soil of bio‐based and conventional plastics and lubricants. Journal of Cleaner Production 242.
Briggs, D.E.G., 1999. Molecular taphonomy of animal and plant cuticles: selective preservation and diagenesis. Philosophical Transactions of the Royal Society of London Series B: Biological Sciences 354, 7‐17.
Brueckner, T., Eberl, A., Heumann, S., Rabe, M., Guebitz, G.M., 2008. Enzymatic and chemical hydrolysis of poly(ethylene terephthalate) fabrics. Journal of Polymer Science Part A: Polymer Chemistry 46, 6435‐6443.
Burgstaller, M., Potrykus, A., Weißenbacher, J., Kabasci, D.S., Merrettig‐Bruns, D.U., Sayder, B., 2018. Study on the treatment of biodegradable plastics.
Burns, E.E., Boxall, A.B.A., 2018. Microplastics in the aquatic environment: Evidence for or against adverse impacts and major knowledge gaps. Environ Toxicol Chem 37, 2776‐2796.
Chae, Y., An, Y.J., 2018. Current research trends on plastic pollution and ecological impacts on the soil ecosystem: A review. Environ Pollut 240, 387‐395.
Cheshire, M.V., Mundie, C.M., Shepherd, H., 1969. Transformation of 14C glucose and starch in soil. Soil Biology and Biochemistry 1, 117‐130.
Chinaglia, S., Tosin, M., Degli‐Innocenti, F., 2018. Biodegradation rate of biodegradable plastics at molecular level. Polymer Degradation and Stability 147, 237‐244.
Datta, R., Kelkar, A., Baraniya, D., Molaei, A., Moulick, A., Meena, R., Formanek, P., 2017. Enzymatic Degradation of Lignin in Soil: A Review. Sustainability 9.
Fraunhofer ITEM Report: WP4 Comparison Polymer page 32 of 36
DIN, 2018. EN 17033 ‐ Plastics – Biodegradable mulch films for use in agriculture and horticulture – Requirements and test methods; German version EN 17033:2018.
Duis, K., Coors, A., 2016. Microplastics in the aquatic and terrestrial environment: sources (with a specific focus on personal care products), fate and effects. Environ Sci Eur 28, 2‐2.
Duis, K., Junker, T., Coors, A., 2021. Environmental fate and effects of water‐soluble synthetic organic polymers used in cosmetic products. Environ Sci Eur 33.
EC, 2011. COMMISSION REGULATION (EU) No 253/2011 of 15 March 2011 amending Regulation (EC) No 1907/2006 of the European Parliament and of the Council on the Registration, Evaluation, Authorisation and Restriction of Chemicals (REACH) as regards Annex XIII.
ECETOC, 2020. Applicability of Analytical Tools, Test Methods and Models for Polymer Risk Assessment. Technical Report No 133‐2. European Centre for Ecotoxicology and Toxicology of Chemicals, p. 150.
ECHA, 2012. Guidance for monomers and polymers, Version 2.0. Guidance, vol. Guidance for the implementation of REACH. European Chemicals Agency, Helsinki, Finland, p. 26p.
ECHA, 2020. RAC and SEAC opinion on an ANNEX XV RESTRICTION REPORT PROPOSAL FOR A RESTRICTION for intentionally added microplastics.
Emadian, S.M., Onay, T.T., Demirel, B., 2017. Biodegradation of bioplastics in natural environments. Waste Management 59, 526‐536.
EPA network ‐ Interest group on Plastics, 2018. Biodegradable Plastics Approaches and experiences from 16 Members of the EPA Network. In: Maier, N. (Ed.), https://epanet.eea.europa.eu/reports‐letters/reports‐and‐letters/ig‐plastics_working‐paper_biodegradable‐plastics.pdf/view.
Eubeler, J.P., 2010. Biodegradation of Synthetic Polymers in the Aquatic Environment. BASF, vol. Dr. rer. nat. . Universität Bremen, Bremen, p. 209p.
Eubeler, J.P., Bernhard, M., Knepper, T.P., 2010. Environmental biodegradation of synthetic polymers II. Biodegradation of different polymer groups. Trac‐Trends in Analytical Chemistry 29, 84‐100.
Eubeler, J.P., Zok, S., Bernhard, M., Knepper, T.P., 2009. Environmental biodegradation of synthetic polymers I. Test methodologies and procedures. TrAC Trends in Analytical Chemistry 28, 1057‐1072.
European Bioplastics, 2018. What are bioplastics? ‐ Material types, terminology, and labels – an introduction.
Fuller, S., Gautam, A., 2016. A Procedure for Measuring Microplastics using Pressurized Fluid Extraction. Environ Sci Technol 50, 5774‐5780.
German, D.P., Chacon, S.S., Allison, S.D., 2011. Substrate concentration and enzyme allocation can affect rates of microbial decomposition. Ecology 92, 1471‐1480.
Gladfelter, A.S., James, T.Y., Amend, A.S., 2019. Marine fungi. Current biology : CB 29, R191‐R195. Gómez, E.F., Michel, F.C., 2013. Biodegradability of conventional and bio‐based plastics and natural
fiber composites during composting, anaerobic digestion and long‐term soil incubation. Polymer Degradation and Stability 98, 2583‐2591.
Haider, T.P., Volker, C., Kramm, J., Landfester, K., Wurm, F.R., 2019. Plastics of the Future? The Impact of Biodegradable Polymers on the Environment and on Society. Angewandte Chemie‐International Edition 58, 50‐62.
Hashimoto, K., Sudo, M., Ohta, K., Sugimura, T., Yamada, H., Aoki, T., 2002. Biodegradation of nylon4 and its blend with nylon6. Journal of Applied Polymer Science 86, 2307‐2311.
Haske‐Cornelius, O., Pellis, A., Tegl, G., Wurz, S., Saake, B., Ludwig, R., Sebastian, A., Nyanhongo, G., Guebitz, G., 2017. Enzymatic Systems for Cellulose Acetate Degradation. Catalysts 7.
Hennecke, D., Bauer, A., Herrchen, M., Wischerhoff, E., Gores, F., 2018. Cationic polyacrylamide copolymers (PAMs): environmental half life determination in sludge‐treated soil. Environ Sci Eur 30, 16.
ISO, 2011. ISO 10640 ‐ Plastics — Methodology for assessing polymer photoageing by FTIR and UV/visible spectroscopy.
ISO, 2012. ISO 10210 ‐ Plastics – Methods for the preparation of samples for biodegradation testing of plastic materials.

Fraunhofer ITEM Report: WP4 Comparison Polymer page 33 of 36
ISO, 2016a. ISO 18830 ‐ Plastics — Determination of aerobic biodegradation of non‐floating plastic materials in a seawater/ sandy sediment interface — Method by measuring the oxygen demand in closed respirometer.
ISO, 2016b. ISO/TS 19022 ‐ Plastics — Method of controlled acceleration of laboratory weathering by increased irradiance.
ISO, 2017. ISO 4582 ‐ Plastics — Determination of changes in colour and variations in properties after exposure to glass‐filtered solar radiation, natural weathering or laboratory radiation sources.
ISO, 2018. ISO 14852 ‐ Determination of the ultimate aerobic biodegradability of plastic materials in an aqueous medium ‐ Method by analysis of evolved carbon dioxide.
ISO, 2019a. ISO 527‐1 ‐ Plastics — Determination of tensile properties — Part 1: General principles. ISO, 2019b. ISO 14851 ‐ Determination of the ultimate aerobic biodegradability of plastic materials in
an aqueous medium ‐ Method by measuring the oxygen demand in a closed respirometer. ISO, 2019c. ISO 17556 ‐ Plastics – Determination of the ultimate aerobic biodegradability of plastic
materials in soil by measuring the oxygen demand in a respirometer or the amount of carbon dioxide evolved (ISO 17556:2019);.
ISO, 2019d. ISO 22404 ‐ Plastics — Determination of the aerobic biodegradation of nonfloating materials exposed to marine sediment — Method by analysis of evolved carbon dioxide.
ISO, 2020a. ISO 19679 ‐ Plastics — Determination of aerobic biodegradation of non‐floating plastic materials in a seawater/sediment interface — Method by analysis of evolved carbon dioxide.
ISO, 2020b. ISO 22403 ‐ Plastics — Assessment of the intrinsic biodegradability of materials exposed to marine inocula under mesophilic aerobic laboratory conditions — Test methods and requirements.
ISO, 2020c. ISO 22766 ‐ Plastics — Determination of the degree of disintegration of plastic materials in marine habitats under real field conditions.
ISO, 2020d. ISO 23977‐1 ‐ Plastics — Determination of the aerobic biodegradation of plastic materials exposed to seawater — Part 1: Method by analysis of evolved carbon dioxide.
ISO, 2020e. ISO 23977‐2 ‐ Plastics — Determination of the aerobic biodegradation of plastic materials exposed to seawater — Part 2: Method by measuring the oxygen demand in closed respirometer.
ISO, 2021a. ISO 5148 ‐ Plastics — Determination of specific aerobic biodegradation rate of solid plastic materials and disappearance time (DT50) under mesophilic laboratory test conditions.
ISO, 2021b. ISO 23517 ‐ Plastics — Soil biodegradable materials for mulch films for use in agriculture and horticulture — Requirements and test methods regarding biodegradation, ecotoxicity and control of constituents.
ISO, 2021c. ISO 23832 ‐ Plastics — Test methods for determination of degradation rate and disintegration degree of plastic materials exposed to marine environmental matrices under laboratory conditions.
Jakubowicz, I., Enebro, J., Yarahmadi, N., 2021. Challenges in the search for nanoplastics in the environment—A critical review from the polymer science perspective. Polymer Testing 93.
Kang, B.R., Kim, S.B., Song, H.A., Lee, T.K., 2019. Accelerating the Biodegradation of High‐Density Polyethylene (HDPE) Using Bjerkandera adusta TBB‐03 and Lignocellulose Substrates. Microorganisms 7, 304.
Kaseem, M., Hamad, K., Deri, F., 2012. Thermoplastic starch blends: A review of recent works. Polymer Science ‐ Series A 54, 165‐176.
Kaushal, J., Khatri, M., Arya, S.K., 2021. Recent insight into enzymatic degradation of plastics prevalent in the environment: A mini ‐ review. Cleaner Engineering and Technology 2.
KBBPPS, 2015. Biodegradability‐standards‐assessment‐report. https://www.biobasedeconomy.eu/projects/kbbpps‐knowledge‐based‐bio‐based‐products‐pre‐standardization/.
Khan, B., Bilal Khan Niazi, M., Samin, G., Jahan, Z., 2017. Thermoplastic Starch: A Possible Biodegradable Food Packaging Material—A Review. Journal of Food Process Engineering 40.
Kjeldsen, A., Price, M., Lilley, C., Guzniczak, E., Archer, I., 2019. A Review of Standards for Biodegradable Plastics. Industrial Biotechnology Innovation Centre, p. 33p.
Fraunhofer ITEM Report: WP4 Comparison Polymer page 34 of 36
Klemm, D., Heublein, B., Fink, H.P., Bohn, A., 2005. Cellulose: fascinating biopolymer and sustainable raw material. Angew Chem Int Ed Engl 44, 3358‐3393.
Kögel‐Knabner, I., 2002. The macromolecular organic composition of plant and microbial residues as inputs to soil organic matter. Soil Biology and Biochemistry 34, 139‐162.
Lehmann, M., Oehlschlägel, L.M., Häusl, F.P., Held, A., Gekle, S., 2021. Ejection of marine microplastics by raindrops: a computational and experimental study. Microplastics and Nanoplastics 1.
Machado, A.A.D., Kloas, W., Zarfl, C., Hempel, S., Rillig, M.C., 2018. Microplastics as an emerging threat to terrestrial ecosystems. Glob Chang Biol 24, 1405‐1416.
Martin, J.P., Haider, K., 1986. Influence of Mineral Colloids on Turnover Rates of SoiI Organic Carbon McCormick, A.R., Hoellein, T.J., London, M.G., Hittie, J., Scott, J.W., Kelly, J.J., 2016. Microplastic in
surface waters of urban rivers: concentration, sources, and associated bacterial assemblages. Ecosphere 7.
McDonough, K., Itrich, N., Casteel, K., Menzies, J., Williams, T., Krivos, K., Price, J., 2017. Assessing the biodegradability of microparticles disposed down the drain. Chemosphere 175, 452‐458.
Meereboer, K.W., Misra, M., Mohanty, A.K., 2020. Review of recent advances in the biodegradability of polyhydroxyalkanoate (PHA) bioplastics and their composites. Green Chemistry 22, 5519‐5558.
Nafchi, A.M., Moradpour, M., Saeidi, M., Alias, A.K., 2013. Thermoplastic starches: Properties, challenges, and prospects. Starch/Staerke 65, 61‐72.
OECD, 1992. Test No. 301: Ready Biodegradability. OECD Publishing. Open‐Bio, 2016. WP5: in‐situ biodegradation. https://www.biobasedeconomy.eu/projects/open‐
bio/. Pischedda, A., Tosin, M., Degli‐Innocenti, F., 2019. Biodegradation of plastics in soil: The effect of
temperature. Polymer Degradation and Stability 170. Polman, E.M.N., Gruter, G.M., Parsons, J.R., Tietema, A., 2020. Comparison of the aerobic
biodegradation of biopolymers and the corresponding bioplastics: A review. Sci Total Environ 753, 141953.
Riederer, M., Schonherr, J., 1988. Development of plant cuticles: fine structure and cutin composition of Clivia miniata Reg. leaves. Planta 174, 127‐138.
Ruggero, F., Gori, R., Lubello, C., 2019. Methodologies to assess biodegradation of bioplastics during aerobic composting and anaerobic digestion: A review. Waste Manag Res 37, 959‐975.
Sánchez, C., 2020. Fungal potential for the degradation of petroleum‐based polymers: An overview of macro‐ and microplastics biodegradation. Biotechnol Adv 40, 107501.
Scherer, C., Weber, A., Stock, F., Vurusic, S., Egerci, H., Kochleus, C., Arendt, N., Foeldi, C., Dierkes, G., Wagner, M., Brennholt, N., Reifferscheid, G., 2020. Comparative assessment of microplastics in water and sediment of a large European river. Sci Total Environ 738, 139866.
Su, S., Kopitzky, R., Tolga, S., Kabasci, S., 2019. Polylactide (PLA) and Its Blends with Poly(butylene succinate) (PBS): A Brief Review. Polymers (Basel) 11.
Thevenot, M., Dignac, M.‐F., Rumpel, C., 2010. Fate of lignins in soils: A review. Soil Biology and Biochemistry 42, 1200‐1211.
Tosin, M., Pischedda, A., Degli‐Innocenti, F., 2019. Biodegradation kinetics in soil of a multi‐constituent biodegradable plastic. Polymer Degradation and Stability 166, 213‐218.
Tosin, M., Weber, M., Siotto, M., Lott, C., Degli Innocenti, F., 2012. Laboratory test methods to determine the degradation of plastics in marine environmental conditions. Front Microbiol 3, 225.
Trainic, M., Flores, J.M., Pinkas, I., Pedrotti, M.L., Lombard, F., Bourdin, G., Gorsky, G., Boss, E., Rudich, Y., Vardi, A., Koren, I., 2020. Airborne microplastic particles detected in the remote marine atmosphere. Communications Earth & Environment 1.
Triebskorn, R., Braunbeck, T., Grummt, T., Hanslik, L., Huppertsberg, S., Jekel, M., Knepper, T.P., Krais, S., Müller, Y.K., Pittroff, M., Ruhl, A.S., Schmieg, H., Schür, C., Strobel, C., Wagner, M., Zumbülte, N., Köhler, H.‐R., 2019. Relevance of nano‐ and microplastics for freshwater ecosystems: A critical review. TrAC Trends in Analytical Chemistry 110, 375‐392.

Fraunhofer ITEM Report: WP4 Comparison Polymer page 35 of 36
Wang, C., Kelley, S.S., Venditti, R.A., 2016. Lignin‐Based Thermoplastic Materials. ChemSusChem 9, 770‐783.
Warren, R.A., 1996. Microbial hydrolysis of polysaccharides. Annual review of microbiology 50, 183‐212.
Wood, 2020. Scientific and technical support for the development of criteria to identify and group polymers for Registration/ Evaluation under REACH and their impact assessment.
Zumstein, M.T., Schintlmeister, A., Nelson, T.F., Baumgartner, R., Woebken, D., Wagner, M., Kohler, H.P.E., McNeill, K., Sander, M., 2018. Biodegradation of synthetic polymers in soils: Tracking carbon into CO2 and microbial biomass. Science Advances 4, eaas9024.

Fraunhofer ITEM Report: WP4 Comparison Polymer page 36 of 36
Annex: Degradation data
Available degradation data (using standardized methods) has been compiled in an excel file.
Related Documents