This article was downloaded by: [Raouf Mbarki] On: 11 December 2014, At: 15:55 Publisher: Taylor & Francis Informa Ltd Registered in England and Wales Registered Number: 1072954 Registered office: Mortimer House, 37-41 Mortimer Street, London W1T 3JH, UK Road Materials and Pavement Design Publication details, including instructions for authors and subscription information: http://www.tandfonline.com/loi/trmp20 Comparison between fatigue performance of horizontal cores from different asphalt pavement depths and laboratory specimens Raouf Mbarki a , M. Emin Kutay a , Nelson Gibson b & Ala R. Abbas c a Michigan State University, Department of Civil and Environmental Engineering , East Lansing , Michigan , USA b Federal Highway Administration , Turner-Fairbank Highway Research Center , McLean , Virginia , USA c University of Akron, Department of Civil Engineering , Akron , Ohio , USA Published online: 28 May 2012. To cite this article: Raouf Mbarki , M. Emin Kutay , Nelson Gibson & Ala R. Abbas (2012) Comparison between fatigue performance of horizontal cores from different asphalt pavement depths and laboratory specimens, Road Materials and Pavement Design, 13:3, 422-432, DOI: 10.1080/14680629.2012.685843 To link to this article: http://dx.doi.org/10.1080/14680629.2012.685843 PLEASE SCROLL DOWN FOR ARTICLE Taylor & Francis makes every effort to ensure the accuracy of all the information (the “Content”) contained in the publications on our platform. However, Taylor & Francis, our agents, and our licensors make no representations or warranties whatsoever as to the accuracy, completeness, or suitability for any purpose of the Content. Any opinions and views expressed in this publication are the opinions and views of the authors, and are not the views of or endorsed by Taylor & Francis. The accuracy of the Content should not be relied upon and should be independently verified with primary sources of information. Taylor and Francis shall not be liable for any losses, actions, claims, proceedings, demands, costs, expenses, damages, and other liabilities whatsoever or howsoever caused arising directly or indirectly in connection with, in relation to or arising out of the use of the Content. This article may be used for research, teaching, and private study purposes. Any substantial or systematic reproduction, redistribution, reselling, loan, sub-licensing, systematic supply, or distribution in any form to anyone is expressly forbidden. Terms &

Welcome message from author
This document is posted to help you gain knowledge. Please leave a comment to let me know what you think about it! Share it to your friends and learn new things together.
Transcript
This article was downloaded by: [Raouf Mbarki]On: 11 December 2014, At: 15:55Publisher: Taylor & FrancisInforma Ltd Registered in England and Wales Registered Number: 1072954 Registeredoffice: Mortimer House, 37-41 Mortimer Street, London W1T 3JH, UK
Road Materials and Pavement DesignPublication details, including instructions for authors andsubscription information:http://www.tandfonline.com/loi/trmp20
Comparison between fatigueperformance of horizontal cores fromdifferent asphalt pavement depths andlaboratory specimensRaouf Mbarki a , M. Emin Kutay a , Nelson Gibson b & Ala R. Abbas ca Michigan State University, Department of Civil and EnvironmentalEngineering , East Lansing , Michigan , USAb Federal Highway Administration , Turner-Fairbank HighwayResearch Center , McLean , Virginia , USAc University of Akron, Department of Civil Engineering , Akron ,Ohio , USAPublished online: 28 May 2012.
To cite this article: Raouf Mbarki , M. Emin Kutay , Nelson Gibson & Ala R. Abbas (2012)Comparison between fatigue performance of horizontal cores from different asphalt pavementdepths and laboratory specimens, Road Materials and Pavement Design, 13:3, 422-432, DOI:10.1080/14680629.2012.685843
To link to this article: http://dx.doi.org/10.1080/14680629.2012.685843
PLEASE SCROLL DOWN FOR ARTICLE
Taylor & Francis makes every effort to ensure the accuracy of all the information (the“Content”) contained in the publications on our platform. However, Taylor & Francis,our agents, and our licensors make no representations or warranties whatsoever as tothe accuracy, completeness, or suitability for any purpose of the Content. Any opinionsand views expressed in this publication are the opinions and views of the authors,and are not the views of or endorsed by Taylor & Francis. The accuracy of the Contentshould not be relied upon and should be independently verified with primary sourcesof information. Taylor and Francis shall not be liable for any losses, actions, claims,proceedings, demands, costs, expenses, damages, and other liabilities whatsoever orhowsoever caused arising directly or indirectly in connection with, in relation to or arisingout of the use of the Content.
This article may be used for research, teaching, and private study purposes. Anysubstantial or systematic reproduction, redistribution, reselling, loan, sub-licensing,systematic supply, or distribution in any form to anyone is expressly forbidden. Terms &

Conditions of access and use can be found at http://www.tandfonline.com/page/terms-and-conditions
Dow
nloa
ded
by [
Rao
uf M
bark
i] a
t 15:
55 1
1 D
ecem
ber
2014

Road Materials and Pavement DesignVol. 13, No. 3, September 2012, 422–432
Comparison between fatigue performance of horizontal cores fromdifferent asphalt pavement depths and laboratory specimens
Raouf Mbarkia*, M. Emin Kutaya, Nelson Gibsonb and Ala R. Abbasc
aMichigan State University, Department of Civil and Environmental Engineering, East Lansing, Michigan,USA; bFederal Highway Administration, Turner-Fairbank Highway Research Center, McLean, Virginia,USA; cUniversity of Akron, Department of Civil Engineering, Akron, Ohio, USA
This study presents a comparison between the fatigue performance of field cores obtainedfrom different layers (top and bottom) and laboratory produced–laboratory compacted spec-imens. The field cores were obtained from the Accelerated Pavement Testing (APT) facilityat Turner-Fairbank Highway Research Center (TFHRC), located in McLean, Virginia, USA.Uniaxial push-pull (compression-tension) fatigue tests were conducted on samples obtainedfrom the top 50 mm and the bottom 50 mm layers of 100 mm thick asphalt pavements. Thesamples were obtained by horizontally coring slabs extracted from six APT lanes. The damagecharacteristic curves (i.e., C versus S curve of the viscoelastic continuum damage (VECD)theory) and the fatigue lives of the field cores were compared with those of the laboratoryspecimens. The experimental test results and the subsequent analysis findings revealed com-parable damage characteristic curves and fatigue lives for the top and bottom field specimens;meanwhile, the field and laboratory specimens exhibited different damage characteristic curvesand fatigue lives.
Keywords: asphalt pavements; fatigue life; viscoelastic continuum damage theory (VECD);accelerated pavement testing facility; push-pull (compression-tension) fatigue tests
1. IntroductionPavement management strategies are based on knowledge of pavement performance and estimatesof remaining service life. The performance of flexible pavements is affected by many distresses.Among these, fatigue cracking is dominant at intermediate temperatures. Fatigue cracking sig-nificantly affects the ride quality and may result in significant maintenance or rehabilitation costs.Consequently, in order to maintain good pavement performance, a better prediction of fatigueperformance is needed.
Fatigue characterization of asphalt mixtures has recently evolved from traditional four-pointbending beam (FPBB) testing to uniaxial cyclic testing on cylindrical samples (Daniel, 2001;Christensen & Bonaquist, 2005; Soltani & Anderson, 2005; Kutay, Gibson, & Youtcheff, 2008a).One of the most commonly used uniaxial fatigue tests is the push-pull test (Kutay, Gibson,Youtcheff, & Dongre, 2009), and good correlation between the fatigue life obtained from this testand field performance has been shown in the literature. This test is very practical and can typicallybe conducted in the relatively low-cost Asphalt Mixture Performance Tester (AMPT), a productof NCHRP project 9-29 (Bonaquist, Christensen, & Stump, 2003). Other advantages of uniaxialfatigue testing include: (i) ease of sample preparation since specimens can be compacted using
*Corresponding author. Email: [email protected]
ISSN 1468-0629 print/ISSN 2164-7402 online© 2012 Taylor & Francishttp://dx.doi.org/10.1080/14680629.2012.685843http://www.tandfonline.com
Dow
nloa
ded
by [
Rao
uf M
bark
i] a
t 15:
55 1
1 D
ecem
ber
2014
Road Materials and Pavement Design 423
standard Superpave gyratory compactors and (ii) ease of applicability of advanced mathematicalmodels such as the viscoelastic continuum damage (VECD) theory due to the presence of a simpleuniaxial state of stress.
The objective of this study is to investigate the fatigue characteristics of field cores obtained fromdifferent layers of six asphalt pavement sections used at the Turner-Fairbank Highway ResearchCenter (TFHRC) Accelerated Pavement Testing (APT) facility. Given its advantages, the uniaxialpush-pull (compression-tension) fatigue test is used for this purpose. Testing was conducted onfield specimens obtained from the top and bottom of different field lanes at the TFHRC APTfacility as well as laboratory-produced specimens prepared using the same materials and mixdesigns. The VECD theory was then used to analyze the fatigue behavior of the tested materialsand estimate their fatigue lives.
2. MaterialsThe experimental design included six asphalt mixtures that have the same aggregate gradation andasphalt binder content as the pavement sections tested at the TFHRC APT facility. All mixtureshad a 12.5 mm nominal maximum aggregate size (NMAS). These mixtures were prepared usingsix different asphalt binders:
• Control (PG 72-22) unmodified asphalt binder,• CR-TB (PG 79-28) crumb rubber asphalt binder, terminal blend,• Terpolymer (PG 74-31) ethylene terpolymer modified asphalt binder,• SBS LG (PG 74-28) styrene-butadiene-styrene modified binder with linear grafting,• AB (PG 72-23) air blown asphalt binder,• Fiber (PG 73-23) unmodified PG 70-22 asphalt binder with 0.2% polyester fiber.
Additional information about these mixtures can be found elsewhere (Kutay et al., 2008a; Qi,Al-Khateeb, Mitchell, Sturat, & Youtcheff, 2004). The laboratory specimens were prepared usingthe Superpave gyratory compactor. Before compaction, specimens were aged for 4 hours at thecompaction temperature. Each specimen was compacted to a height of 180 mm and then coredand cut to a cylindrical sample with a diameter of 71.4 mm and a height of 150 mm. All sampleswere compacted to a target air voids level of 7%, which was the target level for the field lanesduring construction.
The field specimens were cored from slabs far from the wheel path in order to minimize initialdamage other than that of the environment. At the time of coring, the pavements were about7 years old. Each slab measured 100 mm in thickness. Two specimens, measuring 38.1 mm indiameter, were extracted from the top and bottom portions of each field slab (Figure 1). Threereplicates were cored from each layer and the ends of each core were trimmed to achieve a heightof 100 mm. The resulting field specimens measured 38.1 mm in diameter and 100 mm in height.Even though the field specimens were smaller than the laboratory specimens as dictated by thelane thicknesses in the field, previous research by the second and third authors, among others, hasdemonstrated that both specimen sizes give practically the same results for mixtures made with12.5 mm NMAS (Kutay et al., 2009).
Figure 2 shows the air voids of the laboratory and field specimens. It can be noticed from thisfigure that while the laboratory specimens were close to the target air void level of 7%, most fieldcores had lower air void levels. Potential implications for the relatively low air voids of the fieldsections are:
Dow
nloa
ded
by [
Rao
uf M
bark
i] a
t 15:
55 1
1 D
ecem
ber
2014
424 R. Mbarki et al.
Figure 1. Horizontally cored field specimens for push-pull fatigue testing.
4.7
3.8
4.84.9
5.3
7.4
4.5
5.7
3.6
4.6
5.9
6.8
7.196.95
7.477.23
7.627.75
3.0
4.0
5.0
6.0
7.0
8.0
9.0
Control AB SBS-LG CR-TB TP Fiber
Air
Voi
ds (
%)
Top Bot Lab Specimens
Figure 2. Air voids (%) of laboratory and field cores.
• better fatigue performance, solely due to the low air voids (Harvey & Tsai 1996),• reduced aging because of low air voids, leading to better fatigue life as compared with a
condition where the as-constructed air voids were 7%.
As compared with the laboratory samples, the field samples used in this study are expected tohave worse fatigue life because of the 7 years of aging. However, since the laboratory sampleshave much higher air voids, they may have worse fatigue life than the field cores. The followingsections present the fatigue testing and analysis results for both field and laboratory samples.
Dow
nloa
ded
by [
Rao
uf M
bark
i] a
t 15:
55 1
1 D
ecem
ber
2014
Road Materials and Pavement Design 425
3. Testing procedures3.1. Dynamic modulus testsOne of the primary inputs to fatigue analysis using the VECD theory is the linear viscoelasticbehavior of the asphalt mixtures defined using the dynamic modulus, |E∗|, relaxation modulus,E(t), or creep compliance, D(t) master curves (Kutay et al., 2009). Once one of these curvesis obtained, the others can be obtained through inter-conversion (Park & Schapery, 1999). Inthis study, a battery of dynamic modulus tests were run over a wide range of temperatures(4, 19, 31, 46 and 58 ◦C) and loading frequencies (20, 10, 5, 1, 0.5 and 0.1 Hz) using the AMPTdevice. Once the |E∗| values were computed for each temperature, T , and loading frequency,f , the dynamic modulus master curve and the corresponding shift factors were obtained usingthe time-temperature superposition principle (Gibson, 2006). Since there were not enough fieldspecimens, this test was performed on laboratory specimens only.
3.2. Push-pull fatigue testsPush-pull (compression-tension) fatigue tests were conducted on both laboratory and field spec-imens using a testing temperature of 19 ◦C and a loading frequency of 10 Hz. The tests wereconducted using a universal servo-hydraulic test system. Three linear variable displacementtransducers (LVDT) were mounted on the sides of each specimen (120◦ apart). The LVDTswere attached to the middle of the specimen. The gauge length of each LVDT was 50 mm.
The tests were run in an actuator strain-controlled mode, also known as crosshead displacement-controlled. The actuator strain level was selected for each sample such that the on-specimen(center) strain was about 300 microstrains. It should be noted the on-specimen strain increaseswhile the stress decreases during actuator strain-controlled tests. Therefore, one should takecaution when making direct comparisons between test results of different specimens since eachspecimen might have different stress–strain paths. This is one of the primary reasons to utilize theVECD theory to analyze this kind of data. The calibration of the VECD model (i.e., obtainingthe C versus S damage characteristic curve) can be done using random loading history where theapplied stress or strain data are not explicitly defined.
4. Fatigue analysis using the VECD theory4.1. Overview of the VECD analysis procedureThe VECD theory has been successfully used by many researchers to analyze and model thefatigue behavior of asphaltic materials (Bonaquist et al., 2003; Chehab, 2002; Christensen et al.,2005; Daniel, 2001; Kim & Little, 1990; Lundstrom & Isacsson, 2003). This theory is based onSchapery’s elastic-viscoelastic correspondence principle and the work potential theory (Schapery1984). In this theory, the nonlinear behavior caused by distributed micro cracks is accounted forby using the so-called ‘internal state variables’ that quantify damage growth within the specimen.There are three primary pseudo-parameters in this technique: (1) pseudostrain, εR, which isproportional to the linear viscoelastic stress; (2) pseudo stiffness, C, which represents the reductionin modulus; and (3) damage parameter, S, which quantifies the micro crack development withinthe specimen.
Implementation of the convolution integral used in the calculation of the pseudostrain is com-putationally expensive in the time domain (Kutay et al., 2008a). In order to simplify and promotethe practicality of VECD formulations, several researchers derived simplified formulations forthe specific cases of cyclic tests with constant frequency (Christensen et al., 2005; Daniel, 2001;Kutay, Gibson, & Youtcheff, 2008b; Kutay et al., 2009). The procedure suggested by Kutay et al.
Dow
nloa
ded
by [
Rao
uf M
bark
i] a
t 15:
55 1
1 D
ecem
ber
2014
426 R. Mbarki et al.
(2009) was adopted in this paper to numerically solve the convolution integral. The following isa step-by-step summary of this procedure.
• Perform dynamic modulus (|E∗|) tests (AASHTO TP-79) and develop |E∗| and phase anglemaster curves.
• Determine E(t) master curve through inter-conversion (Park & Schapery, 1999) andcalculate α.
• Perform push-pull fatigue tests and calculate C and S at each loading cycle N using thepeak-to-peak stress and strain values according to the procedure described in Kutay et al.(2009).
• Plot C versus S curve and determine dC/dS. The latter can be obtained by fitting a regressionmodel to the C versus S curve and finding the derivative or by simply dividing the C versusS curve into smaller intervals up to the selected failure point, Sf , and calculating dC/dSwithin each interval.
• Finally, select a failure criterion (e.g., C = 0.5 or a 50% reduction in modulus), strain level,frequency and temperature and calculate the fatigue life, Nf , as presented in Equation (1):
Nf =Sf∑
S=1
[−ε2
0 |E∗|2LVE
2dCdS
∣∣∣∣∣at S
]−α
f �SS (1)
where ε0 = peak strain level selected for each cycle, |E∗|LVE = linear viscoelastic dynamicmodulus, C = pseudostiffness, S = damage parameter, f = loading frequency, �Ss is thechange in damage parameter within each summation increment, Sf = damage parametercorresponding to C = 0.5 (i.e., failure), and α = the damage exponent that is simply theinverse of the slope of the E(t) mastercurve plotted on log-log scale.
4.2. Linear viscoelastic characteristicsAs discussed previously, the VECD analysis procedure has two main inputs other than the push-pull fatigue test results: the linear viscoelastic modulus |E∗| (dynamic modulus without damage)and the slope of the relaxation modulus curve used to determine the damage exponent α. Inthis study, the |E∗| master curves of the laboratory specimens were measured in the AMPTdevice. However, there were not enough specimens available for |E∗| testing of the field cores.Therefore, it was assumed that the field specimens and the laboratory specimens had the samelinear viscoelastic characteristics (|E∗| and α).
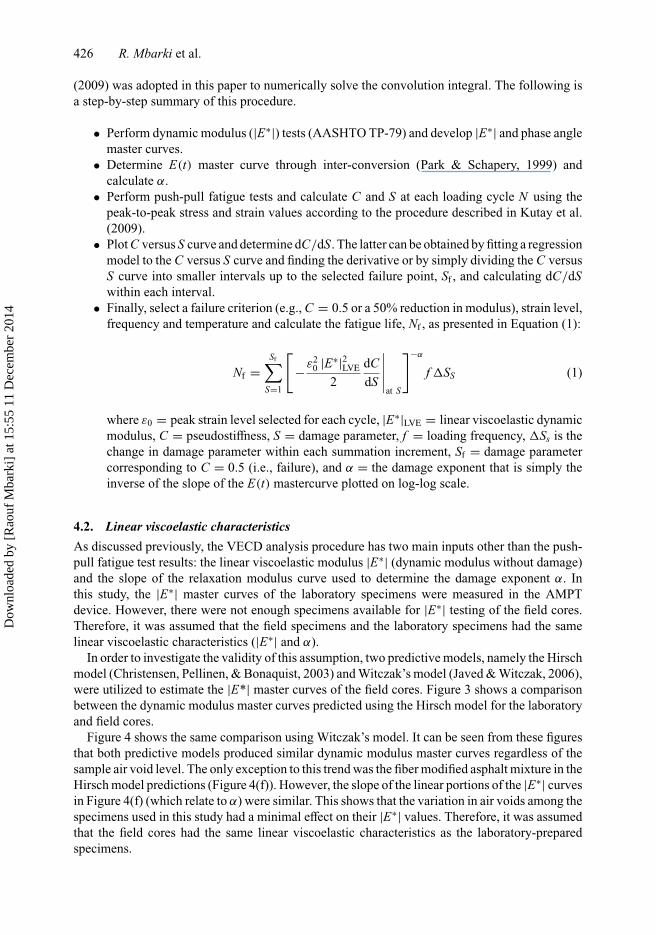
In order to investigate the validity of this assumption, two predictive models, namely the Hirschmodel (Christensen, Pellinen, & Bonaquist, 2003) and Witczak’s model (Javed & Witczak, 2006),were utilized to estimate the |E*| master curves of the field cores. Figure 3 shows a comparisonbetween the dynamic modulus master curves predicted using the Hirsch model for the laboratoryand field cores.
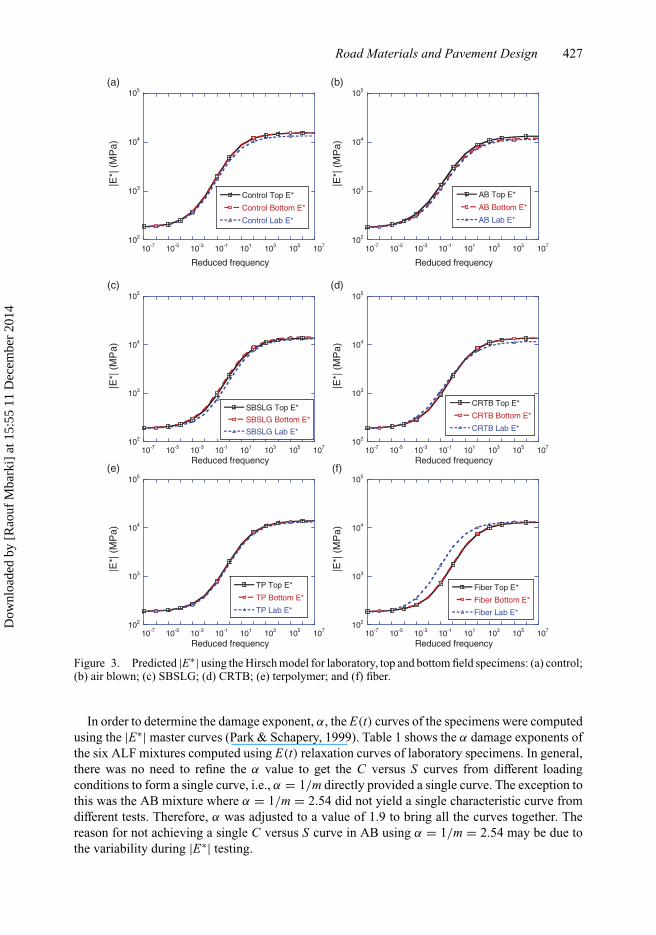
Figure 4 shows the same comparison using Witczak’s model. It can be seen from these figuresthat both predictive models produced similar dynamic modulus master curves regardless of thesample air void level. The only exception to this trend was the fiber modified asphalt mixture in theHirsch model predictions (Figure 4(f)). However, the slope of the linear portions of the |E∗| curvesin Figure 4(f) (which relate to α) were similar. This shows that the variation in air voids among thespecimens used in this study had a minimal effect on their |E∗| values. Therefore, it was assumedthat the field cores had the same linear viscoelastic characteristics as the laboratory-preparedspecimens.
Dow
nloa
ded
by [
Rao
uf M
bark
i] a
t 15:
55 1
1 D
ecem
ber
2014
Road Materials and Pavement Design 427
102
103
104
105
10-7 10-5 10-3 10-1 101 103 105 107
Control Top E*
Control Bottom E*
Control Lab E*
|E*|
(M
Pa)
Reduced frequency
(a)
102
103
104
105
10-7 10-5 10-3 10-1 101 103 105 107
AB Top E*
AB Bottom E*
AB Lab E*
|E*|
(M
Pa)
Reduced frequency
(b)
102
103
104
105
10-7 10-5 10-3 10-1 101 103 105 107
SBSLG Top E*
SBSLG Bottom E*
SBSLG Lab E*
|E*|
(M
Pa)
Reduced frequency
(c)
102
103
104
105
10-7 10-5 10-3 10-1 101 103 105 107
CRTB Top E*
CRTB Bottom E*
CRTB Lab E*
|E*|
(M
Pa)
Reduced frequency
(d)
102
103
104
105
10-7 10-5 10-3 10-1 101 103 105 107
TP Top E*
TP Bottom E*
TP Lab E*
|E*|
(M
Pa)
Reduced frequency
(e)
102
103
104
105
10-7 10-5 10-3 10-1 101 103 105 107
Fiber Top E*
Fiber Bottom E*
Fiber Lab E*
|E*|
(M
Pa)
Reduced frequency
(f)
Figure 3. Predicted |E∗| using the Hirsch model for laboratory, top and bottom field specimens: (a) control;(b) air blown; (c) SBSLG; (d) CRTB; (e) terpolymer; and (f) fiber.
In order to determine the damage exponent, α, the E(t) curves of the specimens were computedusing the |E∗| master curves (Park & Schapery, 1999). Table 1 shows the α damage exponents ofthe six ALF mixtures computed using E(t) relaxation curves of laboratory specimens. In general,there was no need to refine the α value to get the C versus S curves from different loadingconditions to form a single curve, i.e., α = 1/m directly provided a single curve. The exception tothis was the AB mixture where α = 1/m = 2.54 did not yield a single characteristic curve fromdifferent tests. Therefore, α was adjusted to a value of 1.9 to bring all the curves together. Thereason for not achieving a single C versus S curve in AB using α = 1/m = 2.54 may be due tothe variability during |E∗| testing.
Dow
nloa
ded
by [
Rao
uf M
bark
i] a
t 15:
55 1
1 D
ecem
ber
2014
428 R. Mbarki et al.
101
102
103
104
105
10-8 10-6 10-4 10-2 100 102 104 106 108
Control Top E*Control Bottom E*Control Lab E*
|E*|
(M
pa)
Reduced frequency
(a)
100
101
102
103
104
105
10-8 10-6 10-4 10-2 100 102 104 106 108
AB Top E*
AB Bottom E*
AB Lab E*
|E*|
(M
pa)
Reduced frequency
(b)
102
103
104
105
10-8 10-6 10-4 10-2 100 102 104 106 108
SBSLG Top E*
SBSLG Bottom E*
SBSLG Lab E*
|E*|
(M
pa)
Reduced frequency
(c)
102
103
104
105
10-8 10-6 10-4 10-2 100 102 104 106 108
CRTB Top E*
CRTB Bottom E*
CRTB Lab E*
|E*|
(M
pa)
Reduced frequency
(d)
102
103
104
105
10-8 10-6 10-4 10-2 100 102 104 106 108
TP Top E*
TP Bottom E*
TP Lab E*
|E*|
(M
pa)
Reduced frequency
(e)
101
102
103
104
105
10-8 10-6 10-4 10-2 100 102 104 106 108
Fiber Top E*
Fiber Bottom E*
Fiber Lab E*
|E*|
(M
pa)
Reduced frequency
(f)
Figure 4. Predicted |E∗| using Witczak’s model for laboratory, top and bottom field specimens: (a) control;(b) air blown; (c) SBSLG; (d) CRTB; (e) terpolymer; and (f) fiber.
Table 1. Linear viscoelastic (LVE) parameters of ALF mixtures.
m = slope of log Lab |E∗| (MPa) atHMA Specimen (E(t))–log(t) curve α = 1/m T = 19 ◦C, f = 10 Hz
Control 0.45 2.22 7847AB 0.42 1.90∗ 6561CRTB 0.35 2.86 4536Fiber 0.45 2.20 7864SBS-LG 0.37 2.70 4467Terpolymer 0.33 3.00 3726
∗Note: The α was adjusted to a value of 1.9 to bring damage characteristic curves together.
Dow
nloa
ded
by [
Rao
uf M
bark
i] a
t 15:
55 1
1 D
ecem
ber
2014
Road Materials and Pavement Design 429
0 100
5 104
1 105
1.5 105
2 105
0
0.2
0.4
0.6
0.8
1
LabField Top LayerField Bottom Layer
S
C
(a)
0 100
5 104
1 105
1.5 105
2 105
0
0.2
0.4
0.6
0.8
1
LabField Top LayerField Bottom Layer
S
C
(b)
(c) (d)
(e) (f)
0 100 5 104 1 105 1.5 105 2 1050
0.2
0.4
0.6
0.8
1
LabField Top LayerField Bottom Layer
S
C
0 100 5 104 1 105 1.5 105 2 1050
0.2
0.4
0.6
0.8
1
LabField Top LayerField Bottom Layer
S
C
0 100 5 104 1 105 1.5 105 2 1050
0.2
0.4
0.6
0.8
1
LabField Top LayerField Bottom Layer
S
C
0 100 5 104 1 105 1.5 105 2 1050
0.2
0.4
0.6
0.8
1
Field Bottom LayerField Top LayerLab
S
C
Figure 5. Damage characteristic curves of field cores and laboratory specimens: (a) control; (b) AB; (c)SBS LG; (d) CR-TB; (e) terpolymer; and (f) fiber.
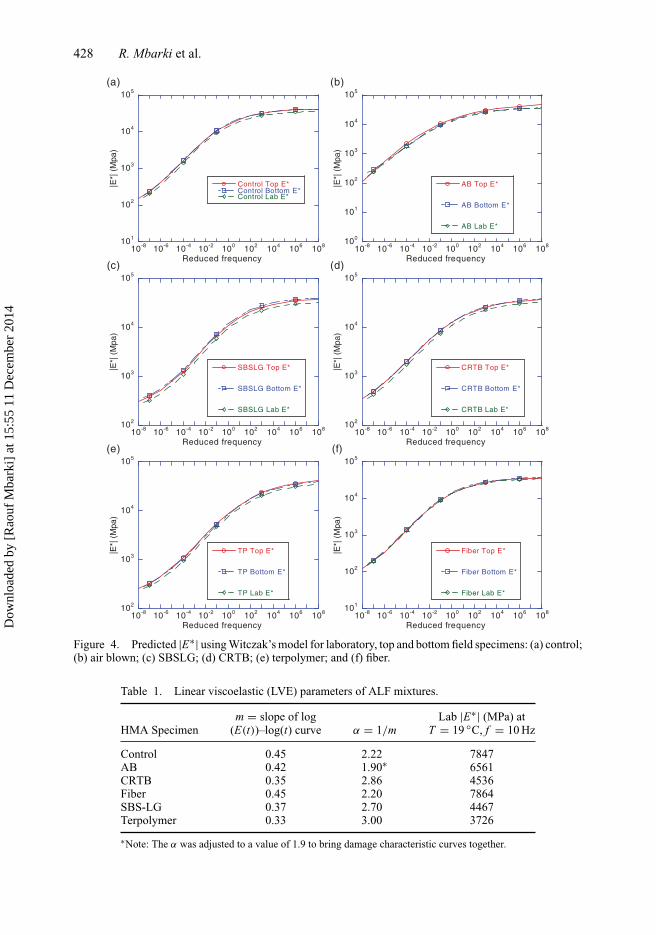
4.3. Damage characteristic curvesFigure 5 shows the damage characteristic curves of the laboratory and field (top and bottom)specimens. As discussed earlier, the damage characteristic curves relate the pseudo stiffness, C,to the damage parameter, S, and quantify damage growth due to micro cracks within the specimen.At the beginning of the test, the pseudo stiffness is equal to unity (i.e., no damage). However, withsuccessive loading and as micro cracks develop and propagate, the pseudo stiffness decreases,reflecting a reduction in the ability of the specimen to resist loading.
As demonstrated in Figure 5, the variation between the top and bottom field specimens issmaller than the difference between the field and laboratory specimens. This is the case for almostall mixtures, except for the fiber modified asphalt mixture. In terms of deterioration rate, therewas no common trend. For example, the C versus S curves of field cores are above the C versus Scurve of the laboratory specimens in control, AB, CRTB and fiber, whereas the trend is oppositein SBS-LG and terpolymer.
Dow
nloa
ded
by [
Rao
uf M
bark
i] a
t 15:
55 1
1 D
ecem
ber
2014

430 R. Mbarki et al.
It should be emphasized that even though the C versus S curves can be used to comparethe deterioration trends in pseudo stiffness between laboratory and field specimens, they arenot sufficient to rank the mixtures based on fatigue performance. The latter can be achievedby comparing their fatigue lives, calculated using Equation (1), as discussed in the followingsubsection.
4.4. Fatigue life comparison of laboratory and field specimensEquation (1) was used to calculate the number of cycles to failure (Nf ), i.e., fatigue lives of themixtures based on the C versus S curves shown in Figure 5. Figure 6 shows a comparison betweenthe fatigue lives of the laboratory and field specimens calculated at strain levels of 75, 175, 350,
10
100
1000
104
105
106
107
108
109
75 175 350 500
Control Lab
Control Top
Control Bottom
Nf (
Num
ber
of c
ycle
s to
C=0
.5)
Microstrain (Half Peak)
T=15 C, f=10Hz
(a) (b)
(c) (d)
(e) (f)
10
100
1000
104
105
106
107
108
109
75 175 350 500
SBSLG Lab
SBSLG Top
SBSLG Bottom
Nf
(Num
ber
of c
ycle
s to
C=0
.5)
Microstrain (Half Peak)
T=15 C, f=10Hz
10
100
1000
104
105
106
107
108
109
75 175 350 500
AB Lab
AB Top
AB Bottom
Nf (
Num
ber
of c
ycle
s to
C=
0.5)
Microstrain (Half Peak)
T=15 C, f=10Hz
10
100
1000
104
105
106
107
108
109
75 175 350 500
CRTB Lab
CRTB Top
CRTB Bottom
Nf (
Num
ber
of c
ycle
s to
C=
0.5)
Microstrain (Half Peak)
T=15 C, f=10Hz
10
100
1000
104
105
106
107
108
109
75 175 350 500
Fiber Lab
Fiber Top
Fiber Bottom
Nf
(Num
ber
of c
ycle
s to
C=0
.5)
Microstrain (Half Peak)
T=15 C, f=10Hz
10
100
1000
104
105
106
107
108
109
75 175 350 500
TP Lab
TP Top
TP Bottom
Nf (
Num
ber
of c
ycle
s to
C=0
.5)
Microstrain (Half Peak)
T=15 C, f=10Hz
Figure 6. Comparison of fatigue lives based on lab and field cores for (a) control; (b) SBS LG; (c) AB;(d) CRTB; (e) fiber; and (f) TP mixtures.
Dow
nloa
ded
by [
Rao
uf M
bark
i] a
t 15:
55 1
1 D
ecem
ber
2014

Road Materials and Pavement Design 431
and 500 microstrains at the temperature of 15 ◦C. These values were selected to cover the expectedrange of strain levels that an asphalt pavement is subjected to in the field.
Figure 6 shows that in some mixtures (control, AB and fiber), the field specimens exhibitedlarger Nf values (i.e., better performance), while in others (SBS-LG, terpolymer and CR-TB),the laboratory specimens had larger Nf values. Given that the field cores were taken 7 years afterconstruction, aging only seems to have affected the SBS-LG and terpolymer (the two polymermodified asphalt mixtures). In all other mixtures, the field cores exhibited either similar or higherNf values.
Due to exposure to sunlight and air, the top portion of an asphalt pavement layer is expectedto age faster than the bottom portion. However, as shown in Figure 6, the top field specimens didnot exhibit consistently lower Nf values as compared with the bottom specimens. This impliesthat the top and bottom portions of the asphalt layer aged equally or that the effect of agingwas not significant enough to alter the behavior of the asphalt layer. Another observation fromFigure 6 is that the selected strain level did not change the ranking of the laboratory and fieldspecimens.
5. ConclusionsThis paper investigated the fatigue behavior of field specimens obtained from the top and bottomportions of different field lanes at the TFHRC APT facility as well as laboratory-produced spec-imens prepared using the same materials and mix designs. Fatigue testing was conducted usingthe uniaxial push-pull (compression-tension) fatigue test. The resulting stress–strain behaviorwas analyzed using the VECD theory. Comparisons were made between the laboratory and fieldspecimens and between the field specimens at varying depths. Based on the experimental testresults and the subsequent analysis findings, the following conclusions were made.
• The top and bottom field specimens exhibited similar damage characteristics and compa-rable fatigue lives.
• The laboratory and field specimens exhibited different damage characteristic curves anddifferent fatigue lives.
• Some mixtures (control, AB and fiber) had higher fatigue lives for the field specimens, whileothers (SBS-LG and terpolymer) had higher fatigue lives for the laboratory specimens.
• Aging in the field only seems to have affected the two polymer modified asphalt mixtures(SBS-LG and terpolymer). In all other mixtures, the field specimens exhibited either similaror higher fatigue lives.
More research is needed to better understand the fatigue behavior of field and laboratory mix-tures. For example, fatigue performance of samples extracted from newly constructed pavementsshould be compared with that of laboratory-prepared mixtures compacted to the same air voidlevel. In addition, the effect of the laboratory aging procedure on fatigue performance shouldbe investigated by comparing in-service pavement samples to asphalt mixtures prepared in thelaboratory using different aging conditions (i.e., aging temperature and aging time).
AcknowledgementsThe authors would like to thank the Bituminous Mixtures Laboratory staff at the TFHRC, Mr Scott Parobeckand Mr Frank Davis, for preparing the specimens and running the tests. Special thanks are extended to DrXicheng Qi for providing the performance data measured at the TFHRC APT facility. Valuable commentsby Professor Richard Kim on the viscoelastic continuum damage theory are greatly appreciated.
Dow
nloa
ded
by [
Rao
uf M
bark
i] a
t 15:
55 1
1 D
ecem
ber
2014
432 R. Mbarki et al.
ReferencesArambula, E., & Kutay, M.E. (2009). Tension-compression fatigue test evaluation using fracture mechanics
and field data. Road Materials and Pavement Design, 10(1), 83–108.Bonaquist, R.F., Christensen, D.W., & Stump III, W. (2003). Simple performance tester for Superpave
mix design: First-article development and evaluation. NCHRP Report 513, National Academies Press,Washington, DC.
Chehab, G.R. (2002). Characterization of asphalt concrete in tension using a viscoelastoplastic model. PhDDissertation, North Carolina State University, Raleigh, NC.
Christensen, D.W., & Bonaquist, R.F. (2005). Practical application of continuum damage theory to fatiguephenomena in asphalt concrete mixtures. Journal of the Association of Asphalt Paving Technologists,74, 963–1002.
Christensen, D.W., Pellinen, T.K., & Bonaquist, R.F. (2003). Hirsch model for estimating the modulus ofasphalt concrete. Journal of the Association of Asphalt Paving Technologists, 72, 97–121.
Daniel, J.S. (2001). Development of a simplified fatigue test and analysis procedure using a viscoelastic,continuum damage model and its implementation to westrack mixtures. PhD Dissertation, North CarolinaState University, Raleigh, NC, 2001.
Gibson, N.H. (2006). A viscoelastoplastic continuum damage model for the compressive behavior of asphaltconcrete. PhD Dissertation, University of Maryland, College Park.
Harvey J.T., & Tsai, B.W. (1996). Effects of asphalt content and air void content on mix fatigue and stiffness.Transportation Research Record No. 1543, TRB, National Research Council, Washington, DC. 38–45.
Javed, B., & Witczak, M.W. (2006). Development of a new revised version of the Witczak E∗ predictivemodel for hot mix asphalt mixture. Journal of the Association of Asphalt Paving Technologists, 75,381–423.
Kim, Y.R., & Little, D. N. (1990). One-dimensional constitutive modeling of asphalt concrete. ASCE Journalof Engineering Mechanics, 116(4), 485–514.
Kutay, M.E., Gibson, N.H., & Youtcheff, J. (2008a). Conventional and viscoelastic continuum damage(VECD) based fatigue analysis of polymer modified asphalt pavements. Journal of Association ofAsphalt Paving Technologists, 77, 395–434.
Kutay, M.E., Gibson, N.H., & Youtcheff, J. (2008b). Use of pseudostress and pseudostrain concepts forcharacterization of asphalt fatigue tests. Proceedings of the Sixth RILEM International Conference onCracking in Pavements, Chicago, USA, June 16–18, 2008.
Kutay, M.E., Gibson, N.H., Youtcheff, J., & Dongre, R. (2009). Use of small samples to predict fatiguelives of field cores: Newly developed formulation based on viscoelastic continuum damage theory.Transportation Research Record: Journal of the Transportation Research Board, 2127, 90–97.
Lundstrom, R., & Isacsson, U. (2003). Asphalt fatigue modeling using viscoelastic continuum damagetheory. Road Materials and Pavement Design, 4(1).
Park, S.W., & Schapery, R.A. (1999). Methods of interconversion between linear viscoelastic materialfunctions. Part I – a numerical method based on Prony series. International Journal of Solids andStructures, 36, 1653–1675.
Qi, X., Al-Khateeb, G., Mitchell, T., Stuart, K., & Youtcheff, J. (2004). Determining modified asphalt binderproperties for the Superpave specification. Report on the construction of pavements with modifiedasphalt binders, Pooled Fund study TPF-5 (019), Internal Report, January.
Schapery, R.A. (1984). Correspondence principles and a generalized J-integral for large deformation andfracture analysis of viscoelastic media. International Journal of Fracture, 25, 195–223.
Soltani, A., & Anderson, D.A. (2005). New test protocol to measure fatigue damage in asphalt mixtures.Road Materials and Pavement Design, 6(4), 485–514.
Dow
nloa
ded
by [
Rao
uf M
bark
i] a
t 15:
55 1
1 D
ecem
ber
2014
Related Documents


