Comparisional Study of Pitched Blade Impeller and Rushton Turbine in Stirred Tank for Optimum Fluid Mixing 1 S. Saravanakumar, 2 P. Sakthivel, 3 S. Shiva Swabnil and 4 S. Rajesh 1 Department of Automobile Engineering, Easwari Engineering College, Chennai. [email protected] 2 Department of Automobile Engineering, Easwari Engineering College, Chennai. [email protected] 3 Department of Mechanical Engineering, Tagore Engineering College, Chennai. [email protected]. 4 Department of Mechanical Engineering, Tagore Engineering College, Chennai. Abstract The improper stirring may cause product ineffective even which may lead to product failure. Hence, the design of impeller for effective stirring action has significant scope. The various parameters like power number, flow number and various position of impeller arrangement (with and without baffles plate) can be measured to predict the performance of the impeller. In this paper the effect of power number in Rushton turbine and Pitched blade impeller for effective stirring operation in the fluid tank. The effect of power number in Rushton turbine is dependent on impeller geometry and blade thickness and it is independent on the ratio of impeller International Journal of Pure and Applied Mathematics Volume 119 No. 12 2018, 3037-3056 ISSN: 1314-3395 (on-line version) url: http://www.ijpam.eu Special Issue ijpam.eu 3037

Welcome message from author
This document is posted to help you gain knowledge. Please leave a comment to let me know what you think about it! Share it to your friends and learn new things together.
Transcript

Comparisional Study of Pitched Blade
Impeller and Rushton Turbine in Stirred Tank
for Optimum Fluid Mixing 1S. Saravanakumar,
2P. Sakthivel,
3S. Shiva Swabnil and
4S. Rajesh
1Department of Automobile Engineering,
Easwari Engineering College,
Chennai.
[email protected] 2Department of Automobile Engineering,
Easwari Engineering College,
Chennai.
[email protected] 3Department of Mechanical Engineering,
Tagore Engineering College,
Chennai.
[email protected]. 4Department of Mechanical Engineering,
Tagore Engineering College,
Chennai.
Abstract The improper stirring may cause product ineffective even which may
lead to product failure. Hence, the design of impeller for effective stirring
action has significant scope. The various parameters like power number,
flow number and various position of impeller arrangement (with and
without baffles plate) can be measured to predict the performance of the
impeller. In this paper the effect of power number in Rushton turbine and
Pitched blade impeller for effective stirring operation in the fluid tank. The
effect of power number in Rushton turbine is dependent on impeller
geometry and blade thickness and it is independent on the ratio of impeller
International Journal of Pure and Applied MathematicsVolume 119 No. 12 2018, 3037-3056ISSN: 1314-3395 (on-line version)url: http://www.ijpam.euSpecial Issue ijpam.eu
3037

diameter to tank diameter. Also for pitched blade impeller the power
number is dependent on the ration of impeller to tank diameter but it is
independent on blade thickness. In the study of pitched blade impeller the
effect of power number is exactly produce opposite result to that observed
for the Rushton turbine. In this paper Physical explanations are given for
the differences in behavior between the two impellers. In the study of
pitched blade impeller the form drag is not important but it dependent on
the fluid flow, so the impact of power number is dependent on the flow
and position of impeller in the tank. At the same time for Rushton turbine
the fluid flow and blade geometry have only 30% impact on power number
and it is dominated by from drag. In this paper the effect of power number
is discussed for pitched blade impeller and Rushton turbine.
Key Words: mixing; power; torque; stirred tank; Rushton turbine;
pitched blade impeller.
International Journal of Pure and Applied Mathematics Special Issue
3038

1. Introduction
In industrial mixing applications, the power consumption per unit volume of
fluid is used extensively for scale-up, scale-down and design. In spite of its
widespread use, the dependence of power consumption on impeller and tank
geometry is defined only in the most general terms. This is partly due to the
difficulty of obtaining accurate torque measurements on the small scale, and
partly due to the predictive limitations of drag theory, particularly for re
circulating three dimensional flows will rightly expect that this
dimensionless group can be derived from physical fundamentals; namely a
drag force analysis, or alternately an angular momentum balance. The drag
force analysis which originated with White1,3
is discussed in detail by
Tatterson4 and can be summarized as follows:
(1)
The first studies of power consumption date back to 19341, but the early
study by Rushton et al2 is widely cited as the first definitive work in the
area. Using dimen- sional analysis, Rushton et al. developed a number of
dimensionless groups, including the power number, Np.
(2)
where P is the power required by the impeller, ρ is the fluid density, N is the
rotating speed of the impeller in rotations per second, and D is the diameter
of the impeller. The power is usually calculated from measurements of the
torque and the shaft speed:
P = 2πNTq (3)
Combining equations (1) and (2), the power number can be rewritten as:
(4)
The calculation of power number using blade element theory in combination
with lift and drag coefficients from the literature. They model the effects of
blade angle, blade thickness, blade camber, and blade number on impeller
performance.
International Journal of Pure and Applied Mathematics Special Issue
3039

…
The power number is one of the most widely used design specifications in
the mixing operation and has proven to be a reliable predictor of a number
of process results. Given the success of the power number, the reader
Figure 1. Control volume around the impeller.
This approach has the advantage of using velocity profiles around the
impeller, so that the connection between circulation patterns and power
number can be examined and the effect of geometry on power number can
be better understood.
The dependence of power number on Reynolds number is analogous to well
establish results for the friction factor in pipe flow, and for the drag
coefficient on a sphere. In the laminar range (Re < 10 to 100, depending on
the impeller of interest), the power number is inversely proportional to the
Reynolds number6 (Np 1=Re). In the fully turbulent range (Re > 2 104), the
power number is constant and independent of the Reynolds number. The
fully turbulent power number, Npft or simply Np, is often quoted as ‘the’
power number for a fixed impeller geometry.
In the context of the drag force grouping of the power number, many
researchers have assumed that Np depends principally on the tip speed and
on the projected area of the blades. The projected area depends on variables
such as impeller diameter D, blade width W, and blade length L. Bujalski et
al.5, however, showed that blade thickness also has a significant effect on
Np for the Rushton turbine (RT). Rutherford et al.6 confirmed this result. It
has also frequently been assumed that the size of the tank is large relative to
the flow around the impeller blades. This allows geometric variables
involving the tank diameter, such as D/T and C/T, to be eliminated. Early
studies7–9 showed that D/T and C/T can affect Np as the impeller
approaches the tank walls, but results in general were contradictory and
inconclusive7. Detailed studies of these effects were largely abandoned
from 1975–1995, with the exception of a comprehensive paper by Medek10
in 1980. More recent work by Armenante et al.11 found a decrease in Np
with increasing D/T for the PBT. A dependence on C/D has also been
reported10–12, illustrating the strong interaction between the impeller and
the tank walls for the PBT impeller.
Possible variations in power number due to changes in impeller diameter,
off bottom clearance, and details of the impeller construction inject a degree
of uncertainty into one of the central specifications used for design of
International Journal of Pure and Applied Mathematics Special Issue
3040
mixing equipment. Very accurate measurements of the torque and power
consumption are required in order to resolve this ambiguity because at small
scales the torque drops off dramatically (Tq D5). While the torque also
increases with N2, there are practical limits on N due to air entrain- ment
and mechanical vibration. The difficulty of detecting the effects of t/D, D/T
and C/T on the power draw is compounded if there is a significant baseline
torque due to friction. As a result, the method used to measure power draw
must be carefully considered. Four experimental methods are considered
here: measurement of current draw by the motor, measurement of
temperature rise in the fluid, measurement of torque on the tank or motor,
and use of torque transducers to measure the torque on the shaft.
King et al13
measured the electrical power consumed by the motor. Where
the efficiency curve of the motor is known and other power losses in the
system from gear boxes and bearings are both known and stable, this
method was shown to work well. At the small scale, this method is difficult
to apply since the additional power consumption due to the impeller is quite
small relative to the total power draw.
An energy balance on the tank suggests that if the tank is insulated, the
power draw can be deduced from the temperature rise of the • fluid over a
suitable period of time. For low viscosity • fluids, the temperature rise is
small, and this method is not practical. For higher viscosity • fluids at low
Re, reasonable results may be obtained, provided the viscosity is not a
strong function of temperature. In general; however, this method is not
recommended.
To measure the torque on the tank, a bearing in combination with a spring
scale can be used. The ‘frictionless’ bearing supporting the tank is stationary
once the shaft speed has stabilized, and the torque sustained by the bearing
is constant. Nienow and Miles14
used an ‘air bearing dynamometer’ for this
method. Bujalski et al5
whose data is referenced later in this study, also used
this method. Alternately, the motor can be supported by a bearing, and the
torque on the motor can be measured2. The best illustration of these
arrangements is given in Figures 2–8 in Holland and Chapman15. As the
impeller diameter decreases relative to the size of the tank, the inertia of the
tank or motor and the frictional forces in the bearing increase relative to the
torque, and this method becomes less accurate.
The most direct way to measure the torque due to fluid forces on the
impeller is to measure the torque on the shaft directly. A torque transducer
is installed on the shaft either outside the tank just below the motor16
, or
inside the tank just above the impeller17. Bujalski
et al5, Distelhoff et al.18, and Rutherford et al
6 mounted a strain gauge on
the shaft just above the impeller. An early version of this apparatus, suitable
only for large torques, is shown in Nagata’s3 Figure 1.8. In this work, a
International Journal of Pure and Applied Mathematics Special Issue
3041

torque transducer is installed on the shaft just below the motor. The
instrument is quite fragile and calibration for very small torque
measurements must be done with great care if accurate and consistent
results are to be obtained.
In this paper, the sensitivity of the power number to changes in blade
thickness and impeller diameter is examined for the down-pumping 45¯
pitched blade impeller (PBT). The experimental equipment is validated
using existing data for the Rushton turbine. The range of Reynolds numbers
considered extends well down into the transitional range for both the RT
and the PBT. The experimental method is described here in some detail in
order to encourage standardization of future work in this area.
2. Experimental
The experiments were carried out in a 0.240m diameter cylindrical tank
with H=T as shown in Figure 2. Four rectangular baffles with a width of
T/10 were equally spaced around the periphery of the tank. A lid was
installed to prevent air entrainment at higher impeller speeds (N). Rushton
turbines of diameter D=T/3 and PBT’s of diameters D=T/4, T/3 and T/2
were studied. All impellers were located at an off-bottom clearance of
C=T/3. Reynolds numbers from 300–150,000 were investigated, covering
the range from low transitional to fully turbulent flow. Table 1 gives the
properties of the test liquids and the range of Reynolds number covered by
each fluid.
Figure 2. Schematic diagram of the experimental setup.
Scale drawings of the RT and the PBT are given in Figure 3. Detailed
dimensions of all impellers are given in Table 2. The hub height of the RT
was measured from the bottom of the disk to the top of the hub. The PBT’s
were used in the down-pumping direction. The blades were welded onto the
hub or the disk and the impellers were secured at the end of the shaft using a
setscrew. While some authors stabilize the shaft using a bearing at the
bottom of the tank, in this work the shaft ends at the bottom of the impeller.
This was done to ensure the retention of any macro instabilities which
International Journal of Pure and Applied Mathematics Special Issue
3042
develop below the impeller. The freedom of motion at the bottom of the
shaft results in bending forces on the shaft which require some additional
precautions in the installation of the torque transducer.
Figure 2 is a schematic diagram of the motor and torque transducer
assembly, which is mounted on a steel framework above the tank. The mixer
motor (Caframo BDC3030) can reach speeds of up to 3000 rpm and has
enough power to cover the full range of the torque transducer without
exceeding it. The motor speed was periodically verified using an optical
tachometer. The speed remained constant to within 2% of the set speed.
The torque transducer (MCRT 3L-08T from S. Himmelstein & Co.) has a
range from -0.7Nm to +0.7Nm (±100oz-in). This transducer was chosen for its
high precision: ±0.1% of full scale. Along with this high sensitivity to torque
comes a high sensitivity to bending forces and axial loads, demanding extra
care and attention when mounting the transducer in the mixer assembly. A
pillow bearing (see Figure 2) was placed between the torque transducer and
the impeller shaft to support all of the axial, radial, and bending loads applied
to the shaft due to the mixing process. This allows only the torque to be
transmitted through to the torque transducer. To remove any remaining
vibrations and bending forces, • ex couplers were placed on either side of the
transducer. These couplers also protect the transducer from small
misalignments in the Motor/shaft/transducer/bearing assembly.
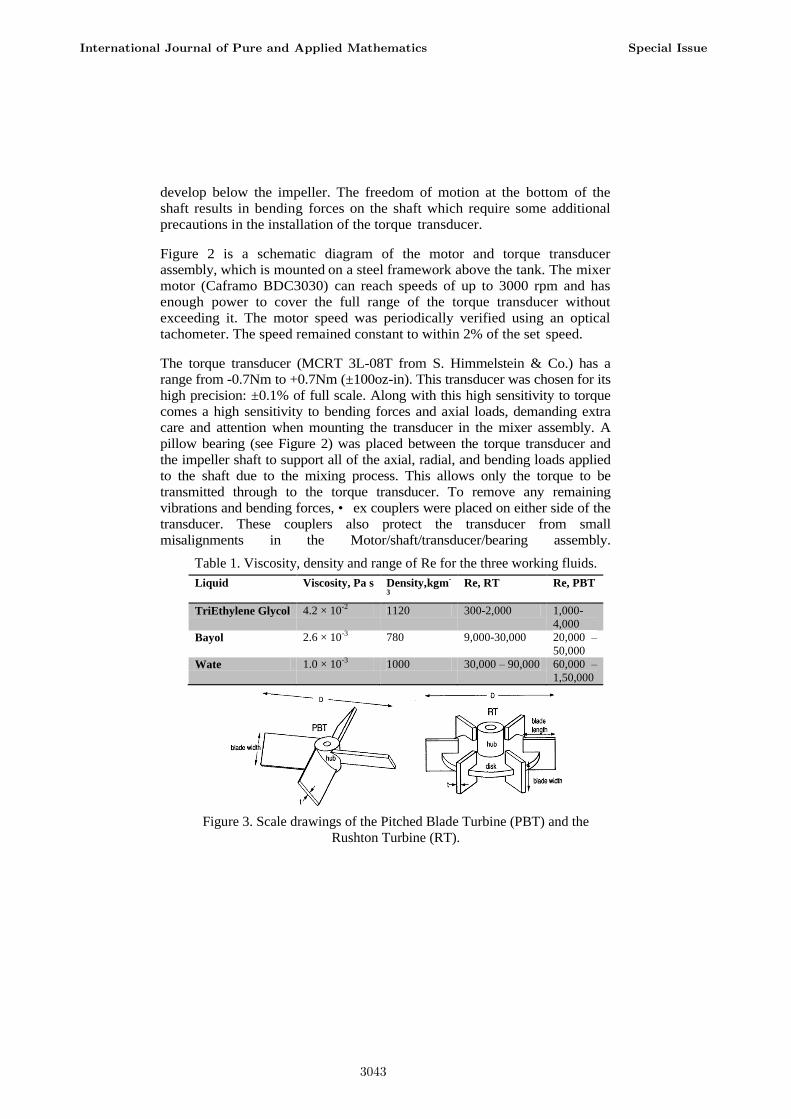
Table 1. Viscosity, density and range of Re for the three working fluids.
Liquid Viscosity, Pa s Density,kgm-
3
Re, RT Re, PBT
TriEthylene Glycol 4.2 × 10⁻²
1120 300-2,000 1,000-
4,000
Bayol 2.6 × 10⁻³
780 9,000-30,000 20,000 –
50,000
Wate 1.0 × 10⁻³
1000 30,000 – 90,000 60,000 –
1,50,000
Figure 3. Scale drawings of the Pitched Blade Turbine (PBT) and the
Rushton Turbine (RT).
International Journal of Pure and Applied Mathematics Special Issue
3043

Table 2. Impeller dimensions in millimetres.
Impeller type T/3 RT T/3 RT T/3 PBT T/3 PBT T/3 PBT T/3 PBT T/4 PBT T/2 PBT
t/D (dimensionless) 0.011 0.034 0.008 0.009 0.019 0.033 0.020 0.020
Diameter, D 80.8 77.1 79.5 79.6 78.8 79.4 60.3 120
Hub diameter 12.8 15.4 15.9 15.9 15.9 15.9 12.7 22.2
Hub bore 6.4 6.4 6.4 6.4 6.4 6.4 6.4 6.4
Hub height 14.3 15.0 12.1 12.1 13.0 14.1 9.4 18.6
Blade thickness, t 0.89 2.59 0.61 0.74 1.50 2.59 1.19 2.44
Blade width 16.2 15.4 15.9 15.9 15.8 15.8 12.0 24.1
Blade length 20.1 19.3 – – – – – –
Disk diameter 53.6 57.9 – – – – – –
Disk thickness 1.42 2.62 – – – – – –
This combination of bearing and torque transducer allows measurement of
torques as small as 0.03 Nm (4oz-in). Several criteria are important for the
selection of a bearing for this application. The bearing needs to absorb the
axial and radial loads associated with the impellers of interest. A close
clearance bearing is needed to minimize the wobble in the impeller shaft. A
bearing with low friction makes it possible to measure small impeller
torques accurately. An unsealed bearing will always have less friction than a
sealed one, but an unsealed bearing in this orientation will leak lubricant
down the shaft and into the tank. The pillow bearing selected (an INA radial
sealed 1/2 inch ball bearing) is mounted in a cast iron housing which is
bolted to the stand. Over time, axial loads caused the bearing to wear down,
allowing increasing wobble in the shaft. The wobble increased the measured
torque by as much as 5–10%. Measurements with excessive wobble were
discarded and the bearing was replaced several times over the course of the
study.
Figure 4 shows the dynamic response of the torque measurement to a
change in N. The torque measurement can take up to 30 minutes to stabilize
due to heating or cooling of the lubricant in the pillow bearing, and the
resulting change in the bearing friction. In order to reduce both the bearing
friction and the dynamics, temperature control was installed around the
bearing. An aluminium block (1.02m × 0.076m × 0.050m) was added to
enclose the bearing.
Figure 4. The effect of temperature control on the bearing baseline measurements
after a change in rotational speed from 1400 to 800 rpm.
International Journal of Pure and Applied Mathematics Special Issue
3044

A thermocouple and two 125 watt electric rod heaters were used to hold the
temperature of the block at 50¯C. This is two degrees above the maximum
temperature attained by the bearing at 1600 rpm without temperature
control. A higher set point temperature would further reduce the bearing
friction, but could also lead to degrada- tion of the bearing lubricant and
heating of the liquid in the tank. With temperature control, the dynamic
period of the torque measurement was reduced by a factor of five and the
friction in the bearing was substantially lower, as shown in Figure 4. During
the experimental runs reported here, the dynamic period lasted
approximately 120 seconds.
Computerized data acquisition (an Opto 22 Process I=O system and Lab
tech Notebook) was used to record the torque. The measured readings were
filtered to remove high frequencies due to rotating imbalances and
imperfections in the bearing and motor. Low pass filtering set at a threshold
of 1 Hz produced an average torque which differed from the unfiltered
average by less than 1%. The filtered signal was sampled at a rate of 2 Hz.
This low data rate precludes examination of blade passages, macro-
instabilities and turbulence.
In order to remove torques due to the pillow bearing and the shaft from the
measured torque, baseline torque measurements were taken. The baseline
torque was measured with the shaft in place for speeds up to 500 rpm.
Above 500 rpm it was found that the viscous drag on the shaft was
negligible and the shaft wobble was excessive, so the baseline
measurements were done with the bearing alone. Measurements where the
impeller torque was less than the baseline torque were discarded.
The torque measurements were taken over the widest possible range of
rotational speeds for each geometry of interest. The dynamics were closely
monitored to ensure that steady state torque measurements were obtained. At
the beginning of each set of experiments, the motor was run at 800 rpm for
at least half an hour. The motor was then set at the lowest speed for the run
and the torque was allowed to level off. After the torque reached a constant
value, the initial baseline torque was recorded, the motor stopped, the
impeller added, and the motor restarted. The dynamic response for each
point varied from a few minutes at the lowest speeds to an almost
instantaneous response at the highest speeds. After the dynamic response
died out, steady state data was collected for 60 seconds. Impeller torque
measurements were taken at rotational speeds from 100 to 1700 rpm at 100
rpm intervals. Baseline measurements were taken at varying intervals as
each run progressed. The intervals ranged from two baseline measurements
at each of the lowest speeds to one baseline measurement for every
five speeds above 1000 rpm, where the baseline was rela- tively constant.
International Journal of Pure and Applied Mathematics Special Issue
3045

Using the apparatus and experimental procedure described above, torque
measurements were repeatable to within ±1% at high speeds, and ±5% at
low speeds.
3. Results
The results are presented in two groups: the first group examines the effect
of blade thickness on power number; the second the effect of D/T. In both
cases, the fully turbulent power number (Npft) is used to provide an overall
perspec- tive, followed by more detailed results showing the variation of
power number with Reynolds number.
Bujalski et al.5 and Rutherford et al.
6 refer to Npft as the mean peak power
number. Bujalski et al.5 first defined Npft as the average of the power
numbers measured from Re=20,000 to twice the Reynolds number where
surface aeration is first observed. Bujalski et al.5 also corrected Npft for
variations in blade width. In this study, a lid on the tank was used to prevent
surface aeration, although mechanical vibrations and the range of the torque
transducer limited the attainable Re to a similar level. Blade width
correction was not necessary since all impeller blades were within ± 0.5%
of W= D/5. In this work, Npft is defined as the average of all Np
measurements for Re > 20,000.
Figure 5 shows the effect of t/D on the fully turbulent power number for the
RT and the 4-bladed PBT. The agreement between the RT results from three
different laboratories is extremely good: all three show a variation of 30%
in the power number over the range of t/D’s considered. The second
significant result from Figure 5 is that the power number is independent of
t/D for the PBT. While the blade thickness is varied by a factor of three, the
power number is essentially constant. This suggests that the thickness of the
blade affects the details of flow separation and trailing vortex formation for
the RT, while for the more streamlined PBT, flow separation is less
dominant and skin drag plays a more important role. It is widely accepted
that the trailing vortices for the PBT are much weaker and more meandering
than those for the RT, providing further support for the relative importance
of flow separation for the two impellers.
The experimental results for the RT are expanded in Figure 6, where the
power number is given as a function of Re. Considering first the
agreement between the two studies shown, the t/D = 0.034 and t/D =
0.0337 data are in very close agreement, and the t/D= 0.011 data set
follows the previously established trend from Rutherford et al.6. While
the average power number, Npft is reported in Figure 5, Figure 6 shows
that the power number for the RT is not constant from 2 ×10⁴ < Re <
7×10⁴. In fact, the variation with Reynolds number for a single impeller
and blade thickness is of the same order of magnitude as the variations in
Npft due to blade thickness. This result agrees closely with data reported by
International Journal of Pure and Applied Mathematics Special Issue
3046

Rutherford et al.6, Distelhoff et al.
18 and Ibrahim and Nienow
12. New data
from this study shows that the effect of t/D extends well into the
transitional regime over another two orders of magnitude of Re. A similar
effect was observed by Magelli19
, who observed that the effect of disk
thickness is significant for 500 < Re < 20,000 and disappears around
Re=50, with the laminar regime beginning at Re= 10. Returning to the
analogy with pipe flow and friction factors, the effect of geometry on
power number (and friction factor) persists at lower Reynolds numbers, but
is less significant as the Reynolds number drops.
Figure 7 reinforces the contrast between the behavior of the power number
for the RT and the PBT. The scale on Figure 7 is adjusted so that the range of
the y-axis is one and a half Npft, providing a consistent basis for comparison
with Figure 6 for the RT. The only variation in the data is for the t/D =
0.019 impeller. A closer examination of these blades revealed rounded
edges, which would reduce the profile drag and the power number,
explaining the small variation in the results. Aside from this deviation, there
is no discernable difference between the four PBT impellers with different
t/D ratios, and there is no significant variation of Np with Reynolds number
for Re > 2 ×10⁴. In this case, the average Npft reflects the data very well. It
can be concluded that Npft is not sensitive to blade thickness for the PBT
impeller. Moving to the effect of D/T, Figure 8 shows a 15% change in Npft
due to variations in D/T for the PBT. All of this data is taken at C=T/3, as
measured from the lower edge of the impeller blades.
Figure 5. Effect of blade thickness ratio on fully turbulent power number for a six
bladed Rushton Turbine and a down-pumping four bladed 45¯ pitched blade turbine.
International Journal of Pure and Applied Mathematics Special Issue
3047

Figure 6. Variation of power number with Reynolds number for a range of
impeller thickness ratios for a six bladed Rushton Turbine.
Figure 7. Variation of power number with Reynolds number for a range of
impeller thickness ratios for a down-pumping four bladed 45¯ pitched blade
impeller (D = T/3, T= 240 mm).
Figure 8. Variation of power number with Reynolds number for three
diameters of down-pumping four bladed 45¯ pitched blade impellers (T=
240 mm, C=T).
International Journal of Pure and Applied Mathematics Special Issue
3048
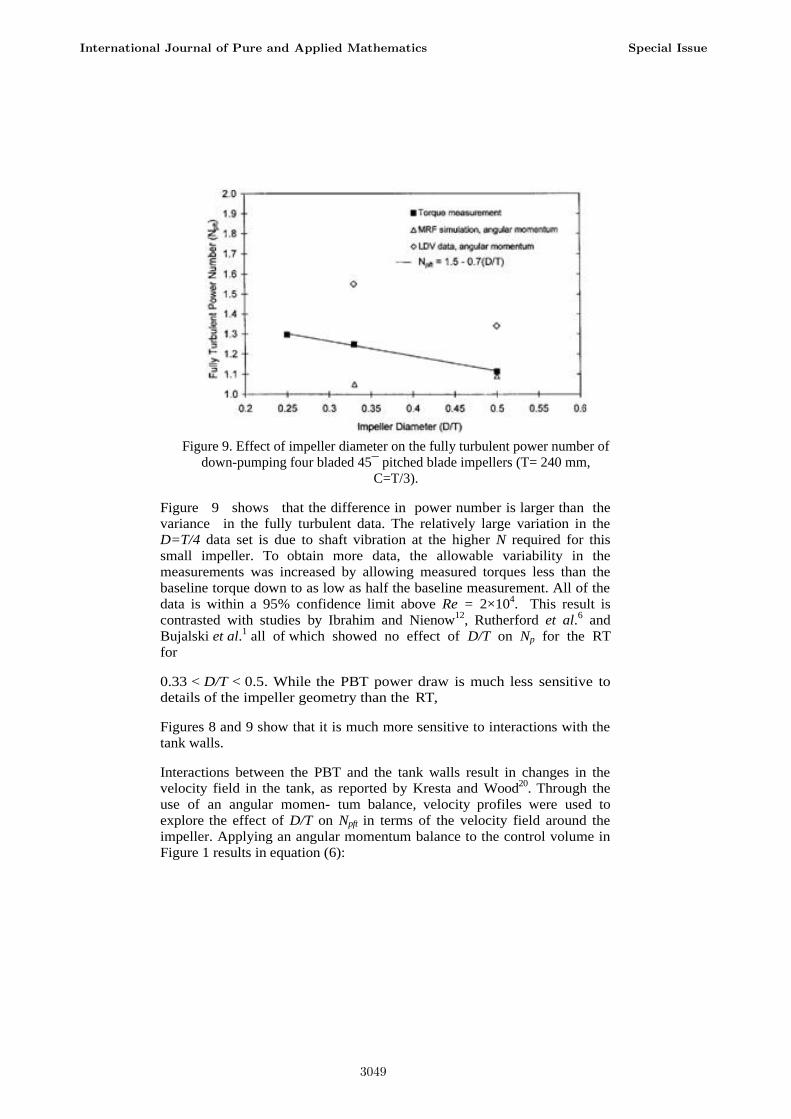
Figure 9. Effect of impeller diameter on the fully turbulent power number of
down-pumping four bladed 45¯ pitched blade impellers (T= 240 mm,
C=T/3).
Figure 9 shows that the difference in power number is larger than the
variance in the fully turbulent data. The relatively large variation in the
D=T/4 data set is due to shaft vibration at the higher N required for this
small impeller. To obtain more data, the allowable variability in the
measurements was increased by allowing measured torques less than the
baseline torque down to as low as half the baseline measurement. All of the
data is within a 95% confidence limit above Re = 2×10⁴. This result is
contrasted with studies by Ibrahim and Nienow12
, Rutherford et al.6 and
Bujalski et al.1 all of which showed no effect of D/T on Np for the RT
for
0.33 < D/T < 0.5. While the PBT power draw is much less sensitive to
details of the impeller geometry than the RT,
Figures 8 and 9 show that it is much more sensitive to interactions with the
tank walls.
Interactions between the PBT and the tank walls result in changes in the
velocity field in the tank, as reported by Kresta and Wood20
. Through the
use of an angular momen- tum balance, velocity profiles were used to
explore the effect of D/T on Npft in terms of the velocity field around the
impeller. Applying an angular momentum balance to the control volume in
Figure 1 results in equation (6):
International Journal of Pure and Applied Mathematics Special Issue
3049
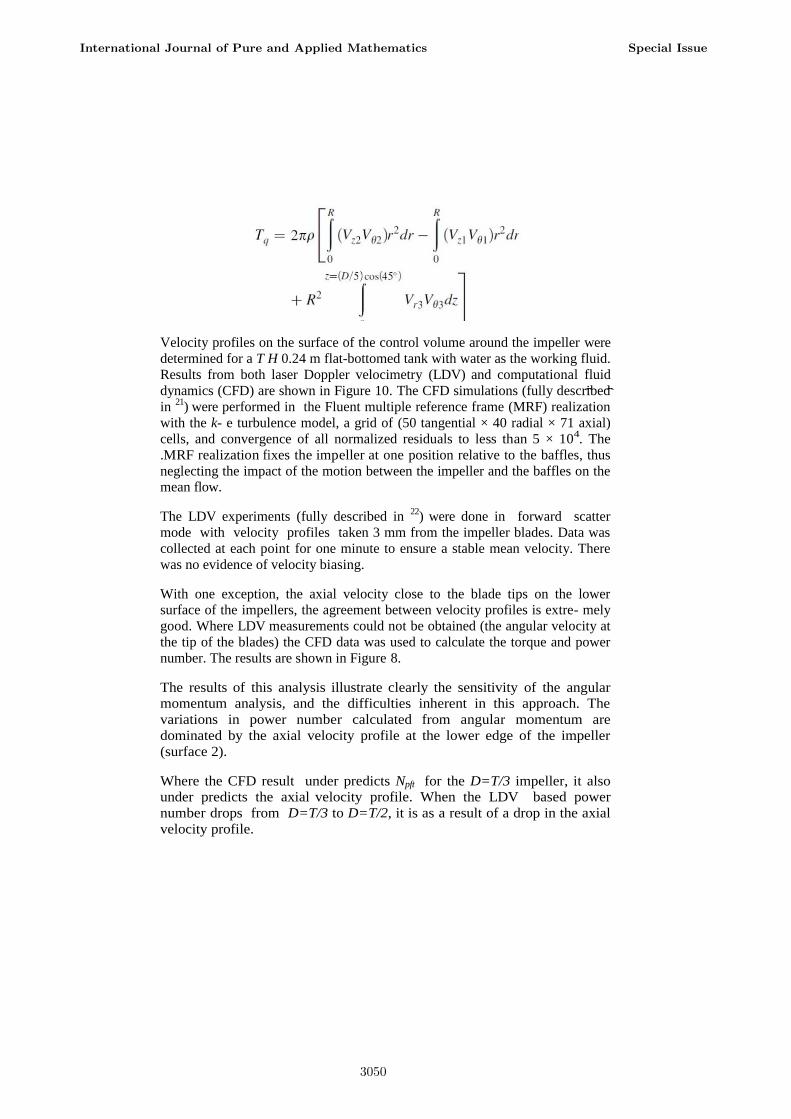
ˆ ˆ
Velocity profiles on the surface of the control volume around the impeller were
determined for a T H 0.24 m flat-bottomed tank with water as the working fluid.
Results from both laser Doppler velocimetry (LDV) and computational fluid
dynamics (CFD) are shown in Figure 10. The CFD simulations (fully described
in 21
) were performed in the Fluent multiple reference frame (MRF) realization
with the k- e turbulence model, a grid of (50 tangential × 40 radial × 71 axial)
cells, and convergence of all normalized residuals to less than 5 × 10⁴. The
.MRF realization fixes the impeller at one position relative to the baffles, thus
neglecting the impact of the motion between the impeller and the baffles on the
mean flow.
The LDV experiments (fully described in 22
) were done in forward scatter
mode with velocity profiles taken 3 mm from the impeller blades. Data was
collected at each point for one minute to ensure a stable mean velocity. There
was no evidence of velocity biasing.
With one exception, the axial velocity close to the blade tips on the lower
surface of the impellers, the agreement between velocity profiles is extre- mely
good. Where LDV measurements could not be obtained (the angular velocity at
the tip of the blades) the CFD data was used to calculate the torque and power
number. The results are shown in Figure 8.
The results of this analysis illustrate clearly the sensitivity of the angular
momentum analysis, and the difficulties inherent in this approach. The
variations in power number calculated from angular momentum are
dominated by the axial velocity profile at the lower edge of the impeller
(surface 2).
Where the CFD result under predicts Npft for the D=T/3 impeller, it also
under predicts the axial velocity profile. When the LDV based power
number drops from D=T/3 to D=T/2, it is as a result of a drop in the axial
velocity profile.
International Journal of Pure and Applied Mathematics Special Issue
3050

Figure 10. Velocity profiles over the control surface illustrated in Figure 1
for the D ˆ T=3 impeller (a) surface 1, the top; (b) surface 2, the bottom; (c)
surface 3 the tip of the blades; and for the D ˆ T=2 impeller (d) surface 1,
the top; (e) surface 2, the bottom; (f) surface 3, the tip of the blades.
Reducing the mass flow rate in the angular momentum balance. Thus, while
the results are not completely satisfy- ing from a quantitative point of view,
they do provide a better physical explanation for the change in power
number. Armenante et al.11
and Medek10
also found a decrease in Np with
increasing D/T for the PBT. Medek shows results for 3 and 6 bladed
impellers which agree with the torque measurements in Figure 8, and cover
a wider range of D/T ratios. Returning to the analogy with friction factors in
pipe flow, Figure 9 shows that the effect of D/T on power number decreases
as the Re is reduced to the low transitional range. Once again, the effect of
geometry becomes less important as the Reynolds number drops and the
viscous forces become significant.
International Journal of Pure and Applied Mathematics Special Issue
3051
4. Conclusions
This work compares the importance of impeller and tank geometry for two
widely used impellers. For the Rushton turbine, power consumption is
dominated by form drag, so details of the blade geometry and flow
separation have a significant impact (30%) on the power number. For the
PBT, form drag is not as important, but the flow at the impeller interacts
strongly with the proximity of the tank walls, so changes in the position of
the impeller in the tank can have a significant impact on the power number
(15%) due to changes in the flow patterns. For both impellers, the impor-
tance of geometry decreases as the Reynolds number drops into the
transitional regime and viscous forces come into play. From the data
presented in this paper, it is concluded that:
(1) Accurate torque measurement techniques have been established and
documented. Results from three differ- ent labs are compared, and
are in very close agreement. This level of accuracy goes a step
beyond the classical results, which established generic power
number curves for many standard impellers.
(2) For pitched blade impellers at Re > 2 × 10⁴, the power number is
constant and Npft is an accurate representation of the data. For the
Rushton turbine, there are changes in Np even above the nominal
limit of 2 × 10⁴.
(3) There is no effect of blade thickness on power number for the 4-
bladed PBT impeller. The previously reported effect of blade
thickness for the RT was replicated, and the curves extended down
into the transitional regime.
(4) The fully turbulent power number for the 4-bladed PBT impeller is a
function of D=T. The variation is linear for the data collected here,
with Npft = 1.5 -- 0.7(D/T) for (0.25 < D/T < 0.5) at C = T/3.
The angular momentum balance set out in equation (6) provides a way to
understand variations in power number as various aspects of impeller and
tank geometry are changed. This analysis, however, is extremely sensitive
and does not yield quantitatively satisfying results for either LDV or CFD
measurements.
5. Nomenclature
A area of control surface, m2
C off bottom clearance of the impeller, m
CD drag coefficient
International Journal of Pure and Applied Mathematics Special Issue
3052

D diameter of the impeller, m
FD drag force, N
h projected blade height, m
H tank height, m
L blade length, m
N rotational speed of the impeller, rps
Npft fully turbulent power number
Np power number
n· unit normal vector at control volume surface
P power, W
r radius or radial coordinate when used as a subscript, m
R radius of the impeller, m
Re Reynolds number Re=ρND2 /µ
T tank diameter, m
t blade thickness, m
Tq torque, Nm
V fluid velocity, m s¡1
W blade width, m
z axial coordinate, m
Greek symbols
m viscosity, Pa s
y tangential direction
r liquid density, kg.m-3
Acronyms
PBT pitched blade turbine
International Journal of Pure and Applied Mathematics Special Issue
3053

£
RT Rushton turbine
References
[1] Uhl, V. W. and Gray, J. B., 1966, Mixing, Theory and Practice, vol. 1 (Academic Press, New York, USA), pp 120.
[2] Rushton, J. H., Costich, E. W. and Everett, H. J., 1950, Power characteristics of mixing impellers, Chem Eng Prog, 46(8): 395–476.
[3] Nagata Shinjie, 1975, Mixing Principles and Applications (John Wiley and Sons, New York, USA), pp 13.
[4] Wu, J. and Pullum, L., 2000, Performance analysis of axial-flow impellers, AIChE J, 46(3): 489–498.
[5] Bujalski, W., Nienow, A. W., Chatwin, S. and Cooke, M., 1987, The dependency on scale of power numbers of Rushton disc turbines, Chem Eng Sci, 42(2): 317–326.
[6] Rutherford, K., Mahmoudi, S. M. S., Lee, K. C. and Yianneskis, M., 1996, The influence of Rushton impeller blade and disk thickness on the mixing characteristics of stirred vessels, Trans IChemE, Part A, Chem Eng Res Des, 74(A3): 369–378.
[7] Bates, R. L., Fondy, P. L. and Corpstein, R. R., 1963, An examination of some geometric parameters of impeller power, I and EC Proc Des Dev, 2(4): 310–314.
[8] Nienow, A. W. and Miles, D., 1971, Impeller power numbers in closed vessels, I and EC Proc Des Dev, 10(1): 41–43.
[9] Gray, D. J., Treybal, R. E. and Barnett, S. M., 1982, Mixing of single and two phase systems: Power consumption of impellers, AIChE J, 28(2): 195–199.
[10] Medek, J., 1980, Power characteristics of agitators with flat inclined blades, Inter Chem Eng, 20: 664–672.
[11] Armenante, P. M., Mazzarotta, B. and Chang, G., 1999, Power consumption in stirred tanks provided with multiple pitched-blade turbines, Ind Eng Chem Res, 38(7): 2809–2816.
[12] Ibrahim, S. and Nienow, A. W., 1995, Power curves and flow patterns for a range of impellers in Newtonian fluids: 40 < Re < 5 105, Trans IChemE, Part A, Chem Eng Res Des, 73(A4): 485–491.
[13] King, R. L., Hiller, R. A. and Tatterson, G. B., 1988, Power consump- tion in a mixer, AIChE J, 34(3): 506–509.
[14] Nienow, A. W. and Miles, D., 1969, A dynamometer for the accurate measurement of mixing torque, J Sci Instrum, 2(2):
International Journal of Pure and Applied Mathematics Special Issue
3054
994–995.
[15] Holland, F. A. and Chapman, F. S., 1966, Liquid Mixing and Processing in Stirred Tanks (Reinhold Pub Corp, New York, USA), pp 46.
[16] Raidoo, A., Raghava Rao, K. S. M. S., Sawant, S. B. and Joshi, J. B., 1987, Improvements in gas inducing impeller design, Chem Eng Comm, 54: 241–246.
[17] Kuboi, R., Nienow, A. W. and Allsford, K., 1983, A multipurpose stirred tank facility for flow visualization and dual impeller power measure- ment, Chem Eng Comm, 22: 29–40.
[18] Distelhoff, M. F. W., Laker, J., Marquis, A. J. and Nouri, J. M., 1995, The application of a strain gauge technique to the measurement of the power characteristics of five impellers, Experiments in Fluids, 20: 56–58.
[19] Magelli, F., 2001, Personal Communication.
[20] Kresta, S. M. and Wood, P. E., 1993, The mean flow field
produced by a 45¯ pitched blade turbine: Changes in the circulation pattern due to off bottom clearance, Can J Chem Eng, 71: 42–52.
[21] Bhattacharya, Sujit and Kresta, S. M., 2001, CFD simulations of three- dimensional wall jets in a stirred tank, Can J Chem Eng., in press.
[22] Zhou, Genwen, and Kresta, S. M., 1996, Distribution of energy between convective and turbulent flow for three frequently used impellers, Trans IChemE, Part A, Chem Eng Res Des, 74(A3): 379–389.
[23] Tatterson, G. B., 1991, Fluid Mixing and Gas Dispersion in Agitated Tanks (McGraw-Hill, Inc, USA).
International Journal of Pure and Applied Mathematics Special Issue
3055

3056
Related Documents