Comparing the Ecological Footprints of the U.S. and the E.U. Comparing the Ecological Footprints of the U.S. and the E.U. Jim Bowyer Dovetail Partners, Inc. Minneapolis, MN

Welcome message from author
This document is posted to help you gain knowledge. Please leave a comment to let me know what you think about it! Share it to your friends and learn new things together.
Transcript

Comparing the Ecological Footprints of the U.S. and the E.U.
Comparing the Ecological Footprints of the U.S. and the E.U.
Jim BowyerDovetail Partners, Inc.
Minneapolis, MN

Comparing Ecological FootprintsComparing Ecological Footprints• The ecological footprint – what is it?• The carbon footprint• Global hectares• Biocapacity• Ecological footprints of various nations.• Footprints of the U.S. and of E.U. nations.• Understanding the U.S. footprint.• The non-renewables footprint.• Implications for wood science.
The Ecological Footprint
A measure of consumption of bioresources in terms of the area of the earth’s surface required to
support that consumption.
Initially described by the term “Appropriated Carrying Capacity,”
the name was later changed to “Ecological Footprint.”

Under the Ecological Footprintconcept consumption of the full
range of bioresources - from grain, beef cattle, and fish, to peat and timber - is described in terms of the land and water surface area
required to support that consumption, as well as disposal of wastes.

The Ecological Footprint of a city, province, or nation is determined by
simply multiplying the per capita footprint for residents of that
geographic area by population.

There is a carbon component to the Ecological Footprint.
This is a measure of the biological capacity, expressed in terms of global hectares, required to process human emissions of fossil carbon dioxide.

Source: Global Footprint Network 2009 (http://www.footprintnetwork.org/en/index.php/GFN/page/carbon_footprint/)
Humanity’s Ecological FootprintN
umbe
r of E
arth
s

A global hectare is “a common unit that encompasses the average
productivity of all the biologically productive land and sea area in the
world in a given year.”
Biologically productive areas include cropland, forest and fishing grounds, but do not include deserts, glaciers,
and the open ocean.
The Ecological Footprint concept also does not allocate any of the earth’s
surface area for use by species other than humans.
Nations with the highest consumption have the highest ecological footprints.
The United States leads the world in consumption of almost everything in both per capita and absolute terms.

Biocapacity is a dynamic measure, varying each year with changes in management of agricultural land, forests, water bodies, and other
areas.
Development of new technologies for resource conversion and use,
ecosystem degradation, and weather also affect biocapacity.

1961 1965 1969 1973 1977 1981 1985 1989 1993 1997 2001 2005
10.0
9.0
8.0
7.0
6.0
5.0
4.0
3.0
2.0
1.0
0.0
Glo
bal h
ecta
res
per p
erso
n
The Ecological Footprint vs. Biocapacity of the United States
― Ecological footprint ― Biocapacity
Source: www.footprintnetwork.org/en/index.php/GFN/page/trends/U.S./
1961 1965 1969 1973 1977 1981 1985 1989 1993 1997 2001 2005
7.0
6.0
5.0
4.0
3.0
2.0
1.0
0.0
Glo
bal h
ecta
res p
er p
erso
n
Ecological footprint Biocapacity
1961 1965 1969 1973 1977 1981 1985 1989 1993 1997 2001 2005
7.0
6.0
5.0
4.0
3.0
2.0
1.0
0.0
Glo
bal h
ecta
res p
er p
erso
n
Ecological footprint Biocapacity
1961 1965 1969 1973 1977 1981 1985 1989 1993 1997 2001 2005
6.0
5.0
4.0
3.0
2.0
1.0
0.0
Glo
bal h
ecta
res p
er p
erso
n
Ecological footprint Biocapacity
1961 1965 1969 1973 1977 1981 1985 1989 1993 1997 2001 2005
6.0
5.0
4.0
3.0
2.0
1.0
0.0
Glo
bal h
ecta
res p
er p
erso
n
Ecological footprint Biocapacity
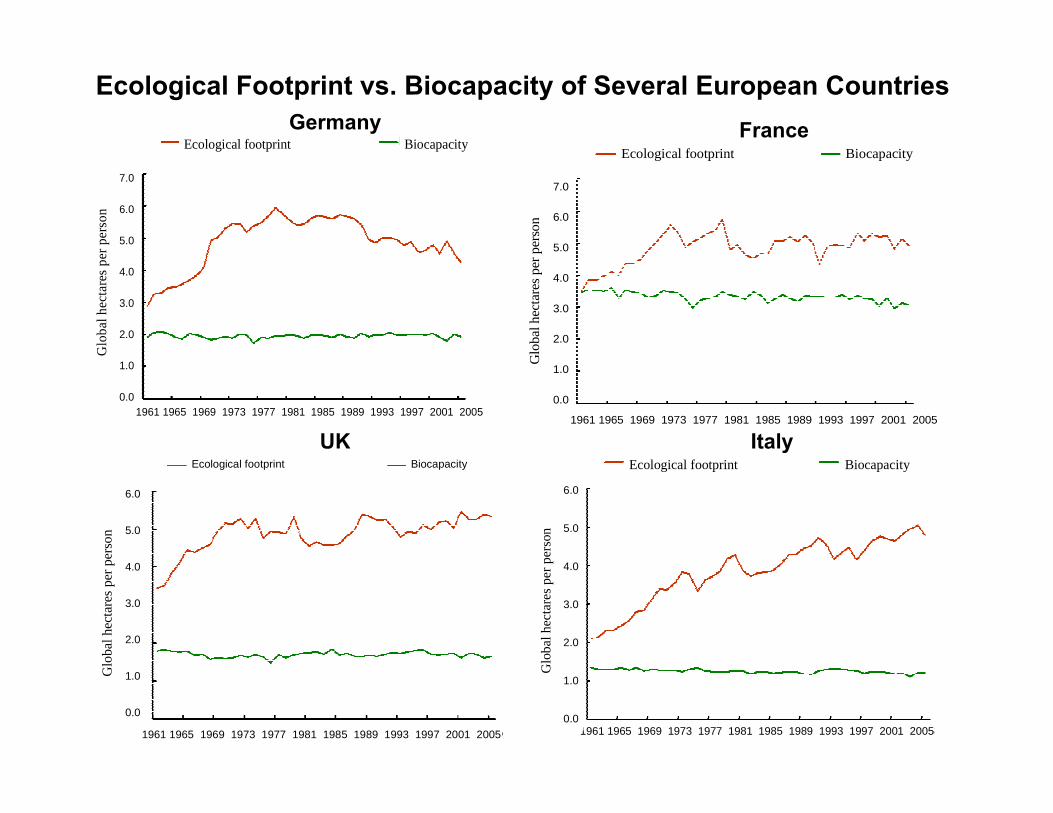
Ecological Footprint vs. Biocapacity of Several European CountriesGermany France
UK Italy
1961 1965 1969 1973 1977 1981 1985 1989 1993 1997 2001 2005
8.0
7.0
6.0
5.0
4.0
3.0
2.0
1.0
0.0
Glo
bal h
ecta
res p
er p
erso
nEcological footprint Biocapacity
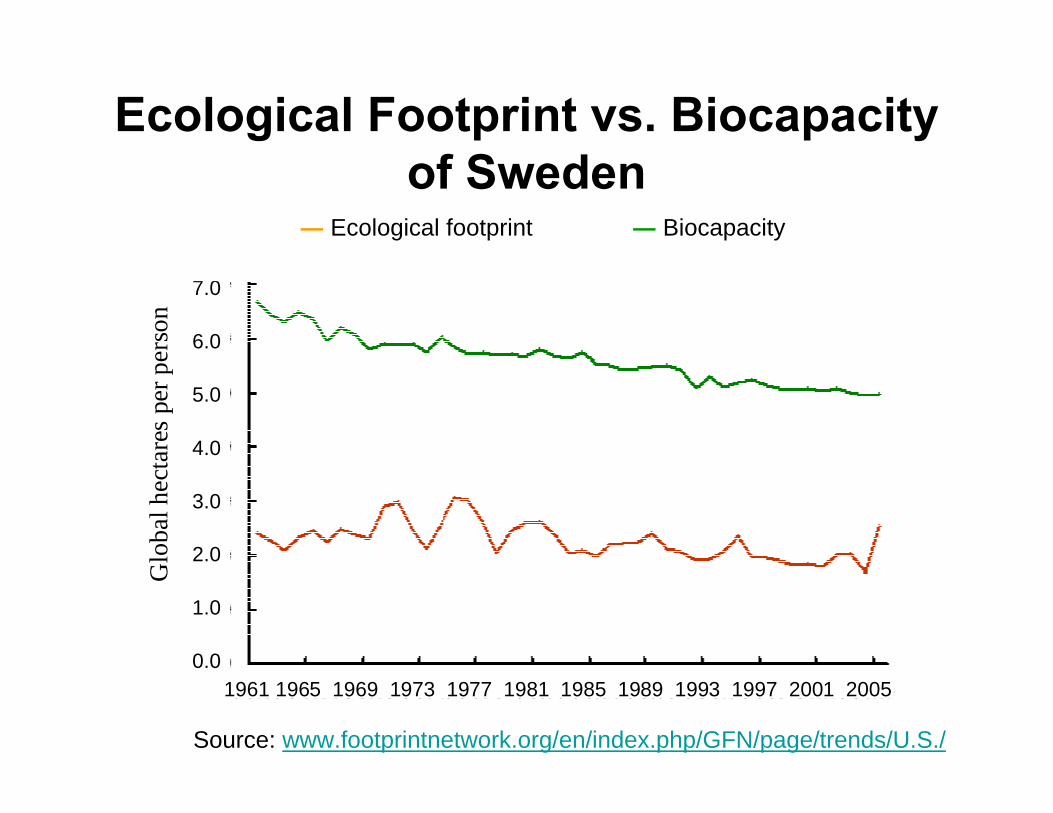
Ecological Footprint vs. Biocapacity of Sweden
― Ecological footprint ― Biocapacity
Source: www.footprintnetwork.org/en/index.php/GFN/page/trends/U.S./
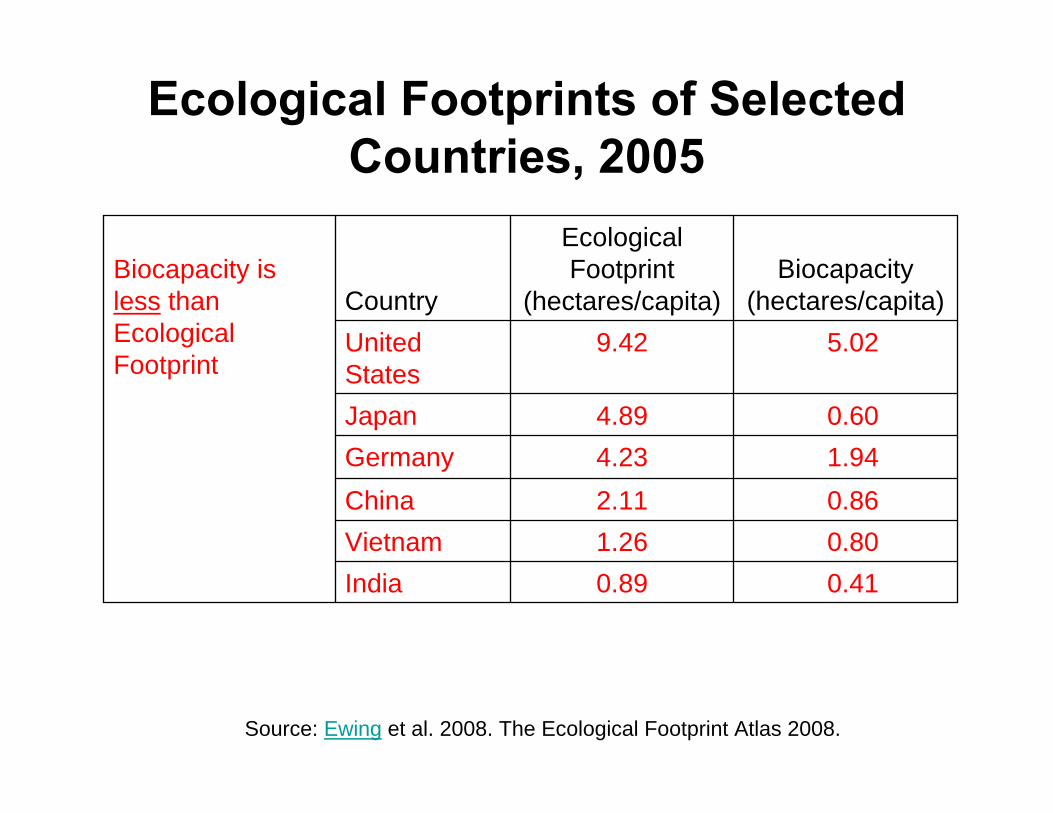
Ecological Footprints of Selected Countries, 2005
0.410.89India0.801.26Vietnam0.862.11China1.944.23Germany0.604.89Japan
5.029.42United States
Biocapacity (hectares/capita)
Ecological Footprint
(hectares/capita)CountryBiocapacity is less than Ecological Footprint
Source: Ewing et al. 2008. The Ecological Footprint Atlas 2008.

4.170.61Dem. Rep. of Congo
1.390.95Indonesia24.971.30Gabon4.021.57Peru2.212.08South Africa7.262.36Brazil3.152.81Venezuela4.143.00Chile
8.113.75Russian Federation
9.975.10Sweden20.057.07Canada56.647.70N. Zealand15.427.81AustraliaBiocapacity is greater
than Ecological Footprint (resource supply nations)
Source: Ewing et al. 2008. The Ecological Footprint Atlas 2008.
Ecological Footprints of Selected Countries, 2005

1961 1965 1969 1973 1977 1981 1985 1989 1993 1997 2001 2005
4.5
4.0
3.5
3.0
2.5
2.0
1.5
1.0
0.5
0.0
Glo
bal h
ecta
res p
er p
erso
nEcological footprint Biocapacity
Global Ecological Footprint vs. Biocapacity
― Ecological footprint ― Biocapacity
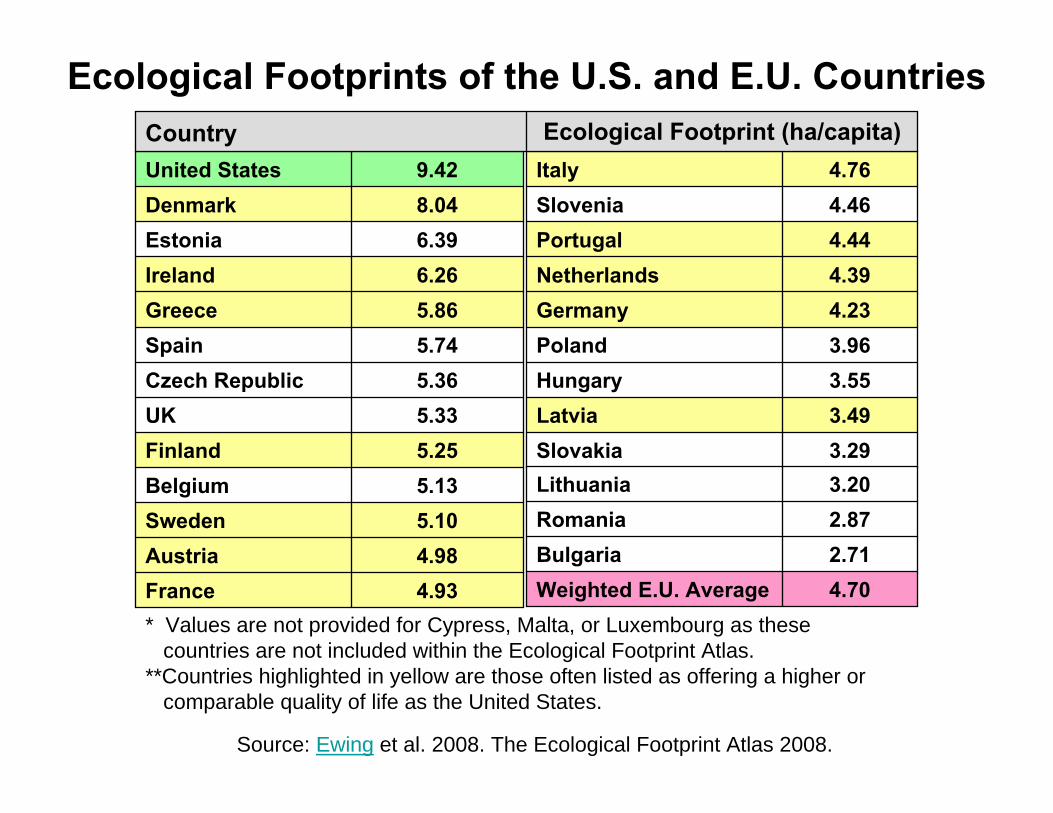
4.93France4.98Austria5.10Sweden5.13Belgium5.25Finland5.33UK5.36Czech Republic5.74Spain5.86Greece6.26Ireland6.39Estonia8.04Denmark9.42United States
Source: Ewing et al. 2008. The Ecological Footprint Atlas 2008.
3.29Slovakia3.49Latvia3.55Hungary3.96Poland4.23Germany4.39Netherlands4.44Portugal4.46Slovenia4.76Italy
4.70Weighted E.U. Average2.71Bulgaria2.87Romania3.20Lithuania
* Values are not provided for Cypress, Malta, or Luxembourg as thesecountries are not included within the Ecological Footprint Atlas.
**Countries highlighted in yellow are those often listed as offering a higher or comparable quality of life as the United States.
Ecological Footprints of the U.S. and E.U. CountriesEcological Footprint (ha/capita)Country

Reader’s Digest recently (2008) published a green and livable index
using the United Nations 2006 Human Development Indicators (HDI) data
and the 2005 Environmental Sustainability Index (ESI). In this
ranking the United States was 23rd, with 13 of the E.U. nations ranked
higher.

In the most recent list of UNDP Human Development Indicators the
U.S. is ranked 15th, with 10 European nations higher on the list.

It is interesting that the Ecological Footprint of the U.S. is substantially higher than all 27 countries of the
E.U., and all E.U. countries often listed as offering a higher or comparable
quality of life than the U.S.

The primary explanation for the very large Ecological Footprint of the
United States relative to Europe is higher energy and fossil fuel
consumption, and the related function of biological resources in
carbon cycling.
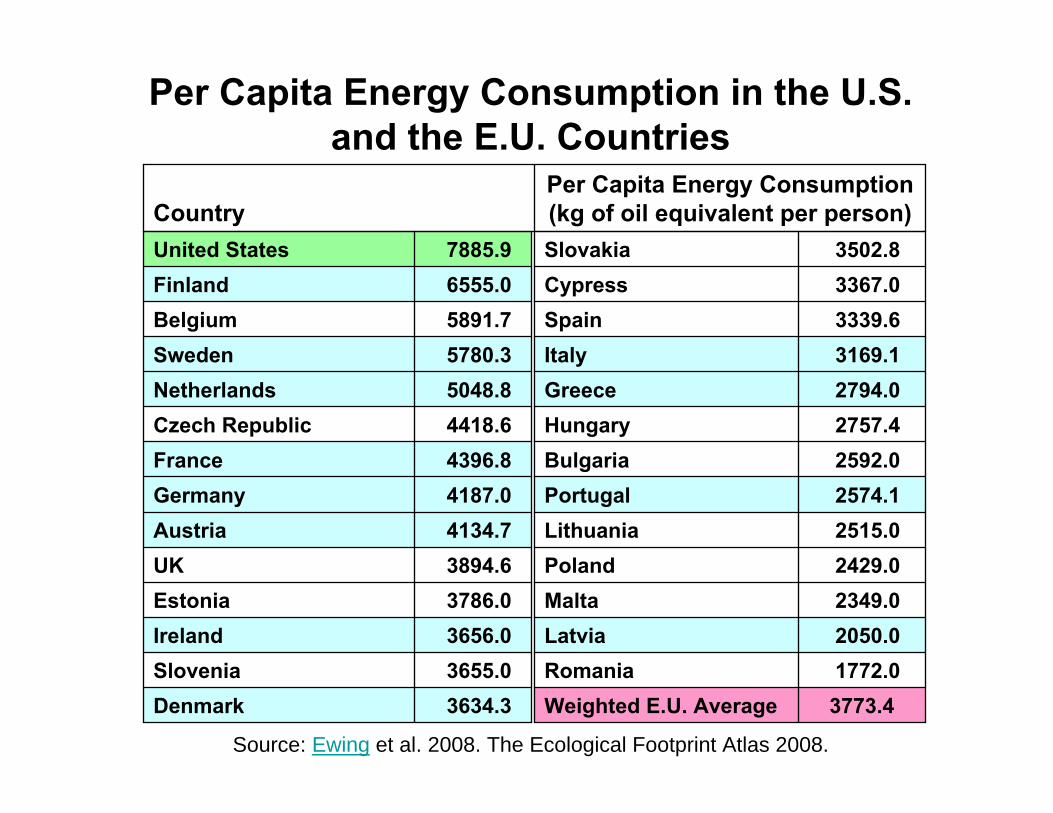
3634.3Denmark3655.0Slovenia3656.0Ireland3786.0Estonia3894.6UK4134.7Austria4187.0Germany4396.8France4418.6Czech Republic5048.8Netherlands5780.3Sweden5891.7Belgium6555.0Finland7885.9United States
3773.4Weighted E.U. Average1772.0Romania2050.0Latvia2349.0Malta2429.0Poland2515.0Lithuania2574.1Portugal2592.0Bulgaria2757.4Hungary2794.0Greece3169.1Italy3339.6Spain3367.0Cypress3502.8Slovakia
Per Capita Energy Consumption (kg of oil equivalent per person)Country
Per Capita Energy Consumption in the U.S. and the E.U. Countries
Source: Ewing et al. 2008. The Ecological Footprint Atlas 2008.

In addition, wood is more commonly used in home construction in the U.S,
and per capita living space is far higher than in even other affluent
countries, resulting in not only greater quantities of raw materials used in construction, but also for
furnishings, cleaning, maintenance, and heating/cooling.
Moreover, U.S. per capita consumption of paper and
paperboard is more than double that of the E.U. overall, and
higher than any individual E.U. country except Finland.

An added contributor to the large U.S. Ecological Footprint is high
meat and grain consumptionrelative to Europe.

In 2007, per capita consumption of meat (beef, pork, poultry, and
mutton/goat meat) was more than 17 percent higher in the U.S. than in the
E.U., and 11 percent higher than in the 15 nations of western Europe; per capita consumption of beef was 70
percent higher in the U.S.

Largely attributable to high beef consumption, U.S. per capita
consumption of grains was about double that of the E.U. in 2007.

European diets, in contrast to the U.S., are more heavily oriented
toward pork rather than beef, and toward fish. E.U. per capita
consumption of fish was nearly four times that of the U.S. in 2007.

An interesting question is why U.S. energy consumption is so high relative to other countries. To
understand high energy consumption is to understand why the U.S.
Ecological Footprint is so large, and perhaps how it might be reduced.

Why are U.S. homes in comparison to those of the E.U.:- so much larger? - so seldom designed so that zone heating could be effectively employed?
- so much more dispersed?- so much less likely to be served by rapidtransit?

Why are U.S. automobiles:
- so large and so fuel inefficient in comparison on average to those in the EU.?

Why do U.S. residents travel, on average, 2.5 times the number of auto miles annually per capita and 3 times the number of air miles, but only one-half the distance per capita by rail and
bus transit systems?
In a word, the answer to all of these questions is energy, and more
specifically cheap energy.

A clear result of the long history of seldom considering energy
implications of purchasing decisions is our large Ecological Footprint.
Another is our extremely high energy consumption even in comparison to other affluent
nations.

“And I will tell you now, if you want to keep your guns, your property, your children and your God . . . if you love
liberty . . . Then Sustainable Development is your enemy!"
Tom DeWeese, PresidentAmerican Policy Center
August 6, 2004
The Non-Renewables Footprint

2.72x4.49x39106175Plastics1.49x0.93x418624387Cement2.60x3.29x5.815.119.1Aluminum1.96x1.87x202395378Steel1.98x3.72x0.541.07 2.01Wood*
E.U.-27U.S.WorldE.U.-27U.S.Raw Material
Consumption Compared to World
AverageAverage Per Capita Consumption (kg)
Per Capita Consumption of Key Raw Materials - U.S. and the E.U. vs. World, 2007
Source: Data for wood (US) from Howard, USFS (2007) and wood (EU) from Ekström(2008); for cement, steel, and aluminum from the U.S. Geological Survey (2009) and the World Bureau of Metal Statistics (2008); and for plastics from the American Chemistry Council Plastics Industry Producers Group (2009), and from the Association of Plastics Manufacturers in Europe (2009).
* Wood quantities in m3. Wood consumption data for U.S. 2005, for EU 2007.

Implications for Wood Science
Implications for Wood Science
• There is a continuing need to find ways to produce more from less, to increase product durability, to increase recycling/ reuse options at the end of product life.
Implications for Wood Science
• Active attention to the Ecological Footprint as well as ongoing research are needed to ensure appropriate policy relative to wood use to prepare for the possibility that the Ecological Footprint concept emerge as a significant environmental policy tool.

Questions?Questions?
For additional information on this and related topics visit www.dovetailinc.org
Related Documents