Comparing reactive and memory-one strategies of direct reciprocity Citation Baek, Seung Ki, Hyeong-Chai Jeong, Christian Hilbe, and Martin A. Nowak. 2016. “Comparing reactive and memory-one strategies of direct reciprocity.” Scientific Reports 6 (1): 25676. doi:10.1038/srep25676. http://dx.doi.org/10.1038/srep25676. Published Version doi:10.1038/srep25676 Permanent link http://nrs.harvard.edu/urn-3:HUL.InstRepos:27320425 Terms of Use This article was downloaded from Harvard University’s DASH repository, and is made available under the terms and conditions applicable to Other Posted Material, as set forth at http:// nrs.harvard.edu/urn-3:HUL.InstRepos:dash.current.terms-of-use#LAA Share Your Story The Harvard community has made this article openly available. Please share how this access benefits you. Submit a story . Accessibility

Welcome message from author
This document is posted to help you gain knowledge. Please leave a comment to let me know what you think about it! Share it to your friends and learn new things together.
Transcript
Comparing reactive and memory-one strategies of direct reciprocity
CitationBaek, Seung Ki, Hyeong-Chai Jeong, Christian Hilbe, and Martin A. Nowak. 2016. “Comparing reactive and memory-one strategies of direct reciprocity.” Scientific Reports 6 (1): 25676. doi:10.1038/srep25676. http://dx.doi.org/10.1038/srep25676.
Published Versiondoi:10.1038/srep25676
Permanent linkhttp://nrs.harvard.edu/urn-3:HUL.InstRepos:27320425
Terms of UseThis article was downloaded from Harvard University’s DASH repository, and is made available under the terms and conditions applicable to Other Posted Material, as set forth at http://nrs.harvard.edu/urn-3:HUL.InstRepos:dash.current.terms-of-use#LAA
Share Your StoryThe Harvard community has made this article openly available.Please share how this access benefits you. Submit a story .
Accessibility
1Scientific RepoRts | 6:25676 | DOI: 10.1038/srep25676
www.nature.com/scientificreports
Comparing reactive and memory-one strategies of direct reciprocitySeung Ki Baek1, Hyeong-Chai Jeong2, Christian Hilbe3,4 & Martin A. Nowak4
Direct reciprocity is a mechanism for the evolution of cooperation based on repeated interactions. When individuals meet repeatedly, they can use conditional strategies to enforce cooperative outcomes that would not be feasible in one-shot social dilemmas. Direct reciprocity requires that individuals keep track of their past interactions and find the right response. However, there are natural bounds on strategic complexity: Humans find it difficult to remember past interactions accurately, especially over long timespans. Given these limitations, it is natural to ask how complex strategies need to be for cooperation to evolve. Here, we study stochastic evolutionary game dynamics in finite populations to systematically compare the evolutionary performance of reactive strategies, which only respond to the co-player’s previous move, and memory-one strategies, which take into account the own and the co-player’s previous move. In both cases, we compare deterministic strategy and stochastic strategy spaces. For reactive strategies and small costs, we find that stochasticity benefits cooperation, because it allows for generous-tit-for-tat. For memory one strategies and small costs, we find that stochasticity does not increase the propensity for cooperation, because the deterministic rule of win-stay, lose-shift works best. For memory one strategies and large costs, however, stochasticity can augment cooperation.
Direct reciprocity, the propensity to return cooperative acts of others, is one of the major mechanisms to establish cooperation1–3. The theory of reciprocity has allowed us to understand under which conditions “a shadow of the future” can help individuals to forego individual short-run benefits in favour of mutually beneficial long-run rela-tionships4–13. Although reciprocal relationships also seem to be at work in several animal species14–16, they play a particular role for human interactions17. Because almost all our social interactions occur repeatedly, reciprocity considerations may have played an important role for the evolution of social heuristics18,19, which in turn helps to understand why we also cooperate with strangers20, sometimes even without considering the resulting costs to ourselves21.
To model the emergence of direct reciprocity, researchers often use the example of the iterated prisoner’s dilemma. In this game, two players can decide repeatedly whether to cooperate or to defect. While mutual coop-eration is optimal from a group perspective, players may feel a temptation to defect at the expense of the co-player. Strategies for the repeated prisoner’s dilemma can become arbitrarily complex—sophisticated players may use the whole past history of play when making the decision whether to cooperate in the next round. In practice, however, several experiments suggest that the complexity of human strategies is restricted. For example, Stevens et al.22 have shown that subjects have problems to remember their co-players’ past decisions accurately, espe-cially if they need to keep track of several co-players or multiple rounds. Similarly, the research of Wedekind and Milinski23,24 suggests that there is a trade-off between having a sophisticated strategy in the prisoner’s dilemma and performing well in a second unrelated task. In addition, recent studies in behavioural economics have found that most of the strategies employed by human subjects are well described by simple strategies that only depend on the last interaction25–29, although there are also other factors such as the average fraction of past cooperative acts30,31. Given that there are such constraints on the complexity of strategies, can we still expect cooperation to evolve? And how complex do the players’ strategies need to be in order to allow for substantial cooperation?
Herein, we approach this question by comparing the evolving cooperation rates for different strategy spaces for the repeated prisoner’s dilemma. The considered strategy spaces differ along two dimensions of complexity. The first dimension is the input that they require: whereas reactive strategies (or memory-1/2 strategies) only
1Department of Physics, Pukyong National University, Busan 48513, Korea. 2Department of Physics and Astronomy, Sejong University, Seoul 05006, Korea. 3IST Austria, Am Campus 1, 3400 Klosterneuburg, Austria. 4Program for Evolutionary Dynamics, Department of Mathematics, Department of Organismic and Evolutionary Biology, Harvard University, Cambridge, MA 02138, United States of America. Correspondence and requests for materials should be addressed to H.-C.J. (email: [email protected]) or C.H. (email: [email protected]) or M.A.N. (email: [email protected])
received: 04 February 2016
Accepted: 19 April 2016
Published: 10 May 2016
OPEN

www.nature.com/scientificreports/
2Scientific RepoRts | 6:25676 | DOI: 10.1038/srep25676
require information about the co-player’s previous move32–34, memory-one strategies additionally need to take one’s own move into account35. The set of reactive strategies is a reasonable and conventional choice to define a subset of memory-one strategies, because a player’s payoff crucially depends on the co-player’s move in the pris-oner’s dilemma. The second dimension is the strategy’s stochasticity. Here, we distinguish strategies that respond to past outcomes in a deterministic fashion, and strategies that prescribe to randomize. Overall, these two inde-pendent dimensions of complexity lead to four different strategy classes.
To assess whether a given strategy class is favourable to the evolution of cooperation, we consider the Moran process in a finite population of players36. Individuals can choose freely among the available strategies, and over time they learn to switch to strategies that yield a higher payoff. By assuming that mutations are sufficiently rare, we can use the framework of Fudenberg & Imhof 37 to calculate how often players use each of the available strategies in the long run38. This in turn allows us to calculate the evolving cooperation rates for each of the four strategy classes, as explained in more detail in the next section. Our results suggest that strategies with larger memory are typically ben-eficial for the evolution of cooperation, whereas the strategies' stochasticity can sometimes have a detrimental effect.
Model and MethodsIt is common to consider two levels when modelling the evolutionary dynamics of repeated games. The first level focuses on the repeated game itself. At this level, we look at a single instance of the repeated game and we calcu-late how the players’ strategies determine the resulting cooperation rates and average payoffs. The second level describes the population dynamics. Here, we look at a whole population of players. Each player is equipped with a strategy for how to play the repeated game. The abundance of a given strategy within the population may change over time, because strategies that lead to a high payoff are expected to spread (either due to reproduction of suc-cessful individuals, or due to imitation and cultural learning). At the population level, we are interested in how often a strategy will be used in the long run, and what the resulting average cooperation rate is. In the following, we describe these two levels in more detail.
Game dynamics of the repeated prisoner’s dilemma. In the prisoner’s dilemma, two individuals decide simultaneously whether to cooperate (C) or to defect (D). A player who cooperates pays a cost c > 0 to provide a benefit b > c for the co-player. Thus, a cooperator either gets b − c (if the co-player cooperates as well) or − c (if the co-player defects). On the other hand, a defector either gets b (if the co-player cooperates) or 0 (if the co-player defects). To reduce the number of free parameters, we can set b: = 1 and we let c vary between 0 < c < 1. Moreover, to avoid negative payoffs, we add the constant c to all payoffs. Under these assumptions, the payoff matrix of the prisoner’s dilemma takes the form
Because c < 1, both players prefer mutual cooperation over mutual defection; however, since c > 0, each individual is tempted to play D irrespective of the co-player's action. If the prisoner’s dilemma is played in a well-mixed population, evolution favours defection.
The question of evolutionary strategy selection becomes more interesting when individuals have the option to reciprocate past actions in the future. To model such repeated interactions, we consider two individuals who play the game (1) for infinitely many rounds. Strategies for such repeated games need to prescribe an action for any possible history of previous play, and they can become arbitrarily complex. To facilitate an evolutionary analysis, we assume herein that individuals at most make use of simple memory-one strategies. That is, their behaviour in any given round may only depend on the outcome of the previous round. Memory-one strategies can be written as a 4-tuple, p = (pCC, pCD, pDC, pDD). The entries pij correspond to the player’s probability to cooperate in the next round, given that the focal player's previous action was i and that the co-player’s action was j. We assume that play-ers only have imperfect control over their actions, such that they mis-implement their intended action with some small probability ε > 05,39. Under this assumption, the player's effective strategy becomes p′ = (1 − ε)p + ε(1 − p).
When both players apply memory-one strategies p and q, respectively, then the dynamics of the repeated prisoner’s dilemma takes the form of a Markov chain with four possible states CC, CD, DC, DD (the possible outcomes of each round). The transition matrix of this Markov chain is given by
′ ′ ′ − ′ − ′ ′ − ′ − ′
′ ′ ′ − ′ − ′ ′ − ′ − ′
′ ′ ′ − ′ − ′ ′ − ′ − ′
′ ′ ′ − ′ − ′ ′ − ′ − ′
.
p q p q p q p qp q p q p q p qp q p q p q p qp q p q p q p q
(1 ) (1 ) (1 )(1 )(1 ) (1 ) (1 )(1 )(1 ) (1 ) (1 )(1 )(1 ) (1 ) (1 )(1 ) (2)
CC CC CC CC CC CC CC CC
CD DC CD DC CD DC CD DC
DC CD DC CD DC CD DC CD
DD DD DD DD DD DD DD DD
Due to the assumption of errors, all entries of this transition matrix are positive. Therefore, there exists a unique invariant distribution v = (vCC, vCD, vDC, vDD), representing the probability to find the two players in each of the four states over the course of the game. Given the invariant distribution v, we can calculate player 1’s payoff as π(p, q) = v · h1 and player 2’s payoff as π(q, p) = v · h2, with h1 = (1, 0, 1 + c, c) and h2 = (1, 1 + c, 0, c). Similarly, we can calculate the players’ average cooperation rate in the repeated game as γ(p, q) = vCC + vCD and γ(q, p) = vCC + vDC. If the cooperation rate γ(p, p) of a strategy against itself converges to one as the error rate ε
www.nature.com/scientificreports/
3Scientific RepoRts | 6:25676 | DOI: 10.1038/srep25676
goes to zero, we call the strategy p a self-cooperator (see also ref. 40). Similarly, strategies for which the cooperation rate γ(p, p) approaches zero are called self-defectors.
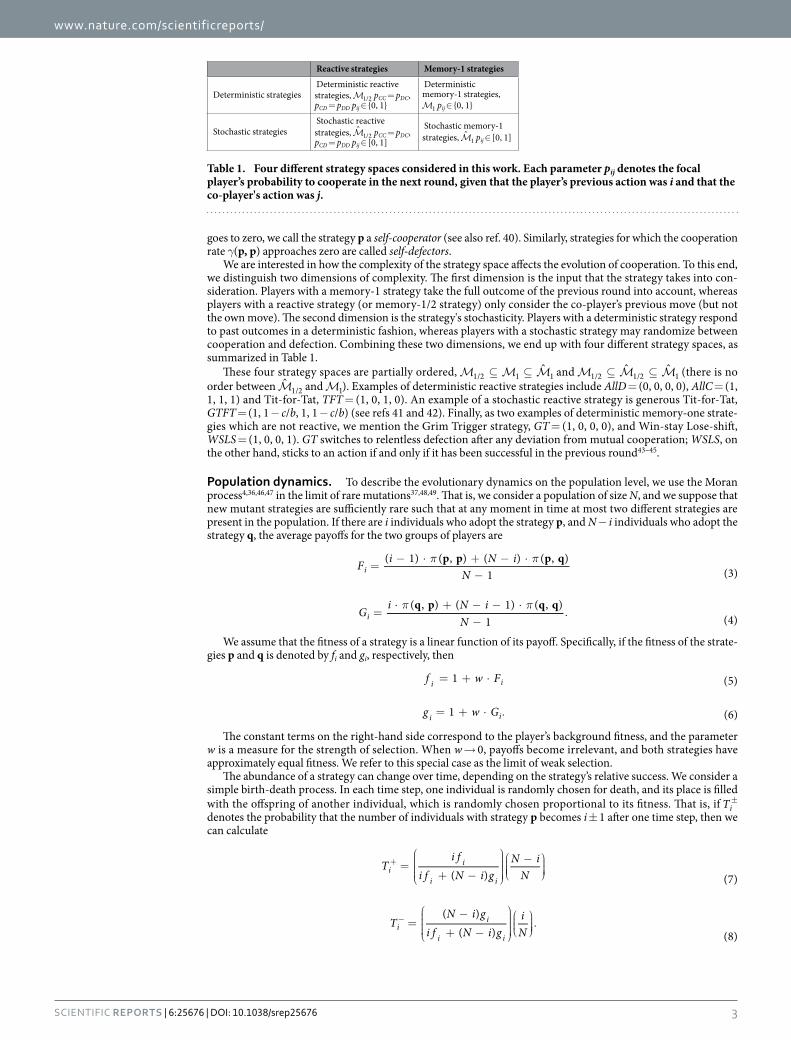
We are interested in how the complexity of the strategy space affects the evolution of cooperation. To this end, we distinguish two dimensions of complexity. The first dimension is the input that the strategy takes into con-sideration. Players with a memory-1 strategy take the full outcome of the previous round into account, whereas players with a reactive strategy (or memory-1/2 strategy) only consider the co-player’s previous move (but not the own move). The second dimension is the strategy's stochasticity. Players with a deterministic strategy respond to past outcomes in a deterministic fashion, whereas players with a stochastic strategy may randomize between cooperation and defection. Combining these two dimensions, we end up with four different strategy spaces, as summarized in Table 1.
These four strategy spaces are partially ordered, ⊆ ⊆ ˆ1/2 1 1 and ⊆ ⊆ˆ ˆ
1/2 1/2 1 (there is no order between ˆ
1/2 and 1). Examples of deterministic reactive strategies include AllD = (0, 0, 0, 0), AllC = (1, 1, 1, 1) and Tit-for-Tat, TFT = (1, 0, 1, 0). An example of a stochastic reactive strategy is generous Tit-for-Tat, GTFT = (1, 1 − c/b, 1, 1 − c/b) (see refs 41 and 42). Finally, as two examples of deterministic memory-one strate-gies which are not reactive, we mention the Grim Trigger strategy, GT = (1, 0, 0, 0), and Win-stay Lose-shift, WSLS = (1, 0, 0, 1). GT switches to relentless defection after any deviation from mutual cooperation; WSLS, on the other hand, sticks to an action if and only if it has been successful in the previous round43–45.
Population dynamics. To describe the evolutionary dynamics on the population level, we use the Moran process4,36,46,47 in the limit of rare mutations37,48,49. That is, we consider a population of size N, and we suppose that new mutant strategies are sufficiently rare such that at any moment in time at most two different strategies are present in the population. If there are i individuals who adopt the strategy p, and N − i individuals who adopt the strategy q, the average payoffs for the two groups of players are
π π=
− ⋅ + − ⋅−
F i N iN
p p p q( 1) ( , ) ( ) ( , )1 (3)i
π π=⋅ + − − ⋅
−.G i N i
Nq p q q( , ) ( 1) ( , )
1 (4)i
We assume that the fitness of a strategy is a linear function of its payoff. Specifically, if the fitness of the strate-gies p and q is denoted by fi and gi, respectively, then
= + ⋅f w F1 (5)i i
= + ⋅ .g w G1 (6)i i
The constant terms on the right-hand side correspond to the player’s background fitness, and the parameter w is a measure for the strength of selection. When w → 0, payoffs become irrelevant, and both strategies have approximately equal fitness. We refer to this special case as the limit of weak selection.
The abundance of a strategy can change over time, depending on the strategy’s relative success. We consider a simple birth-death process. In each time step, one individual is randomly chosen for death, and its place is filled with the offspring of another individual, which is randomly chosen proportional to its fitness. That is, if ±Ti denotes the probability that the number of individuals with strategy p becomes i ± 1 after one time step, then we can calculate
=
+ −
−
+Ti f
i f N i gN i
N( ) (7)i
i
i i
=
−
+ −
.
−TN i g
i f N i giN
( )( ) (8)
ii
i i
Reactive strategies Memory-1 strategies
Deterministic strategies Deterministic reactive strategies, 1/2 pCC = pDC, pCD = pDD pij ∈ {0, 1}
Deterministic memory-1 strategies, 1 pij ∈ {0, 1}
Stochastic strategies Stochastic reactive strategies, ˆ
1/2 pCC = pDC, pCD = pDD pij ∈ [0, 1]
Stochastic memory-1 strategies, ̂1 pij ∈ [0, 1]
Table 1. Four different strategy spaces considered in this work. Each parameter pij denotes the focal player’s probability to cooperate in the next round, given that the player’s previous action was i and that the co-player's action was j.
www.nature.com/scientificreports/
4Scientific RepoRts | 6:25676 | DOI: 10.1038/srep25676
The quantities +Ti and −Ti can be used to compute the probability that eventually the whole population will adopt strategy p36. In the special case that the population starts from a state in which only a single player applies p, this fixation probability ρ is given by
∑ ∏ρ = =
+
.
=
−
=
−
+
−TT
p q( , ) 1(9)j
N
i
ji
i1
1
1
1
If there is no selection (i.e., if w = 0), the fixation probability for any mutant strategy p simplifies to ρ(p, q) = 1/N. For positive selection strength w > 0, we thus say that the mutant strategy p is advantageous, neu-tral, or disadvantageous if ρ(p, q) is larger, equal, or smaller than 1/N, respectively. Conversely, we say that the resident strategy q is evolutionary robust if there is no advantageous mutant strategy40,50.
For strategy spaces with finitely many strategies, = …p p{ , , }n1 , we can use the above formula for the fix-ation probabilities to calculate the long-run abundance of each strategy. For sufficiently rare mutations, the evo-lutionary process can be described by a Markov chain with state space , corresponding to the homogeneous populations in which everyone applies the same strategy (see ref. 37). The off-diagonal entries of the transition matrix M = (mjk) are given by mjk = ρ(pk, p j)/(n − 1); starting in a population in which everyone uses strategy p j, the probability that the next mutant adopts strategy pk is 1/(n − 1), and the probability that the mutant strategy reaches f ixation is ρ(pk, p j). The diagonal entries of the transition matrix have the form
ρ= − ∑ −≠m np p1 ( , )/( 1)jj k jk j , which can be interpreted as the probability that the next mutant strategy will
go extinct. For any finite selection strength w, the stochastic transition matrix M has a unique invariant distribu-tion ξ = (ξ1, … , ξn). The entries of ξ represent the frequency with which each strategy is used in the selection-mutation equilibrium. Note that the exact value of the mutation rate is unimportant in calculating the invariant distribution as long as the transition matrix M is positive definite. Using this invariant distribution ξ, one can compute the average payoff in the population over time as
∑π ξ π= ⋅ .p p( , )(10)j
n
jj j
Similarly, one can compute the population’s average cooperation rate as
∑γ ξ γ= ⋅ .p p( , )(11)j
n
jj j
These two expressions average over all self-interactions of strategies, because in the rare-mutation limit the population is almost always homogeneous. The measure γ takes into account how much each strategy actually contributes to the cooperative behaviour of a population. A strategy’s contribution may not always be clear from its definition. For example, the strategy GT = (1, 0, 0, 0) is a self-defector (as any defection by mistake will cause it to respond with indefinite defection), whereas WSLS = (1, 0, 0, 1) is a self-cooperator, although the two strategies differ by just one bit.
When the strategy space is infinite (as for stochastic strategy spaces), we cannot apply the previous method directly. Instead, we use two different approximations. The first approach is to discretise the state spaces = M̂1/2 and = M̂1 . That is, instead of allowing for arbitrary conditional cooperation probabilities pij ∈ [0, 1], the proba-bilities are restricted to some finite grid pij = {0, 1/m, 2/m, … , 1}, where 1/m is the grid size. As our second approach, we use the method of Imhof & Nowak51. This method starts with an arbitrary resident strategy p(0). This resident is then challenged by a single mutant with strategy q, with q being taken from a uniform distribution over the space of all memory-one strategies. If the mutant goes extinct, we define p(1) = p(0); otherwise, the mutant becomes the new resident and p(1) = q. This elementary step is repeated for t iterations, leading to a sequence of successive resident populations (p(0), p(1), … , p(t)). Using this approach, we can calculate the average payoff of the population as π π= ∑ tp p( , )/j
t j j( ) ( ) , and the average cooperation rate as γ γ= ∑ tp p( , )/jt j j( ) ( ) . As we will see, the
two complementary approaches give similar results—provided that the grid size 1/m used for the first method is sufficiently small, and that the number of iterations t used for the second method is sufficiently large.
Analytical methods in the limit of weak selection. In addition to the above numerical methods, one can use perturbative methods to compute exact strategy abundance in the limit of weak selection52,53. For a finite strategy space of size n, the assumption of weak selection implies that each strategy pi is approximately played with probability 1/n, plus a deviation term that is proportional to
∑ π π π π= + − − .=
Ln
p p p p p p p p1 ( ( , ) ( , ) ( , ) ( , ))(12)
ij
ni i i j j i j j
1
When Li > 0, we say that the strategy pi is favoured by selection. The analogous quantity for infinite strategy spaces (see also ref. 53) is given by
∫ π π π π= + − − .L dp p p p q q p q q q( ) [ ( , ) ( , ) ( , ) ( , )] (13)
In this expression ∫ dq is the short-hand notat ion for the four-dimensional integral ∫ ∫ ∫ ∫ dq dq dq dqCC CD DC DD0
1
0
1
0
1
0
1 , which in most cases needs to be computed numerically (see Appendix). By look-
www.nature.com/scientificreports/
5Scientific RepoRts | 6:25676 | DOI: 10.1038/srep25676
ing for maxima of L(p), we can determine the stochastic strategy that is most favoured by selection in the weak-selection limit.
ResultsIn the following, we first discuss the dynamics in each of the four considered strategy spaces separately, and then we compare the resulting cooperation levels and average payoffs.
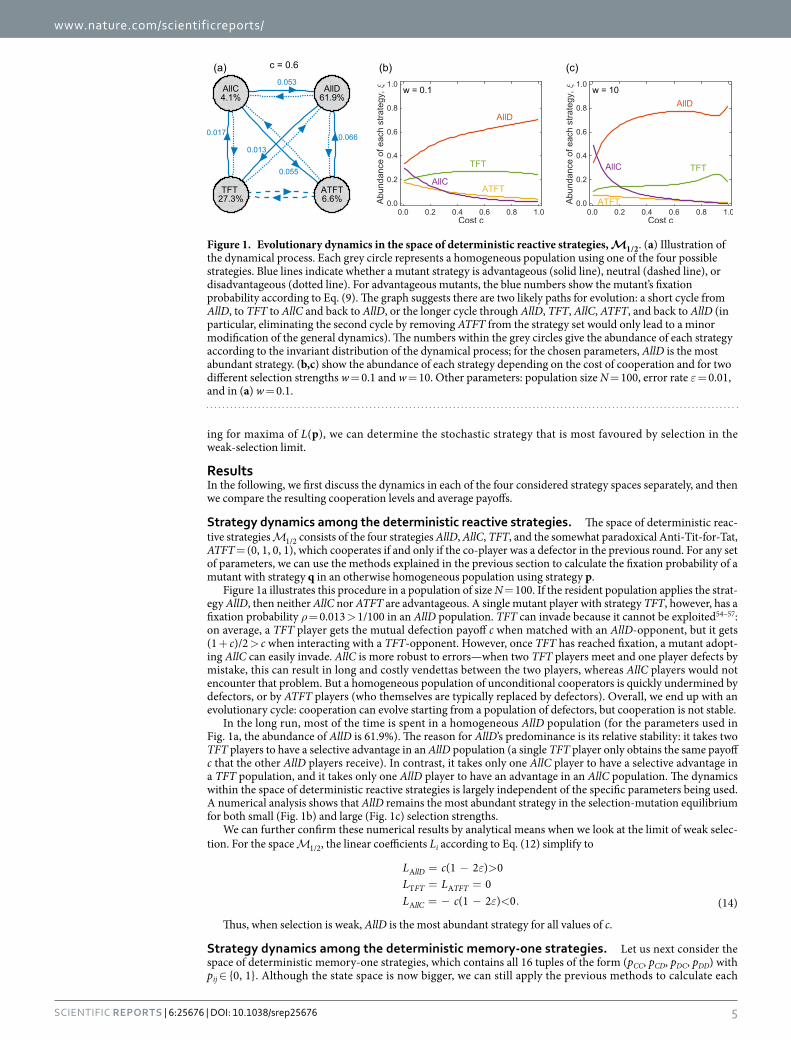
Strategy dynamics among the deterministic reactive strategies. The space of deterministic reac-tive strategies 1/2 consists of the four strategies AllD, AllC, TFT, and the somewhat paradoxical Anti-Tit-for-Tat, ATFT = (0, 1, 0, 1), which cooperates if and only if the co-player was a defector in the previous round. For any set of parameters, we can use the methods explained in the previous section to calculate the fixation probability of a mutant with strategy q in an otherwise homogeneous population using strategy p.
Figure 1a illustrates this procedure in a population of size N = 100. If the resident population applies the strat-egy AllD, then neither AllC nor ATFT are advantageous. A single mutant player with strategy TFT, however, has a fixation probability ρ = 0.013 > 1/100 in an AllD population. TFT can invade because it cannot be exploited54–57: on average, a TFT player gets the mutual defection payoff c when matched with an AllD-opponent, but it gets (1 + c)/2 > c when interacting with a TFT-opponent. However, once TFT has reached fixation, a mutant adopt-ing AllC can easily invade. AllC is more robust to errors—when two TFT players meet and one player defects by mistake, this can result in long and costly vendettas between the two players, whereas AllC players would not encounter that problem. But a homogeneous population of unconditional cooperators is quickly undermined by defectors, or by ATFT players (who themselves are typically replaced by defectors). Overall, we end up with an evolutionary cycle: cooperation can evolve starting from a population of defectors, but cooperation is not stable.
In the long run, most of the time is spent in a homogeneous AllD population (for the parameters used in Fig. 1a, the abundance of AllD is 61.9%). The reason for AllD’s predominance is its relative stability: it takes two TFT players to have a selective advantage in an AllD population (a single TFT player only obtains the same payoff c that the other AllD players receive). In contrast, it takes only one AllC player to have a selective advantage in a TFT population, and it takes only one AllD player to have an advantage in an AllC population. The dynamics within the space of deterministic reactive strategies is largely independent of the specific parameters being used. A numerical analysis shows that AllD remains the most abundant strategy in the selection-mutation equilibrium for both small (Fig. 1b) and large (Fig. 1c) selection strengths.
We can further confirm these numerical results by analytical means when we look at the limit of weak selec-tion. For the space 1/2 , the linear coefficients Li according to Eq. (12) simplify to
ε
ε
= − >= == − − < .
L cL LL c
(1 2 ) 00
(1 2 ) 0 (14)
llD
FT TFT
llC
A
T A
A
Thus, when selection is weak, AllD is the most abundant strategy for all values of c.
Strategy dynamics among the deterministic memory-one strategies. Let us next consider the space of deterministic memory-one strategies, which contains all 16 tuples of the form (pCC, pCD, pDC, pDD) with pij ∈ {0, 1}. Although the state space is now bigger, we can still apply the previous methods to calculate each
Figure 1. Evolutionary dynamics in the space of deterministic reactive strategies, 1/2 . (a) Illustration of the dynamical process. Each grey circle represents a homogeneous population using one of the four possible strategies. Blue lines indicate whether a mutant strategy is advantageous (solid line), neutral (dashed line), or disadvantageous (dotted line). For advantageous mutants, the blue numbers show the mutant’s fixation probability according to Eq. (9). The graph suggests there are two likely paths for evolution: a short cycle from AllD, to TFT to AllC and back to AllD, or the longer cycle through AllD, TFT, AllC, ATFT, and back to AllD (in particular, eliminating the second cycle by removing ATFT from the strategy set would only lead to a minor modification of the general dynamics). The numbers within the grey circles give the abundance of each strategy according to the invariant distribution of the dynamical process; for the chosen parameters, AllD is the most abundant strategy. (b,c) show the abundance of each strategy depending on the cost of cooperation and for two different selection strengths w = 0.1 and w = 10. Other parameters: population size N = 100, error rate ε = 0.01, and in (a) w = 0.1.
www.nature.com/scientificreports/
6Scientific RepoRts | 6:25676 | DOI: 10.1038/srep25676
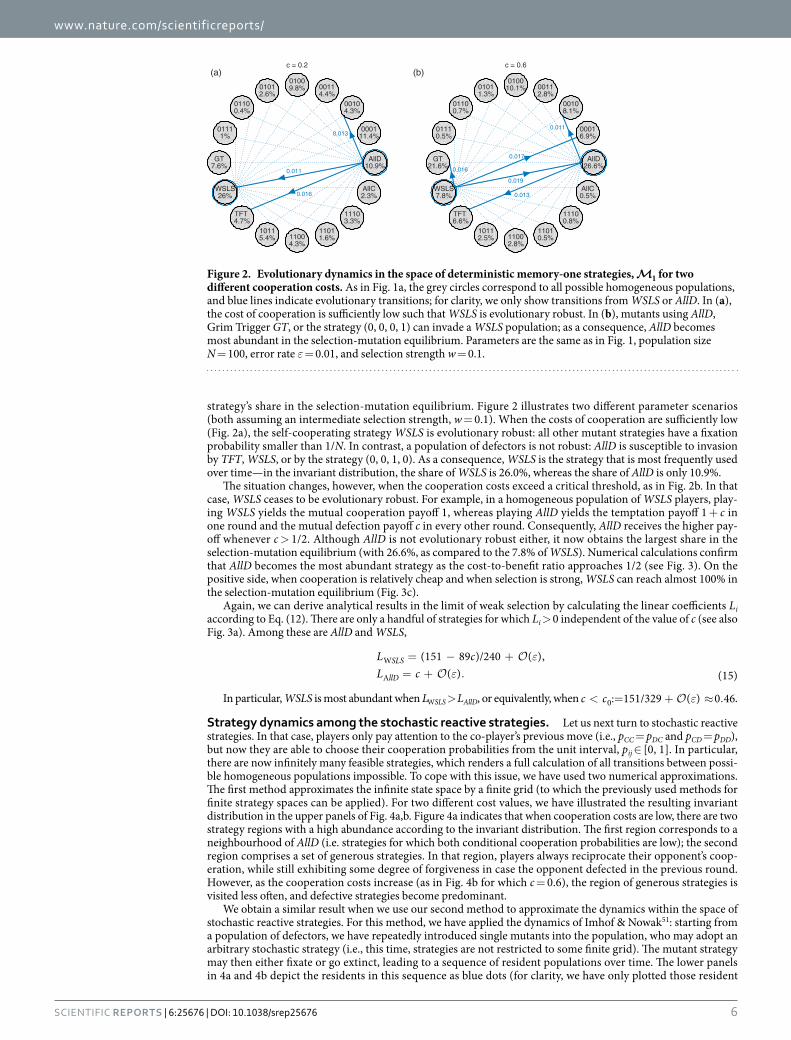
strategy’s share in the selection-mutation equilibrium. Figure 2 illustrates two different parameter scenarios (both assuming an intermediate selection strength, w = 0.1). When the costs of cooperation are sufficiently low (Fig. 2a), the self-cooperating strategy WSLS is evolutionary robust: all other mutant strategies have a fixation probability smaller than 1/N. In contrast, a population of defectors is not robust: AllD is susceptible to invasion by TFT, WSLS, or by the strategy (0, 0, 1, 0). As a consequence, WSLS is the strategy that is most frequently used over time—in the invariant distribution, the share of WSLS is 26.0%, whereas the share of AllD is only 10.9%.
The situation changes, however, when the cooperation costs exceed a critical threshold, as in Fig. 2b. In that case, WSLS ceases to be evolutionary robust. For example, in a homogeneous population of WSLS players, play-ing WSLS yields the mutual cooperation payoff 1, whereas playing AllD yields the temptation payoff 1 + c in one round and the mutual defection payoff c in every other round. Consequently, AllD receives the higher pay-off whenever c > 1/2. Although AllD is not evolutionary robust either, it now obtains the largest share in the selection-mutation equilibrium (with 26.6%, as compared to the 7.8% of WSLS). Numerical calculations confirm that AllD becomes the most abundant strategy as the cost-to-benefit ratio approaches 1/2 (see Fig. 3). On the positive side, when cooperation is relatively cheap and when selection is strong, WSLS can reach almost 100% in the selection-mutation equilibrium (Fig. 3c).
Again, we can derive analytical results in the limit of weak selection by calculating the linear coefficients Li according to Eq. (12). There are only a handful of strategies for which Li > 0 independent of the value of c (see also Fig. 3a). Among these are AllD and WSLS,
εε
= − += + .
L cL c
(151 89 )/240 ( ),( ) (15)
SLS
llD
W
A
In particular, WSLS is most abundant when LWSLS > LAllD, or equivalently, when ε< = + ≈ .c c : 151/329 ( ) 0 460 .
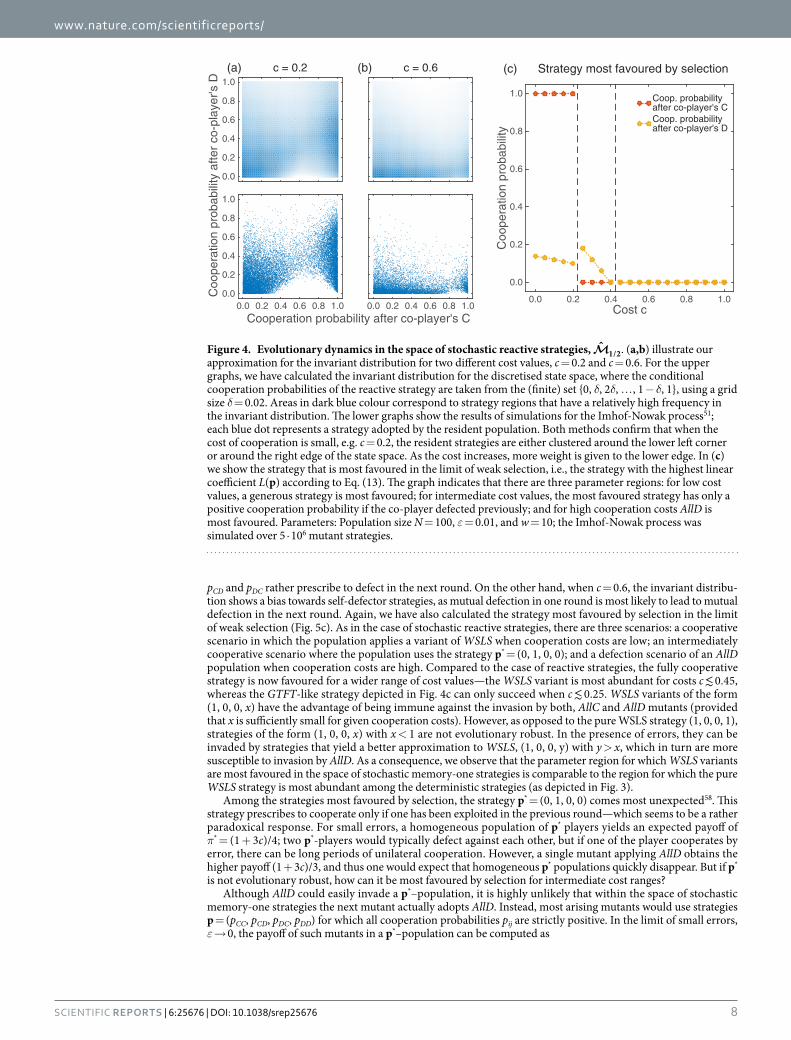
Strategy dynamics among the stochastic reactive strategies. Let us next turn to stochastic reactive strategies. In that case, players only pay attention to the co-player’s previous move (i.e., pCC = pDC and pCD = pDD), but now they are able to choose their cooperation probabilities from the unit interval, pij ∈ [0, 1]. In particular, there are now infinitely many feasible strategies, which renders a full calculation of all transitions between possi-ble homogeneous populations impossible. To cope with this issue, we have used two numerical approximations. The first method approximates the infinite state space by a finite grid (to which the previously used methods for finite strategy spaces can be applied). For two different cost values, we have illustrated the resulting invariant distribution in the upper panels of Fig. 4a,b. Figure 4a indicates that when cooperation costs are low, there are two strategy regions with a high abundance according to the invariant distribution. The first region corresponds to a neighbourhood of AllD (i.e. strategies for which both conditional cooperation probabilities are low); the second region comprises a set of generous strategies. In that region, players always reciprocate their opponent’s coop-eration, while still exhibiting some degree of forgiveness in case the opponent defected in the previous round. However, as the cooperation costs increase (as in Fig. 4b for which c = 0.6), the region of generous strategies is visited less often, and defective strategies become predominant.
We obtain a similar result when we use our second method to approximate the dynamics within the space of stochastic reactive strategies. For this method, we have applied the dynamics of Imhof & Nowak51: starting from a population of defectors, we have repeatedly introduced single mutants into the population, who may adopt an arbitrary stochastic strategy (i.e., this time, strategies are not restricted to some finite grid). The mutant strategy may then either fixate or go extinct, leading to a sequence of resident populations over time. The lower panels in 4a and 4b depict the residents in this sequence as blue dots (for clarity, we have only plotted those resident
0.013
0.011
0.016
AllD10.9%
000111.4%
00104.3%
00114.4%
01009.8%0101
2.6%01100.4%
01111%
GT 7.6%
WSLS26%
TFT 4.7%
10115.4% 1100
4.3%
11011.6%
11103.3%
AllC2.3%
c = 0.2
0.011
0.013
0.019
0.017
0.016
AllD26.6%
00016.9%
00108.1%
00112.8%
010010.1%0101
1.3%01100.7%
01110.5%
GT 21.6%
WSLS7.8%
TFT 6.6%
10112.5% 1100
2.8%
11010.5%
11100.8%
AllC0.5%
c = 0.6(a) (b)
Figure 2. Evolutionary dynamics in the space of deterministic memory-one strategies, 1 for two different cooperation costs. As in Fig. 1a, the grey circles correspond to all possible homogeneous populations, and blue lines indicate evolutionary transitions; for clarity, we only show transitions from WSLS or AllD. In (a), the cost of cooperation is sufficiently low such that WSLS is evolutionary robust. In (b), mutants using AllD, Grim Trigger GT, or the strategy (0, 0, 0, 1) can invade a WSLS population; as a consequence, AllD becomes most abundant in the selection-mutation equilibrium. Parameters are the same as in Fig. 1, population size N = 100, error rate ε = 0.01, and selection strength w = 0.1.

www.nature.com/scientificreports/
7Scientific RepoRts | 6:25676 | DOI: 10.1038/srep25676
populations that survived at least 50 mutant invasions). Again, low cooperation costs lead to two clusters in the two-dimensional state space—a cluster with defective strategies and a cluster with generous strategies. But as before, the cluster of generous strategies tends to shrink as the cooperation costs increase (as also observed in ref. 51). We have also numerically computed the stochastic reactive strategy that is most favoured by selection (see Fig. 4c). There are three parameter regions: for cost-to-benefit ratios below 1/4, we observe that the most favoured strategy is generous. However, as the cooperation costs increase and the cost-to-benefit ratio is between 1/4 and 2/5, the most favoured strategy prescribes that players should no longer reciprocate cooperation, and players should only cooperate with some low probability when the opponent defected in the previous round. Clearly, a population made up of such players only achieves low levels of cooperation. The situation becomes even worse as the cost-to-benefit ratio exceeds 2/5, in which case unconditional defection becomes the most favoured strategy.
Strategy dynamics among the stochastic memory-one strategies. Finally, we can apply the same two approximations to the 4-dimensional space of all stochastic memory-one strategies. Of course, that state space can no longer be depicted in a two-dimensional graph; but Fig. 5a,b show the invariant distribution for each of the four components pCC, pCD, pDC, and pDD, again for the two cost values c = 0.2 and c = 0.6. For c = 0.2 we observe behaviour that is consistent with WSLS. After mutual cooperation, players almost certainly continue with cooperation, and after mutual defection players are more likely to cooperate than to defect, whereas the values of
Figure 3. Selection-mutation equilibrium in the space of memory-one strategies for different costs and selection strengths. The graphs in (a) show the linear coefficients Li according to Eq. (12), whereas the graphs in (b,c) show the strategy abundance for intermediate (w = 0.1) and strong (w = 10) selection, respectively. In each case, the 16 curves are plotted in three different panels (depending on the strategy’s abundance), in order to increase the clarity of the Figure. WSLS is most abundant when cooperation is cheap, whereas AllD and GT become predominant as c exceeds a critical threshold. The other parameters are the same as before, N = 100 and ε = 0.01.
www.nature.com/scientificreports/
8Scientific RepoRts | 6:25676 | DOI: 10.1038/srep25676
pCD and pDC rather prescribe to defect in the next round. On the other hand, when c = 0.6, the invariant distribu-tion shows a bias towards self-defector strategies, as mutual defection in one round is most likely to lead to mutual defection in the next round. Again, we have also calculated the strategy most favoured by selection in the limit of weak selection (Fig. 5c). As in the case of stochastic reactive strategies, there are three scenarios: a cooperative scenario in which the population applies a variant of WSLS when cooperation costs are low; an intermediately cooperative scenario where the population uses the strategy p* = (0, 1, 0, 0); and a defection scenario of an AllD population when cooperation costs are high. Compared to the case of reactive strategies, the fully cooperative strategy is now favoured for a wider range of cost values—the WSLS variant is most abundant for costs c ≲ 0.45, whereas the GTFT-like strategy depicted in Fig. 4c can only succeed when c ≲ 0.25. WSLS variants of the form (1, 0, 0, x) have the advantage of being immune against the invasion by both, AllC and AllD mutants (provided that x is sufficiently small for given cooperation costs). However, as opposed to the pure WSLS strategy (1, 0, 0, 1), strategies of the form (1, 0, 0, x) with x < 1 are not evolutionary robust. In the presence of errors, they can be invaded by strategies that yield a better approximation to WSLS, (1, 0, 0, y) with y > x, which in turn are more susceptible to invasion by AllD. As a consequence, we observe that the parameter region for which WSLS variants are most favoured in the space of stochastic memory-one strategies is comparable to the region for which the pure WSLS strategy is most abundant among the deterministic strategies (as depicted in Fig. 3).
Among the strategies most favoured by selection, the strategy p* = (0, 1, 0, 0) comes most unexpected58. This strategy prescribes to cooperate only if one has been exploited in the previous round—which seems to be a rather paradoxical response. For small errors, a homogeneous population of p* players yields an expected payoff of π* = (1 + 3c)/4; two p*-players would typically defect against each other, but if one of the player cooperates by error, there can be long periods of unilateral cooperation. However, a single mutant applying AllD obtains the higher payoff (1 + 3c)/3, and thus one would expect that homogeneous p* populations quickly disappear. But if p* is not evolutionary robust, how can it be most favoured by selection for intermediate cost ranges?
Although AllD could easily invade a p*–population, it is highly unlikely that within the space of stochastic memory-one strategies the next mutant actually adopts AllD. Instead, most arising mutants would use strategies p = (pCC, pCD, pDC, pDD) for which all cooperation probabilities pij are strictly positive. In the limit of small errors, ε → 0, the payoff of such mutants in a p*–population can be computed as
0.0
0.2
0.4
0.6
0.8
1.0(a) c = 0.2 (b) c = 0.6
Cooperation probability after co-player's C0.0 0.2 0.4 0.6 0.8 1.0
Coo
pera
tion
prob
abili
ty a
fter
co-p
laye
r's D
0.0
0.2
0.4
0.6
0.8
1.0
0.0 0.2 0.4 0.6 0.8 1.0 Cost c0.0 0.2 0.4 0.6 0.8 1.0
Coo
pera
tion
prob
abili
ty
0.0
0.2
0.4
0.6
0.8
1.0 Coop. probabilityafter co-player's CCoop. probabilityafter co-player's D
(c) Strategy most favoured by selection
Figure 4. Evolutionary dynamics in the space of stochastic reactive strategies, ˆ1/2 . (a,b) illustrate our
approximation for the invariant distribution for two different cost values, c = 0.2 and c = 0.6. For the upper graphs, we have calculated the invariant distribution for the discretised state space, where the conditional cooperation probabilities of the reactive strategy are taken from the (finite) set {0, δ, 2δ, … , 1 − δ, 1}, using a grid size δ = 0.02. Areas in dark blue colour correspond to strategy regions that have a relatively high frequency in the invariant distribution. The lower graphs show the results of simulations for the Imhof-Nowak process51; each blue dot represents a strategy adopted by the resident population. Both methods confirm that when the cost of cooperation is small, e.g. c = 0.2, the resident strategies are either clustered around the lower left corner or around the right edge of the state space. As the cost increases, more weight is given to the lower edge. In (c) we show the strategy that is most favoured in the limit of weak selection, i.e., the strategy with the highest linear coefficient L(p) according to Eq. (13). The graph indicates that there are three parameter regions: for low cost values, a generous strategy is most favoured; for intermediate cost values, the most favoured strategy has only a positive cooperation probability if the co-player defected previously; and for high cooperation costs AllD is most favoured. Parameters: Population size N = 100, ε = 0.01, and w = 10; the Imhof-Nowak process was simulated over 5 · 106 mutant strategies.

www.nature.com/scientificreports/
9Scientific RepoRts | 6:25676 | DOI: 10.1038/srep25676
π =−
− +.
pp p
c1
1 (16)CD
CD DD
This payoff is not only smaller than the residents’ payoff π*; it is exactly the same payoff that mutants would get in an AllD population. Thus, the strategy p* = (0, 1, 0, 0) can be successful because against almost all mutant strategies it behaves like AllD; only against itself (and against a few other strategies, like against AllD) it cooperates occasionally. In a sense, p* acts as if it used a rudimentary form of kin recognition - it shows some cooperation against players of the same kind, but it defects against almost everyone else.
Comparison of the evolving cooperation rates. After analysing the strategy dynamics in each of the four strategy spaces separately, we are now in a position to compare the evolving cooperation rates. For reactive strategies and low cooperation costs, stochastic strategies lead to more cooperation than deterministic strategies (Fig. 6b). As we have seen in Fig. 1, deterministic reactive strategies are unable to stabilize cooperation; TFT can be invaded by AllC, and AllC is easily invaded by AllD (see also ref. 59). Stochastic reactive strategies, on the other hand, can maintain a healthy level of cooperation for a considerable time. GTFT-like strategies resist inva-sion by AllD, and they are only destabilized when altruistic AllC-like strategies increase in frequency by neutral drift42,51,60–63. However, with increasing cooperation costs, it takes longer until GTFT-like strategies emerge, as the so-called cooperation-rewarding zone shrinks as c increases (see, for example, ref. 5), and GTFT-like strategies are more likely to be invaded by overly altruistic strategies. As a result, when cooperation costs are high deterministic strategies perform slightly better, because TFT mutants show up more quickly to re-invade AllD populations.
Memory-one strategies are generally more favourable to cooperation, as depicted in Fig. 6c. In contrast to reactive strategies, memory-one strategies allow for WSLS-like behaviour which is more stable against indirect invasion by altruistic AllC strategies44,64. Interestingly, however, we find that for low cooperation costs, determin-istic memory-one strategies are better in sustaining cooperation than stochastic strategies. Among the determin-istic memory-one strategies, mutants are strongly opposed by selection when they enter a WSLS population (as illustrated in Fig. 2). As a result, WSLS reaches almost 100% in the invariant distribution, provided that selection is sufficiently strong and that the costs of cooperation are low. There are two reasons why stochastic strategies can result in less cooperation. First, although WSLS remains a Nash equilibrium65,66, stochasticity allows for the invasion of nearby mutants (that are only slightly disfavoured by selection); these mutants may in turn be more susceptible to invasion by AllD67. Second, stochastic dynamics often generates resident populations that only use an approximate version of WSLS, having the form (1, 0, 0, x), with x < 1. Compared to the deterministic WSLS rule, these approximate versions are more prone to noise: if one of the players defected by error, it may take a sub-stantial number of rounds to re-establish mutual cooperation (which becomes most clear when x is close to zero).
0.0
0.5
1.0(a) c = 0.2
pCC
0.0
0.5
1.0 pCD
0.0
0.5
1.0 pDC
Fre
quen
cy a
ccor
ding
to in
varia
nt d
istr
ibut
ion
0.0
0.5
1.0
0.0 1.0
pDD
(b) c = 0.6p
CC
pCD
pDC
0.0 1.0
pDD
Cost c0.0 0.2 0.4 0.6 0.8 1.0
Coo
pera
tion
prob
abili
ty
0.0
0.2
0.4
0.6
0.8
1.0
pCC
pCD
pDC
pDD
(c) Strategy most favoured by selection
Figure 5. Evolutionary dynamics in the space of stochastic memory-one strategies, ˆ1 . (a,b) show the
marginal distribution of the evolving cooperation probabilities pij in the mutation-selection equilibrium. To generate the figure, we have calculated the invariant distribution for a discretised version of the state space, using a grid size of δ = 0.2. For low costs, the cooperation probabilities are in line with WSLS behaviour; for larger cost values, cooperation breaks down, and most evolving strategies are self-defectors. In (c) we depict the strategy that has the highest linear coefficient L(p) according to Eq. (13). Again there are three parameter regions: for low costs, a variant of WSLS is most favoured by selection; for intermediate costs, the somewhat paradoxical strategy (0, 1, 0, 0) is most favoured; and for high costs, AllD becomes predominant. Parameters are the same as before: Population size N = 100, ε = 0.01, and w = 10.

www.nature.com/scientificreports/
1 0Scientific RepoRts | 6:25676 | DOI: 10.1038/srep25676
This result is somewhat disappointing: especially in parameter regions in which WSLS is unstable, one would hope that stochastic strategies allow at least for some degree of cooperation, because WSLS variants of the form (1, 0, 0, x) are immune to the invasion of AllC and AllD mutants as explained above. The previous results on the effect of stochasticity need to be viewed in light of the assumed mutation kernel—for our numerical results we have assumed that new mutant strategies are taken from a uniform distribution. This assumption often generates mutant strategies with intermediate cooperation probabilities—which have no chance of being evolutionary robust40. What would happen if mutant strategies were instead taken from a distribution that puts more weight on the boundary of the state space? In Fig. 7, we show numerical results under the assumption that the cooperation probabilities of new mutant strategies follow a U-shaped distribution on the interval [0,1]. Keeping the previous error rate of ε = 0.01, the U-shaped mutation kernel seems to marginally increase the evolving cooperation rates for most cost values (Fig. 7a). If we additionally reduce the error rate to ε = 10−4, U-shaped mutations can lead to a more dra-matic increase in cooperation rates, especially for scenarios with intermediate cooperation costs. In that parameter region, successful residents often apply strategies of the form (1 − δ1, δ2, δ3, δ4) with all δi ≪ 1. Because δ4 ≪ 1, such residents can hardly be exploited by AllD mutants. If, in addition, δ1 ≪ δ4, such strategies can still reach a substantial level of cooperation against themselves. We note that strategies of the form (1 − δ1, δ2, δ3, δ4) are not stable, as they could be invaded by strategies that increase their cooperation probability after mutual defection. However, pro-vided that δ1 is sufficiently small, the selective advantage of such mutants would be comparably small, and hence it
Cost c0.0 0.2 0.4 0.6 0.8 1.0
Abu
ndan
ce o
f coo
pera
tion
0.0
0.1
0.2
0.3
(a) Unconditional strategies
Only deterministicstrategiesContinuous space ofstochastic strategies(Imhof & Nowak)
Cost c0.0 0.2 0.4 0.6 0.8 1.0
Abu
ndan
ce o
f coo
pera
tion
0.0
0.2
0.4
0.6
0.8
1.0
(b) Reactive strategies
Only deterministicstrategies
Continuous space ofstochastic strategies(Imhof & Nowak)
Cost c0.0 0.2 0.4 0.6 0.8 1.0
Abu
ndan
ce o
f coo
pera
tion
0.0
0.2
0.4
0.6
0.8
1.0
(c) Memory-one strategies
Only deterministicstrategies
Continuous space ofstochastic strategies(Imhof & Nowak)
Figure 6. Evolving cooperation rates for (a) unconditional strategies, (i.e., strategies that use the same cooperation probability p in every round, independent of the past history), (b) reactive strategies, and (c) memory-one strategies. All graphs show the abundance of cooperation as measured by the quantity γ in Eq. (11) for the case of deterministic strategies (blue), and according to the Imhof-Nowak process for stochastic strategies (yellow; a discretised version of the continuous space of memory-one strategies would yield similar results). Dots represent simulation results, whereas solid lines represent numerically exact results derived from the invariant distribution of the evolutionary processes. Parameters: population size N = 100, ε = 0.01, and w = 10.
Cost c0.0 0.2 0.4 0.6 0.8 1.0
Abu
ndan
ce o
f coo
pera
tion
0.0
0.2
0.4
0.6
0.8
1.0
(a) Frequent errors,U-shaped mutations
Only deterministicstrategiesContinuous space ofstochastic strategies(Imhof & Nowak)
Cost c0.0 0.2 0.4 0.6 0.8 1.0
Abu
ndan
ce o
f coo
pera
tion
0.0
0.2
0.4
0.6
0.8
1.0
(b) Rare errors,U-shaped mutations
Only deterministicstrategiesContinuous space ofstochastic strategies(Imhof & Nowak)
Figure 7. U-shaped mutation kernels lead to more cooperation in high cost scenarios. As in Fig. 6c, both graphs show the evolving cooperation rate for the space of deterministic memory-one strategies (blue) and stochastic memory-one strategies (yellow). However, here we have varied the error rate of players (ε = 1% for frequent errors, ε = 0.01% for rare errors). In addition, the cooperation probabilities pi of new mutant strategies are now taken from a beta-distribution. The beta-distribution has the density function f(p) = Cpα−1(1 − p)β−1, with C being a normalization factor. The values α = β = 1 yield the uniform distribution on [0,1], as used in Fig. 6; here, we have taken α = β = 0.1, yielding a strongly U-shaped distribution. All other parameters are the same as in Fig. 6.

www.nature.com/scientificreports/
1 1Scientific RepoRts | 6:25676 | DOI: 10.1038/srep25676
may take a long time until such mutant strategies appear and fixate in the population. The results in Fig. 7 thus sug-gest that the assumed mutation structure can have a considerable impact on the evolving cooperation rates. Herein, we have considered two extreme structures, uniform mutations and strongly U-shaped mutations, but a more gen-eral analysis of the impact of different mutation kernels would certainly be a worthwhile topic for future research.
Discussion and SummaryWe have used the Moran process in finite populations to study the evolution of cooperation in repeated games. The mathematics of repeated games can be intricate. Even if one only considers a restricted strategy space, such as the space of all memory-one strategies, it is typically hard to derive exact results for the resulting evolutionary dynamics. There are various ways to cope with this complexity. Some studies have focused on even simpler strat-egy sets, consisting only of a handful of representative strategies (e.g. refs 7,59,61 and 68). Others have obtained analytical results for certain infinitely-dimensional subsets of memory-one strategies, like reactive strategies51,60, zero-determinant strategies62, or conformistic strategies63. Yet another approach is to use computer simulations (as in refs 44 and 69–71). Herein, we have taken a somewhat intermediate approach. By assuming appropriate separation of time scales (e.g., mutations are sufficiently rare such that populations are typically homogeneous), we can compute numerically exact strategy abundance in case the strategy space is finite (as in the case of deter-ministic strategies). To explore the dynamics among stochastic strategies, we have extended this approach to approximate the dynamics in infinite strategy spaces.
We have used this approach to systematically compare the evolutionary dynamics among strategy spaces of different complexity. The strategy spaces considered differ along two dimensions, depending on whether strate-gies are reactive or memory-one, and depending on whether strategies are deterministic or stochastic. Each of the four considered strategy spaces has been explored previously, but only in isolation. Herein, we are explicitly inter-ested how much complexity is needed to allow for a healthy level of cooperation. In this way, our study contrib-utes to a growing research effort, exploring how the evolution of cooperation depends on underlying modelling assumptions. For example, García and Traulsen72 and Stewart and Plotkin71 have analysed the role of the mutation structure on the emergence and stability of cooperation, whereas van den Berg and Weissing73 have explored the consequences of two different strategy representations. We believe that this kind of research is extremely useful, as it serves as an important robustness check for previous results on the evolution of direct reciprocity.
Our study provides at least two major insights. The first insight is that more complex strategies do not guar-antee more cooperation. More specifically, we have found that memory-one strategies, which also take one’s own previous move into account, have a positive impact on cooperation. If players have no memory at all (i.e. if they can only use unconditional strategies), evolution unambiguously promotes defection (as depicted in Fig. 6a). However, if players can react to the co-player’s previous move, or even better to the moves of both players, then evolution can promote cooperative strategies when the costs of cooperation are sufficiently low. Although we have not tested memory-two strategies (i.e. players who react to the outcome of the last two rounds), one may expect that such strategies could further facilitate cooperation, especially in parameter regions in which the classical WSLS strategy becomes unstable (see, e.g. refs 8 and 74). The effect of stochasticity on cooperation is more ambig-uous. If players only remember the co-players’ previous move, then stochasticity allows for generous strategies like GTFT, and such generous strategies can help to establish relatively high levels of cooperation. On the other hand, when cooperation costs are low, and players are allowed to use memory-one strategies, stochastic strategies cannot further promote cooperation. Here, the deterministic version of WSLS works best.
Our second insight is rather conceptual. To quantify the evolutionary success of some strategy p, it is com-mon to check whether the strategy is an equilibrium, or whether the strategy is evolutionary robust (see e.g. refs 40,50,65,66 and 75). To this end, one checks whether there would be a mutant strategy q that can prosper in a population of p players. A strategy that is not robust is generally assumed to play a minor role during the evolu-tionary process. Yet, we have seen that under some evolutionary conditions, the strategy p* = (0, 1, 0, 0) can be surprisingly successful despite not being evolutionary robust. This somewhat paradoxical strategy can persist because against almost all other strategies it plays like AllD; but against a handful of strategies (including itself and against AllD) it cooperates for a substantial fraction of time. In particular, there are mutant strategies that could invade into a homogeneous p* - population. However, the probability that such a mutant arises within a reason-able timespan is vanishingly small, as the space of such advantageous mutants has measure zero within the space of all memory-one strategies. Thus, it does not seem sufficient for evolutionary robustness to ask whether there is another strategy that would have a higher fitness; one also needs to check whether this beneficial mutant strat-egy can arise under the considered mutation scheme. Put differently, unless a resident outperforms every other strategy, the question of evolutionary robustness cannot be properly assessed without reference to the mutation scheme. Of course, this observation does not diminish the value of traditional equilibrium considerations—but if a strategy is only unstable because some non-generic strategy can invade, then some caution seems warranted.
Appendix: Computation of the linear coefficient L(p) for stochastic strategies. To compute the stochastic strategy that is most favoured by selection, we have evaluated the four-dimensional integral L(p) in Eq. (13) by means of Gaussian quadrature76. For maximizing L(p), we have employed a two-step approach: The first step is exhaustive global search of the whole strategy space. Some degree of discretisation is inevitable in checking many different realizations of p = (pCC, pCD, pDC, pDD). In particular, we have observed that the objective function L(p) tends to change rapidly when i approaches the boundary of the strategy space. As the change is smoothed by the implementation error, it is quite often the case that ′p ij, or − ′p1 ij, turns out to be ε( ). Therefore, the mesh size of pij has been set to be of an order of ε when getting close to zero or one. Specifically, we have used 174 = 83, 521 grid points in total by adding pij = 0.005, 0.01, 0.02, 0.98, 0.99, and 0.995 to a regular mesh grid pij = 0.1k (k = 0,… , 10).

www.nature.com/scientificreports/
1 2Scientific RepoRts | 6:25676 | DOI: 10.1038/srep25676
The next step is the gradient-descent method77, starting from the best strategy of the exhaustive search. Although this second method is local, it works in a continuous space and finds out a nearby maximum with far higher precision than the grid search. We expect that this two-step approach precisely locates the global maxi-mum as long as the mesh of the first step is fine enough to detect all the relevant variations of the objective func-tion L(p).
References1. Trivers, R. L. The evolution of reciprocal altruism. Q. Rev. Biol. 46, 35–57 (1971).2. Axelrod, R. The Evolution of Cooperation (Basic Books, New York, 1984).3. Nowak, M. A. Five rules for the evolution of cooperation. Science 314, 1560–1563 (2006).4. Nowak, M. A. Evolutionary Dynamics: Exploring the Equations of Life (Harvard University Press, Cambridge, 2006).5. Sigmund, K. The calculus of selfishness (Princeton Univ. Press, 2010).6. Fudenberg, D. & Maskin, E. The folk theorem in repeated games with discounting or with incomplete information. Econometrica 54,
533–554 (1986).7. Boyd, R. & Richerson, P. J. The evolution of reciprocity in sizeable groups. J. Theor. Biol. 132, 337–356 (1988).8. Hauert, C. & Schuster, H. G. Effects of increasing the number of players and memory size in the iterated prisoner’s dilemma: a
numerical approach. Proc. R. Soc. B 264, 513–519 (1997).9. Pacheco, J. M., Traulsen, A., Ohtsuki, H. & Nowak, M. A. Repeated games and direct reciprocity under active linking. J. Theor. Biol.
250, 723–731 (2008).10. Rand, D. G., Ohtsuki, H. & Nowak, M. A. Direct reciprocity with costly punishment: generous tit-for-tat prevails. J. Theor. Biol. 256,
45–57 (2009).11. van Veelen, M., García, J., Rand, D. G. & Nowak, M. A. Direct reciprocity in structured populations. Proc. Natl. Acad. Sci. USA 109,
9929–9934 (2012).12. Bednarik, P., Fehl, K. & Semmann, D. Costs for switching partners reduce network dynamics but not cooperative behaviour. Proc.
R. Soc. B 281, 20141661 (2014).13. Szolnoki, A. & Perc, M. Defection and extortion as unexpected catalysts of unconditional cooperation in structured populations. Sci.
Rep. 4, 5496 (2014).14. Wilkinson, G. S. Reciprocal food-sharing in the vampire bat. Nature 308, 181–184 (1984).15. Milinski, M. Tit for tat in sticklebacks and the evolution of cooperation. Nature 325, 433–435 (1987).16. Stephens, D. W., McLinn, C. M. & Stevens, J. R. Discounting and reciprocity in an iterated prisoner’s dilemma. Science 298,
2216–2218 (2002).17. Binmore, K. Natural justice (Oxford University Press, Oxford, UK, 2011).18. Rand, D. G. et al. Social heuristics shape intuitive cooperation. Nat. Commun. 5, 3677 (2014).19. Capraro, V., Jordan, J. J. & Rand, D. G. Heuristics guide the implementation of social preferences in one-shot prisoner’s dilemma
experiments. Sci. Rep. 4, 6790 (2014).20. Delton, A. W., Krasnow, M. M., Cosmides, L. & Tooby, J. Evolution of direct reciprocity under uncertainty can explain human
generosity in one-shot encounters. Proc. Natl. Acad. Sci. USA 108, 13335–13340 (2011).21. Hoffman, M., Yoeli, E. & Nowak, M. A. Cooperate without looking: why we care what people think and not just what they do. Proc.
Natl. Acad. Sci. USA 112, 1727–1732 (2015).22. Stevens, J. R., Volstorf, J., Schooler, L. J. & Rieskamp, J. Forgetting constrains the emergence of cooperative decision strategies. Front.
Psychol. 1, 235 (2011).23. Milinski, M. & Wedekind, C. Working memory constrains human cooperation in the prisoner’s dilemma. Proc. Natl. Acad. Sci. USA
95, 13755–13758 (1998).24. Wedekind, C. & Milinski, M. Cooperation through image scoring in humans. Science 288, 850–852 (2000).25. Engle-Warnick, J. & Slonim, R. L. Inferring repeated-game strategies from actions: evidence from trust game experiments. Econ.
Theor. 28, 603–632 (2006).26. Dal Bó, P. & Fréchette, G. R. The evolution of cooperation in infinitely repeated games: experimental evidence. Am. Econ. Rev. 101,
411–429 (2011).27. Camera, G., Casari, M. & Bigoni, M. Cooperative strategies in anonymous economies: an experiment. Game Econ. Behav. 75,
570–586 (2012).28. Bruttel, L. & Kamecke, U. Infinity in the lab. how do people play repeated games? Theor. Decis. 72, 205–219 (2012).29. Dal Bó, P. & Fréchette, G. R. Strategy choice in the infinitely repeated prisoners’ dilemma. Social Science Research Network.
(2015) Available at: http://ssrn.com/abstract= 2292390 (Accessed: 9th March 2016).30. Cuesta, J. A., Gracia-Lázaro, C., Ferrer, A., Moreno, Y. & Sánchez, A. Reputation drives cooperative behaviour and network
formation in human groups. Sci. Rep. 5, 7843 (2015).31. Gallo, E. & Yan, C. The effects of reputational and social knowledge on cooperation. Proc. Natl. Acad. Sci. USA 112, 3647–3652
(2015).32. Kalai, E., Samet, D. & Stanford, W. A note on reactive equilibria in the discounted prisoner’s dilemma and associated games. Int. J.
Game Theory 17, 177–186 (1988).33. Nowak, M. A. & Sigmund, K. Oscillations in the evolution of reciprocity. J. Theor. Biol. 137, 21–26 (1989).34. Wahl, L. M. & Nowak, M. A. The continuous prisoner’s dilemma: I. linear reactive strategies. J. Theor. Biol. 200, 307–321 (1999).35. Nowak, M. A. & Sigmund, K. Chaos and the evolution of cooperation. Proc. Natl. Acad. Sci. USA 90, 5091–5094 (1993).36. Nowak, M. A., Sasaki, A., Taylor, C. & Fudenberg, D. Emergence of cooperation and evolutionary stability in finite populations.
Nature 428, 646–650 (2004).37. Fudenberg, D. & Imhof, L. A. Imitation processes with small mutations. J. Econ. Theory 131, 251–262 (2006).38. Martinez-Vaquero, L. A., Cuesta, J. A. & Sánchez, A. Generosity pays in the presence of direct reciprocity: a comprehensive study of
2 × 2 repeated games. Plos One 7, e35135 (2012).39. Boyd, R. Mistakes allow evolutionary stability in the repeated prisoner’s dilemma game. J. Theor. Biol. 136, 47–56 (1989).40. Stewart, A. J. & Plotkin, J. B. Collapse of cooperation in evolving games. Proc. Natl. Acad. Sci. USA 111, 17558–17563 (2014).41. Molander, P. The optimal level of generosity in a selfish, uncertain environment. J. Conflict Resolut. 29, 611–618 (1985).42. Nowak, M. A. & Sigmund, K. Tit for tat in heterogeneous populations. Nature 355, 250–253 (1992).43. Kraines, D. & Kraines, V. Pavlov and the prisoner’s dilemma. Theor. Decis. 26, 47–79 (1989).44. Nowak, M. & Sigmund, K. A strategy of win-stay, lose-shift that outperforms tit-for-tat in the prisoner’s dilemma game. Nature 364,
56–58 (1993).45. Tamura, K. & Masuda, N. Win-stay lose-shift strategy in formation changes in football. EPJ Data Sci. 4, 9 (2015).46. Taylor, C., Fudenberg, D., Sasaki, A. & Nowak, M. A. Evolutionary game dynamics in finite populations. B. Math. Biol. 66,
1621–1644 (2004).47. Jeong, H.-C., Oh, S.-Y., Allen, B. & Nowak, M. A. Optional games on cycles and complete graphs. J. Theor. Biol. 356, 98–112 (2014).48. Wu, B., Gokhale, C. S., Wang, L. & Traulsen, A. How small are small mutation rates? J. Math. Biol. 64, 803–827 (2012).49. McAvoy, A. Comment on “Imitation processes with small mutations”. J. Econ. Theory 159, 66–69 (2015).

www.nature.com/scientificreports/
13Scientific RepoRts | 6:25676 | DOI: 10.1038/srep25676
50. Stewart, A. J. & Plotkin, J. B. From extortion to generosity, evolution in the iterated prisoner’s dilemma. Proc. Natl. Acad. Sci. USA 110, 15348–15353 (2013).
51. Imhof, L. A. & Nowak, M. A. Stochastic evolutionary dynamics of direct reciprocity. Proc. R. Soc. B 277, 463–468 (2010).52. Antal, T., Traulsen, A., Ohtsuki, H., Tarnita, C. E. & Nowak, M. A. Mutation–selection equilibrium in games with multiple strategies.
J. Theor. Biol. 258, 614–622 (2009).53. Tarnita, C. E., Antal, T. & Nowak, M. A. Mutation–selection equilibrium in games with mixed strategies. J. Theor. Biol. 261, 50–57
(2009).54. Press, W. H. & Dyson, F. D. Iterated prisoner’s dilemma contains strategies that dominate any evolutionary opponent. Proc. Natl.
Acad. Sci. USA 109, 10409–10413 (2012).55. Duersch, P., Oechssler, J. & Schipper, B. When is tit-for-tat unbeatable? Int. J. Game Theory 43, 25–36 (2013).56. Hilbe, C., Wu, B., Traulsen, A. & Nowak, M. A. Cooperation and control in multiplayer social dilemmas. Proc. Natl. Acad. Sci. USA
111, 16425–16430 (2014).57. Hilbe, C., Wu, B., Traulsen, A. & Nowak, M. A. Evolutionary performance of zero-determinant strategies in multiplayer games. J.
Theor. Biol. 374, 115–124 (2015).58. Kim, Y. J., Roh, M. & Son, S.-W. Network structures between strategies in iterated prisoners’ dilemma games. J. Korean Phys. Soc. 64,
341–345 (2014).59. Imhof, L. A., Fudenberg, D. & Nowak, M. A. Evolutionary cycles of cooperation and defection. Proc. Natl. Acad. Sci. USA 102,
10797–10800 (2005).60. Nowak, M. A. & Sigmund, K. The evolution of stochastic strategies in the prisoner’s dilemma. Acta Appl. Math. 20, 247–265 (1990).61. Grujić , J., Cuesta, J. A. & Sánchez, A. On the coexistence of cooperators, defectors and conditional cooperators in the multiplayer
iterated prisoner’s dilemma. J. Theor. Biol. 300, 299–308 (2012).62. Hilbe, C., Nowak, M. A. & Traulsen, A. Adaptive dynamics of exortion and compliance. Plos One 8, e77886 (2013).63. Dong, Y., Li, C., Tao, Y. & Zhang, B. Evolution of conformity in social dilemmas. Plos One 10, e0137435 (2015).64. Imhof, L. A., Fudenberg, D. & Nowak, M. A. Tit-for-tat or win-stay, lose-shift? J. Theor. Biol. 247, 574–580 (2007).65. Akin, E. Stable cooperative solutions for the iterated prisoner’s dilemma (2013). arXiv:1211.0969v2.66. Hilbe, C., Traulsen, A. & Sigmund, K. Partners or rivals? strategies for the iterated prisoner’s dilemma. Game Econ. Behav. 92, 41–52
(2015).67. García, J. & van Veelen, M. In and out of equilibrium I: evolution of strategies in repeated games with discounting. J. Econ. Theory
161, 161–189 (2016).68. van Segbroeck, S., Pacheco, J. M., Lenaerts, T. & Santos, F. C. Emergence of fairness in repeated group interactions. Phys. Rev. Lett.
108, 158104 (2012).69. Hilbe, C., Nowak, M. A. & Sigmund, K. Evolution of extortion in iterated prisoner’s dilemma games. Proc. Natl. Acad. Sci. USA 110,
6913–6918 (2013).70. Szolnoki, A. & Perc, M. Evolution of extortion in structured populations. Phys. Rev. E 89, 022804 (2014).71. Stewart, A. J. & Plotkin, J. B. The evolvability of cooperation under local and non-local mutations. Games 6, 231–250 (2015).72. García, J. & Traulsen, A. The structure of mutations and the evolution of cooperation. Plos One 7, e35287 (2012).73. van den Berg, P. & Weissing, F. J. The importance of mechanisms for the evolution of cooperation. Proc. R. Soc. B 282, 20151382
(2015).74. Baek, S. K. & Kim, B. J. Intelligent tit-for-tat in memory-limited prisoner’s dilemma game. Phys. Rev. E 78, 011125 (2008).75. Boyd, R. & Lorberbaum, J. No pure strategy is evolutionary stable in the iterated prisoner’s dilemma game. Nature 327, 58–59
(1987).76. Newman, M. E. J. Computational Physics (CreateSpace Independent, United States, 2013).77. Press, W. H., Flannery, B. P., Teukolsky, S. A. & Vetterling, W. T. Numerical Recipes in C: The Art of Scientific Computing (Cambridge
University Press, New York, 1992), 2 edn.
AcknowledgementsS.K.B. gratefully acknowledge discussions with Su Do Yi. S.K.B. was supported by Basic Science Research Program through the National Research Foundation of Korea (NRF) funded by the Ministry of Science, ICT and Future Planning (NRF-2014R1A1A1003304). H.C.J. was supported by Basic Science Research Program through the National Research Foundation of Korea (NRF) funded by the Ministry of Education (2015R1D1A1A01058317). C.H. acknowledges generous funding from the Schrödinger scholarship of the Austrian Science Fund (FWF), J3475.
Author ContributionsH.-C.J. and M.A.N. designed the research, S.K.B. and C.H. performed the simulations and analysed the results. All authors wrote and reviewed the manuscript.
Additional InformationCompeting financial interests: The authors declare no competing financial interests.How to cite this article: Baek, S. K. et al. Comparing reactive and memory-one strategies of direct reciprocity. Sci. Rep. 6, 25676; doi: 10.1038/srep25676 (2016).
This work is licensed under a Creative Commons Attribution 4.0 International License. The images or other third party material in this article are included in the article’s Creative Commons license,
unless indicated otherwise in the credit line; if the material is not included under the Creative Commons license, users will need to obtain permission from the license holder to reproduce the material. To view a copy of this license, visit http://creativecommons.org/licenses/by/4.0/
Related Documents