1 Comparing Perceptions of Biotechnology in Fresh versus Processed Foods: A Cross-Cultural Study Hyeyoung Kim ([email protected]), Post-doctoral Associate Lisa House ([email protected] ), Professor Food and Resource Economics Department, University of Florida Selected Paper prepared for presentation at the Agricultural & Applied Economics Association’s 2013 AAEA & CAES Joint Annual Meeting, Washington, DC, August 4-6, 2013. Copyright 2013 by [Kim, H. & House, L.] All rights reserved. Readers may make verbatim copies of this document for non-commercial purposes by any means, provided that this copyright notice appears on all such copies.

Welcome message from author
This document is posted to help you gain knowledge. Please leave a comment to let me know what you think about it! Share it to your friends and learn new things together.
Transcript

1
Comparing Perceptions of Biotechnology in Fresh versus Processed Foods: A
Cross-Cultural Study
Hyeyoung Kim ([email protected]), Post-doctoral Associate
Lisa House ([email protected] ), Professor
Food and Resource Economics Department, University of Florida
Selected Paper prepared for presentation at the Agricultural & Applied Economics
Association’s 2013 AAEA & CAES Joint Annual Meeting, Washington, DC, August 4-6, 2013.
Copyright 2013 by [Kim, H. & House, L.] All rights reserved. Readers may make verbatim
copies of this document for non-commercial purposes by any means, provided that this copyright
notice appears on all such copies.

2
Comparing Perceptions of Biotechnology in Fresh versus Processed Foods: A
Cross-Cultural Study
Abstract
This study focused on investigating how respondents’ perceptions of biotechnology used in food
production differs depending on the level of product transformation (i.e. fresh versus processed
food). Using cluster analysis, respondents were clustered into two groups, genetically
engineered (GE) tolerant and GE sensitive, based on changes in their perceptions about fresh
apples and apple juice produced with and without biotechnology. Comparisons of respondents
from six countries were performed to measure relative attitudes about biotech food. In addition,
three types of positive information about biotechnology were tested in order to determine what
types of information influences respondents’ GE tolerance. Results indicate that respondents
were less likely to change their initial health perception for apple juice than for fresh apples
when produced from trees that were genetically modified. The residency effect was strong and
heterogeneous: respondents of Japan were much more sensitive than respondents of Spain and
the United States.
Key Words: Biotechnology, product transformation, apple, a cross-cultural study, cluster
analysis
3
Comparing Perceptions of Biotechnology in Fresh versus Processed Foods: A
Cross-Cultural Study
Introduction
Biotech crops have been adopted quickly in commercial usage, reaching 160 million
hectares in 2011 worldwide, up from 1.7 million hectares in 1996 (James, 2011). Although
uncertainty about the effects of biotech products on human health and moral/religious objections
remains for biotechnology, in some cases, it may be the only available solution to cure crop
diseases in agricultural production. However, industries hesitate to introduce biotechnology as
their solution because of concerns about losing consumer loyalty and market share.
Worldwide consumption of food products vary, including the degree to which foods
already produced with biotechnology are included. One factor includes the amount of processed
foods consumed. For example, in the United States, most processed food products would
contain at least some portion of biotech ingredients. Soybeans, corn, and canola seeds (three
crops frequently produced with biotechnology) are important sources of vegetable oil in the U.S.,
corn is a principal source of sweeteners, and corn and soybeans are significant sources of other
ingredients for processed foods (Rousu et al, 2007). In a report comparing total food
consumption (per pound capita) of packaged food and fresh food for several countries (New
York Times, 2010), consumers in France, the United States and Spain were found to consume
consumed over half of their food as packaged (i.e., most are processed).
Foods produced with biotechnology may be found more often in processed foods. One
reason for this may be that consumers could favor processed food made with biotechnology
compared to fresh foods, as it may be perceived as ‘farther’ from the modification or ‘less’
modified. Previous research on consumer willingness to accept biotech foods have investigated
various types of foods. In a study by Rousu et al (2007), participants lowered their rating of

4
genetic modification (GM)-labeled food items by 14% relative to the same non-GM food items.
The products evaluated included tortilla chips (highly processed foods), Russet potatoes (fresh),
and vegetable oil (minimal human health concern). Although, they included fresh and processed
products in the experiment, the study was limited to directly testing how consumer perception of
biotech food was altered according to how the product was utilized.
This study aims to develop an understanding of the factors influencing consumers’
preferences for food products produced with biotechnology, with a special focus on comparing
perceptions between fresh and processed products. Additionally in light of the growing
importance of international trade, the survey was conducted in five international markets
(Belgium, France, Germany, Japan, and Spain) as well as the United States. In a manner similar
to previous studies, information on the potential benefits of biotechnology was given to test
response to different reasons for use of the technology.
This study adds to the literature comparing acceptance in different U.S. export markets,
including Japan. Additionally, the focus on consumer attitudes based on the level of product
transformation may provide further input to producer and scientist decisions to invest in
biotechnology. Finally, in addition to using the typical reasons for biotechnology (environmental
benefit and consumer benefits), a benefit focusing on using biotechnology to aid farmers fighting
a significant disease will provide input to industries faced with this major decision.
Previous Research
Previous studies found European consumers have higher valuations for non-GM food
than do U.S. consumers (Gaskell et al, 1999; Lusk et al, 2005; Lusk et al., 2006). Lusk et al
(2005) conducted a meta-analysis showing that European consumers have 29% higher valuations
for non-biotech food than U.S consumers. Lusk et al (2006) employed quantile regression to
evaluate the difference between consumers’ conceptions of biotechnology in the EU and the
5
United States. They found that U.S. consumers WTA biotech food was twice that of British and
French consumers at the median level of compensation. The lower the level of perceived risk
and the higher the perceived benefit, the lower the compensation demanded. Gaskell et al. (1999)
tried to explain why people in the U.S. are less troubled by biotech food than Europeans by
examining the different public perceptions of biotechnology. They found that the increasing
amount of press coverage of technological controversies is associated with negative public
perceptions in both countries.
In one of few studies on Japanese consumers, McCluskey et al (2003) conducted in-
person interviews to measure consumers WTA biotech noodles versus non-biotech noodles using
the contingent valuation method (CVM) in Japan. They found that 80% of Japanese consumers
would not choose the biotech noodles over non-biotech noodles for discount ranges of 5% to 50%
and the required discount to be WTA was high (more than 50%). In the regression, cognitive
variables such as food safety, environment attitudes, subjective knowledge and perceived risk
and socio-economics such as income and education were significant in increasing the WTA
compensation for choosing GM foods.
In addition to differences between countries, information has been found to impact
willingness to accept biotech foods. Lusk et al (2004) conducted an experimental auction to
determine what types of information on the benefits of biotechnology affect consumer
acceptance of biotech food in Europe and the United States. WTA was measured before and
after providing consumers with three types of positive information: environment benefits, health
benefits, and benefits to the developing world. Environmental benefits had a significant
influence on WTA bids. In particular, people in the U.S. were influenced by the environmental
information while people in the EU tended to be affected more by the health information. In

6
addition, individuals with more subjective knowledge were less influenced by new positive
information as they placed greater weight on their prior information. Rousu and Lusk (2009)
expanded the finding of Lusk et al (2004) to evaluate the information. The results showed that
the value of information was largest for health benefits, then for benefits to the developing world.
Environmental benefits were third. Consumers who received the higher valued information were
less likely to switch their decision to purchase. That is, consumers who received the health
information were least likely to switch to the GM cookie after receiving the information. As the
impact of information may be affected by prior knowledge, House et al (2004) investigated the
effect of individual subjective and objective knowledge on willingness to consume biotech food
for European and U.S. consumers using the same data from Lusk et al (2004). The study found
that subjective knowledge was a significant determinant to eating biotech food but objective
knowledge was not, calling into question the potential impact of educational programs on
acceptance. However, as there was slight correlation between objective and subjective
knowledge, increased objective knowledge could still increase biotech food acceptance.
Rousu et al (2007) verified the different impact of negative (environmental group
perspectives), positive (biotech industry perspectives), and verifiable information (independent,
third-party perspectives) on changing of consumers’ WTP for three biotech products: tortilla
chips, Russet potatoes and vegetable oil. Even though consumers were generally influenced
more by negative information than positive information, consumers who had both anti-biotech
and verifiable information discounted biotech food less than those who had only anti-biotech
information.
This study seeks to fill the gaps by investigating consumer perception of biotechnology at
different stages of food processing, as well as investigating acceptance in multiple countries.
7
Given the time between previous studies comparing acceptance across countries, this research
also allows us to see if changes have occurred as biotechnology has existed in the markets for a
longer time.
Data and Survey Design
An online survey was conducted in five international markets, as well as the United
States, in June, 2012. Four European countries were selected based on their level of acceptance
of buying biotech food; Germany and France were categorized as high-rejection of biotech food
while Spain and Belgium were categorized as low-rejection of biotech food (Gaskell et al, 2006).
In addition, we included Japan due to its importance as a market for U.S. agricultural exports. A
random sample of 1,610 consumers was recruited through a survey panel to complete an online
survey: 399 individuals in Japan, 408 individuals in Germany and France, 406 individuals in
Spain and Belgium, and 397 individuals in the U.S.
To compare consumers attitude changes toward foods produced with/without
biotechnology and to determine if perceptions differ based on whether the product is fresh or
processed, participants were asked a series of questions about a variety of products. The
questionnaire was designed to understand consumers’ perception of biotech food as well as
measure the knowledge and attitudes of individuals toward biotechnology in food production.
To obtain a base measurement of health perceptions, consumers were asked to rate how much
they agreed or disagreed that fresh apples/apple juice are healthy with semantic differential (1 is
strongly disagree and 7 is strongly agree). Another question using the same format asks about
apples from a tree that was genetically modified and juice from apples from a tree that was
genetically modified.
Consumers’ knowledge of biotech food was measured using both subjective and
objective methods. Subjective knowledge was measured by respondents’ self-reported
8
knowledge about issues related to biotechnology in food production using a 9-point scale (1 is
not at all knowledgeable and 9 is extremely knowledgeable). Consumers’ objective knowledge
was measured using ten true/false questions. The appendix includes specific questions and
correctly answered percentages for each question.
To measure a respondent’s perceived risk and moral concerns toward biotechnology,
participants were asked to indicate their level of agreement with ten statements (see appendix).
Four statements measured attitudes of biotech benefits, while the rest of the statements expressed
to measure perceived risk about uncertain effects and moral concerns. To reduce the number of
variables in a regression analysis, factor analysis was performed for the statements. Participants
were also asked their opinion regarding the acceptability of varying reasons biotechnology is
used in agricultural production using a scale 1 to 7 (1 is strongly disagree and 7 is strongly agree):
to reduce pesticides, to prolong shelf-life of food, to improve farmers’ profits, to alleviate world
poverty, and to protect plants from a specific disease that threatens future production of that plant.
As indicators of respondents’ lifestyle related to biotechnology, we asked respondents to
indicate their purchase behaviors for organic food and their levels of religious involvement. We
expected that individuals who always purchase organic food or who are involved religion may be
sensitive to biotechnology. In addition, this study included respondents’ socio-economic
characteristics of age, gender, income, education and presence of children.
Information treatment
Survey participants were provided with explanations of different benefits of biotech
production, including benefits for consumers by improving food quality, for the environment by
reducing the usage of pesticide, and for producers to maintain production when faced with a
disease that threatens production. Consumers were randomly assigned to one of four

9
experimental groups, including one group that was not given any information (control group).
The specific information is as follow:
Fresher foods: In the case of biotechnology, the apple has a special protein, which
increases the shelf life of the apple. Because of this method, the apple will stay
fresher longer and it is less likely to have bruises (soft brown spots).
Protection of the environment: In the case of biotechnology, the apple has a special
protein, which makes it resistant to certain insects. This allows the farmer to use less
pesticide when producing the apple. Reducing the use of pesticides is good for the
environment.
Disease control: There is currently an insect that transmits a disease in apples. This
disease causes the apple tree to produce less, or in extreme cases, die. In the case of
biotechnology, the apple has a special protein, which makes it resistant to this insect.
This will allow apple farmers to stay in business, and keep apple prices from
increasing over time.
Respondents were asked to answer a question in order to confirm whether respondents
carefully read the information or not after reading the information. Respondents who correctly
answered the question were only included in this study. Approximately 90% of respondents
provided correct answers.
Research Methodology
Factor analysis
Factor analysis was conducted to narrow down the number of variables regarding to
consumers’ perceived risk and moral concerns toward biotechnology. An exploratory factor
analysis was applied to ten statements measured with a five-point Likert scale. The data proved
suitable for factor analysis, with Kaiser’s measure of sampling adequacy reaching 0.85. A
principle component analysis (PCA) was used to extract the number of factors and then Varimax
rotation was applied. Three factors were derived by the Eigenvalues larger than 1 criterion.
Consumer segmentation
Focused on participants who initially indicated health perceptions of fresh apples and
apple juice, the study segmented markets by the genetically engineered (GE) tolerant group and
GE sensitive group using cluster analysis. Even though recent consumer segmentation studies
10
divided more than two categorical GM consumers (Barker and Burnham, 2001; Gaskell et al.,
2004; Zhang et al., 2010), this study used two segmentations based on the clustering method.
Cluster analysis is a statistical technique used to classify sets of observation into relatively
homogenous groups. Using cluster analysis, market segments were developed based on the
respondents’ changed perceptions on how healthy apples or apple juice where once they were
told apples and juice were from trees that were genetically modified. In the first procedure,
Ward’s minimum variance model was conducted to determine the number of clusters. From a
tree diagram, two clusters were found in both the fresh apple and apple juice models.
Accordingly, K-means cluster procedures were applied by taking the cluster seeds generated
from the Ward’s method. This method attempts to minimize the sum of squares of any two
clusters that can be formed at each step.
Socioeconomic (age, education, race, gender, income, and education) and psychographic
variables (lifestyles, personality characteristics, and social class) are two of the most common
bases for market segmentation. In order to better understand and profile the two clusters,
ANOVA tests were used to relate the mean values of the two clusters. The ANOVA tests were
also conducted for country comparisons and product comparisons. The Tukey test was used for
multiple comparisons. In addition, the binomial probit model was used to better understand
consumers’ characteristics and attitudes influencing the different perception changes between the
two clusters.
Results
Health Perceptions of fresh apples and apple juice
Consumer health perceptions across multiple countries for fresh apples and apple juice
are shown in Table 1. Overall, average total scores for fresh apples and apple juice are 5.6 and
5.2 (7 is the highest point), respectively. This is significantly different at the 5% level, indicating

11
that consumers perceived fresh apples as healthier than apple juice. Looking at individual
countries, the average scores in France and Spain between fresh apples and apple juice were not
statistically different. An F-test was conducted to test equal average scores across countries. All
average scores across all countries significantly differed at the 5% level for fresh apples and
apple juice with/without the information that the tree was genetically modified. Consumers in
Spain perceived fresh apples and apple juice as the healthiest, followed by consumers in the
United States.
Overall, 82% and 71% of participants, respectively, perceived fresh apples and apple
juice as being healthy. However, the rating for fresh apples and apple juice made using apples
from a tree that was genetically modified considerably decreased, down to 32% for both products.
A t-test was conducted to test if the decrease in perception was significantly different for apples
and juice from GM trees. The result showed that respondents’ perception for fresh apples was
significantly decreased compared to apple juice at 1% level indicating that the fact the apples and
juice were from GM trees differently influenced respondents’ perception depending on the level
of product transformation. As expected, there was a stronger impact on fresh apples.
Comparing across countries, pair-wise comparisons indicate that Spain and the U.S. have
homogenous groups for rating fresh apples and apple juice from GM trees, from which, the
proportion of respondents who maintained a healthy perception was relatively high at
approximately 49% for fresh apples and 45% for apple juice. In France, Germany and Japan,
respondents (52% for fresh apples and 43% for apple juice) switched their initial healthy
perception to unhealthy or neutral when the tree was genetically modified. However, the
difference of average ratings between fresh apples and apple juice from GM trees was not
significant.

12
For the rest of the study, we focus on the consumers who initially had healthy perceptions
of fresh apples and/or apple juice and investigate in-depth what characteristics are different and
what information may prevent respondents from experiencing a change to their initial perception.
Table 1. Healthy perceptions of fresh apples and apple juice by country
Fresh apple Apple juice
NO GE GE APPLE TREE NO GE GE APPLE TREE
Unhea
lthy
Neut
ral
Heal
thy Ave.
score
Unhea
lthy
Neut
ral
Heal
thy Ave.
score
Unhea
lthy
Neutra
l
Health
y Ave.
score
Unhealt
hy
Neutr
al
Healt
hy Ave.
score
N 1-3 4 5-7 1-3 4 5-7 1-3 4 5-7 1-3 4 5-7
% % % %
BE 167 6.0 10.8 83.2 5.5 a
H 38.9 29.3 31.7 3.9 a 11.4 20.4 68.3 5.1
a I 40.1 29.9 29.9 3.7
a
FR 194 9.8 11.9 78.4 5.4 a
H 49.5 27.8 22.7 3.3 a 11.3 17.0 71.6 5.2
a H 49.0 26.3 24.7 3.3
a
DE 180 8.3 26.7 65.0 5.3 a
H 47.8 31.1 21.1 3.3 a 11.7 31.7 56.7 4.9
a I 50.0 30.6 19.5 3.3
a
JP 332 6.3 16.6 77.1 5.3a
H 35.8 43.7 20.5 3.8 a
5.1 27.4 67.5 5.0 a
I 36.7 41.0 22.3 3.8 a
ES 182 3.3 7.7 89.0 5.9 b
H 22.5 26.9 50.6 4.5 b 5.5 8.2 86.3 5.8
b H 24.2 27.5 48.4 4.4
b
US 376 2.1 6.4 91.5 5.9 b
H 25.0 27.7 47.3 4.3 b 9.6 16.0 74.5 5.2
a I 27.4 30.1 42.6 4.2
b
Total 1431 5.5 12.7 81.8 5.6**
H 35.0 31.9 33.1 3.9**
8.7 20.3 71.0 5.2**
I 36.4 31.8 31.8 3.8**
a and b different superscripts in the same column indicate significant differences among countries at p<0.05.
H and I different subscripts in the same raw indicate significant differences between fresh apples and apple juice at
p<0.05.
** indicates that average score differences across countries are significant at the 0.05 level.
Cross country comparisons
Average perceptions and respondents’ characteristics for respondents who initially
indicated a healthy perception of fresh apples and/or apple juice are shown in Table 2. ANOVA
tests were conducted to test equal means across countries and the Tukey test was used for
multiple comparisons. As expected, average scores of perception are slightly higher than total
sample averages due to the elimination of respondents who rated fresh apples and/or apple juice
as neutral and unhealthy.
Socio-economic characteristics varied across countries except for gender distribution.
Average ages of respondents were between 35 and 54 years old. Respondents from the U. S. and
Belgium were slightly older. Respondents in France and Spain were more likely to indicate that
they graduated from a university. Respondents in Japan showed the highest average household
13
income among countries, while respondents in France and Spain indicated the lowest average
household income level. Although we measured household income based on the U.S. dollar
(directly converting using the exchange rate), it is difficult to compare between countries as this
does not account for differences in purchasing power. Respondents in the U.S. indicated
relatively low rates of children present in their households compared to respondents from other
countries.
Respondents self-reported knowledge levels regarding biotechnology issues varied over
countries. Respondents in Germany, Japan and Spain indicated relatively high subjective
knowledge levels compared to France, Belgium and the United States. With regards to objective
knowledge, respondents in Japan obtained the highest average score followed by respondents in
Germany. That is, Japanese consumers correctly answered over six out of ten questions
regarding biotechnology issues, while respondents in the U.S. obtained the lowest average scores
for the quiz (5.1 correct on average).
Purchases of organic foods and involvement in religion were included to capture attitudes
that might correlate with opinions related to biotechnology. Respondents in Germany purchased
organic food most frequently, with 25% indicating they always purchase organics. This was
followed by France (9.5%), Japan (8.2%) and the U.S. (6.3%). Approximately 50% of U.S.
respondents indicated that they were strongly or somewhat involved in religion, followed by
Spain (25.3%), Germany (20.5%), France (18.4%), Belgium (15.3%) and Japan (5.4%).
Perceived risk and moral concerns were measured using ten statements (appendix). The
statements measuring moral concerns indicated that respondents in Germany, Japan and France
were inclined to have a greater degree of concern compared to respondents from the U.S., Spain
and Belgium. This is somewhat interesting in that higher proportions of respondents in the U.S.

14
and Spain felt closely associated with religion, but this did not translate to moral concerns for
biotechnology. The four statements measuring perceived risk indicated that respondents in Spain
and the U.S. perceived relatively low risk, while respondents in Germany and France perceived
relatively high risk in biotechnology. Generally, respondents in Spain and the U.S. showed
optimistic attitudes of biotech benefits, while respondents in Germany and France were cynical.
Table 2. Comparison of descriptive statistics for respondents initially presented health perception
Belgium France Germany Japan Spain U.S F-value
Average ratings Apples 5.9b 5.9
b 6.1
b 5.6
a 6.1
b 6.1
b 14.9
**
Apples from GM tree 4.1cd
3.6b 3.4
b 3.8
bd 4.6
a 4.4
ac 16.6
**
Apple juice 5.4bc
5.7ab
5.6bc
5.3c 6.0
a 5.4
bc 10.3
**
Apple juice from GM tree 3.9bc
3.6cd
3.3d 3.8
c 4.6
a 4.2
ab 13.7
**
Demographics Age 4.4ab
4.3ab
4.1b 4.3
b 4.1
b 4.6
a 5.2
**
Male 0.5a 0.5
a 0.5
a 0.5
a 0.5
a 0.5
b 0.3
Education 3.8a 4.0
a 3.5
b 3.7
b 4.1
a 3.6
b 10.7
**
Income 8.5d 7.6
c 9.5
a 11.3
b 7.8
cd 9.5
a 83.8
**
Presence of children 0.5a 0.5
a 0.5
a 0.5
a 0.6
a 0.4
b 5.7
**
Lifestyle Organic purchasers 0.0a 0.1
a 0.3
b 0.1
a 0.0
a 0.1
b 11.4
**
Involved in religion 0.2ab
0.2b 0.2
b 0.1
a 0.3
b 0.5
c 41.7
**
Knowledge Subjective knowledge 3.9d 4.1
cd 5.5
a 4.7
b 4.7
bc 4.1
cd 12.4
**
Objective knowledge 60ac
58ac
59ac
65a 56
bc 51
b 11.2
**
GE attitudes Man has no right 3.7b 3.8
a 4.0
a 3.9
a 3.3
b 3.2
b 20.7
**
No increase food supply 2.9ab
3.0a 3.5
c 2.8
ab 2.6
b 2.7
b 13.6
**
BEN to developing world 3.2b 3.0
b 2.9
b 3.1
b 3.5
a 3.5
a 10.2
**
Only benefit large firm 3.7cd
4.0de
4.2e 3.3
ab 3.6
bc 3.1
a 29.8
**
Help human health 2.9bd
2.6cd
2.5c 3.0
b 3.3
a 3.0
b 13.2
**
Reduce production cost 3.2b 3.3
b 3.0
b 3.2
b 3.7
a 3.3
b 7.6
**
Super-weeds 3.5bc
3.8ab
4.0a 3.6
b 3.3
c 3.4
c 12.6
**
Right to alter 2.3cd
2.1c 2.3
cd 2.5
bd 2.7
ab 2.8
a 11.8
**
Concern long term effect 4.0ab
4.2ab
4.3a 4.0
b 4.0
ab 4.1
ab 2.6
**
Little danger 2.6ab
2.3b 2.4
b 2.5
b 2.9
a 2.7
a 8.0
**
Reasons to use GE Reduce pesticide 5.5ab
5.0 d 4.3
c 5.0
d 5.6
a 5.2
bd 13.6
**
Increase food supply 5.0ad
4.6cd
4.2c 5.2
ab 5.5
a 5.0
bd 11.4
**
Improve farm profit 4.2b 3.6
c 3.4
c 4.2
b 4.9
a 4.5
b 17.5
**
Cure disease 5.3ab
4.9b 4.2
c 4.9
b 5.6
a 4.9
b 12.0
**
Shelf-life of food 4.3bc
4.0cd
3.5ad
3.9 cd
3.2a 4.5
b 14.8
**
a, b, c, d and e different superscripts in the same row indicate significant differences among
countries at p<0.05.
** indicates that average score differences across countries are significant at the 0.05 level.
Consumers’ attitudes toward using biotechnology in agricultural production were
measured based on five different statements. Respondents in six countries all gave the highest
score for reducing the use of pesticides in food production followed by protecting plants from a
15
specific disease that threatens future production of that plant and to contribute to the alleviation
of poverty and hunger by increasing the food supply world-wide. In particular, respondents in
Spain and Belgium showed relatively higher emphasis on the value reducing pesticides. In other
words, most international consumers seemed to prefer biotechnology if it contributes to
environmental and food security compared to more consumer related reasons.
Factor analysis for biotechnology attitudes
A factor analysis was used for the ten statements asking about respondents’ attitudes
toward biotechnology to identify a relatively small number of factors that can be used in further
analysis. Kaiser-Meyer-Olkin (KMO)’s measure of sampling adequacy was used to identify the
appropriateness of the factor analysis for the ten statements. The overall KMO was 0.85 which
is a strong result or a sampling adequacy measurement.
Principal component analysis was used to identify the number of factors by applying a
Varimax rotation. Using the criteria above 1 eigenvalue, three factors were derived which
explained 63% of the total variance. The rotated factor loadings of the ten statements are
presented in Table 3. Since factor loadings express the correlation between the original
statements and the derived three factors, a higher loading indicates a higher correlation to the
factors. The first factor is named “Optimism” because statements with high loadings in the first
factor addressed bright benefit of biotechnology to the developing world, human health, and
farmers. Also, the optimistic factor covers low perceived risk and moral concerns. Since
statements in the second factor express high perceived risk and moral concerns for using
biotechnology, the second factor is named “Skeptic”. The last factor is named “Cynic” as the
statement relates consumer cynicism about the potential contribution of biotechnology in
increasing food supply.

16
Table 3. Rotated factor loadings about biotechnology attitudes for three factors
Factor1:
Optimism
Factor2:
Skeptic
Factor3:
Cynic Biotechnology will lead to a reduction in farmers’ production costs. 0.69 0.05 -0.16 People in the developing world will benefit from biotechnology. 0.68 -0.14 -0.30
Biotechnology will help promote human health. 0.66 -0.33 -0.13
There is little danger that biotechnology will result in new diseases. 0.57 -0.41 0.12 Man has every right to alter plants and animals genetically for economic reasons. 0.57 -0.41 -0.01
I am concerned about the lack of knowledge of long-term effects of biotechnology
on human health. -0.07 0.71 0.05
The release of genetically modified organisms into the environment will result in
dangerous mutations and “super-weeds” that cannot be killed by conventional
herbicides.
-0.22 0.63 0.19
Man has no right to “play God” with nature. -0.23 0.50 0.25
Only large multinational corporations will benefit from the biotechnology
revolution. -0.10 0.40 0.32
The world’s food supply will not be increased through the use of biotechnology. -0.14 0.19 0.75
Consumer segmentations
To identify consumer segments based on respondents changed health perceptions of fresh
apples and apple juice, a two-step cluster approach (Ward’s method and K-means cluster
analysis) was conducted. Two clusters were identified and the number of cases in each cluster
by country is shown in Table 4. The first cluster was named GE tolerant. These respondents
maintained their health perceptions or slightly changed their health perceptions to neutral when
informed that the apple trees were genetically modified. On average, 58% of total respondents
were segmented into this cluster. The second cluster was named GE sensitive. In this cluster,
respondents changed their health perception to unhealthy or neutral when informed that the apple
trees were genetically modified. On average, 42% of total respondents were segmented into a
GE sensitive cluster. A relatively high portion of respondents in Spain and the U.S. were
assigned into a GE tolerant cluster.
Table 4. Percentage of cases in each cluster
Products Cluster names Belgium France Germany Japan Spain U.S Total
Percentages (%)
Fresh apples GE tolerant 55 48 42 48 75 68 58
GE sensitive 45 52 58 52 25 32 42
Apple juice GE tolerant 61 50 39 43 74 66 57
GE sensitive 39 50 61 57 26 34 43
17
Respondents’ characteristics and attitudes toward biotechnology were compared by
cluster as shown in Table 5. As expected, respondents in the GE sensitive cluster rated
significantly lower for health perceptions of fresh apples and apple juice regardless of presenting
the information about GE treatments to the apple trees, but the gap is larger with the information.
Gender and education characteristics were significantly different between clusters. Male and
higher educated respondents were more frequently part of the GE tolerant cluster. Respondents’
purchasing behaviors with regard to organic food and religious involvement were not
significantly different between clusters. Objective knowledge was significantly different
between clusters for both fresh apples and apple juice: respondents in the GE tolerant cluster
were more knowledgeable. Subjective knowledge was only significantly different between
clusters in apple juice.
Respondents in the GE tolerant cluster have positive scores in the optimism factor and
negative scores in factors skeptic and cynic. This indicated that respondents in the GE tolerant
cluster were aware of the benefits of biotechnology in reducing farmers’ production costs, their
benefit to people in the developing world, and in promoting human health. On the other hand,
respondents in the GE sensitive cluster have opposite signs of the factors. That is, respondents in
the GE sensitive cluster were worried about the uncertain effects of biotechnology on human
health and the environment, as well as pessimistic of the potential for biotechnology to increase
food supply. Not surprisingly, respondents in the GE tolerant cluster showed higher average
scores than the GE sensitive cluster for the statements asking about attitudes toward reasons to
use biotechnology in agricultural productions.
18
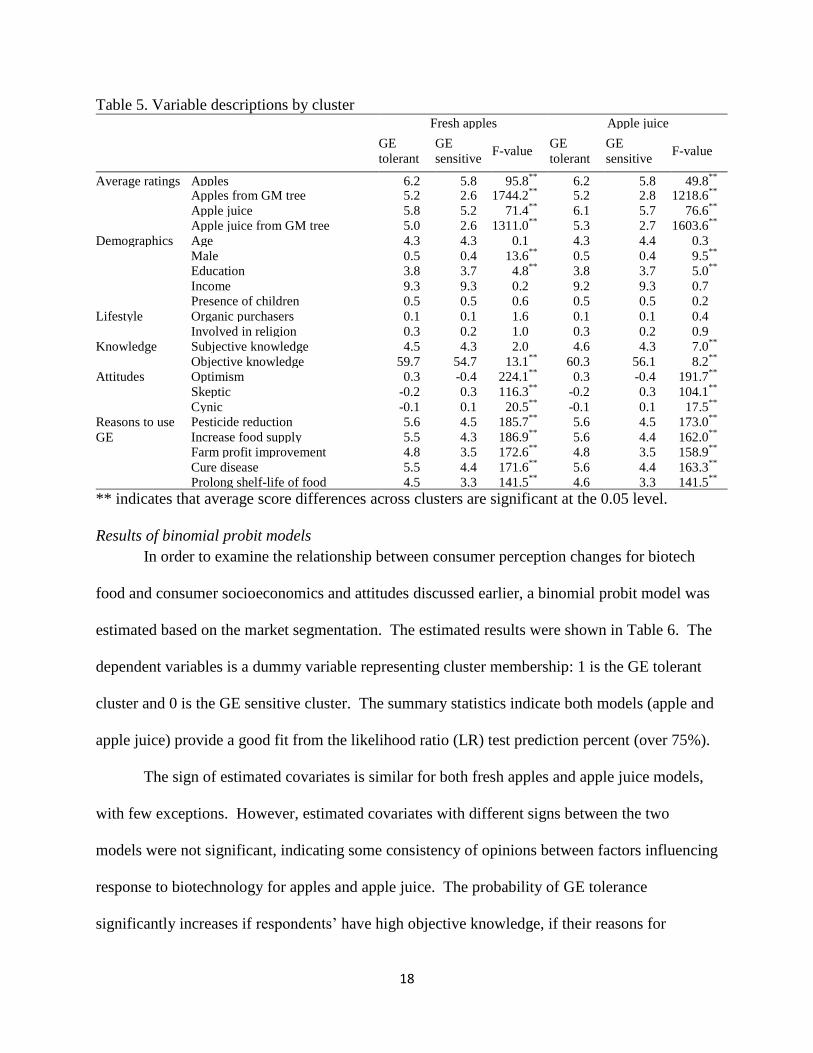
Table 5. Variable descriptions by cluster
Fresh apples Apple juice
GE
tolerant
GE
sensitive F-value
GE
tolerant
GE
sensitive F-value
Average ratings Apples 6.2 5.8 95.8**
6.2 5.8 49.8**
Apples from GM tree 5.2 2.6 1744.2
** 5.2 2.8 1218.6
**
Apple juice 5.8 5.2 71.4**
6.1 5.7 76.6**
Apple juice from GM tree 5.0 2.6 1311.0
** 5.3 2.7 1603.6
**
Demographics Age 4.3 4.3 0.1 4.3 4.4 0.3
Male 0.5 0.4 13.6**
0.5 0.4 9.5**
Education 3.8 3.7 4.8
** 3.8 3.7 5.0
**
Income 9.3 9.3 0.2 9.2 9.3 0.7 Presence of children 0.5 0.5 0.6 0.5 0.5 0.2
Lifestyle Organic purchasers 0.1 0.1 1.6 0.1 0.1 0.4
Involved in religion 0.3 0.2 1.0 0.3 0.2 0.9 Knowledge Subjective knowledge 4.5 4.3 2.0 4.6 4.3 7.0
**
Objective knowledge 59.7 54.7 13.1**
60.3 56.1 8.2**
Attitudes Optimism 0.3 -0.4 224.1
** 0.3 -0.4 191.7
**
Skeptic -0.2 0.3 116.3**
-0.2 0.3 104.1**
Cynic -0.1 0.1 20.5**
-0.1 0.1 17.5**
Reasons to use
GE
Pesticide reduction 5.6 4.5 185.7**
5.6 4.5 173.0**
Increase food supply 5.5 4.3 186.9**
5.6 4.4 162.0**
Farm profit improvement 4.8 3.5 172.6
** 4.8 3.5 158.9
**
Cure disease 5.5 4.4 171.6**
5.6 4.4 163.3**
Prolong shelf-life of food 4.5 3.3 141.5
** 4.6 3.3 141.5
**
** indicates that average score differences across clusters are significant at the 0.05 level.
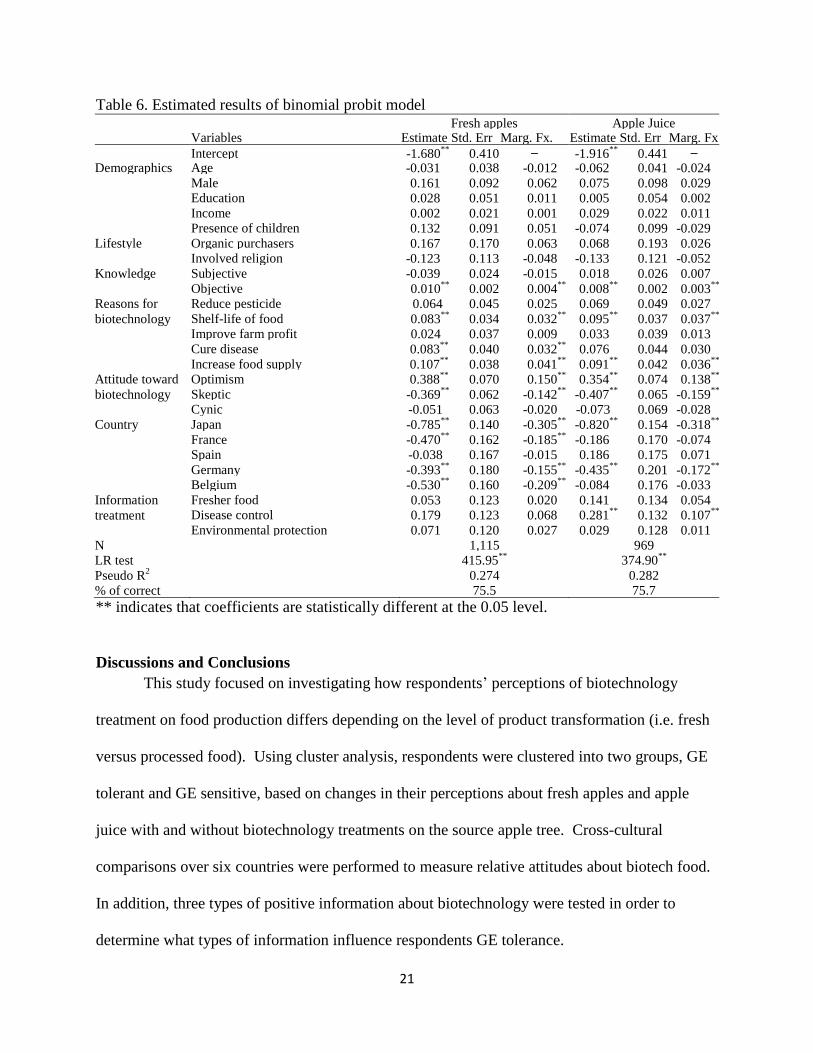
Results of binomial probit models
In order to examine the relationship between consumer perception changes for biotech
food and consumer socioeconomics and attitudes discussed earlier, a binomial probit model was
estimated based on the market segmentation. The estimated results were shown in Table 6. The
dependent variables is a dummy variable representing cluster membership: 1 is the GE tolerant
cluster and 0 is the GE sensitive cluster. The summary statistics indicate both models (apple and
apple juice) provide a good fit from the likelihood ratio (LR) test prediction percent (over 75%).
The sign of estimated covariates is similar for both fresh apples and apple juice models,
with few exceptions. However, estimated covariates with different signs between the two
models were not significant, indicating some consistency of opinions between factors influencing
response to biotechnology for apples and apple juice. The probability of GE tolerance
significantly increases if respondents’ have high objective knowledge, if their reasons for
19
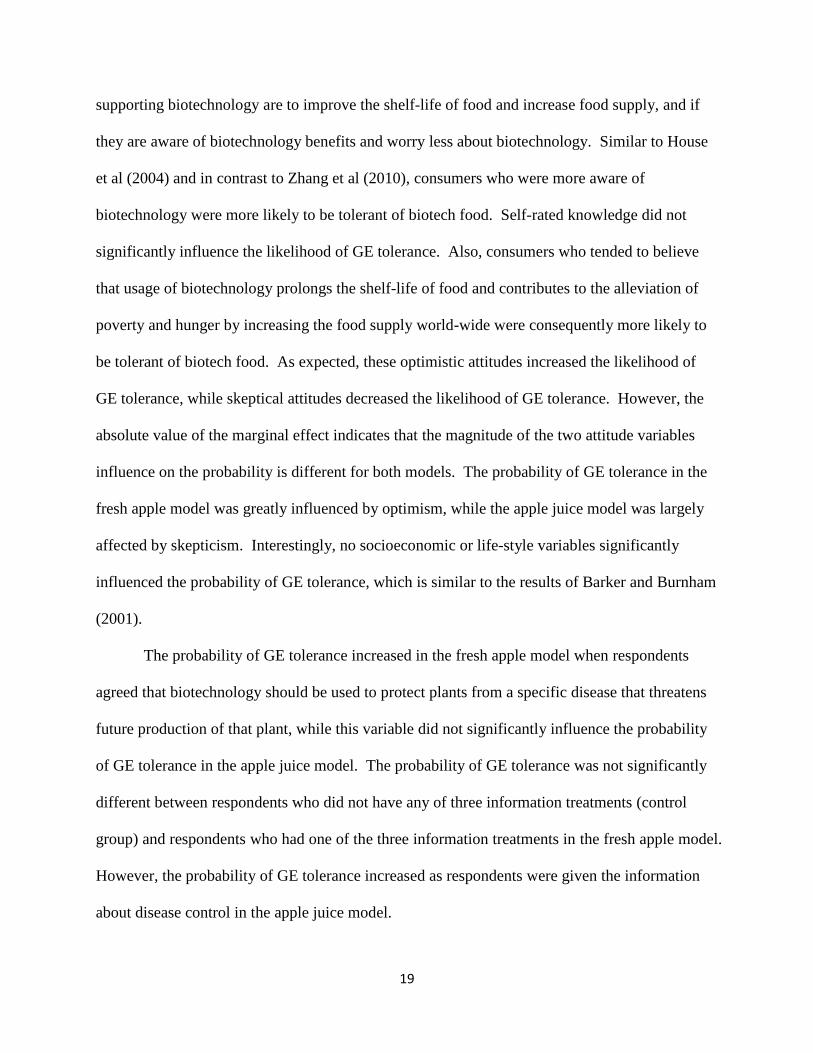
supporting biotechnology are to improve the shelf-life of food and increase food supply, and if
they are aware of biotechnology benefits and worry less about biotechnology. Similar to House
et al (2004) and in contrast to Zhang et al (2010), consumers who were more aware of
biotechnology were more likely to be tolerant of biotech food. Self-rated knowledge did not
significantly influence the likelihood of GE tolerance. Also, consumers who tended to believe
that usage of biotechnology prolongs the shelf-life of food and contributes to the alleviation of
poverty and hunger by increasing the food supply world-wide were consequently more likely to
be tolerant of biotech food. As expected, these optimistic attitudes increased the likelihood of
GE tolerance, while skeptical attitudes decreased the likelihood of GE tolerance. However, the
absolute value of the marginal effect indicates that the magnitude of the two attitude variables
influence on the probability is different for both models. The probability of GE tolerance in the
fresh apple model was greatly influenced by optimism, while the apple juice model was largely
affected by skepticism. Interestingly, no socioeconomic or life-style variables significantly
influenced the probability of GE tolerance, which is similar to the results of Barker and Burnham
(2001).
The probability of GE tolerance increased in the fresh apple model when respondents
agreed that biotechnology should be used to protect plants from a specific disease that threatens
future production of that plant, while this variable did not significantly influence the probability
of GE tolerance in the apple juice model. The probability of GE tolerance was not significantly
different between respondents who did not have any of three information treatments (control
group) and respondents who had one of the three information treatments in the fresh apple model.
However, the probability of GE tolerance increased as respondents were given the information
about disease control in the apple juice model.
20
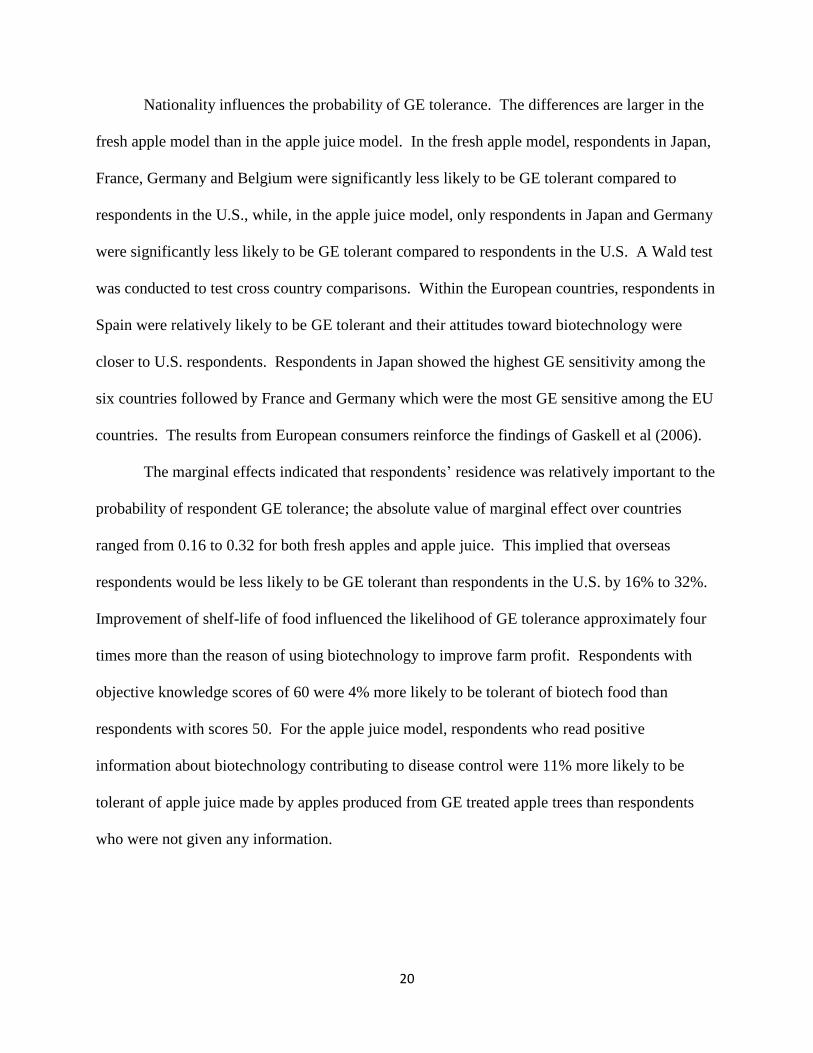
Nationality influences the probability of GE tolerance. The differences are larger in the
fresh apple model than in the apple juice model. In the fresh apple model, respondents in Japan,
France, Germany and Belgium were significantly less likely to be GE tolerant compared to
respondents in the U.S., while, in the apple juice model, only respondents in Japan and Germany
were significantly less likely to be GE tolerant compared to respondents in the U.S. A Wald test
was conducted to test cross country comparisons. Within the European countries, respondents in
Spain were relatively likely to be GE tolerant and their attitudes toward biotechnology were
closer to U.S. respondents. Respondents in Japan showed the highest GE sensitivity among the
six countries followed by France and Germany which were the most GE sensitive among the EU
countries. The results from European consumers reinforce the findings of Gaskell et al (2006).
The marginal effects indicated that respondents’ residence was relatively important to the
probability of respondent GE tolerance; the absolute value of marginal effect over countries
ranged from 0.16 to 0.32 for both fresh apples and apple juice. This implied that overseas
respondents would be less likely to be GE tolerant than respondents in the U.S. by 16% to 32%.
Improvement of shelf-life of food influenced the likelihood of GE tolerance approximately four
times more than the reason of using biotechnology to improve farm profit. Respondents with
objective knowledge scores of 60 were 4% more likely to be tolerant of biotech food than
respondents with scores 50. For the apple juice model, respondents who read positive
information about biotechnology contributing to disease control were 11% more likely to be
tolerant of apple juice made by apples produced from GE treated apple trees than respondents
who were not given any information.
21
Table 6. Estimated results of binomial probit model
Fresh apples Apple Juice
Variables Estimate Std. Err Marg. Fx. Estimate Std. Err Marg. Fx
Intercept -1.680**
0.410 -1.916**
0.441 Demographics Age -0.031 0.038 -0.012 -0.062 0.041 -0.024 Male 0.161 0.092 0.062 0.075 0.098 0.029 Education 0.028 0.051 0.011 0.005 0.054 0.002 Income 0.002 0.021 0.001 0.029 0.022 0.011 Presence of children 0.132 0.091 0.051 -0.074 0.099 -0.029 Lifestyle Organic purchasers 0.167 0.170 0.063 0.068 0.193 0.026 Involved religion -0.123 0.113 -0.048 -0.133 0.121 -0.052 Knowledge Subjective -0.039 0.024 -0.015 0.018 0.026 0.007 Objective 0.010
** 0.002 0.004
** 0.008
** 0.002 0.003
**
Reasons for
biotechnology
Reduce pesticide 0.064 0.045 0.025 0.069 0.049 0.027 Shelf-life of food 0.083
** 0.034 0.032
** 0.095
** 0.037 0.037
**
Improve farm profit 0.024 0.037 0.009 0.033 0.039 0.013 Cure disease 0.083
** 0.040 0.032
** 0.076 0.044 0.030
Increase food supply 0.107**
0.038 0.041**
0.091**
0.042 0.036**
Attitude toward
biotechnology
Optimism 0.388**
0.070 0.150**
0.354**
0.074 0.138**
Skeptic -0.369
** 0.062 -0.142
** -0.407
** 0.065 -0.159
**
Cynic -0.051 0.063 -0.020 -0.073 0.069 -0.028 Country Japan -0.785
** 0.140 -0.305
** -0.820
** 0.154 -0.318
**
France -0.470**
0.162 -0.185**
-0.186 0.170 -0.074 Spain -0.038 0.167 -0.015 0.186 0.175 0.071 Germany -0.393
** 0.180 -0.155
** -0.435
** 0.201 -0.172
**
Belgium -0.530**
0.160 -0.209**
-0.084 0.176 -0.033 Information
treatment
Fresher food 0.053 0.123 0.020 0.141 0.134 0.054 Disease control 0.179 0.123 0.068 0.281
** 0.132 0.107
**
Environmental protection 0.071 0.120 0.027 0.029 0.128 0.011 N 1,115 969 LR test 415.95
** 374.90
**
Pseudo R2 0.274 0.282
% of correct
predictions
75.5 75.7
** indicates that coefficients are statistically different at the 0.05 level.
Discussions and Conclusions
This study focused on investigating how respondents’ perceptions of biotechnology
treatment on food production differs depending on the level of product transformation (i.e. fresh
versus processed food). Using cluster analysis, respondents were clustered into two groups, GE
tolerant and GE sensitive, based on changes in their perceptions about fresh apples and apple
juice with and without biotechnology treatments on the source apple tree. Cross-cultural
comparisons over six countries were performed to measure relative attitudes about biotech food.
In addition, three types of positive information about biotechnology were tested in order to
determine what types of information influence respondents GE tolerance.

22
Prior to information on biotechnology, respondents showed significantly different
perceptions of fresh apples and apple juice; fresh apples were perceived as healthier than apple
juice. Approximately half of respondents’ initial perceptions of fresh apples and apple juice did
not change, but 54% (apples) and 48% (apple juice) decreased their opinion when the apple trees
were treated with biotechnology, indicating that biotechnology still negatively impacts
consumers’ food perceptions in many cases (only in 2% did perception increase). In particular,
the perception of how healthy apples were was more strongly impacted than apple juice.
Respondents who initially perceived fresh apples or apple juice as healthy were clustered
into two groups, GE tolerant and GE sensitive, based on perception changes. From the results of
the probit analysis, socioeconomic and life style variables were not significant in explaining the
segment to which a respondent belonged. Residency was a strong indicator of which segment
consumers belonged to. Residents of European countries were generally more sensitive than
residents of the U.S., which was a result similar to Lusk (2004). However, residents of Spain
were analogous in attitude to residents of the U.S., which may reflect that Spain is the biggest
adopter of genetically modified Maize in the EU (Gómez-Barbero, Berbel, and Rodríguez-
Cerezo, 2008). Residents of Japan indicated the strongest sensitivity to GE treatment with
Germany trailing far behind. Respondents’ objective knowledge was significant in explaining
the segment to which a consumer belonged but subjective knowledge was not. This result was
supported by the published finding that increased objective knowledge could increase biotech
food acceptance (House et al, 2004). We also found that respondents’ optimistic and skeptical
attitudes toward biotechnology were significant indicators of segment in both the fresh apple and
apple juice models. Considering the close relationship between inclination toward biotechnology

23
and residency, the findings broadly support that the segmentation is subject to the influence of
respondents’ surrounding environment rather than individuals’ socio-demographic characteristics.
The cluster to which a respondent belonged was affected differently by respondents’
reactions to new information about benefits to the disease control and agreement that plants
should be protected from disease. Even though the statements were not exactly same, both
statements supported the idea that biotechnology contributes to maintaining agricultural
production by protecting plants from a disease. Individuals’ self-agreement was not significant
in predicting the segment for apple juice but it was significant for fresh apples. New information
on disease control significantly increased the level of respondent segmentation for GE tolerance
of apple juice made by apples from GE treated apple trees. However, no positive benefits of
biotechnology explained the segmentation for fresh apples. That is, respondents’ perceptions
were relatively inflexible about fresh apples from GE treated apple trees, even when presented
with new information, while their personal agreement was significant. Overall, these results
suggest that consumer attitudes toward biotech food can be changed by positive information, but
the effect of information may vary depending on the type of product.
The results confirm the industry’s concerns that introducing biotechnology to solve a
specific disease may lead to perception changes. However, the results suggest that advertising
efforts by agribusiness to enlighten consumers about biotechnology’s importance to production
will alleviate strong resistance. Since the residency effect was strong and heterogeneous across
countries, different marketing approaches may be required for success in each market. Our
findings also suggest that introducing biotechnology for processed products will have relatively
less impact than on fresh products.

24
One limitation of this study is that the dependent variable is based on a rating of how
healthy a person believes a product to be. Future research that explores the impact of these
changes in perception on willingness to pay for products, again examining the difference based
on both level of product transformation and country of residence, would be of interest as well.
References
Barker, B. and Burnham, T.A. (2001) “Consumer response to genetically modified foods: market segment
analysis and implications for producers and policy makers” Journal of Agricultural and Resource
Economics 26(2):387-403.
Bureau of Labor Statistics (2008). U.S. Department of Commerce Industry Report: Food Manufacturing
NAICS 311. Bureau of Labor Statistics, Washington, DC. Available at:
http://trade.gov/td/ocg/report08_processedfoods.pdf. Accessed on: January 23, 2013
Gaskell, G., A. Allansdottir, et al. (2006). Europeans and Biotechnology in 2005: Patterns and Trends,
Eurobarometer 64.3.
Gaskell, G., N. Allum, et al. (2004). "GM foods and the misperception of risk perception." Risk Analysis
24(1): 185-194.
Gaskell, G., M.W. Bauer, J. Durant, and N.C. Allum (1999). "Worlds apart? The reception of genetically
modified foods in Europe and the U.S." Science 285: 384-387.
Gómez-Barbero, M., J. Berbel, and E. Rodríguez-Cerezo. (2008). “Bt corn in Spain- the performance of
the EU’s first GM crop”, Correspondence, Nature Biotechnology 26: 384-386.
James, C. (2011). Global status of commercialized biotech/GM crops: 2011, International Service for the
Acquisition of Agri-biotech Applications (ISAAA) Brief No. 43. ISAAA: Ithaca, NY. Available
at: http://www.isaaa.org/resources/publications/briefs/43/. Accessed on: January 23, 2013.
House, L., Lusk, J., Jaeger, S., Traill, W.B., Moore, M., Valli, C., Morrow, B., and Yee, W.M.S. (2004).
Objective and subjective knowledge: Impacts on consumer demand for genetically modified
foods in the United States and the European Union. AgBioForum, 7(3): 113-123.

25
Kipe, S. (2006). The world fresh fruit market. Foreign Agricultural Service, USDA, Washington DC.
Available at: http://www.fas.usda.gov/htp/hort_circular/2006/02-
06/world%20fresh%20fruit%20market%202004.pdf. Accessed on: January 23, 2013.
http://www.nytimes.com/imagepages/2010/04/04/business/04metrics_g.html?ref=business
Lusk, J. L., L.O. House, C. Valli, S.R. Jaeger, M. Moore, B. Morrow, and W.B. Traill (2004). "Effect of
information about benefits of biotechnology on consumer acceptance of genetically modified
food: Evidence from experimental auctions in United States, England, and France." European
Review of Agricultural Economics 31: 179-204.
Lusk, J. L., M. Jamal, L. Kurlander, M. Roucan, and L. Taulman (2005). "A meta-analysis of genetically
modified food valuation studies." Journal of Agricultural and Resource Economics 30: 28-44.
Lusk, J. L., W. B. Traill, et al. (2006). "Comparative advantage in demand: experimental evidence of
preferences for genetically modified food in the United States and European Union." Journal of
Agricultural Economics 57: 1-21.
McCluskey, J. J., K. M. Grimsrud, et al. (2003). "Consumer response to genetically modified food
products in Japan." Agricultural and Resource Economics Review 32(2): 222-231.
Rousu, M. C., and Lusk, J.L (2009). "Valuing information on GM foods in a WTA market: What
information is most valuable?" AgBioForum 12(2).
Rousu, M. C., Wallace E. Huffman, Jason F. Shogren, and Abebayehu Tegene (2007). "Effects and value
of verifiable information in a controversial market: Evidence from lab auctions of genetically
modified food." Economic Inquiry 45: 409-432.
Zhang, X., Huang, J., Qiu, H. and Huang, Z. (2010) “A consumer segmentation study with regards to
genetically modified food in urban China” Food Policy 35:456-462

26
Appendix. Variable descriptions Variables Descriptions/Categories
Demographics
Age 1 if 18 to 19; 2 if 20 to 24; 3 if 25 to 34; 4 if 35 to 44; 5 if 45 to 54; 6 if 55 to 64; 7 if 65
years and over
Male 1 if male; 0 if female
Education 1 if primary school; 2 if secondary/high school; 3 if technical or associate or equivalent;
4 if university graduate; 5 if Post university/Masters, Ph.D.
Income
1 if less than $10k; 2 if $10k - 14,999; 3 if $15k- 19,999; 4 if $20k - 24,999; 5 if $25k -
29,999; 6 if $30k - 34,999; 7 if $35k - 39,999; 8 if $40k- 49,999; 9 if $50k-59,999; 10
of $60k-74,999; 11 if $75k-99,999; 12 if $100k-149,999; 13 if $150k - 199,999; 14 if
$200k or over
Presence of children 1 if a household has children under the age 18; 0 otherwise
Lifestyle
Organic purchasers 1 if individual always purchase organic food; 0 otherwise
Involved in religion 1 if individual is very or somewhat involved with his/her religion; 0 otherwise
Subjective knowledge:
How knowledgeable would you say you are about the
facts and issues related to biotechnology in food
production?
9 point scale (1 if not at all knowledgeable and 9 if
extremely knowledgeable)
Objective knowledge Scores correctly answered (0 to 100%)
By eating a genetically modified fruit, a person's genes could also become modified. (61.4% correct)
It is impossible to transfer animal genes into plants. (29.6% correct)
Genetically modified plants or animals are always bigger than ordinary ones. (49.2% correct)
Foods containing genetically modified ingredients are more likely to cause allergic reactions than foods which do
not include genetically modified ingredients. (26.3% correct)
Foods containing genetically modified ingredients are required by law to be labeled in our country. (61.2%
correct)
Yeast used to make beer contains living organisms. (79.7% correct)
All bacteria found in food is harmful.(83.9% correct)
We eat DNA every day. (64.1% correct)
To be healthy, food should be sterile before it is eaten. (56.9% correct)
Ordinary fruit does not contain genes but genetically modified fruit does. (53.0% correct)
Measuring biotechnology attitude 5 point scale (1 if SD and 5 if SA)
Man has no right to “play God” with nature. (Moral concerns)
The world’s food supply will not be increased through the use of biotechnology. (Benefit attitudes)
People in the developing world will benefit from biotechnology. (Benefit attitudes)
Only large multinational corporations will benefit from the biotechnology revolution. (Benefit attitudes)
Biotechnology will help promote human health. (Perceived risk)
Biotechnology will lead to a reduction in farmers’ production costs. (Benefit attitudes)
The release of genetically modified organisms into the environment will result in dangerous mutations and
“super-weeds” that cannot be killed by conventional herbicides. (Perceived risk and moral concerns)
Man has every right to alter plants and animals genetically for economic reasons. (Moral concerns)
I am concerned about the lack of knowledge of long-term effects of biotechnology on human health. (Perceived
risk)
There is little danger that biotechnology will result in new diseases. (Perceived risk)
Attitude for reasons of biotechnology 7 point scale (1 if SD and 7 if SA)
To reduce the use of pesticides or herbicides in food production.
To contribute to the alleviation of poverty and hunger by increasing the food supply world-wide.
To help to improve the profitability of farmers.
If it was the only way to protect plants from a specific disease that threatens future production of that plant.
To prolong shelf-life of food.
Measuring healthy perception 7 point scale (1 if SD and 7 if SA)
Apple/ Apple from GM tree/ Apple juice/ Apple juice from GM tree
1) SD means strongly disagree and SA means strongly agree.
Related Documents