Comparing linear and undulating periodisation for improving and maintaining muscular strength qualities in women This thesis is presented for the degree of Doctor of Philosophy of School of Human Movement and Exercise Science 2006 Lian-Yee Kok BEd (Phy. Ed.), MS (Sports Sc.) Supervisors: Dr David Bishop, PhD Dr Peter Hamer, PhD

Welcome message from author
This document is posted to help you gain knowledge. Please leave a comment to let me know what you think about it! Share it to your friends and learn new things together.
Transcript
Comparing linear and undulating
periodisation for improving and maintaining
muscular strength qualities in women
This thesis is presented for the degree of
Doctor of Philosophy
of
School of Human Movement and Exercise Science
2006
Lian-Yee Kok BEd (Phy. Ed.), MS (Sports Sc.)
Supervisors: Dr David Bishop, PhD Dr Peter Hamer, PhD
i
Abstract
Resistance training is increasingly popular for improving strength qualities such
as hypertrophy, maximal strength, endurance and power. Although many resistance-
training programmes now adhere to the concept of periodisation, the number of studies
examining its structure and design are few, and there are just a handful of studies that
have examined periodised training for the maintenance of strength and power. Even
rarer, are periodised resistance-training studies that utilise female subjects.
Previous studies have compared non-periodised training regimens such as
Progressive Resistance Exercise (PRE), and the two main models of periodisation, Linear
Periodisation (LP) and Undulating Periodisation (UP). Results are inconclusive as to
whether the efficacy of the periodised training programmes were due to the manipulation
of training variables such as volume and intensity, or that training programmes with
higher doses of volume induced better training responses. However, to make effective
comparisons between training programmes, the training volume or workload (total load
lifted x total repetitions) and training intensity have to be equated between the groups
under examination. While the intensities (percentage of one-repetition maximum, 1 RM)
for improving strength qualities such as hypertrophy and maximal strength have general
consensus among resistance-training practitioners, there exists disagreement over the
intensity that should be used during the training of power. Thus, it is important to first
identify the load for power training before comparisons can be made between LP and UP
programmes using equal training volumes.
To examine some of the questions above, a study was first carried out to identify
the load(s) that optimise(s) average mechanical power output for women of different
strength abilities. The identified load(s) were then used in two studies to compare the
effects of LP and UP on untrained and moderately-trained women when total workload
and total average intensity were equalised at the end of the training period. The effects
of the two training programmes were assessed through measurements of isoinertial
maximum strength, changes in arm and thigh girths, changes in muscle cross-sectional
areas, average mechanical power outputs during the bench press throws and
countermovement jumps, and work and power during repeated sprints (cycle). The
same variables were also examined on trained women before and after a short,
periodised maintenance phase.
ii
Power was optimised at 60 % of 1 RM for the upper body and at 30 % of 1 RM
for the lower body for both strong and weaker women. Other loads however, also
produced similarly high power outputs. However, within the range of loads that
maximised power output, stronger and more powerful female subjects, and also stronger
and more powerful parts of the body within the same subjects, utilise lower percentages
of 1 RM to produce high power compared to less strong and less powerful subjects and
body parts. Women also seem to produce lower power outputs than men, but the
advantage men have becomes less apparent when power output scores are described
relative to body mass. Conflicting results with some previous studies made it safer and
more prudent for the researcher to utilise light loads of 30 and 40 % of 1 RM for power
training in the subsequent studies comparing LP and UP training.
The comparison of LP and UP training with equalised volume and intensity
suggest that both untrained and moderately-trained women found both LP and UP
programmes equally adept in improving strength qualities, and personal preference may
be used to decide which programme to initiate. Uncommon results include the
observations that muscle hypertrophic responses were larger and occurred earlier than
previously reported, and that non-projected, light-load, explosive training was capable
of bringing about small increases in strength and power. The final study found that
adhering to two UP maintenance training programmes with equalised volumes and
intensities twice a week increased upper-body strength and maintained lower-body
strength adequately across a 3-wk phase.
The results from these studies support previous results that suggest training
programmes with higher workloads and repetitions produce superior strength and power
adaptations, and it is not specifically the variation of training volume and intensity
within a periodised programme that improves strength qualities. Thus, both periodised
programmes used in this thesis can be recommended for untrained and moderately-
trained women as both LP and UP were found to be similarly effective for increasing
upper- and lower-body hypertrophy, strength and power.
iii
Table of Contents ABSTRACT…………………………….….………………………………………. i
TABLE OF CONTENTS…………….……………………………………………. iii
LIST OF FIGURES………………….…………………………………………..... viii
LIST OF TABLES…………………………………….…………………………... xiii
ACKNOWLEDGEMENTS……………………....……………………………….. xvi
CHAPTER 1. INTRODUCTION…………………………………...…………… 1-1
1.1 Introduction………………………………………………………………... 1-1
1.2 Statement Of The Problem………………………………………………… 1-2
1.3 Hypotheses………………………………………………………………… 1-3
1.4 Limitations And Delimitations…………………………………………….. 1-4
1.5 Significance Of The Studies In The Thesis………………………………... 1-5
CHAPTER 2. REVIEW OF LITERATURE…………………………………… 2-1
2.1 Definitions Of Strength Qualities………………………………………….. 2-1
2.2 Development Of Strength Qualities……………………………………….. 2-5
2.2.1 Development of strength Qualities Using Isoinertial Training….. 2-5
2.2.2 Training for Power………………………………………………. 2-6
2.2.3 Assessment of Strength Qualities………………………….…….. 2-11
2.3 Periodisation……………………………………………………………….. 2-14
2.3.1 Linear Periodisation………………………………...…………... 2-17
2.3.2 Undulating Periodisation……………………………………….. 2-23
2.3.3 Sex Issues in Periodisation…………………………….………… 2-29
2.3.4 Periodisation for Maintenance…………………..………………. 2-34
2.4 Direction Of Research……………………………………………………... 2-38
iv
CHAPTER 3. GENERAL MATERIALS AND METHODS…………………... 3-1
3.1 Introduction…………………………………………………………………. 3-1
3.2 Subjects……………………………………………………………..………. 3-1
3.3 Equipment…………………………………………………………..………. 3-1
3.3.1 Plyometric Power System (PPS)………………………………….. 3-1
3.3.1.1 Structure of the PPS……………………………..…… 3-1
3.3.1.2 Data collection and analysis…………………………. 3-3
3.3.1.3 Calibration of the PPS…………………..…………… 3-4
3.3.2 Toshiba Diagnostic Ultrasound Equipment……………………… 3-7
3.3.3 Other Test Equipment………………………..…………………… 3-7
3.3.4 Weight-Training Equipment……………………………………… 3-8
3.4 Familiarisation Procedure……………………………………………...…… 3-8
3.5 General Warm-up And Cool-Down Procedures……………………………. 3-9
3.6 Determination Of Hand, Foot And Body Positions………………………… 3-10
3.6.1 Determination of Upper-body Positions………………………….. 3-11
3.6.2 Determination of Lower-body Positions………………………….. 3-11
3.7 Testing Procedures………………………………………………………….. 3-12
3.7.1 Isoinertial One-Repetition Maximum (1 RM) Bench Press………. 3-12
3.7.2 Isoinertial One-Repetition Maximum (1 RM) Squat……………... 3-14
3.7.3 Isoinertial Bench Press Throw (BPT)…………………………….. 3-15
3.7.4 Isoinertial Countermovement Jump (CMJ)………………………. 3-17
3.7.5 Ultrasound Imaging of Muscle Cross-SectionalArea…………….. 3-19
3.7.5.1 Setting up the ultrasound machine…………………… 3-19
3.7.5.2 Preparation of the subject……………………………. 3-19
3.7.5.3 Obtaining the ultrasound image……………………… 3-20
3.7.5.4 Calculation of the muscle CSA……………………….. 3-20
3.7.6 Measurement of Arm and Thigh Girths…………………………... 3-22
3.7.7 5 x 6-Second Cycle Test…………………………………………... 3-23
3.8 Resistance-Training Exercises……………………………………………… 3-25
v
CHAPTER 4. AVERAGE MECHANICAL POWER OUTPUT DURING THE BENCH PRESS THROW AND COUNTERMOVEMENT JUMP IN WOMEN………………...
4-1
4.1 Introduction……………………………………………………………….... 4-1
4.2 Purpose……………………………………………….…………………….. 4-3
4.3 Subjects……………………………………………………………………... 4-4
4.4 Procedure…………………………………………………………………… 4-4
4.5 Statistical Analyses…………………………………………………………. 4-5
4.6 Results………………………………………………………………………. 4-6
4.7 Discussion…………………………………………………………………... 4-14
4.8 Conclusion…………………………………………………………………... 4-19
CHAPTER 5. ENHANCING MUSCULAR STRENGTH QUALITIES IN UNTRAINED WOMEN: LINEAR VERSUS UNDULATING PERIODISATION………………………………………………...
5-1
5.1 Introduction……………………………………………………………….... 5-1
5.2 Purpose……………………………………………….…………………….. 5-6
5.3 Methods…………………………………………………………………….. 5-6
5.3.1 Subjects…………………………………………………………… 5-6
5.3.2 Study Overview…………………………………………………… 5-7
5.3.3 Training Procedures……………………………………………… 5-9
5.4 Statistical Analyses…………………………………………………………. 5-13
5.5 Results………………………………………………………………………. 5-14
5.5.1 Subject Characteristics…………………………………………… 5-14
5.5.2 Training Protocol…………………………………………………. 5-14
5.5.3 Body Mass and Limb Girth……………………………………….. 5-15
5.5.4 Muscle CSA (Rectus Femoris)…………………………………….. 5-17
5.5.5 Maximal Dynamic Strength……………………………………….. 5-18
5.5.6 BPT and CMJ……………………………………………………... 5-20
5.5.7 5 x 6-s Cycle Test………………………………………………….. 5-25
5.6 Discussion…………………………………………………………………... 5-28
5.7 Conclusion…………………………………………………………………... 5-36
vi
CHAPTER 6. COMPARING LINEAR AND UNDULATING PERIODISATION FOR IMPROVING MUSCULAR STRENGTH QUALITIES IN STRENGTH-TRAINED WOMEN…………………………………………………………...
6-1
6.1 Introduction……………………………………………………………….... 6-1
6.2 Purpose……………………………………………….…………………….. 6-3
6.3 Subjects…………………………………………………………………….. 6-3
6.4 Testing And Training Procedures………………………………………….. 6-4
6.5 Statistical Analyses…………………………………………………………. 6-6
6.6 Results………………………………………………………………………. 6-7
6.6.1 Subject Characteristics…………………………………………… 6-7
6.6.2 Training Protocol…………………………………………………. 6-7
6.6.3 Body Mass and Limb Girth……………………………………….. 6-9
6.6.4 Muscle CSA (Rectus Femoris)…………………………………….. 6-11
6.6.5 Maximal Dynamic Strength……………………………………….. 6-12
6.6.6 BPT and CMJ……………………………………………………... 6-14
6.6.7 5 x 6-s Cycle Test………………………………………………….. 6-23
6.7 Discussion…………………………………………………………………... 6-26
6.8 Conclusion…………………………………………………………………... 6-34
vii
CHAPTER 7. COMPARING PERIODISED PROTOCOLS FOR THE MAINTENANCE OF STRENGTH AND POWER IN RESISTANCE-TRAINED WOMEN…………………………….
6-1
7.1 Introduction……………………………………………………………….... 7-1
7.2 Purpose……………………………………………….…………………….. 7-3
7.3 Subjects…………………………………………………………………….. 7-4
7.4 Testing And Training Procedures………………………………………….. 7-4
7.5 Statistical Analyses…………………………………………………………. 7-7
7.6 Results………………………………………………………………………. 7-8
7.6.1 Subject Characteristics…………………………………………… 7-8
7.6.2 Training Protocol…………………………………………………. 7-8
7.6.3 Body Mass and Limb Girth……………………………………….. 7-9
7.6.4 Maximal Dynamic Strength……………………………………….. 7-10
7.6.5 BPT and CMJ……………………………………………………... 7-10
7.6.6 5 x 6-s Cycle Test………………………………………………….. 7-12
7.7 Discussion…………………………………………………………………... 7-14
7.8 Conclusion…………………………………………………………………... 7-17
CHAPTER 8. CONCLUSIONS AND RECOMMENDATIONS……………… 8-1
8.1 Summary Of Findings……………………………………………………... 8-1
8.2 Recommendations And Future Research………………………………….. 8-6
8.3 Conclusion…………………………………………………………………. 8-8
REFERENCES……………………….….……………………………...…………. R-1
APPENDICES:
A Sample images of PPS data analysis for the (i) bench press throw and
the (ii) countermovement jump……………………………………………. A-1
B Informed consent for the subjects in Chapter 4………………………….. A-2
C Informed consent for the subjects in Chapter 5………………………….. A-3
D Sample training sheets for the subjects in (i) Chapter 5, (ii) Chapter 6
and (iii) Chapter 7………………………………………………………….. A-4
viii
List of Figures Figure 2.1: Combinations between the dominant biomotor abilities (Adapted
from Bompa, 1993). ____________________________________ 2-3
Figure 2.2: Graphical representation of periodisation. ___________________ 2-15
Figure 3.1: The modified Plyometric Power System. ____________________ 3-6
Figure 3.2: Toshiba Diagnostic Ultrasound Equipment. __________________ 3-7
Figure 3.3: Stretching exercises used for the following muscles during cool- down: a. Triceps and latissimus; b. Upper back and deltoids; c. Chest and biceps; d. Hamstrings; e. Lower back and hips; f. Inner thighs; g. Quadriceps; h. Calves. __________________________ 3-10
Figure 3.4: Different phases of the 1 RM Bench Press on the PPS: a. Beginning position; b. Lowest depth reached; c. Finished position. ______________________________________________ 3-14
Figure 3.5: Different phases of the 1 RM Squat on the PPS: a. Beginning position; b. Lowest depth reached; c. Finished position. _______ 3-15
Figure 3.6: Different phases of the BPT: a. Beginning position; b. Lowest depth reached; c. Finished position. ________________________ 3-17
Figure 3.7: Different phases of the CMJ: a. Beginning position; b. Lowest depth reached; c. Finished position. ________________________ 3-18
Figure 3.8: Ultrasound imaging of the rectus femoris. ___________________ 3-21
Figure 3.9: Tracing the perimeter of the rectus femoris using ImageJ software. _____________________________________________ 3-21
Figure 3.10: Measurement of girth: a. Relaxed arm girth; b. Mid-thigh girth. __ 3-23
Figure 3.11: The 5 x 6-s cycle test. ___________________________________ 3-24
Figure 3.12: Resistance exercises used in the studies: a. Bench press; b. Back squat; c. Lat pull-down; d. Leg press; e. Shoulder press; f. Lunge; g. Upright row; h. Knee extension; i. Pec press; j. Knee flexion; k. Dumbell press; l. Heel raise. ______________________________ 3-26
ix
Figure 4.1: (A) Loads representing 30 – 80 % of 1 RM BP; (B) Loads
representinig 30 – 80 % of 1 RM SQ. Columns and error bars represent mean ± SD. a denotes significant differences between groups at p ≤ 0.05; b denotes significant differences between groups at p ≤ 0.01. ______________________________________ 4-7
Figure 4.2: Load-power curves depicting average power output (W) during BPT with different percentages of 1 RM for GrpL and GrpH women. Error bars represent ± SD. a denotes significant within- group difference from 60 % of 1 RM, b denotes significant between-group difference (p ≤ 0.05). _______________________ 4-8
Figure 4.3: Average power output (W) during the countermovement jump (CMJ) with different percentages of 1 RM for the weakest (GrpL), strongest (GrpH), and both groups of subjects combined. Columns and error bars represent mean ± SD. a denotes significantly different from 30 % of 1 RM (p ≤ 0.05). __________ 4-9
Figure 4.4: Range of loads that produced the highest average mechanical power output during the bench press throw (BPT) and countermovement jump (CMJ) for both weak (GrpL) and strong (GrpH) subjects. _______________________________________ 4-10
Figure 4.5: Load-force curves depicting average force output (N) during (A) BPT, and (B) CMJ with different percentages of 1 RM for GrpL and GrpH women. Error bars represent ± SD. a denotes significantly different from preceding load, b denotes significantly different from other group (p ≤ 0.05). _______________________ 4-12
Figure 4.6: Load-velocity curves depicting average force output (N) during (A) BPT, and (B) CMJ with different percentages of 1 RM for GrpL and GrpH women. Error bars represent ± SD. a denotes significantly different from preceding load, b denotes significantly different from other group (p ≤ 0.05). _______________________ 4-14
Figure 5.1: Testing and training schedule over a 12-wk period incorporating a pre-training conditioning period and three specific training phases, preceded by familiarisation sessions. _______________________ 5-8
Figure 5.2: Training volume by week and phase. Results represent mean ± SD. * denotes significantly different from other group (p ≤ 0.05). _ 5-15
x
Figure 5.3: Changes in body mass for LP and UP groups. Results represent mean ± SD. ___________________________________________ 5-16
Figure 5.4: Muscle CSA (mean ± SD) of the right rectus femoris for LP and UP groups across test occasions. a denotes significantly different from T1, b denotes significantly different from T2, * significantly different from other group (p ≤ 0.05). _______________________ 5-17
Figure 5.5: Changes in 1 RM bench press (BP) and squat (SQ) means between occasions for LP and UP groups, and for pooled data from both groups. Error bars denote ± SD. a denotes significantly greater thanT1 mean, b denotes significantly greater than T2 mean, and c significantly higher than T3 mean (p ≤ 0.05). _________________ 5-19
Figure 5.6: Height of bar at peak of throw and jump during each test at 30 % of 1 RM using pooled data. Results denote mean ± SD. a denotes significantly less than T1 mean, and b significantly less than T2 mean (p ≤ 0.05). _______________________________________ 5-23
Figure 5.7: Height of bar at peak of throw and jump during each test at 13 kg and 22 kg using pooled data. Results denote mean ± SD. a denotes significantly greater than T1 mean, and b significantly greater than T2 mean, and c significantly higher than T3 mean (p ≤ 0.05). ______________________________________________
5-25
Figure 5.8: Work for each sprint during the 5 x 6-s repeated cycle test during each test occasion for (A) LP and (B) UP groups. _____________ 5-27
Figure 5.9: Power for each sprint during the 5 x 6-s repeated cycle test during each test occasion for (A) LP and (B) UP groups. _____________ 5-27
Figure 6.1: Testing and training schedule over a 12-wk period incorporating a pre-training conditioning period and three specific training phases, preceded by familiarisation sessions. _______________________ 6-6
Figure 6.2: Weekly training volume for all exercises combined during the experimental period. Results and error bars represent mean ± SD. * denotes significantly different from other group (p ≤ 0.05). _ 6-8
Figure 6.3: Muscle CSA measurements at each test occasions for LP and UP training groups. Graph points and error bars represent mean ± SD. a denotes significantly greater thanT1 mean, b significantly greater than T2 mean, c significantly greater than T3 mean, and d significantly greater than T4 mean (p ≤ 0.05). ________________ 6-11
xi
Figure 6.4: Changes in 1 RM bench press (BP) and squat (SQ) means across test occasions for LP and UP groups, and for pooled data from both groups. Columns and error bars represent mean ± SD. a denotes significantly greater thanT1 mean, b denotes significantly greater than T2 mean, and c significantly greater than T3 mean (p ≤ 0.05). ______________________________________________ 6-14
Figure 6.5: Pooled average mechanical power output at each test occasion for the BPT using relative and absolute loads. Graph points and error bars represent mean ± SD. a denotes significantly greater power output than T1, b denotes significantly greater power output than T2, c significantly greater power output than T3 (p ≤ 0.05). _____ 6-17
Figure 6.6: Pooled average mechanical power output at each test occasion for the CMJ using relative and absolute loads. Graph points and error bars represent mean ± SD. a denotes significantly greater power output than T1, b denotes significantly greater power output than T2, c significantly greater power output than T3 (p ≤ 0.05). ^ denotes significant from T2 at p ≤ 0.10. _____________________ 6-18
Figure 6.7: Height of bar at peak of throw and jump during each test at 30 % of 1 RM using pooled data. Results denote mean ± SD. a denotes significantly less than T1 mean, b significantly less than T2 mean (p ≤ 0.05), and c significantly less than T3 mean (p ≤ 0.05). ^ denotes significantly less than T1 mean, and * significantly less than T2 mean (p ≤ 0.10). ________________________________
6-20
Figure 6.8: Height of bar at peak of throw and jump during each test at 30 % of 1 RM at T1 using pooled data. Results denote mean ± SD. a denotes significantly greater than T1 mean, b significantly less than T2 mean (p ≤ 0.05), and c significantly less than T3 mean (p ≤ 0.05). ^ denotes significantly greater than T2 mean (p ≤ 0.10). _ 6-21
Figure 6.9: Work for each sprint during the 5 x 6-s repeated cycle test during each test occasion for (A) LP and (B) UP groups. _____________ 6-25
Figure 6.10: Power for each sprint during the 5 x 6-s repeated cycle test during each test occasion for (A) LP and (B) UP groups. _____________ 6-25
xii
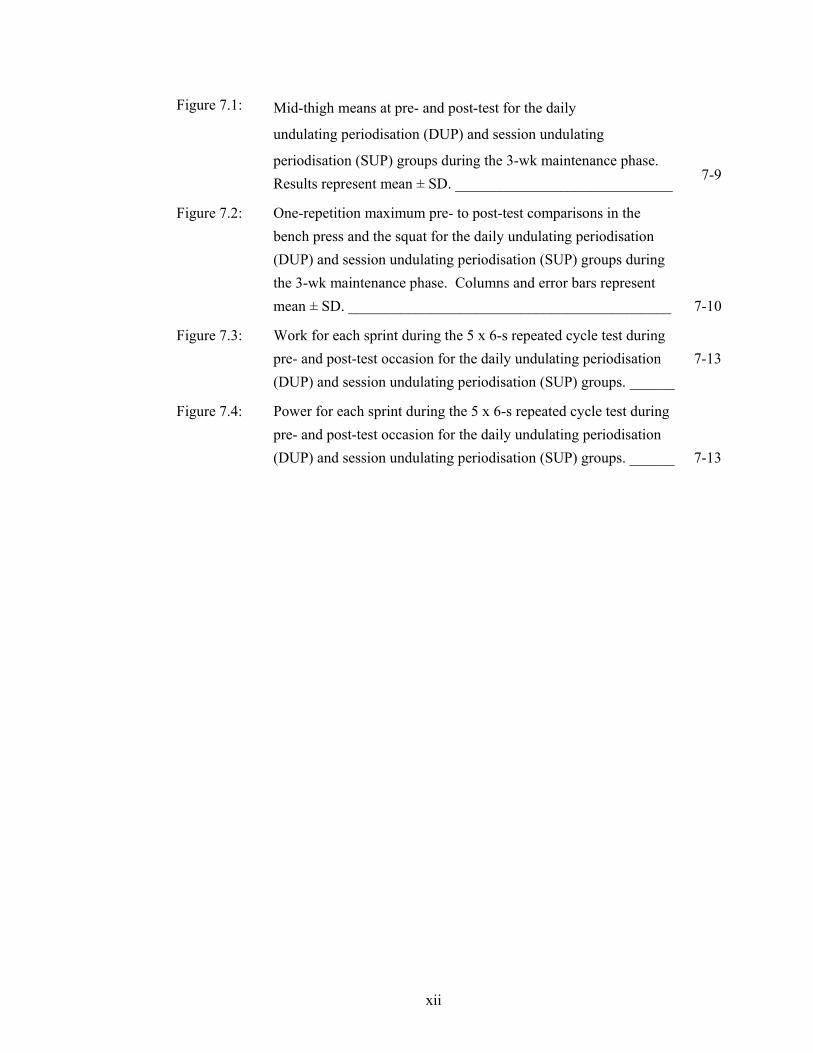
Figure 7.1: Mid-thigh means at pre- and post-test for the daily
undulating periodisation (DUP) and session undulating
periodisation (SUP) groups during the 3-wk maintenance phase. Results represent mean ± SD. _____________________________ 7-9
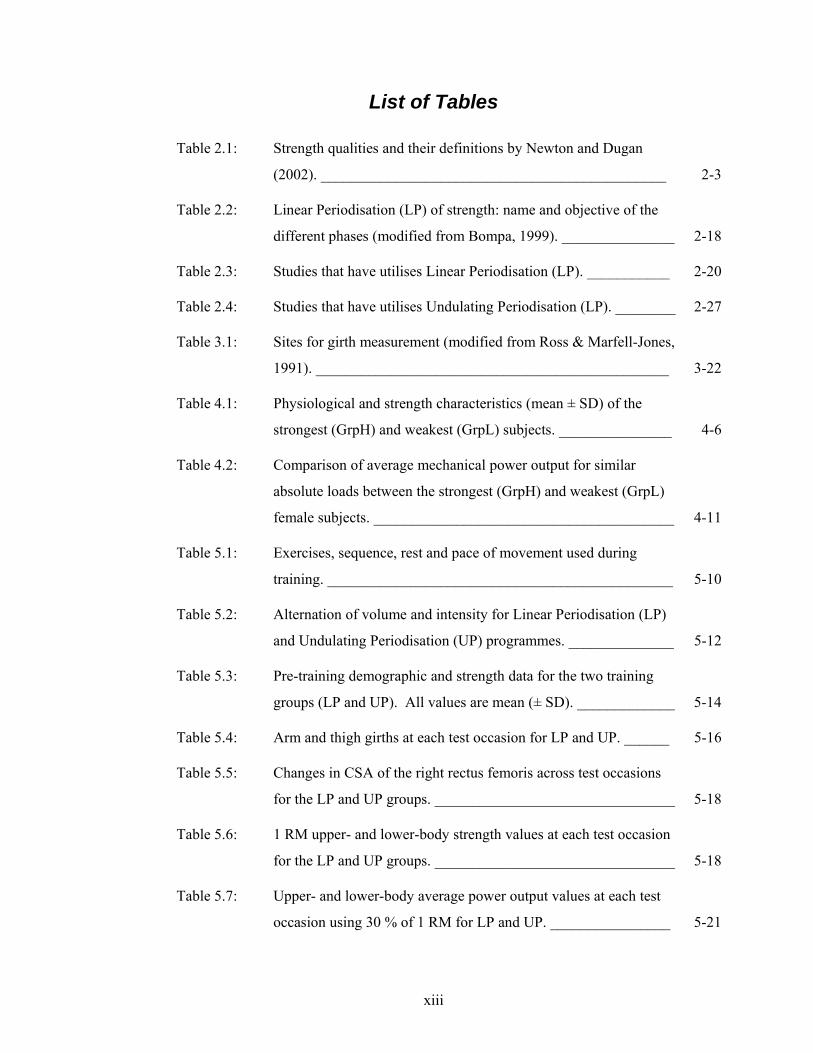
Figure 7.2: One-repetition maximum pre- to post-test comparisons in the bench press and the squat for the daily undulating periodisation (DUP) and session undulating periodisation (SUP) groups during the 3-wk maintenance phase. Columns and error bars represent mean ± SD. ___________________________________________ 7-10
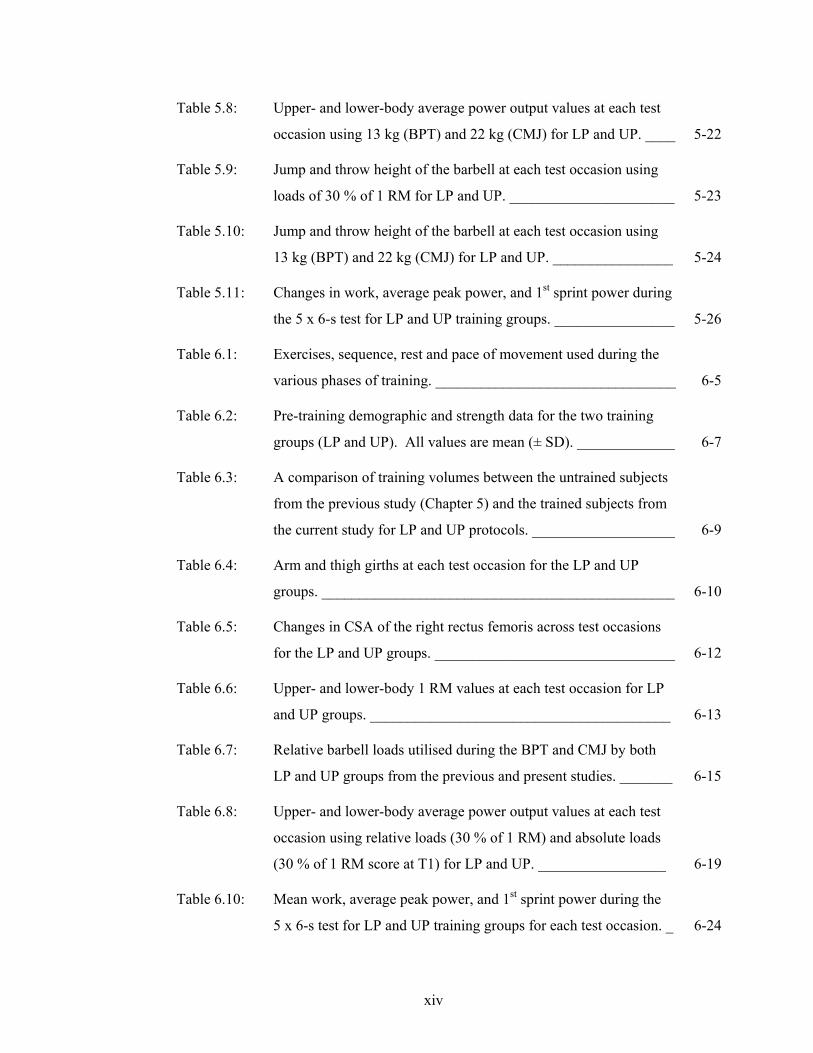
Figure 7.3: Work for each sprint during the 5 x 6-s repeated cycle test during pre- and post-test occasion for the daily undulating periodisation (DUP) and session undulating periodisation (SUP) groups. ______
7-13
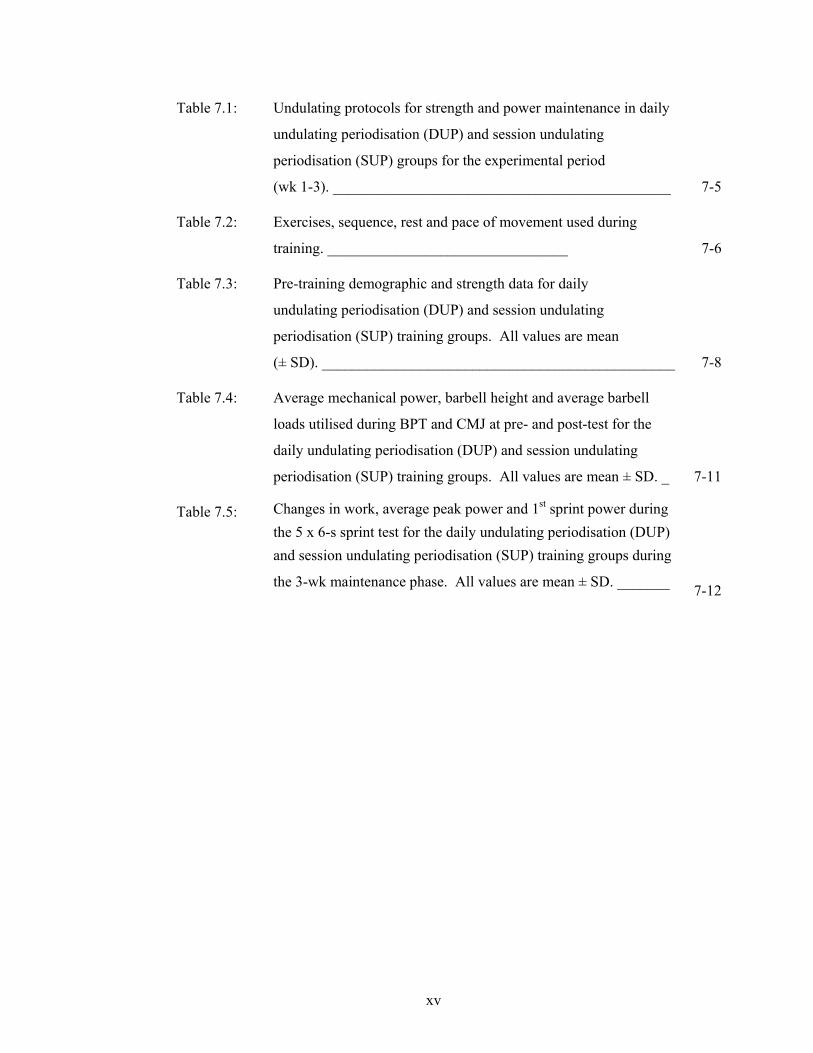
Figure 7.4: Power for each sprint during the 5 x 6-s repeated cycle test during pre- and post-test occasion for the daily undulating periodisation (DUP) and session undulating periodisation (SUP) groups. ______ 7-13
xiii
List of Tables
Table 2.1: Strength qualities and their definitions by Newton and Dugan
(2002). ______________________________________________ 2-3
Table 2.2: Linear Periodisation (LP) of strength: name and objective of the
different phases (modified from Bompa, 1999). _______________ 2-18
Table 2.3: Studies that have utilises Linear Periodisation (LP). ___________ 2-20
Table 2.4: Studies that have utilises Undulating Periodisation (LP). ________ 2-27
Table 3.1: Sites for girth measurement (modified from Ross & Marfell-Jones,
1991). _______________________________________________ 3-22
Table 4.1: Physiological and strength characteristics (mean ± SD) of the
strongest (GrpH) and weakest (GrpL) subjects. _______________ 4-6
Table 4.2: Comparison of average mechanical power output for similar
absolute loads between the strongest (GrpH) and weakest (GrpL)
female subjects. ________________________________________ 4-11
Table 5.1: Exercises, sequence, rest and pace of movement used during
training. ______________________________________________ 5-10
Table 5.2: Alternation of volume and intensity for Linear Periodisation (LP)
and Undulating Periodisation (UP) programmes. ______________ 5-12
Table 5.3: Pre-training demographic and strength data for the two training
groups (LP and UP). All values are mean (± SD). _____________ 5-14
Table 5.4: Arm and thigh girths at each test occasion for LP and UP. ______ 5-16
Table 5.5: Changes in CSA of the right rectus femoris across test occasions
for the LP and UP groups. ________________________________ 5-18
Table 5.6: 1 RM upper- and lower-body strength values at each test occasion
for the LP and UP groups. ________________________________ 5-18
Table 5.7: Upper- and lower-body average power output values at each test
occasion using 30 % of 1 RM for LP and UP. ________________ 5-21
xiv
Table 5.8: Upper- and lower-body average power output values at each test
occasion using 13 kg (BPT) and 22 kg (CMJ) for LP and UP. ____ 5-22
Table 5.9: Jump and throw height of the barbell at each test occasion using
loads of 30 % of 1 RM for LP and UP. ______________________ 5-23
Table 5.10: Jump and throw height of the barbell at each test occasion using
13 kg (BPT) and 22 kg (CMJ) for LP and UP. ________________ 5-24
Table 5.11: Changes in work, average peak power, and 1st sprint power during
the 5 x 6-s test for LP and UP training groups. ________________ 5-26
Table 6.1: Exercises, sequence, rest and pace of movement used during the
various phases of training. ________________________________ 6-5
Table 6.2: Pre-training demographic and strength data for the two training
groups (LP and UP). All values are mean (± SD). _____________ 6-7
Table 6.3: A comparison of training volumes between the untrained subjects
from the previous study (Chapter 5) and the trained subjects from
the current study for LP and UP protocols. ___________________ 6-9
Table 6.4: Arm and thigh girths at each test occasion for the LP and UP
groups. _______________________________________________ 6-10
Table 6.5: Changes in CSA of the right rectus femoris across test occasions
for the LP and UP groups. ________________________________ 6-12
Table 6.6: Upper- and lower-body 1 RM values at each test occasion for LP
and UP groups. ________________________________________ 6-13
Table 6.7: Relative barbell loads utilised during the BPT and CMJ by both
LP and UP groups from the previous and present studies. _______ 6-15
Table 6.8: Upper- and lower-body average power output values at each test
occasion using relative loads (30 % of 1 RM) and absolute loads
(30 % of 1 RM score at T1) for LP and UP. _________________ 6-19
Table 6.10: Mean work, average peak power, and 1st sprint power during the
5 x 6-s test for LP and UP training groups for each test occasion. _ 6-24
xv
Table 7.1: Undulating protocols for strength and power maintenance in daily
undulating periodisation (DUP) and session undulating
periodisation (SUP) groups for the experimental period
(wk 1-3). _____________________________________________ 7-5
Table 7.2: Exercises, sequence, rest and pace of movement used during
training. ________________________________ 7-6
Table 7.3: Pre-training demographic and strength data for daily
undulating periodisation (DUP) and session undulating
periodisation (SUP) training groups. All values are mean
(± SD). _______________________________________________ 7-8
Table 7.4: Average mechanical power, barbell height and average barbell
loads utilised during BPT and CMJ at pre- and post-test for the
daily undulating periodisation (DUP) and session undulating
periodisation (SUP) training groups. All values are mean ± SD. _ 7-11
Table 7.5: Changes in work, average peak power and 1st sprint power during the 5 x 6-s sprint test for the daily undulating periodisation (DUP) and session undulating periodisation (SUP) training groups during
the 3-wk maintenance phase. All values are mean ± SD. _______ 7-12

xvi
Acknowledgements
This thesis could not have been completed without the encouragement,
inspiration, and help given by family, friends and colleagues. This thesis has all of these
origins and without them would have been poorer. I would like to dedicate this thesis to
my family and my circle of dearest friends, who had to put up with my absence
throughout the time I was away from home. Thank you for your unwavering support and
words of encouragement every time I felt like giving up.
There are others who deserve special mention, and to whom I am greatly
indebted. Firstly, exceptional thanks must be given to Dr David Bishop and Dr Peter
Hamer, who guided me through the research process, and gave constructive and valuable
guidance and feedback, without which, this study could not have been completed.
Comments from both have improved and enriched the thesis considerably. Their
experience in research has made this thesis more complete and organised.
To the subjects who participated in the studies, and fellow students who gave their
assistance during the data collection process, my heartfelt thanks. To the academic,
administrative and technical staff of the School of Human Movement and Exercise
Science, my most sincere gratitude for all the help you have offered me throughout my
PhD experience in Australia. To my postgraduate “mates” from Rooms 1106 and 1107 –
thanks for your friendship and the outrageous but extremely original ideas that are thrown
around whenever my brains suffer from low-productivity. Finally, I would like to
acknowledge the assistance and encouragement given to me by Professor Brian Blanksby
- thanks for listening whenever I needed an “ear”. I could not have managed without you
all.
While I am happy this PhD endurance event is over, I will however, miss the
aussie research experience I have had. Thanks from the bottom of my heart!
1-1
CHAPTER 1. INTRODUCTION 1.1 Introduction
Many competitive sports require athletes to possess high levels of strength
qualities such as maximal strength, power, rate of force development and
muscular endurance. While high levels of these qualities have been shown to
enhance athletic performance and/or delay the onset of muscular fatigue, adequate
levels could help improve the performance of daily tasks. These muscular
qualities are also important for the health of both men and women. In order to
improve performance in the different strength qualities, different variations of
resistance training programmes have been proposed since the 1950s (Kraemer &
Fleck, 1988). Designing resistance training programmes that can result in
adaptations that will bring about improvement in the different strength qualities is
a task that will challenge the skill of coaches and trainers. Resistance training
programmes have been usually designed to first condition the body to prepare it
for higher levels of training as the programme progresses. The training of other
strength qualities such as maximal strength, power and endurance typically
follows. The improvements achieved must then be transferred to the skill that is
required by the athletes.
In the last few decades, improvement of strength qualities has been
organised according to the concept of periodisation, which promotes the
arrangement of the training regimen into phases with the objective of maximising
the capacity of the athlete to meet specific demands of the sport (Bompa, 1999).
Variables such as resistance, volume, intensity and specificity are varied
according to the requirements of each phase in order to acquire peak conditioning
and performance for targeted important competitions (Bompa. 1993). Existing
studies on periodisation have utilised a variety of different manipulations for
training volume and intensity. Earlier studies on periodisation mainly utilised
linear periodisation (LP) where a programme would begin with high volume and
low intensity, progressing through to low volume but high intensity as
competition draws near. More recent studies have utilised undulating
periodisation (UP) where training volume and intensity were programmed to
1-2
alternate training days that emphasised different strength qualities such as
hypertrophy, maximal strength and power.
Most periodised programmes utilise resistances set at specific intensities
(normally a certain percentage of one-repetition maximum, or 1RM) for each type
of strength quality that is being emphasised. For example, an intensity of more
than 85% of 1RM is generally accepted as the load intensity for the improvement
of maximal strength, while 67-85 % of 1RM is used for improving hypertrophy,
and less than 67 % of 1RM is used for muscular endurance training (Baechle,
Earle & Wathen, 2000). There exists however, disagreement over the load (% of
1 RM) that should be used during the training of power. This makes it important
to identify the load for power training before comparisons can be made between
LP and UP programmes using equal training volumes. It is also important to
examine if there are differences in loads for maximising power between women
of different strength abilities.
Training studies have also rarely examined the effect of periodised
resistance programmes on maintaining maximal strength and power. What type
of periodised maintenance programme is conducive to maintaining strength,
power and muscle mass? Which UP model for periodisation is more effective?
Answers to these questions are sought. In addition to the above, most studies
have utilised male subjects and their results implied for women. This series of
studies investigated the development of strength qualities such as maximal
strength and power in both untrained and moderately-trained women using a
linear periodised programme and an undulating periodised programme matched
for total load volume and intensity.
1.2 Statement Of The Problem
The review of literature in Chapter 2 indicates that the load that is optimal
for power-training, and the superiority of either LP or UP over another for
strength and power development has not been determined conclusively. The use
of periodised programmes during maintenance training also lacks investigation.
The task of comparing the LP and UP programmes has been made more difficult
as previous studies had variations in training volume, intensity, mesocycle length,
and training status of subjects. It is clear that more research was required to
identifiy the load that maximises average power output, and to investigate the
1-3
structuring of LP and UP training during strength and power development and
maintenance.
These studies therefore, attempted to firstly identify the load that
optimises average mechanical power output for women of different strength
abilities, and subsequently to compare the effects of LP and UP on untrained and
moderately-trained women when total workload and total average intensity are
equalised at the end of the training period. The effects of the two training
programmes were assessed through measurements of isoinertial maximum
strength, changes in arm and thigh girths, changes in muscle cross-sectional areas,
average mechanical power outputs during the bench press throws and
countermovement jumps, and work and power during repeated sprints (cycle).
The same variables were also examined before and after a short, periodised
maintenance phase.
1.3 Hypotheses
The main hypothesis is that there are no significant differences in strength
qualities in the female subjects due to training in accordance with two different
periodised protocols. The sub-hypotheses that were formed to test the differences
between the experimental groups were as follows:
i There will be no significant differences in average power output between
loads of 30, 40, 50, 60, 70 and 80 % of 1 RM during the bench press throw
and the countermovement jump.
ii There will be no significant differences in arm and thigh girths between
the periodised groups after the training period.
iii There will be no significant differences in muscle cross-sectional areas
(right rectus femoris) between the periodised groups after the training
period.
iv There will be no significant differences in maximal upper- and lower-body
isoinertial strength between the periodised groups after the training period.
v There will be no significant differences in upper- and lower-body average
mechanical power output between the periodised groups after the training
period.

1-4
vi There will be no significant differences in the height of the barbell during
the bench press throw and the countermovement jump between the
periodised groups after the training period.
vii There will be no significant differences in work and power performances
during the repeated-cycle test between the periodised groups after the
training period.
1.4 Limitations And Delimitations
The researcher faced several limitations. These limitations stemmed from
conditions that could not be controlled, or were the results of the delimitations
that were imposed. The limitations were as follows:
i. This study required that the subjects maintained their usual life style while
participating. They were required to keep diet and activity diaries for the
researcher to estimate their caloric input and expenditure. Thus, the first
limitation involved the honesty and diligence of the subjects in keeping
records of what they ate and what they did throughout the training period.
ii. The second limitation involved the representativeness of the sample, as all
subjects were females between the ages of 18 – 32. This may restrict the
generalisability of the results to other female populations.
iii. Any changes or improvement in the variables tested were limited to
training only with the same volume and intensity, periodised programme,
training period.
iv. Any changes or improvement in the variables tested was limited to the
training frequency, intensity and duration set by the researcher.
v. The measures taken may not be totally representative of the strength
qualities. Strength qualities of limited parts of the body were taken.
vi. The study also required that the subjects were non-smokers, were not
taking any medication, and had no known medical conditions or physical
injuries.
This study was delimited by the researcher in several ways. The
delimitations were imposed in order to make the study more workable and to keep
the scope of the study within limits. The first delimitation was set with regards to
the total workload and the average training intensity for the two training
1-5
programmes. In order to match total workload and average intensity, a linear
periodised model with two weeks for conditioning, and three weeks each for the
hypertrophy, strength and power phases was designed. This same workload and
intensity was spread out over the training period to make up one hypertrophy, one
strength, and one power day a week, forming the UP programme. This
delimitation however results in an automatic limitation with respect to the
structure of linear periodisation by assuming that hypertrophy, basic strength and
power conversion will occur within each three-week phase. The second
delimitation set by the researcher concerns the scope of representation by the
subjects. All the studies involved the recruitment of female subjects from the
University of Western Australia. Limitations with respect to how well the
university females represent other untrained and moderately-trained women may
arise.
1.5 Significance Of The Studies In The Thesis
Although training at loads that maximised average power outputs has been
suggested to improve power production (Wilson, Newton, Murphy & Humphries,
1993), previous investigations on men have not been able to agree on the optimal
load for power maximisation. Additionally, there has been no previous study that
has examined the loads that maximises average power output during exercises
such as the bench press throw and the countermovement jump in women, and it is
not known if the optimal power load would be similar for both strong and weak
women. Data from this study could provide information on the appropriate load
for power training, especially for the female population.
Most studies on periodisation have not been able to compare the efficacy
of its training structure effectively because of unequal volume, intensity or
workloads. The studies that have tried to control these training variables have
produced conflicting results. Comparing the linear periodised model against the
undulating model with the total workload and total average intensity held equal
might help clarify if the variations of intensity and volume (workload) in the
structure of periodised programmes actually promote better strength adaptations.
The comparison of two different models might also provide data on whether
hypertrophy, strength and power can be trained within a microcycle or whether
each quality should be held more consistently over a phase of about three to four
1-6
weeks. Current research data is not conclusive on which variation provides better
results.
The results from this study might also be able to provide comparisons on
the rate and structure of strength improvement for both the upper- and lower-
body. As more studies have concentrated on lower-body development, this study
will examine the efficacy of periodised strength training for both the upper- and
lower-body. Furthermore, the majority of studies have been conducted on male
subjects. Therefore, this study will also provide more data on the efficacy of
periodisation on both untrained and moderately-trained women. There is also no
previous published study that has assessed the maintenance of strength and power
utilising periodised resistance-training protocols on women. This data could
provide valuable feedback on the efficacy of periodised resistance training for
maintaining strength and power over a short training phase.
2-1
CHAPTER 2. REVIEW OF LITERATURE 2.1 Definitions Of Strength Qualities
Atha (1981) defined strength as the ability to develop force against an
unyielding resistance in a single contraction of unlimited duration. This definition
of strength as a static measure avoids consideration of the complex interaction of
force development and the velocity of concentric and eccentric muscle actions.
Disagreeing with this definition, Knuttgen and Kraemer (1987) proposed that
strength be operationally defined as the maximal force a muscle or muscle group
can generate at a specified or determined velocity.
Clarke (1994) then categorised strength as isometric, isokinetic and isotonic.
Isometric strength was stated as a single maximal voluntary contraction (MVC)
performed by a muscle group in a static position, in which no shortening or
lengthening of the muscle occurs. This definition for isometric strength should be
used cautiously as changes in muscle length do occur during isometric
contractions as the myosin heads bind with the actin binding sites. This definition
might be more accurate if isometric strength is taken to represent a MVC in which
no change in joint angle occurs. Isokinetic strength meanwhile, is regarded as the
maximum force that can be exerted by the muscle during contraction with the
velocity of movement held constant. Isokinetic strength training and assessment
requires equipment to control for a variety of movement velocities. This type of
muscle action does not simulate the natural movements of the body, which
includes accelerations, decelerations, and eccentric stretching phases before the
concentric or shortening phases. As such, the external and logical validity of
findings from isokinetic research would appear questionable (Cronin, McNair &
Marshall, 2003). Isotonic strength is the maximum force that can be exerted by
the muscle during contraction as it moves through its range of motion. Isotonic
strength can be further divided into concentric and eccentric forms.
The use of the term “isotonic” has been disputed since the early 1990s.
Kraemer and Fry (1995) noted that this term is frequently and improperly used to
indicate dynamic muscle activity with constant external resistance, when it
actually denotes a dynamic event in which muscle generates the same amount of
force/tension throughout the entire movement. However, the force exerted by
muscle during human movement is not constant, but varies with the mechanical
2-2
advantage of the joint and the length of the muscle. Murphy, Wilson and Pryor
(1994) were the earliest to use the term “isoinertial” to replace “isotonic” in the
assessment of strength and power. According to Murphy et al. (1994), typical
athletic performance is characterised by the acceleration and deceleration of a
constant mass (constant gravitational load), which is usually the athlete’s body or
an implement being thrown or propelled. Isoinertial literally means constantly
resistant to motion, and may be more accurate in describing the constant external
loading associated with weightlifting tasks (Abernethy, Wilson & Logan, 1995).
Isoinertial actions also better simulate the movement patterns performed in
everyday activities better.
Bompa (1993) defined strength simply as the ability to apply force.
Strength, together with speed and endurance, are described as the main biomotor
abilities. A higher contribution from one of these biomotor abilities during
physical performance denotes that biomotor ability as the dominant ability.
Bompa also suggests that there is interdependence between these main biomotor
abilities, and that they can combine to form other abilities. Strength and
endurance combine to produce muscular endurance, endurance combines with
speed to produce speed endurance, while maximum strength and speed combine
to produce power. Each of these products of the main biomotor abilities can be
sub-divided into different categories according to the level of specificity required
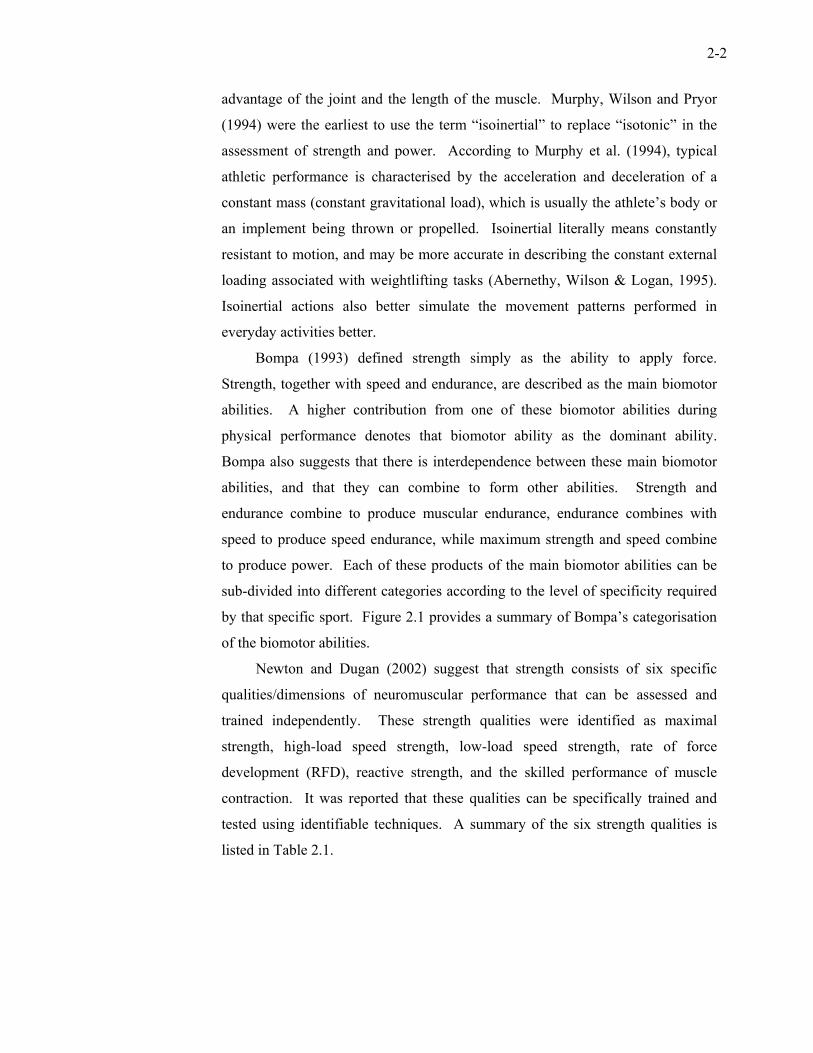
by that specific sport. Figure 2.1 provides a summary of Bompa’s categorisation
of the biomotor abilities.
Newton and Dugan (2002) suggest that strength consists of six specific
qualities/dimensions of neuromuscular performance that can be assessed and
trained independently. These strength qualities were identified as maximal
strength, high-load speed strength, low-load speed strength, rate of force
development (RFD), reactive strength, and the skilled performance of muscle
contraction. It was reported that these qualities can be specifically trained and
tested using identifiable techniques. A summary of the six strength qualities is
listed in Table 2.1.
2-3
Figure 2.1 Combinations between the dominant biomotor abilities (Adapted from Bompa, 1993).
*P = Power; M-E = Muscular endurance; S-E = Speed endurance
Table 2.1 Strength qualities and their definitions by Newton and Dugan (2002).
Strength Qualities Definition
Maximal strength Highest force capability of the neuromuscular system produced during slow eccentric, concentric, or isometric contractions.
High-load speed strength Highest force capability of the neuromuscular system produced during dynamic eccentric and concentric actions under a relatively heavy load (>30% of maximum) and performed as rapidly as possible.
Low-load speed strength Highest force capability of the neuromuscular system produced during dynamic eccentric and concentric actions under a relatively light load (<30% of maximum) and performed as rapidly as possible.
Rate of force development The rate at which the neuromuscular system is able to develop force, measured by calculating the slope of the force-time curve on the rise to maximum force of the action.
Reactive strength The ability of the neuromuscular system to tolerate a relatively high stretch load and change movement from rapid eccentric to rapid concentric.
Skilled performance of muscle contraction
The ability of the motor control system to coordinate the muscle contraction sequences to make the greatest use of the other strength qualities such that the total movement best achieves the desired outcome.
STRENGTH
SPEED ENDURANCE S-E
M-E
P
Landing/Reactive Power
Acceleration
Throwing Power
Take-off Power
Starting Power
Deceleration Power
M-E long
M-E medium
Power-endurance
M-E short
2-4
It should be noted that Bompa (1993) and Newton and Dugan (2002) have
concluded that strength is not a lone component by itself, but consists of a number
of sub-qualities or abilities such as maximal strength, power, and muscular
endurance. Even though there are differences in the number of qualities and the
terms used to name the qualities, it is important to train and assess each one
separately. Some sports require maximal strength and power (e.g., Olympic
weightlifting), while other sports may require reactive strength (basketball, long
jump). Tan (1999) reported in his review that regardless of which strength quality
is predominantly needed in a sport, the development of maximal strength should
be given priority. Having a satisfactory strength base would help develop other
areas required during conditioning. However, of all the different strength
qualities, power or speed-strength may be most pertinent for many athletic events
that require jumping, throwing, striking and quick changes in movement
direction. These events require muscles to generate high absolute power in order
to produce movements executed with high velocity and high force (Young &
Bilby, 1993). Power above a minimum threshold is also important for functional
performances such as lifting heavy objects, climbing stairs, rising from a chair,
and doing heavy housework (Bassey, Fiatarone & O’Neill, 1992).
The term speed strength is more commonly used in Europe and has been
used as a synonym for power (Young & Bilby, 1993). As strength is the ability to
exert force, and speed is denoted as distance divided by time, speed strength
should be taken as a combination of these two definitions i.e., the ability to apply
force through a distance divided by the time of force application. The formula for
power can be written as
Power = Work / Time
= Force x Distance / Time
= Force x Velocity
Therefore, when talking about speed strength, the actual mechanical quality
being discussed is power. Baker (1995) is of the opinion that the correct term to
use is power, especially in actual dynamic muscle performance. This series of
studies will use the term power instead of speed strength, and isoinertial in place
of isotonic.
2-5
2.2 Development Of Strength Qualities
Although physical strength has been required for the satisfaction of personal
needs and protection, for use in combat, and in the modern era, for athletics and
health (Clarke, 1973), many sporting activities require high power output rather
than high force production (Newton, Kraemer, Hakkinen, Humphries & Murphy,
1996). Therefore it seems pertinent to emphasise both these strength qualities
during resistance training. Atha (1981) had grouped the strengthening of muscle
according to three main categories –isotonic, isometric and isokinetic. Included
under isotonic strength development were the sub-divisions of heavy, progressive,
and variable resistance exercises, speed loading training, eccentric and plyometric
training, and hybrid methods. As stated earlier, this study will use the term
isoinertial training in place of isotonic training, and a brief description of
isoinertial training will be given in the following sections.
2.2.1 Development of Strength Qualities Using Isoinertial Training
Isoinertial resistance training is most dynamically related to sports-specific
movements and can be used for developing different strength qualities; all that is
required, is the manipulation of training variables that may include the number of
sets, number of repetitions, number and order of exercises, rest periods, amount of
resistance used, type of muscle action performed (concentric or eccentric), and the
number of training sessions held over the training period. Studies from the early
1940s investigated the manipulation of these variables in accordance with a
programme termed Progressive Resistance Exercise (PRE). PRE basically had
trainees utilise a fixed percentage of one-repetition maximum (1 RM) throughout
an entire training period. Most training models for maximal strength today are
based on studies from the 1950s and 1960s.
Through a number of studies, Berger (1962a, 1962b, 1963) provided
considerable information on the development of maximal strength using the
criterion measure of 1 RM. These studies concluded that maximal strength gains
are achieved when subjects performed 6 RM for three sets. Studies conducted by
O’Shea (1966) and Berger and Hardage (1967) have also suggested that strength
gains are greatest when resistance is high, and that 3 x 6-8 RM used during PRE
was the most efficient method for achieving maximal strength. Atha (1981), and
Anderson and Kearney (1982) reported that strength increases produced by
2-6
training were great when subjects performed sets of low number of repetitions at
high but sub-maximal loads (nearing the 1 RM value). Wathen, Baechle and
Earle’s (2000) suggestion for the development of strength is 2 - 6 sets of 5 - 6
RM. Maximal strength training is usually performed at slow to moderate speeds.
Isoinertial resistance training can also be utilised to develop other strength
qualities. The planning of a strength training programme needs to take into
consideration the development of muscle hypertrophy in order to aid anatomical
adaptation in the early stages of strength training. Some research have shown that
three sets of 8-10 RM with shorter rest periods of one to one and a half minutes
can elicit a large response from the endocrine system. This in turn is
hypothesized to provide a greater stimulus for muscle size increments or
hypertrophy (Kraemer, Noble, Clark & Culver, 1987). Wathen et al. (2000)
stated that the goal of hypertrophy training is to improve the muscular and
metabolic base by performing exercises with low to moderate resistance and a
high number of repetitions. It was suggested that most exercises should be for 2 -
6 sets at an intensity 6 - 12 RM. Bompa (1993) suggests that by performing
hypertrophy training first, the athlete’s strength potential seems to increase faster.
This is especially so if the hypertrophy phase is followed by a strength and power
development phase. The rate of performing each movement during hypertrophy
training is of a moderate tempo.
The use of isoinertial training for the development of power is popular, but
there exists considerable debate regarding the percentage range of 1 RM that can
bring about the most favourable adaptation in power development. It is still not
clear whether improvements in muscle power are brought about through high,
low, or even intermediate ranges of the 1 RM. There are too many conflicting
studies, and evidence supporting all three ranges can be found. Additional
research to further examine the appropriate external resistance for maximum
power may still be needed to help establish the appropriate training stimulus to
improve muscle power.
2.2.2 Training for Power
When muscle is maximally activated against a given load, there is an
“optimum” load that elicits the highest mechanical power output, which is a direct
result of the force-velocity relationship of muscle contractile mechanics (Dugan,
2-7
Doyle, Humphries, Hasson & Newton, 2004). It has been suggested that
explosive power might be best trained using resistances that maximise mechanical
output (Wilson, Newton, Murphy & Humphries, 1993) over a wide range of loads
(Kaneko, Fuchimoto, Toji & Suei, 1983). Training using this resistance load may
lead to an increase in power production or power training adaptations through
improvements in concentric force and rate of force development (concentric and
eccentric). The reasons for the increase in power performances may be due to
both favourable neural and muscle fibre adaptations, which result from the
specific stresses placed on the neuromuscular system during training with
resistances that maximise power output (Wilson et al., 1993; Baker, Nance &
Moore, 2001a). Training at the load that maximises mechanical power has also
been suggested to lead to a broader range of adaptations compared to adaptations
through either strength-oriented or speed-oriented training alone (Wilson et al.,
1993; Wilson, Murphy & Giorgi, 1996).
A recent review reinforces the idea that training at the load which
maximises mechanical power output may be most effective in improving
maximum muscular power (Kawamori and Haff, 2004). There is however,
considerable debate regarding the optimal load or range of loads (denoted as a
percentage of 1 RM or a percentage of maximal isometric strength) that can
generate the highest power production. There are studies indicating that heavy
loads (80 – 100 % of 1RM) are necessary to allow for the recruitment of high
threshold FT motor units on the basis of the size principle (Sale, 1987;
Schmidtbleicher & Haralambie, 1981; Behm & Sale, 1993). Other studies have
suggested that training for power should use light loads 10 - 45% of concentric 1
RM or maximal isometric force (Kaneko et al., 1983; Moritani, Muro, Ishida &
Taguchi, 1987; Wilson et al., 1993; Newton, Murphy, Humphries et al., 1997;
Moss, Refnes, Abildgaard, Nicolaysen & Jensen, 1997; McBride, Triplett-
McBride, Davie & Newton, 1999; Stone, O’Bryant, McCoy et al., 2003), and be
performed at a speed that is closer to the actual speed of dynamic athletic
performance movements. Additional studies have provided evidence that
intermediate loads of 50 – 70 % of 1 RM produce optimal power scores (Thomas,
Fiatarone & Fielding, 1996; Mayhew, Ware, Johns & Bemben, 1997; Baker et al.,
2001a; Baker, Nance & Moore, 2001b; Cronin, McNair & Marshall, 2001; Siegel,
Gilders, Staron & Hagerman, 2002; Cronin & Crewther, 2004).
2-8
This large range of optimal loads has made it difficult to implement
specific training recommendations based on the current research. The question
then, is why are there so many different optimal loads for maximising power?
The examination of previous literature has found loads that maximise power to
range from 10 - 80 % of 1 RM. A number of researchers (Baker 2001a; Cronin et
al., 2001; Stone et al., 2003; Dugan et al, 2004) have suggested that the
discrepancies could be due to the following factors:
i. Data collection and power calculation
Data collection was performed using different experimental setups, and this
affected the way power output was obtained (Dugan et al., 2004). In the
various studies examined, power output scores have been obtained using
only displacement data, through the use of a force platform to obtain vertical
ground reaction forces (VGRF), using an accelerometer system, and using a
combination of VGRF and displacement. The first three methods incur a
higher risk of accumulating error because data needs to be manipulated,
differentiated or integrated, which in turn increases the risk of error
accumulation in the results. The most appropriate method for now, seems to
be to utilise both force and displacement data to obtain power values.
ii. Inclusion or exclusion of body weight force in the calculation of power
Dugan et al. (2004) demonstrated how the optimal load for maximising
power could shift from 20 % to 70 % of 1 RM by removing body weight
from the calculation of power. However, it should be noted that the
inclusion of body weight need not be used for the calculation of power
during exercises such as the bench press, bench press throw, shoulder press,
and shoulder press throw. A number of previous studies utilising the squat
jump or countermovement jump did not include body weight in the
calculation of power, and arguments about whether this inclusion is required
still persist. Dugan et al. (2004) is of the opinion that body weight must be
included in the calculation because the contraction properties of the leg
extensors and the resulting force and velocity of the system are determined
by the total load, i.e. body mass and the bar to be accelerated.
2-9
iii. Different types of jump squat performance
Some studies had subjects perform jump squats using free weights, while
other studies utilise Smith rack type equipment. The comparison performed
by Dugan et al. (2004) did not obtain major differences in optimal power
loads between the two types of jump squats.
iv. Reporting of average versus peak power
Both peak and average power have been reported in previous studies. It is
technically correct to use either of these power values, but comparisons
across studies are difficult when different power values are used. Harman,
Rosenstein, Frykman and Rosenstein (1990) quoted studies that found peak
power to have higher correlation with the vertical jump performance than
average power. If the ultimate goal of a study is to maximise vertical jump
performance, it appears that peak power should be used (Dugan et al.,
2004).
v. Load intensities
The optimal load for power production is normally reported as a percentage
of 1 RM. However, the knee angle used during 1 RM squat varies from
study to study, ranging from full squats to quarter squats. Some studies
have also utilised different knee angles for the squat and the squat jump
within the same study. Performing a squat using free weights or in a Smith
machine will also affect the performance of the 1 RM squat. Therefore, it
may be better to report load intensities in terms of “body weights” (Dugan et
al. (2004). An example would be if the actual load utilised during 30 % of 1
RM was 20 kg and the body weight was 80 kg, the standardised unit in
terms of “body weights” reported would be 0.25.
vi. Standardisation of instructions
Previous studies have used the term “jump squat” to mean different
movements – either starting from a stationary position with a fixed knee
angle, or a movement that starts from a standing position and includes a
countermovement before a jump is performed for maximum height.
Therefore it is important to report instructions given to subjects so that
2-10
future researchers can replicate the movements involved and compare the
results given (Dugan et al., 2004).
vii. Projection or non-projection of weight implement
Cronin et al. (2001) suggested that the differences in optimal load for
maximising power differed depending on whether the barbell/load was
projected or not projected at the end of the movement. Studies that utilised
traditional barbell kinetics, such as during the performance of the bench
press or squat, have to stop the barbell at the end of the movement. This
action may not produce accurate measures of power as the subjects must
decelerate the barbell at the end of the movement (Elliott, Wilson & Kerr,
1989). Newton et al. (1996) found that using a 45% of 1 RM load, and an
explosive non-projected bench press movement, the deceleration phase was
approximately 40% of the concentric movement time, but the force output
during the deceleration phase was reduced to only a fraction of bar weight.
Additionally, it was found that the bench press throw allowed the bar to be
accelerated for 96% of the throw as opposed to 60% for the traditional
bench press. Cronin et al. (2001) compared movements that were projected
against movements that were not (rebound and concentric only bench press
and bench press throws) and obtained greater average and peak power,
average force and peak acceleration for the projected movements.
viii. Subject characteristics
Comparisons of the strongest and weakest subjects in some studies have
indicated that the percentage of 1 RM at which power occurs is different for
subjects with different strength abilities (Poprawski, 1988; Baker, 2001a;
Stone et al., 2003). These results contrasted however, over whether stronger
(Baker, 2001a) or weaker (Poprawski, 1988; Stone et al., 2003) subjects
required higher percentages of 1 RM to produce optimal power. Differences
in specific power training may have resulted optimal loads that differed
between untrained and trained subjects.
2-11
ix. Nature of the exercise
The load that produces maximal mechanical power output depended on the
type of exercise performed, with complex exercises such as the snatch and
clean-and-jerk resulting in much higher power outputs than the traditional
squat and bench press even though heavier loads can be lifted during the
latter exercises (Baker, 1995). However, the availability of equipment such
as the Plyometric Power System (PPS) saw power outputs being measured
through exercises such as the jump squats (Baker et al., 2001b) and bench
press throws (Baker et al., 2001b). Other studies have reported using
exercises such as the hang power clean (Kawamori, Crum, Blumert et al.,
2005), elbow flexion (Kaneko et al., 1983; Moss et al., 1997), knee flexion,
shoulder press and leg press. With the principle of specificity in mind, it
may be more appropriate to identify the optimal load for optimising power
for the specific exercise used during training and assessment, as this may be
most effective for power development (Kawamori et al., 2005).
This section offered some clarification as to why it may be important to
train at the load that maximise power, and why different load intensities (% of 1
RM) have been nominated for optimal power production. It is apparent that the
optimal load for maximising power remains unresolved, although the majority of
the studies indicate that heavy loads should not be used during training for power,
especially for untrained individuals. Thus, it may be important for further
research in this area to reasonably address the issues that have been discussed.
2.2.3 Assessment of Strength Qualities
Different training protocols have been shown to be effective in enhancing
different strength qualities. For example, training with heavy loads has been
demonstrated to improve maximal strength without perceptable changes in RFD
(Hakkinen, Komi & Alen, 1985a). Conversely, plyometric training has been
reported to increase RFD primarily, with little change to the production of
maximal force (Hakkinen et al., 1985b). Therefore, strength assessment can help
give accurate descriptions of the effect of various resistance training protocols on
each strength quality and also provide insights into the mechanics underpinning
the acute responses and chronic adaptations to strength training (Wilson &
2-12
Murphy, 1996). The assessment of strength qualities in this thesis involves body
mass and limb girth assessment, assessment of the changes in muscle CSA,
isoinertial strength and power assessment, and anaerobic power assessments, with
all procedures described in detail in Chapter 3. However, a brief explanation is
given on the choice of isoinertial assessment over isokinetic and isometric
assessment.
Isoinertial assessment has demonstrated superiority over other assessment
modes especially since most human physical performances are isoinertial in
nature (Murphy et al., 1994). As isoinertial assessment is more specific to
movements similar to dynamic performance, the ability for this assessment to
achieve high correlations with dynamic performance is great (Murphy et al.,
1994). Isoinertial assessment is also more sensitive to changes obtained through
isoinertial training when compared with isokinetic and isometric assessment,
possibly due to structural similarities (Abernethy & Jurimae, 1996). Isoinertial
strength assessment needs to be differentiated according to the different strength
qualities. Maximal isoinertial strength is usually determined using 1 - 3 RM.
Power may be determined from tests that require explosive efforts against body
weight or small external resistances. More recent studies investigating isoinertial
strength have employed force transducers attached to implements to be pushed or
thrown (e.g. barbells) to analyse the capacity to develop force over time. One
such example is the PPS (described in Chapter 3), which consists of a Smith rack
and barbell set that allows the collection of force-time data while permitting the
assessment of force production capabilities. The use of the PPS allows the barbell
to be projected, without the barbell falling back on to the performer. The PPS
allows the performer to move the barbell over almost the entire movement range
and has been shown to produce better force and power performances when
compared with traditional barbell movements that did not allow the release of the
barbell load at the end of the movement (Newton et al., 1996; Cronin et al., 2001).
Not many studies have utilised cycle tests to examine the efficacy of
resistance-training programmes. Earlier studies on the periodisation of strength
(Stone, Wilson, Blessing & Rozenek, 1983, O’Bryant, Byrd & Stone, 1988;
McGee, Jessee, Stone, Blessing, 1992) have used cycle tests to assess the capacity
to exert force and generate power. O’Bryant et al. (1988) compared a PRE
protocol against a linear periodised model, and found that both experimental
2-13
groups produced significant increases in the final maximum cycle ergometer
power output (p < 0.01), but that the periodised group reached a significantly
higher final maximum power output than the PRE group. These tests however,
were cycle sprints of longer durations (e.g., 50-s flat-out cycle or cycle to
exhaustion). Previous studies have also shown agreement between cycle tests,
such as the Wingate test, and measures of anaerobic power such as jumping (Bar-
Or, 1987). Wilson et al. (1993) reported that training at the load that maximised
mechanical power output was more effective in developing jumping and cycling
performance. A more recent cycle test is the 5 x 6-s test that allows for the
assessment of one-off power performance during the first sprint, repeated
measures of maximal power, and power decrement; giving an indication of the
ability to repeat power efforts and recover quickly (Newman, Tarpenning &
Marino, 2004). As a number of activities (such as resistance-training) require
approximately 6 s of an active movement phase performed repeatedly, the amount
of work and power that can be developed during this time could be of importance
to track the changes in such performances. Repeated bouts of cycling can also be
used to assess adaptations of anaerobic capacity to increased high-intensity work
performance (such as during resistance training). This has significant
implications for sports requiring repeated generation of explosive power
(Christian & Seymour, 1985). The 5 x 6-s test has yet to be utilised to evaluate
changes in total work, average peak power across sprints, power during the first
sprint, and work and power decrement brought about by different periodised
resistance programmes.
The current state of knowledge does not allow unambiguous
recommendation of one form of assessment over another. In fact, it is suggested
that several forms be used to assess subjects from a given sport or training
protocol (Abernethy et al., 1995). This is because not all modes of assessment are
equally sensitive to the various training protocols in use, and no single mode of
assessment provides all the information considered necessary as each could be
measuring different strength qualities. What may be essential to obtain valid
measures of strength and power is that the assessment is as specific as possible to
the movement used during sport or training, as too often the assessment used is
unrelated and incongruent to the movement patterns, contraction type, posture and
2-14
velocities used during the actual activity during training or competition (Cronin &
Owen, 2004).
2.3 Periodisation
Matvayev examined the concept of periodisation in 1961 (Stone, O’Bryant
& Garhammer, 1981). Matyavev’s model of periodisation embodies the
principles of the general adaptation syndrome as proposed by Dr Hans Seyle.
This theory proposes three phases of adaptation made by the body towards
demands placed on it through the stress of exercise or other activities. The first
phase is that of shock where the body has to confront new training stimulus and
muscle soreness, which usually accompanies it. Performance may decrease
during this phase. The second phase is that of adaptation by the body
(biochemical, structural, biomechanical, psychological) and performance
increases (Stone, O’Bryant, Garhammer, McMillan & Rozenek, 1982). There
may be a shift into the third phase, which is overtraining, where performance may
plateau or deteriorate. A reasonable amount of periodisation should help the body
avoid the overtraining phase, and provide a stimulus for continuous gains.
Bompa (1999) has further defined periodisation as the division of an
annual plan into smaller phases of training in order to allow a training programme
to be set into more manageable segments. Periodisation allows for periods of
active rest and adaptation through manipulations of intensity, volume and rest
(Herrick & Stone, 1996). The planning of variation (especially in volume and
intensity) and rest is used to avoid fluctuations of strength improvement-
decrement usually associated with PRE in which training intensity and volume are
added on continuously. Periodised training programmes, with planned periods of
rest and recovery, may help reduce the possibility of staleness and overtraining
(Fleck & Kraemer, 1997).
A number of models of periodisation have been designed and examined by
researchers like Stone et al. (1981), Stowers, McMillan, Scala et al. (1983),
Charniga, Gambetta, Kraemer et al. (1987), O’Bryant et al. (1988), McGee et al.
(1992), Mayhew et al. (1997), and Schiotz, Potteiger, Huntsinger and Denmark
(1998). The main tenet of periodisation however, is that there is a shift from
high-volume and low-intensity training, during the early parts of the preparation
phase, to an emphasis on high-intensity but low-volume training going into the
2-15
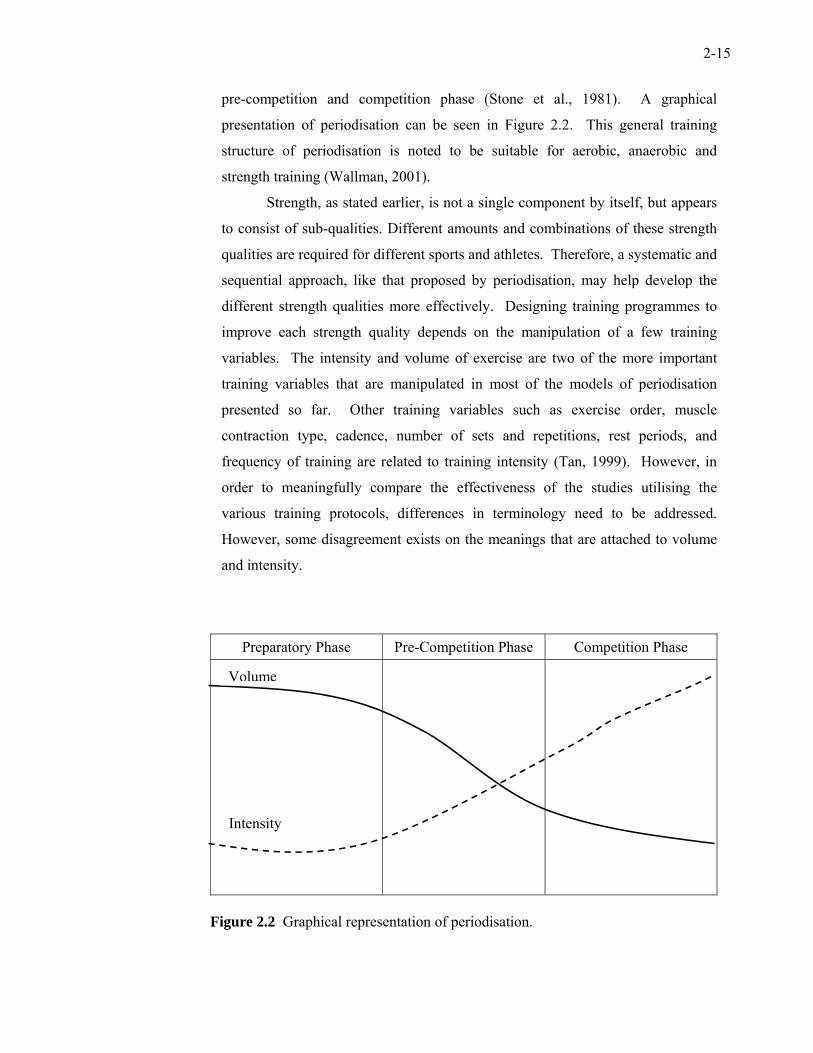
pre-competition and competition phase (Stone et al., 1981). A graphical
presentation of periodisation can be seen in Figure 2.2. This general training
structure of periodisation is noted to be suitable for aerobic, anaerobic and
strength training (Wallman, 2001).
Strength, as stated earlier, is not a single component by itself, but appears
to consist of sub-qualities. Different amounts and combinations of these strength
qualities are required for different sports and athletes. Therefore, a systematic and
sequential approach, like that proposed by periodisation, may help develop the
different strength qualities more effectively. Designing training programmes to
improve each strength quality depends on the manipulation of a few training
variables. The intensity and volume of exercise are two of the more important
training variables that are manipulated in most of the models of periodisation
presented so far. Other training variables such as exercise order, muscle
contraction type, cadence, number of sets and repetitions, rest periods, and
frequency of training are related to training intensity (Tan, 1999). However, in
order to meaningfully compare the effectiveness of the studies utilising the
various training protocols, differences in terminology need to be addressed.
However, some disagreement exists on the meanings that are attached to volume
and intensity.
Preparatory Phase Pre-Competition Phase Competition Phase
Figure 2.2 Graphical representation of periodisation.
Volume
Intensity
2-16
Intensity of strength training is normally taken as the percentage of
concentric or isometric maximal strength (Steinhofer, 1997). Fleck (1999)
referred to training intensity as the weight lifted or repetition maximum weight
used to perform a certain number of repetitions. Pauletto (1986) described
intensity as the power output of an exercise. As power is work per unit of time
(or force multiplied by the velocity of the movement), power output or intensity is
thus dependent upon the load and how fast this load is moved. Stone, O’Bryant,
Schilling et al. (1999) divided intensity of resistance training into training
intensity and exercise intensity. Training intensity is an estimate of the average
rate at which training proceeds and is calculated as the average mass lifted per
exercise, per session, per week, and so on. Exercise intensity is the actual power
output for a single repetition or a set of repetitions, and is monitored by relative
intensity (the % of 1 RM). Intensity of resistance training is inversely related to
the load lifted (Baechle, Earle & Wathen, 2000) – with fewer repetitions lifted for
heavier loads. Whether an individual trains for strength, hypertrophy or
endurance depends upon the number of repetitions lifted at a certain load. This
concept is linked to the ways a training load can be described. For example, as a
percentage of the highest load that can be lifted with proper form and technique
for only one repetition (1 RM), or as the heaviest load that can be lifted for a
specified number of repetitions. The former is normally quoted in percentages
(e.g., 30 % of 1 RM), while the latter is stated in RM (e.g., 8 RM = the load that
can be lifted exactly 8 times). For both conditions, it is assumed that the
performer had given his/her best performance, and another repetition or extra load
could not be lifted. Both methods can be used, and the studies performed by this
researcher utilise a combination of both to maintain training intensity within the
programmed ranges during training.
The volume of exercise relates to the amount of work performed during
the lifting/pushing phase of exercise, while work (volume) performed relates to
the force exerted and the distance the resistance is moved. Stone et al. (1999)
support this definition because in adults, the distance a mass is moved during a
resistance exercise is relatively constant. With gravity also considered a constant
value, volume can thus be approximated by the amount of mass/load that is lifted.
2-17
Therefore, training volume is usually approximated by multiplying the number of
repetitions by the resistance (load) used (Fleck & Kraemer, 1988). This estimate
of volume is identified as volume load (Kramer, Stone, O’Bryant et al., 1997).
However, Fleck (1999) described training volume in reference to the total number
of repetitions performed (number of sets x number of repetitions x number of
exercises) without reference to the load. Volume in this study, will be expressed
as the total mass lifted per week and will be calculated as being equivalent to
number of repetitions per set x number of sets per session x mass lifted per set x
number of training sessions per week (Willoughby, 1993). The changes in
training intensity and volume through a training period, as utilised in periodised
models, have been indicative of superior results when compared to programmes
that have used constant volume and intensity (Stone et al., 1981; O’Bryant et al.,
1988; Willoughby, 1993).
Since the proposal of the concept of periodisation, two basic models have
surfaced. The first model that was used was termed classic, traditional, linear, or
more recently stepwise periodisation. In the last decade or so, another model has
emerged, and has been termed the non-linear, non-traditional or undulating
periodisation model (Baker, Wilson & Carlyon, 1994; Rhea, Ball, Phillips &
Burkett, 2002; Kraemer,O’Bryant, Pendlay,Plisk, & Stone, 2004b). This second
model has also been termed mixed-methods resistance training by Newton,
Hakkinen, Hakkinen et al. (2002). It should be noted here that there is
disagreement over the terms used to name the different models. There are
suggestions that all periodised programmes are non-linear or undulating to a
certain extent and that linear periodisation does not exist as this would go against
the concept of variation (Kraemer et al., 2004b). Since linear and undulating
periodisation seem to be more accepted currently, these two terms will be utilised
in this study until conformity in terminology is achieved. Each of these models
will be discussed in the following sections.
2.3.1 Linear Periodisation
The Linear Periodisation (LP) model was proposed by Matvayev in an
attempt to maximise strength development (Willoughby, 1993; Baker et al.,
1994). The model is characterised by training which starts with high-volume and
low-intensity exercises, with volume reduced as intensity is increased as the
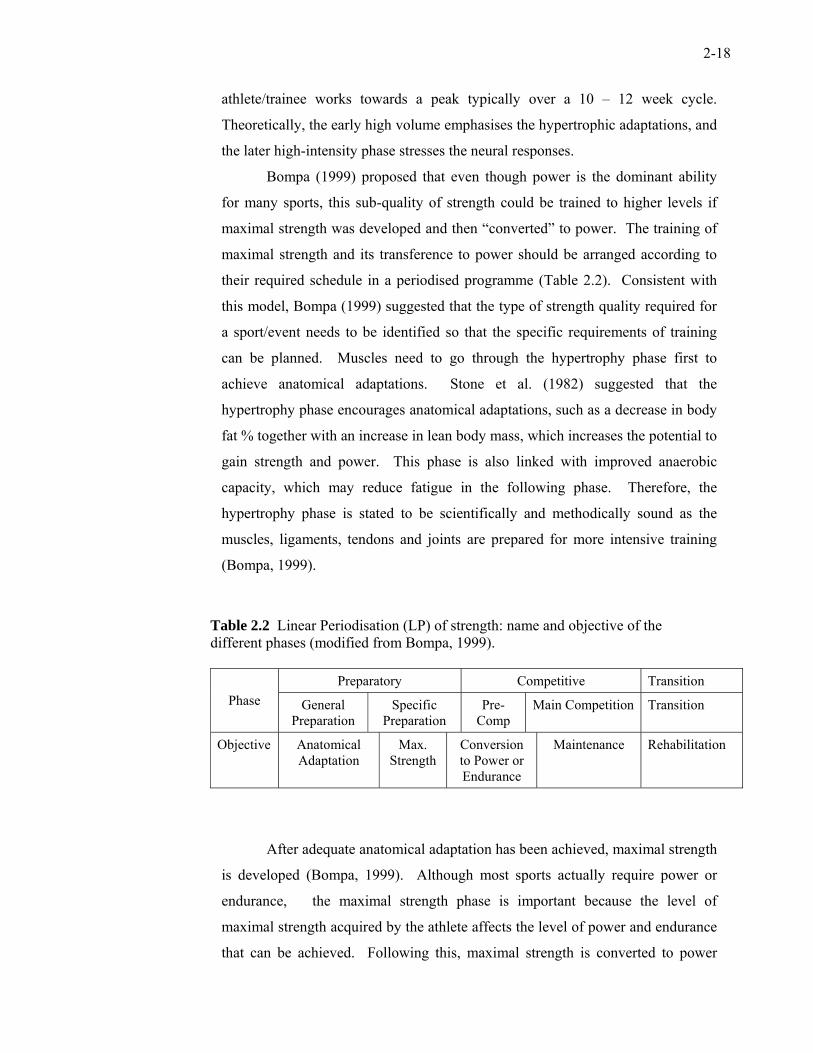
2-18
athlete/trainee works towards a peak typically over a 10 – 12 week cycle.
Theoretically, the early high volume emphasises the hypertrophic adaptations, and
the later high-intensity phase stresses the neural responses.
Bompa (1999) proposed that even though power is the dominant ability
for many sports, this sub-quality of strength could be trained to higher levels if
maximal strength was developed and then “converted” to power. The training of
maximal strength and its transference to power should be arranged according to
their required schedule in a periodised programme (Table 2.2). Consistent with
this model, Bompa (1999) suggested that the type of strength quality required for
a sport/event needs to be identified so that the specific requirements of training
can be planned. Muscles need to go through the hypertrophy phase first to
achieve anatomical adaptations. Stone et al. (1982) suggested that the
hypertrophy phase encourages anatomical adaptations, such as a decrease in body
fat % together with an increase in lean body mass, which increases the potential to
gain strength and power. This phase is also linked with improved anaerobic
capacity, which may reduce fatigue in the following phase. Therefore, the
hypertrophy phase is stated to be scientifically and methodically sound as the
muscles, ligaments, tendons and joints are prepared for more intensive training
(Bompa, 1999).
Table 2.2 Linear Periodisation (LP) of strength: name and objective of the different phases (modified from Bompa, 1999).
Preparatory Competitive Transition
Phase General Preparation
Specific Preparation
Pre- Comp
Main Competition Transition
Objective Anatomical Adaptation
Max. Strength
Conversion to Power or Endurance
Maintenance Rehabilitation
After adequate anatomical adaptation has been achieved, maximal strength
is developed (Bompa, 1999). Although most sports actually require power or
endurance, the maximal strength phase is important because the level of
maximal strength acquired by the athlete affects the level of power and endurance
that can be achieved. Following this, maximal strength is converted to power
2-19
and/or endurance, usually at the end of the preparatory phase and continues
through to the beginning of the competitive phase. Subsequent to this, a
maintenance phase is introduced to sustain the standards achieved during the
earlier phases (Hoffman & Kang, 2003). Two to three sessions per week (Fleck
& Kraemer, 1997) have to be put aside for training strength and power/endurance
to maintain the elements of strength. This was because studies have shown that
when no maintenance sessions were held for strength, performance in most
strength qualities will decrease (Wallman, 2001). Training for strength and
power/endurance is ceased five to seven days before the main competition as the
reduced training volume and intensity would allow physiological recovery. The
end of competition will see the transition phase where the athlete is allowed time
to rejuvenate and rehabilitate injuries (Bompa, 1999).
The basic LP concept has been used in several studies, which are listed in
Table 3.3. It should be noted that although the general principles for LP have
been adhered to, each study utilised different durations for the hypertrophy,
maximal strength and power conversion phases. There are also variations in
training volume and intensity among the studies. All of the studies in Table 3.3
have compared LP training programmes with PRE training, where the RM load is
held consistent, with the exception of the study by Mayhew et al. (1997), where
the periodised programme was not compared to any other group. The results from
the study by Stone et al. (1981) reported that the 1 RM squat and the vertical jump
performances in the LP group were significantly better than the PRE group.
However, no values for percent increase were given. Stowers et al. (1983)
indicated that the LP group improved on the 1 RM squat by 27 %, and this result
was significantly better than the 1 x 10 RM and 3 x 10 RM groups (14 % and 20
% increases respectively). The periodised group in the O’Bryant et al. (1988)
study achieved significantly better results than the PRE group not only in the 1
RM squat (38 % improvement), but also in cycle power performance (17 %
improvement). Improved results from the periodised group were also obtained
from Willoughby’s study (1993), using men with resistance-training experience.
Bench press 1 RM results improved significantly by 28 % and 23 % respectively,
while the 1 RM squat improved significantly by 48 % and 34 % respectively.
These results indicate that LP produced better strength and power gains compared
to PRE programmes.
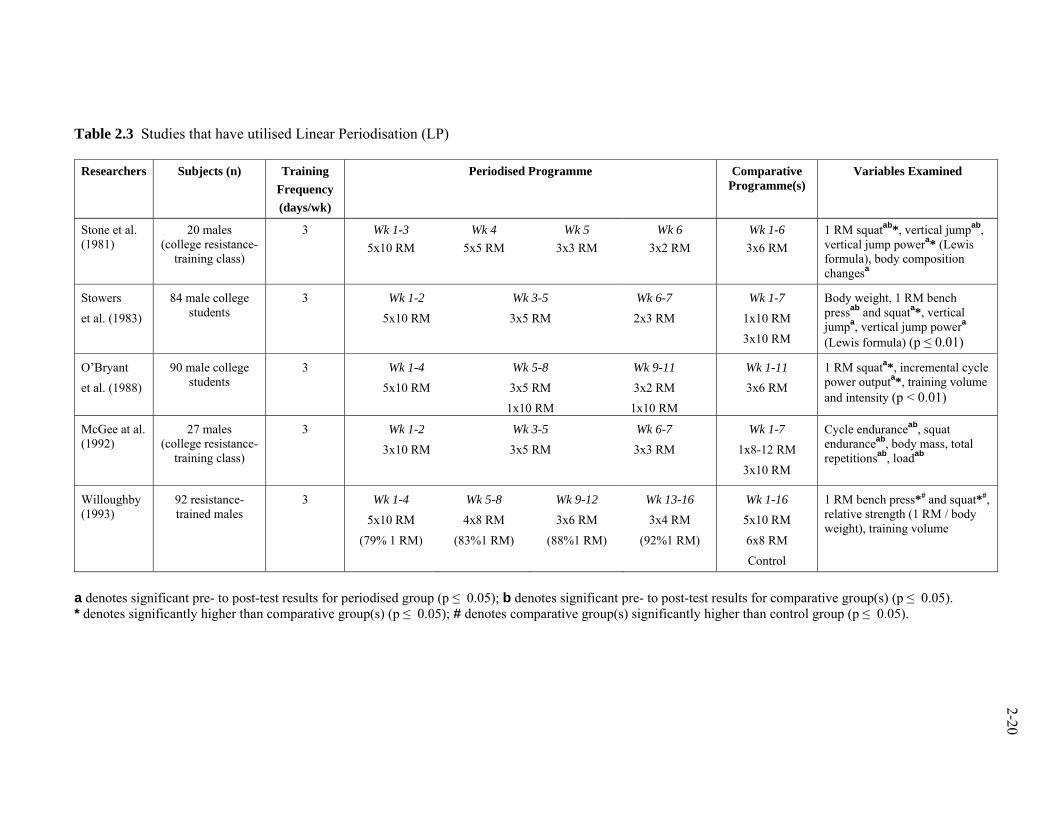
Table 2.3 Studies that have utilised Linear Periodisation (LP)
Researchers Subjects (n) Training Frequency (days/wk)
Periodised Programme Comparative Programme(s)
Variables Examined
Stone et al. (1981)
20 males (college resistance-
training class)
3 Wk 1-3 5x10 RM
Wk 4 5x5 RM
Wk 5 3x3 RM
Wk 6 3x2 RM
Wk 1-6 3x6 RM
1 RM squatab*, vertical jumpab, vertical jump powera* (Lewis formula), body composition changesa
Stowers et al. (1983)
84 male college students
3 Wk 1-2 5x10 RM
Wk 3-5 3x5 RM
Wk 6-7 2x3 RM
Wk 1-7 1x10 RM 3x10 RM
Body weight, 1 RM bench pressab and squata*, vertical jumpa, vertical jump powera (Lewis formula) (p ≤ 0.01)
O’Bryant et al. (1988)
90 male college students
3 Wk 1-4 5x10 RM
Wk 5-8 3x5 RM 1x10 RM
Wk 9-11 3x2 RM
1x10 RM
Wk 1-11 3x6 RM
1 RM squata*, incremental cycle power outputa*, training volume and intensity (p < 0.01)
McGee at al. (1992)
27 males (college resistance-
training class)
3 Wk 1-2 3x10 RM
Wk 3-5 3x5 RM
Wk 6-7 3x3 RM
Wk 1-7 1x8-12 RM 3x10 RM
Cycle enduranceab, squat enduranceab, body mass, total repetitionsab, loadab
Willoughby (1993)
92 resistance-trained males
3 Wk 1-4 5x10 RM
(79% 1 RM)
Wk 5-8 4x8 RM
(83%1 RM)
Wk 9-12 3x6 RM
(88%1 RM)
Wk 13-16 3x4 RM
(92%1 RM)
Wk 1-16 5x10 RM 6x8 RM Control
1 RM bench press*# and squat*#, relative strength (1 RM / body weight), training volume
a denotes significant pre- to post-test results for periodised group (p ≤ 0.05); b denotes significant pre- to post-test results for comparative group(s) (p ≤ 0.05). * denotes significantly higher than comparative group(s) (p ≤ 0.05); # denotes comparative group(s) significantly higher than control group (p ≤ 0.05).
2-20
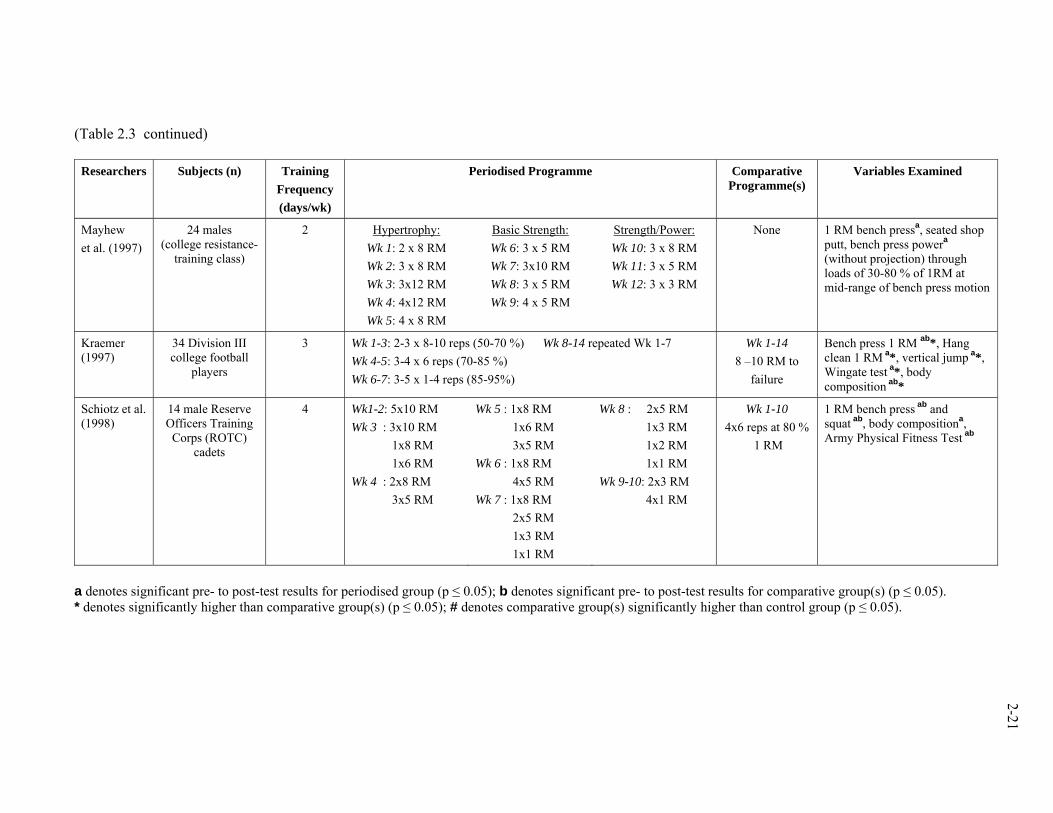
(Table 2.3 continued)
Researchers Subjects (n) Training Frequency (days/wk)
Periodised Programme Comparative Programme(s)
Variables Examined
Mayhew et al. (1997)
24 males (college resistance-
training class)
2 Hypertrophy: Wk 1: 2 x 8 RM Wk 2: 3 x 8 RM Wk 3: 3x12 RM Wk 4: 4x12 RM Wk 5: 4 x 8 RM
Basic Strength: Wk 6: 3 x 5 RM Wk 7: 3x10 RM Wk 8: 3 x 5 RM Wk 9: 4 x 5 RM
Strength/Power: Wk 10: 3 x 8 RM Wk 11: 3 x 5 RM Wk 12: 3 x 3 RM
None 1 RM bench pressa, seated shop putt, bench press powera (without projection) through loads of 30-80 % of 1RM at mid-range of bench press motion
Kraemer (1997)
34 Division III college football
players
3 Wk 1-3: 2-3 x 8-10 reps (50-70 %) Wk 4-5: 3-4 x 6 reps (70-85 %) Wk 6-7: 3-5 x 1-4 reps (85-95%)
Wk 8-14 repeated Wk 1-7 Wk 1-14 8 –10 RM to
failure
Bench press 1 RM ab*, Hang clean 1 RM a*, vertical jump a*, Wingate test a*, body composition ab*
Schiotz et al. (1998)
14 male Reserve Officers Training
Corps (ROTC) cadets
4 Wk1-2: 5x10 RM Wk 3 : 3x10 RM 1x8 RM 1x6 RM Wk 4 : 2x8 RM 3x5 RM
Wk 5 : 1x8 RM 1x6 RM 3x5 RM Wk 6 : 1x8 RM 4x5 RM Wk 7 : 1x8 RM 2x5 RM 1x3 RM 1x1 RM
Wk 8 : 2x5 RM 1x3 RM 1x2 RM 1x1 RM Wk 9-10: 2x3 RM 4x1 RM
Wk 1-10 4x6 reps at 80 %
1 RM
1 RM bench press ab and squat ab, body compositiona, Army Physical Fitness Test ab
a denotes significant pre- to post-test results for periodised group (p ≤ 0.05); b denotes significant pre- to post-test results for comparative group(s) (p ≤ 0.05). * denotes significantly higher than comparative group(s) (p ≤ 0.05); # denotes comparative group(s) significantly higher than control group (p ≤ 0.05).
2-21
2-22
These encouraging results for the LP model were however, confounded
because the training volume or workload for the programmes under comparison
were not equalised. Baker et al. (1994) estimated that the subjects in the PRE
groups in studies by Stone et al. (1981) and O’Bryant et al. (1988) performed
approximately only 56 % of the LP group’s training volume. Studies by Stone et
al. (1981), Stowers et al. (1983), O’Bryant et al. (1988), and McGee et al. (1992)
also did not have matched volumes and intensities between the different training
protocols. Kraemer (1997) examined a series of strength training programmes for
American football players with the third study comparing a linear periodisation
programme with a 1-set circuit comprising nine exercises using weight training
machines. Results from this study found that a periodised multiple-set
programme was superior to a single-set programme. These results however, do
not suggest that the use of periodisation was the main reason for improved
performances but that comparisons between single-set and multiple-set training
have indicated that higher training volumes are more effective than lower
volumes for increasing hypertrophy and strength (Schlumberger, Stec &
Schmidtbleicher, 2001).
The inability of the previously mentioned studies to equalise training
volume and intensity made it difficult to assess if the differences between training
programmes were due to the effectiveness of the structure of that programme or
because of differences in volume and intensity. Among the earliest to attempt to
equate training volume and intensity was Willoughby (1993). Resistance-trained
men were put into groups following two non-periodised programmes (5 x 10 RM
and 6 x 8 RM) and a classic periodised programme for 16 weeks. Training
volume, but not repetitions, was partially equated during the first eight weeks of
training. Intensity was also not controlled. After week eight, the periodised
group had a lower training volume, but still managed to achieve better 1 RM
scores. This may indicate that a decrease in volume may be responsible for the
greater improvement in 1 RM strength score, and that training periods exceeding
eight weeks may be needed for LP programmes to show better results than non-
periodised programmes.
Most of the previously mentioned studies also used subjects who were
novices in training. As these types of subjects show greater improvement after a
short period of training, results from the studies may not actually indicate the
2-23
efficacy of the training programme (Hakkinen and Komi, 1985). Only the study
conducted by Willoughby (1993) used resistance-trained subjects, but the results
similarly supported the positive effects of periodised training over progressive
resistance training. The Willoughby (1993) study produced data that suggested
the periodised training programme continued to help the subjects improve their
performance, while the progressive resistance groups stagnated after four to six
weeks of training. Fleck and Kraemer (1997) presented their view that the
manipulation of training volume and intensity may need to be different for
strength-trained and untrained subjects. Untrained subjects may need the classical
structure of beginning with high volume and low intensity, followed by lower
volume and higher intensity. However, trained subjects may not need to decrease
the volume of training as much over the training period because they have a
higher ability to tolerate and recover from higher volume and higher intensity
training. More research is needed to determine the suitable structure of
periodisation for trained and untrained subjects.
The studies on linear periodisation have mostly assessed strength qualities
like maximal strength, power and muscular endurance. The usual measurements
have been the 1 RM bench press and the 1 RM squat for maximal strength (Stone
et al, 1981; Stowers et al., 1983; Willoughby, 1993). Some studies have assessed
changes in lean body mass by measuring sum of skinfolds (Mayhew et al., 1997)
and underwater weighing (Stone et al., 1981). Changes in power were assessed
through the vertical jump (Stone et al, 1981; Stowers et al., 1983; Willoughby,
1993), the seated shot putt (Mayhew et al., 1997) and incremental cycle ergometer
exercise (O’Bryant et al., 1988). McGee et al. (1992) was the only study to assess
the effects of periodised strength training on muscular endurance through a test of
cycling to exhaustion. It is clear that more data on the effects of periodised
training is needed, especially on power.
2.3.2 Undulating Periodisation
Poliquin (1988) proposed a periodised model that is characterised by a
more undulatory manipulation of volume and intensity throughout a training
cycle. Changes in volume and intensity were made according to 2-wk cycles.
Poliquin suggested that a prolonged linear intensification model such as that
proposed by Stone et al. (1982) might lead to neural fatigue, which in turn would
2-24
compromise strength gains. Therefore, it might theoretically be better to alternate
short periods of high-volume training (stressing hypertrophic responses) with
short periods of high-intensity training (stressing the neural responses). This
variance could also be arranged within a microcycle, rather than be alternated
every one or two microcycles, so that intensity and volume could vary on a daily
or weekly basis (Newton, Hakkinen, Hakkinen et al., 2002). These undulating
models have been termed non-linear periodisation because of the changes in
volume and intensity used. Most undulating models have been undertaken for 12
wk, and after a short active rest period, the cycle is repeated. This model may be
most appropriate for team and individual sports in which the competition season
is long, and matches may have to be played weekly or biweekly (Fleck &
Kraemer, 1997).
Baker et al. (1994) designed a UP model that alternately increased and
decreased training volume and intensity regularly at 2-wk intervals, and compared
it against a PRE group with constant volume and intensity, and a LP model using
decreasing volume and increasing intensity. Training volume and relative
intensity were equated among the groups for the training period (12 wk).
Assessment of strength and anthropometric qualities showed that all three training
programmes improved measures of 1 RM bench press and squat, and vertical
jump height. Bench press 1 RM improvement was 12, 11 and 16 % for the PRE,
LP and UP groups respectively. The increase in 1 RM squat was 26, 18 and 28 %
respectively, while the vertical jump performance increased by 9, 4 and 10 %
respectively. The results of this study indicated that when training was equated
for volume (repetitions) and intensity, there was no significant difference in
strength gains between training models for strength-trained men. It would seem
that variation and structure (Willoughby, 1993; Schiotz et al., 1998), which is
central to the concept of periodisation, is less important than training volume for
improving strength and vertical jump performance with short-duration resistance-
training programmes. Although the investigators considered the training groups
equated for volume and intensity, volume was represented by the number of
repetitions performed, and not by workload. However, the use of repetitions has
been challenged as an unsatisfactory measure of training volume as the loads
lifted during training are necessary for a better estimation of workload (Stone et
al., 1999).
2-25
Kraemer (1997) also proposed an undulating model that featured
strength/power training days and body-building hypertrophy days on American
Football players. Variation was also designed within the strength and power days
as subjects performed 3 - 5 repetitions of 85-90 % 1 RM, 8 - 10 repetitions of 65-
70 % 1 RM, and 12 - 15 repetitions of 40-60 % of 1 RM per set, with 2 - 4 sets
performed for each exercise. This UP program consisted of 12 predominantly
free-weight exercises, and was compared to a single-set 9 - exercise programme
utilising weight machines. The periodised training group trained four times per
week while the single-set group trained three times. The results suggest that the
undulating model resulted in significantly greater changes in percent body fat,
total body mass, and variables of strength, power and endurance, while the single-
set programme managed to achieve non-significant improvements in the 1 RM
bench press, vertical jump height and body-fat percent. A number of factors
made comparisons between programmes difficult; both training groups had
training volumes and intensity that were not equal, different training frequencies
per week, and utilised different training modes.
The study by Stone, Potteiger, Pierce et al. (2000) compared the efficacy
of the same PRE and LP programmes used by Baker et al. (1994) with a UP
model that was named the overreaching periodised model, which had brief (1-2
wk) increases in volume or intensity before returning to normal training, in order
to avoid training to failure. The more intense phases were supposed to stimulate
the physiological condition so that a delayed increase in performance is achieved
2 – 5 wk after the return to normal training. The non-periodised group and the
linear periodised group were equalised on repetitions, but the overreaching group
did significantly fewer repetitions. The researchers took this to be acceptable as
the purpose of the study was to concentrate on performance changes through the
training programmes. The results indicated that the periodised models produced
better 1 RM scores than the non-periodised model when repetitions were
equalised, and also when fewer repetitions were performed. This seems to
reinforce that the manipulation and sequencing of volume and intensity guides the
final outcome of a training programme, contrasting with the conclusions of Baker
et al. (1994).
Newton et al. (2002) used a form of the undulating model where each
microcycle contained three training days, and one day each was allotted for
2-26
hypertrophy, maximal strength and power. The training period was for 10 wk and
was used to compare the efficacy of this periodised model on increasing power
and strength in young (30 ± 5 y) and older (61 ± 4 y) men. Three training
sessions were held a week for 11 weeks. One day a week was designated a
hypertrophy day, a strength day and a power day respectively. This study
examined the effects of mixed-methods training on isometric strength, force and
power output, and differences in the development of strength qualities due to age.
The results suggest that mixed-methods training can elicit improvement in
isometric strength, force and power output for men of both age categories.
Unfortunately, this study was unable to furnish details on the effectiveness of
mixed-methods training as compared to other models of strength training as no
comparative study was done.
Rhea et al. (2002) investigated a model that was similar to that of Newton
et al. (2002), and named it daily UP. This model was compared to an LP model
with training volume and intensity equated throughout the training period of 12
wk. The training volume and intensity was altered differently for each group, but
with total volume (total repetitions performed) and intensity (RM) equated by the
end of the training period. The LP group altered volume and intensity across four
microcycles, while the UP group altered volume and intensity on a daily basis.
Training using daily UP was found to have produced greater percent gains in the
bench press (LP: 14.4 %, UP: 28.8 %) and leg press (LP: 25.7 %, UP: 55.8 %)
than training with LP. Statistical significance however, was observed only in the
leg press. Although the subjects from this study were reported to be previously
strength-trained (5.2 y), the large strength increments reported are normally
observed in males of lesser training experience (Rhea 2004). A summary of these
studies is presented in Table 2.4.
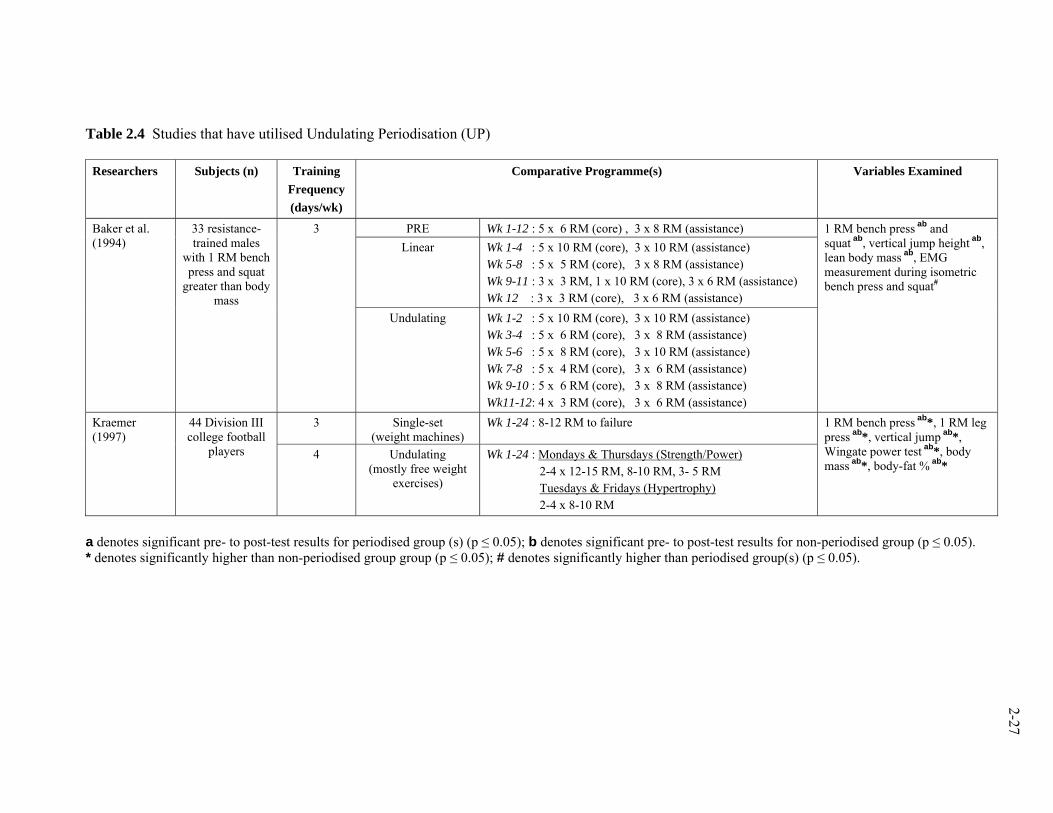
Table 2.4 Studies that have utilised Undulating Periodisation (UP)
Researchers Subjects (n) Training Frequency (days/wk)
Comparative Programme(s) Variables Examined
PRE Wk 1-12 : 5 x 6 RM (core) , 3 x 8 RM (assistance) Linear Wk 1-4 : 5 x 10 RM (core), 3 x 10 RM (assistance)
Wk 5-8 : 5 x 5 RM (core), 3 x 8 RM (assistance) Wk 9-11 : 3 x 3 RM, 1 x 10 RM (core), 3 x 6 RM (assistance) Wk 12 : 3 x 3 RM (core), 3 x 6 RM (assistance)
Baker et al. (1994)
33 resistance-trained males
with 1 RM bench press and squat
greater than body mass
3
Undulating Wk 1-2 : 5 x 10 RM (core), 3 x 10 RM (assistance) Wk 3-4 : 5 x 6 RM (core), 3 x 8 RM (assistance) Wk 5-6 : 5 x 8 RM (core), 3 x 10 RM (assistance) Wk 7-8 : 5 x 4 RM (core), 3 x 6 RM (assistance) Wk 9-10 : 5 x 6 RM (core), 3 x 8 RM (assistance) Wk11-12: 4 x 3 RM (core), 3 x 6 RM (assistance)
1 RM bench press ab and squat ab, vertical jump height ab, lean body mass ab, EMG measurement during isometric bench press and squat#
3 Single-set (weight machines)
Wk 1-24 : 8-12 RM to failure Kraemer (1997)
44 Division III college football
players 4 Undulating (mostly free weight
exercises)
Wk 1-24 : Mondays & Thursdays (Strength/Power) 2-4 x 12-15 RM, 8-10 RM, 3- 5 RM Tuesdays & Fridays (Hypertrophy) 2-4 x 8-10 RM
1 RM bench press ab*, 1 RM leg press ab*, vertical jump ab*, Wingate power test ab*, body mass ab*, body-fat % ab*
a denotes significant pre- to post-test results for periodised group (s) (p ≤ 0.05); b denotes significant pre- to post-test results for non-periodised group (p ≤ 0.05). * denotes significantly higher than non-periodised group group (p ≤ 0.05); # denotes significantly higher than periodised group(s) (p ≤ 0.05).
2-27
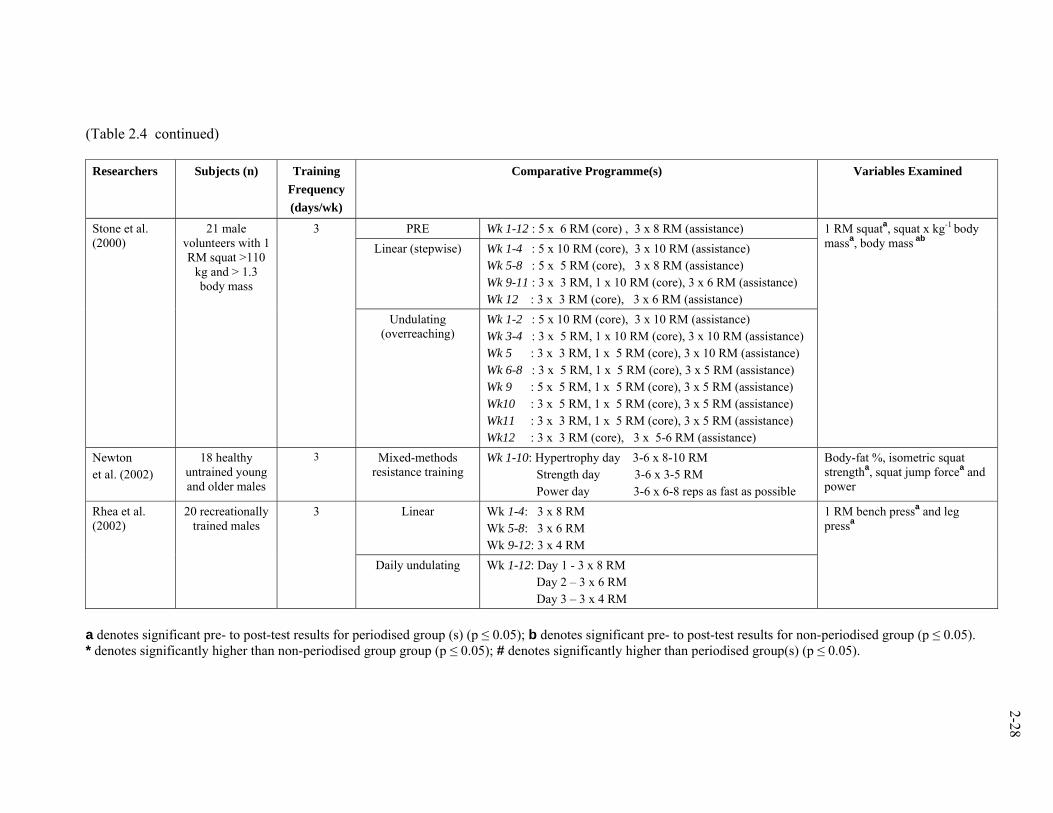
(Table 2.4 continued)
Researchers Subjects (n) Training Frequency (days/wk)
Comparative Programme(s) Variables Examined
PRE Wk 1-12 : 5 x 6 RM (core) , 3 x 8 RM (assistance) Linear (stepwise) Wk 1-4 : 5 x 10 RM (core), 3 x 10 RM (assistance)
Wk 5-8 : 5 x 5 RM (core), 3 x 8 RM (assistance) Wk 9-11 : 3 x 3 RM, 1 x 10 RM (core), 3 x 6 RM (assistance) Wk 12 : 3 x 3 RM (core), 3 x 6 RM (assistance)
Stone et al. (2000)
21 male volunteers with 1 RM squat >110
kg and > 1.3 body mass
3
Undulating (overreaching)
Wk 1-2 : 5 x 10 RM (core), 3 x 10 RM (assistance) Wk 3-4 : 3 x 5 RM, 1 x 10 RM (core), 3 x 10 RM (assistance) Wk 5 : 3 x 3 RM, 1 x 5 RM (core), 3 x 10 RM (assistance) Wk 6-8 : 3 x 5 RM, 1 x 5 RM (core), 3 x 5 RM (assistance) Wk 9 : 5 x 5 RM, 1 x 5 RM (core), 3 x 5 RM (assistance) Wk10 : 3 x 5 RM, 1 x 5 RM (core), 3 x 5 RM (assistance) Wk11 : 3 x 3 RM, 1 x 5 RM (core), 3 x 5 RM (assistance) Wk12 : 3 x 3 RM (core), 3 x 5-6 RM (assistance)
1 RM squata, squat x kg-1 body massa, body mass ab
Newton et al. (2002)
18 healthy untrained young and older males
3 Mixed-methods resistance training
Wk 1-10: Hypertrophy day 3-6 x 8-10 RM Strength day 3-6 x 3-5 RM Power day 3-6 x 6-8 reps as fast as possible
Body-fat %, isometric squat strengtha, squat jump forcea and power
Linear
Wk 1-4: 3 x 8 RM Wk 5-8: 3 x 6 RM Wk 9-12: 3 x 4 RM
Rhea et al. (2002)
20 recreationally trained males
3
Daily undulating Wk 1-12: Day 1 - 3 x 8 RM Day 2 – 3 x 6 RM Day 3 – 3 x 4 RM
1 RM bench pressa and leg pressa
a denotes significant pre- to post-test results for periodised group (s) (p ≤ 0.05); b denotes significant pre- to post-test results for non-periodised group (p ≤ 0.05). * denotes significantly higher than non-periodised group group (p ≤ 0.05); # denotes significantly higher than periodised group(s) (p ≤ 0.05).
2-28
2-29
An important difference between LP and UP programmes is that a key
element in LP is the build-up to higher intensities over time, whereas the
undulating models varies volume and intensity within the training microcycle, or
even from week to week. Intensity and volume also varies for linear
periodisation, but the variation is not as dramatic and further studies are needed to
determine the structure of variation required within any resistance training
programme that will bring about optimal gains in strength qualities. Comparison
between these two programmes have not been frequent, and as noted by Fleck
(1999) in his review, the ability to generalise the results were limited by the use of
different training frequencies, training exercises and training volume. For
example, most studies used a training frequency of three times per week, but
Kraemer (1997) compared two groups, one that trained three times a week while
the other trained four times a week. A large variation exists in the number of
exercises used in the studies; Baker et al. (1994) used a combination of 17
exercises, Kraemer (1997) used 20 exercises for one programme and 21 for the
other, while Stone et al. (2000) used only six. These variations in training
frequency and the number of exercises used led to differences in training volume
and workloads in the studies, making comparisons difficult. Thus, more
comparative research on these two models is still warranted.
2.3.3 Sex Issues in Periodisation
(i) Sex Differences in Strength
Previous strength studies on women and their response to resistance exercise
have suggested that there were no qualitative differences in strength between men
and women. The only difference appears to be linked to the fact that women have
smaller body sizes and lower lean body masses than men (Wilmore, 1974).
Faigenbaum (2000) notes that the main strength-related anatomical differences
between men and women are in body height, body mass, muscle fibre size, the
proportion of hip width to shoulder width, and the proportion of body fat to body
weight. A taller, broader skeletal frame can support more muscle tissue and
provide a leverage advantage over smaller, narrower frames. These differences
explain in part, the strength and power advantage the average man has over
women due to a greater amount of muscle tissue (Shepard, 2000).
2-30
The absolute muscle strength of women is approximately 60 % of the value
achieved by men (Heyward, Johannes-Ellis & Romer, 1986; Wilmore, 1974).
However, if strength data are expressed relative to total body mass or expressed
per unit of lean body mass, sex-related differences become much smaller. Sex
differences in strength are smaller for the legs than for the arms (Heyward et al.,
1986; Holloway & Baechle, 1990). This is most likely due to the levels of fat-
free mass which are lower for women in the upper body, and are reported to
account for 97 % of the sex differences in strength (Bishop, Cureton & Collins,
1987). Lower fat-free mass levels may also explain why it seems more difficult
to develop and maintain upper-body strength in women (Fry, Kraemer, Weseman
et al., 1991).
Holloway and Baechle (1990), and Fleck and Kraemer (1997) have noted
that average women have approximately two thirds of the power output of
average men. There are differences again between upper- and lower-body data
on power output, and these differences exist even for competitive men and
women weight-lifters. Women seem to generate less power per unit of muscle,
even though there is no consistent evidence that muscle fibre type varies by sex
within a particular muscle. The similarity in muscle fibre type between sexes is
supported by an earlier study by Costill, Daniels, Evans et al. (1976) that
indicated no sex differences in the relative proportions of slow- and fast-twitch
fibres. Fleck and Kraemer (1997) suggest that the explanation may be found in
connection with the RFD difference between men and women. It appears that
skeletal muscle RFD is slower for the average woman than for the average man
(Hakkinen, 1993), and there is evidence to show that RFD could affect power
output (McBride et al., 1999; Haff, Carlock, Hartman et al., 2005).
It needs also to be noted that other than differences between the sexes,
there is as considerable a range of strength abilities among men and among
women, as among the same sex. Kraemer, Mazzetti, Nindl et al. (2001) suggest
that with longer periods of resistance training, the initial sex differences in many
muscular performances may be significantly reduced. This may result in some
women being stronger than some men. Therefore, rather than focus on the
differences in muscular performances, the goal of any resistance-training
2-31
programme should be to develop any individual towards achieving his/her genetic
potential. The efficacy of periodised resistance-training programmes for women
need to be further examined for these reasons.
(ii) Periodisation of Strength Studies on Women
Considering that about four decades have gone by since periodisation was
introduced, there have not been many studies on the many aspects that are
involved. There are even fewer studies that have examined the effects of
periodised resistance-training on women. Previous resistance-training studies on
women have utilised PRE, and have found no qualitative difference between men
and women for gains in strength. Training differences are more quantitative and
mostly due to differences in size and a lower lean body mass for women
(Wilmore, 1974). Current knowledge of the responses of female subjects to
resistance training is based largely on the responses of young adult males
(Shepard, 2000).
One of the earliest published periodisation studies on women was
performed by Herrick and Stone (1996). The study compared a PRE programme
(15 wk of 3 x 6 RM) with an LP programme (8 wk of 3 x 10 RM, 2 wk of 3 x 4
RM, and 2 wk of 3 x 2 RM), with workloads equalised between the programmes.
One week of active rest (aerobic training on a Lifecycle ergometer at a low
resistance setting) was given between each cycle of the LP programme. The
study did not find any significant differences between the two training protocols,
suggesting that training volume may be more important than how volume is
structured within a training programme (Baker et al., 1994). However, the
periodised group had continuing linear improvement, while the progressive
resistance group was plateuing towards the end. The results for periodisation may
have been more indicative if training frequency was more than the scheduled
twice a week training done in this study, or performed through a longer
experimental period.
Kraemer, Ratamess, Fry et al. (2000) performed a comparison between
single-set circuit resistance training and an undulating periodised multiple-set
protocol on female competitive collegiate tennis players. Exercises that were
specific to tennis movements were selected. Subjects trained 2 - 3 times a week
depending on their match schedules for a training period of nine months. The
2-32
authors found that there was a significant increase in power output for the
periodised group only. Maximum strength was found to have increased
significantly after four, six and nine months for the periodised group, while the
single-set group had increases during the test only at the fourth month. The
periodised group also had improvements in tennis serve velocity that were not
demonstrated by the single-set group. This suggests that multiple-set periodised
resistance training that utilised sport-specific movements is superior to a single-
set protocol in the development of strength qualities and also sport-specific
performances. However, similar to the study carried out by Kraemer (1997), both
training groups had training volumes and intensities that were not equal, with the
periodised group performing higher volumes. It has been previously suggested
that periodised programmes with higher training volumes will promote better
strength and power responses compared with programmes of lower volumes
(Baker et al., 1994; Schiotz et al., 1998).
The next periodised training study on women was designed by Marx,
Ratamess, Nindl et al. (2001) to compare the effects of periodisation and low-
volume, single-set resistance training on muscular performances and
anthropometric measures over a period of 24 wk. One group of subjects
performed one set to failure of 8 - 12 repetitions (low volume group), while the
second group did periodised training of 3 - 15 repetitions for 2 - 4 sets. A control
group did no training. The results indicated that the single-set workout (as
recommended by the ACSM for strength training) did not provide an adequate
physiological challenge to the body to allow for continued gains in strength for
untrained women. Low-volume single-set training was as effective as periodised
training in the first 12 wk, but only the periodised group showed significant
improvements at the end of 24 wk therefore reinforcing training volume as a
significant factor for improvement in muscular performances. This result is
similar to earlier mentioned studies that utilised a single set to failure programme
(Kraemer, 1997; Kraemer et al., 2000).
Kraemer, Hakkinen, Triplett-McBride et al. (2003) compared a nonlinear
periodised programme (similar to daily undulating periodisation) with a
traditional multiple-set non-periodised programme (similar to PRE) for a period
of nine months. The subjects were female collegiate tennis players who were not
strength trained, and matched on USTA tennis rankings. A total of 3 groups were
2-33
formed to undergo daily UP (Day 1: 3 x 4-6 RM; Day 2: 3 x 8-10 RM; Day 3: 3 x
12-15 RM), PRE training (entire training period: 3 x 8-10 RM), and a control
group who performed only tennis training. Total training volume (number of sets
x number or repetitions) during each week was similar for both training
programmes. Variables measured included body composition changes, anaerobic
power, aerobic capacity, speed and agility, grip strength, vertical jump height,
resting serum hormonal concentrations, and tennis service, forehand and
backhand velocities. Daily UP was more effective in improving 1 RM leg press,
1 RM bench press, 1 RM shoulder press after six months. At the end of training,
daily UP was more effective than PRE in improving leg press, shoulder press,
jump height, and service, forehand and backhand velocities. An interesting
finding from this study was that women tennis players seemed unable to
continually improve their upper-body strength, as most bench press and shoulder
press gains plateaued off between 4-6 mth. It was suggested that the subjects
might have reached the upper limits of their physical adaptations. However, it
needs to be noted that the final three months of training were carried out during
the major competitive season and this may have impaired additional progress. It
has been previously reported that the concurrent demands of competition and skill
practice may be detrimental to upper-body strength (Legg & Burnham, 1999).
Kraemer, Nindl, Ratamess et al. (2004a) recently performed the only LP
study that had untrained women as subjects. Two LP models were used – the first
starting at 8 RM and changing to 3 RM within a 3-mth mesocycle, with this
mesocycle repeated in the following three months. The second model started at
12 RM and changed to 8 RM, and the mesocycle was repeated. For each model
of LP, there were two groups of subjects performing either total-body training or
upper-body training. This design allowed the comparison of the different
programmes, and at the same time, compared upper-body with total-body
training. Consequently, the four training groups and a control were assessed for
arm and thigh muscle cross sectional areas (CSA), 1 RM squat and bench press,
and peak power during ballistic jump squats and bench throws. Strength and
power increases showed specificity of training, as upper-body training did not
improve lower-body strength and power scores. This trend was also found in
muscle CSA as all groups improved arm muscle CSA, but only groups that
2-34
trained the lower body had muscle CSA increases in the thigh muscle CSA. Peak
power improvements developed later as most significant improvements were seen
only at the end of training. Higher percentage improvements were generally
obtained using the range of 3 – 8 RM. However, as the researchers carried out a
concurrent aerobic programme, these results will have to be taken with caution.
This is due to suggestions that concurrent strength and endurance training appears
to inhibit strength development especially when high volume/intensity resistance
and endurance programmes are performed concurrently (Leveritt, Abernethy,
Barry & Logan, 1999; Leveritt & Abernethy; 1999).
Although the number of studies on periodisation has been steadily
increasing, only five have utilised female subjects. The small number of studies
makes it tenuous to generalise results to the female population. Additionally, it is
important to examine the effects of periodised resistance-training on female
subjects from the athletic population as the use of untrained individuals would
exhibit impressive improvements regardless of training protocol used. However,
these studies should also avoid confounding factors such as concurrent training,
and by using periodised models with properly matched training variables. Thus,
the need for more periodisation studies on women, both untrained and trained, is
amplified.
2.3.4 Periodisation For Maintenance
Most resistance training programmes are designed to help athletes achieve
maximal physical condition by the end of pre-competition conditioning, and the
start of the competition period. Once competition begins, during what is
commonly known as the in-season, maintenance training is performed to sustain
the earlier gains in strength/power/endurance for the duration of the competition.
The longer the competition period, the more important strength and power
training during that phase becomes to ensure the levels of strength and power
achieved earlier are maintained throughout (Bompa, 1993). Maintenance training
may also be performed during a specific phase within a planned mesocycle, if the
training objectives warrant a reduction in volume or intensity, but the risk of loss
in strength, power or endurance is to be reduced. Wathen et al. (2000) have
suggested that maintenance training may also increase the levels of strength,
power and anaerobic endurance.
2-35
While more athletes and teams are utilising periodised training to achieve
maximal physical conditions prior to competition, the use of maintenance training
is less common, with many athletes relying on practise sessions and the
competition itself to maintain pre-competition strength gains. Not performing
maintenance training or utilising training volumes that are too low, may cause a
decrease in muscle mass, which in turn results in a decrease in strength and power
(Baker et al., 1994; Allerheiligen, 2003). Legg and Burnham (1999) have
recorded shoulder strength loss to be as much as 29 % during a 10-wk football
season, with most of the loss occurring in the first 5 wk. Loss of muscle mass
may also occur due to more emphasis being put on technical and tactical training
during this part of the season, although maximal strength and power training is
just as important (Baker, 1998). To ensure that muscle mass, strength and power
is maintained throughout the competition, the different elements of periodised
training such as hypertrophy, maximal strength and power training need to be
incorporated into the maintenance phase (Allerheiligen, 2003).
Charniga, Gambetta, Kraemer et al. (1986) have suggested that training
for maintenance should involve the use of light to moderate intensity loads, with
an emphasis on speed of movement, and that repetitions should range from 3 – 6
for each exercise. It has been suggested that maintenance training should be
performed twice a week (Fleck & Kraemer, 1997), and should comprise of
primarily core exercises performed at a moderate intensity for approximately
three sets per exercise (Hoffman, Wendell, Cooper & Kang, 2003). Wathen et al.
(2000) suggest that training with a moderate intensity and moderate volume that is
80 – 85 % of 1 RM for 2 – 3 sets of 6 – 8 repetitions would be sufficient for
preserving strength, power, and performance levels. Resistance training may be
limited to 30 min, 1-2 times per week (Wathen et al. 2000). Manipulation of
training variables for the maintenance of strength and power does not seem to be
any clearer since the earlier studies in the 1980s. There does not seem to be any
conclusive suggestion on the optimal manipulation of training variables to
maintain strength and power.
Though research on both LP and UP protocols for pre-competition training
is steadily increasing, the same could not be said of periodised training for
maintenance. A search of the available literature revealed few studies on
periodised maintenance training, with only one study utilising female subjects
2-36
(Bell, Syrotuik, Attwood & Quinney, 1993). Earlier studies have examined the
effect of reduced training on strength (Hakkinen et al., 1985a; Graves, Pollock,
Leggett et al., 1988; Hoffman, Fry, Howard, Maresh & Kraemer, 1991b) and
endurance (Neufer, Costill, Fielding et al., 1987; Hoffman et al., 1991b). More
recent studies have examined the efficacy of some periodised maintenance models
(Baker, 2001b; Hoffman et al., 2003), but such research is inadequate.
Bell, Syrotuik, Attwood and Quinney (1993) examined the maintenance of
strength, while simultaneously enhancing aerobic endurance on novice and
experienced female rowers, whose resistance-training background was unclear,
for 10 wk while performing aerobic endurance maintenance. This was followed
by 6 wk of aerobic endurance training while performing strength maintenance.
Prior to the start of the maintenance phase for strength, subjects were matched on
strength and divided into groups that performed strength maintenance once or
twice a week utilising an LP model. Six exercises were used, with an intensity
range of 70-83 %, performed for 3-8 sets. No significant difference was found
between the group that trained once a week and the group that trained twice a
week, and four out of six of the exercises tested remained at pre-test strength
level. The results suggest that strength can be maintained with a training
frequency of once or twice a week, while focusing on aerobic endurance
improvement, without compromising the former. Even though training both
aerobic and strength components simultaneously has been suggested to be more
similar to actual training situations, results from this study may be confounded
(Leveritt et al., 1999; Leveritt & Abernethy, 1999). Support for this can be found
in the study by Graves et al. (1988), who had earlier suggested that strength
gained after resistance training can be maintained for 8-12 wk by reducing
training frequency provided that intensity is sufficient, and no other concurrent
training is performed.
Baker (2001d) examined maximum strength and power throughout an
entire in-season in national (29 wk) and senior (19 wk) rugby league players.
Strength and power training was performed twice a week concurrently with
energy system conditioning, and skill and team practice. Training followed a UP
protocol (Baker, 1998) that emphasised hypertrophy, strength and power training
within a session, and also changing volume and intensity on a weekly basis from
lower to higher in 3 – 4 wk cycles. This cycle was repeated across the in-season,
2-37
as often as required. Core and assistant exercises were performed for 2 sets of 8
repetitions per exercise, but the number of exercises was not reported. According
to the set intensity, each weekly cycle was structured for a different strength
quality such as hypertrophy, maximal strength and power. Maximal strength and
power was maintained for the professional players, while the senior league
players managed to improve strength but not power. It is possible that the
professional league players were stronger and more powerful, thus reducing their
scope of improvement. The players from both groups did not have their strength
impeded by concurrent energy system training, as the players either gained
strength, or did not suffer deterioration. The issue of concurrent training still
requires exploration.
Hoffman and Kang (2003) utilised a maintenance programme that utilised
both strength (bench press and squat, 6 – 8 RM) and power exercises (power
clean 3 – 5 RM and push press 4 – 5 RM) within the same session for 12 wk.
Measurements of 1 RM bench press and squat were assessed, as well as body
mass and percentage of body fat. Only the 1 RM squat increased significantly
from pre- to post-test, while strength was maintained in the upper body. This is
opposite from the results obtained by Hoffman and Kaminsky (2000) that had
found improvements in the upper body, but not the lower body.
Another recent study on maintenance was carried out by Hoffman et al.
(2003), where an LP protocol was compared against non-linear (UP) training in
male American footballers. Training frequency was twice weekly, and the
duration of training was 12 wk. The LP group trained consistently at
approximately 80 % of 1 RM on both training days (which makes it more similar
to PRE), while UP trained at 70 % of 1 RM on the first day, and 90 % of 1 RM on
the second. Exercises utilised were the same as those in the study by Hoffman
and Kang (2003). A significant increase in the 1 RM squat was observed in the
LP group, but not the UP group, which suggests that LP may be more effective in
eliciting strength gains during maintenance. There was however, no significant
difference in bench press for either training protocol, reinforcing the results from
Hoffman and Kang (2003). These results however, need to be taken with caution
as the training groups were formed across two different competition seasons, with
the players from the first year forming the LP group, and players from the
following year the UP group. Although Hoffman et al. (2003) have suggested
2-38
that both groups of subjects were freshman with similar training backgrounds and
resistance-training experience, it would be methodologically more accurate to
observe both groups throughout the same experimental period.
The studies on maintenance training have suggested that there are
inconsistent recommendations for periodised programmes. As there seems to be
limited studies in this area, more research using periodised protocols for
maintenance of strength and power is needed. The lone maintenance study
utilising female subjects emphasises the need for more research on strength and
power maintenance, especially in women.
2.4 Direction Of Research
The literature reviewed in this chapter suggests that although more women
are using resistance training as part of their fitness improvement strategy,
resistance-training research using females as subjects is still scarce. Therefore,
more research data is needed to fill this gap. The studies in the following chapters
will seek to examine questions such as:
i. At what load maximal average mechanical power output is produced
during the BPT/CMJ exercise?
ii. Do differences exist in the average mechanical output produced by
different percentages of 1 RM during explosive BPT and CMJ by women
of different strength levels?
iii. What are the changes in strength qualities when untrained women adhere
to LP or UP training?
iv. Would training efficacy using LP and UP be different if the beginning
strength level of women was higher?
v. Would periodised resistance-training be able to maintain strength and
power during a maintenance programme?
The following chapters are a written description of the studies that were
carried out in an attempt to answer the above questions. Chapter 3 describes the
equipment and procedures used during testing and training. This is followed by
Chapter 4, which detailed the search for the load that maximises average power in
women of differing strength levels. Chapters 5 and 6 then used the identified load
in comparing the efficacy of LP and UP in developing strength qualities in

2-39
untrained and moderately-trained women respectively. The same subjects from
the final training study then performed the maintenance programmes described in
Chapter 7. The final chapter summarises all the findings.
3-1
CHAPTER 3. GENERAL MATERIALS AND METHODS 3.1 Introduction
This chapter describes the subjects, equipment and procedures used in the
studies for the thesis. All testing and training sessions were carried out at the
School of Human Movement and Exercise Science, The University of Western
Australia (UWA).
3.2 Subjects
Subjects for the different studies were from the student and staff
population at UWA. Requests for volunteers were posted electronically to
female staff and students through the University Communications Services.
Posters requesting participation from strength-trained subjects were also put up
at the university weight-training room. Subjects had to be between the ages of
18 and 32, have no history of medical problems, and be free from physical
injuries. Written consent was obtained from each subject before the start of each
study.
3.3 Equipment
The following sections list and describe in detail the different equipment
utilised in the studies. Specific testing procedures utilising the equipment are
presented in section 3.6.
3.3.1 Plyometric Power System (PPS)
The tests for strength and power were performed using a modified
Plyometric Power System, PPS (Plyopower Technologies, Lismore, Australia.
The structure of the PPS (Figure 3.1), the process of data collection and analysis,
and the calibration processes will be discussed in different sections.
3.3.1.1 Structure of the PPS
The PPS is similar in structure to a Smith rack, and allows a standard
Olympic barbell to slide in a vertical plane about two steel shafts. Linear
bearings between the barbell and the steel shafts minimised friction. Murphy,
Wilson and Pryor (1994) quantified the frictional force as being approximately
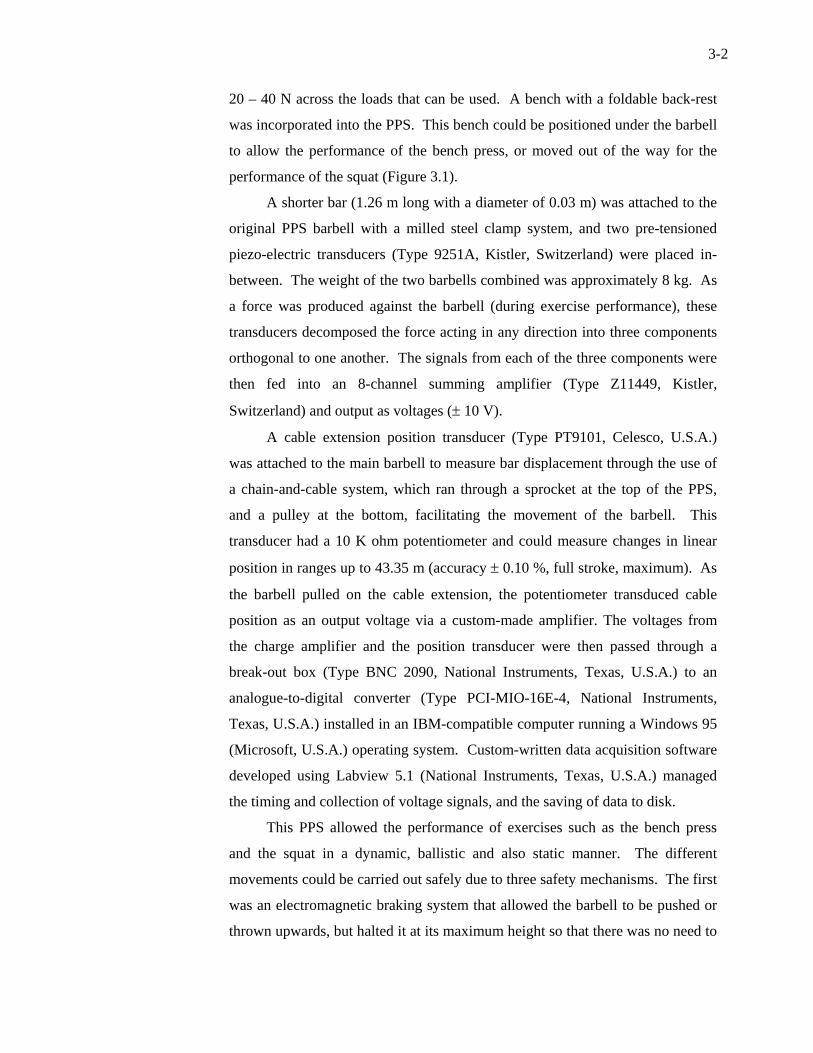
3-2
20 – 40 N across the loads that can be used. A bench with a foldable back-rest
was incorporated into the PPS. This bench could be positioned under the barbell
to allow the performance of the bench press, or moved out of the way for the
performance of the squat (Figure 3.1).
A shorter bar (1.26 m long with a diameter of 0.03 m) was attached to the
original PPS barbell with a milled steel clamp system, and two pre-tensioned
piezo-electric transducers (Type 9251A, Kistler, Switzerland) were placed in-
between. The weight of the two barbells combined was approximately 8 kg. As
a force was produced against the barbell (during exercise performance), these
transducers decomposed the force acting in any direction into three components
orthogonal to one another. The signals from each of the three components were
then fed into an 8-channel summing amplifier (Type Z11449, Kistler,
Switzerland) and output as voltages (± 10 V).
A cable extension position transducer (Type PT9101, Celesco, U.S.A.)
was attached to the main barbell to measure bar displacement through the use of
a chain-and-cable system, which ran through a sprocket at the top of the PPS,
and a pulley at the bottom, facilitating the movement of the barbell. This
transducer had a 10 K ohm potentiometer and could measure changes in linear
position in ranges up to 43.35 m (accuracy ± 0.10 %, full stroke, maximum). As
the barbell pulled on the cable extension, the potentiometer transduced cable
position as an output voltage via a custom-made amplifier. The voltages from
the charge amplifier and the position transducer were then passed through a
break-out box (Type BNC 2090, National Instruments, Texas, U.S.A.) to an
analogue-to-digital converter (Type PCI-MIO-16E-4, National Instruments,
Texas, U.S.A.) installed in an IBM-compatible computer running a Windows 95
(Microsoft, U.S.A.) operating system. Custom-written data acquisition software
developed using Labview 5.1 (National Instruments, Texas, U.S.A.) managed
the timing and collection of voltage signals, and the saving of data to disk.
This PPS allowed the performance of exercises such as the bench press
and the squat in a dynamic, ballistic and also static manner. The different
movements could be carried out safely due to three safety mechanisms. The first
was an electromagnetic braking system that allowed the barbell to be pushed or
thrown upwards, but halted it at its maximum height so that there was no need to
3-3
catch the returning barbell. The second safety mechanism involved a hydraulic
disc brake system that could lock the barbell at a selected height without
allowing any movement once it was engaged. The final safety mechanism was a
pair of hardened steel metal clasps on both sides of the PPS frame. The
minimum height that the barbell was allowed to drop could be adjusted by
placing the metal clasps on to metal stops that protruded at 5-cm gaps along the
side of the PPS. Additional hardened plastic clips could be added to control
height accuracy to 0.01 m. The metal clasps were set at the specific heights
required both for the safety of the subject and the performance of the exercise.
3.3.1.2 Data collection and analysis
Data collected by the computer were analysed using the following
procedures. Force and displacement data were acquired at 1000 Hz over a 5-s
epoch and filtered using a 2nd order low-pass recursive Butterworth filter with a
cut-off frequency of 5 Hz and displayed on screen. When data had been
collected and saved to disk, a custom-written data analysis software, Plyopower
Analysis, developed using Labview 5.1 (National Instruments, Texas, U.S.A.)
was used to analyse the displacement and force data. The software calculated
the discrete differentiation of the filtered displacement data to compute
instantaneous velocity using initial and final condition settings to minimise
boundary errors. Data values of instantaneous velocities were then multiplied by
force data to obtain values for instantaneous power. Although the piezo-electric
transducers allowed force data to be collected in 3-dimensional planes, only
vertical forces (z direction) together with vertical displacement, were evaluated
for the studies. Thus, all power variables were calculated along the vertical axis
only. Sample data analysis images are presented in Appendix A.
The data analysis process took into consideration the division of
movement into concentric and eccentric phases. The eccentric phase
commenced from the beginning of the movement (defined as onset of bar
descent) until the time before the start of the concentric phase, while the
concentric phase was defined as the time point when bar velocity changed from
negative to positive. Peak power output was taken as the highest instantaneous
power produced during the propulsive phase. Power output was also averaged
over the concentric phase to derive average power output. Average velocity,
3-4
peak velocity, and average force were determined for the concentric phase of
each trial. Peak force was determined as the highest force during the concentric
phase. Work was determined by a numerical integration (Simpsons Rule) of
power-time curve of the concentric phase. The rate of force development (RFD)
was identified over a 20-ms moving point average throughout the trial, with the
greatest 20-ms value designated as maximal RFD. These data were then
transferred to spreadsheets for statistical analysis.
3.3.1.3 Calibration of the PPS
The PPS was calibrated before the start of the first study and periodically
checked throughout the course of the study.
i Calibration of the force components
a. Each charge amplifier was set in accordance with the manufacturer’s
specifications, and was zeroed by adjusting the zero offset to achieve a
voltage reading as near zero as possible, as displayed on a digital
voltmeter.
b. The Kistler reset button was pressed.
c. A known mass (10-kg calibration weight plate and a 0.16-kg metal hook)
was hung from the PPS barbell.
d. The voltage reading was recorded (e.g. - 0.303).
e. The force (N) per volt (V) was obtained as follows:
- 0.303 V = -9.81 x 10.16
1 V = (-9.81 x 10.16) / -0.303
1 V = 328.943 N
f. This value was then set as a scaling factor for the z-force component in the
settings for the Plyometric Analysis software programme.
g. Steps a - f were performed for the other two force components.

3-5
ii Calibration of the displacement component
a. Voltage readings were taken at different barbell heights (0.25 m, 0.5 m,
1.0 m, 1.5 m, 2.0 m and 2.15 m) to confirm that the cable position
transducer recorded output voltages in measurements that increased and
decreased in a linear manner.
b. The voltage measurements were used to calculate the displacement (m)
per volt (V). For example, a displacement of 0.25 m produced a voltage
of 0.46V. A linear regression of best fit was performed to determine the
gradient of coefficient of the relationship (e.g. 0.46).
c. The displacement per volt was calculated as follows:
1 V = 0.25 / 0.46
= 0.5435
d. This value was then set as a scaling factor for displacement in the
Plyometric Analysis software programme.
e. The displacement calibration was checked periodically, and before each
major set of testing.
iii Checking of Calibration Before/After Test Session
a. Before and after each testing session, the calibration for the z-force
component was checked against a known mass and the scaling factor was
changed if necessary.
b. Steps a – f from the calibration of force were repeated for the z-force
component to check that the scaling factor was consistent.
c. A set of force data was collected with the calibration plate hanging off the
barbell. The force reading was expected to be approximately 99.67 N
(10.16 x 9.81).
3-6
Figure 3.1 The modified Plyometric Power System.
8-Channel Kistler Amplifier
BNC
Fx Fx Fy Fy
Fz Fz
Summing Amplifier
Analogue-to-Digital Converter
LABVIEW Custom Written Data
Acquisition and Analysis The 5 x 6-s cycle test
Key:
Name of PPS parts Data acquisition and analysis process
Fy Fx Fz d
Electromagnetic Brake
Disc Brake
PPS Barbell
Attachment Barbell
Bench
Wooden Grid Board
Cable Extension Position
Transducer
Kistler Transducers
Attached Between Barbells
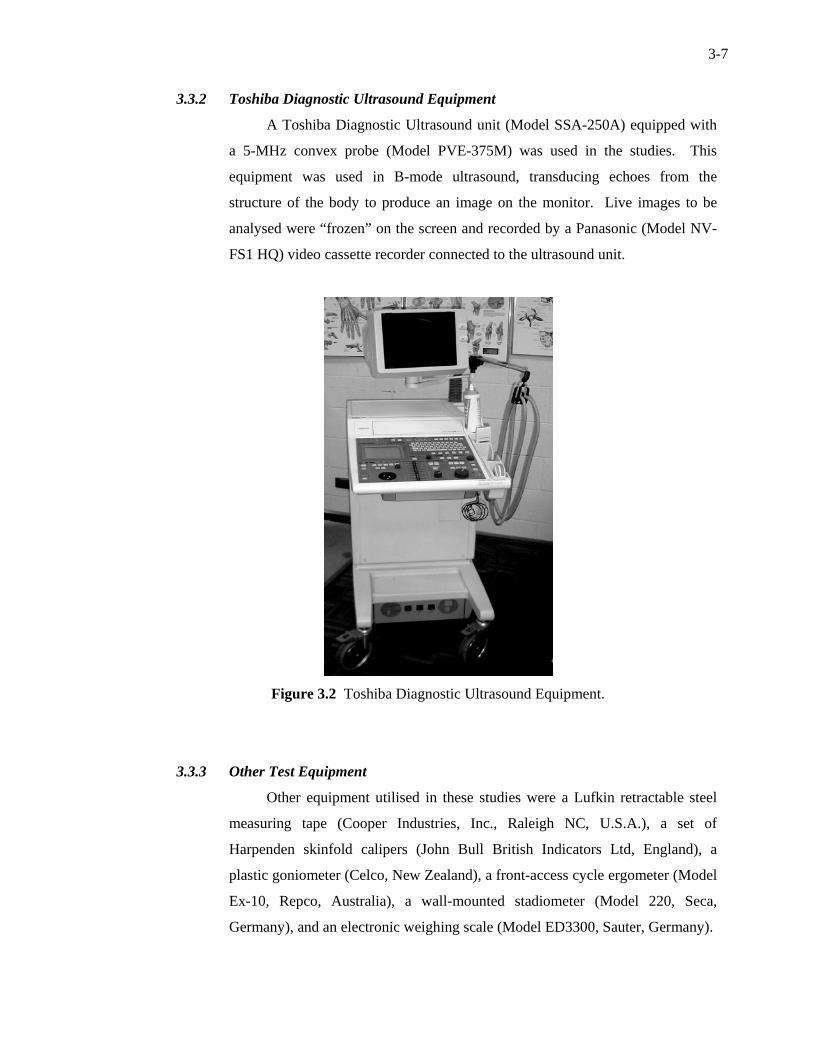
3-7
3.3.2 Toshiba Diagnostic Ultrasound Equipment
A Toshiba Diagnostic Ultrasound unit (Model SSA-250A) equipped with
a 5-MHz convex probe (Model PVE-375M) was used in the studies. This
equipment was used in B-mode ultrasound, transducing echoes from the
structure of the body to produce an image on the monitor. Live images to be
analysed were “frozen” on the screen and recorded by a Panasonic (Model NV-
FS1 HQ) video cassette recorder connected to the ultrasound unit.
Figure 3.2 Toshiba Diagnostic Ultrasound Equipment.
3.3.3 Other Test Equipment
Other equipment utilised in these studies were a Lufkin retractable steel
measuring tape (Cooper Industries, Inc., Raleigh NC, U.S.A.), a set of
Harpenden skinfold calipers (John Bull British Indicators Ltd, England), a
plastic goniometer (Celco, New Zealand), a front-access cycle ergometer (Model
Ex-10, Repco, Australia), a wall-mounted stadiometer (Model 220, Seca,
Germany), and an electronic weighing scale (Model ED3300, Sauter, Germany).
3-8
3.3.4 Weight-Training Equipment
Two training studies were carried out in the Health and Fitness
Laboratory, School of Human Movement and Exercise Science (HMES) UWA.
The weight training equipment in the laboratory was supplied by Orbit Health
and Fitness Solutions (Perth, Australia). The equipment included:
i. Olympic barbell (20 kg)
ii. Standard barbell (7 kg)
iii. Weight plates ranging from 2.5 kg to 20 kg
iv. Dumbells ranging from 2 kg to 10 kg
v. Smith rack
vi. Bench press rack and bench
vii. Leg press machine
viii. Knee flexion/extension machine
ix. Lat-pulldown machine
x. Calf raise machine
xi. Shoulder press machine
xii. Pec-press machine
3.4 Familiarisation Procedure
For all three studies, subjects attended two to three familiarisation
sessions. During the familiarisation sessions, each subject practised performing
the correct technique required for all tests and training. Subjects were given an
opportunity to ask any questions they had about the studies and any issues
related to their participation. Demographic data were recorded and informed
consent was obtained. The purpose of these sessions were firstly to ensure that
all movements were performed in a uniform manner, and secondly, to reduce the
risk of injury to the subjects through performance of incorrect technique. It was
also during the familiarisation sessions that hand-placement, shoulder position
on the bench, foot placement, and the depth of descent that the barbell was
required to reach was recorded. All positions were marked for each subject prior
to the test in order to ensure reliability between sessions. The familiarisation
sessions were also used to estimate one-repetition maximum (1 RM) values for
3-9
the bench press and the squats in order to minimise the number of trials needed
to obtain the 1 RM value on test day.
3.5 General Warm-up And Cool-down Procedures
Before each testing and training session, subjects warmed up by riding a
stationary cycle ergometer (Monark Bycycle Ergometer, Varberg, Sweden) for 3
min using a light resistance setting of 60 W (60 rpm x 1 kp). Immediately
following this, each subject proceeded to activity specific warm up activities.
This meant that if a squat activity followed the warm up, the subjects would
perform 1 – 3 sets of light resistance squats that were made progressively
heavier from set to set. Test sessions normally required three sets of activity
specific warm up, while a 10 repetition set at 50 % of 1 RM was performed
before each training exercise.
Static stretching was not utilised as part of the warm up routine based on
literature that suggests performing static stretches can have a negative impact on
strength and power performance (Kokkonen, Nelson & Cornwell, 1998; Young
& Behm, 2003). It was suggested that the decrement in performance was related
to a loss of musculotendinous stiffness after acute stretching (Magnusson,
Simonsen, Aagaard & Kjaer, 1996). Wilson, Murphy and Pryor (1994) had
earlier suggested that a stiff musculotendinous system allowed the muscle
contractile components to improve force production. Thigpen, Moritani,
Thiebaud and Hargis (1985) had reported that the Hoffman reflex (H reflex)
remained depressed after the triceps surae was released from a sustained stretch.
The suppressed H reflex suggests that stretching could induce autogenic
inhibition of a muscle, which in turn, may compromise force production.
After every test or training session, each subject cooled down by
performing a 5-min ride on the same cycle ergometers. A standard full-body
stretching routine was also performed. Each stretching position was held for 10
s, and two repetitions were performed for each exercise. All instructions and
pictures of the exercises were mounted on a wall/board to help standardise the
routine. The eight stretching exercises are shown in Figure 3.3 below.
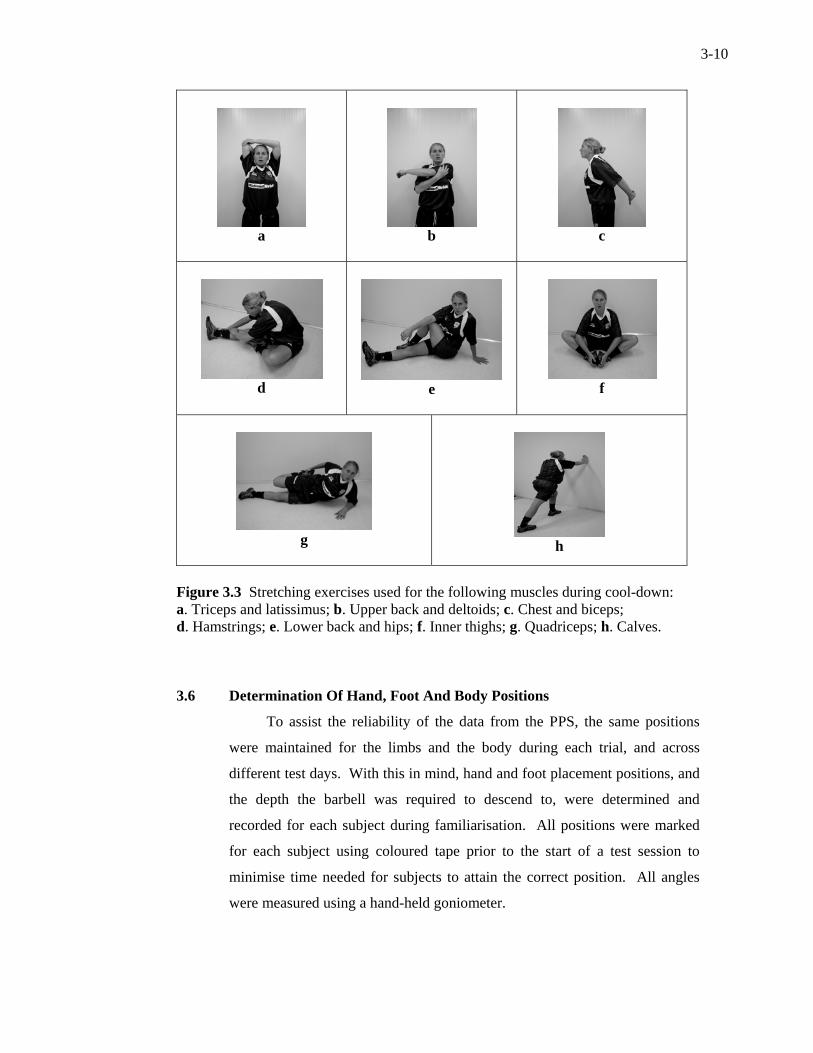
3-10
a
b
c
d
e
f
g
h
Figure 3.3 Stretching exercises used for the following muscles during cool-down: a. Triceps and latissimus; b. Upper back and deltoids; c. Chest and biceps; d. Hamstrings; e. Lower back and hips; f. Inner thighs; g. Quadriceps; h. Calves.
3.6 Determination Of Hand, Foot And Body Positions
To assist the reliability of the data from the PPS, the same positions
were maintained for the limbs and the body during each trial, and across
different test days. With this in mind, hand and foot placement positions, and
the depth the barbell was required to descend to, were determined and
recorded for each subject during familiarisation. All positions were marked
for each subject using coloured tape prior to the start of a test session to
minimise time needed for subjects to attain the correct position. All angles
were measured using a hand-held goniometer.
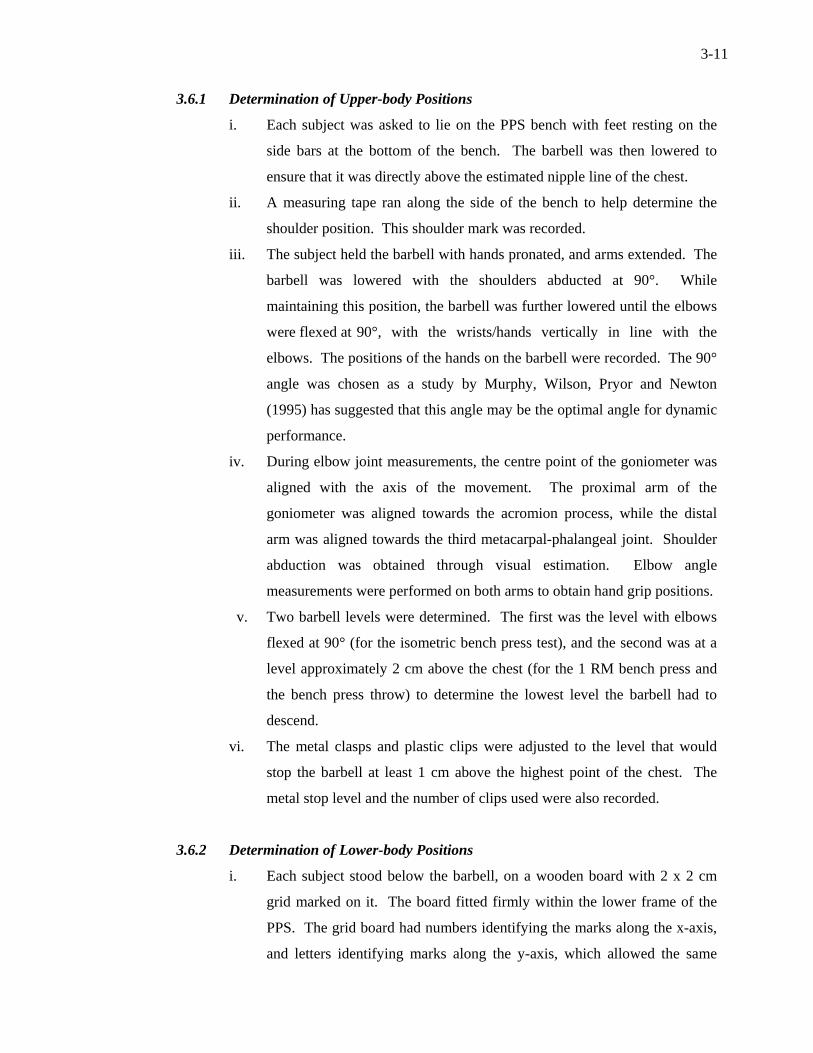
3-11
3.6.1 Determination of Upper-body Positions
i. Each subject was asked to lie on the PPS bench with feet resting on the
side bars at the bottom of the bench. The barbell was then lowered to
ensure that it was directly above the estimated nipple line of the chest.
ii. A measuring tape ran along the side of the bench to help determine the
shoulder position. This shoulder mark was recorded.
iii. The subject held the barbell with hands pronated, and arms extended. The
barbell was lowered with the shoulders abducted at 90°. While
maintaining this position, the barbell was further lowered until the elbows
were flexed at 90°, with the wrists/hands vertically in line with the
elbows. The positions of the hands on the barbell were recorded. The 90°
angle was chosen as a study by Murphy, Wilson, Pryor and Newton
(1995) has suggested that this angle may be the optimal angle for dynamic
performance.
iv. During elbow joint measurements, the centre point of the goniometer was
aligned with the axis of the movement. The proximal arm of the
goniometer was aligned towards the acromion process, while the distal
arm was aligned towards the third metacarpal-phalangeal joint. Shoulder
abduction was obtained through visual estimation. Elbow angle
measurements were performed on both arms to obtain hand grip positions.
v. Two barbell levels were determined. The first was the level with elbows
flexed at 90° (for the isometric bench press test), and the second was at a
level approximately 2 cm above the chest (for the 1 RM bench press and
the bench press throw) to determine the lowest level the barbell had to
descend.
vi. The metal clasps and plastic clips were adjusted to the level that would
stop the barbell at least 1 cm above the highest point of the chest. The
metal stop level and the number of clips used were also recorded.
3.6.2 Determination of Lower-body Positions
i. Each subject stood below the barbell, on a wooden board with 2 x 2 cm
grid marked on it. The board fitted firmly within the lower frame of the
PPS. The grid board had numbers identifying the marks along the x-axis,
and letters identifying marks along the y-axis, which allowed the same
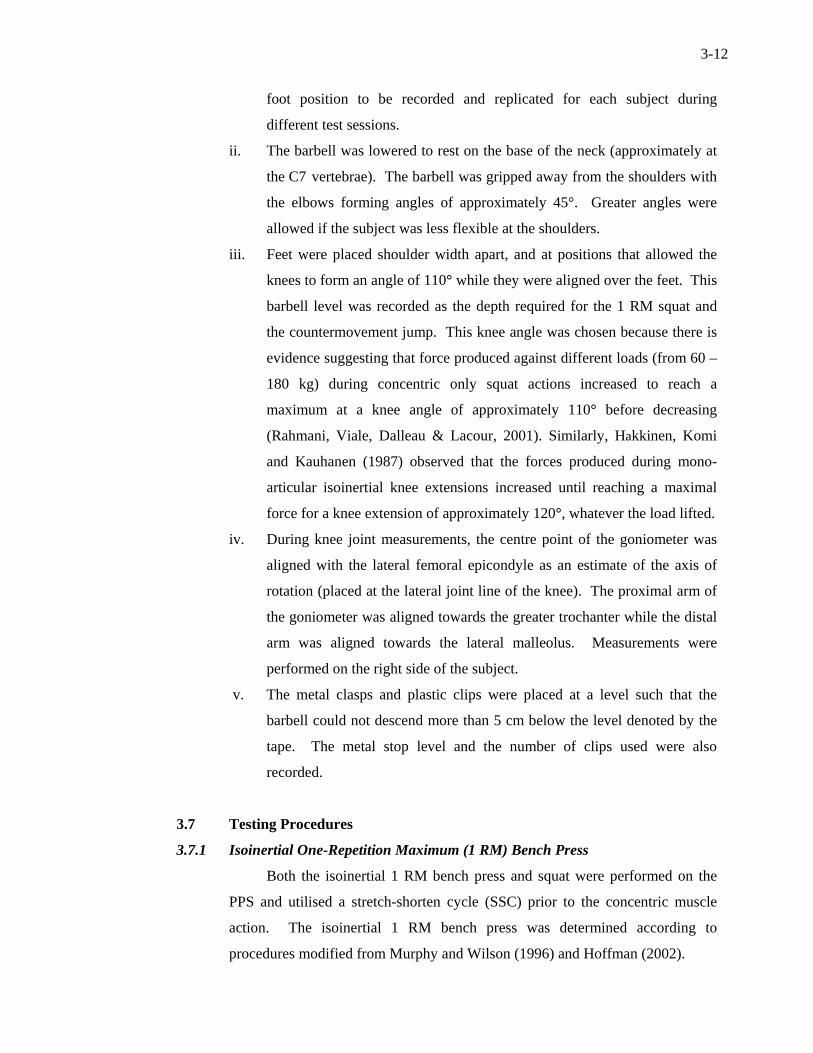
3-12
foot position to be recorded and replicated for each subject during
different test sessions.
ii. The barbell was lowered to rest on the base of the neck (approximately at
the C7 vertebrae). The barbell was gripped away from the shoulders with
the elbows forming angles of approximately 45°. Greater angles were
allowed if the subject was less flexible at the shoulders.
iii. Feet were placed shoulder width apart, and at positions that allowed the
knees to form an angle of 110° while they were aligned over the feet. This
barbell level was recorded as the depth required for the 1 RM squat and
the countermovement jump. This knee angle was chosen because there is
evidence suggesting that force produced against different loads (from 60 –
180 kg) during concentric only squat actions increased to reach a
maximum at a knee angle of approximately 110° before decreasing
(Rahmani, Viale, Dalleau & Lacour, 2001). Similarly, Hakkinen, Komi
and Kauhanen (1987) observed that the forces produced during mono-
articular isoinertial knee extensions increased until reaching a maximal
force for a knee extension of approximately 120°, whatever the load lifted.
iv. During knee joint measurements, the centre point of the goniometer was
aligned with the lateral femoral epicondyle as an estimate of the axis of
rotation (placed at the lateral joint line of the knee). The proximal arm of
the goniometer was aligned towards the greater trochanter while the distal
arm was aligned towards the lateral malleolus. Measurements were
performed on the right side of the subject.
v. The metal clasps and plastic clips were placed at a level such that the
barbell could not descend more than 5 cm below the level denoted by the
tape. The metal stop level and the number of clips used were also
recorded.
3.7 Testing Procedures
3.7.1 Isoinertial One-Repetition Maximum (1 RM) Bench Press
Both the isoinertial 1 RM bench press and squat were performed on the
PPS and utilised a stretch-shorten cycle (SSC) prior to the concentric muscle
action. The isoinertial 1 RM bench press was determined according to
procedures modified from Murphy and Wilson (1996) and Hoffman (2002).

3-13
i. The subject lay down on the PPS bench according to previously marked
positions, with their feet on the lower side bars. Metal stops and plastic
clips were put in place to ensure that the barbell would not reach a level
less than one cm above the highest point of her chest.
ii. The subject then held the barbell with her arms extended at grip positions
indicated by tape (Figure 3.4a). The barbell was locked in this position.
Both brakes were disengaged only after the loaded barbell was supported
by the subject.
iii. Two spotters stood at each end of the barbell, ready to assist the subject if
the need arose.
iv. A bench press trial was deemed successful if the subject was able to lower
the barbell to the tape mark representing the depth required (Figure 3.4b),
and raise it until her arms were fully extended at the elbow joints (Figure
3.4c). The bar was lowered and raised at a self-selected, but controlled
velocity.
v. A trial was deemed incorrect if the subject bounced the barbell off her
chest, raised her buttocks off the bench, or lifted any foot off the side bar.
Incorrectly completed trials were repeated after the subject was given a 3 –
5 min rest.
vi. A rest period of 3 – 5 min was given after every warm-up set and every
trial.
vii. Once the subject was in position, a warm-up set of 10 repetitions with a
resistance approximating 30 % of her estimated 1 RM was slowly
performed. This was followed by warm-up sets of 10 repetitions of 50 %
of 1 RM, and 5 repetitions of 75 % of 1 RM.
viii. A resistance approximating 3 RM was then loaded on to the barbell and
the subject was asked to lift it not more than three times. Based on the
number of successful lifts and the form shown as she performed the lifts, a
1 RM load was estimated.
ix. The first 1 RM attempt was carried out. If the subject was successful, the
load was incremented by 2.5 – 5 kg until she could not complete the lift.
The last successful lift was recorded as the 1 RM.
x. The process of determining the 1 RM generally took no more than four
trials.
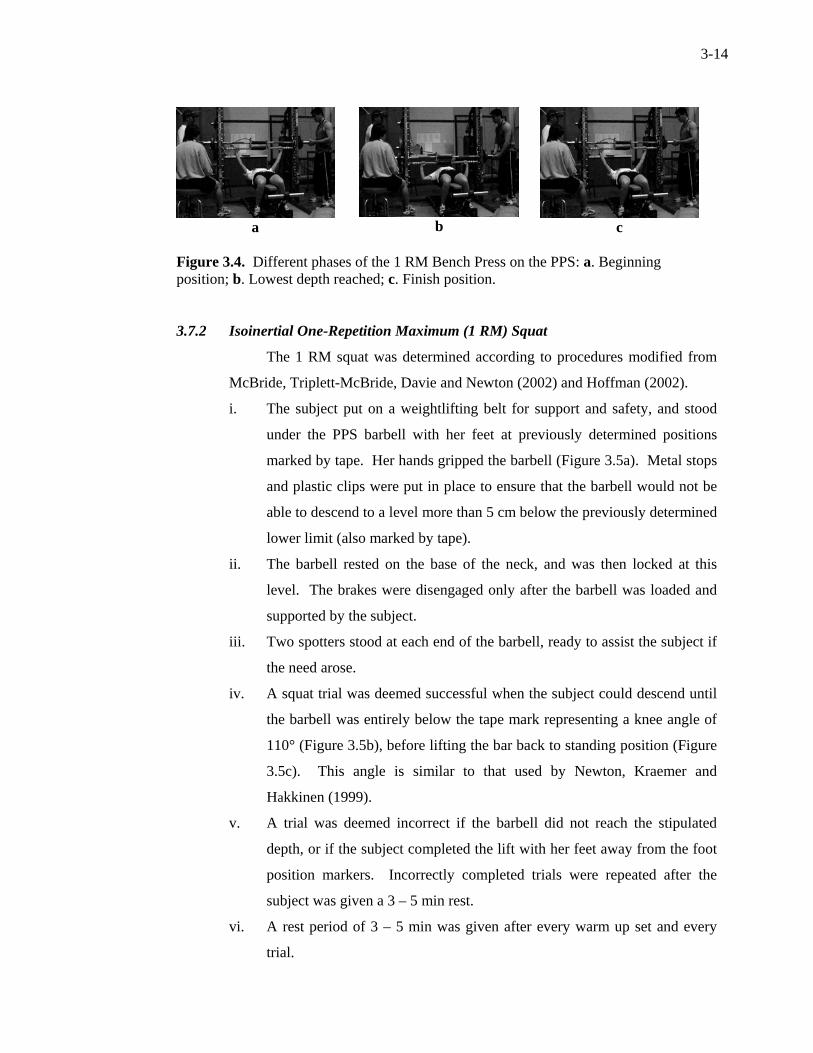
3-14
a
b
c
Figure 3.4. Different phases of the 1 RM Bench Press on the PPS: a. Beginning position; b. Lowest depth reached; c. Finish position. 3.7.2 Isoinertial One-Repetition Maximum (1 RM) Squat
The 1 RM squat was determined according to procedures modified from
McBride, Triplett-McBride, Davie and Newton (2002) and Hoffman (2002).
i. The subject put on a weightlifting belt for support and safety, and stood
under the PPS barbell with her feet at previously determined positions
marked by tape. Her hands gripped the barbell (Figure 3.5a). Metal stops
and plastic clips were put in place to ensure that the barbell would not be
able to descend to a level more than 5 cm below the previously determined
lower limit (also marked by tape).
ii. The barbell rested on the base of the neck, and was then locked at this
level. The brakes were disengaged only after the barbell was loaded and
supported by the subject.
iii. Two spotters stood at each end of the barbell, ready to assist the subject if
the need arose.
iv. A squat trial was deemed successful when the subject could descend until
the barbell was entirely below the tape mark representing a knee angle of
110° (Figure 3.5b), before lifting the bar back to standing position (Figure
3.5c). This angle is similar to that used by Newton, Kraemer and
Hakkinen (1999).
v. A trial was deemed incorrect if the barbell did not reach the stipulated
depth, or if the subject completed the lift with her feet away from the foot
position markers. Incorrectly completed trials were repeated after the
subject was given a 3 – 5 min rest.
vi. A rest period of 3 – 5 min was given after every warm up set and every
trial.
3-15
vii. Once the subject was in position, a warm-up set of 10 repetitions with a
resistance approximating 30 % of her estimated 1 RM was slowly
performed. This was followed by warm-up sets of 10 repetitions of 50 %
of 1 RM, and five repetitions of 75 % of 1 RM.
viii. A resistance approximating 3 RM was then loaded on to the barbell and
the subject was asked to lift it not more than three times. Based on the
number of successful lifts and the form shown as she performed the lifts, a
1 RM load was estimated.
ix. The first 1 RM attempt was carried out. If the subject was successful, the
load was incremented by 5 – 10 kg until she could not complete the lift.
The last successful lift was recorded as the 1 RM.
x. The process of determining the 1 RM generally took no more than four
trials.
a
b
c
Figure 3.5. Different phases of the 1 RM Squat on the PPS: a. Beginning position; b. Lowest depth reached; c. Finish position. 3.7.3 Isoinertial Bench Press Throw (BPT)
The BPT was performed on the PPS using eccentric and concentric
movements followed by the release of the barbell. Test and retest reliability for
average power production, r, had been found to be 0.92 (Baker, 2003). Force,
displacement and time data were recorded for each trial over a 5-s epoch.
i. After determining the 1 RM bench press (section 3.6.1), relative loads of
15% (for warm-up), and 30 – 80 % were calculated. For Study 2 (Chapter
5), other than 30 % of 1 RM, an absolute load of 13 kg was also used. In
Study 3 (Chapter 6), the 30 % of 1 RM from the first test was used during
the subsequent tests as an absolute load, while still testing a new 30 %
load.

3-16
ii. The subject warmed up by performing one set of non-projected bench
presses with the 15 % of 1 RM load for about 5 – 8 repetitions. After a
short rest, subjects performed 2 – 3 BPTs with the same light load, and
was given another rest period of about 5 min.
iii The appropriate load for the trial was loaded on to the barbell.
iv. The subject lay down on the PPS bench according to previously marked
positions, with feet on the lower side bars. Metal stops and plastic clips
were put in place to ensure that the barbell would not reach a level less
than 1 cm above the highest point of her chest.
v The subject then held the barbell with her arms extended at grip positions
indicated by tape (Figure 3.6a). The barbell was locked in this position.
Both brakes were disengaged only after the loaded barbell was supported
by the subject.
vi The subject was asked to be still until an auditory signal to start was given
by the tester. The amplifiers were reset to zero.
vii The subject was instructed to lower the barbell rapidly to the tape mark
level approximately 2 cm above chest (Figure 3.6b), and immediately
throw it upwards for maximum height (Figure 3.6c). No pause was
permitted between the eccentric and concentric phases of the BPT. The
correct depth of the barbell was visually monitored by the tester. At
maximum height, the electromagnetic braking system automatically
engaged to halt the bar.
viii The electrical signals from the load cells and the postion transducer were
recorded by the data acquisition computer and saved to disk for later
analysis.
ix During each BPT, the subject was required to maintain a 90o abducted
position at the shoulders to ensure consistency of limb and movement
position.
x. Each subject performed three consecutive BPT trials for the load tested. A
rest period of 1 min was given between each explosive trial, while 5 min
was given between different loads. The best of the three trials was used
for analysis.
xi. For a trial to be successful, the barbell could not contact the safety stops
above the chest; had to reach appropriate depth as indicated by a tape
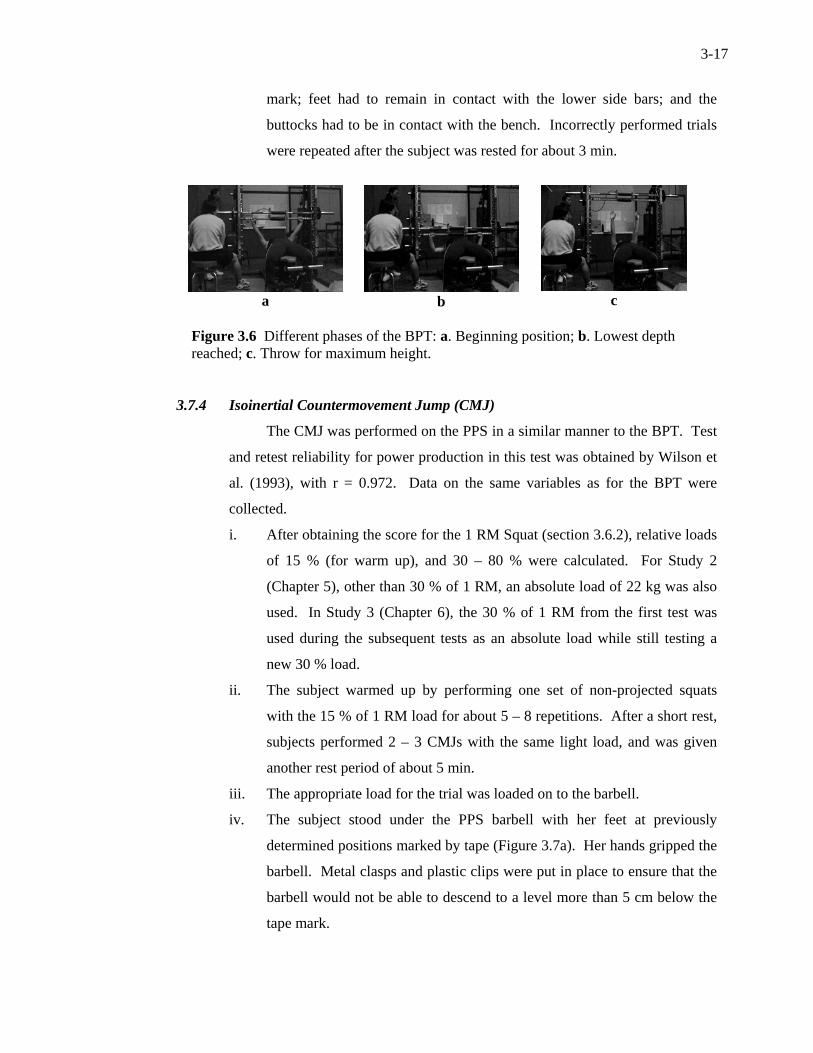
3-17
mark; feet had to remain in contact with the lower side bars; and the
buttocks had to be in contact with the bench. Incorrectly performed trials
were repeated after the subject was rested for about 3 min.
a
b
c
Figure 3.6 Different phases of the BPT: a. Beginning position; b. Lowest depth reached; c. Throw for maximum height.
3.7.4 Isoinertial Countermovement Jump (CMJ)
The CMJ was performed on the PPS in a similar manner to the BPT. Test
and retest reliability for power production in this test was obtained by Wilson et
al. (1993), with r = 0.972. Data on the same variables as for the BPT were
collected.
i. After obtaining the score for the 1 RM Squat (section 3.6.2), relative loads
of 15 % (for warm up), and 30 – 80 % were calculated. For Study 2
(Chapter 5), other than 30 % of 1 RM, an absolute load of 22 kg was also
used. In Study 3 (Chapter 6), the 30 % of 1 RM from the first test was
used during the subsequent tests as an absolute load while still testing a
new 30 % load.
ii. The subject warmed up by performing one set of non-projected squats
with the 15 % of 1 RM load for about 5 – 8 repetitions. After a short rest,
subjects performed 2 – 3 CMJs with the same light load, and was given
another rest period of about 5 min.
iii. The appropriate load for the trial was loaded on to the barbell.
iv. The subject stood under the PPS barbell with her feet at previously
determined positions marked by tape (Figure 3.7a). Her hands gripped the
barbell. Metal clasps and plastic clips were put in place to ensure that the
barbell would not be able to descend to a level more than 5 cm below the
tape mark.
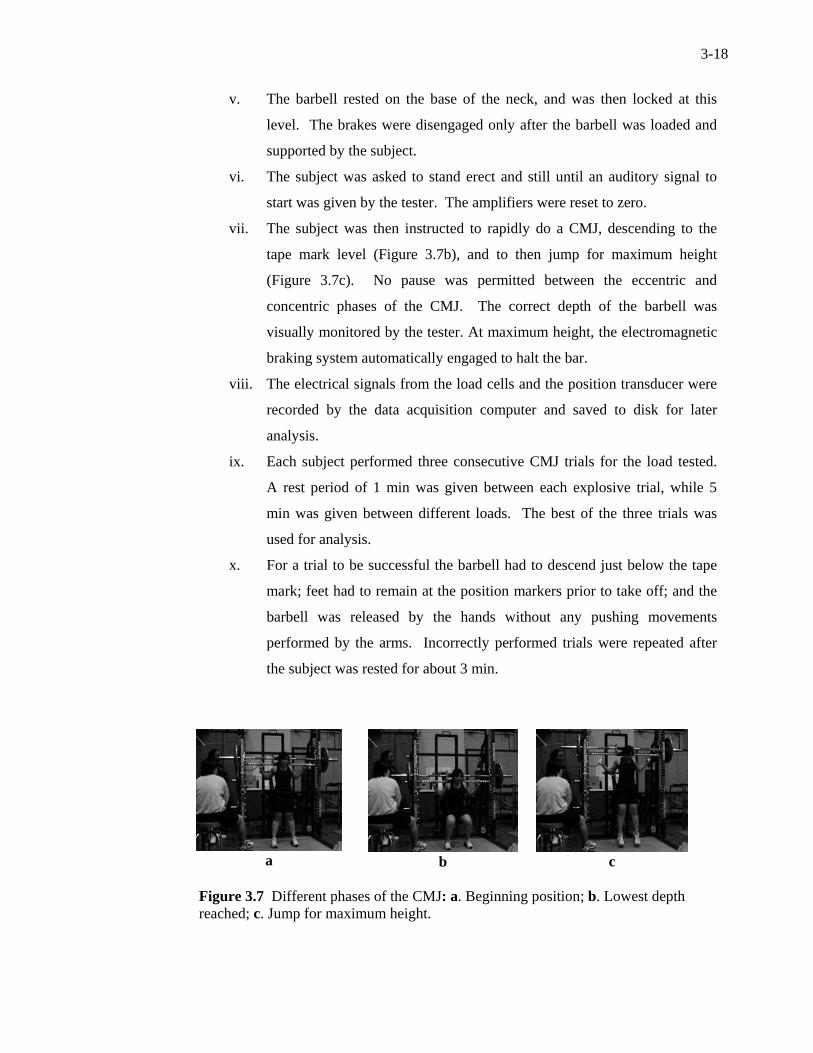
3-18
v. The barbell rested on the base of the neck, and was then locked at this
level. The brakes were disengaged only after the barbell was loaded and
supported by the subject.
vi. The subject was asked to stand erect and still until an auditory signal to
start was given by the tester. The amplifiers were reset to zero.
vii. The subject was then instructed to rapidly do a CMJ, descending to the
tape mark level (Figure 3.7b), and to then jump for maximum height
(Figure 3.7c). No pause was permitted between the eccentric and
concentric phases of the CMJ. The correct depth of the barbell was
visually monitored by the tester. At maximum height, the electromagnetic
braking system automatically engaged to halt the bar.
viii. The electrical signals from the load cells and the position transducer were
recorded by the data acquisition computer and saved to disk for later
analysis.
ix. Each subject performed three consecutive CMJ trials for the load tested.
A rest period of 1 min was given between each explosive trial, while 5
min was given between different loads. The best of the three trials was
used for analysis.
x. For a trial to be successful the barbell had to descend just below the tape
mark; feet had to remain at the position markers prior to take off; and the
barbell was released by the hands without any pushing movements
performed by the arms. Incorrectly performed trials were repeated after
the subject was rested for about 3 min.
a
b
c
Figure 3.7 Different phases of the CMJ: a. Beginning position; b. Lowest depth reached; c. Jump for maximum height.
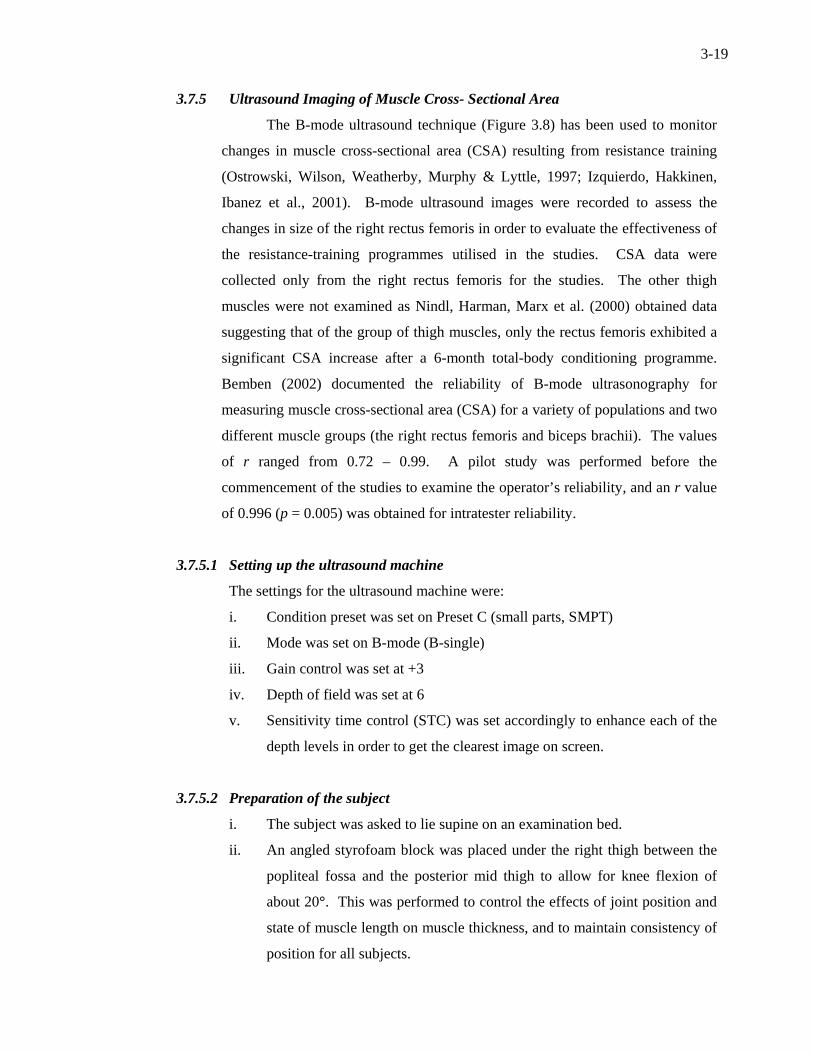
3-19
3.7.5 Ultrasound Imaging of Muscle Cross- Sectional Area
The B-mode ultrasound technique (Figure 3.8) has been used to monitor
changes in muscle cross-sectional area (CSA) resulting from resistance training
(Ostrowski, Wilson, Weatherby, Murphy & Lyttle, 1997; Izquierdo, Hakkinen,
Ibanez et al., 2001). B-mode ultrasound images were recorded to assess the
changes in size of the right rectus femoris in order to evaluate the effectiveness of
the resistance-training programmes utilised in the studies. CSA data were
collected only from the right rectus femoris for the studies. The other thigh
muscles were not examined as Nindl, Harman, Marx et al. (2000) obtained data
suggesting that of the group of thigh muscles, only the rectus femoris exhibited a
significant CSA increase after a 6-month total-body conditioning programme.
Bemben (2002) documented the reliability of B-mode ultrasonography for
measuring muscle cross-sectional area (CSA) for a variety of populations and two
different muscle groups (the right rectus femoris and biceps brachii). The values
of r ranged from 0.72 – 0.99. A pilot study was performed before the
commencement of the studies to examine the operator’s reliability, and an r value
of 0.996 (p = 0.005) was obtained for intratester reliability.
3.7.5.1 Setting up the ultrasound machine
The settings for the ultrasound machine were:
i. Condition preset was set on Preset C (small parts, SMPT)
ii. Mode was set on B-mode (B-single)
iii. Gain control was set at +3
iv. Depth of field was set at 6
v. Sensitivity time control (STC) was set accordingly to enhance each of the
depth levels in order to get the clearest image on screen.
3.7.5.2 Preparation of the subject
i. The subject was asked to lie supine on an examination bed.
ii. An angled styrofoam block was placed under the right thigh between the
popliteal fossa and the posterior mid thigh to allow for knee flexion of
about 20°. This was performed to control the effects of joint position and
state of muscle length on muscle thickness, and to maintain consistency of
position for all subjects.

3-20
iii. To locate the evaluation site, the proximal border of the patella and the
anterior superior iliac spine were marked with an eyebrow liner. A Lufkin
tape was used to connect the two locations along the midline of the
anterior surface of the thigh. Horizontal marks were made at the lower
one-third portion between the two anatomical locations.
3.7.5.3 Obtaining the ultrasound image
i. A water-soluble transmission gel (type Ultra by Medtel, Australia) was
spread evenly along the evaluation site, and on the transducer head. An
even spread of gel ensured optimal imaging.
ii. Care was taken to ensure that the transducer was held perpendicular to the
anterior surface of the thigh, and that there was no depression occuring on
the skin surface. An even and light pressure was maintained to prevent
deformation of superficial structures as well as limit the squeeze of gel
from under the transducer head.
iii. Once the image was optimised on the monitor it was “frozen”, and
recorded for 10 s using the VCR. Two consecutive images were recorded
from the same site.
3.7.5.4 Calculation of the muscle CSA
i. The recorded images were transferred from the video tape to a computer
and stored as image files. The VCR was connected to a computer installed
with a Matrox graphics card (Matrox Graphics Inc., Canada) running the
Matrox PC-VCR software (Matrox Marvel G450). This software was
used to view the recorded footage and captured still-images of the muscle.
Each image was then saved as a high-resolution jpeg file for further
analysis.
ii. Each image was assessed for muscle CSA using the ImageJ (version 1.32j)
image processing programme (National Institute of Health, Besthesda,
Maryland, U.S.A.). This software was used to calculate area and pixel
value statistics of the defined sections on the CSA images.
iii. Before the calculation of CSA could be performed, the number of pixels
representing one cm on the video image had to be determined. This was
accomplished by using the ultrasound machine to record an image using
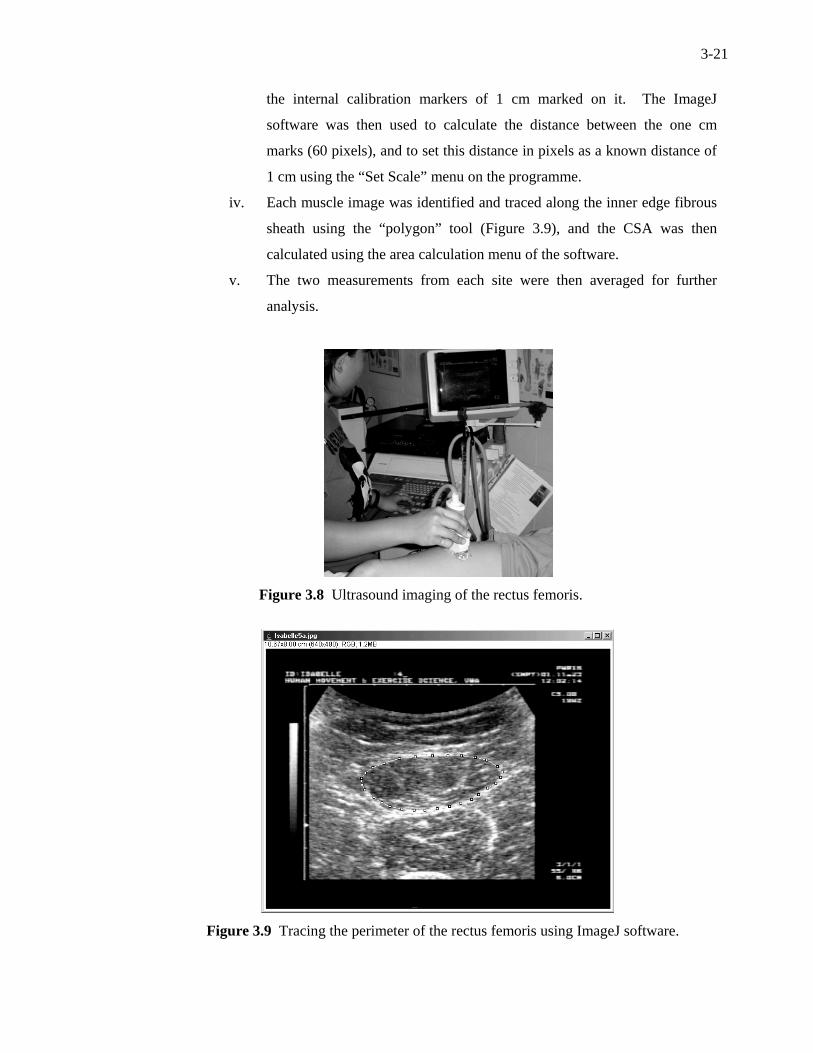
3-21
the internal calibration markers of 1 cm marked on it. The ImageJ
software was then used to calculate the distance between the one cm
marks (60 pixels), and to set this distance in pixels as a known distance of
1 cm using the “Set Scale” menu on the programme.
iv. Each muscle image was identified and traced along the inner edge fibrous
sheath using the “polygon” tool (Figure 3.9), and the CSA was then
calculated using the area calculation menu of the software.
v. The two measurements from each site were then averaged for further
analysis.
Figure 3.8 Ultrasound imaging of the rectus femoris.
Figure 3.9 Tracing the perimeter of the rectus femoris using ImageJ software.
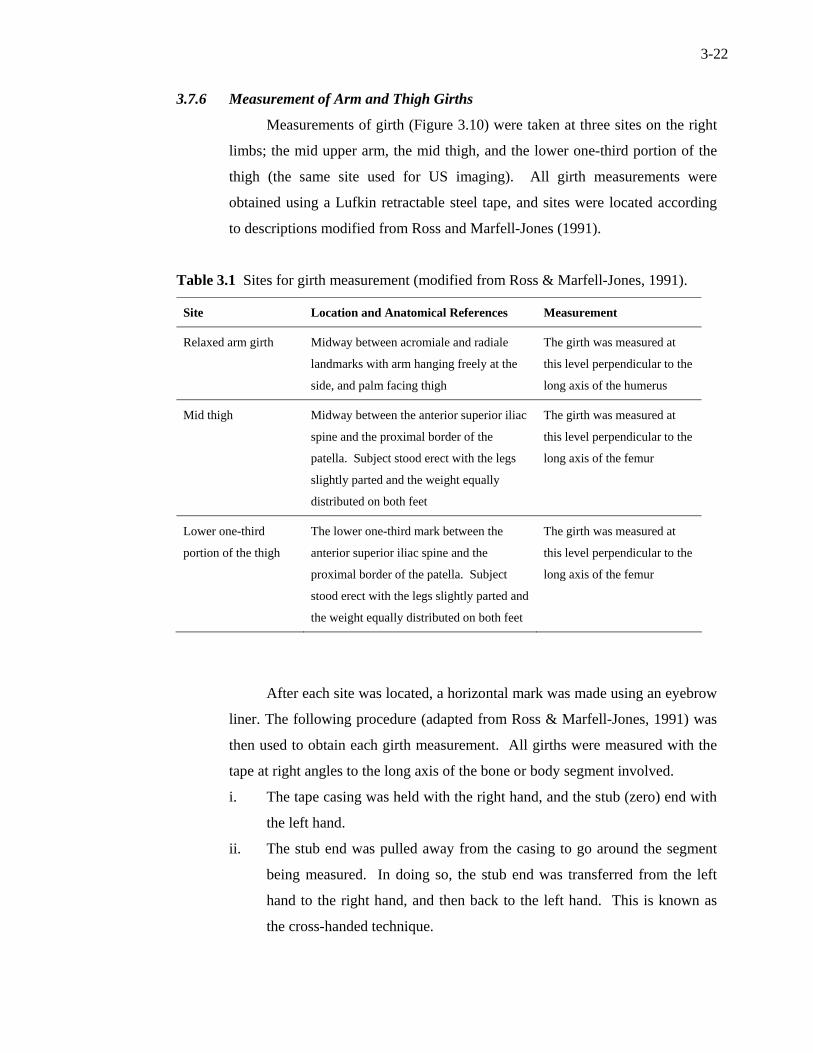
3-22
3.7.6 Measurement of Arm and Thigh Girths
Measurements of girth (Figure 3.10) were taken at three sites on the right
limbs; the mid upper arm, the mid thigh, and the lower one-third portion of the
thigh (the same site used for US imaging). All girth measurements were
obtained using a Lufkin retractable steel tape, and sites were located according
to descriptions modified from Ross and Marfell-Jones (1991).
Table 3.1 Sites for girth measurement (modified from Ross & Marfell-Jones, 1991).
Site Location and Anatomical References Measurement
Relaxed arm girth Midway between acromiale and radiale
landmarks with arm hanging freely at the
side, and palm facing thigh
The girth was measured at
this level perpendicular to the
long axis of the humerus
Mid thigh Midway between the anterior superior iliac
spine and the proximal border of the
patella. Subject stood erect with the legs
slightly parted and the weight equally
distributed on both feet
The girth was measured at
this level perpendicular to the
long axis of the femur
Lower one-third
portion of the thigh
The lower one-third mark between the
anterior superior iliac spine and the
proximal border of the patella. Subject
stood erect with the legs slightly parted and
the weight equally distributed on both feet
The girth was measured at
this level perpendicular to the
long axis of the femur
After each site was located, a horizontal mark was made using an eyebrow
liner. The following procedure (adapted from Ross & Marfell-Jones, 1991) was
then used to obtain each girth measurement. All girths were measured with the
tape at right angles to the long axis of the bone or body segment involved.
i. The tape casing was held with the right hand, and the stub (zero) end with
the left hand.
ii. The stub end was pulled away from the casing to go around the segment
being measured. In doing so, the stub end was transferred from the left
hand to the right hand, and then back to the left hand. This is known as
the cross-handed technique.
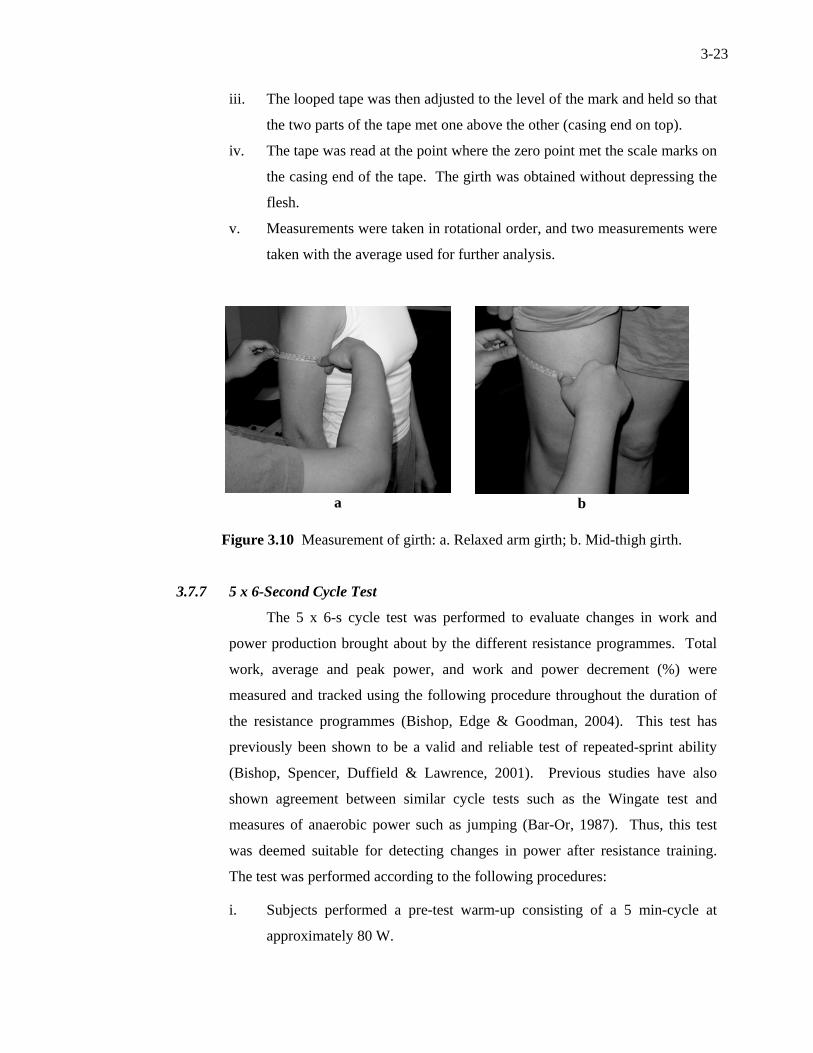
3-23
iii. The looped tape was then adjusted to the level of the mark and held so that
the two parts of the tape met one above the other (casing end on top).
iv. The tape was read at the point where the zero point met the scale marks on
the casing end of the tape. The girth was obtained without depressing the
flesh.
v. Measurements were taken in rotational order, and two measurements were
taken with the average used for further analysis.
a
b
Figure 3.10 Measurement of girth: a. Relaxed arm girth; b. Mid-thigh girth.
3.7.7 5 x 6-Second Cycle Test
The 5 x 6-s cycle test was performed to evaluate changes in work and
power production brought about by the different resistance programmes. Total
work, average and peak power, and work and power decrement (%) were
measured and tracked using the following procedure throughout the duration of
the resistance programmes (Bishop, Edge & Goodman, 2004). This test has
previously been shown to be a valid and reliable test of repeated-sprint ability
(Bishop, Spencer, Duffield & Lawrence, 2001). Previous studies have also
shown agreement between similar cycle tests such as the Wingate test and
measures of anaerobic power such as jumping (Bar-Or, 1987). Thus, this test
was deemed suitable for detecting changes in power after resistance training.
The test was performed according to the following procedures:
i. Subjects performed a pre-test warm-up consisting of a 5 min-cycle at
approximately 80 W.
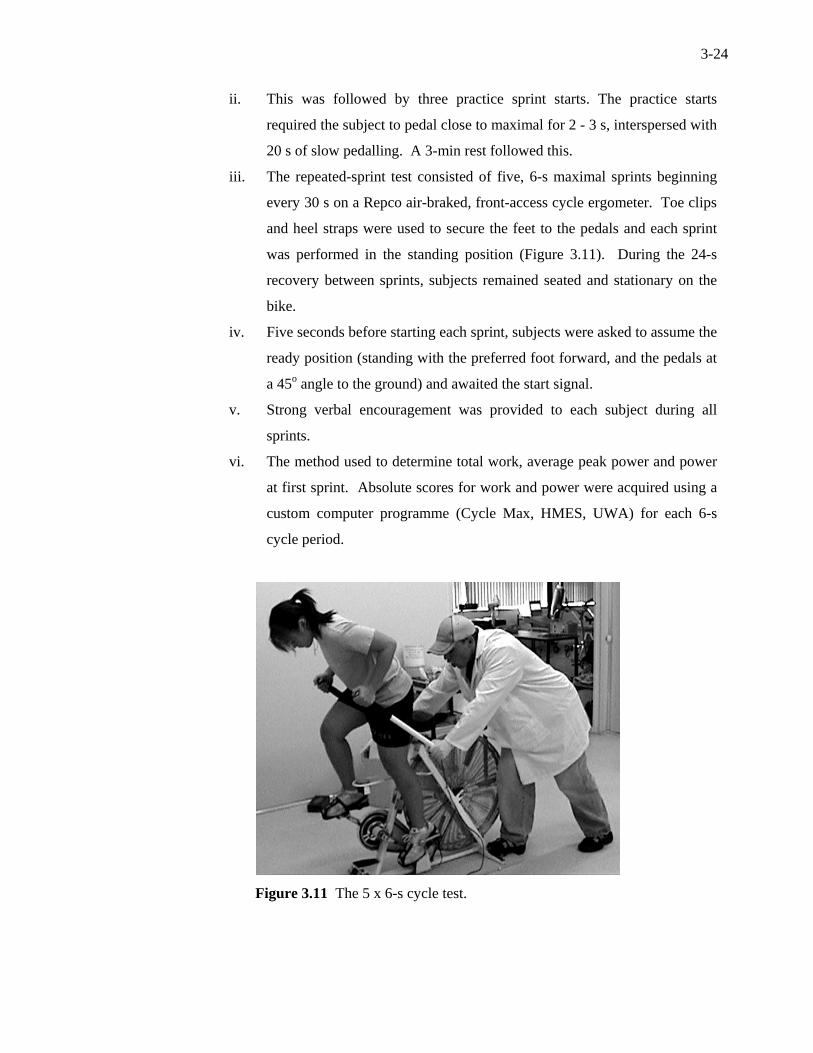
3-24
ii. This was followed by three practice sprint starts. The practice starts
required the subject to pedal close to maximal for 2 - 3 s, interspersed with
20 s of slow pedalling. A 3-min rest followed this.
iii. The repeated-sprint test consisted of five, 6-s maximal sprints beginning
every 30 s on a Repco air-braked, front-access cycle ergometer. Toe clips
and heel straps were used to secure the feet to the pedals and each sprint
was performed in the standing position (Figure 3.11). During the 24-s
recovery between sprints, subjects remained seated and stationary on the
bike.
iv. Five seconds before starting each sprint, subjects were asked to assume the
ready position (standing with the preferred foot forward, and the pedals at
a 45o angle to the ground) and awaited the start signal.
v. Strong verbal encouragement was provided to each subject during all
sprints.
vi. The method used to determine total work, average peak power and power
at first sprint. Absolute scores for work and power were acquired using a
custom computer programme (Cycle Max, HMES, UWA) for each 6-s
cycle period.
Figure 3.11 The 5 x 6-s cycle test.
3-25
3.8 Resistance-Training Exercises
The following resistance training exercises (Figure 3.12) were used in the
two training programmes utilised in the studies. Components of the programme
contained both concentric and eccentric muscle actions. The exercises selected
were a mixture of core and assistance exercises to give the subjects a balanced
whole-body workout that would simulate real-life training. Core exercises
involve the recruitment of one or more large muscle areas, and utilise more than
one joint. This differs from assistance exercises which usually recruit smaller
muscle areas, and utilise a single joint (Wathen, Baechle & Earle, 2000). Both
free weights and exercise machines were utilised. There were four upper-body
and four lower-body exercises chosen for each training programme, with all
exercises performed bilaterally. An abdominal and a back exercise were added
to every training session to bring the total number of exercises to 10. Training
using multiple exercises within a single training session has been postulated to
induce better hormonal anabolic environment (Schlumberger, Stec &
Schmidtbleicher, 2001).
The bench press and the back squat were the main focus of the exercise
programme. The loads used for these two exercises during training were
determined from the 1 RM scores during testing. Thus the load utilised for
training was calculated for each subject before training. Subjects would train for
bench press and squat at 30-40 %, 75-80 % or 85-90 % of 1 RM, according to
the intensity that was set in the programme. For all other exercises, training
loads were determined by obtaining the maximum load that could be lifted for a
specified number of repetitions. This is known as the repetition maximum (RM)
concept (Wathen et al., 2000). Subjects trained using 6 RM or 10 RM loads
according to the intensity set for that session. If a 6 RM intensity was required,
subjects identified a load that allowed them to complete six repetitions with their
maximal effort. All loads used were recorded so that subjects had a guide line as
to which loads should be used during training. This load could vary slightly
between sets, and also between training sessions. During familiarisation and
through the pre-test conditioning period, subjects were trained to determine their
6 RM or 10 RM loads. Using a combination of the % of 1 RM and the RM
methods, the subjects should achieve the load intensity set for training.
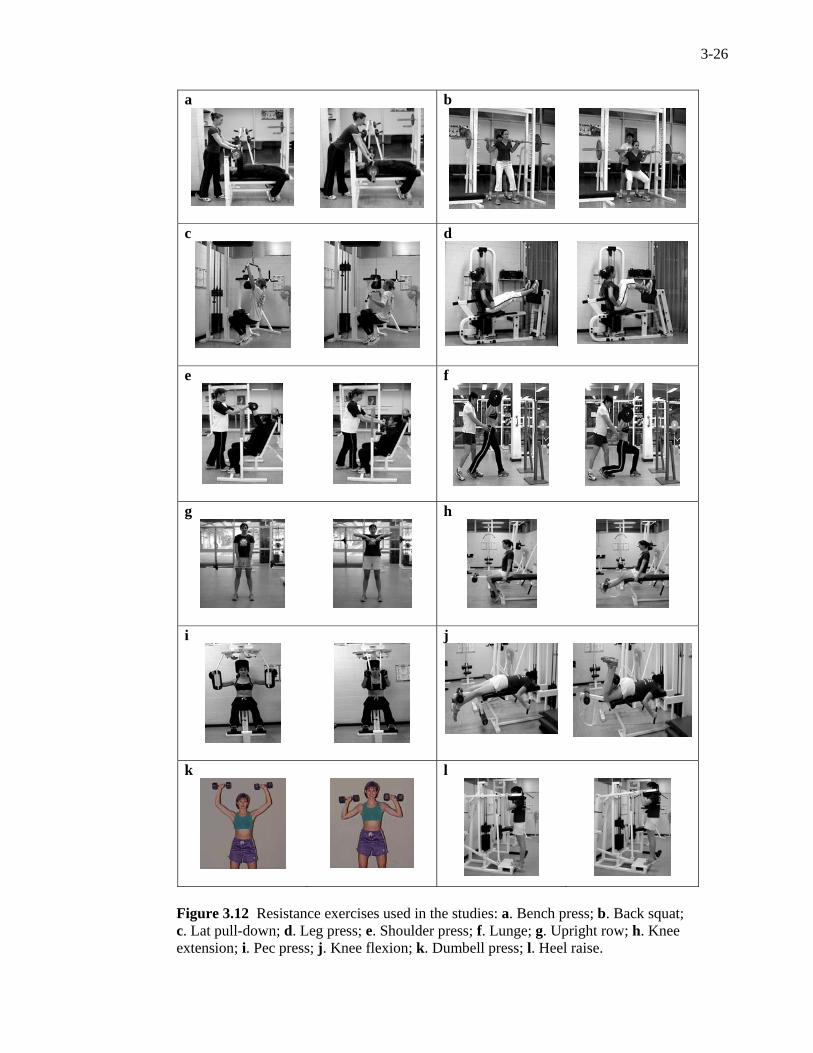
3-26
a
b
c
d
e
f
g
h
i
j
k
l
Figure 3.12 Resistance exercises used in the studies: a. Bench press; b. Back squat; c. Lat pull-down; d. Leg press; e. Shoulder press; f. Lunge; g. Upright row; h. Knee extension; i. Pec press; j. Knee flexion; k. Dumbell press; l. Heel raise.
4-1
CHAPTER 4. AVERAGE MECHANICAL POWER OUTPUT DURING THE BENCH PRESS THROW AND COUNTERMOVEMENTJUMP IN WOMEN
4.1 Introduction
Mechanical power has been defined as the rate of performing work and
also as force multiplied by the velocity of a movement (Kawamori & Haff, 2004).
Power is a muscular quality that is important for many sports and daily activities,
and is required for movements such as jumping, striking, throwing implements,
and making quick changes of direction. Most sports utilise these movements to
some extent, and thus require the neuromuscular system to rapidly generate force
over a distance for brief time periods in order to produce power (McBride,
Triplett-McBride, Davie & Newton, 1999; Newton & Kraemer, 1994). Adequate
levels of power are also important for functional performances such as lifting
heavy objects, climbing stairs, rising from a chair, and doing heavy housework
(Bassey, Fiatarone & O’Neill, 1992).
When a muscle is maximally activated against a given resistance load, the
highest mechanical power output depends on the relationship between force and
velocity (Wilson, Newton, Murphy and Humphries, 1993). Wilson et al. (1993)
further suggested that explosive power might be best trained using resistances that
maximise mechanical power output as these may lead to the greatest increases in
power production or enhanced power-training adaptations. This reinforces an
earlier suggestion by Kaneko, Fuchimoto, Toji and Suei (1983) that training at the
load that maximises mechanical power output is the most effective in increasing
maximum muscular power over a wide range of loads. Training at the load that
maximised mechanical power has also been suggested to lead to a broader range
of adaptations compared with adaptations through either strength-oriented or
speed-oriented training alone (Wilson et al., 1993; Wilson, Murphy & Giorgi,
1996). The reasons for the increase in power performances may be due to both
favourable neural and muscle fibre adaptations that result from the specific
stresses placed on the neuromuscular system during training with resistances that
maximise power output (Wilson et al., 1993; Baker, Nance & Moore, 2001a).
Improvement of power has frequently been achieved through isoinertial
resistance training as it is most dynamically related to sports-specific movements
4-2
(Murphy, Wilson & Pryor, 1994). A number of studies have therefore utilised
isoinertial movements and sought to examine the loads that could maximise
mechanical power output. These studies however, have proposed different
percentages of one-repetition maximum (1 RM) for bringing about the highest
mechanical power output during isoinertial exercises. Some studies have
indicated that heavy resistance training (80 – 100 % of 1 RM) has resulted in
greater increases in movement speed, rate of force development (RFD) and power
when compared with lighter-load training (Behm & Sale, 1993; Schmidtbleicher
& Haralambie, 1981). Other studies suggest that intermediate loads (40 – 60 % of
1 RM) maximise power output during isoinertial exercises (Thomas, Fiatarone &
Fielding, 1996; Mayhew, Ware, Johns & Bemben, 1997; Baker et al. 2001a;
Baker, Nance & Moore, 2001b; Siegel, Gilders, Staron & Hagerman, 2002). A
number of studies also support the use of light loads (10 – 30 % of 1 RM) to
maximise power output (Kaneko et al., 1983; Wilson et al., 1993; Moss, Refsnes,
Abildgaard, Nicolaysen & Jensen, 1997; Newton, Murphy, Humphries et al.,
1997; McBride, Triplett-McBride, Davie & Newton, 2002).
Dugan, Doyle, Humphries, Hasson and Newton (2004) suggested that the
differences in the proposed optimal loads were brought about by different
methods of data collection; whether body mass was included in the calculation of
power during the squat jump and countermovement jump; whether average or
peak power was reported; performing the squat using free weights or within a
Smith rack; whether full squats, three-quarter, or half squats were performed; and
if squats were performed with or without a stretch-shorten cycle (SSC), with or
without projection of the body mass, and also with different knee angles. Cronin,
McNair and Marshall (2001) agreed that the projection (released from contact) or
non-projection of the barbell/load affected the identification of the load that
maximised power. Non-projection of the barbell during the performance of the
bench press or squat may not produce accurate measures of power as subjects
have to decelerate the barbell at the end of the movement (Elliott, Wilson & Kerr,
1989), while with the bench press throw movements, the projected barbell was
subjected to greater average and peak power, average force and peak acceleration
(Cronin et al., 2001).
Differences in proposed loads that maximised mechanical power may also
have been caused by the different training status / strength abilities of the subjects.
4-3
Stone, O'Bryant, McCoy, Coglianese, Lehmkuhl, and Schilling (2003) compared
their five strongest and five weakest subjects and reported that as maximum
strength increased, the percentage of 1 RM at which peak power occured also
increased; the stronger subjects maximised peak power at 40% of 1 RM, while the
weaker subjects had their highest peak power at 10% of 1 RM. Poprawski (1988)
also noted that stronger athletes used loads of a higher percentage of 1 RM (70
%), and less strong athletes used loads representing lower percentages of 1 RM
(50 %) to maximise power training adaptations. Baker et al (2001a, 2001b) used
subjects who had power-training experience, and suggested that increased
exposure to specific power training may have resulted in optimal loads that
differed from those recorded for untrained (Kaneko et al., 1983; Thomas et al.,
1996; Mayhew et al., 1997; Cronin et al. 2001; Siegel et al., 2002) and strength-
trained subjects (Newton et al., 1997). More research is therefore required to help
establish the appropriate training stimulus to improve muscle power, particularly
for females. The paucity of power data from the female population is underlined
by the fact that all but one of the previously mentioned studies (Thomas et al.,
1996) utilised males. Additionally, data from the female population needs to
differentiate between stronger and weaker subjects.
4.2 Purpose
No previous study has investigated the loads that produce maximal
mechanical output for both the upper and lower body in women using explosive,
projected, bench press throws (BPT) and countermovement jumps (CMJ). More
specifically, this study sought to investigate:
(i) the load (% of 1 RM) that produced the highest average mechanical power
output during the BPT/CMJ exercise.
(ii) if any differences existed in the average mechanical output produced by
different percentages of 1 RM during explosive BPT and CMJ by women
of different strength levels.
(iii) the shape of the power curve (average power versus % 1RM) between
upper- and lower-body exercises for women of different strength levels.
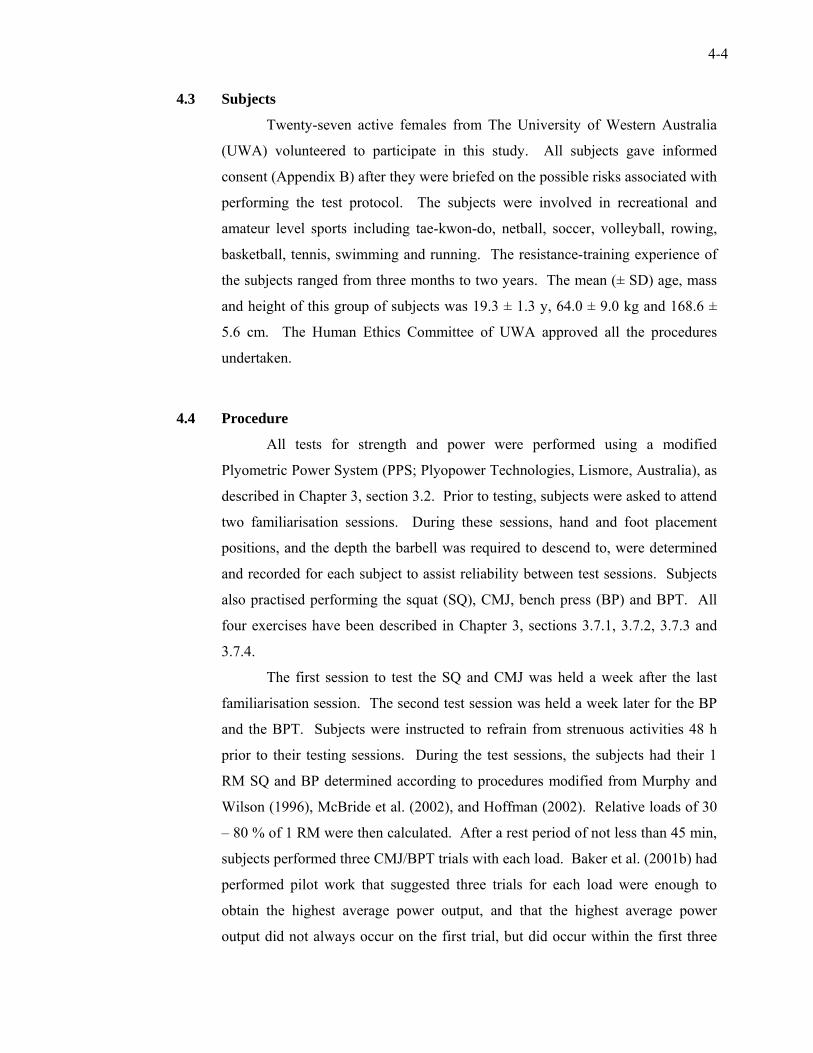
4-4
4.3 Subjects
Twenty-seven active females from The University of Western Australia
(UWA) volunteered to participate in this study. All subjects gave informed
consent (Appendix B) after they were briefed on the possible risks associated with
performing the test protocol. The subjects were involved in recreational and
amateur level sports including tae-kwon-do, netball, soccer, volleyball, rowing,
basketball, tennis, swimming and running. The resistance-training experience of
the subjects ranged from three months to two years. The mean (± SD) age, mass
and height of this group of subjects was 19.3 ± 1.3 y, 64.0 ± 9.0 kg and 168.6 ±
5.6 cm. The Human Ethics Committee of UWA approved all the procedures
undertaken.
4.4 Procedure
All tests for strength and power were performed using a modified
Plyometric Power System (PPS; Plyopower Technologies, Lismore, Australia), as
described in Chapter 3, section 3.2. Prior to testing, subjects were asked to attend
two familiarisation sessions. During these sessions, hand and foot placement
positions, and the depth the barbell was required to descend to, were determined
and recorded for each subject to assist reliability between test sessions. Subjects
also practised performing the squat (SQ), CMJ, bench press (BP) and BPT. All
four exercises have been described in Chapter 3, sections 3.7.1, 3.7.2, 3.7.3 and
3.7.4.
The first session to test the SQ and CMJ was held a week after the last
familiarisation session. The second test session was held a week later for the BP
and the BPT. Subjects were instructed to refrain from strenuous activities 48 h
prior to their testing sessions. During the test sessions, the subjects had their 1
RM SQ and BP determined according to procedures modified from Murphy and
Wilson (1996), McBride et al. (2002), and Hoffman (2002). Relative loads of 30
– 80 % of 1 RM were then calculated. After a rest period of not less than 45 min,
subjects performed three CMJ/BPT trials with each load. Baker et al. (2001b) had
performed pilot work that suggested three trials for each load were enough to
obtain the highest average power output, and that the highest average power
output did not always occur on the first trial, but did occur within the first three
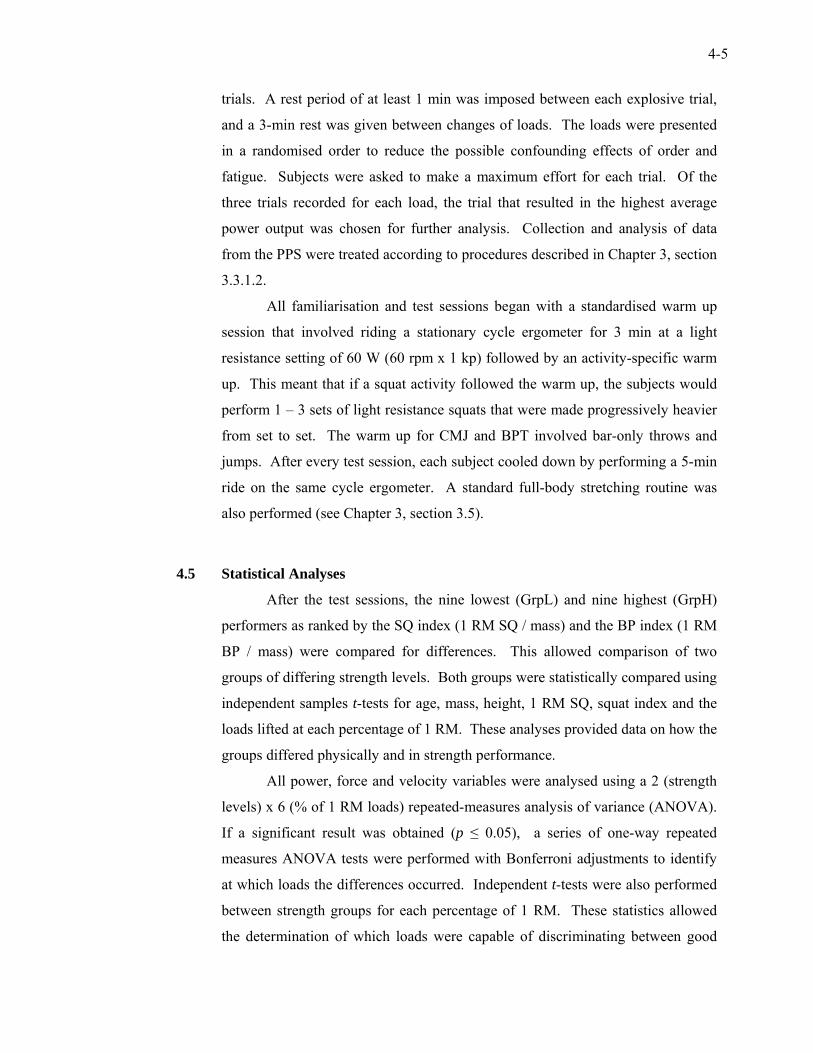
4-5
trials. A rest period of at least 1 min was imposed between each explosive trial,
and a 3-min rest was given between changes of loads. The loads were presented
in a randomised order to reduce the possible confounding effects of order and
fatigue. Subjects were asked to make a maximum effort for each trial. Of the
three trials recorded for each load, the trial that resulted in the highest average
power output was chosen for further analysis. Collection and analysis of data
from the PPS were treated according to procedures described in Chapter 3, section
3.3.1.2.
All familiarisation and test sessions began with a standardised warm up
session that involved riding a stationary cycle ergometer for 3 min at a light
resistance setting of 60 W (60 rpm x 1 kp) followed by an activity-specific warm
up. This meant that if a squat activity followed the warm up, the subjects would
perform 1 – 3 sets of light resistance squats that were made progressively heavier
from set to set. The warm up for CMJ and BPT involved bar-only throws and
jumps. After every test session, each subject cooled down by performing a 5-min
ride on the same cycle ergometer. A standard full-body stretching routine was
also performed (see Chapter 3, section 3.5).
4.5 Statistical Analyses
After the test sessions, the nine lowest (GrpL) and nine highest (GrpH)
performers as ranked by the SQ index (1 RM SQ / mass) and the BP index (1 RM
BP / mass) were compared for differences. This allowed comparison of two
groups of differing strength levels. Both groups were statistically compared using
independent samples t-tests for age, mass, height, 1 RM SQ, squat index and the
loads lifted at each percentage of 1 RM. These analyses provided data on how the
groups differed physically and in strength performance.
All power, force and velocity variables were analysed using a 2 (strength
levels) x 6 (% of 1 RM loads) repeated-measures analysis of variance (ANOVA).
If a significant result was obtained (p ≤ 0.05), a series of one-way repeated
measures ANOVA tests were performed with Bonferroni adjustments to identify
at which loads the differences occurred. Independent t-tests were also performed
between strength groups for each percentage of 1 RM. These statistics allowed
the determination of which loads were capable of discriminating between good
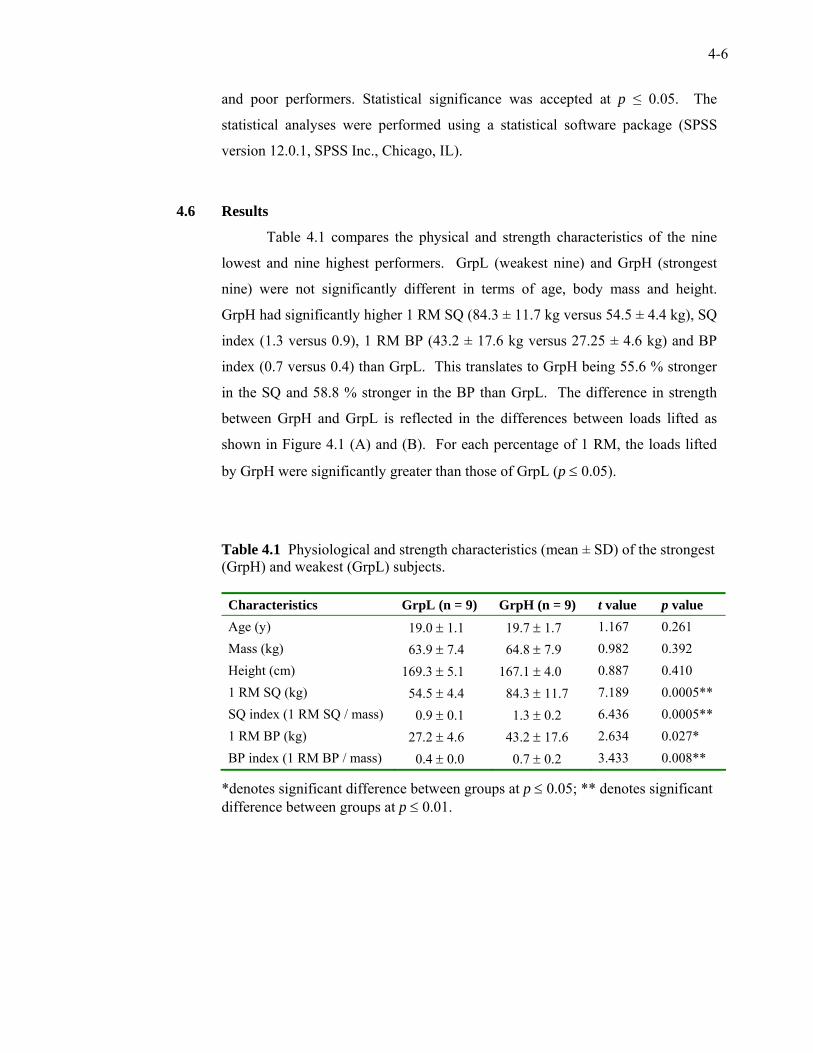
4-6
and poor performers. Statistical significance was accepted at p ≤ 0.05. The
statistical analyses were performed using a statistical software package (SPSS
version 12.0.1, SPSS Inc., Chicago, IL).
4.6 Results
Table 4.1 compares the physical and strength characteristics of the nine
lowest and nine highest performers. GrpL (weakest nine) and GrpH (strongest
nine) were not significantly different in terms of age, body mass and height.
GrpH had significantly higher 1 RM SQ (84.3 ± 11.7 kg versus 54.5 ± 4.4 kg), SQ
index (1.3 versus 0.9), 1 RM BP (43.2 ± 17.6 kg versus 27.25 ± 4.6 kg) and BP
index (0.7 versus 0.4) than GrpL. This translates to GrpH being 55.6 % stronger
in the SQ and 58.8 % stronger in the BP than GrpL. The difference in strength
between GrpH and GrpL is reflected in the differences between loads lifted as
shown in Figure 4.1 (A) and (B). For each percentage of 1 RM, the loads lifted
by GrpH were significantly greater than those of GrpL (p ≤ 0.05).
Table 4.1 Physiological and strength characteristics (mean ± SD) of the strongest (GrpH) and weakest (GrpL) subjects.
Characteristics GrpL (n = 9) GrpH (n = 9) t value p value Age (y) 019.0 ± 1.1 019.7 ± 1.7 1.167 0.261 Mass (kg) 063.9 ± 7.4 064.8 ± 7.9 0.982 0.392 Height (cm) 169.3 ± 5.1 167.1 ± 4.0 0.887 0.410 1 RM SQ (kg) 054.5 ± 4.4 084.3 ± 11.7 7.189 0.0005** SQ index (1 RM SQ / mass) 000.9 ± 0.1 001.3 ± 0.2 6.436 0.0005** 1 RM BP (kg) 027.2 ± 4.6 043.2 ± 17.6 2.634 0.027* BP index (1 RM BP / mass) 000.4 ± 0.0 000.7 ± 0.2 3.433 0.008**
*denotes significant difference between groups at p ≤ 0.05; ** denotes significant difference between groups at p ≤ 0.01.
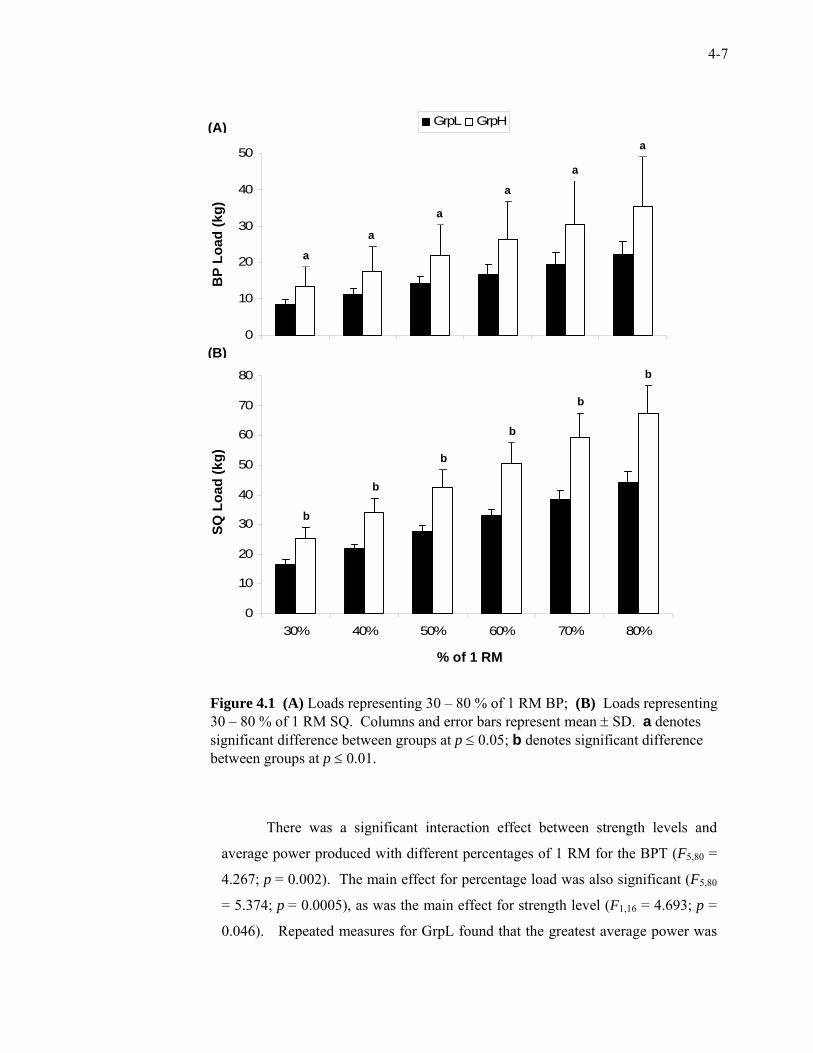
4-7
Figure 4.1 (A) Loads representing 30 – 80 % of 1 RM BP; (B) Loads representing 30 – 80 % of 1 RM SQ. Columns and error bars represent mean ± SD. a denotes significant difference between groups at p ≤ 0.05; b denotes significant difference between groups at p ≤ 0.01.
There was a significant interaction effect between strength levels and
average power produced with different percentages of 1 RM for the BPT (F5,80 =
4.267; p = 0.002). The main effect for percentage load was also significant (F5,80
= 5.374; p = 0.0005), as was the main effect for strength level (F1,16 = 4.693; p =
0.046). Repeated measures for GrpL found that the greatest average power was
0
10
20
30
40
50
1 2 3 4 5 6
GrpL GrpH
0
10
20
30
40
50
60
70
80
30% 40% 50% 60% 70% 80%
BP
Load
(kg)
SQ
Loa
d (k
g)
% of 1 RM
(A)
(B)
b
a
a
a
a
a
a
b
b
b
b
b
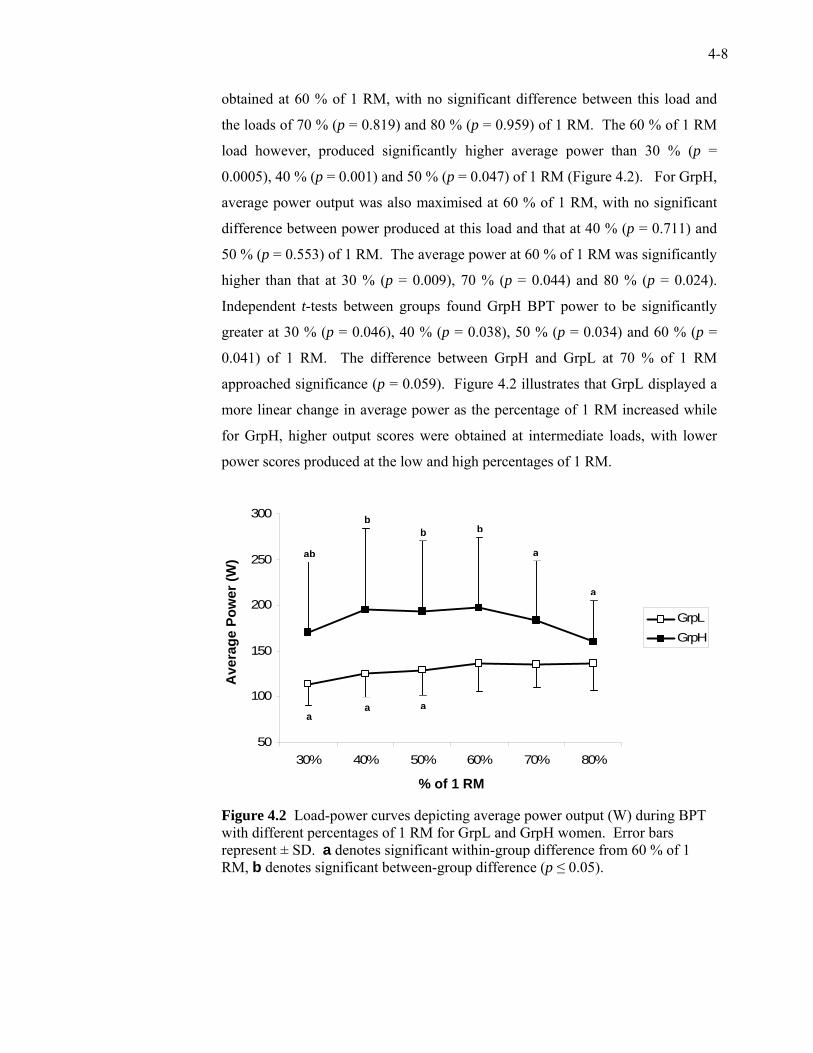
4-8
obtained at 60 % of 1 RM, with no significant difference between this load and
the loads of 70 % (p = 0.819) and 80 % (p = 0.959) of 1 RM. The 60 % of 1 RM
load however, produced significantly higher average power than 30 % (p =
0.0005), 40 % (p = 0.001) and 50 % (p = 0.047) of 1 RM (Figure 4.2). For GrpH,
average power output was also maximised at 60 % of 1 RM, with no significant
difference between power produced at this load and that at 40 % (p = 0.711) and
50 % (p = 0.553) of 1 RM. The average power at 60 % of 1 RM was significantly
higher than that at 30 % (p = 0.009), 70 % (p = 0.044) and 80 % (p = 0.024).
Independent t-tests between groups found GrpH BPT power to be significantly
greater at 30 % (p = 0.046), 40 % (p = 0.038), 50 % (p = 0.034) and 60 % (p =
0.041) of 1 RM. The difference between GrpH and GrpL at 70 % of 1 RM
approached significance (p = 0.059). Figure 4.2 illustrates that GrpL displayed a
more linear change in average power as the percentage of 1 RM increased while
for GrpH, higher output scores were obtained at intermediate loads, with lower
power scores produced at the low and high percentages of 1 RM.
Figure 4.2 Load-power curves depicting average power output (W) during BPT with different percentages of 1 RM for GrpL and GrpH women. Error bars represent ± SD. a denotes significant within-group difference from 60 % of 1 RM, b denotes significant between-group difference (p ≤ 0.05).
50
100
150
200
250
300
30% 40% 50% 60% 70% 80%
GrpLGrpH
Ave
rage
Pow
er (W
)
% of 1 RM
ab a
a
a a a
bb b
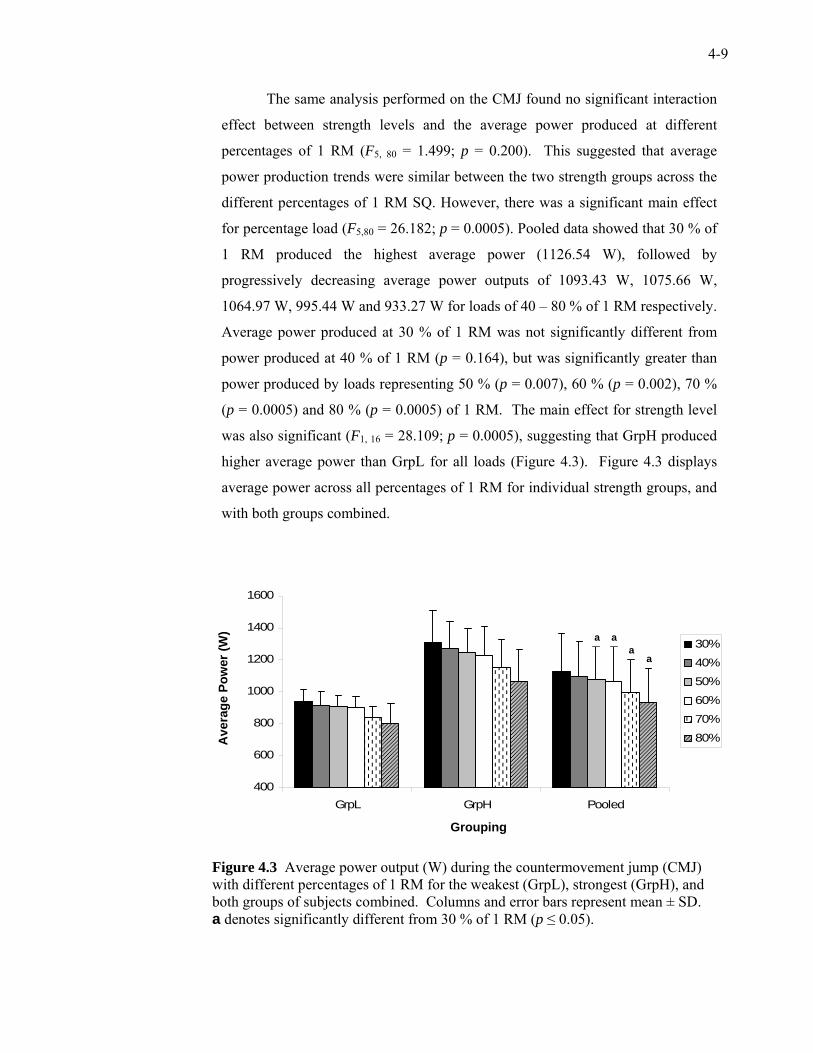
4-9
The same analysis performed on the CMJ found no significant interaction
effect between strength levels and the average power produced at different
percentages of 1 RM (F5, 80 = 1.499; p = 0.200). This suggested that average
power production trends were similar between the two strength groups across the
different percentages of 1 RM SQ. However, there was a significant main effect
for percentage load (F5,80 = 26.182; p = 0.0005). Pooled data showed that 30 % of
1 RM produced the highest average power (1126.54 W), followed by
progressively decreasing average power outputs of 1093.43 W, 1075.66 W,
1064.97 W, 995.44 W and 933.27 W for loads of 40 – 80 % of 1 RM respectively.
Average power produced at 30 % of 1 RM was not significantly different from
power produced at 40 % of 1 RM (p = 0.164), but was significantly greater than
power produced by loads representing 50 % (p = 0.007), 60 % (p = 0.002), 70 %
(p = 0.0005) and 80 % (p = 0.0005) of 1 RM. The main effect for strength level
was also significant (F1, 16 = 28.109; p = 0.0005), suggesting that GrpH produced
higher average power than GrpL for all loads (Figure 4.3). Figure 4.3 displays
average power across all percentages of 1 RM for individual strength groups, and
with both groups combined.
Figure 4.3 Average power output (W) during the countermovement jump (CMJ) with different percentages of 1 RM for the weakest (GrpL), strongest (GrpH), and both groups of subjects combined. Columns and error bars represent mean ± SD. a denotes significantly different from 30 % of 1 RM (p ≤ 0.05).
400
600
800
1000
1200
1400
1600
GrpL GrpH Pooled
30%
40%50%
60%70%
80%Ave
rage
Pow
er (W
)
Grouping
a a a
a
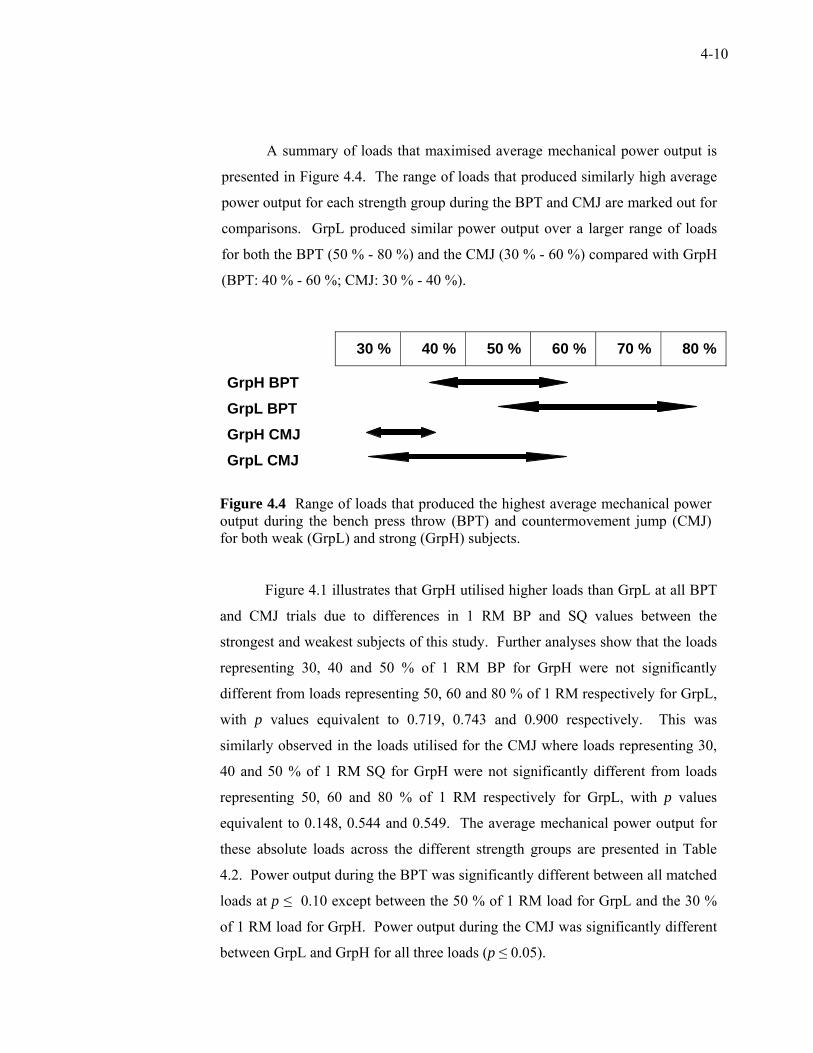
4-10
A summary of loads that maximised average mechanical power output is
presented in Figure 4.4. The range of loads that produced similarly high average
power output for each strength group during the BPT and CMJ are marked out for
comparisons. GrpL produced similar power output over a larger range of loads
for both the BPT (50 % - 80 %) and the CMJ (30 % - 60 %) compared with GrpH
(BPT: 40 % - 60 %; CMJ: 30 % - 40 %).
30 % 40 % 50 % 60 % 70 % 80 %
GrpH BPT
GrpL BPT
GrpH CMJ
GrpL CMJ
Figure 4.4 Range of loads that produced the highest average mechanical power output during the bench press throw (BPT) and countermovement jump (CMJ) for both weak (GrpL) and strong (GrpH) subjects.
Figure 4.1 illustrates that GrpH utilised higher loads than GrpL at all BPT
and CMJ trials due to differences in 1 RM BP and SQ values between the
strongest and weakest subjects of this study. Further analyses show that the loads
representing 30, 40 and 50 % of 1 RM BP for GrpH were not significantly
different from loads representing 50, 60 and 80 % of 1 RM respectively for GrpL,
with p values equivalent to 0.719, 0.743 and 0.900 respectively. This was
similarly observed in the loads utilised for the CMJ where loads representing 30,
40 and 50 % of 1 RM SQ for GrpH were not significantly different from loads
representing 50, 60 and 80 % of 1 RM respectively for GrpL, with p values
equivalent to 0.148, 0.544 and 0.549. The average mechanical power output for
these absolute loads across the different strength groups are presented in Table
4.2. Power output during the BPT was significantly different between all matched
loads at p ≤ 0.10 except between the 50 % of 1 RM load for GrpL and the 30 %
of 1 RM load for GrpH. Power output during the CMJ was significantly different
between GrpL and GrpH for all three loads (p ≤ 0.05).
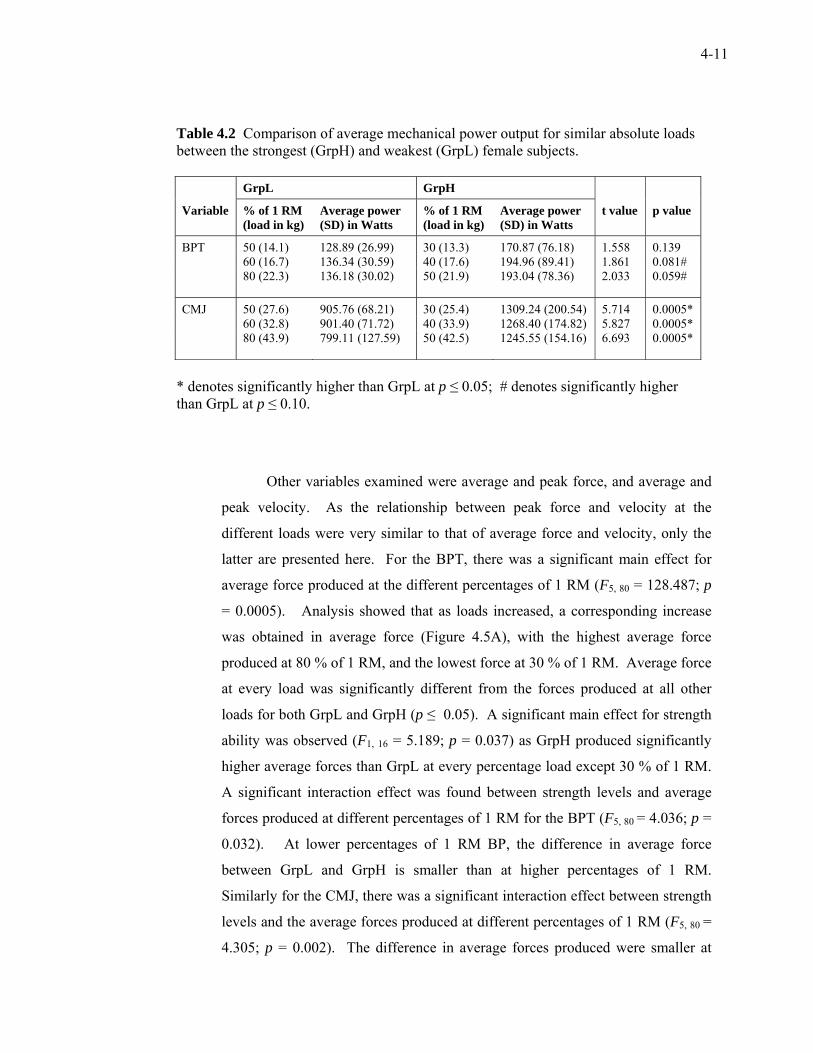
4-11
Table 4.2 Comparison of average mechanical power output for similar absolute loads between the strongest (GrpH) and weakest (GrpL) female subjects.
GrpL GrpH
Variable % of 1 RM (load in kg)
Average power (SD) in Watts
% of 1 RM (load in kg)
Average power (SD) in Watts
t value p value
BPT 50 (14.1) 128.89 (26.99) 30 (13.3) 170.87 (76.18) 1.558 0.139 60 (16.7) 136.34 (30.59) 40 (17.6) 194.96 (89.41) 1.861 0.081# 80 (22.3) 136.18 (30.02) 50 (21.9) 193.04 (78.36) 2.033 0.059# CMJ 50 (27.6) 905.76 (68.21) 30 (25.4) 1309.24 (200.54) 5.714 0.0005* 60 (32.8) 901.40 (71.72) 40 (33.9) 1268.40 (174.82) 5.827 0.0005* 80 (43.9) 799.11 (127.59) 50 (42.5) 1245.55 (154.16) 6.693 0.0005*
* denotes significantly higher than GrpL at p ≤ 0.05; # denotes significantly higher than GrpL at p ≤ 0.10.
Other variables examined were average and peak force, and average and
peak velocity. As the relationship between peak force and velocity at the
different loads were very similar to that of average force and velocity, only the
latter are presented here. For the BPT, there was a significant main effect for
average force produced at the different percentages of 1 RM (F5, 80 = 128.487; p
= 0.0005). Analysis showed that as loads increased, a corresponding increase
was obtained in average force (Figure 4.5A), with the highest average force
produced at 80 % of 1 RM, and the lowest force at 30 % of 1 RM. Average force
at every load was significantly different from the forces produced at all other
loads for both GrpL and GrpH (p ≤ 0.05). A significant main effect for strength
ability was observed (F1, 16 = 5.189; p = 0.037) as GrpH produced significantly
higher average forces than GrpL at every percentage load except 30 % of 1 RM.
A significant interaction effect was found between strength levels and average
forces produced at different percentages of 1 RM for the BPT (F5, 80 = 4.036; p =
0.032). At lower percentages of 1 RM BP, the difference in average force
between GrpL and GrpH is smaller than at higher percentages of 1 RM.
Similarly for the CMJ, there was a significant interaction effect between strength
levels and the average forces produced at different percentages of 1 RM (F5, 80 =
4.305; p = 0.002). The difference in average forces produced were smaller at
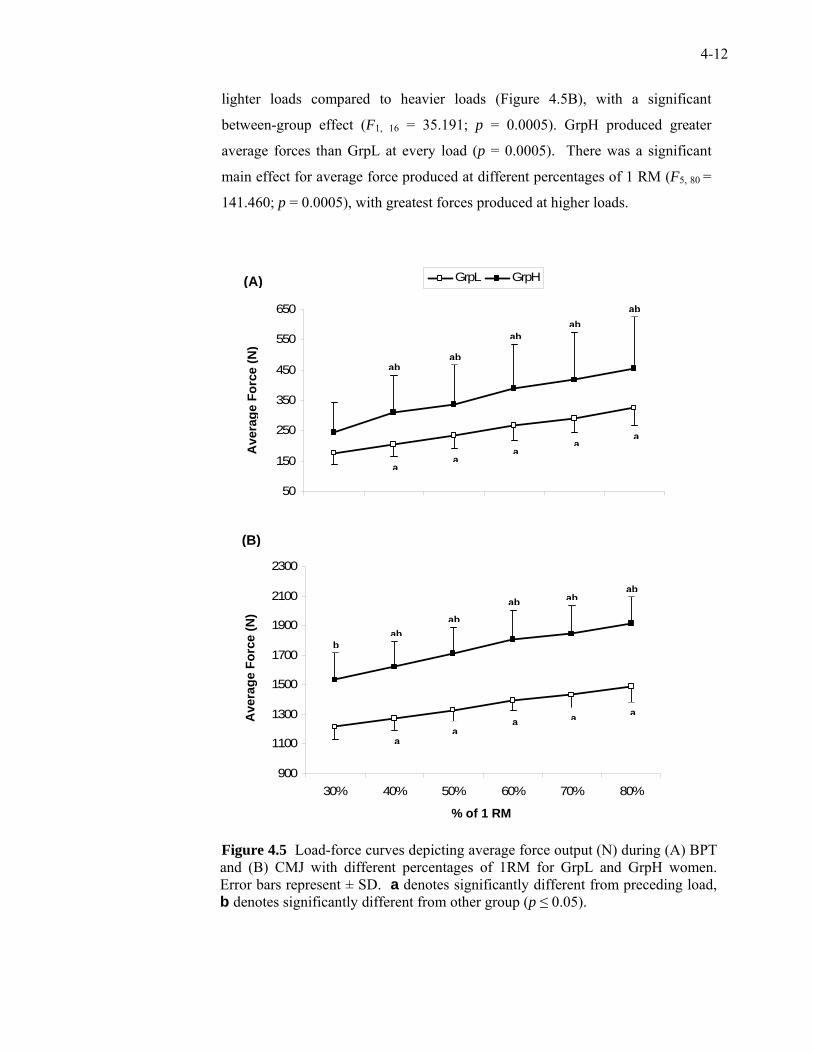
4-12
lighter loads compared to heavier loads (Figure 4.5B), with a significant
between-group effect (F1, 16 = 35.191; p = 0.0005). GrpH produced greater
average forces than GrpL at every load (p = 0.0005). There was a significant
main effect for average force produced at different percentages of 1 RM (F5, 80 =
141.460; p = 0.0005), with greatest forces produced at higher loads.
Figure 4.5 Load-force curves depicting average force output (N) during (A) BPT and (B) CMJ with different percentages of 1RM for GrpL and GrpH women. Error bars represent ± SD. a denotes significantly different from preceding load, b denotes significantly different from other group (p ≤ 0.05).
50
150
250
350
450
550
650
30% 40% 50% 60% 70% 80%
GrpL GrpH
900
1100
1300
1500
1700
1900
2100
2300
30% 40% 50% 60% 70% 80%
Ave
rage
For
ce (N
)
(A)
a
aa
aa
abab
ab
abab
(B)
Ave
rage
For
ce (N
)
% of 1 RM
aa
a a a
bab
ababab
ab
4-13
Average velocity changed in a manner that contrasted with average force;
as loading conditions increased, average velocity decreased. For the BPT there
was an interaction effect between groups and percentage loads (F5, 80 = 4.447, p =
0.001). GrpH achieved higher velocities at lower loads, and lower velocities at
higher loads compared with GrpL, resulting in the graphs intersecting at 60 % of
1 RM (Figure 4.6A). The main between-group effect was not significant (F1, 16 =
0.092, p = 0.766), and independent t-tests found significant difference between
the groups only at 80 % of 1 RM, where the average velocity produced by GrpH
had reached a level lower than that of GrpL (Figure 4.6A). There was a
significant effect for load (F5, 80 = 118.909, p = 0.0005), signifying a significant
decrease in average velocity (p ≤ 0.05) for every 10 % increase in load. Average
decrease across loads was 9.1 % for GrpL and 14.3 % for GrpH.
Correspondingly for the CMJ, average velocity differed significantly
across loads, with the heavier loading conditions resulting in lower velocities and
maximal velocity being obtained with the lightest load (F5, 80 = 268.352, p =
0.0005). The main between-group effect was not significant (F1, 16 = 2.612; p =
0.126), but there was an interaction effect between strength levels and changes in
percentage loads (F5, 80 = 2.800, p = 0.022) with GrpH achieving higher velocities
at all loads, but differences in average velocities diminishing as loads increased.
There was a significant decrease in average velocity (p ≤ 0.05) for every 10 %
increase in load (Figure 4.6B). Average decrease across loads was 7.5 % for
GrpL and 8.6 % for GrpH.
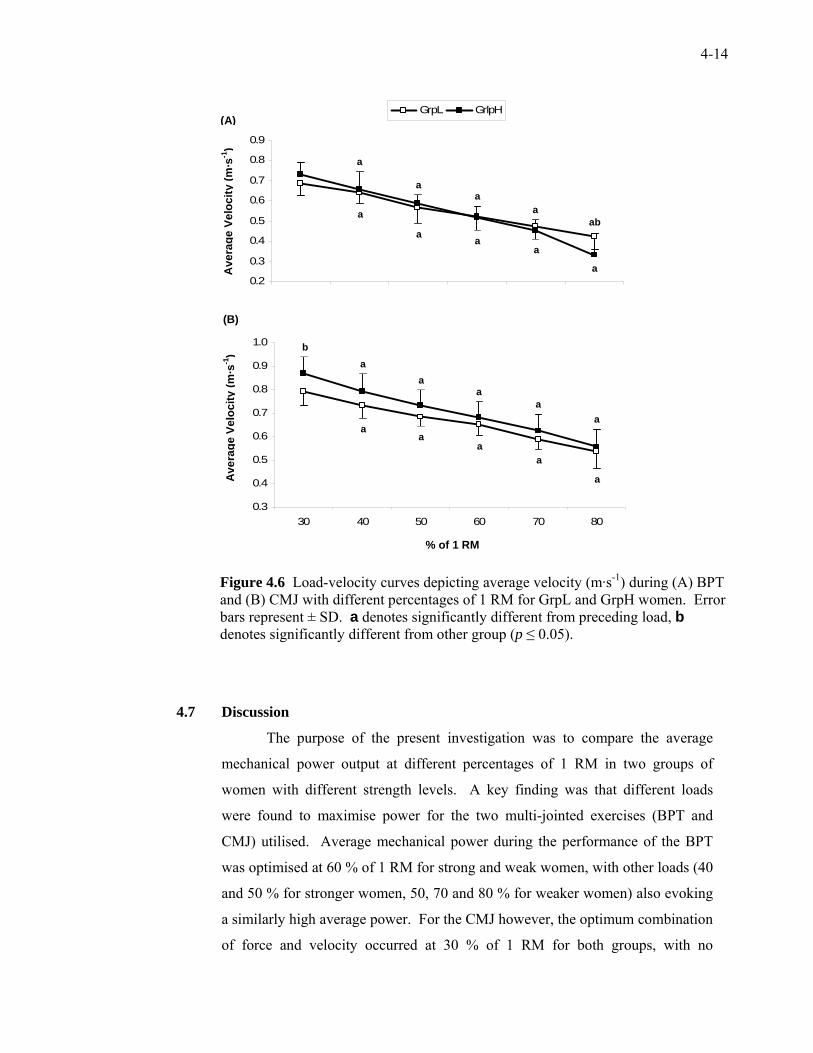
4-14
Figure 4.6 Load-velocity curves depicting average velocity (m·s-1) during (A) BPT and (B) CMJ with different percentages of 1 RM for GrpL and GrpH women. Error bars represent ± SD. a denotes significantly different from preceding load, b denotes significantly different from other group (p ≤ 0.05).
4.7 Discussion
The purpose of the present investigation was to compare the average
mechanical power output at different percentages of 1 RM in two groups of
women with different strength levels. A key finding was that different loads
were found to maximise power for the two multi-jointed exercises (BPT and
CMJ) utilised. Average mechanical power during the performance of the BPT
was optimised at 60 % of 1 RM for strong and weak women, with other loads (40
and 50 % for stronger women, 50, 70 and 80 % for weaker women) also evoking
a similarly high average power. For the CMJ however, the optimum combination
of force and velocity occurred at 30 % of 1 RM for both groups, with no
0.2
0.3
0.4
0.5
0.6
0.7
0.8
0.9
30 40 50 60 70 80
GrpL GrlpH(A)
ab a
a
aa
a
a aa
a Ave
rage
Vel
ocity
(m·s
-1)
0.3
0.4
0.5
0.6
0.7
0.8
0.9
1.0
30 40 50 60 70 80
Ave
rage
Vel
ocity
(m·s
-1)
aa
aa
a a
aa
a
a
b
% of 1 RM
(B)
4-15
difference between this load and 40 % of 1 RM for stronger women, while loads
of 40, 50 and 60 % of 1 RM were also able to produce high power outputs for
weaker women. Graphs displaying power output in the upper and lower body
(Figures 4.2 and 4.3) are clearly different, and suggest that the ability to produce
power does not follow the same pattern across all muscle and joint systems
(Siegel et al., 2002) in females.
Although no differences existed in the basic anthropometric measures of
the two groups, GrpH was significantly stronger than GrpL in both the upper
(strength indices of 0.7 versus 0.4) and lower body (strength indices of 1.3 versus
0.9). As strength and power data for females are scarce, it was difficult to
accurately characterise the present subjects. Herrick and Stone (1996) trained
novice female subjects of similar age and physical characteristics for 15 wk using
two different resistance training programmes. At pre-test, the subjects had a SQ
index of 0.78 and a BP index of 0.52, which increased to 1.16 and 0.66
respectively at post-test. These values for the SQ are lower when compared with
the subjects from GrpL and GrpH in the present study. However, it needs to be
clarified that the subjects in the study by Herrick and Stone (1996) performed
parallel squats, while the present subjects performed squats to a knee angle of
110°. The greater knee angle utilised in the present study may have produced
greater 1 RM SQ values than a SQ performed with a smaller knee angle (Baker et
al. 2001b). For the BP, Herrick and Stone obtained indices of 0.52 (pre-test) and
0.66 (post-test), which are slightly higher than subjects from GrpL (0.4), but
lower than subjects from GrpH (0.7). Our results may also be compared with
netball players with resistance-training experience who recorded a BP strength
index of 0.48 (Cronin & Owen, 2004). Thus, it would seem that the strength
indices achieved by GrpL and GrpH are representative of untrained and
moderately strength-trained women respectively, for both the SQ and BP.
As no values for maximal average mechanical power output in females
during the BPT and CMJ could be found, comparisons were made based on data
observed in male subjects. The maximal average mechanical power output
values produced by the female subjects during the BPT (136 - 198 W) in the
present study were much lower than those reported in male subjects (Baker et al.
2001a – 598 W; Cronin, McNair & Marshall, 2000 – 233-321 W; Cronin et al.
2001 – 335 W; Newton, Kraemer, Hakkinen, Humphries & Murphy, 1996 –
4-16
595 W; Newton et al. 1997 – 563 W; Mayhew et al. 1997 – 450 W). Only Baker
et al. (2001b) provided values for average power produced during the CMJ –
1772 W; a much higher power output value when compared with 944 W from
GrpL and 1309 W from GrpH in the present study. It appears that, compared to
women, men are able to produce higher average mechanical power outputs
whether they are trained (Baker et al., 2001a & 2001b; Newton et al., 1996;
Newton et al., 1997) or have less resistance-training experience (Cronin et al.,
2000 & 2001; Mayhew et al., 1997) compared to women. As power has been
reported to be related to strength (Moss et al., 1997; Baker, 2001a) and males
have been reported to be stronger than women (Faigenbaum, 2000; Shepard,
2000), it is not surprising that men are more powerful than women. However,
when the BPT power data from the present study was expressed relative to body
mass, the difference in power output between men (Cronin et al., 2000: 2.7 – 3.7
W·kg-1) and women (2.1 – 3.1 W·kg-1) of similar resistance-training experience
became similar. Although the BPT power output relative to body mass in these
women are still lower than those observed in highly-trained males (Baker et al.,
2001a - 6.5 W·kg-1; Newton et al., 1996 - 7.1 W·kg-1; Newton et al., 1997 - 6.7
W·kg-1), it is likely that similar to differences in strength due to sex (Heyward,
Johannes-Ellis & Romer, 1986), increased resistance-training experience would
narrow the differences in power between sexes.
In addition to providing average power output values for women, the
current data suggest that, similar to some of the previous studies on men from
different sports (Izquierdo, Hakkinen, Gonzalez-Badillo, Ibanez & Gorostiaga,
2002; Siegel et al., 2002), women do not optimise average mechanical power at
the same loads in the upper and lower body. However, in contrast to the present
study, previous research on males suggests that the lower body produces optimal
power at higher percentages of 1 RM compared with the upper body (Siegel et
al., 2002; Izquierdo et al., 2002). Adding to this ambiguity, the studies by Baker
et al. (2001a, 2001b) have indicated that both the upper and lower body
maximise average mechanical power at similar percentages of 1 RM for power-
trained male rugby players. The discrepancy in results may be due to differences
in methodology (Dugan et al., 2004) or it may be that weaker parts of the body
are compelled to apply higher forces at higher loads, resulting in better power
outputs for higher ranges of 1 RM. The present subjects had relatively untrained
4-17
(and weaker) upper-bodies compared to their lower-bodies; therefore optimal
loads are produced at higher ranges of 1 RM for the BPT compared with the
CMJ. It was not possible to verify this from the studies by Siegel et al. (2002)
and Izquierdo et al. (2002) as their power scores may be less accurate since they
were obtained without the projection of the barbell and only displacement data
were used (Dugan et al., 2004).
Supporting this notion is the observation that weaker performers seemed
to produce higher mechanical power outputs at higher ranges of 1 RM compared
with stronger performers (Figure 4.4), for both the BPT (GrpL: 50 - 80 %, GrpH:
40 - 60 %) and CMJ (GrpL: 30 - 60 %, GrpH: 30 - 40 %). Possible reasons may
be found by examining the force-velocity relationship in the production of power.
Current data from these two variables conform to the force-velocity relationship
of muscle action: greater levels of force were recorded with heavier loads while
an inverse relationship was observed for velocity (Figures 4.5 and 4.6). This
meant that as greater percentages of 1 RM loads were utilised, average force
increased but average velocities decreased, probably due to the subjects’ inability
to release the heavier barbell loads quickly (Cronin, Marshall & McNair, 2003).
Newton et al. (1996) has explained that loads greater than 70% of 1 RM appear
ineffective for maximising power output during the CMJ due to the far greater
decrease in velocity relative to the smaller increase in force that results from the
use of heavier loads. However, it is not known why the combination of force and
velocity to produce optimal power output did not occur at the same percentages
of 1 RM for women of differing strength levels. Baker (2001a) has suggested
that weaker subjects increased power output by increasing the force applied to
the load while maintaining movement speed, whereas stronger subjects
maximised power by increasing the speed at which each load is lifted. The data
from the present study does not support this argument as both strong and weak
women similarly increased force application and decreased velocities as loads
increased.
Stronger subjects performed every BPT and CMJ with higher absolute
loads due to their greater 1 RM scores. These higher absolute loads have
considerably more initial inertia to overcome, which becomes more pronounced
with higher percentages of 1 RM (70 – 80 %), resulting in more optimal power
production at lower loads (Baker 2001a). Thus, at higher percentages of 1 RM,
4-18
the heavier absolute loads may require a stiffer series elastic component (SEC) in
GrpH to safely absorb the eccentric impact during the lowering of the barbell for
the BPT and CMJ that in turn, may reduce the transfer of elastic strain energy to
the ensuing concentric movement, thereby reducing average concentric power
production (Golhoffer & Kryolainen, 1991). The comparisons presented in Table
4.2 illustrate that the loads lifted by GrpH at 30, 40 and 50 % of 1 RM BP and
SQ were similar in absolute terms to those representing 50, 60 and 80 % of 1 RM
for GrpL. GrpH produced higher average power than GrpL for each load under
comparison probably because these absolute loads represented lower percentages
of 1 RM that required a more compliant SEC component, enabling the
production of higher power. All these factors lend support to why stronger
individuals optimise power at lower percentages of 1 RM compared with weaker
individuals.
It has been previously observed that there are different optimal loads to
maximise power output in subjects of different resistance-training experience for
different exercises (Baker, 1995; Lund, Dolny & Browder, 2004; Kawamori,
Crum, Blumert et al., 2005). However, there is very little agreement between
studies. Olympic lifts maximised average power at 80 - 90 % of 1 RM,
traditional strength exercises at 40 – 60 % of 1 RM, and jump squats at 30 – 40
% of 1 RM (Baker, 1995); average and peak power were maximised at 60 % of 1
RM during the leg press (Lund, Dolny & Browder, 2004); and peak power was
maximised at 70 % of 1 RM during the hang power clean (Kawamori, Crum,
Blumert et al., 2005). In fact, the lack of agreement among the studies
performed so far is more apparent than issues that have found concurrence. The
review by Dugan et al. (2004) evoked legitimate reasons why comparison of
results and replication of research have been made difficult by differences in data
collection and methodology. The different studies examined had obtained power
output using different experimental setups: using only displacement data, only
force data, both force and displacement data, and accelerometer systems;
included or excluded body weight in the calculation of power; used free weights
or exercise machines; reported average or peak power; used different joint angles
for similar movements; usage and non-usage of a SSC. Differences in the
optimal load for maximising power also differed depending whether the weight
implement was projected of not at the end of the movement (Cronin et al., 2001).
4-19
Thus new studies examining loads that maximise power output need to report
procedural aspects with greater clarity, to ensure that better understanding is
achieved regarding the relationship between resistance loads and power for
different subjects and different exercises.
4.8 Conclusion
Although data from the present study suggested that 60 and 30 % of 1
RM will maximise mechanical power output during the BPT and CMJ
respectively in female subjects, a range of loads can be applied depending on the
strength status of the subjects. Average mechanical power output was
maximised at 30 % of 1 RM for the CMJ in both strong and weak women.
However, a load of 40 % of 1 RM also produced high average power output for
the stronger women, while loads between 40 – 60 % of 1 RM allowed for high
average power output in weaker women. The load that maximised average
mechanical power during the BPT was 60 % of 1 RM for both strength groups.
Stronger women also produced high average power with 40 and 50 % of 1 RM,
while weaker women produced high power outputs at 50, 70 and 80 % of 1 RM.
The upper body maximised power using different percentages of 1 RM when
compared with the lower body. Power curves suggest that stronger, more
powerful subjects utilise resistances of a lower percentage of 1 RM to maximise
their power output compared to less strong subjects. While the idea of training at
the load that maximises average mechanical power has garnered reasonable
support, higher percentages of 1 RM for novice subjects should be avoided.
Subjects may need to train with simple exercises at lower loads emphasising
technique and speed of movement (Baker, 2002). Even though specific
percentages of 1 RM have been shown to maximise power, the lack of significant
differences between the optimal loads with lower percentages of 1 RM may
make it safer and more prudent to utilise lighter loads for power training in
novices. Additionally, conflicting results with some previous studies may make
it more suitable to utilise a range of lower percentages of 1 RM for power
training, while maintaining heavier loads for maximal strength training.
5-1
CHAPTER 5. ENHANCING MUSCULAR STRENGTH QUALITIES IN UNTRAINED WOMEN: LINEAR VERSUS UNDULATING PERIODISATION
5.1 Introduction
Resistance training programmes have been used since before recorded
history (Clark, 1973). While recorded history has described many anecdotal
regimes to maximise strength qualities, the scientific examination of optimal
training has occurred more recently. Studies from the 1940s – 1960s frequently
utilised Progressive Resistance Exercise (PRE) that involved the use of constant
repetitions at a fixed percentage of one-repetition maximum (1 RM) throughout
an entire training period. A number of studies from that era concluded that
maximal strength gains were achieved when subjects performed 6 – 8 RM for
three sets using PRE (Berger, 1963; O’Shea, 1966; Berger & Hardage, 1967).
More recently, the American College of Sports Medicine (ACSM, 2002)
recommended that for development of strength, 1 – 6 RM performed at moderate
velocity was the optimal prescription after lighter (8 – 12 RM) base-traininh was
performed.
Resistance training can also be utilised to develop muscular hypertrophy,
which is needed to aid anatomical adaptations in the early stages of strength
training. Bompa (1993) suggested that by performing hypertrophy training
before strength training, improvement in strength is increased. Research has
shown that three sets of 8-10 RM with shorter rest periods of 1 - 1.5 min can
elicit a large response from the endocrine system which in turn is hypothesised to
provide a greater stimulus for muscle size increments (Kraemer, Noble, Clark &
Culver, 1987). Consistent with this, it has been suggested that hypertrophy
training should consist of multiple sets of loads within the 6 – 12 RM training
zone at a moderate velocity (ACSM, 2002).
While there appears some agreement on the range of volume and
intensity required for the development of maximal strength and hypertrophy,
there is limited agreement regarding the exercise prescription required to
optimise power development. Previous studies have suggested that training at
the load that produces the highest power output may provide the most effective
stimulus for improving power performance (Wilson, Newton, Murphy &
5-2
Humphries, 1993; Kawamori & Haff, 2004). However, research investigating
power production has obtained results indicating that maximal power outputs
could be brought about through high, low, or even intermediate ranges of the 1
RM load (Behm & Sale, 1993; Baker, Nance & Moore, 2001a & 2001b; Wilson
et al., 1993). This discrepancy in results may be due to the different methods
used for the measurement and calculation of power, the experimental protocol,
equipment, and different body positions adopted during testing (Dugan, Doyle,
Humphries, Hasson & Newton, 2004).
In a study that addressed many of the concerns raised by Dugan et al.
(2004), it was shown that both stronger and weaker women maximised power
during the countermovement jump (CMJ) at 30 % of 1 RM, with no statistical
difference between this load and 40 % of 1 RM (see Chapter 3). This result is
comparable to those from studies by Wilson et al. (1993), and Hakkinen and
Komi (1985a, 1985b), and suggests that similar to men, light loads (30-40 % of
1 RM) maximise power for women during the CMJ. Although the load that
produced the highest mechanical power output during the bench press throw
(BPT) was not 30 % of 1 RM, but rather 40- 60 % of 1 RM for stronger women
and 50 – 80 % of 1 RM for weaker women (Chapter 4), support for using the
lighter load for power training could be obtained from Baker (2002). Baker
(2002) suggested that higher percentages of 1 RM should be avoided if the
subjects were novices to resistance training. Additional support to train with
loads approximating 30 % of 1 RM for the BPT can be found in a study by
Murphy, Wilson and Pryor (1994) who showed that this load possessed the
highest relation to dynamic performance (seated shot put).
The use of these loads in resistance training programmes for improving
hypertrophy, strength and power has normally followed the concept of
periodisation (Bompa, 1999). Periodisation allows for periods of active rest and
adaptation through manipulations of intensity, volume and rest (Herrick & Stone,
1996). Periodisation has been suggested to help avoid the oscillating pattern of
strength improvement-decrement usually associated with PRE in which training
intensity and repetitions remain the same, but training loads are progressively
increased (Bompa, 1999). Well-planned, periodised, training programmes may
also help reduce the possibility of staleness and overtraining (Fleck & Kraemer,
5-3
1997), as well as help athletes peak at appropriate times during an athletic season
(Harris, Stone, O’Bryant, Proulx & Johnson, 2000).
There are two basic periodisation models, although there is disagreement
over the terms given to the different models. The first is termed traditional,
linear, or stepwise periodisation, while the other model is termed non-linear,
non-traditional or undulating periodisation (Baker, Wilson & Carlyon, 1994;
Rhea, Ball, Phillips & Burkett, 2002; Kraemer, O’Bryant, Pendlay et al., 2004b).
This second model has also been termed mixed-methods resistance training by
Newton, Hakkinen, Hakkinen et al. (2002). Linear periodisation (LP) is
characterised by training that starts with high-volume and low-intensity
exercises, with volume reduced as intensity is increased as the athlete/trainee
works towards a peak in muscular performance, typically over a 10 – 12 wk
cycle. Theoretically, the early high-volume phase emphasises the hypertrophic
adaptations, and the later, high-intensity phase stresses the neural responses. In
contrast, undulating periodisation (UP), as first proposed by Poliquin (1988),
manipulates volume and intensity according to 2-wk cycles. Poliquin suggested
that a prolonged LP might lead to neural fatigue, which in turn would
compromise strength gains. Therefore, theoretically it might be better to
alternate short periods of high volume training with short periods of high-
intensity training. Newton et al. (2002) and Rhea et al. (2002) used a form of UP
where each microcycle contained three training days, and one day was allotted to
hypertrophy, maximal strength and power respectively, with training volume and
intensity undulating on a daily basis.
Despite the limitations of definition, the various models have been
compared between each other and against PRE. Some studies have proposed
that it is the fluctuations and variability in training intensity and volume through
a training period that have resulted in superior results when periodised
programmes were compared to other training models such as PRE programmes
(Stone, O’Bryant & Garhammer, 1981; Stowers, McMillan, Scala et al., 1983;
O’Bryant, Byrd & Stone, 1988; Willoughby, 1993; Stone, Potteiger, Pierce et al.,
2000) or one set of repetitions to failure (McGee, Jessee, Stone & Blessing,
1992; Kraemer, 1997; Marx, Ratamess, Nindl et al., 2001). However, a number
of these studies failed to equate training volume between comparative
programmes, thus rendering comparisons problematic. Based on this,
5-4
researchers such as Baker et al. (1994) and Schiotz, Potteiger, Huntsinger and
Denmark (1998) proposed that if volume (repetitions) and intensity were equal
over a training period, subjects would achieve similar results regardless of the
training structure used. Baker et al. (1994) reported that in males, there were no
differences in strength and power gains when training with PRE, LP or UP
programmes if training volume (repetitions) and relative intensity was equated
for the entire training period. A similar study conducted on males by Stone et
al. (2000) however, contradicted Baker et al. (1994) by finding that both the
periodised programmes produced better 1 RM scores than PRE when repetitions
were equalised and also when fewer repetitions were performed by the UP
group. In an attempt to further explore this concept, Rhea et al. (2002) altered
volume and intensity across four microcycles for LP, while the UP group altered
volume and intensity on a daily basis, but training volume (repetitions) and
intensity were equated throughout the 12-wk training period. UP training was
found to produce significantly greater percent gains in the bench press and leg
press than LP training. The results from Stone et al. (2000) and Rhea et al.
(2002) once again suggested that the manipulation and sequencing of volume
and intensity guided the final outcome of a training programme. Further
research is therefore required to investigate if periodised training was successful
because of the manipulation of volume and intensity, or if higher volume and
intensity would make any programme more successful.
Possible reasons for the discrepancies above may be due to the different
methods applied to estimate volume, the different intensities used during
training, and/or the varying training status of the subjects from different studies.
Some researchers (Baker et al., 1994; Stone et al., 2000; Rhea et al., 2002;
Kraemer, Hakkinen, Triplett-McBride et al., 2003) have estimated training
volume through the number of repetitions performed, but still obtained
conflicting observations on the efficacy of periodised training possibly due to
differences in training intensities. Others calculated volume as the product of the
total number of repetitions performed and the mass lifted (McGee et al., 1992;
Willoughby, 1993; Herrick & Stone, 1996). This method has been suggested as
a more accurate estimation of training volume (Stone, O’Bryant, Schilling et al.,
1999) as it is related to both the amount of work performed during the
lifting/pushing phase of exercise, and the level of training stress provided by the
5-5
exercises involved. In addition, both Baker et al. (1994) and Schiotz et al. (1998)
utilised subjects who were considered moderately trained as they could perform
parallel squats with loads between 1.2 to 1.5 times their body mass, and bench
press approximately 1.1 times their body mass. This differed from the study by
Stone et al. (2000), whose subjects could squat with approximately 1.7 times
their body mass, but did not perform the bench press. The subjects from the
study of Rhea et al. (2002) had similar upper-body strength compared to those of
Baker et al. (1994) and Schiotz et al. (1998), but the leg press was performed
instead of the squat. These inconsistencies have made the optimal periodisation
model elusive.
One of the problems of generalisation of many studies to the general
population is that few studies have examined the effects of periodised strength
training on women. In the studies that have utilised female subjects, similar
problems equating training volume were found. Herrick and Stone (1996) did
not find any significant statistical differences between PRE and LP programmes
when workloads (weight lifted x repetitions x sets) were matched. In contrast,
Kraemer, Ratamess, Fry et al. (2000) and Marx et al. (2001) both compared UP
protocols with single-set circuit resistance training and found that the periodised
groups improved strength and power performances earlier, and provided
continued gains in strength for untrained women. However, as the UP
programmes in both these studies had higher training volumes, the efficacy of
the structure of periodisation could not be ascertained. In a subsequent study,
Kraemer et al. (2003) equated weekly total training volume (number of sets x
number of repetitions) between a daily UP programme and a PRE programme for
a period of nine months. The subjects were female collegiate tennis players who
were not currently performing strength training and were matched on USTA
tennis rankings. Daily UP was found to be more effective in improving 1 RM
upper- and lower-body strength, jump height, and service, forehand and
backhand velocities. While this study indicated a positive effect of periodised
training, these results should be examined with caution as the researchers also
carried out a concurrent endurance programme. It has been previously reported
that concurrent strength and endurance training may affect strength development
(Leveritt, Abernethy, Barry & Logan, 1999).
5-6
5.2 Purpose
Although most research suggests that periodisation should be used during
resistance training, it is not clear whether it is the varying structure of the
periodised programmes or the differences in training volume that makes
periodisation successful. Clearly, more studies on the efficacy of LP and UP are
needed, especially those that assess strength changes in women. Such studies
should be careful to equate training volume between training protocols, as this
would make it easier to assess if the differences between training programmes
were due to the effectiveness of the structure of the periodised programmes or
because of differences in volume and intensity. Training volume however,
should include both repetitions and mass lifted, as this would constitute a better
estimate of work accomplished (Stone et al., 1999). It is also important to avoid
confounding factors such as concurrent training. Therefore, the purpose of this
study was to examine the efficacy of two periodised programmes (one that varied
training intensity and volume every 3 wk and the other daily) in producing
changes to upper- and lower-body strength qualities. It was hypothesised that
there would be no difference between LP or UP in enhancing strength qualities in
untrained females.
5.3 Methods
5.3.1 Subjects
Twenty-four active, female students volunteered for this study. All
subjects participated regularly in social and amateur level sports, but were not
systematically training. None had participated in strength training in the previous
six months, and were asked to maintain their normal dietary and activity habits
throughout the experimental period. All of the subjects were non-smokers, were
not taking any medication, and had no known medical conditions or physical
injuries that could confound the results of this study. Each subject was informed
of the potential risks and benefits associated with the investigation, and gave
informed consent (Appendix C). The Human Ethics Committee of UWA
approved all the procedures undertaken. Prior to the assignment to experimental
groups, four subjects withdrew for reasons unrelated to the research. The mean
5-7
(± SD) age, mass and height of the subjects who completed the study were 20.0 ±
1.9 y, 66.1 ± 9.5 kg and 170.7 ± 8.5 cm, respectively.
5.3.2 Study Overview
Tests were performed every 3 wk, with the first test session (T0)
performed prior to pre-training conditioning. All baseline measurements were
taken at (T1), with the final test at the end of 12 weeks (T4). The scheduling of
test sessions is shown in Figure 5.1. A 48-h break was given between the last
training session and subsequent testing sessions to ensure subjects had recovered
from previous training. Although it has been suggested that resistance training
may negatively affect neuromuscular performance for approximately seven days
due to fatigue and muscle damage (Baechle, Earle & Wathen, 2000), the 48-h
rest period was considered acceptable as the loads lifted by the subjects during
training were not maximal, and all subjects, regardless of experimental group,
were subjected to the same amount of rest prior to testing.
Four familiarisation sessions for testing and training were held prior to
the first test session (T0). Hand and foot positions for the strength and power
tests were determined and recorded so that the same positions were used each
time the subjects were tested in order to ensure reliability of position. Tests
performed during T0 were used to obtain 1 RM scores for the bench press and
squat, which were used to calculate training intensity during the pre-training
conditioning period (3 wk) that occurred subsequent to T0. This offered the
subjects a number of occasions (a minimum of 12) to learn how to perform the
test and training exercises with proper technique before the experimental period
began (training phases I, II and III). By doing so, differences between initial
baseline values at T1 were less likely to be influenced by learning effects and
neural improvements, especially since the subjects were novices.
At T1 (after pre-training conditioning), subjects were ranked and then
assigned to either the LP or UP group on the basis of their squat (SQ) index (1
RM SQ / mass ) ensuring that the average for each group was not significantly
different (SQ: t18 = 0.688, p = 0.500) at baseline. Based on the Q index, an
A-B-B-A procedure was used. The subject with the highest SQ index was
placed into Group A, the 2nd and 3rd ranked subjects into Group B, the 4th into
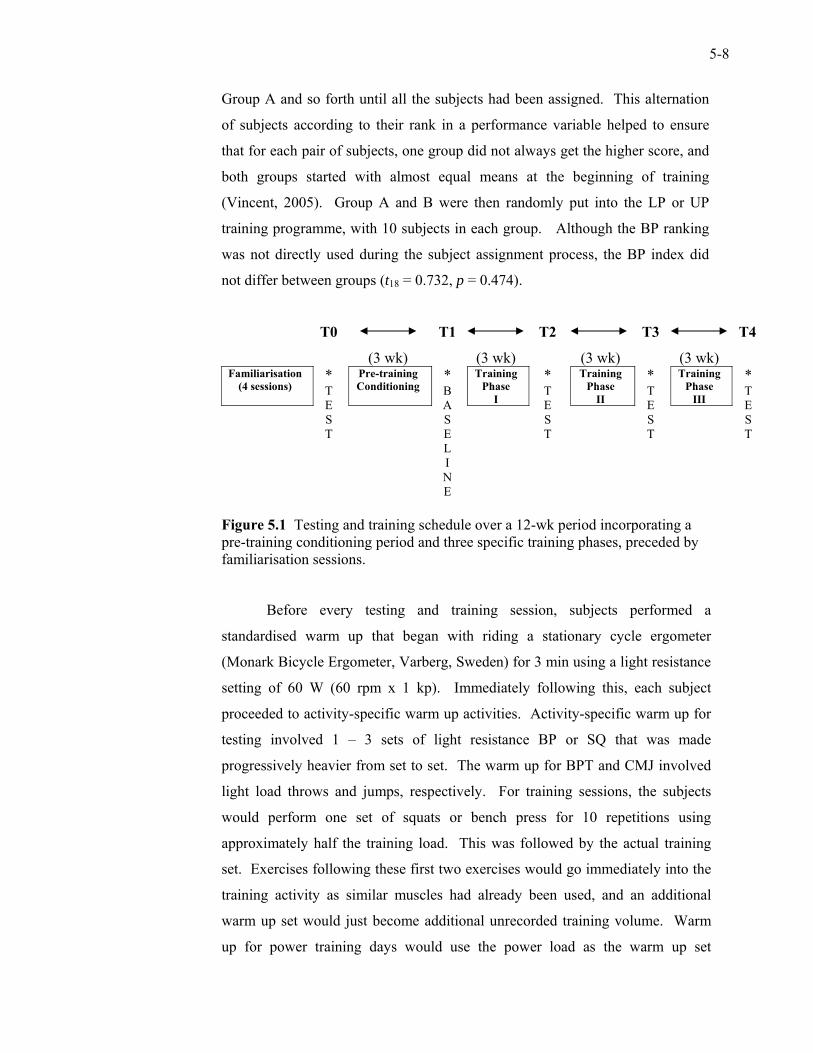
5-8
Group A and so forth until all the subjects had been assigned. This alternation
of subjects according to their rank in a performance variable helped to ensure
that for each pair of subjects, one group did not always get the higher score, and
both groups started with almost equal means at the beginning of training
(Vincent, 2005). Group A and B were then randomly put into the LP or UP
training programme, with 10 subjects in each group. Although the BP ranking
was not directly used during the subject assignment process, the BP index did
not differ between groups (t18 = 0.732, p = 0.474).
T0 T1 T2 T3 T4
(3 wk) (3 wk) (3 wk) (3 wk) Familiarisation
(4 sessions) Pre-training Conditioning
Training Phase
I
Training Phase
II
Training Phase
III
* T E S T
* B A S E L I N E
* T E S T
* T E S T
* T E S T
Figure 5.1 Testing and training schedule over a 12-wk period incorporating a pre-training conditioning period and three specific training phases, preceded by familiarisation sessions.
Before every testing and training session, subjects performed a
standardised warm up that began with riding a stationary cycle ergometer
(Monark Bicycle Ergometer, Varberg, Sweden) for 3 min using a light resistance
setting of 60 W (60 rpm x 1 kp). Immediately following this, each subject
proceeded to activity-specific warm up activities. Activity-specific warm up for
testing involved 1 – 3 sets of light resistance BP or SQ that was made
progressively heavier from set to set. The warm up for BPT and CMJ involved
light load throws and jumps, respectively. For training sessions, the subjects
would perform one set of squats or bench press for 10 repetitions using
approximately half the training load. This was followed by the actual training
set. Exercises following these first two exercises would go immediately into the
training activity as similar muscles had already been used, and an additional
warm up set would just become additional unrecorded training volume. Warm
up for power training days would use the power load as the warm up set
5-9
performed in a slow and controlled manner for 10 repetitions. Static stretching
was not utilised as part of the warm up routine based on increasing evidence
suggesting that performing static stretches can have a negative impact on
strength and power performance (Kokkonen, Nelson & Cornwell, 1998; Young
& Behm, 2003). At the end of every session, each subject cooled down by
performing a 5-min ride on the same cycle ergometer. A standard full body
stretching routine was also performed. Each stretching position was held for
10 s, and two repetitions were performed for each exercise. All instructions and
pictures of the exercises were mounted on a board to help standardise the routine
(Chapter 3, Section 3.5).
Changes throughout training were assessed using several tests. Subjects
performed the tests in the following order – body mass, girth measurements,
ultrasound imaging, 1 RM dynamic SQ, CMJ, 1 RM dynamic BP, BPT, 5 x 6-s
cycle test. This order of testing was chosen to minimise fatigue between tests.
Each subject was also allotted a minimum of 15 min for recovery between tests
involving physical activity. Full details for each test have been presented in
Chapter 3, Section 3.7. Tests for muscular strength and power were performed
using a modified Plyometric Power System (PPS - Plyopower Technologies,
Lismore, Australia), as described in Chapter 3, Section 3.3.1.
5.3.3 Training Procedures
The LP and UP groups were formed after pre-training conditioning at T1.
The periodised programmes were then run for nine weeks. Both groups trained
three times per week on a Monday-Wednesday-Friday schedule. Each training
session took no more than 1 h, inclusive of warm up and cool down. All
sessions were supervised by the researcher, and the same instructions were given
to each subject. The LP group had 3-wk phases that emphasised hypertrophy
(Phase I), maximal strength (Phase II) and power (Phase III) respectively.
Meanwhile, the UP group emphasised a different strength quality on each
training day – hypertrophy on Monday, maximal strength on Wednesday, and
power on Friday. All subjects limited their training activities to only the
designated sessions of the study. Full training compliance (100 %) was observed
by 18 of the remaining subjects (total of 36 training sessions). Two other
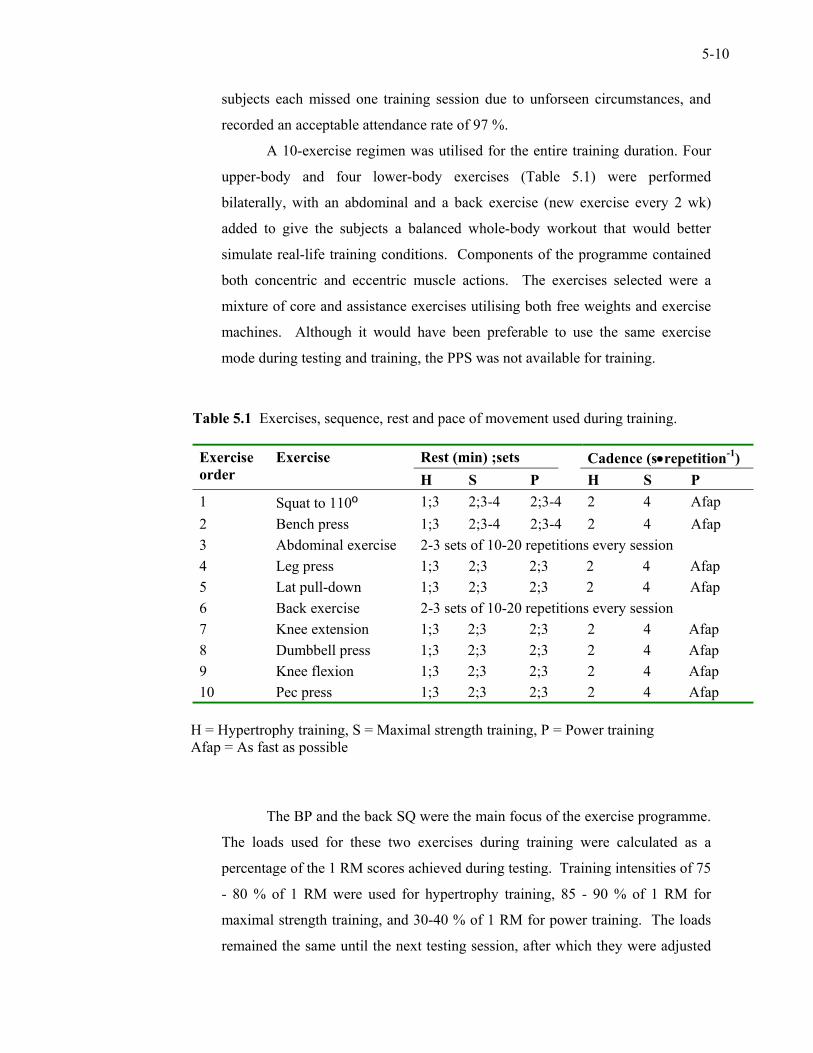
5-10
subjects each missed one training session due to unforseen circumstances, and
recorded an acceptable attendance rate of 97 %.
A 10-exercise regimen was utilised for the entire training duration. Four
upper-body and four lower-body exercises (Table 5.1) were performed
bilaterally, with an abdominal and a back exercise (new exercise every 2 wk)
added to give the subjects a balanced whole-body workout that would better
simulate real-life training conditions. Components of the programme contained
both concentric and eccentric muscle actions. The exercises selected were a
mixture of core and assistance exercises utilising both free weights and exercise
machines. Although it would have been preferable to use the same exercise
mode during testing and training, the PPS was not available for training.
Table 5.1 Exercises, sequence, rest and pace of movement used during training.
Rest (min) ;sets Cadence (s•repetition-1) Exercise order
Exercise H S P H S P
1 Squat to 110º 1;3 2;3-4 2;3-4 2 4 Afap 2 Bench press 1;3 2;3-4 2;3-4 2 4 Afap 3 Abdominal exercise 2-3 sets of 10-20 repetitions every session 4 Leg press 1;3 2;3 2;3 2 4 Afap 5 Lat pull-down 1;3 2;3 2;3 2 4 Afap 6 Back exercise 2-3 sets of 10-20 repetitions every session 7 Knee extension 1;3 2;3 2;3 2 4 Afap 8 Dumbbell press 1;3 2;3 2;3 2 4 Afap 9 Knee flexion 1;3 2;3 2;3 2 4 Afap 10 Pec press 1;3 2;3 2;3 2 4 Afap
H = Hypertrophy training, S = Maximal strength training, P = Power training Afap = As fast as possible
The BP and the back SQ were the main focus of the exercise programme.
The loads used for these two exercises during training were calculated as a
percentage of the 1 RM scores achieved during testing. Training intensities of 75
- 80 % of 1 RM were used for hypertrophy training, 85 - 90 % of 1 RM for
maximal strength training, and 30-40 % of 1 RM for power training. The loads
remained the same until the next testing session, after which they were adjusted
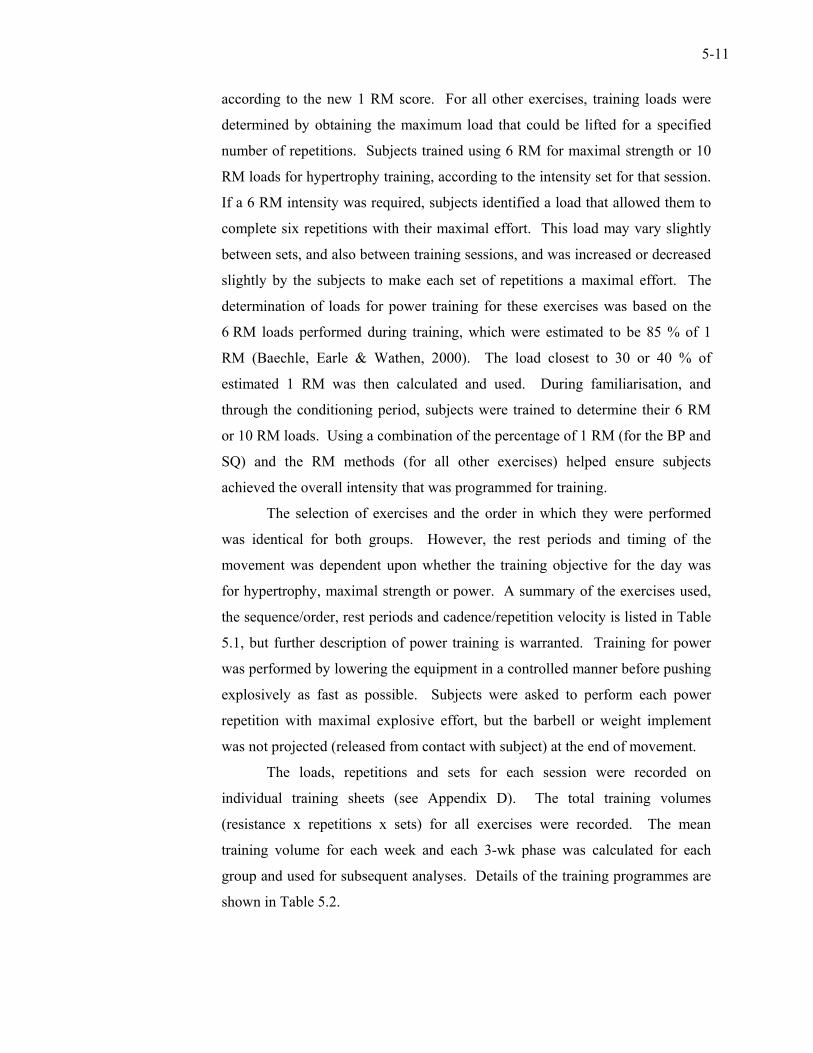
5-11
according to the new 1 RM score. For all other exercises, training loads were
determined by obtaining the maximum load that could be lifted for a specified
number of repetitions. Subjects trained using 6 RM for maximal strength or 10
RM loads for hypertrophy training, according to the intensity set for that session.
If a 6 RM intensity was required, subjects identified a load that allowed them to
complete six repetitions with their maximal effort. This load may vary slightly
between sets, and also between training sessions, and was increased or decreased
slightly by the subjects to make each set of repetitions a maximal effort. The
determination of loads for power training for these exercises was based on the
6 RM loads performed during training, which were estimated to be 85 % of 1
RM (Baechle, Earle & Wathen, 2000). The load closest to 30 or 40 % of
estimated 1 RM was then calculated and used. During familiarisation, and
through the conditioning period, subjects were trained to determine their 6 RM
or 10 RM loads. Using a combination of the percentage of 1 RM (for the BP and
SQ) and the RM methods (for all other exercises) helped ensure subjects
achieved the overall intensity that was programmed for training.
The selection of exercises and the order in which they were performed
was identical for both groups. However, the rest periods and timing of the
movement was dependent upon whether the training objective for the day was
for hypertrophy, maximal strength or power. A summary of the exercises used,
the sequence/order, rest periods and cadence/repetition velocity is listed in Table
5.1, but further description of power training is warranted. Training for power
was performed by lowering the equipment in a controlled manner before pushing
explosively as fast as possible. Subjects were asked to perform each power
repetition with maximal explosive effort, but the barbell or weight implement
was not projected (released from contact with subject) at the end of movement.
The loads, repetitions and sets for each session were recorded on
individual training sheets (see Appendix D). The total training volumes
(resistance x repetitions x sets) for all exercises were recorded. The mean
training volume for each week and each 3-wk phase was calculated for each
group and used for subsequent analyses. Details of the training programmes are
shown in Table 5.2.
Table 5.2 Alternation of volume and intensity for Linear Periodisation (LP) and Undulating Periodisation (UP) programmes. Pre-training Conditioning: Wk 1-3
T1: Division of subjects into groups
Training Phase I: Wk 4-6
Training Phase II: Wk 7-9
Training Phase III: Wk 10-
12 Wk 1 (H) Wk 2 (H) Wk 3 (H) Wk 1 (S) Wk 2 (S) Wk 3 (S) Wk 1 (P) Wk 2 (P) Wk 3 (P)
1075 3
1077 3
1080 3
685 3
690 3
690 4
830 3
840 3
840 4
All subjects perform the same training
LP
10 RM x 3
10 RM x 3
10 RM x 3
6 RM x 3
6 RM x 3
6 RM x 3 830 3
840 3
840 3
Wk 1 Wk 2 Wk 3 Day 1 (H) Day 2 (S) Day 3 (P) Day 1 (H) Day 2 (S) Day 3 (P) Day 1 (H) Day 2 (S) Day 3 (P)
1070 2
1070 3
1270 3
1075 3
685 3
830 3
1077 3
690 3
840 3
1080 3
690 4
840 4
15 RM x 2
12 RM x 3
10 RM x 3
UP
10 RM x 3
6 RM x 3 8
30 3 10 RM x 3
6 RM x 3 8
40 3
10 RM x 3
6 RM x 3 840 3
1070 2 denotes
srepetitionRMof 1% number of sets for the bench press and squat exercises, and all power exercises
(H) = Hypertrophy training; (S) = Maximal strength training; (P) = Power training (15 RM x 2) denotes the number of maximum repetitions to be performed for the required number of sets for all other exercises (except abdominal and back exercises).
5-12
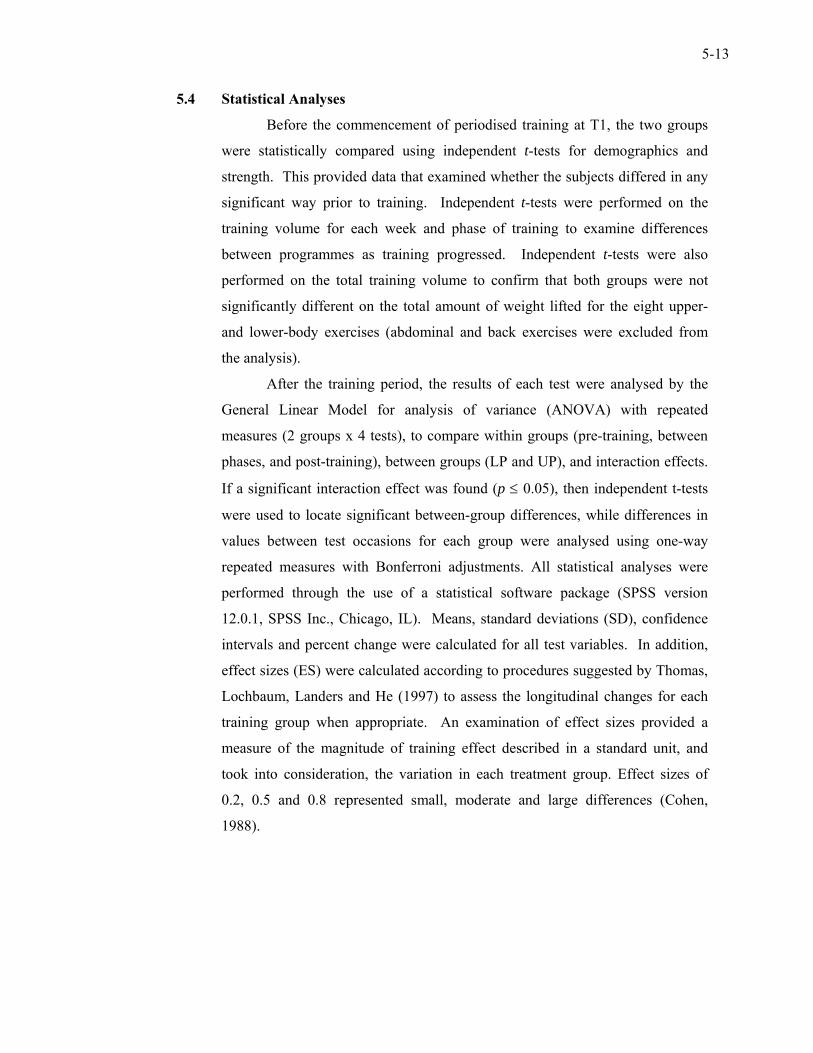
5-13
5.4 Statistical Analyses
Before the commencement of periodised training at T1, the two groups
were statistically compared using independent t-tests for demographics and
strength. This provided data that examined whether the subjects differed in any
significant way prior to training. Independent t-tests were performed on the
training volume for each week and phase of training to examine differences
between programmes as training progressed. Independent t-tests were also
performed on the total training volume to confirm that both groups were not
significantly different on the total amount of weight lifted for the eight upper-
and lower-body exercises (abdominal and back exercises were excluded from
the analysis).
After the training period, the results of each test were analysed by the
General Linear Model for analysis of variance (ANOVA) with repeated
measures (2 groups x 4 tests), to compare within groups (pre-training, between
phases, and post-training), between groups (LP and UP), and interaction effects.
If a significant interaction effect was found (p ≤ 0.05), then independent t-tests
were used to locate significant between-group differences, while differences in
values between test occasions for each group were analysed using one-way
repeated measures with Bonferroni adjustments. All statistical analyses were
performed through the use of a statistical software package (SPSS version
12.0.1, SPSS Inc., Chicago, IL). Means, standard deviations (SD), confidence
intervals and percent change were calculated for all test variables. In addition,
effect sizes (ES) were calculated according to procedures suggested by Thomas,
Lochbaum, Landers and He (1997) to assess the longitudinal changes for each
training group when appropriate. An examination of effect sizes provided a
measure of the magnitude of training effect described in a standard unit, and
took into consideration, the variation in each treatment group. Effect sizes of
0.2, 0.5 and 0.8 represented small, moderate and large differences (Cohen,
1988).
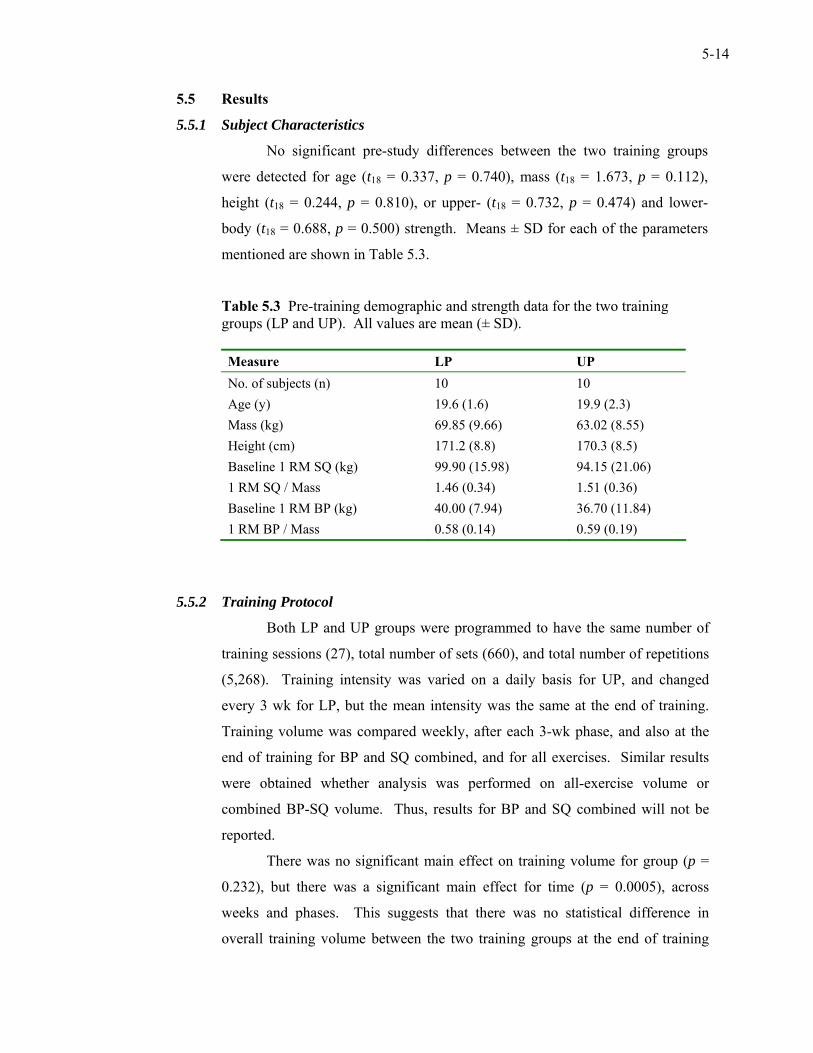
5-14
5.5 Results
5.5.1 Subject Characteristics
No significant pre-study differences between the two training groups
were detected for age (t18 = 0.337, p = 0.740), mass (t18 = 1.673, p = 0.112),
height (t18 = 0.244, p = 0.810), or upper- (t18 = 0.732, p = 0.474) and lower-
body (t18 = 0.688, p = 0.500) strength. Means ± SD for each of the parameters
mentioned are shown in Table 5.3.
Table 5.3 Pre-training demographic and strength data for the two training groups (LP and UP). All values are mean (± SD).
Measure LP UP No. of subjects (n) 10 10 Age (y) 19.6 (1.6) 19.9 (2.3) Mass (kg) 69.85 (9.66) 63.02 (8.55) Height (cm) 171.2 (8.8) 170.3 (8.5) Baseline 1 RM SQ (kg) 99.90 (15.98) 94.15 (21.06) 1 RM SQ / Mass 1.46 (0.34) 1.51 (0.36) Baseline 1 RM BP (kg) 40.00 (7.94) 36.70 (11.84) 1 RM BP / Mass 0.58 (0.14) 0.59 (0.19)
5.5.2 Training Protocol
Both LP and UP groups were programmed to have the same number of
training sessions (27), total number of sets (660), and total number of repetitions
(5,268). Training intensity was varied on a daily basis for UP, and changed
every 3 wk for LP, but the mean intensity was the same at the end of training.
Training volume was compared weekly, after each 3-wk phase, and also at the
end of training for BP and SQ combined, and for all exercises. Similar results
were obtained whether analysis was performed on all-exercise volume or
combined BP-SQ volume. Thus, results for BP and SQ combined will not be
reported.
There was no significant main effect on training volume for group (p =
0.232), but there was a significant main effect for time (p = 0.0005), across
weeks and phases. This suggests that there was no statistical difference in
overall training volume between the two training groups at the end of training
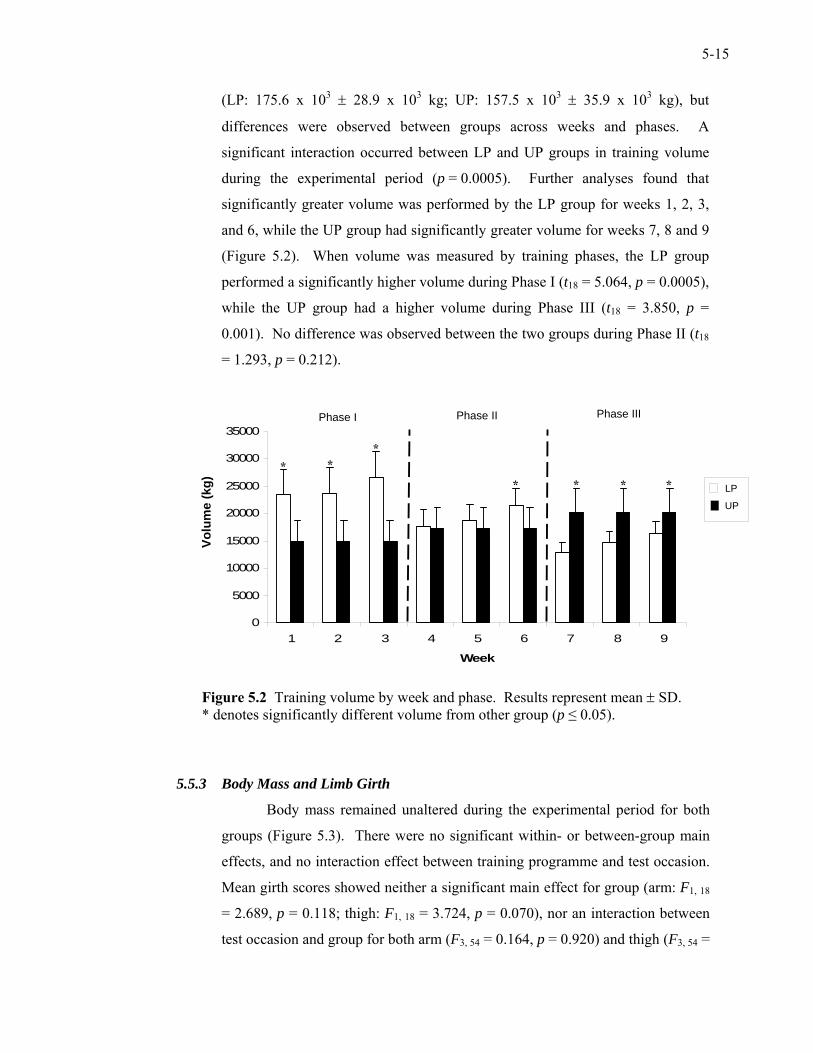
5-15
(LP: 175.6 x 10³ ± 28.9 x 10³ kg; UP: 157.5 x 10³ ± 35.9 x 10³ kg), but
differences were observed between groups across weeks and phases. A
significant interaction occurred between LP and UP groups in training volume
during the experimental period (p = 0.0005). Further analyses found that
significantly greater volume was performed by the LP group for weeks 1, 2, 3,
and 6, while the UP group had significantly greater volume for weeks 7, 8 and 9
(Figure 5.2). When volume was measured by training phases, the LP group
performed a significantly higher volume during Phase I (t18 = 5.064, p = 0.0005),
while the UP group had a higher volume during Phase III (t18 = 3.850, p =
0.001). No difference was observed between the two groups during Phase II (t18
= 1.293, p = 0.212).
Figure 5.2 Training volume by week and phase. Results represent mean ± SD. * denotes significantly different volume from other group (p ≤ 0.05).
5.5.3 Body Mass and Limb Girth
Body mass remained unaltered during the experimental period for both
groups (Figure 5.3). There were no significant within- or between-group main
effects, and no interaction effect between training programme and test occasion.
Mean girth scores showed neither a significant main effect for group (arm: F1, 18
= 2.689, p = 0.118; thigh: F1, 18 = 3.724, p = 0.070), nor an interaction between
test occasion and group for both arm (F3, 54 = 0.164, p = 0.920) and thigh (F3, 54 =
0
5000
10000
15000
20000
25000
30000
35000
1 2 3 4 5 6 7 8 9
Week
Volu
me
(kg)
* **
* * * *
Phase I Phase II Phase III
LP
UP
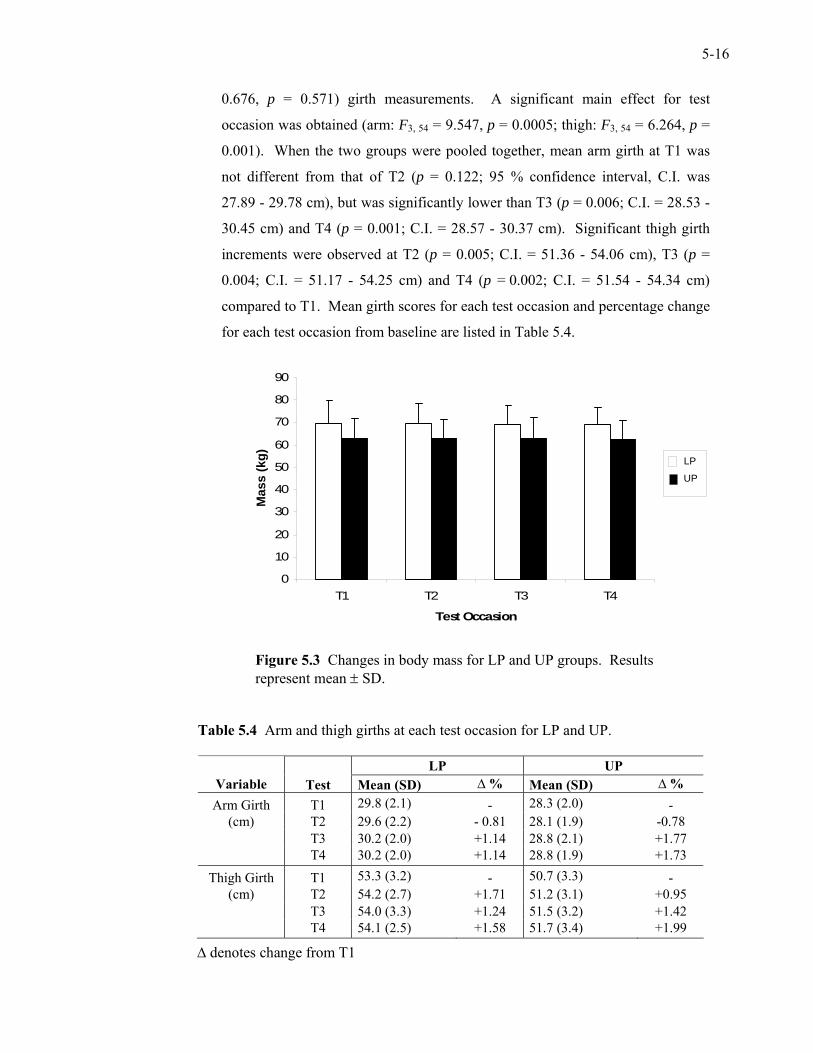
5-16
0.676, p = 0.571) girth measurements. A significant main effect for test
occasion was obtained (arm: F3, 54 = 9.547, p = 0.0005; thigh: F3, 54 = 6.264, p =
0.001). When the two groups were pooled together, mean arm girth at T1 was
not different from that of T2 (p = 0.122; 95 % confidence interval, C.I. was
27.89 - 29.78 cm), but was significantly lower than T3 (p = 0.006; C.I. = 28.53 -
30.45 cm) and T4 (p = 0.001; C.I. = 28.57 - 30.37 cm). Significant thigh girth
increments were observed at T2 (p = 0.005; C.I. = 51.36 - 54.06 cm), T3 (p =
0.004; C.I. = 51.17 - 54.25 cm) and T4 (p = 0.002; C.I. = 51.54 - 54.34 cm)
compared to T1. Mean girth scores for each test occasion and percentage change
for each test occasion from baseline are listed in Table 5.4.
Figure 5.3 Changes in body mass for LP and UP groups. Results represent mean ± SD.
Table 5.4 Arm and thigh girths at each test occasion for LP and UP.
LP UP Variable Test Mean (SD) ∆ % Mean (SD) ∆ % Arm Girth T1 29.8 (2.1) - 28.3 (2.0) -
(cm) T2 29.6 (2.2) - 0.81 28.1 (1.9) -0.78 T3 30.2 (2.0) +1.14 28.8 (2.1) +1.77 T4 30.2 (2.0) +1.14 28.8 (1.9) +1.73
Thigh Girth T1 53.3 (3.2) - 50.7 (3.3) - (cm) T2 54.2 (2.7) +1.71 51.2 (3.1) +0.95
T3 54.0 (3.3) +1.24 51.5 (3.2) +1.42 T4 54.1 (2.5) +1.58 51.7 (3.4) +1.99
∆ denotes change from T1
0
10
20
30
40
50
60
70
80
90
T1 T2 T3 T4
Test Occasion
Mas
s (k
g)
LP
UP
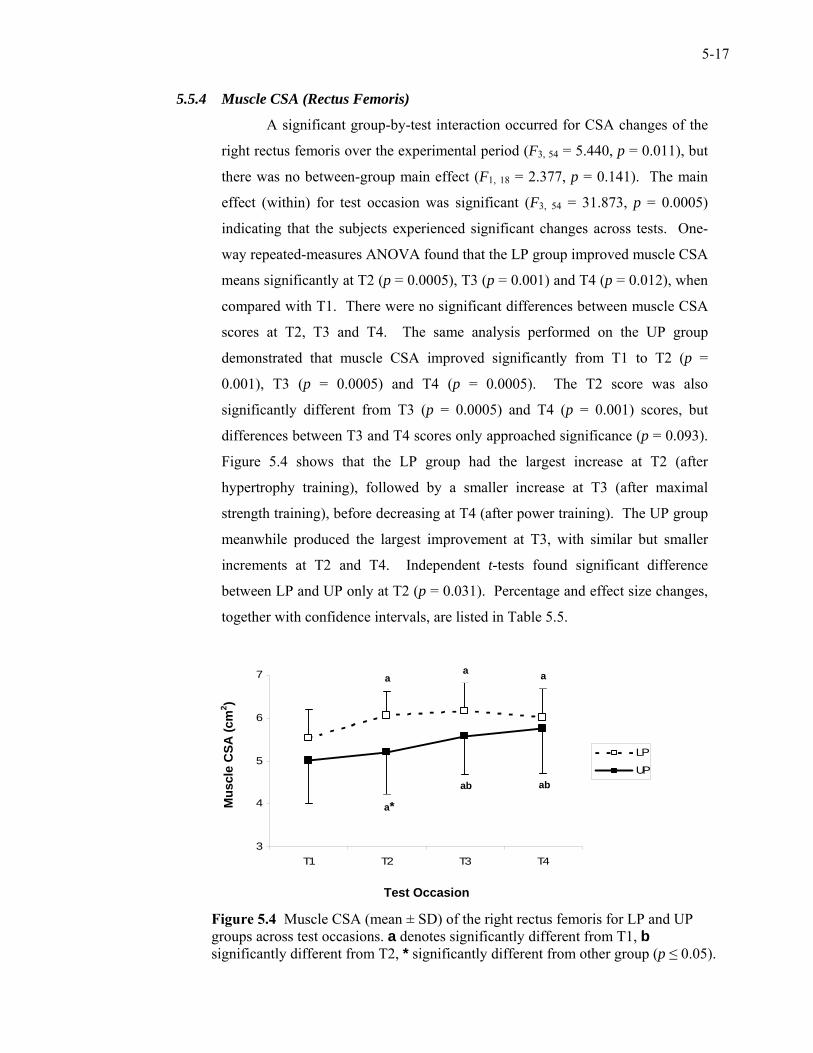
5-17
5.5.4 Muscle CSA (Rectus Femoris)
A significant group-by-test interaction occurred for CSA changes of the
right rectus femoris over the experimental period (F3, 54 = 5.440, p = 0.011), but
there was no between-group main effect (F1, 18 = 2.377, p = 0.141). The main
effect (within) for test occasion was significant (F3, 54 = 31.873, p = 0.0005)
indicating that the subjects experienced significant changes across tests. One-
way repeated-measures ANOVA found that the LP group improved muscle CSA
means significantly at T2 (p = 0.0005), T3 (p = 0.001) and T4 (p = 0.012), when
compared with T1. There were no significant differences between muscle CSA
scores at T2, T3 and T4. The same analysis performed on the UP group
demonstrated that muscle CSA improved significantly from T1 to T2 (p =
0.001), T3 (p = 0.0005) and T4 (p = 0.0005). The T2 score was also
significantly different from T3 (p = 0.0005) and T4 (p = 0.001) scores, but
differences between T3 and T4 scores only approached significance (p = 0.093).
Figure 5.4 shows that the LP group had the largest increase at T2 (after
hypertrophy training), followed by a smaller increase at T3 (after maximal
strength training), before decreasing at T4 (after power training). The UP group
meanwhile produced the largest improvement at T3, with similar but smaller
increments at T2 and T4. Independent t-tests found significant difference
between LP and UP only at T2 (p = 0.031). Percentage and effect size changes,
together with confidence intervals, are listed in Table 5.5.
Figure 5.4 Muscle CSA (mean ± SD) of the right rectus femoris for LP and UP groups across test occasions. a denotes significantly different from T1, b significantly different from T2, * significantly different from other group (p ≤ 0.05).
Test Occasion
3
4
5
6
7
T1 T2 T3 T4
LP
UP
Mus
cle
CSA
(cm
2 )
a a a
a*
ab ab
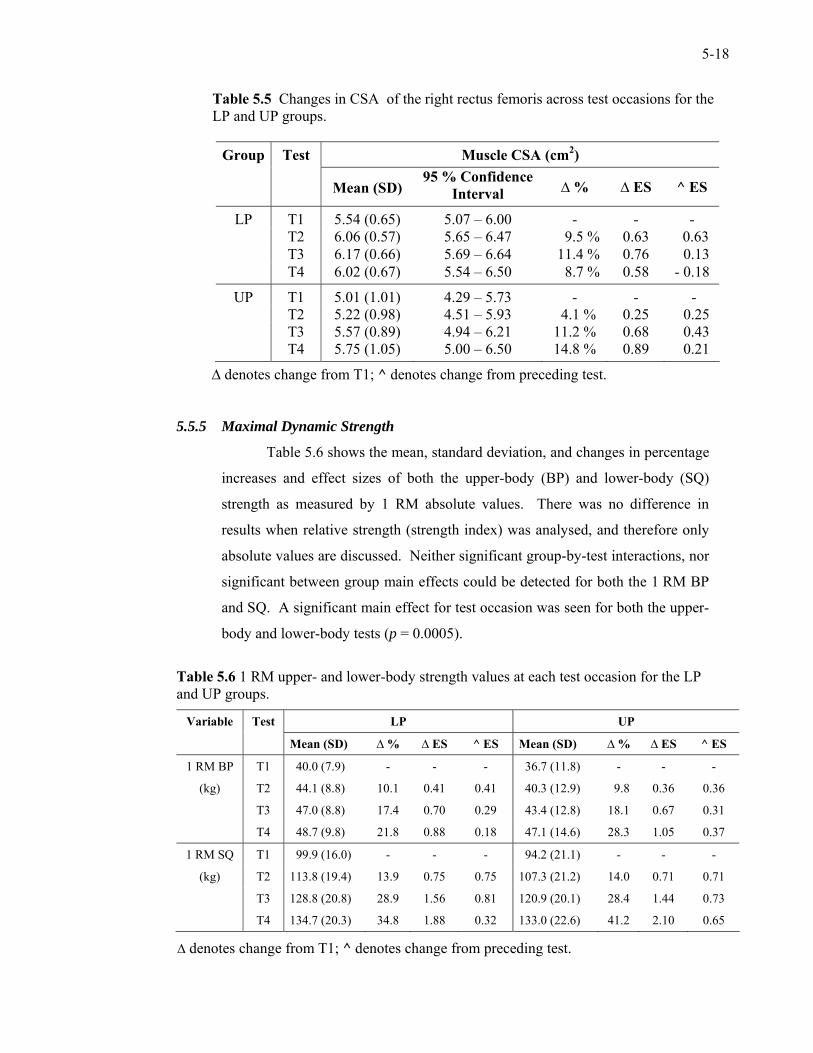
5-18
Table 5.5 Changes in CSA of the right rectus femoris across test occasions for the LP and UP groups.
Group Test Muscle CSA (cm2)
Mean (SD) 95 % Confidence
Interval ∆ % ∆ ES ^ ES
LP T1 5.54 (0.65) 5.07 – 6.00 - - - T2 6.06 (0.57) 5.65 – 6.47 009.5 % 0.63 00.63 T3 6.17 (0.66) 5.69 – 6.64 011.4 % 0.76 - 0.13 T4 6.02 (0.67) 5.54 – 6.50 008.7 % 0.58 - 0.18
UP T1 5.01 (1.01) 4.29 – 5.73 - - - T2 5.22 (0.98) 4.51 – 5.93 04.1 % 0.25 - 0.25 T3 5.57 (0.89) 4.94 – 6.21 11.2 % 0.68 - 0.43 T4 5.75 (1.05) 5.00 – 6.50 14.8 % 0.89 - 0.21
∆ denotes change from T1; ^ denotes change from preceding test.
5.5.5 Maximal Dynamic Strength
Table 5.6 shows the mean, standard deviation, and changes in percentage
increases and effect sizes of both the upper-body (BP) and lower-body (SQ)
strength as measured by 1 RM absolute values. There was no difference in
results when relative strength (strength index) was analysed, and therefore only
absolute values are discussed. Neither significant group-by-test interactions, nor
significant between group main effects could be detected for both the 1 RM BP
and SQ. A significant main effect for test occasion was seen for both the upper-
body and lower-body tests (p = 0.0005).
Table 5.6 1 RM upper- and lower-body strength values at each test occasion for the LP and UP groups.
Variable Test LP UP
Mean (SD) ∆ % ∆ ES ^ ES Mean (SD) ∆ % ∆ ES ^ ES
1 RM BP T1 040.0 (7.9) - - - 036.7 (11.8) - - -
(kg) T2 044.1 (8.8) 10.1 0.41 0.41 040.3 (12.9) 09.8 0.36 0.36
T3 047.0 (8.8) 17.4 0.70 0.29 043.4 (12.8) 18.1 0.67 0.31
T4 048.7 (9.8) 21.8 0.88 0.18 047.1 (14.6) 28.3 1.05 0.37
1 RM SQ T1 099.9 (16.0) - - - 094.2 (21.1) - - -
(kg) T2 113.8 (19.4) 13.9 0.75 0.75 107.3 (21.2) 14.0 0.71 0.71
T3 128.8 (20.8) 28.9 1.56 0.81 120.9 (20.1) 28.4 1.44 0.73
T4 134.7 (20.3) 34.8 1.88 0.32 133.0 (22.6) 41.2 2.10 0.65
∆ denotes change from T1; ^ denotes change from preceding test.
5-19
When the groups were collapsed for the 1 RM BP, mean 1 RM scores at
T2 (mean = 42.2 kg, C.I. = 37.0 - 43.1 kg), T3 (mean = 45.2 kg, C.I. = 40.0 -
50.3 kg) and T4 (mean = 47.9 kg, C.I. = 42.0 - 53.7 kg) were significantly
greater than the means at T1 (mean = 38.4 kg, C.I. = 33.6 - 43.1 kg), with all p
values equivalent to 0.0005. Similarly, when the groups were collapsed for the
1 RM SQ, 1 RM scores at T2 (mean = 110.5 kg, C.I. = 101.0 - 120.1 kg), T3
(mean = 124.8 kg, C.I. = 115.2 – 134.4 kg) and T4 (mean = 133.8 kg, C.I. =
123.7 - 143.1 kg) were significantly greater than the means at T1 (mean =
97.0 kg, C.I. = 88.2 - 105.8 kg), with all p values equivalent to 0.0005. Group 1
RM scores were also significantly higher at each subsequent test occasion (p =
0.0005) between all test occasions (Figure 5.5).
Figure 5.5 Changes in 1 RM bench press (BP) and squat (SQ) means between test occasions for LP and UP groups, and for pooled data from both groups. Error bars denote ± SD. a denotes significantly greater than T1 mean, b significantly greater than T2 mean, and c significantly higher than T3 mean (p ≤ 0.05).
0
10
20
30
40
50
60
70
BP-LP BP-UP BP-Both
T1 T2 T3 T4
0
20
40
60
80
100
120
140
160
180
SQ-LP SQ-UP SQ-Both
abc
abc
ab
ab
a
a
1 R
M B
ench
Pre
ss (k
g)
1 R
M S
quat
(kg)
Variable
5-20
Although no significant interaction effect was observed, it should be
noted that the interaction effect for the 1 RM SQ approached significance (p =
0.089) for the set alpha, and the interaction was significant at the 0.10 level.
Therefore, percentage increases and effect sizes are described for practical
purposes. For both the LP and UP groups, the lower body recorded greater
percentage increases when compared with the upper body (Table 5.5). The UP
group obtained larger percentage gains and larger effect sizes at the end of
training compared with LP for both the BP (28.2 % versus 21.8 %; ES = 1.05
versus 0.88) and the SQ (41.2 % versus 34.8 %; ES = 2.10 versus 1.88). When
comparisons were made between test occasions for each group, the effect sizes
for the LP group were higher at T2 (BP: 0.41; SQ: 0.75) and T3 (BP: 0.29; SQ:
0.81), with the smallest increment achieved at the end of training (BP: 0.18; SQ:
0.32). On the other hand, the UP group recorded similar effect sizes after each
training phase for both the BP (T2: ES = 0.36; T3: ES = 0.31; T3: ES = 0.37)
and the SQ (T2: ES = 0.71; T3: ES = 0.73; T3: ES = 0.65).
5.5.6 BPT and CMJ
(i) Power Output
Average mechanical power output and jump/throw height was examined
during CMJ and BPT. The use of relative loads of 30 % of 1 RM did not
produce results that demonstrated an increase in power performance with LP or
UP training in any clear manner (Table 5.7). Statistical analysis did not find any
significant main or interaction effects. This could be due to the fact that the
relative loads increased each time the 1 RM test was performed, resulting in new
and heavier loads for the subjects at each subsequent test occasion.
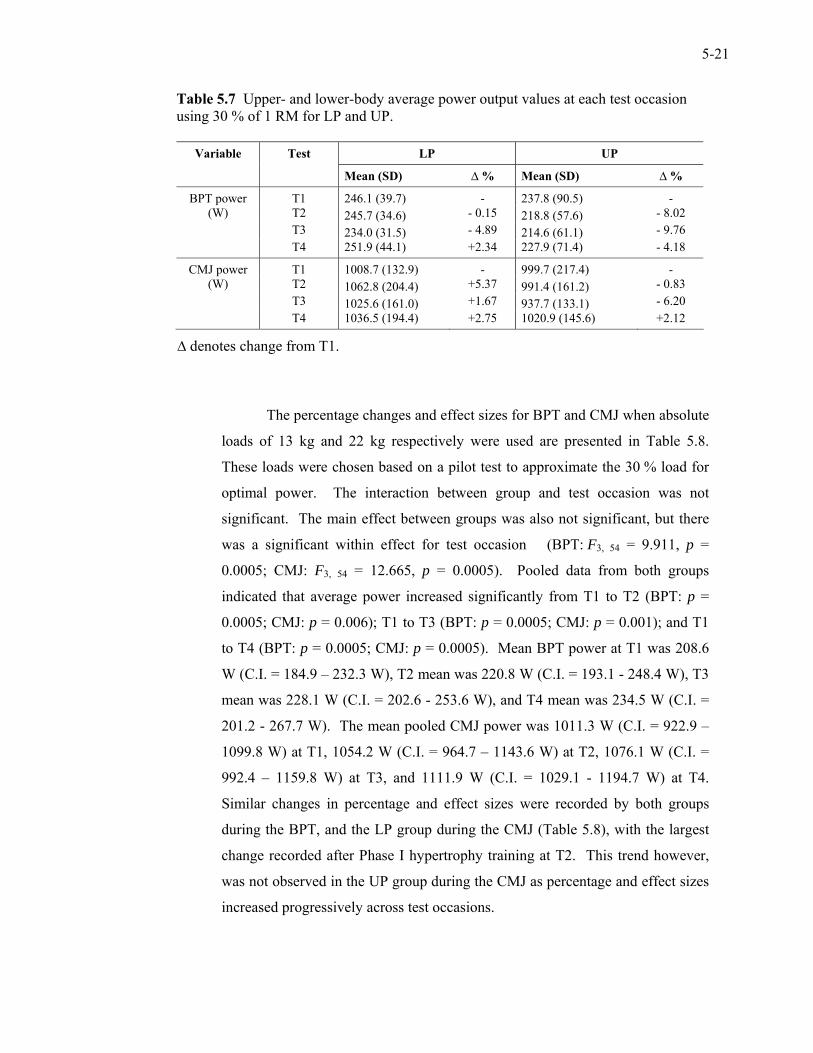
5-21
Table 5.7 Upper- and lower-body average power output values at each test occasion using 30 % of 1 RM for LP and UP.
Variable Test LP UP
Mean (SD) ∆ % Mean (SD) ∆ %
BPT power T1 246.1 (39.7) - 237.8 (90.5) - (W) T2 245.7 (34.6) - 0.15 218.8 (57.6) - 8.02
T3 234.0 (31.5) - 4.89 214.6 (61.1) - 9.76 T4 251.9 (44.1) +2.34 227.9 (71.4) - 4.18
CMJ power T1 1008.7 (132.9) - 999.7 (217.4) - (W) T2 1062.8 (204.4) +5.37 991.4 (161.2) - 0.83
T3 1025.6 (161.0) +1.67 937.7 (133.1) - 6.20 T4 1036.5 (194.4) +2.75 1020.9 (145.6) +2.12
∆ denotes change from T1. The percentage changes and effect sizes for BPT and CMJ when absolute
loads of 13 kg and 22 kg respectively were used are presented in Table 5.8.
These loads were chosen based on a pilot test to approximate the 30 % load for
optimal power. The interaction between group and test occasion was not
significant. The main effect between groups was also not significant, but there
was a significant within effect for test occasion (BPT: F3, 54 = 9.911, p =
0.0005; CMJ: F3, 54 = 12.665, p = 0.0005). Pooled data from both groups
indicated that average power increased significantly from T1 to T2 (BPT: p =
0.0005; CMJ: p = 0.006); T1 to T3 (BPT: p = 0.0005; CMJ: p = 0.001); and T1
to T4 (BPT: p = 0.0005; CMJ: p = 0.0005). Mean BPT power at T1 was 208.6
W (C.I. = 184.9 – 232.3 W), T2 mean was 220.8 W (C.I. = 193.1 - 248.4 W), T3
mean was 228.1 W (C.I. = 202.6 - 253.6 W), and T4 mean was 234.5 W (C.I. =
201.2 - 267.7 W). The mean pooled CMJ power was 1011.3 W (C.I. = 922.9 –
1099.8 W) at T1, 1054.2 W (C.I. = 964.7 – 1143.6 W) at T2, 1076.1 W (C.I. =
992.4 – 1159.8 W) at T3, and 1111.9 W (C.I. = 1029.1 - 1194.7 W) at T4.
Similar changes in percentage and effect sizes were recorded by both groups
during the BPT, and the LP group during the CMJ (Table 5.8), with the largest
change recorded after Phase I hypertrophy training at T2. This trend however,
was not observed in the UP group during the CMJ as percentage and effect sizes
increased progressively across test occasions.
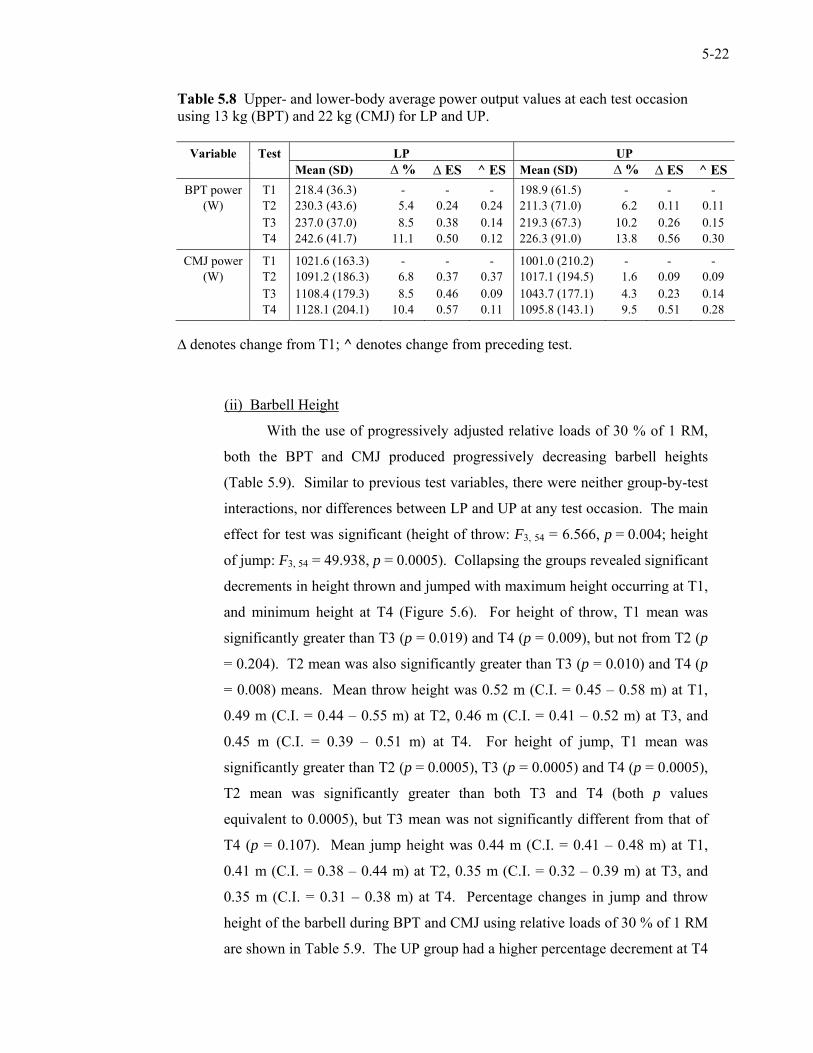
5-22
Table 5.8 Upper- and lower-body average power output values at each test occasion using 13 kg (BPT) and 22 kg (CMJ) for LP and UP.
Variable Test LP UP Mean (SD) ∆ % ∆ ES ^ ES Mean (SD) ∆ % ∆ ES ^ ES
BPT power T1 218.4 (36.3) - - - 198.9 (61.5) - - - (W) T2 230.3 (43.6) 15.4 0.24 0.24 211.3 (71.0) 16.2 0.11 0.11
T3 237.0 (37.0) 18.5 0.38 0.14 219.3 (67.3) 10.2 0.26 0.15 T4 242.6 (41.7) 11.1 0.50 0.12 226.3 (91.0) 13.8 0.56 0.30
CMJ power T1 1021.6 (163.3) - - - 1001.0 (210.2) - - - (W) T2 1091.2 (186.3) 16.8 0.37 0.37 1017.1 (194.5) 11.6 0.09 0.09
T3 1108.4 (179.3) 18.5 0.46 0.09 1043.7 (177.1) 14.3 0.23 0.14 T4 1128.1 (204.1) 10.4 0.57 0.11 1095.8 (143.1) 19.5 0.51 0.28
∆ denotes change from T1; ^ denotes change from preceding test.
(ii) Barbell Height
With the use of progressively adjusted relative loads of 30 % of 1 RM,
both the BPT and CMJ produced progressively decreasing barbell heights
(Table 5.9). Similar to previous test variables, there were neither group-by-test
interactions, nor differences between LP and UP at any test occasion. The main
effect for test was significant (height of throw: F3, 54 = 6.566, p = 0.004; height
of jump: F3, 54 = 49.938, p = 0.0005). Collapsing the groups revealed significant
decrements in height thrown and jumped with maximum height occurring at T1,
and minimum height at T4 (Figure 5.6). For height of throw, T1 mean was
significantly greater than T3 (p = 0.019) and T4 (p = 0.009), but not from T2 (p
= 0.204). T2 mean was also significantly greater than T3 (p = 0.010) and T4 (p
= 0.008) means. Mean throw height was 0.52 m (C.I. = 0.45 – 0.58 m) at T1,
0.49 m (C.I. = 0.44 – 0.55 m) at T2, 0.46 m (C.I. = 0.41 – 0.52 m) at T3, and
0.45 m (C.I. = 0.39 – 0.51 m) at T4. For height of jump, T1 mean was
significantly greater than T2 (p = 0.0005), T3 (p = 0.0005) and T4 (p = 0.0005),
T2 mean was significantly greater than both T3 and T4 (both p values
equivalent to 0.0005), but T3 mean was not significantly different from that of
T4 (p = 0.107). Mean jump height was 0.44 m (C.I. = 0.41 – 0.48 m) at T1,
0.41 m (C.I. = 0.38 – 0.44 m) at T2, 0.35 m (C.I. = 0.32 – 0.39 m) at T3, and
0.35 m (C.I. = 0.31 – 0.38 m) at T4. Percentage changes in jump and throw
height of the barbell during BPT and CMJ using relative loads of 30 % of 1 RM
are shown in Table 5.9. The UP group had a higher percentage decrement at T4
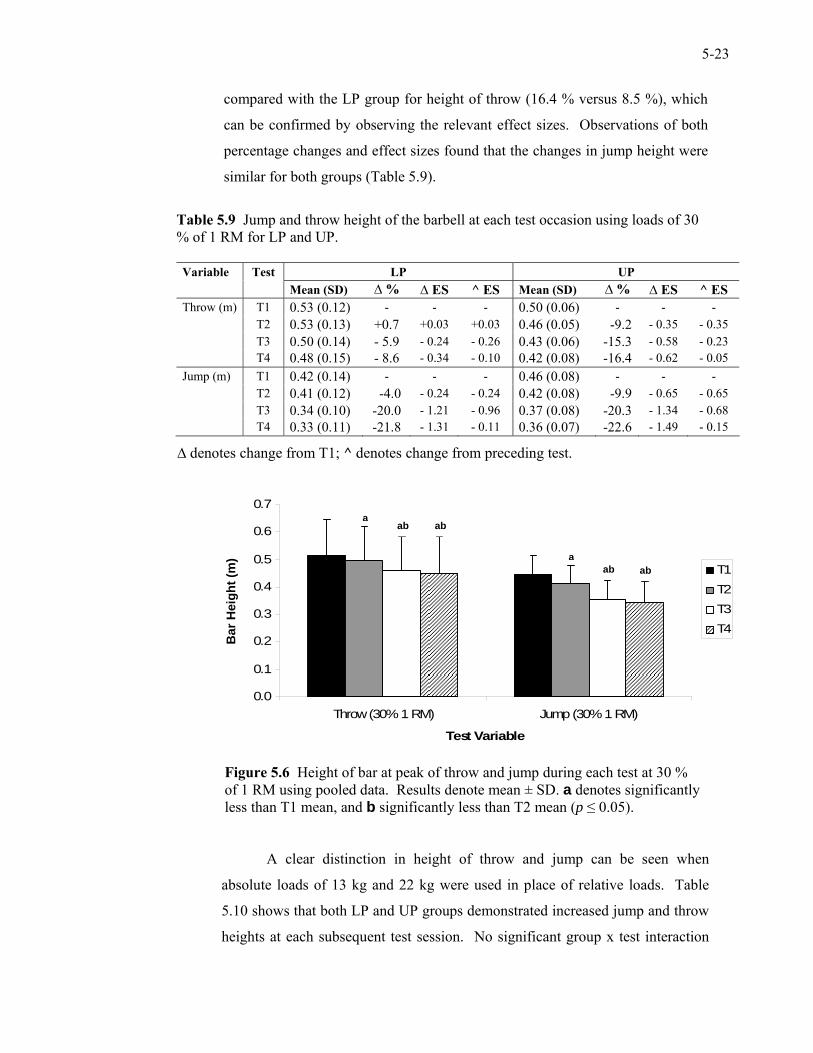
5-23
compared with the LP group for height of throw (16.4 % versus 8.5 %), which
can be confirmed by observing the relevant effect sizes. Observations of both
percentage changes and effect sizes found that the changes in jump height were
similar for both groups (Table 5.9).
Table 5.9 Jump and throw height of the barbell at each test occasion using loads of 30 % of 1 RM for LP and UP. Variable Test LP UP Mean (SD) ∆ % ∆ ES ^ ES Mean (SD) ∆ % ∆ ES ^ ES Throw (m) T1 0.53 (0.12) - - - 0.50 (0.06) - - - T2 0.53 (0.13) +0.7 +0.03 +0.03 0.46 (0.05) 1-9.2 - 0.35 - 0.35 T3 0.50 (0.14) - 5.9 - 0.24 - 0.26 0.43 (0.06) -15.3 - 0.58 - 0.23 T4 0.48 (0.15) - 8.6 - 0.34 - 0.10 0.42 (0.08) -16.4 - 0.62 - 0.05 Jump (m) T1 0.42 (0.14) - - - 0.46 (0.08) - - - T2 0.41 (0.12) 1-4.0 - 0.24 - 0.24 0.42 (0.08) 1-9.9 - 0.65 - 0.65 T3 0.34 (0.10) -20.0 - 1.21 - 0.96 0.37 (0.08) -20.3 - 1.34 - 0.68 T4 0.33 (0.11) -21.8 - 1.31 - 0.11 0.36 (0.07) -22.6 - 1.49 - 0.15
∆ denotes change from T1; ^ denotes change from preceding test.
Figure 5.6 Height of bar at peak of throw and jump during each test at 30 % of 1 RM using pooled data. Results denote mean ± SD. a denotes significantly less than T1 mean, and b significantly less than T2 mean (p ≤ 0.05).
A clear distinction in height of throw and jump can be seen when
absolute loads of 13 kg and 22 kg were used in place of relative loads. Table
5.10 shows that both LP and UP groups demonstrated increased jump and throw
heights at each subsequent test session. No significant group x test interaction
0.0
0.1
0.2
0.3
0.4
0.5
0.6
0.7
Throw (30% 1 RM) Jump (30% 1 RM)
Test Variable
T1T2T3T4
Bar
Hei
ght (
m)
ab ab
ab ab
a
a
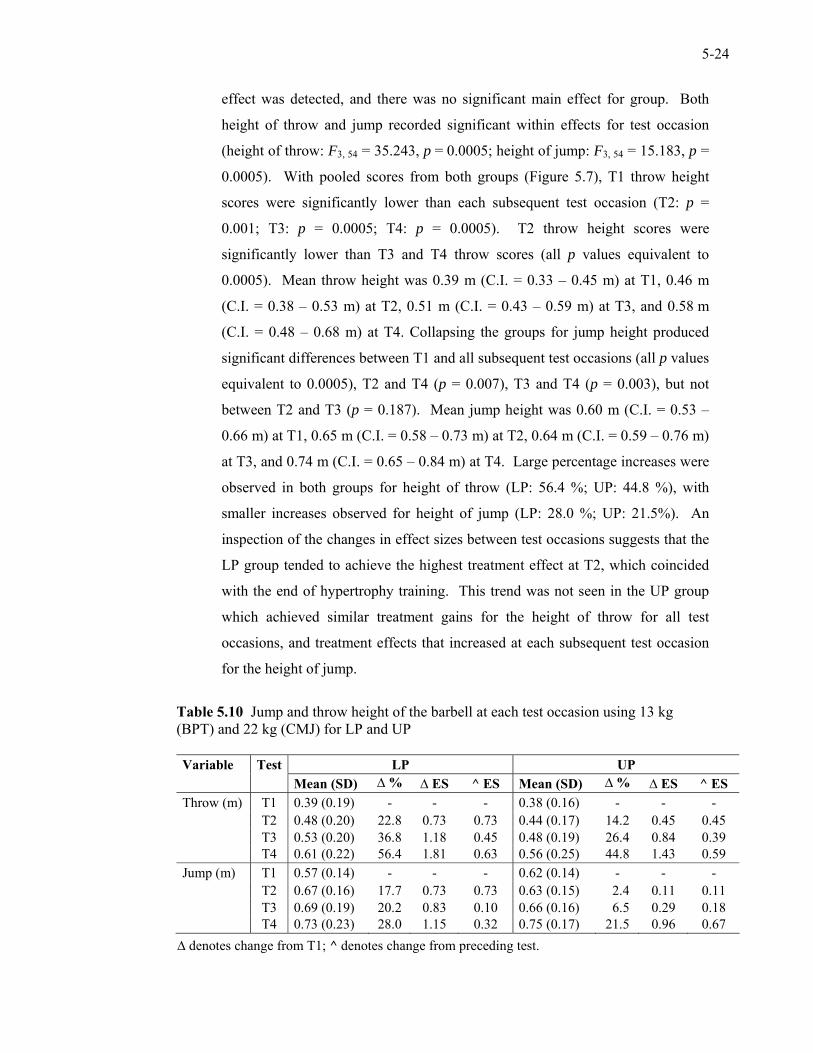
5-24
effect was detected, and there was no significant main effect for group. Both
height of throw and jump recorded significant within effects for test occasion
(height of throw: F3, 54 = 35.243, p = 0.0005; height of jump: F3, 54 = 15.183, p =
0.0005). With pooled scores from both groups (Figure 5.7), T1 throw height
scores were significantly lower than each subsequent test occasion (T2: p =
0.001; T3: p = 0.0005; T4: p = 0.0005). T2 throw height scores were
significantly lower than T3 and T4 throw scores (all p values equivalent to
0.0005). Mean throw height was 0.39 m (C.I. = 0.33 – 0.45 m) at T1, 0.46 m
(C.I. = 0.38 – 0.53 m) at T2, 0.51 m (C.I. = 0.43 – 0.59 m) at T3, and 0.58 m
(C.I. = 0.48 – 0.68 m) at T4. Collapsing the groups for jump height produced
significant differences between T1 and all subsequent test occasions (all p values
equivalent to 0.0005), T2 and T4 (p = 0.007), T3 and T4 (p = 0.003), but not
between T2 and T3 (p = 0.187). Mean jump height was 0.60 m (C.I. = 0.53 –
0.66 m) at T1, 0.65 m (C.I. = 0.58 – 0.73 m) at T2, 0.64 m (C.I. = 0.59 – 0.76 m)
at T3, and 0.74 m (C.I. = 0.65 – 0.84 m) at T4. Large percentage increases were
observed in both groups for height of throw (LP: 56.4 %; UP: 44.8 %), with
smaller increases observed for height of jump (LP: 28.0 %; UP: 21.5%). An
inspection of the changes in effect sizes between test occasions suggests that the
LP group tended to achieve the highest treatment effect at T2, which coincided
with the end of hypertrophy training. This trend was not seen in the UP group
which achieved similar treatment gains for the height of throw for all test
occasions, and treatment effects that increased at each subsequent test occasion
for the height of jump.
Table 5.10 Jump and throw height of the barbell at each test occasion using 13 kg (BPT) and 22 kg (CMJ) for LP and UP Variable Test LP UP Mean (SD) ∆ % ∆ ES ^ ES Mean (SD) ∆ % ∆ ES ^ ES Throw (m) T1 0.39 (0.19) - - - 0.38 (0.16) - - - T2 0.48 (0.20) 22.8 0.73 0.73 0.44 (0.17) 14.2 0.45 0.45 T3 0.53 (0.20) 36.8 1.18 0.45 0.48 (0.19) 26.4 0.84 0.39 T4 0.61 (0.22) 56.4 1.81 0.63 0.56 (0.25) 44.8 1.43 0.59 Jump (m) T1 0.57 (0.14) - - - 0.62 (0.14) - - - T2 0.67 (0.16) 17.7 0.73 0.73 0.63 (0.15) 12.4 0.11 0.11 T3 0.69 (0.19) 20.2 0.83 0.10 0.66 (0.16) 16.5 0.29 0.18 T4 0.73 (0.23) 28.0 1.15 0.32 0.75 (0.17) 21.5 0.96 0.67 ∆ denotes change from T1; ^ denotes change from preceding test.
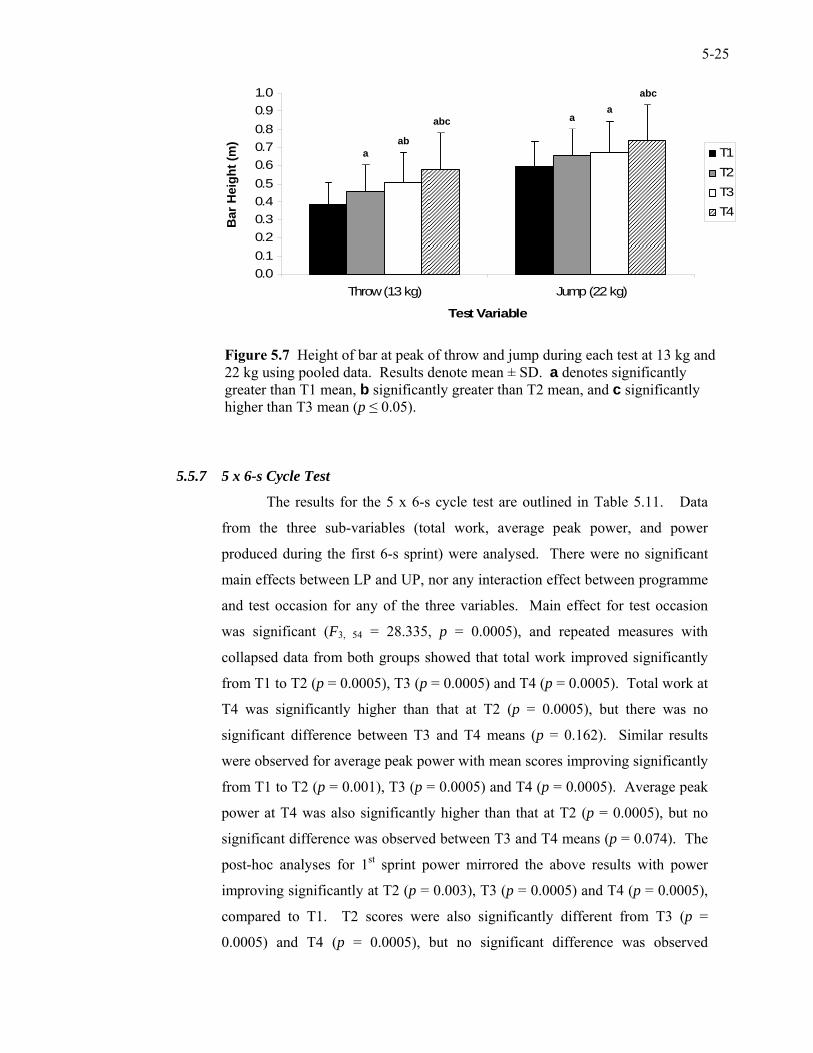
5-25
Figure 5.7 Height of bar at peak of throw and jump during each test at 13 kg and 22 kg using pooled data. Results denote mean ± SD. a denotes significantly greater than T1 mean, b significantly greater than T2 mean, and c significantly higher than T3 mean (p ≤ 0.05).
5.5.7 5 x 6-s Cycle Test
The results for the 5 x 6-s cycle test are outlined in Table 5.11. Data
from the three sub-variables (total work, average peak power, and power
produced during the first 6-s sprint) were analysed. There were no significant
main effects between LP and UP, nor any interaction effect between programme
and test occasion for any of the three variables. Main effect for test occasion
was significant (F3, 54 = 28.335, p = 0.0005), and repeated measures with
collapsed data from both groups showed that total work improved significantly
from T1 to T2 (p = 0.0005), T3 (p = 0.0005) and T4 (p = 0.0005). Total work at
T4 was significantly higher than that at T2 (p = 0.0005), but there was no
significant difference between T3 and T4 means (p = 0.162). Similar results
were observed for average peak power with mean scores improving significantly
from T1 to T2 (p = 0.001), T3 (p = 0.0005) and T4 (p = 0.0005). Average peak
power at T4 was also significantly higher than that at T2 (p = 0.0005), but no
significant difference was observed between T3 and T4 means (p = 0.074). The
post-hoc analyses for 1st sprint power mirrored the above results with power
improving significantly at T2 (p = 0.003), T3 (p = 0.0005) and T4 (p = 0.0005),
compared to T1. T2 scores were also significantly different from T3 (p =
0.0005) and T4 (p = 0.0005), but no significant difference was observed
0.00.10.20.30.40.50.60.70.80.91.0
Throw (13 kg) Jump (22 kg)
Test Variable
T1T2T3T4
Bar
Hei
ght (
m)
abc
abc
ab a
a a
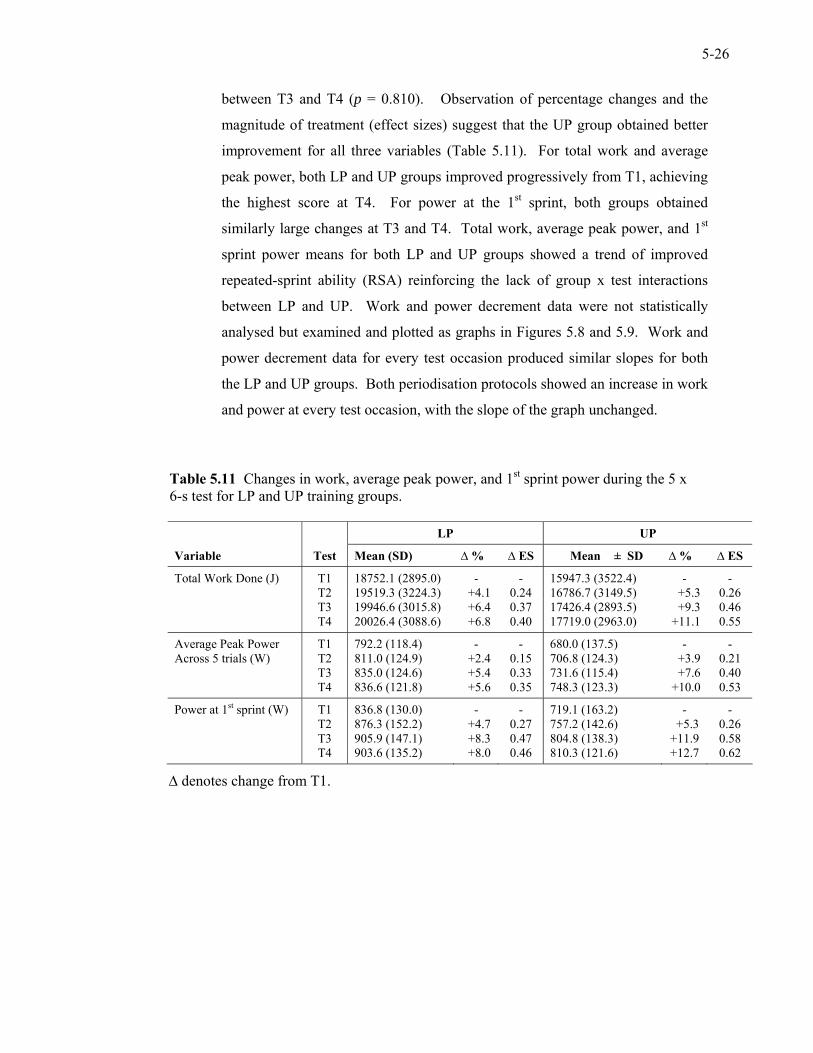
5-26
between T3 and T4 (p = 0.810). Observation of percentage changes and the
magnitude of treatment (effect sizes) suggest that the UP group obtained better
improvement for all three variables (Table 5.11). For total work and average
peak power, both LP and UP groups improved progressively from T1, achieving
the highest score at T4. For power at the 1st sprint, both groups obtained
similarly large changes at T3 and T4. Total work, average peak power, and 1st
sprint power means for both LP and UP groups showed a trend of improved
repeated-sprint ability (RSA) reinforcing the lack of group x test interactions
between LP and UP. Work and power decrement data were not statistically
analysed but examined and plotted as graphs in Figures 5.8 and 5.9. Work and
power decrement data for every test occasion produced similar slopes for both
the LP and UP groups. Both periodisation protocols showed an increase in work
and power at every test occasion, with the slope of the graph unchanged.
Table 5.11 Changes in work, average peak power, and 1st sprint power during the 5 x 6-s test for LP and UP training groups. LP UP
Variable Test Mean (SD) ∆ % ∆ ES Mean ± SD ∆ % ∆ ES
Total Work Done (J) T1 18752.1 (2895.0) - - 15947.3 (3522.4) - - T2 19519.3 (3224.3) 0+4.1 0.24 16786.7 (3149.5) +5.3 0.26 T3 19946.6 (3015.8) 0+6.4 0.37 17426.4 (2893.5) +9.3 0.46 T4 20026.4 (3088.6) 0+6.8 0.40 17719.0 (2963.0) +11.1 0.55
Average Peak Power T1 792.2 (118.4) - - 680.0 (137.5) - - Across 5 trials (W) T2 811.0 (124.9) 0+2.4 0.15 706.8 (124.3) +3.9 0.21 T3 835.0 (124.6) 0+5.4 0.33 731.6 (115.4) +7.6 0.40 T4 836.6 (121.8) 0+5.6 0.35 748.3 (123.3) +10.0 0.53
Power at 1st sprint (W) T1 836.8 (130.0) - - 719.1 (163.2) - - T2 876.3 (152.2) 0+4.7 0.27 757.2 (142.6) 0+5.3 0.26 T3 905.9 (147.1) 0+8.3 0.47 804.8 (138.3) +11.9 0.58 T4 903.6 (135.2) 0+8.0 0.46 810.3 (121.6) +12.7 0.62
∆ denotes change from T1.
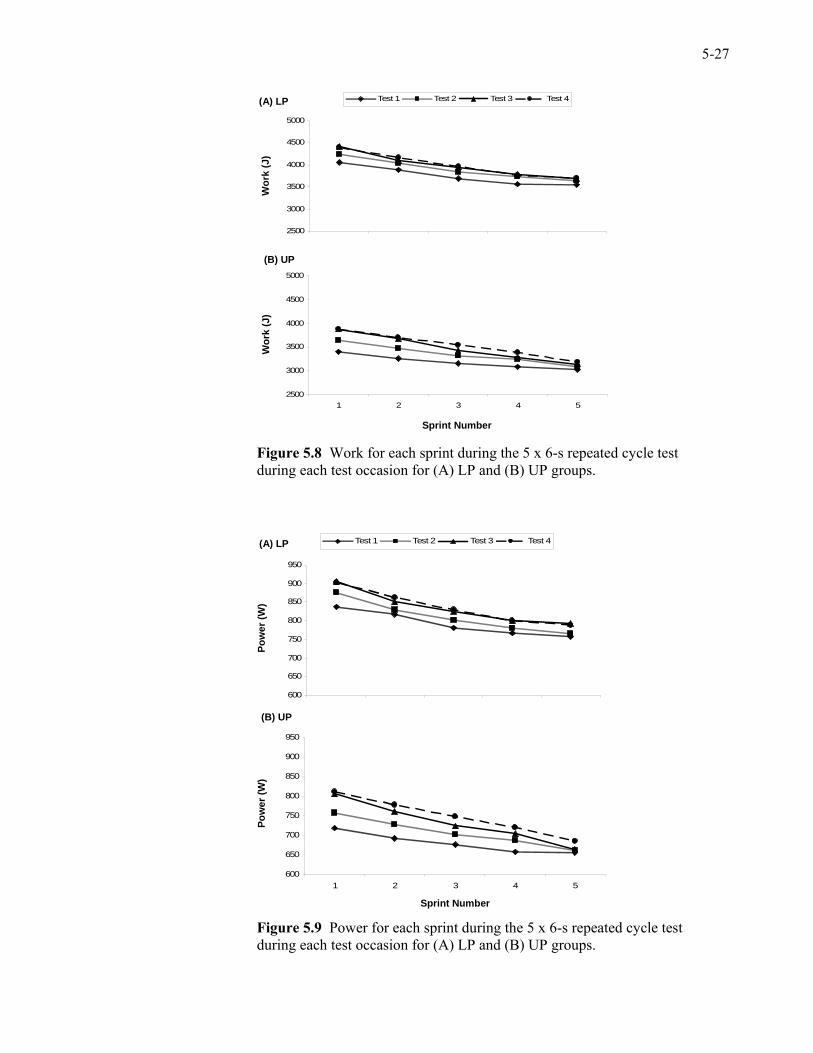
5-27
Figure 5.8 Work for each sprint during the 5 x 6-s repeated cycle test during each test occasion for (A) LP and (B) UP groups.
Figure 5.9 Power for each sprint during the 5 x 6-s repeated cycle test during each test occasion for (A) LP and (B) UP groups.
2500
3000
3500
4000
4500
5000
1 2 3 4 5
Test 1 Test 2 Test 3 Test 4
2500
3000
3500
4000
4500
5000
1 2 3 4 5
Wor
k (J
) W
ork
(J)
Sprint Number
(A) LP
(B) UP
600
650
700
750
800
850
900
950
1 2 3 4 5
Test 1 Test 2 Test 3 Test 4
600
650
700
750
800
850
900
950
1 2 3 4 5
Pow
er (W
) Po
wer
(W)
Sprint Number
(A) LP
(B) UP
5-28
5.6 Discussion
This study may be the first to examine differences between LP and UP
for improving strength qualities in untrained women. Training volume
(estimated by multiplying the total number of repetitions by the mass lifted),
intensity, sets and repetitions were matched between experimental groups by the
end of training. The main finding was that despite differences in the way
intensity and volume were varied, both LP and UP training produced significant
results across test occasions for most of the variables tested, without significant
interactions between the training groups. These results agree with those
obtained in males by Baker et al. (1994) and Herrick and Stone (1996) which
suggest that resistance training programmes with higher workloads and
repetitions produce superior strength and power adaptations, and it is not
specifically the variation of training volume and intensity within a periodised
programme that improves strength qualities, as suggested by others (O’Bryant et
al., 1988; Willoughby, 1993; Kraemer & Fry, 1995; Marx, Kraemer, Nindl et al.,
1998; Stone et al., 2000). However, it is important to note that the LP group in
this study performed power training with low percentages of 1 RM during the
final 3 wk of training while previous studies (Stone et al., 1981; O’Bryant et al.,
1988; Willoughby, 1993; Baker et al., 1994; Herrick & Stone, 1996; Schiotz et
al., 1998) utilised higher percentages of 1 RM with low repetitions for power
training.
Muscle hypertrophy has been shown to be associated with improved
maximal strength (Sale, MacDougall, Alway & Sutton, 1987), and has
previously been reported in women after resistance training (Staron, Malicky,
Leonardi et al., 1990; Starkey, Pollock, Ishida et al., 1996; Kraemer et al., 2000).
Muscle hypertrophy (as assessed via girth measurements and muscle CSA
changes) was observed in this study. The stimuli for increased muscle CSA
include hormonal, metabolic and mechanical factors (Enoka, 1994). High
volume training has been shown to elicit rapid increases in growth hormone and
decreases in cortisol in women, which in turn, have been suggested to accentuate
hypertrophic responses (Mulligan, Fleck, Gordon et al., 1996). Both training
programmes were found to be equally effective in improving arm and thigh
girths across test occasions, with hypertrophic responses occurring earlier in the
thighs (after 3 wk conditioning and 3 wk training) than in the arms (after 3 and 6
5-29
wk of conditioning and training respectively). However, as a word of caution
with interpretation, these changes are within the error of estimation of changes in
muscle size by girth measurements.
Ultrasonic imaging appears to be more sensitive to muscle CSA changes
than girth measurements, and is a more reliable measure of muscle hypertrophy
as shown through pilot testing by this researcher (Chapter 3, Section 3.6.5) and
also Bemben (2002). Perhaps due to improved measurement sensitivity, a
statistical interaction between LP and UP training was observed. The LP group
recorded their largest increase in CSA after hypertrophy training, followed by a
smaller increase after maximal strength training and a slight decrement after
power training, while the UP group achieved hypertrophic gains after every
phase. This lends support to the efficacy of the prescribed volume and intensity
in bringing about hypertrophic gains. However, there was no end difference in
performing all hypertrophic sessions within a 3-wk phase (LP) or doing only one
hypertrophy session a week for nine consecutive weeks (UP), as no significant
between-group difference was found. Taking into consideration all subjects, the
change in muscle CSA of the rectus femoris in the current study was
approximately 6.8 % after 3 wk of training, 11.3 % after 6 wk, and 11.8 % after
9 wk. These changes are larger than those reported by Chilibeck, Calder, Sale
and Webber (1998) and Kraemer, Nindl, Ratamess et al. (2004b) who used
female subjects with similar physical attributes and training history, but utilised
much longer training programmes (20 and 24 wk respectively). Chilibeck et al.
(1998) reported that training programmes utilising complex (multi-joint)
exercises, such as the bench press and leg press, result in minimal muscle
hypertrophy in the first few weeks of training because a neural adaptation
(learning and coordinating) period of more than 10 wk is required. Lean mass in
the legs (as measured by dual-energy X-ray absorptiometry) was found to have
increased by 1.4 % after 10 wk of training, with a further increase of 2.0 % after
another 10 wk of training. Kraemer et al. (2004a) similarly reported a much
slower rate of rectus femoris CSA improvement (through magnetic resonance
imaging) than the current study (3.7 % after 12 wk, and 8.1 % after 24 wk).
Even by adding the pre-training conditioning period performed in the present
study, hypertrophy was induced after only six weeks of training. These
contrasting results may be partially attributed to the structure of the respective
5-30
training programmes. Chilibeck et al. (1998) utilised a PRE programme
consisting of seven exercises performed for five sets, with intensity set at 6 – 10
RM for the upper body and 10 – 12 RM for the lower body, but may have
reported smaller CSA changes due to a training frequency of only twice a week
which may be insufficient for hypertrophy (Kraemer & Ratamess, 2004). While
Kraemer et al. (2004a) utilised an LP programme, they also included aerobic
training, which may have impaired CSA changes (Leveritt et al., 1999). The
subjects in the current study may also have achieved a faster rate of muscle CSA
improvement during the experimental period due to the pre-study training that
allowed for neural improvement to occur and stabilise, thus allowing
hypertrophic improvements to begin more quickly. This pre-study conditioning
was not performed in the studies of Chilibeck et al. (1998) and Kraemer et al.
(2004a).
Both the LP and UP training protocols recorded increases in maximal
strength for the upper and lower body, with no statistical difference between the
programmes. Without statistical significance, it would seem that using either
protocol for untrained women would bring about similar maximal strength gains
for both the upper and lower body. When the current subjects were examined
for percentage improvements in strength, the UP group obtained gains of 28.2 %
for the BP and 41.2 % for the SQ, compared with 21.2 % for the BP and 34.8 %
for the SQ by the LP group. Rhea et al. (2002) have also reported that UP
training produces greater percentage gains in both the bench press (LP: 14.4 %,
UP: 28.8 %) and leg press (LP: 25.7 %, UP: 55.8 %) compared with LP training
for male subjects. However, Rhea et al. (2002) did not report if there was a
significant interaction effect between the two protocols which would have
confirmed any differential effect due to the LP and UP programmes. It is also
interesting to note that although Rhea et al. (2002) reported their subjects as
previously strength trained (resistance training experience of approximately 5.2
y), percentage increments of up to 55.8 % for the leg press, and up to 28.8 % for
the bench press were observed. These percentages are normally associated with
subjects with lesser training experience (Rhea 2004), such as those from the
current study. Rhea et al. (2002) also reported that UP elicited greater strength
gains in the first six weeks of training, while strength gains in the second half of
the 12-wk programme were not significantly different from those attained by the
5-31
LP programme. These results contrast with those of the current study as the UP
group achieved consistent gains as the study progressed, while the LP group
achieved the largest gains after phase I or II, and decreasing gains subsequently.
This trend mirrored the training volume performed by both training groups,
reinforcing the opinion that larger doses of training volume are more important
for hypertrophic and strength gains than the manipulation of volume and
intensity (Baker et al., 1994; Schiotz et al., 1998). Unfortunately, it was not
possible to compare the volume of the current study with that of Rhea et al.
(2002) as volume in their study was represented by repetitions. Despite these
percentage differences, the overall strength gained at the end of training was not
significantly different between the two training groups in the present study.
Upper-body (bench press) percentage gains observed here are
comparable to those reported in studies by Herrick and Stone (1996), and
Kraemer et al. (2004b), who used similarly untrained female subjects, but for a
longer training period (15 and 24 wk respectively). The LP and UP groups in
the present study achieved a mean improvement of 25.1 % in the bench press,
while the mean improvements for the subjects of Herrick and Stone (1996) and
Kraemer et al. (2004b) were 28.5 % and 28.8 % respectively (note: only the two
total body training groups from the study by Kraemer at al. (2004b) were used in
the calculation of this mean). Comparative data for the SQ was more difficult to
obtain as most studies with female subjects utilised the leg press for lower-body
strength assessment, and the two studies utilising the SQ (Herrick & Stone,
1996; Kraemer at al., 2004b) had subjects perform the parallel SQ (with upper
thigh parallel to floor), while the subjects in the current study performed the SQ
to a knee angle of 110º. A reduced-range SQ (such as those performed to 110º)
will produce 1 RM scores that are greater than scores produced during the
parallel SQ (Baker, Nance & Moore, 2001b). No effect sizes were reported by
Herrick and Stone (1996) or Kraemer et al. (2004b) for comparisons, but
reported percentage improvements in SQ strength were also found to be similar
to that of the current study. A possible explanation as to why the current group
of subjects managed to obtain similar gains in strength within a shorter time
frame was that the studies by Herrick and Stone (1996) and Kraemer et al.
(2004b) both ran concurrent aerobic programmes. This may have hindered
strength gains (Leveritt et al., 1999; Sporer & Wenger, 2003) due to impaired
5-32
muscle tension development brought about by fatigue (Craig, Lucas, Pohlman &
Stelling (1991). Strength improvements in the lower body were greater than that
of the upper body regardless of the programme used. This was indicated by both
percentage changes and effect sizes. Previous researchers have also observed
this phenomenon (Herrick & Stone, 1996; Schiotz et al., 1998; Rhea et al, 2002;
Kraemer et al. 2004b). Willoughby (1993) proposed that these differences
between upper-body and lower-body strength occurred due to the smaller muscle
mass involved during upper-body training, which would produce smaller gains,
especially over a short term.
An unexpected development in this study was that the LP group still
achieved some increase in strength after Phase III training (4.4 % for the BP and
5.9 % for the SQ) although training intensity and volume was at its lowest (30 –
40 % of 1 RM, volume = 43 821 kg). Through the same phase, the UP group
performed training at a higher intensity and volume (ranges from 40 – 90 % of 1
RM, volume = 60 781 kg), and achieved strength increases of 10.1 % and 12.8
% for the BP and SQ respectively. Previous research with untrained males
(Lyttle, Wilson & Ostrowski, 1996; Moss, Refnes, Abildgaard, Nicolaysen &
Jensen, 1997; Jones, Bishop, Hunter & Fleisig, 2001) has similarly observed
strength developments after low-intensity and low-volume training. Moss et al.
(1997) have proposed that light loads performed with sufficiently high
acceleration could produce high tension within muscle and also recruit high
threshold units, thus aiding muscle strength and hypertrophy improvement,
emphasising again the relationship between muscle hypertrophy and strength.
This suggests that comparable to untrained men, training at low intensities and
volumes can result in strength gains for untrained women. This prescription
could be suitable for novice individuals who may be anxious about training with
heavier loads, especially when using free weights. These gains in strength were
likely to be linked to gains in lean body mass as the LP group recorded smaller
gains in lean body mass (8.7 %) compared with the UP group (14.8 %), who
were still performing some hypertrophy and maximal strength training.
However, continued use of light loads has been suggested to be detrimental to
strength and power performances (Baker et al., 1994). In spite of this, anecdotal
feedback from LP subjects suggested that the light-load power training during
Phase III acted as a psychological relief after 6 wk of heavy training,
5-33
emphasising one of the main tenets behind the concept of periodisation –
alternating heavy and light training for the alleviation of physical and mental
stress (Bompa, 1999). UP subjects similarly felt that power training once a week
provided some psychological and physical relief. The psychological benefit
from reduced training stress may be worth the trade-off of a slight decrease in
muscle mass.
Although power is an important component during sports performance,
most studies on periodisation have focused on maximal strength improvement.
In the current study, average mechanical power was assessed during BPT and
CMJ activities. Although average mechanical power production improved at the
end of the training period, there was no significant difference in the efficacy of
either training group. The similarities in the trend for improvements in power
and strength suggest that increments in power may be linked to increments in
strength (Moss et al., 1997). Improvement in power was assessed through the
use of both relative and absolute loads. The results indicated that relative loads
did not provide a clear indication of power improvement, as 30 % of 1 RM
increased at every test occasion, giving the subjects a new load with which to
perform the BPT and CMJ. The use of absolute loads of 13 kg (BPT) and 22 kg
(CMJ) however, produced a clearer trend of power increment and supports the
use of absolute loads to assess power changes after training (Hakkinen & Komi,
1985a; Mayhew, Ware, Johns & Bemben, 1997). Comparative average
mechanical power scores during BPT and CMJ from other studies were not
found as few studies utilising female subjects have assessed this component. Of
those that did (e.g., Kraemer et al., 2004b), values for peak power with relative
loads were obtained. While Baker et al. (2001a, 2001b) reported average
mechanical power output, they recruited power-trained rugby-league players,
and as such, their scores were much higher than those observed in the current
study. Comparison of power output with previous studies (Mayhew et al., 1997;
Stone, O’Bryant, McCoy et al., 2003) are also made complicated by differences
in the measurement and calculation of power, the experimental protocol,
equipment, and different body positions adopted during testing (Dugan et al.,
2004).
Average power increased significantly from pre-test to post-test in spite
of the subjects performing traditional explosive power training without
5-34
projecting (releasing from contact) the barbell or weight implement at the end of
movement. Although it has been suggested that holding on to the barbell at the
end of an explosive bench press action will decrease power (Elliott, Wilson &
Kerr, 1989; Newton, Kraemer, Hakkinen et al., 1996), the difference in average
power output between projected and non-projected movements has been
approximated to be only 5.8 % (Cronin, McNair & Marshall, 2001). This
difference may not be large enough to discard the use of traditional, non-
projected movements during power training, especially since equipment such as
the PPS is not readily available to most individuals performing resistance
training. Thus, while significant improvements in power were seen in the
present study, further research is required to investigate if greater gains could be
obtained by projecting the weights throughout a training period.
Although the LP group performed light-load power training exclusively
during the final 3 wk of training, gains in average power production were similar
to that achieved during the heavy maximal strength training performed earlier.
The intention to perform all power exercises as forcefully and as explosively as
possible may have provided a suitable stimulus for an increase in velocity
(Behm & Sale, 1993; Cronin et al., 2001) that in turn, improved power
production. This emphasises the importance of giving precise and clear
instructions to all subjects (Cronin et al. 2001), and ensuring that all training
procedures are carried out in a standardised manner. Mayhew et al. (1997) have
suggested that light loads lifted explosively could provide sufficient
neuromuscular facilitation to improve contractile efficiency allowing greater
force production and power production. Fast contraction velocities have also
been reported as the most effective for increasing muscular power (Newton &
Kraemer, 1994). Power improvement, as measured by average mechanical
power output, may also be influenced by the training volume as the LP group
achieved their highest power increase during the first 3 wk when volume was the
highest, and power increases tapered off with decreasing training volume. No
previous study could be found to substantiate this.
Maximal barbell height achieved during BPT and CMJ was used to
assess the effects of the periodised programmes on the functional aspects of
jumping and throwing. Loads approximating 30 % of 1 RM produced
decreasing barbell heights due the increase in mass of this load relative to
5-35
increased 1 RM values at each test occasion. Absolute loads of 13 kg for the
BPT and 22 kg for the CMJ produced increasing barbell heights as the subjects
became more powerful. An interesting observation is that there was an increase
in barbell height even when testing for power was performed with the barbell
projected while training for power was performed without projection of the
resistance training implement. This form of power training may have improved
the ability of the subjects to accelerate the barbell thus improving power
production. No other studies have recorded the changes in a loaded barbell
height, thus comparisons could not be performed.
Using the 5 x 6-s cycle test, data were collected to detect changes in
power performance after periodised training. Earlier studies on periodisation
(Christian & Seymour, 1985; O’Bryant et al., 1988; McGee et al. 1992) have
used cycle tests to assess the capacity to exert force and generate power. These
tests however, were longer duration cycle sprints (e.g., 50-s flat-out cycle or
cycle to exhaustion). The 5 x 6-s test allowed for the assessment of one-off
power performance during the first sprint, and also repeated measures of
maximal power, and power decrement, which gave an indication of the ability to
repeat power efforts and to recover quickly, or RSA. There was a lack of
statistical difference between the two training programmes for total work, peak
power and 1st sprint power. There was no interaction effect between training
programme and test occasion. For all cycle test measures, there were significant
differences between test occasions when pooled data from both groups were
used, showing improvement in work and power measures at each test occasion
after the baseline test, and a trend of improved RSA. These increases may be
related to increased strength and power, which reduced the number of motor
units required during cycling work, thus creating a greater motor unit reserve
(O’Bryant et al., 1988). Examining effect sizes did not indicate any distinct
pattern of improvement for LP or UP throughout the experimental period. The
similar increases in strength and power for both groups may be due to the
absence of differences between the groups, or may be due to a lack of specificity
of the cycling movement to the movements utilised during training.
5-36
5.7 Conclusion
For women who participate in recreational and amateur level sports, but
have not undertaken resistance training, both LP and UP seemed equally adept in
improving strength qualities, and personal preference may be used by the novice
individual to decide which programme to embark on. Improvements in
hypertrophy were larger, and occurred earlier than previously reported. Most of
the improvement in strength and power appear to be associated with improved
hypertrophic changes in muscle brought about by increased training volumes.
Non-projected, light-load, explosive training was found to be capable of
bringing about small increases in strength and power. Cycle tests may not
adequately assess improvements in strength qualities after periodised resistance
training due to a lack of specificity between testing and training movements.
Some caution needs to be used in extrapolating the results of this study to
athletes or physically stronger and more powerful female populations as most
studies using untrained individuals have shown great improvements regardless
of the type of training programme (Hakkinen and Komi, 1985a). Therefore
further research employing stronger women with resistance-training experience
is needed to extend the findings of the current study.
6-1
CHAPTER 6. COMPARING LINEAR AND UNDULATING PERIODISATION FOR IMPROVING MUSCULAR STRENGTH QUALITIES IN STRENGTH-TRAINED WOMEN
6.1 Introduction
Periodisation is a gradual cycling of resistance, volume, intensity, and
specificity through specially programmed training periods/phases in order to
achieve peak levels of performance and to maximise the individual’s capacity to
meet the specific demands of a sport, while optimising recovery (Bompa, 1993).
Many researchers support the view that it is the appropriate sequencing and
manipulation of training variables that produces superior results, and not simply
the volume of work or number of repetitions performed (O’Bryant, Byrd &
Stone, 1988; Kraemer & Fry, 1995; Marx, Kraemer, Nindl et al., 1998; Stone,
Potteiger, Pierce et al., 2000). In contrast, other researchers (Baker, Wilson &
Carlyon, 1994; Schiotz, Potteiger, Huntsinger & Denmark, 1998) have proposed
that if volume (repetitions) and intensity remain equal over a training period,
then gains in strength will be equal regardless of the periodisation model
employed.
Two basic models of periodisation, linear and undulating, have been
proposed. Linear periodisation (LP) begins with high volume and low intensity,
gradually changing to lower volume and higher intensity over a macrocycle
comprising a few training phases. Each phase of training (normally 3 – 6 wk)
emphasises one particular strength component, such as hypertrophy, maximal
strength, power, or endurance. This differs from undulating periodisation (UP)
which varies training volume and intensity more frequently, emphasising a
different component over two weeks (Poliquin, 1988, Baker et al., 1994; Stone et
al., 2000) or on a daily basis (Newton, Hakkinen, Hakkinen et al., 2002; Rhea,
Ball, Phillips & Burkett, 2002). Earlier studies on periodisation focused on
comparing LP with progressive resistance exercise (PRE), a protocol that utilises
constant intensity and repetitions throughout the entire training period (Stone,
O’Bryant & Garhammer, 1981; Stowers, McMillan, Scala, Davis Wilson &
Stone, 1983; O’Bryant et al., 1988; McGee, Jessee, Stone & Blessing, 1992;
Willoughby, 1993; Kraemer, 1997; Schiotz et al., 1998). These studies have
generally indicated that resistance training programmes should adhere to some
6-2
form of periodisation structure to optimise strength gains (Rhea and Alderman,
2004). Later studies compared training adaptations with PRE, LP and UP (Baker
et al., 1994; Stone et al., 2000; Rhea, Ball, Phillips & Burkett, 2002), but further
research on the UP model is needed as results were inconclusive as to which
periodised protocol was more effective.
Data from the previous study (see Chapter 5) have shown that for women
who were active in recreational and amateur-level sports, but novices in
resistance training, both LP and UP programmes were equally effective at
improving strength qualities such as maximal strength, muscle hypertrophy and
power production. However, it has been suggested that untrained individuals
will usually improve performance after resistance training regardless of the
programme used (Hakkinen & Komi, 1985a; Fleck, 1999). The efficacy of any
training programme is normally based on its ability to stimulate positive
adaptations in trained rather than untrained individuals. Trained individuals
have demonstrated slower rates of strength improvement (Kraemer & Fleck,
1988; Schiotz et al., 1998; Giorgi, Wilson, Weatherby & Murphy, 1998) with
increases approximating 40 % in untrained, 20 % in moderately-trained, 16 % in
trained, 10 % in advanced, and 2 % in elite individuals (Kraemer, Adams,
Cafarelli et al., 2002). Fleck and Kraemer (1997) are of the opinion that the
manipulation of training volume and intensity may need to be different for
subjects of different strength abilities. Untrained and intermediate-level subjects
may need the classical structure of LP, as they require a gradual decrease in
volume and intensity to recover from higher workloads in previous phases
(Stone, O’Bryant, Garhammer, McMillan & Rozenek, 1982). In contrast, UP
training may better suit highly-trained subjects as they are able to tolerate and
recover from higher volume and higher intensity training, and may require the
greater variation in volume and intensity found in UP to continue progressing
(Rhea et al., 2002). Compounding this further would be that although research
on periodised strength training has been steadily increasing, few LP-UP
comparisons have used subjects with reasonably extensive strength-training
experience (Baker et al., 1994; Rhea et al., 2002), and no agreement was reached
on the efficacy of either programme. It is important to note that these studies
have only involved trained men.
6-3
Although some research on resistance training has utilised women with
previous resistance-training experience (Schlumberger, Stec & Schmidtbleicher,
2001), none have involved periodised resistance training. Furthermore, while
Kraemer and his co-researchers (2000, 2003, 2004a) have examined periodised
training and its effects on women, the subjects were not performing resistance
training prior to the studies. Similarly, the previous study (Chapter 5) observed
previously untrained women. Hence, the efficacy of both protocols and their
suitability for individuals of high or low strength levels is still uncertain. Clearly
more research is needed to compare the efficacy of LP and UP in improving
different strength qualities utilising resistance-trained subjects, especially
resistance-trained women.
6.2 Purpose
The purpose of this study was to investigate the efficacy of LP and UP
resistance-training programmes to improve strength qualities in women with
resistance-training experience, and to compare the results from this study to the
previous study utilising untrained women. This is important to determine which
structure of periodisation is more suitable for trained and untrained subjects, and
if resistance-trained women show the same adaptations as untrained women. It
was hypothesised that both periodised training protocols would elicit similar
improvements in strength qualities in moderately strength-trained women, and
that there would be no differences in relative improvement between the untrained
females from the previous study and the moderately-trained young females of the
present study.
6.3 Subjects
Eighteen females with at least six months weight training experience
immediately prior to the study, but who were not competitive strength athletes,
volunteered for this study. As two subjects declined to participate further
following the pre-study conditioning period (due to reasons unrelated to the
study), the remaining subjects were assigned equally into LP and UP training
based on their one-repetition maximum (1 RM) squat scores using the A-B-B-A
procedure. There were eight subjects in each group and all subjects completed
100 % of the training sessions. The subjects were not elite strength athletes but
6-4
could perform a squat (knee angle 110°) with a load greater than 1.5 times their
body mass, and a supine bench press with a load at least 0.6 times their body
mass. While the strength index (1 RM / body mass) for the lower body was
comparable to data from previous studies utilising moderately-trained men, the
bench press index for these women could not match the moderately-trained
men’s index of 1.0. These women however, had similar upper-body strength as
the stronger women in the first study presented in Chapter 4.
All subjects were recruited from the university population and were
currently involved in a range of activities such as netball, volleyball, basketball,
rowing, tennis, badminton and rock-climbing. The subjects were non smokers,
were not taking any medication, and had neither medical conditions nor physical
injuries that could confound the results of this study. Each subject gave
informed consent after being informed of the potential risks associated with the
investigation, and limited their training activities to only the designated sessions
of the study. They were asked to maintain their dietary and activity habits
throughout the experimental period. The Human Ethics Committee of UWA
approved all the procedures undertaken. The mean (± SD) characteristics for
age, mass and height are 21.9 ± 4.3 y, 62.8 ± 11.9 kg, and 168.9 ± 8.4 cm
respectively.
6.4 Testing And Training Procedures
Two familiarisation sessions for testing, and two for training, were held
prior to the first test session. Although the subjects had previously performed
resistance training, not all of them had prior experience using the modified
Plyometric Power System, PPS (Plyopower Technologies, Lismore, Australia).
Thus, familiarisation sessions were necessary to determine and record hand and
foot positions so that the same positions were used each time the subjects were
tested. This aimed to reduce unwanted variability and improve reliability (Sale,
1991) by allowing the subjects to practise performing the test exercises with the
correct technique.
The testing and training procedures for the current study were almost
identical to that performed in the previous study (Chapter 5, Sections 5.4 and
5.5) for untrained women. There were only two differences; the first was related
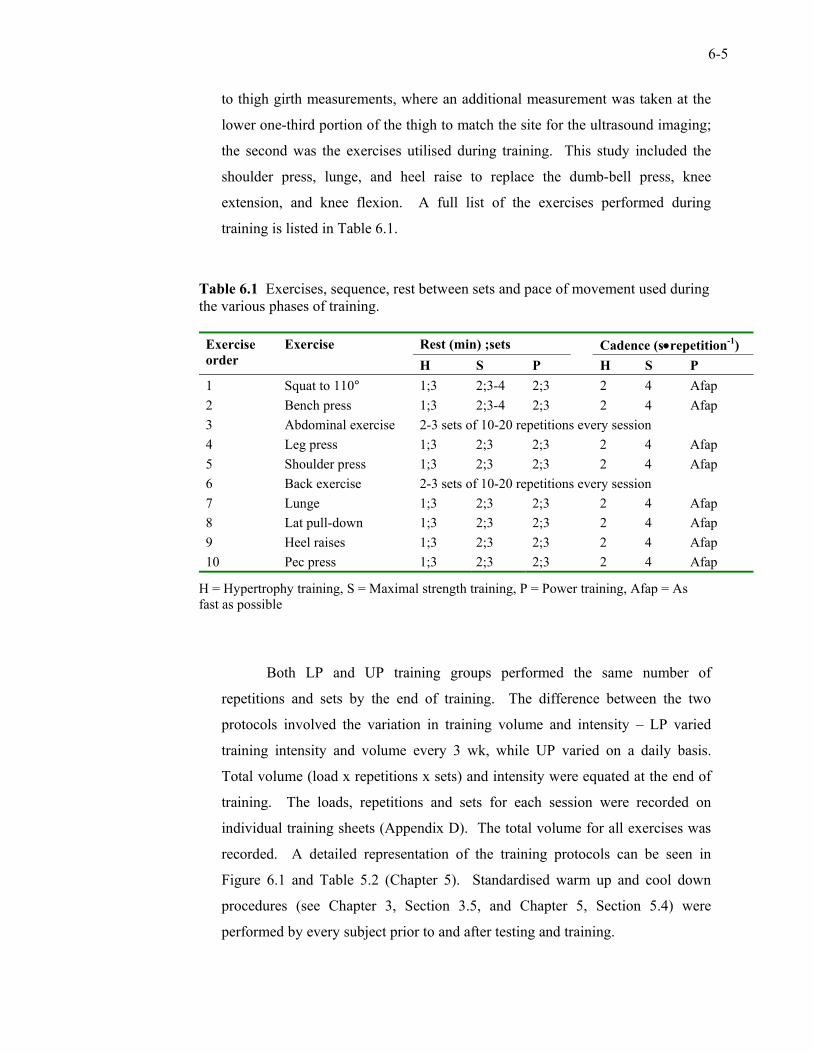
6-5
to thigh girth measurements, where an additional measurement was taken at the
lower one-third portion of the thigh to match the site for the ultrasound imaging;
the second was the exercises utilised during training. This study included the
shoulder press, lunge, and heel raise to replace the dumb-bell press, knee
extension, and knee flexion. A full list of the exercises performed during
training is listed in Table 6.1.
Table 6.1 Exercises, sequence, rest between sets and pace of movement used during the various phases of training.
Rest (min) ;sets Cadence (s•repetition-1) Exercise
order Exercise
H S P H S P 1 Squat to 110° 1;3 2;3-4 2;3 2 4 Afap 2 Bench press 1;3 2;3-4 2;3 2 4 Afap 3 Abdominal exercise 2-3 sets of 10-20 repetitions every session 4 Leg press 1;3 2;3 2;3 2 4 Afap 5 Shoulder press 1;3 2;3 2;3 2 4 Afap 6 Back exercise 2-3 sets of 10-20 repetitions every session 7 Lunge 1;3 2;3 2;3 2 4 Afap 8 Lat pull-down 1;3 2;3 2;3 2 4 Afap 9 Heel raises 1;3 2;3 2;3 2 4 Afap 10 Pec press 1;3 2;3 2;3 2 4 Afap
H = Hypertrophy training, S = Maximal strength training, P = Power training, Afap = As fast as possible
Both LP and UP training groups performed the same number of
repetitions and sets by the end of training. The difference between the two
protocols involved the variation in training volume and intensity – LP varied
training intensity and volume every 3 wk, while UP varied on a daily basis.
Total volume (load x repetitions x sets) and intensity were equated at the end of
training. The loads, repetitions and sets for each session were recorded on
individual training sheets (Appendix D). The total volume for all exercises was
recorded. A detailed representation of the training protocols can be seen in
Figure 6.1 and Table 5.2 (Chapter 5). Standardised warm up and cool down
procedures (see Chapter 3, Section 3.5, and Chapter 5, Section 5.4) were
performed by every subject prior to and after testing and training.
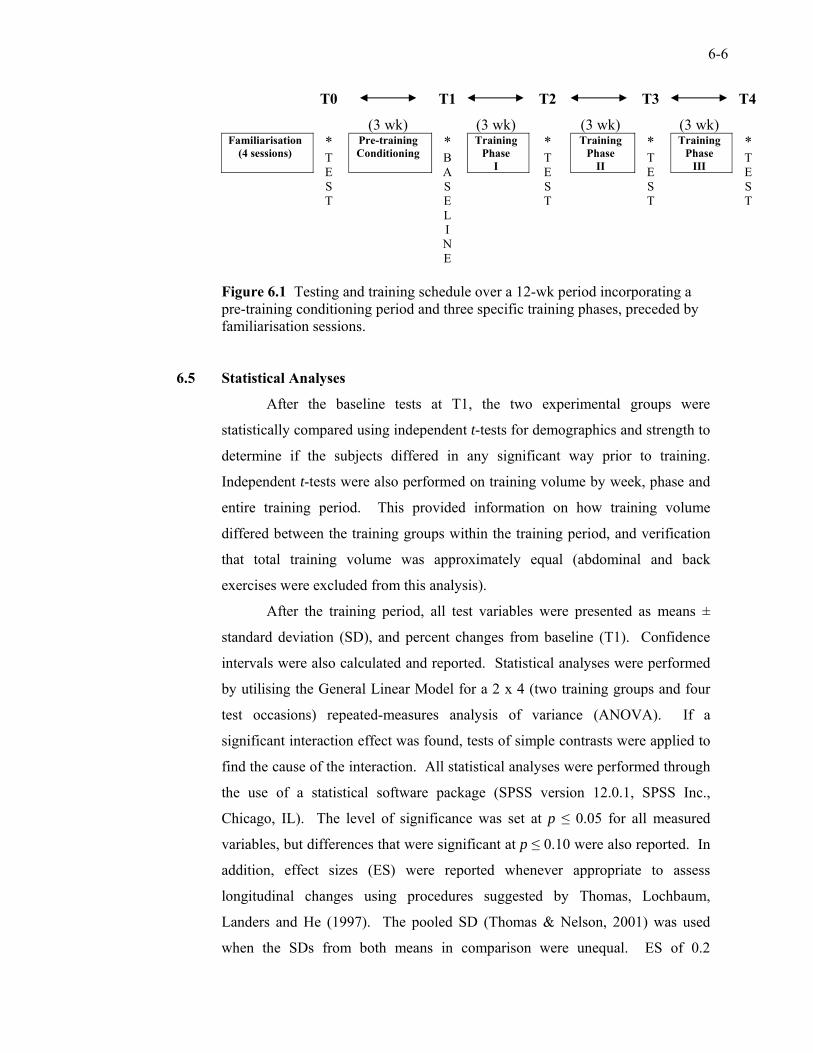
6-6
T0 T1 T2 T3 T4
(3 wk) (3 wk) (3 wk) (3 wk) Familiarisation
(4 sessions) Pre-training Conditioning
Training Phase
I
Training Phase
II
Training Phase
III
* T E S T
* B A S E L I N E
* T E S T
* T E S T
* T E S T
Figure 6.1 Testing and training schedule over a 12-wk period incorporating a pre-training conditioning period and three specific training phases, preceded by familiarisation sessions.
6.5 Statistical Analyses
After the baseline tests at T1, the two experimental groups were
statistically compared using independent t-tests for demographics and strength to
determine if the subjects differed in any significant way prior to training.
Independent t-tests were also performed on training volume by week, phase and
entire training period. This provided information on how training volume
differed between the training groups within the training period, and verification
that total training volume was approximately equal (abdominal and back
exercises were excluded from this analysis).
After the training period, all test variables were presented as means ±
standard deviation (SD), and percent changes from baseline (T1). Confidence
intervals were also calculated and reported. Statistical analyses were performed
by utilising the General Linear Model for a 2 x 4 (two training groups and four
test occasions) repeated-measures analysis of variance (ANOVA). If a
significant interaction effect was found, tests of simple contrasts were applied to
find the cause of the interaction. All statistical analyses were performed through
the use of a statistical software package (SPSS version 12.0.1, SPSS Inc.,
Chicago, IL). The level of significance was set at p ≤ 0.05 for all measured
variables, but differences that were significant at p ≤ 0.10 were also reported. In
addition, effect sizes (ES) were reported whenever appropriate to assess
longitudinal changes using procedures suggested by Thomas, Lochbaum,
Landers and He (1997). The pooled SD (Thomas & Nelson, 2001) was used
when the SDs from both means in comparison were unequal. ES of 0.2
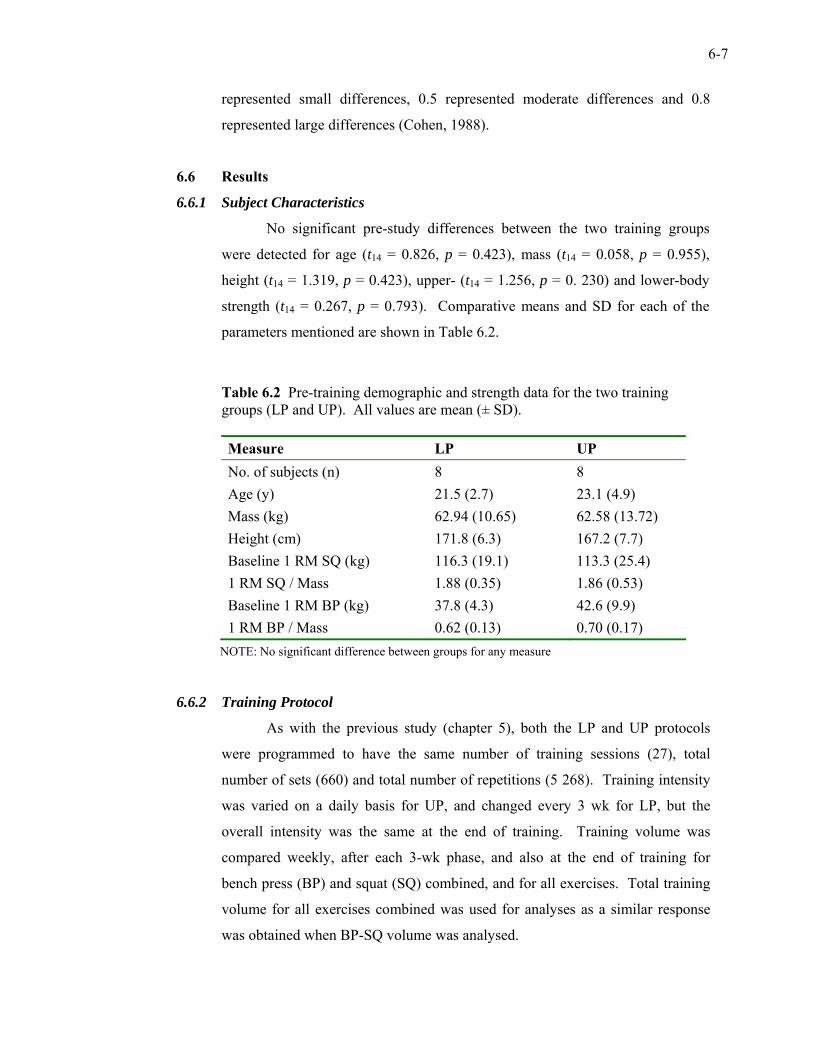
6-7
represented small differences, 0.5 represented moderate differences and 0.8
represented large differences (Cohen, 1988).
6.6 Results
6.6.1 Subject Characteristics
No significant pre-study differences between the two training groups
were detected for age (t14 = 0.826, p = 0.423), mass (t14 = 0.058, p = 0.955),
height (t14 = 1.319, p = 0.423), upper- (t14 = 1.256, p = 0. 230) and lower-body
strength (t14 = 0.267, p = 0.793). Comparative means and SD for each of the
parameters mentioned are shown in Table 6.2.
Table 6.2 Pre-training demographic and strength data for the two training groups (LP and UP). All values are mean (± SD).
Measure LP UP No. of subjects (n) 8 8 Age (y) 21.5 (2.7) 23.1 (4.9) Mass (kg) 62.94 (10.65) 62.58 (13.72) Height (cm) 171.8 (6.3) 167.2 (7.7) Baseline 1 RM SQ (kg) 116.3 (19.1) 113.3 (25.4) 1 RM SQ / Mass 1.88 (0.35) 1.86 (0.53) Baseline 1 RM BP (kg) 37.8 (4.3) 42.6 (9.9) 1 RM BP / Mass 0.62 (0.13) 0.70 (0.17)
NOTE: No significant difference between groups for any measure 6.6.2 Training Protocol
As with the previous study (chapter 5), both the LP and UP protocols
were programmed to have the same number of training sessions (27), total
number of sets (660) and total number of repetitions (5 268). Training intensity
was varied on a daily basis for UP, and changed every 3 wk for LP, but the
overall intensity was the same at the end of training. Training volume was
compared weekly, after each 3-wk phase, and also at the end of training for
bench press (BP) and squat (SQ) combined, and for all exercises. Total training
volume for all exercises combined was used for analyses as a similar response
was obtained when BP-SQ volume was analysed.
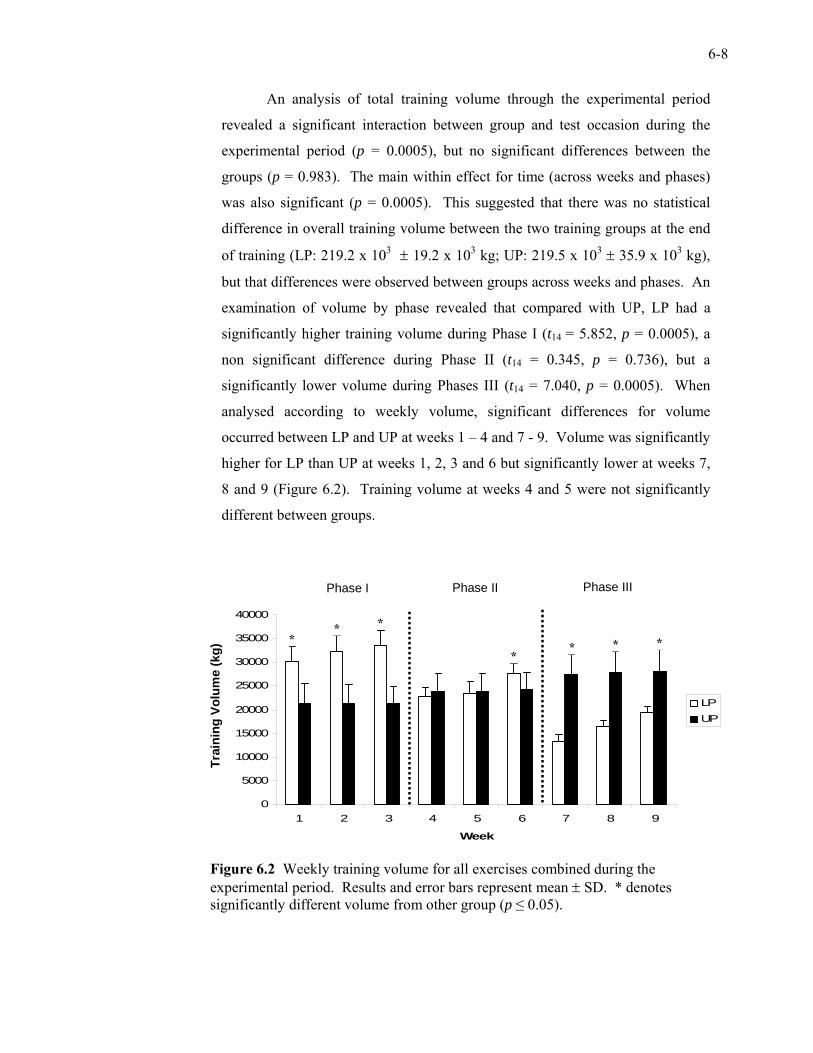
6-8
An analysis of total training volume through the experimental period
revealed a significant interaction between group and test occasion during the
experimental period (p = 0.0005), but no significant differences between the
groups (p = 0.983). The main within effect for time (across weeks and phases)
was also significant (p = 0.0005). This suggested that there was no statistical
difference in overall training volume between the two training groups at the end
of training (LP: 219.2 x 10³ ± 19.2 x 10³ kg; UP: 219.5 x 10³ ± 35.9 x 10³ kg),
but that differences were observed between groups across weeks and phases. An
examination of volume by phase revealed that compared with UP, LP had a
significantly higher training volume during Phase I (t14 = 5.852, p = 0.0005), a
non significant difference during Phase II (t14 = 0.345, p = 0.736), but a
significantly lower volume during Phases III (t14 = 7.040, p = 0.0005). When
analysed according to weekly volume, significant differences for volume
occurred between LP and UP at weeks 1 – 4 and 7 - 9. Volume was significantly
higher for LP than UP at weeks 1, 2, 3 and 6 but significantly lower at weeks 7,
8 and 9 (Figure 6.2). Training volume at weeks 4 and 5 were not significantly
different between groups.
Figure 6.2 Weekly training volume for all exercises combined during the experimental period. Results and error bars represent mean ± SD. * denotes significantly different volume from other group (p ≤ 0.05).
0
5000
10000
15000
20000
25000
30000
35000
40000
1 2 3 4 5 6 7 8 9
Week
LPUP
****
** *
Trai
ning
Vol
ume
(kg)
Phase I Phase II Phase III
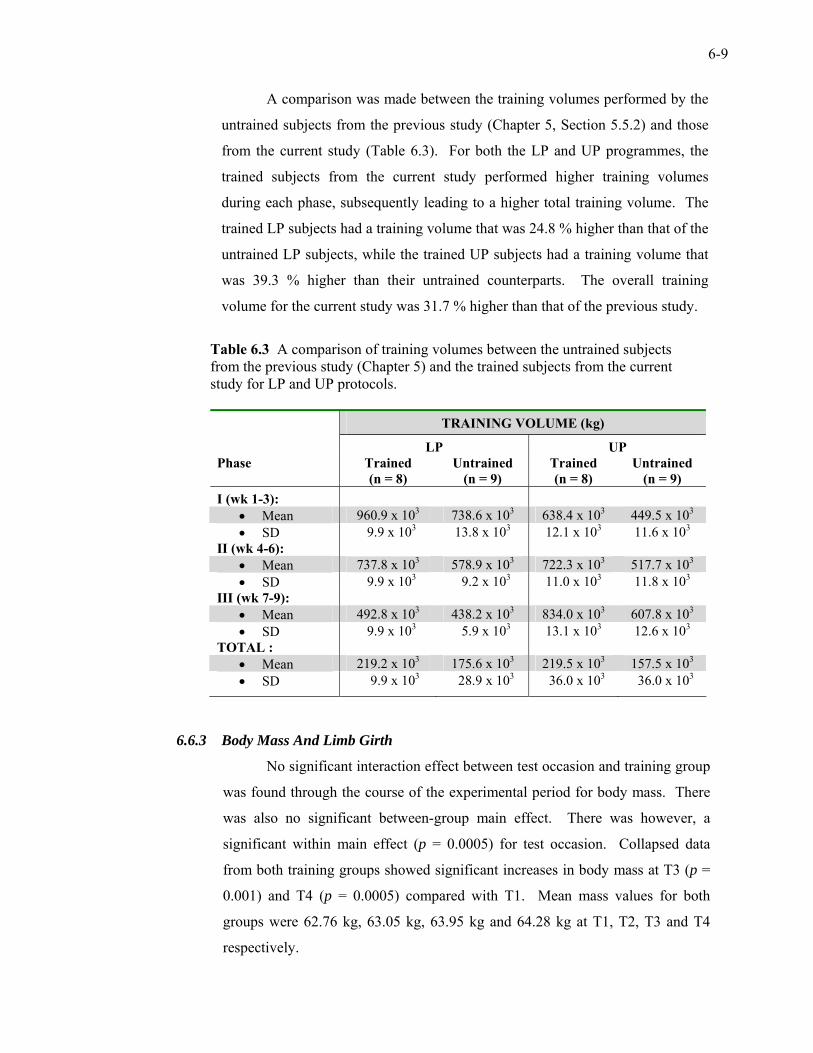
6-9
A comparison was made between the training volumes performed by the
untrained subjects from the previous study (Chapter 5, Section 5.5.2) and those
from the current study (Table 6.3). For both the LP and UP programmes, the
trained subjects from the current study performed higher training volumes
during each phase, subsequently leading to a higher total training volume. The
trained LP subjects had a training volume that was 24.8 % higher than that of the
untrained LP subjects, while the trained UP subjects had a training volume that
was 39.3 % higher than their untrained counterparts. The overall training
volume for the current study was 31.7 % higher than that of the previous study.
Table 6.3 A comparison of training volumes between the untrained subjects from the previous study (Chapter 5) and the trained subjects from the current study for LP and UP protocols.
TRAINING VOLUME (kg) LP UP Phase Trained
(n = 8) Untrained
(n = 9) Trained (n = 8)
Untrained (n = 9)
I (wk 1-3): • Mean 960.9 x 10³ 738.6 x 10³ 638.4 x 10³ 449.5 x 10³ • SD 09.9 x 10³ 13.8 x 10³ 12.1 x 10³ 11.6 x 10³
II (wk 4-6): • Mean 737.8 x 10³ 578.9 x 10³ 722.3 x 10³ 517.7 x 10³ • SD 09.9 x 10³ 09.2 x 10³ 11.0 x 10³ 11.8 x 10³
III (wk 7-9): • Mean 492.8 x 10³ 438.2 x 10³ 834.0 x 10³ 607.8 x 10³ • SD 09.9 x 10³ 05.9 x 10³ 13.1 x 10³ 12.6 x 10³
TOTAL : • Mean 219.2 x 10³ 175.6 x 10³ 219.5 x 10³ 157.5 x 10³ • SD 009.9 x 10³ 028.9 x 10³ 036.0 x 10³ 036.0 x 10³
6.6.3 Body Mass And Limb Girth
No significant interaction effect between test occasion and training group
was found through the course of the experimental period for body mass. There
was also no significant between-group main effect. There was however, a
significant within main effect (p = 0.0005) for test occasion. Collapsed data
from both training groups showed significant increases in body mass at T3 (p =
0.001) and T4 (p = 0.0005) compared with T1. Mean mass values for both
groups were 62.76 kg, 63.05 kg, 63.95 kg and 64.28 kg at T1, T2, T3 and T4
respectively.
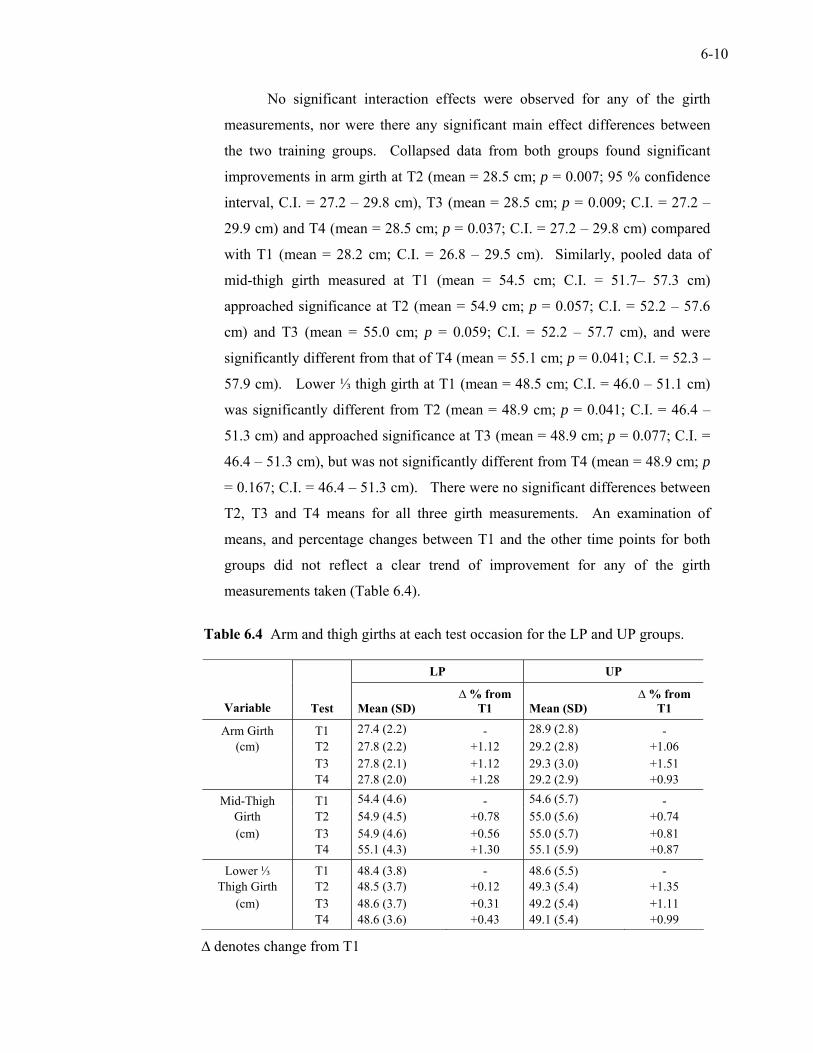
6-10
No significant interaction effects were observed for any of the girth
measurements, nor were there any significant main effect differences between
the two training groups. Collapsed data from both groups found significant
improvements in arm girth at T2 (mean = 28.5 cm; p = 0.007; 95 % confidence
interval, C.I. = 27.2 – 29.8 cm), T3 (mean = 28.5 cm; p = 0.009; C.I. = 27.2 –
29.9 cm) and T4 (mean = 28.5 cm; p = 0.037; C.I. = 27.2 – 29.8 cm) compared
with T1 (mean = 28.2 cm; C.I. = 26.8 – 29.5 cm). Similarly, pooled data of
mid-thigh girth measured at T1 (mean = 54.5 cm; C.I. = 51.7– 57.3 cm)
approached significance at T2 (mean = 54.9 cm; p = 0.057; C.I. = 52.2 – 57.6
cm) and T3 (mean = 55.0 cm; p = 0.059; C.I. = 52.2 – 57.7 cm), and were
significantly different from that of T4 (mean = 55.1 cm; p = 0.041; C.I. = 52.3 –
57.9 cm). Lower ⅓ thigh girth at T1 (mean = 48.5 cm; C.I. = 46.0 – 51.1 cm)
was significantly different from T2 (mean = 48.9 cm; p = 0.041; C.I. = 46.4 –
51.3 cm) and approached significance at T3 (mean = 48.9 cm; p = 0.077; C.I. =
46.4 – 51.3 cm), but was not significantly different from T4 (mean = 48.9 cm; p
= 0.167; C.I. = 46.4 – 51.3 cm). There were no significant differences between
T2, T3 and T4 means for all three girth measurements. An examination of
means, and percentage changes between T1 and the other time points for both
groups did not reflect a clear trend of improvement for any of the girth
measurements taken (Table 6.4).
Table 6.4 Arm and thigh girths at each test occasion for the LP and UP groups.
LP UP
Variable Test Mean (SD) ∆ % from
T1 Mean (SD) ∆ % from
T1
Arm Girth T1 27.4 (2.2) - 28.9 (2.8) - (cm) T2 27.8 (2.2) +1.12 29.2 (2.8) +1.06
T3 27.8 (2.1) +1.12 29.3 (3.0) +1.51 T4 27.8 (2.0) +1.28 29.2 (2.9) +0.93
Mid-Thigh T1 54.4 (4.6) - 54.6 (5.7) - Girth T2 54.9 (4.5) +0.78 55.0 (5.6) +0.74 (cm) T3 54.9 (4.6) +0.56 55.0 (5.7) +0.81
T4 55.1 (4.3) +1.30 55.1 (5.9) +0.87
Lower ⅓ T1 48.4 (3.8) - 48.6 (5.5) - Thigh Girth T2 48.5 (3.7) +0.12 49.3 (5.4) +1.35
(cm) T3 48.6 (3.7) +0.31 49.2 (5.4) +1.11 T4 48.6 (3.6) +0.43 49.1 (5.4) +0.99
∆ denotes change from T1
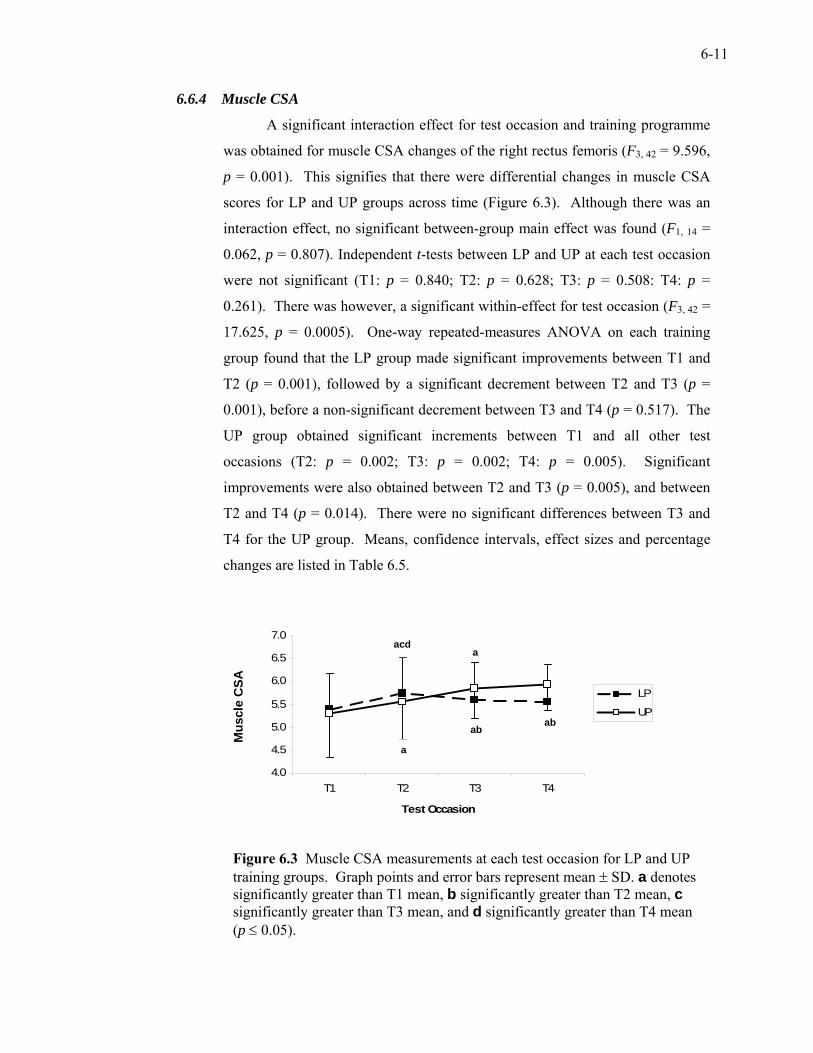
6-11
6.6.4 Muscle CSA
A significant interaction effect for test occasion and training programme
was obtained for muscle CSA changes of the right rectus femoris (F3, 42 = 9.596,
p = 0.001). This signifies that there were differential changes in muscle CSA
scores for LP and UP groups across time (Figure 6.3). Although there was an
interaction effect, no significant between-group main effect was found (F1, 14 =
0.062, p = 0.807). Independent t-tests between LP and UP at each test occasion
were not significant (T1: p = 0.840; T2: p = 0.628; T3: p = 0.508: T4: p =
0.261). There was however, a significant within-effect for test occasion (F3, 42 =
17.625, p = 0.0005). One-way repeated-measures ANOVA on each training
group found that the LP group made significant improvements between T1 and
T2 (p = 0.001), followed by a significant decrement between T2 and T3 (p =
0.001), before a non-significant decrement between T3 and T4 (p = 0.517). The
UP group obtained significant increments between T1 and all other test
occasions (T2: p = 0.002; T3: p = 0.002; T4: p = 0.005). Significant
improvements were also obtained between T2 and T3 (p = 0.005), and between
T2 and T4 (p = 0.014). There were no significant differences between T3 and
T4 for the UP group. Means, confidence intervals, effect sizes and percentage
changes are listed in Table 6.5.
Figure 6.3 Muscle CSA measurements at each test occasion for LP and UP training groups. Graph points and error bars represent mean ± SD. a denotes significantly greater than T1 mean, b significantly greater than T2 mean, c significantly greater than T3 mean, and d significantly greater than T4 mean (p ≤ 0.05).
4.0
4.5
5.0
5.5
6.0
6.5
7.0
T1 T2 T3 T4
Test Occasion
LP
UP
a
Mus
cle
CSA
acd
ab ab
a
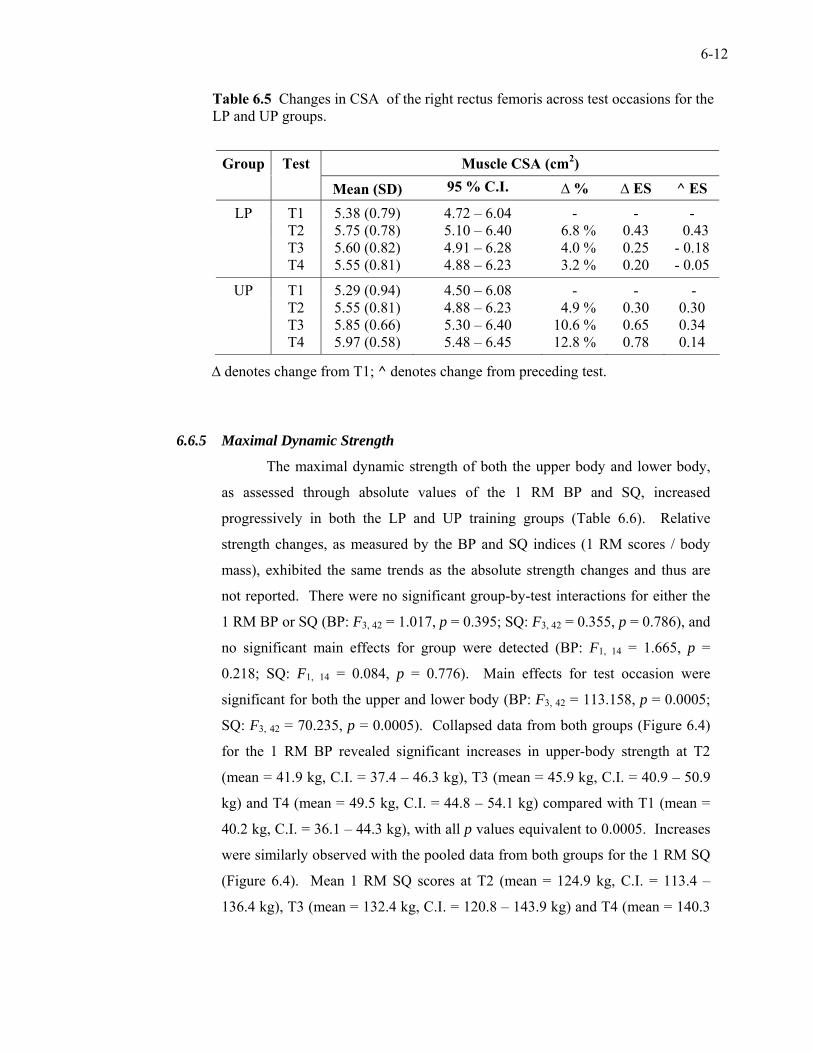
6-12
Table 6.5 Changes in CSA of the right rectus femoris across test occasions for the LP and UP groups.
Group Test Muscle CSA (cm2)
Mean (SD) 95 % C.I. ∆ % ∆ ES ^ ES
LP T1 5.38 (0.79) 4.72 – 6.04 - - - T2 5.75 (0.78) 5.10 – 6.40 06.8 % 0.43 00.43 T3 5.60 (0.82) 4.91 – 6.28 04.0 % 0.25 - 0.18 T4 5.55 (0.81) 4.88 – 6.23 03.2 % 0.20 - 0.05
UP T1 5.29 (0.94) 4.50 – 6.08 - - - T2 5.55 (0.81) 4.88 – 6.23 04.9 % 0.30 0.30 T3 5.85 (0.66) 5.30 – 6.40 10.6 % 0.65 0.34 T4 5.97 (0.58) 5.48 – 6.45 12.8 % 0.78 0.14
∆ denotes change from T1; ^ denotes change from preceding test.
6.6.5 Maximal Dynamic Strength
The maximal dynamic strength of both the upper body and lower body,
as assessed through absolute values of the 1 RM BP and SQ, increased
progressively in both the LP and UP training groups (Table 6.6). Relative
strength changes, as measured by the BP and SQ indices (1 RM scores / body
mass), exhibited the same trends as the absolute strength changes and thus are
not reported. There were no significant group-by-test interactions for either the
1 RM BP or SQ (BP: F3, 42 = 1.017, p = 0.395; SQ: F3, 42 = 0.355, p = 0.786), and
no significant main effects for group were detected (BP: F1, 14 = 1.665, p =
0.218; SQ: F1, 14 = 0.084, p = 0.776). Main effects for test occasion were
significant for both the upper and lower body (BP: F3, 42 = 113.158, p = 0.0005;
SQ: F3, 42 = 70.235, p = 0.0005). Collapsed data from both groups (Figure 6.4)
for the 1 RM BP revealed significant increases in upper-body strength at T2
(mean = 41.9 kg, C.I. = 37.4 – 46.3 kg), T3 (mean = 45.9 kg, C.I. = 40.9 – 50.9
kg) and T4 (mean = 49.5 kg, C.I. = 44.8 – 54.1 kg) compared with T1 (mean =
40.2 kg, C.I. = 36.1 – 44.3 kg), with all p values equivalent to 0.0005. Increases
were similarly observed with the pooled data from both groups for the 1 RM SQ
(Figure 6.4). Mean 1 RM SQ scores at T2 (mean = 124.9 kg, C.I. = 113.4 –
136.4 kg), T3 (mean = 132.4 kg, C.I. = 120.8 – 143.9 kg) and T4 (mean = 140.3
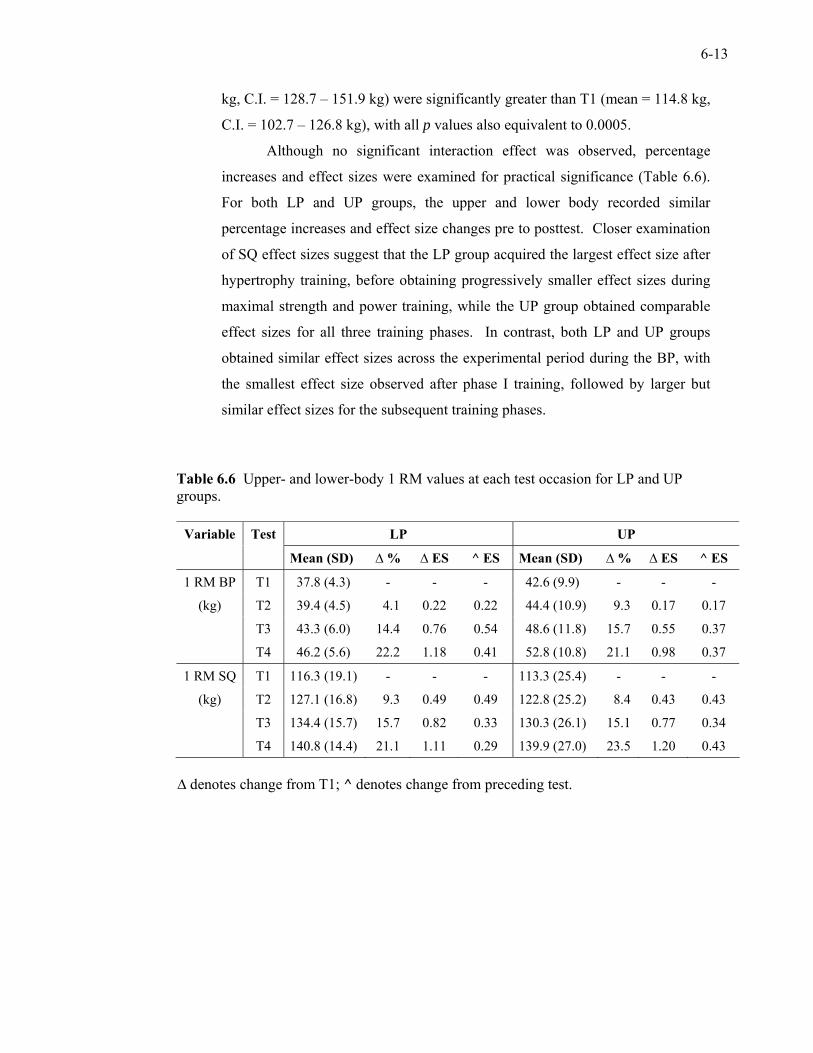
6-13
kg, C.I. = 128.7 – 151.9 kg) were significantly greater than T1 (mean = 114.8 kg,
C.I. = 102.7 – 126.8 kg), with all p values also equivalent to 0.0005.
Although no significant interaction effect was observed, percentage
increases and effect sizes were examined for practical significance (Table 6.6).
For both LP and UP groups, the upper and lower body recorded similar
percentage increases and effect size changes pre to posttest. Closer examination
of SQ effect sizes suggest that the LP group acquired the largest effect size after
hypertrophy training, before obtaining progressively smaller effect sizes during
maximal strength and power training, while the UP group obtained comparable
effect sizes for all three training phases. In contrast, both LP and UP groups
obtained similar effect sizes across the experimental period during the BP, with
the smallest effect size observed after phase I training, followed by larger but
similar effect sizes for the subsequent training phases.
Table 6.6 Upper- and lower-body 1 RM values at each test occasion for LP and UP groups.
Variable Test LP UP
Mean (SD) ∆ % ∆ ES ^ ES Mean (SD) ∆ % ∆ ES ^ ES
1 RM BP T1 037.8 (4.3) - - - 042.6 (9.9) - - -
(kg) T2 039.4 (4.5) 04.1 0.22 0.22 044.4 (10.9) 09.3 0.17 0.17
T3 043.3 (6.0) 14.4 0.76 0.54 048.6 (11.8) 15.7 0.55 0.37
T4 046.2 (5.6) 22.2 1.18 0.41 052.8 (10.8) 21.1 0.98 0.37
1 RM SQ T1 116.3 (19.1) - - - 113.3 (25.4) - - -
(kg) T2 127.1 (16.8) 09.3 0.49 0.49 122.8 (25.2) 08.4 0.43 0.43
T3 134.4 (15.7) 15.7 0.82 0.33 130.3 (26.1) 15.1 0.77 0.34
T4 140.8 (14.4) 21.1 1.11 0.29 139.9 (27.0) 23.5 1.20 0.43 ∆ denotes change from T1; ^ denotes change from preceding test.
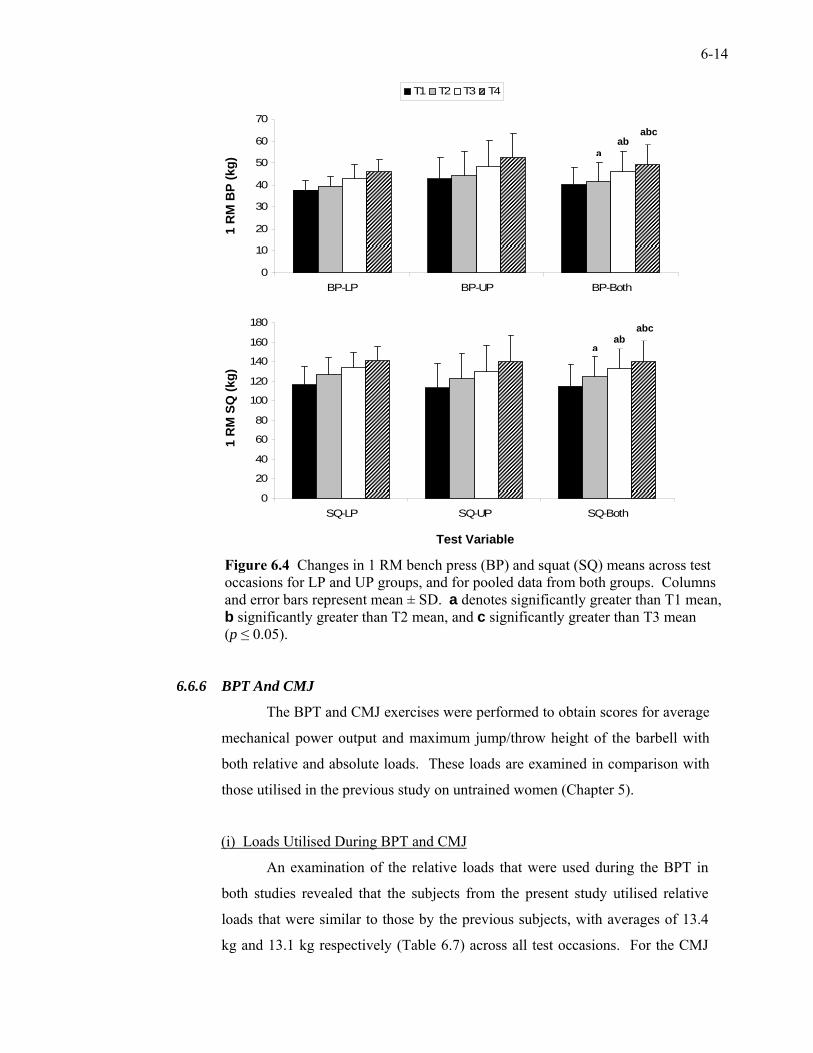
6-14
Figure 6.4 Changes in 1 RM bench press (BP) and squat (SQ) means across test occasions for LP and UP groups, and for pooled data from both groups. Columns and error bars represent mean ± SD. a denotes significantly greater than T1 mean, b significantly greater than T2 mean, and c significantly greater than T3 mean (p ≤ 0.05).
6.6.6 BPT And CMJ
The BPT and CMJ exercises were performed to obtain scores for average
mechanical power output and maximum jump/throw height of the barbell with
both relative and absolute loads. These loads are examined in comparison with
those utilised in the previous study on untrained women (Chapter 5).
(i) Loads Utilised During BPT and CMJ
An examination of the relative loads that were used during the BPT in
both studies revealed that the subjects from the present study utilised relative
loads that were similar to those by the previous subjects, with averages of 13.4
kg and 13.1 kg respectively (Table 6.7) across all test occasions. For the CMJ
0
10
20
30
40
50
60
70
BP-LP BP-UP BP-Both
T1 T2 T3 T4
0
20
40
60
80
100
120
140
160
180
SQ-LP SQ-UP SQ-Both
1 R
M B
P (k
g)
1 R
M S
Q (k
g)
Test Variable
abc
abc
ab
ab
a
a
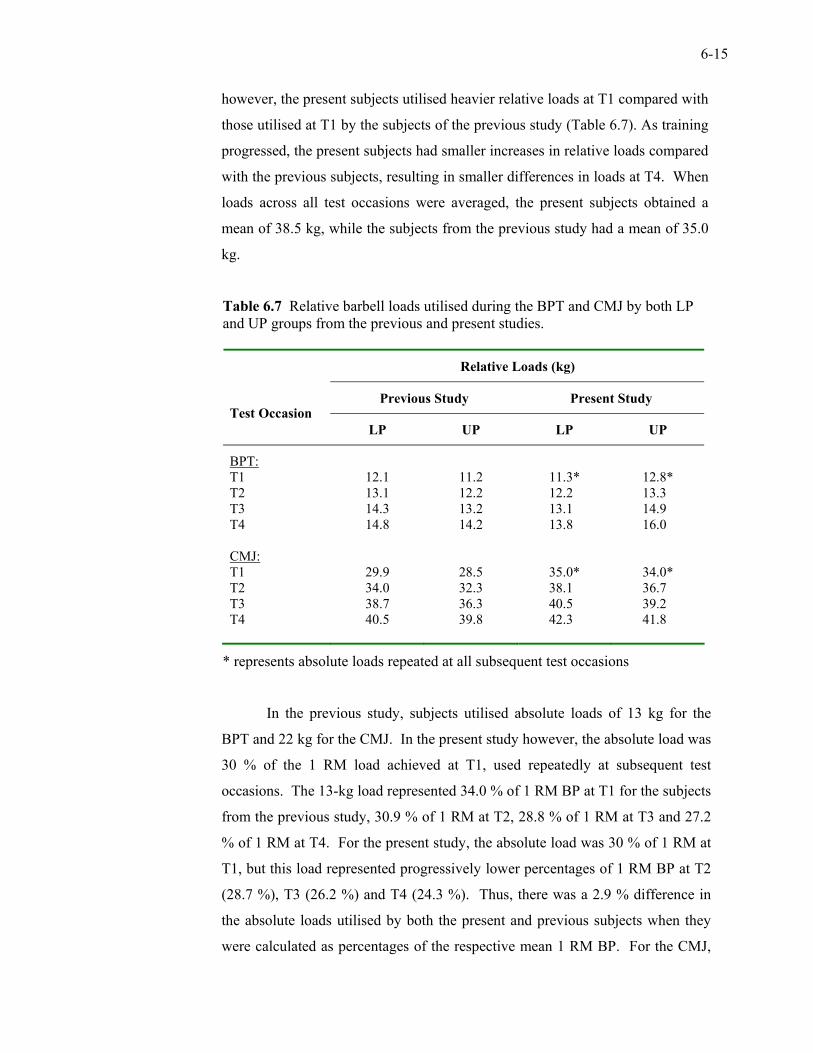
6-15
however, the present subjects utilised heavier relative loads at T1 compared with
those utilised at T1 by the subjects of the previous study (Table 6.7). As training
progressed, the present subjects had smaller increases in relative loads compared
with the previous subjects, resulting in smaller differences in loads at T4. When
loads across all test occasions were averaged, the present subjects obtained a
mean of 38.5 kg, while the subjects from the previous study had a mean of 35.0
kg.
Table 6.7 Relative barbell loads utilised during the BPT and CMJ by both LP and UP groups from the previous and present studies.
Relative Loads (kg)
Previous Study Present Study
Test Occasion LP UP LP UP
BPT: T1 12.1 11.2 11.3* 12.8* T2 13.1 12.2 12.2* 13.3* T3 14.3 13.2 13.1* 14.9* T4 14.8 14.2 13.8* 16.0* CMJ: T1 29.9 28.5 35.0* 34.0* T2 34.0 32.3 38.1* 36.7* T3 38.7 36.3 40.5* 39.2* T4 40.5 39.8 42.3* 41.8*
* represents absolute loads repeated at all subsequent test occasions In the previous study, subjects utilised absolute loads of 13 kg for the
BPT and 22 kg for the CMJ. In the present study however, the absolute load was
30 % of the 1 RM load achieved at T1, used repeatedly at subsequent test
occasions. The 13-kg load represented 34.0 % of 1 RM BP at T1 for the subjects
from the previous study, 30.9 % of 1 RM at T2, 28.8 % of 1 RM at T3 and 27.2
% of 1 RM at T4. For the present study, the absolute load was 30 % of 1 RM at
T1, but this load represented progressively lower percentages of 1 RM BP at T2
(28.7 %), T3 (26.2 %) and T4 (24.3 %). Thus, there was a 2.9 % difference in
the absolute loads utilised by both the present and previous subjects when they
were calculated as percentages of the respective mean 1 RM BP. For the CMJ,
6-16
the 22-kg load used in the previous study was approximately 22.7 % of 1 RM SQ
at T1, 19.9 % of 1 RM at T2, 17.6 % of 1 RM at T3, and 16.4 % of 1 RM at T4.
However, the actual absolute loads utilised in the present study began as 30 % of
1 RM SQ at T1, becoming 27.6 % of 1 RM at T2, 26.1 % of 1 RM at T3, and
24.6 % of 1 RM at T4. This suggests that the subjects from the present study had
performed the CMJ at 7.9 % higher absolute loads compared with the subjects
from the previous study.
(ii) Power Output
Average mechanical power output data showed no significant group-by-
test interaction effects for the BPT and CMJ using absolute (BPT: F3, 42 = 0.133,
p = 0.940; CMJ: F3, 42 = 0.298, p = 0.827) or relative loads (BPT: F3, 42 = 0.119,
p = 0.948; CMJ: F3, 42 = 0.324, p = 0.808). There were no main effects for group
(absolute load BPT: F1, 14 = 0.199, p = 0.662; absolute load CMJ: F1, 14 = 0.123,
p = 0.731; relative load BPT: F1, 14 = 0.319, p = 0.581; relative load CMJ: F1, 14 =
0.108, p = 0.748), but significant main effects for test occasion were observed for
both the BPT and CMJ with relative loads (BPT: F3, 42 = 9.000, p = 0.005; CMJ:
F3, 42 = 5.797, p = 0.002), and absolute loads (BPT: F3, 42 = 13.356, p = 0.0005;
CMJ: F3, 42 = 15.820, p = 0.0005). For the BPT performed with relative loads,
T1 power output (mean = 196.5 W, C.I. = 173.9 – 219.0 W) was significantly
lower than that at T2 (mean = 220.0 W, C.I. = 194.9 – 245.2 W), T3 (mean =
224.3 W, C.I. = 207.1 – 241.4 W) and T4 (mean = 224.3 W, C.I. = 205.7 – 242.9
W), with p values of 0.005, 0.0005 and 0.001 respectively. No other significant
differences were observed among average power scores at T2, T3 and T4. For
the BPT performed with absolute loads, power output at T1 (mean = 196.5 W,
C.I. = 173.9 – 219.0 W) was not significantly different from that at T2 (mean =
199.7 W, C.I. = 180.6 – 218.8 W), but was significantly lower than that at T3
(mean = 214.4 W, C.I. = 193.0 – 235.7 W) and T4 (mean = 225.6 W, C.I. =
205.5 – 245.5 W), with p values of 0.002 and 0.0005 respectively. Mean T2
power output score was also significantly lower than that of T3 (p = 0.002) and
T4 (p = 0.001), while the T3 score was significantly lower than that of T4 (p =
0.037). Pooled average power outputs by absolute and relative loads during the
BPT are depicted in Figure 6.5.
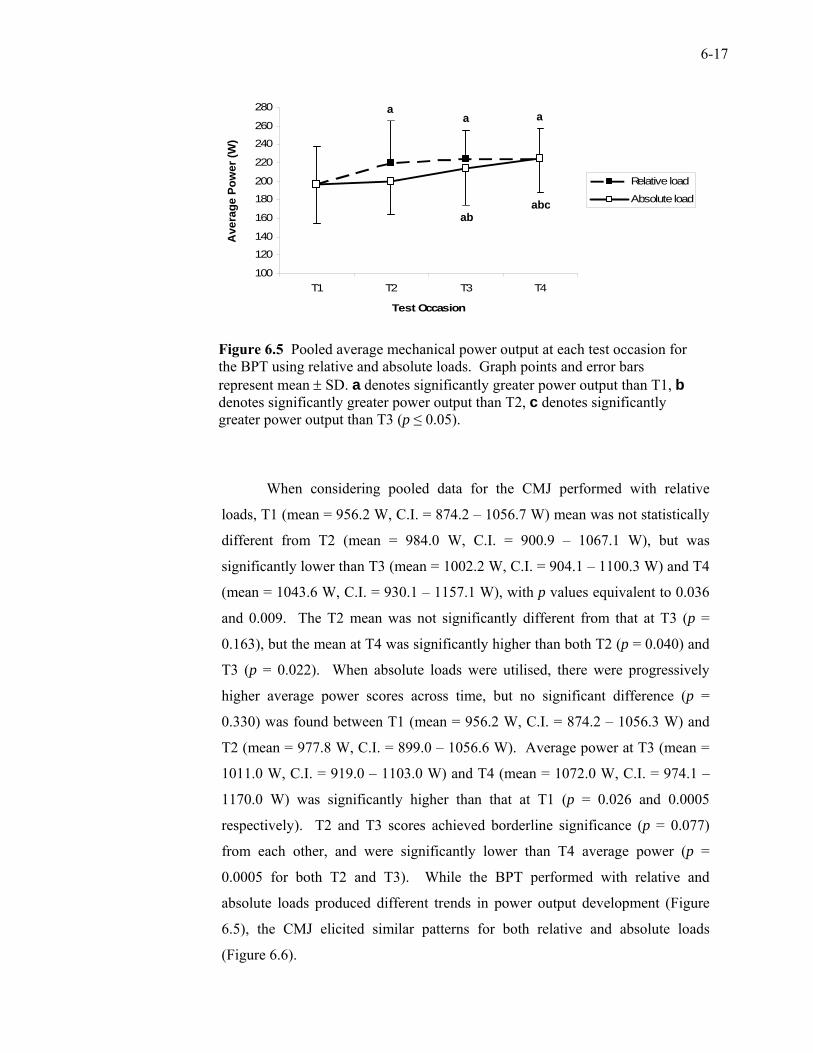
6-17
Figure 6.5 Pooled average mechanical power output at each test occasion for the BPT using relative and absolute loads. Graph points and error bars represent mean ± SD. a denotes significantly greater power output than T1, b denotes significantly greater power output than T2, c denotes significantly greater power output than T3 (p ≤ 0.05).
When considering pooled data for the CMJ performed with relative
loads, T1 (mean = 956.2 W, C.I. = 874.2 – 1056.7 W) mean was not statistically
different from T2 (mean = 984.0 W, C.I. = 900.9 – 1067.1 W), but was
significantly lower than T3 (mean = 1002.2 W, C.I. = 904.1 – 1100.3 W) and T4
(mean = 1043.6 W, C.I. = 930.1 – 1157.1 W), with p values equivalent to 0.036
and 0.009. The T2 mean was not significantly different from that at T3 (p =
0.163), but the mean at T4 was significantly higher than both T2 (p = 0.040) and
T3 (p = 0.022). When absolute loads were utilised, there were progressively
higher average power scores across time, but no significant difference (p =
0.330) was found between T1 (mean = 956.2 W, C.I. = 874.2 – 1056.3 W) and
T2 (mean = 977.8 W, C.I. = 899.0 – 1056.6 W). Average power at T3 (mean =
1011.0 W, C.I. = 919.0 – 1103.0 W) and T4 (mean = 1072.0 W, C.I. = 974.1 –
1170.0 W) was significantly higher than that at T1 (p = 0.026 and 0.0005
respectively). T2 and T3 scores achieved borderline significance (p = 0.077)
from each other, and were significantly lower than T4 average power (p =
0.0005 for both T2 and T3). While the BPT performed with relative and
absolute loads produced different trends in power output development (Figure
6.5), the CMJ elicited similar patterns for both relative and absolute loads
(Figure 6.6).
100
120
140
160
180
200
220
240
260
280
T1 T2 T3 T4
Test Occasion
Relative load
Absolute load
a a a
ab abc
Ave
rage
Pow
er (W
)
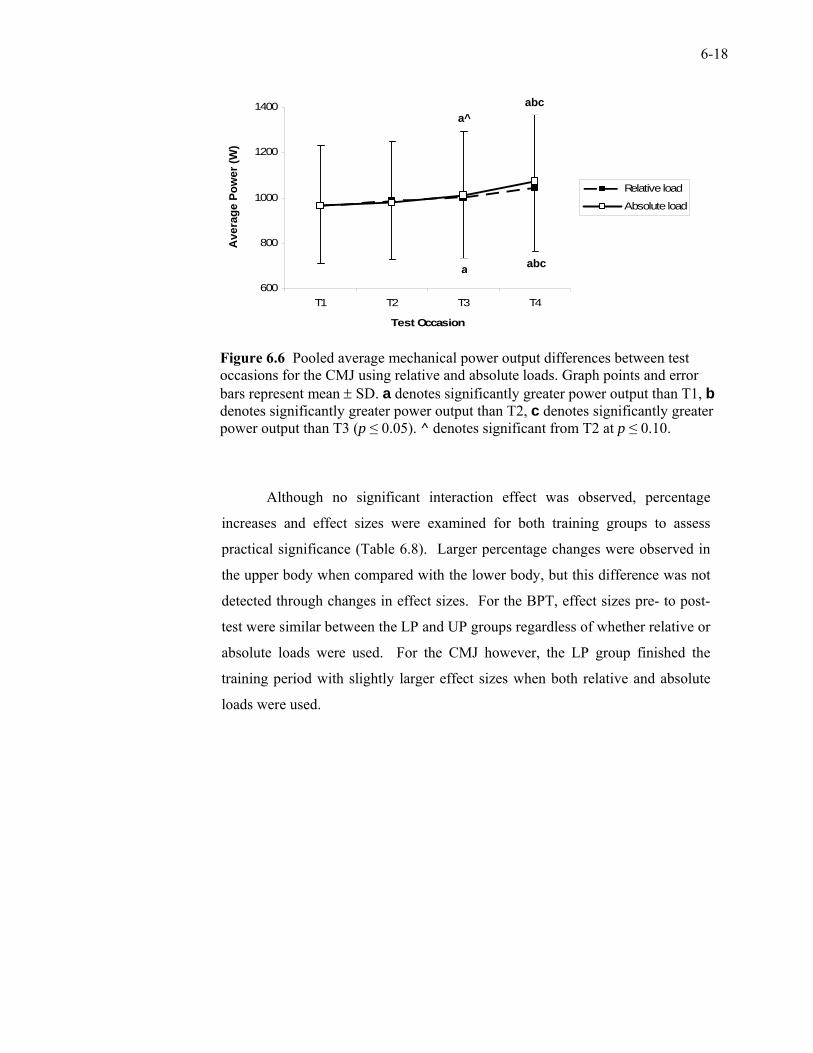
6-18
Figure 6.6 Pooled average mechanical power output differences between test occasions for the CMJ using relative and absolute loads. Graph points and error bars represent mean ± SD. a denotes significantly greater power output than T1, b denotes significantly greater power output than T2, c denotes significantly greater power output than T3 (p ≤ 0.05). ^ denotes significant from T2 at p ≤ 0.10.
Although no significant interaction effect was observed, percentage
increases and effect sizes were examined for both training groups to assess
practical significance (Table 6.8). Larger percentage changes were observed in
the upper body when compared with the lower body, but this difference was not
detected through changes in effect sizes. For the BPT, effect sizes pre- to post-
test were similar between the LP and UP groups regardless of whether relative or
absolute loads were used. For the CMJ however, the LP group finished the
training period with slightly larger effect sizes when both relative and absolute
loads were used.
600
800
1000
1200
1400
T1 T2 T3 T4
Test Occasion
Relative load
Absolute load
abc
abc
a^
a
Ave
rage
Pow
er (W
)
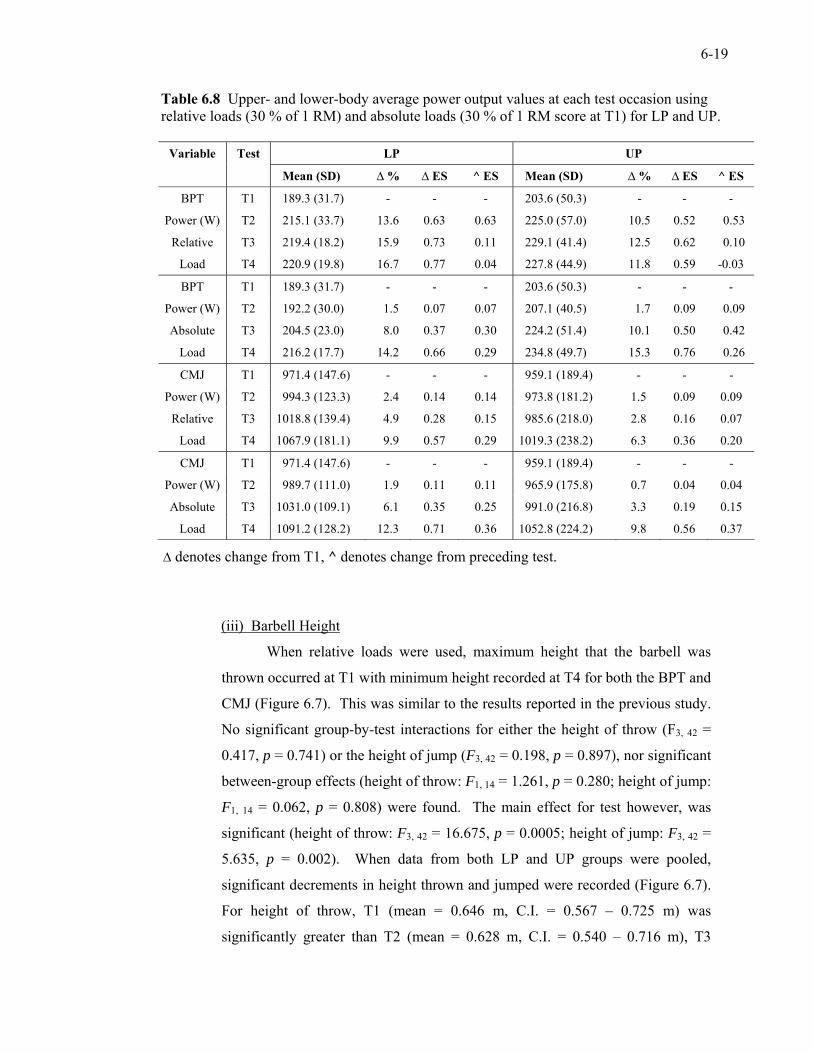
6-19
Table 6.8 Upper- and lower-body average power output values at each test occasion using relative loads (30 % of 1 RM) and absolute loads (30 % of 1 RM score at T1) for LP and UP.
Variable Test LP UP
Mean (SD) ∆ % ∆ ES ^ ES Mean (SD) ∆ % ∆ ES ^ ES
BPT T1 0189.3 (31.7) - - - 0203.6 (50.3) - - -
Power (W) T2 0215.1 (33.7) 13.6 0.63 0.63 0225.0 (57.0) 10.5 0.52 00.53
Relative T3 0219.4 (18.2) 15.9 0.73 0.11 0229.1 (41.4) 12.5 0.62 00.10
Load T4 0220.9 (19.8) 16.7 0.77 0.04 0227.8 (44.9) 11.8 0.59 -0.03
BPT T1 0189.3 (31.7) - - - 0203.6 (50.3) - - -
Power (W) T2 0192.2 (30.0) 01.5 0.07 0.07 0207.1 (40.5) 01.7 0.09 00.09
Absolute T3 0204.5 (23.0) 08.0 0.37 0.30 0224.2 (51.4) 10.1 0.50 00.42
Load T4 0216.2 (17.7) 14.2 0.66 0.29 0234.8 (49.7) 15.3 0.76 00.26
CMJ T1 0971.4 (147.6) - - - 0959.1 (189.4) - - -
Power (W) T2 0994.3 (123.3) 02.4 0.14 0.14 0973.8 (181.2) 1.5 0.09 0.09
Relative T3 1018.8 (139.4) 04.9 0.28 0.15 0985.6 (218.0) 2.8 0.16 0.07
Load T4 1067.9 (181.1) 09.9 0.57 0.29 1019.3 (238.2) 6.3 0.36 0.20
CMJ T1 0971.4 (147.6) - - - 0959.1 (189.4) - - -
Power (W) T2 0989.7 (111.0) 01.9 0.11 0.11 0965.9 (175.8) 0.7 0.04 0.04
Absolute T3 1031.0 (109.1) 06.1 0.35 0.25 0991.0 (216.8) 3.3 0.19 0.15
Load T4 1091.2 (128.2) 12.3 0.71 0.36 1052.8 (224.2) 9.8 0.56 0.37
∆ denotes change from T1, ^ denotes change from preceding test.
(iii) Barbell Height
When relative loads were used, maximum height that the barbell was
thrown occurred at T1 with minimum height recorded at T4 for both the BPT and
CMJ (Figure 6.7). This was similar to the results reported in the previous study.
No significant group-by-test interactions for either the height of throw (F3, 42 =
0.417, p = 0.741) or the height of jump (F3, 42 = 0.198, p = 0.897), nor significant
between-group effects (height of throw: F1, 14 = 1.261, p = 0.280; height of jump:
F1, 14 = 0.062, p = 0.808) were found. The main effect for test however, was
significant (height of throw: F3, 42 = 16.675, p = 0.0005; height of jump: F3, 42 =
5.635, p = 0.002). When data from both LP and UP groups were pooled,
significant decrements in height thrown and jumped were recorded (Figure 6.7).
For height of throw, T1 (mean = 0.646 m, C.I. = 0.567 – 0.725 m) was
significantly greater than T2 (mean = 0.628 m, C.I. = 0.540 – 0.716 m), T3
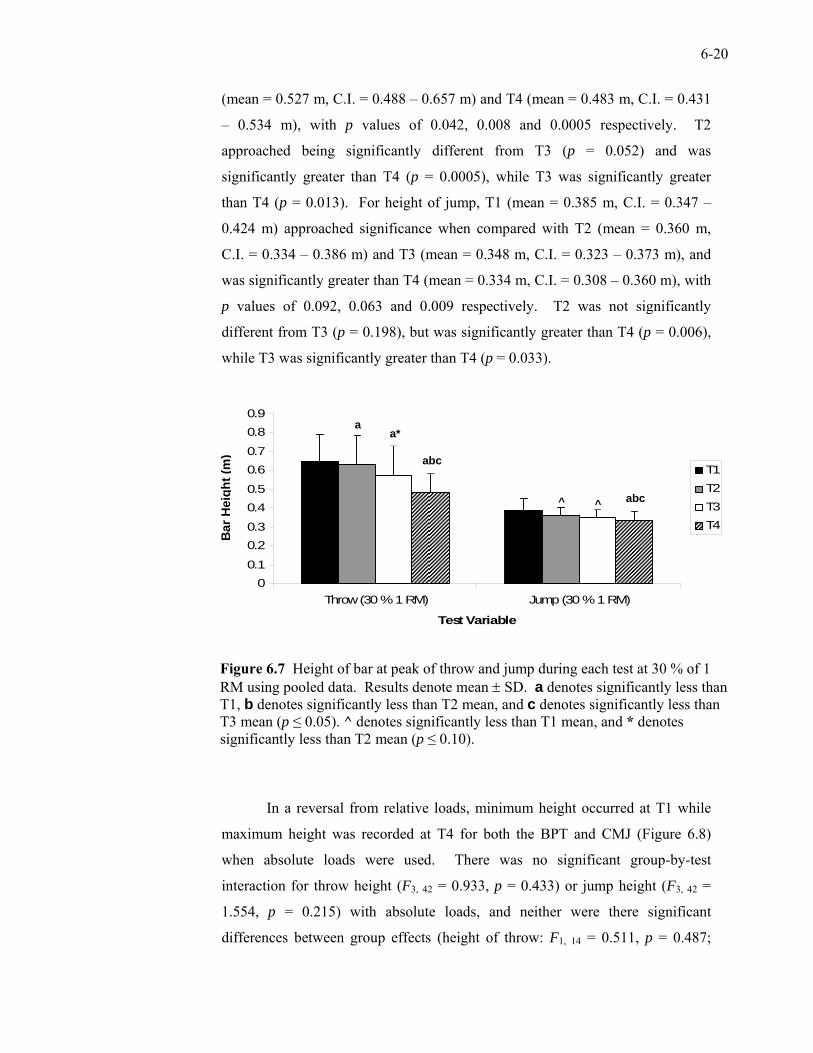
6-20
(mean = 0.527 m, C.I. = 0.488 – 0.657 m) and T4 (mean = 0.483 m, C.I. = 0.431
– 0.534 m), with p values of 0.042, 0.008 and 0.0005 respectively. T2
approached being significantly different from T3 (p = 0.052) and was
significantly greater than T4 (p = 0.0005), while T3 was significantly greater
than T4 (p = 0.013). For height of jump, T1 (mean = 0.385 m, C.I. = 0.347 –
0.424 m) approached significance when compared with T2 (mean = 0.360 m,
C.I. = 0.334 – 0.386 m) and T3 (mean = 0.348 m, C.I. = 0.323 – 0.373 m), and
was significantly greater than T4 (mean = 0.334 m, C.I. = 0.308 – 0.360 m), with
p values of 0.092, 0.063 and 0.009 respectively. T2 was not significantly
different from T3 (p = 0.198), but was significantly greater than T4 (p = 0.006),
while T3 was significantly greater than T4 (p = 0.033).
Figure 6.7 Height of bar at peak of throw and jump during each test at 30 % of 1 RM using pooled data. Results denote mean ± SD. a denotes significantly less than T1, b denotes significantly less than T2 mean, and c denotes significantly less than T3 mean (p ≤ 0.05). ^ denotes significantly less than T1 mean, and * denotes significantly less than T2 mean (p ≤ 0.10).
In a reversal from relative loads, minimum height occurred at T1 while
maximum height was recorded at T4 for both the BPT and CMJ (Figure 6.8)
when absolute loads were used. There was no significant group-by-test
interaction for throw height (F3, 42 = 0.933, p = 0.433) or jump height (F3, 42 =
1.554, p = 0.215) with absolute loads, and neither were there significant
differences between group effects (height of throw: F1, 14 = 0.511, p = 0.487;
00.1
0.20.3
0.40.5
0.60.7
0.80.9
Throw (30 % 1 RM) Jump (30 % 1 RM)
Test Variable
T1T2T3T4
Bar
Hei
ght (
m)
abc
abc
a* a
^ ^
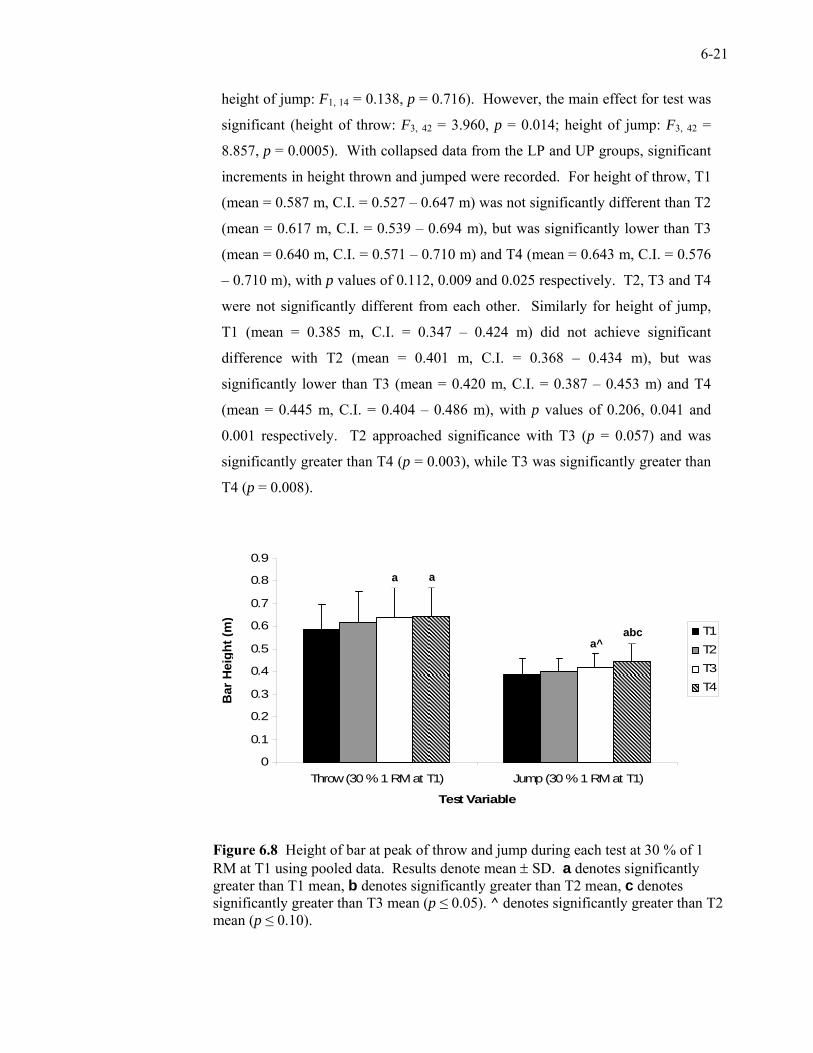
6-21
height of jump: F1, 14 = 0.138, p = 0.716). However, the main effect for test was
significant (height of throw: F3, 42 = 3.960, p = 0.014; height of jump: F3, 42 =
8.857, p = 0.0005). With collapsed data from the LP and UP groups, significant
increments in height thrown and jumped were recorded. For height of throw, T1
(mean = 0.587 m, C.I. = 0.527 – 0.647 m) was not significantly different than T2
(mean = 0.617 m, C.I. = 0.539 – 0.694 m), but was significantly lower than T3
(mean = 0.640 m, C.I. = 0.571 – 0.710 m) and T4 (mean = 0.643 m, C.I. = 0.576
– 0.710 m), with p values of 0.112, 0.009 and 0.025 respectively. T2, T3 and T4
were not significantly different from each other. Similarly for height of jump,
T1 (mean = 0.385 m, C.I. = 0.347 – 0.424 m) did not achieve significant
difference with T2 (mean = 0.401 m, C.I. = 0.368 – 0.434 m), but was
significantly lower than T3 (mean = 0.420 m, C.I. = 0.387 – 0.453 m) and T4
(mean = 0.445 m, C.I. = 0.404 – 0.486 m), with p values of 0.206, 0.041 and
0.001 respectively. T2 approached significance with T3 (p = 0.057) and was
significantly greater than T4 (p = 0.003), while T3 was significantly greater than
T4 (p = 0.008).
Figure 6.8 Height of bar at peak of throw and jump during each test at 30 % of 1 RM at T1 using pooled data. Results denote mean ± SD. a denotes significantly greater than T1 mean, b denotes significantly greater than T2 mean, c denotes significantly greater than T3 mean (p ≤ 0.05). ^ denotes significantly greater than T2 mean (p ≤ 0.10).
0
0.1
0.2
0.3
0.4
0.5
0.6
0.7
0.8
0.9
Throw (30 % 1 RM at T1) Jump (30 % 1 RM at T1)
Test Variable
T1T2T3T4
Bar
Hei
ght (
m)
abc a^
aa
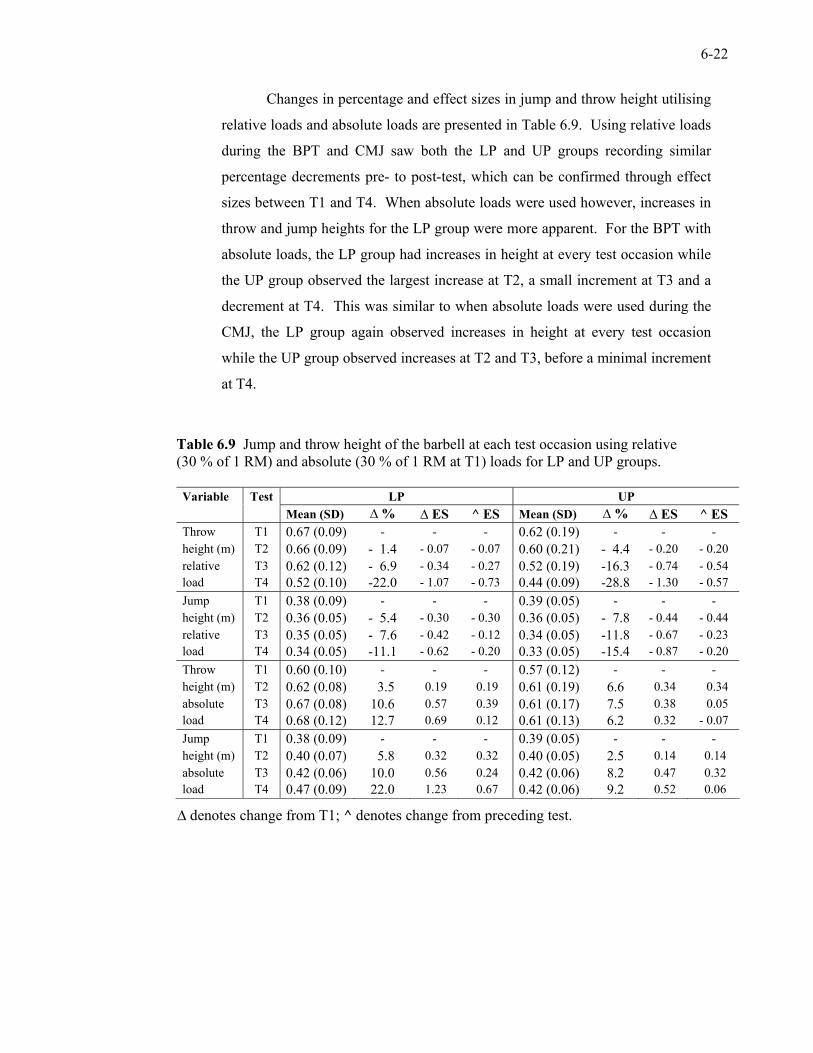
6-22
Changes in percentage and effect sizes in jump and throw height utilising
relative loads and absolute loads are presented in Table 6.9. Using relative loads
during the BPT and CMJ saw both the LP and UP groups recording similar
percentage decrements pre- to post-test, which can be confirmed through effect
sizes between T1 and T4. When absolute loads were used however, increases in
throw and jump heights for the LP group were more apparent. For the BPT with
absolute loads, the LP group had increases in height at every test occasion while
the UP group observed the largest increase at T2, a small increment at T3 and a
decrement at T4. This was similar to when absolute loads were used during the
CMJ, the LP group again observed increases in height at every test occasion
while the UP group observed increases at T2 and T3, before a minimal increment
at T4.
Table 6.9 Jump and throw height of the barbell at each test occasion using relative (30 % of 1 RM) and absolute (30 % of 1 RM at T1) loads for LP and UP groups. Variable Test LP UP Mean (SD) ∆ % ∆ ES ^ ES Mean (SD) ∆ % ∆ ES ^ ES Throw T1 0.67 (0.09) - - - 0.62 (0.19) - - - height (m) T2 0.66 (0.09) -01.4 - 0.07 - 0.07 0.60 (0.21) -04.4 - 0.20 - 0.20 relative T3 0.62 (0.12) -06.9 - 0.34 - 0.27 0.52 (0.19) -16.3 - 0.74 - 0.54 load T4 0.52 (0.10) -22.0 - 1.07 - 0.73 0.44 (0.09) -28.8 - 1.30 - 0.57 Jump T1 0.38 (0.09) - - - 0.39 (0.05) - - - height (m) T2 0.36 (0.05) -05.4 - 0.30 - 0.30 0.36 (0.05) -07.8 - 0.44 - 0.44 relative T3 0.35 (0.05) -07.6 - 0.42 - 0.12 0.34 (0.05) -11.8 - 0.67 - 0.23 load T4 0.34 (0.05) -11.1 - 0.62 - 0.20 0.33 (0.05) -15.4 - 0.87 - 0.20 Throw T1 0.60 (0.10) - - - 0.57 (0.12) - - - height (m) T2 0.62 (0.08) 03.5 0.19 0.19 0.61 (0.19) 6.6 0.34 - 0.34 absolute T3 0.67 (0.08) 10.6 0.57 0.39 0.61 (0.17) 7.5 0.38 - 0.05 load T4 0.68 (0.12) 12.7 0.69 0.12 0.61 (0.13) 6.2 0.32 - 0.07 Jump T1 0.38 (0.09) - - - 0.39 (0.05) - - - height (m) T2 0.40 (0.07) 05.8 0.32 0.32 0.40 (0.05) 2.5 0.14 0.14 absolute T3 0.42 (0.06) 10.0 0.56 0.24 0.42 (0.06) 8.2 0.47 0.32 load T4 0.47 (0.09) 22.0 1.23 0.67 0.42 (0.06) 9.2 0.52 0.06
∆ denotes change from T1; ^ denotes change from preceding test.
6-23
6.6.7 5 x 6-s Cycle Test
Three variables from the 5 x 6-s cycle test - total work done, average
peak power (average peak power scores across the five sprint trials) and power
produced during the first 6-s sprint - were statistically analysed. No significant
group x test interactions were observed for any of the three variables (total work:
F3, 42 = 0.292, p = 0.831; average peak power: F3, 42 = 0.164, p = 0.920; power at
1st sprint: F3, 42 = 0.884, p = 0.457). Neither were there any between-group main
effects for any of the variables (total work: F1, 42 = 0.626, p = 0.442; average
peak power: F1, 42 = 0.697, p = 0.418; power at 1st sprint: F1, 42 = 0.392, p =
0.541). However, the main effect for test occasion was significant for all three
variables (total work: F3, 42 = 6.002, p = 0.002; average peak power: F3, 42 =
5.248, p = 0.004; power at 1st sprint: F3, 42 = 11 935, p = 0.541). When repeated
measures were performed on pooled data from both LP and UP groups, there was
significant improvement from T1 for all three variables. Total work improved
significantly from T1 (mean = 17 231 J; C.I. = 15 929 – 18 533 J) to T2 (mean =
17 893 J; C.I. = 16 364 – 19 421 J; p = 0.016), T3 (mean = 18 382 J; C.I. = 16
712 – 20 053 J; p = 0.001) and T4 (mean = 170987 J, C.I. = 16 435 – 19 539 J; p
= 0.040). T2 total work was also significantly lower than T3 (p = 0.034), but not
T4 (p = 0.761), while no significant difference was found between T3 and T4 (p
= 0.146). With pooled data from average peak power, T1 (mean = 722.0 W; C.I.
= 673.0 – 771.0 W) was significantly lower than T2 (mean = 753.5 W; C.I. =
693.6 – 813.4 W; p = 0.005) and T3 (mean = 765.5 W; C.I. = 699.2 – 831.9 W; p
= 0.003), and approached significant difference from T4 (mean = 748.0 W; C.I.
= 686.2 – 809.8 W; p = 0.100). No significant difference was observed between
T2, T3 and T4. For power at 1st sprint, T1 mean (mean = 780.5 W; C.I. = 723.2
– 837.7 W) was significantly lower than T2 (mean = 826.2 W; C.I. = 756.4 –
896.0 W; p = 0.001), T3 (mean = 837.2 W; C.I. = 762.8 – 911.5 W; p = 0.001),
and T4 (mean = 826.2 W; C.I. = 745.3 – 907.1 W; p = 0.009). Similar to average
peak power, no significant difference was observed between T2, T3 and T4. The
results for the 5 x 6-s cycle test are outlined in Table 6.10.
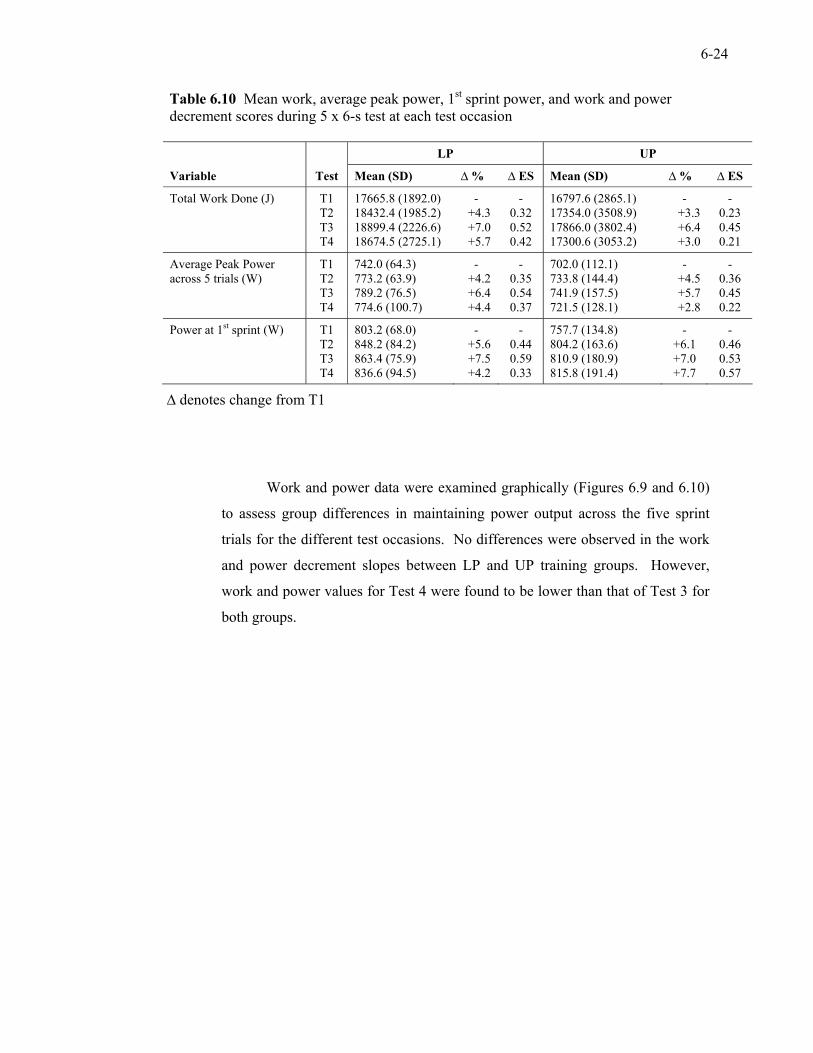
6-24
Table 6.10 Mean work, average peak power, 1st sprint power, and work and power decrement scores during 5 x 6-s test at each test occasion
LP UP
Variable Test Mean (SD) ∆ % ∆ ES Mean (SD) ∆ % ∆ ES
Total Work Done (J) T1 17665.8 (1892.0) - - 16797.6 (2865.1) - - T2 18432.4 (1985.2) 0+4.3 0.32 17354.0 (3508.9) +3.3 0.23 T3 18899.4 (2226.6) 0+7.0 0.52 17866.0 (3802.4) +6.4 0.45 T4 18674.5 (2725.1) 0+5.7 0.42 17300.6 (3053.2) +3.0 0.21
Average Peak Power T1 742.0 (64.3) - - 702.0 (112.1) - - across 5 trials (W) T2 773.2 (63.9) 0+4.2 0.35 733.8 (144.4) +4.5 0.36 T3 789.2 (76.5) 0+6.4 0.54 741.9 (157.5) +5.7 0.45 T4 774.6 (100.7) 0+4.4 0.37 721.5 (128.1) +2.8 0.22
Power at 1st sprint (W) T1 803.2 (68.0) - - 757.7 (134.8) - - T2 848.2 (84.2) 0+5.6 0.44 804.2 (163.6) +6.1 0.46 T3 863.4 (75.9) 0+7.5 0.59 810.9 (180.9) +7.0 0.53 T4 836.6 (94.5) 0+4.2 0.33 815.8 (191.4) +7.7 0.57
∆ denotes change from T1
Work and power data were examined graphically (Figures 6.9 and 6.10)
to assess group differences in maintaining power output across the five sprint
trials for the different test occasions. No differences were observed in the work
and power decrement slopes between LP and UP training groups. However,
work and power values for Test 4 were found to be lower than that of Test 3 for
both groups.
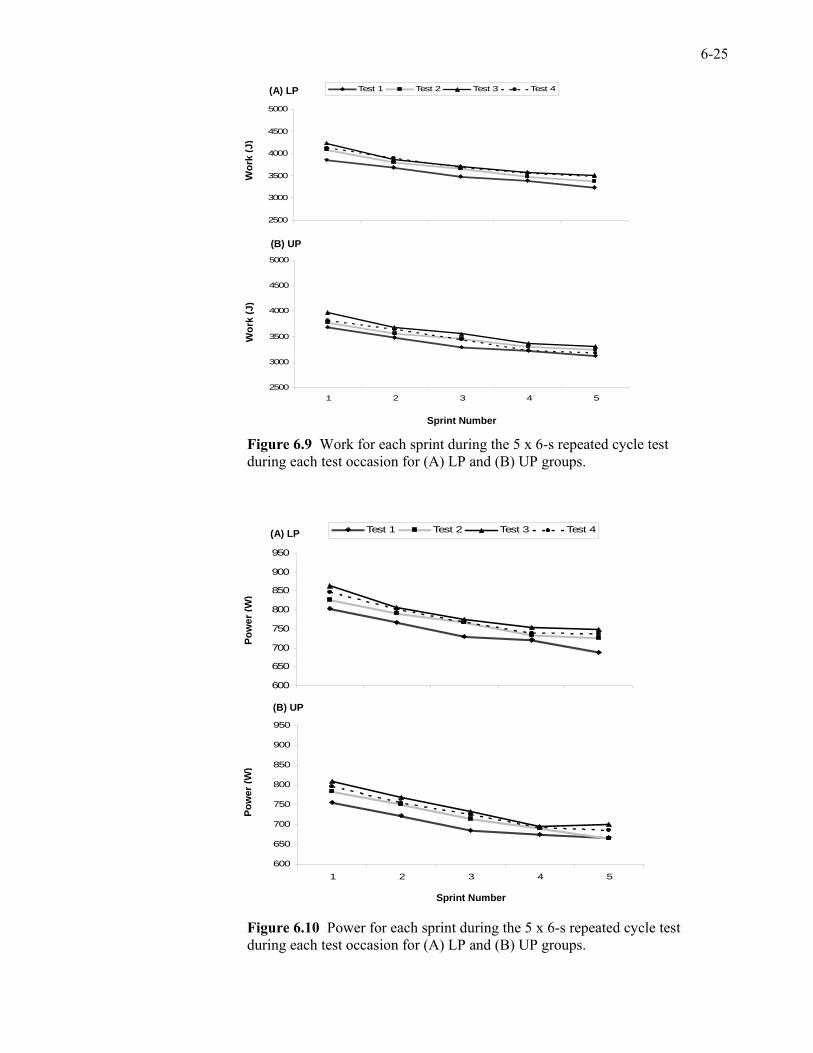
6-25
Figure 6.9 Work for each sprint during the 5 x 6-s repeated cycle test during each test occasion for (A) LP and (B) UP groups.
Figure 6.10 Power for each sprint during the 5 x 6-s repeated cycle test during each test occasion for (A) LP and (B) UP groups.
2500
3000
3500
4000
4500
5000
1 2 3 4 5
Test 1 Test 2 Test 3 Test 4
2500
3000
3500
4000
4500
5000
1 2 3 4 5
Wor
k (J
) W
ork
(J)
Sprint Number
(A) LP
(B) UP
600
650
700
750
800
850
900
950
1 2 3 4 5
Test 1 Test 2 Test 3 Test 4
600
650
700
750
800
850
900
950
1 2 3 4 5
Pow
er (W
) Po
wer
(W)
Sprint Number
(A) LP
(B) UP
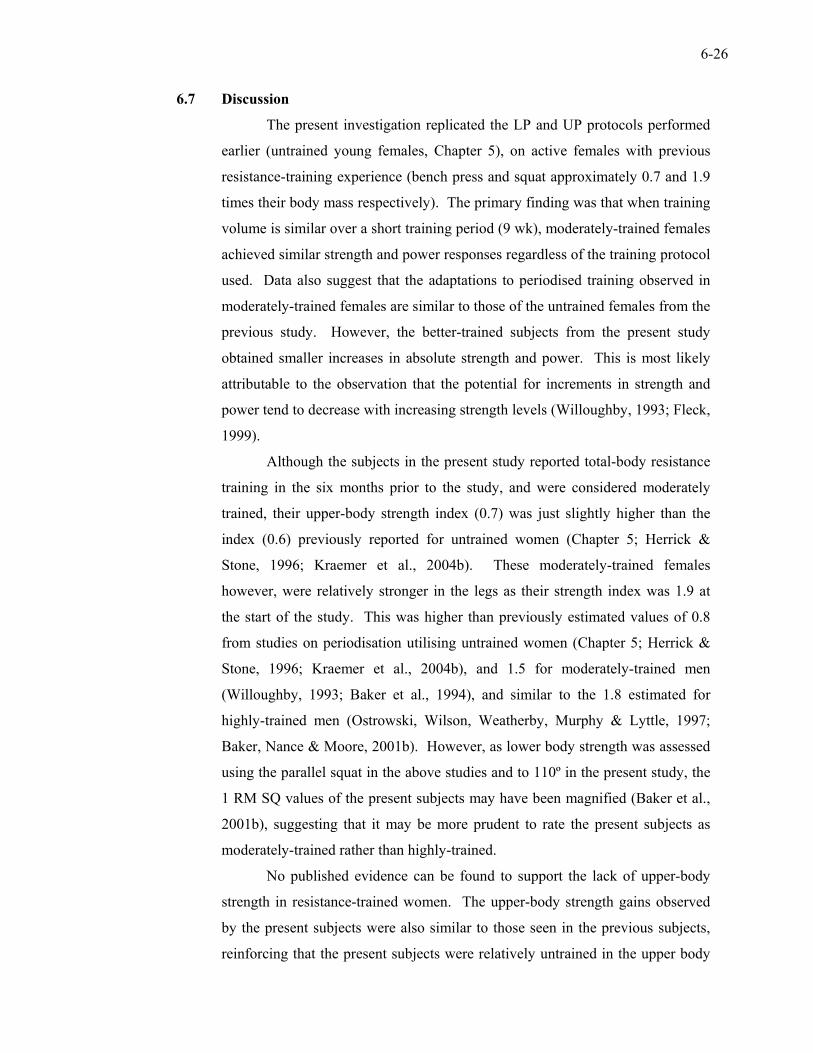
6-26
6.7 Discussion
The present investigation replicated the LP and UP protocols performed
earlier (untrained young females, Chapter 5), on active females with previous
resistance-training experience (bench press and squat approximately 0.7 and 1.9
times their body mass respectively). The primary finding was that when training
volume is similar over a short training period (9 wk), moderately-trained females
achieved similar strength and power responses regardless of the training protocol
used. Data also suggest that the adaptations to periodised training observed in
moderately-trained females are similar to those of the untrained females from the
previous study. However, the better-trained subjects from the present study
obtained smaller increases in absolute strength and power. This is most likely
attributable to the observation that the potential for increments in strength and
power tend to decrease with increasing strength levels (Willoughby, 1993; Fleck,
1999).
Although the subjects in the present study reported total-body resistance
training in the six months prior to the study, and were considered moderately
trained, their upper-body strength index (0.7) was just slightly higher than the
index (0.6) previously reported for untrained women (Chapter 5; Herrick &
Stone, 1996; Kraemer et al., 2004b). These moderately-trained females
however, were relatively stronger in the legs as their strength index was 1.9 at
the start of the study. This was higher than previously estimated values of 0.8
from studies on periodisation utilising untrained women (Chapter 5; Herrick &
Stone, 1996; Kraemer et al., 2004b), and 1.5 for moderately-trained men
(Willoughby, 1993; Baker et al., 1994), and similar to the 1.8 estimated for
highly-trained men (Ostrowski, Wilson, Weatherby, Murphy & Lyttle, 1997;
Baker, Nance & Moore, 2001b). However, as lower body strength was assessed
using the parallel squat in the above studies and to 110º in the present study, the
1 RM SQ values of the present subjects may have been magnified (Baker et al.,
2001b), suggesting that it may be more prudent to rate the present subjects as
moderately-trained rather than highly-trained.
No published evidence can be found to support the lack of upper-body
strength in resistance-trained women. The upper-body strength gains observed
by the present subjects were also similar to those seen in the previous subjects,
reinforcing that the present subjects were relatively untrained in the upper body
6-27
when compared with the indices of 1.0 - 1.2 reported for moderately-trained men
(Willoughby, 1993; Baker et al., 1994; Ostrowski et al., 1997; Rhea et al., 2002),
and 1.4 reported for highly-trained men (Baker, Nance & Moore, 2001a).
However, it may be that moderately-trained women have lower BP strength
indices than their male counterparts. Possible reasons could be that trained
women find it more difficult to continually improve their upper-body strength
after about 4-6 months training (Kraemer et al., 2003), or that they have less
muscle mass distributed to the upper body compared with men (Nindl, Harman
Marx et al., 2000). Anecdotal evidence also suggests that the female subjects
tend to train less on the upper body as they fear that observable hypertrophic
responses (such as muscular arms and legs) would make them less feminine
(Fleck & Kraemer, 1997).
As in the previous study, the total number of sets and repetitions were
equated between the LP and UP training programmes at the end of training.
Similar training volumes were performed by both the LP and UP groups and the
results indicated similar gains for all the variables tested. Thus, it seems more
likely that it is higher volume/workload (Stowers et al., 1983; Baker et al., 1994;
Schiotz et al., 1998), rather than the manipulation of volume and intensity
(O’Bryant et al., 1988; Kraemer, 1997; Marx, Ratamess, Nindl et al., 2001), that
improved strength and power through periodised training. However, previous
studies (Stone et al., 1981; O’Bryant et al., 1988; Willoughby, 1993; Baker et al.,
1994; Herrick & Stone, 1996; Schiotz et al., 1998) utilised higher percentages of
1 RM during the LP power-training phase compared with the lower percentages
(30 – 40 %) utilised here. This did not reduce the training volume (total
repetitions x mass lifted) performed by the present subjects as overall volume in
this study was much higher (31.7 % overall) than that performed by the
untrained female subjects from the previous study. As training volume was
based on the 1 RM scores, the stronger subjects in this study obtained higher 1
RM scores at each test occasion, resulting in higher overall training volumes.
Closer inspection of the data indicates that the subjects in the present study had
higher 1 RM SQ scores compared with the subjects from the previous study,
while the 1 RM BP scores were similar. Consequently, higher lower-body
training volumes were performed by the present subjects compared with the
subjects from the previous study (11.8 % difference), while upper-body training
6-28
volumes were similar for subjects from both studies (2.1 % difference). This
implies that the difference in training volume between the subjects of the two
studies was mainly due to the greater lower-body strength of the subjects in the
present study.
Consistent with previous resistance-training studies over a mesocycle,
there was no significant interaction or main effects for group for changes in body
mass (Stone et al. 1981; Stone et al. 1982; Stowers et al., 1983). Both LP and
UP groups however, increased body mass significantly at T3 and T4. This
increase in body mass is likely to be linked to hypertrophic responses of muscle
as both modes of measurement (girth and muscle CSA) used to estimate
hypertrophic response to periodised training in this study showed significant
improvement. However, pilot work by this investigator and previous work by
Bemben (2002) suggest that ultrasound images of the rectus femoris are more
sensitive and reliable than girth measurements. This is supported by the
observation that significant group-by-test interactions were found for the
analyses of muscle CSA images, but not girth measurements. In addition to this,
mid-thigh girths suggested that the LP group had better increments at the end of
training, while lower one-third thigh girths indicated that the UP group
performed better. A comparison between rectus femoris muscle CSA and lower
⅓ thigh girth measurements showed no similarities between the trends in
percentage changes although both measures were assessed at a similar location
on the same limb (Tables 6.4 and 6.5). This inconsistency is often associated
with anthropometric measures such as girth.
Rhea et al. (2002) performed a similar LP-UP comparison on trained men
and also found no differences in hypertrophic responses estimated from mid-
thigh circumferences and body-fat percentages (determined through the Bod
Pod) between the two groups. Analysis of muscle CSA in the present study
however, indicated that there were significant differences in hypertrophic
responses for both groups. The LP programme emphasised training for
hypertrophy throughout the first 3-wk phase, and improvements in muscle CSA
were significant during that specific phase, with decrements recorded in the
subsequent phases. The UP programme performed only one session of
hypertrophy training a week throughout the entire training period, but achieved
larger muscle CSA increments (12.8 % versus 6.8 %, ES = 0.78 versus 0.43)
6-29
than the LP group throughout the training period. It appears that the moderately-
trained women in the present study improved their muscle CSA more effectively
on one session of hypertrophy a week across a training period compared with
training specifically for hypertrophy over a 3-wk training phase followed by
strength and power training. It is apparent that muscle CSA changes in the
present study mirrored the changes in training volume as estimated through work
done (Stone et al. 1981; Stowers et al., 1983; Stone et al., 2000). Although the
LP group from the previous study demonstrated a similar trend of muscle CSA
changes (highest after hypertrophy training before decreasing improvements),
the increments in percentage and effect sizes were similar to those observed in
the UP group of that study. It may be that as the female subjects in the previous
study were untrained, they may have responded favourably to any training
protocol (Hakkinen and Komi, 1985a). However, for females who are better
trained, such as those in the present study, the decrease in training volume for the
LP group during maximal strength and power training may have increased the
likelihood for loss in muscle hypertrophy, and possibly reduced the potential for
continued gains in strength and power (Baker et al., 1994). Other hypertrophy-
related results of interest are: (a) muscle hypertrophy in moderately-trained
women occurred as quickly as the untrained women in the previous study,
although the magnitude was slightly lower in the present study; (b) muscle
hypertrophy also occurred much quicker than in earlier studies utilising female
subjects (Chilibeck, Calder, Sale & Webber, 1998; Kraemer, Nindl, Ratamess et
al., 2004a) which may be attributed to the lower training frequency (Kraemer &
Ratamess, 2004) or the concurrent performance of aerobic endurance training
(Leveritt, Abernethy, Barry & Logan, 1999; Sporer & Wenger, 2003) performed
in these previous studies.
Despite differences in changes in muscle CSA, the improvements in BP
and SQ 1 RM were statistically similar between groups following the 3-wk
pretraining conditioning and the 9-wk training cycle. Observations of
percentages and effect sizes reinforce the similarities between this study and the
previous study on untrained women (Chapter 5), which found no differences
between the periodised protocols for improving maximal strength in female
subjects, leaving individual preference to be the deciding factor. These results
however, contrast with the results of Rhea et al. (2002) who utilised similar
6-30
protocols on experienced males, and found UP more effective, but agree with
Baker et al. (1994) who found no difference between the protocols for trained
men. It has also been suggested that moderately-trained individuals (male) may
find strength increments more difficult to achieve compared with untrained
individuals (Ostrowski, et al., 1997). In spite of this, the subjects in the present
study managed to improve upper- and lower-body strength by 23.0 % and 22.3
% respectively. These percentages are lower than those obtained by the
untrained subjects (BP: 25.1 %, SQ: 38.0 %) in Chapter 5, but agree with the
findings of Schlumberger et al. (2001) who found that strength increments were
still possible for women who were moderately-trained, probably as a result of
optimised neural adaptations. Other than neural adaptations, it may be possible
to attribute the strength increments in moderately-trained individuals to
hypertrophic responses (Baker et al., 1994) as observations of the trends of
strength development suggest that strength increments were highest in the LP
group when muscle CSA increments were highest and vice versa. This is
reinforced by the UP group attaining gradually increasing strength which
mirrored muscle CSA gains from T1 to T4. It is likely that both neural and
hypertrophic adaptations acted concurrently as the LP group obtained similar
lower-body strength increases (LP: 21.1 %, UP: 23.5 %) although the changes in
CSA (LP: 6.8 %, UP: 12.8 %) were lower than those seen in the UP group.
There is some concern however, that the decrease in muscle CSA observed in
the LP group may be detrimental to strength gains (Stone et al., 1982; Baker et
al., 1994). Unexpectedly, small strength increments were obtained by the LP
group during Phase III (BP: 6.7 %; SQ: 4.8 %) when training volume and
intensity was at its lowest. The same phenomenon was observed in untrained
women (Chapter 5) and men (Moss, Refnes, Abildgaard, Nicolaysen & Jensen,
1997; Jones, Bishop, Hunter & Fleisig, 2001), and reinforces that low intensity
and volume through a short training phase can produce strength gains. Moss et
al. (1997) proposed that repeated lifting of light loads with sufficient
acceleration could produce high tension, recruit high threshold units and
facilitate strength gains. Even though the benefits of this include the relief of
training stress through lighter training, while still maintaining some strength
gains, it is not advisable to perform light-load training for long periods of time as
strength and power performances may decline (Baker et al., 1994).
6-31
The average mechanical power output results of this study suggest that
significant power output increments from pre-test to post-test were produced
through relative and absolute loads by both the LP and UP groups, despite
traditional power training that did not project the barbell or weight implement. It
has been reported that this action would decrease power (Elliott, Wilson & Kerr,
1989; Newton, Kraemer, Hakkinen, Humphries & Murphy, 1996), but as the
difference between projected and non-projected movements has been estimated
to be only 5.8 % (Cronin, McNair & Marshall, 2001), it is not viable to discard
traditional movements as they can be performed with most resistance-training
equipment. Power development observed in moderately-trained women was
found to be similar to that observed in untrained women (Chapter 5), with
increments in both training groups mirroring maximal strength improvement.
However, while power in untrained women also seems to be influenced by
changes in muscle CSA, the same could not be said for moderately-trained
women. In moderately-trained women, power increments were apparent even
when muscle CSA increments were smallest during light-load power training.
The magnitude of the training effect during this light-load phase was similar to
that observed after maximal strength training. It is possible that it was the
intention to perform the exercises forcefully and explosively that increased
movement velocity (Behm & Sale, 1993; Cronin et al., 2001), or faster
contraction velocities from the explosive training (Newton & Kraemer, 1994)
that improved power production. Baker (2001b) has suggested that trained
individuals who have attained their strength base may direct further development
towards other aspects such as velocity, which may influence power development
more than strength. Investigation into changes in velocity in the present study
did not offer any supporting evidence for this premise. Therefore, the
implication is that for women who have had previous strength training,
mechanical power production may be less dependent upon hypertrophic
responses than strength.
Little data exists for comparison of average mechanical power produced
during the BPT and CMJ in moderately-trained women. Previous studies
utilised active but untrained females (Chapter 5) or measured peak power instead
of average power (Kraemer et al., 2004b), while Baker et al. (2001a, 2001b)
measured average power but utilised power-trained males. Therefore,
6-32
comparisons with the subjects from the previous study seem the most suitable.
As the subjects in the present study were stronger in the lower body than the
untrained subjects from the previous study, the relative loads that were used
during CMJ were consequently also heavier. Mean relative loads utilised for the
BPT and CMJ by the present subjects were 2.3 % and 10.5 % higher respectively
than the mean relative loads utilised by the untrained subjects from the previous
study. The relative loads utilised for BPT were similar to those used by the
untrained subjects, therefore it was not surprising that the average mechanical
power output produced using relative loads were similar to that produced by
relative loads in the previous study. The similarity in power output was
observed even when absolute loads were used possibly because the 13-kg load
used represented similar percentages of 1 RM BP for the untrained subjects as
the absolute loads used in this study. As the upper body was less trained than the
lower body, the present subjects obtained larger increments in BPT power output
compared with CMJ power output. However, in spite of jumping with heavier
relative loads, moderately-trained women were able to produce average
mechanical power outputs that were similar to those produced by untrained
women. When absolute loads were compared across studies, the 22-kg load
represented only 63.9 % of the absolute loads used during the CMJ in this study.
As the 22-kg load was not used in this study (the barbell hit maximal height for
most subjects), it can only be speculated that the present subjects would produce
higher power outputs than the untrained subjects if the same absolute load was
used.
As in Chapter 5, maximal barbell heights achieved during the BPT and
CMJ were used to assess the effects of LP and UP training on functional
performances such as throwing and jumping. Barbell heights decreased across
test occasions when relative loads were used as these loads increased along with
maximal strength. Absolute loads (30 % of 1 RM at T1) represented decreasing
percentages of improved 1 RM scores at each test occasion, and therefore
resulted in increasing barbell heights as power improved. This occurrence was
also observed for untrained women (Chapter 5). Only one other study examined
height of throw and jump during BPT and CMJ on the PPS (Ostrowski et al.,
1997), but this study had male subjects of superior upper- and lower-body
strength, and a barbell load of 20 kg was used, making comparisons tenuous.
6-33
Comparing the present study with the previous (Chapter 5) indicates that the
present subjects achieved greater mean throw heights, but lower jump heights,
regardless of whether relative or absolute loads were used. While the present
subjects had slightly higher throw heights than the previous subjects, the average
power output was similar. As for height of jump, the present subjects obtained
lower means as both relative and absolute loads were much higher than those of
the previous subjects, but the average power output was similar. Thus, it would
seem that barbell height is not able to estimate throw and jump performances
during the BPT and CMJ. It has been speculated that an optimum combination
of force and velocity applied to an optimum load (Chapter 4; Wilson, Newton,
Murphy & Humphries, 1993) would result in optimum power outputs. It is
possible that this optimum combination does not require maximal barbell
throw/jump heights.
Some studies have demonstrated that periodised resistance training can
increase cycle ergometer power output (Christian & Seymour, 1985; O’Bryant et
al., 1988; McGee et al., 1992). These were longer duration tests involving a 50-s
all-out cycle or cycle to exhaustion. Two studies (Kraemer, Ratamess, Fry et al.,
2000; Marx et al., 2001) used the Wingate cycle ergometer to assess lower-body
anaerobic power after periodised training on untrained females, but only one
study on periodisation has used the 5 x 6-s test on untrained women to assess
their ability to repeat sprint efforts and recover quickly (Chapter 5). The results
suggest that the moderately-trained women produced cycle ergometer
performances that were similar to the untrained women from the previous study.
Both groups improved total work, average peak power and 1st sprint power pre-
to post-test. It appears that the periodised protocols improved muscle contraction
velocity that in turn, improved power performance (Newton & Kraemer, 1994),
leading to better cycle ergometer performance. O’Bryant et al. (1988) had linked
improved cycle ergometer performance after periodised training to a reduction of
motor units required, thereby creating a greater motor unit reserve. However,
this statement seems inaccurate as maximal effort cycling is more likely
produced through increased force and power output. The lack of difference
between the groups in the present study is consistent with other studies that have
demonstrated that assessment of movements utilised during training need to be
specific to the muscle action and the velocity at which it is performed (Wilson,
6-34
Murphy & Walshe, 1996; Bishop, Jenkins, Mackinnon, McEniery & Carey,
1999).
6.8 Conclusion
A comparison of LP and UP on moderately-trained women who have had
previous resistance training experience suggests that both programmes were
equally successful in improving strength qualities, although the increments were
lower than those previously observed in untrained women. This differed from
the single previous research conducted with moderately-trained men that found
UP to be superior. The moderately-trained women in the present study were
stronger per kg body mass, and were able to produce similar amounts of power
with heavier loads compared with the untrained women (Chapter 5). However,
these moderately-trained women appeared to be less strong in the upper body
compared with the lower body, reinforcing the need to plan training according to
specific muscle groups. Non-projected, light-load, explosive traditional power
training was found to be effective in improving strength and explosive power,
and may be important in reducing training stress that has been associated with
high volume and intensity training. However, the duration that light-load
training can be performed without jeopardising hypertrophic and strength
responses needs to be determined. Training volumes (total repetitions x mass
lifted) for the LP and UP groups affected muscle CSA differently, but similar
gains were observed at the end of training. In addition to that, hypertrophic
responses occurred earlier than previously reported. It appears that repeated-
sprint cycle tests are not sensitive to changes in power performance after
periodised strength/power training. A more suitable anaerobic capacity
assessment may be a repeated jump test as it is more specific to the training
protocols utilised. It is apparent that more comparative studies on the two
programmes are needed with trained females and males, and older females and
males. This may provide data on whether women need different periodisation
strategies to achieve optimal strength-power responses. It may also be important
to compare the rate of change in the measured strength qualities if the duration of
the periodised programmes was longer. The protocols could also be modified to
examine the effects of periodisation on the maintenance of strength qualities.
7-1
CHAPTER 7. COMPARING PERIODISED PROTOCOLS FOR THE MAINTENANCE OF STRENGTH AND POWER IN RESISTANCE-TRAINED WOMEN
7.1 Introduction
Periodisation of resistance training organises training into phases that
systematically emphasise different strength qualities in order to help athletes
attain peak conditions prior to competition (Stone, O’Bryant & Garhammer,
1981), and to reduce staleness and overtraining (Fleck & Kraemer, 1997). These
peak levels of hypertrophy, strength, power and/or muscular endurance then need
to be maintained throughout a competition period (or in-season phase) when the
increase in technical and tactical training may lead to reduced training volumes.
A short period of maintenance training may also be performed when training
objectives prescribe a reduction of training volume or intensity, but the risk of
loss in strength, power or endurance is to be reduced. Preserving gains achieved
in earlier training phases is important as reduced training volumes may result in a
decrease in muscle mass. The loss of muscle mass may subsequently lead to a
decline in strength and power performances (Baker, Wilson & Carlyon, 1994;
Baker; 1998; Allerheiligen, 2003), which in turn, can affect sporting
performances. Studies examining in-season changes in athletes from sports such
as swimming, basketball and football have reported decrements in strength and
power during a competitive period (Neufer, Costill, Fielding, Flynn & Kirwin,
1987; Hoffman, Fry, Howard, Maresh & Kraemer, 1991b; Scheidner, Arnold,
Martin, Bell & Crocker, 1998; Legg & Burnham, 1999). The use of maintenance
training may help avert this phenomenon.
It has been suggested that maintenance training should not only maintain
the existing levels of strength and power, but also increase the strength qualities
mentioned (Wathen, Baechle & Earle, 2000). However, in the studies that have
examined maintenance training, strength and power were increased in previously
untrained subjects (Hoffman, Maresh, Armstrong & Kraemer, 1991a; Bell,
Syrotuik, Attwood & Quinney, 1993; DeRenne, Hetzler, Buxton & Ho, 1996), but
were only maintained at pre-competition levels in previously resistance-trained
subjects (Hoffman et al., 1991b; Baker, 2001b). As untrained populations tend to
show improved performances regardless of the type of training programme
7-2
(Hakkinen and Komi, 1985a), the results from untrained subjects need to be
viewed with caution. A more recent investigation however, demonstrated
promising results for maintenance training in resistance-trained football players
(Hoffman, Wendell, Cooper & Kang, 2003), contradicting earlier research that
maintenance training could only maintain strength qualities in previously-trained
males (Baker, 2001b). Thus, the discrepancy needs further investigation.
While strength and power training protocols have been well documented,
little attention has been given to protocols for the maintenance of strength
qualities. Strength and power development has usually adhered to one of two
basic models of periodisation, linear or undulating periodisation. Linear
periodisation (LP) typically begins with high volume but low intensity, and the
programme shifts to lower volume but higher intensity by the end of the training
mesocycle (Stone et al., 1981). The mesocycle is divided into phases, with one
strength component (hypertrophy, maximal strength or power) emphasised in
each phase based on the programmed intensity of training. Undulating
periodisation (UP) involves alternating high and low intensity regularly,
emphasising different strength components on a daily or weekly basis (Fleck,
1999). Most UP studies have utilised one day a week for hypertrophy, strength
and power training respectively (Newton, Hakkinen, Hakkinen et al., 2002; Rhea,
Ball, Phillips & Burkett, 2002; Kraemer, Hakkinen, Triplett-McBride et al.,
2003). These descriptions however, do not readily fit the protocols that were
utilised in the two studies that examined periodised maintenance training (Baker,
2001b; Hoffman et al., 2003).
Baker (2001b) utilised a form of UP that adjusted intensity to include the
training of hypertrophy, strength and power within a training session. Meanwhile,
Hoffman et al. (2003) compared a LP model that involved training at 80 % for
both days of training, with a UP model that consisted of training at an intensity of
70 % on one day, and 90 % on the other. Another study (Hoffman & Kang, 2003)
utilised a protocol that was similar to the LP programme of Hoffman et al. (2003),
but described the protocol as non-periodised. The LP model utilised by Hoffman
et al. (2003) however, seemed to mirror non-periodised Progressive Resistance
Exercise (PRE) as repetitions and intensity were kept consistent throughout a
training phase, rather than the normal weekly changes in volume and intensity
(Wathen et al., 2000). Another point of contention was that the experimental
7-3
groups in the study by Hoffman et al. (2003) were formed across two competition
seasons, with one group of freshman footballers adhering to LP in the first year,
and another group of freshman performing UP during the second year. Although
it was suggested by Hoffman et al. (2003) that both groups of freshman would
have similar training backgrounds and resistance training experience, it is
methodologically more accurate to compare both groups within a common
training period.
Although Hoffman et al. (2003) found LP to be more effective than UP in
eliciting strength gains during a 12-wk maintenance phase, more research is
needed on both LP and UP designs. In addition, there is only one study (Bell et
al., 1993) that has utilised female subjects in a strength maintenance study, and no
published studies can be found that have examined the effects of periodised
maintenance training on strength and power in resistance-trained women. This is
in spite of increased female participation in many sporting activities and
competitions, and emphasises the need for more studies on strength and power
maintenance in women. Therefore, following two, 9-wk resistance-training
programmes utilising either LP or UP (Chapter 6), two different models of UP
were performed twice a week and the efficacy in preserving maximal strength and
power in the same group of resistance-trained female subjects was compared.
7.2 Purpose
The purpose of the present study was to examine the effects of two UP
maintenance programmes on strength and power in a group of resistance-trained
women. The responses of various tests related to strength and power were
scrutinised after a 3-wk maintenance programme. This duration was selected as it
has been suggested that previously resistance- and power-trained males
experienced a loss in strength after approximately 2 wk of detraining (Fleck,
1994). As comparisons between training programmes are usually more effective if
training volume and intensity are equalised between groups, the design of the two
comparative programmes resulted in a similar overall training volume (repetitions
x sets x load lifted) and intensity. It was hypothesised that previously resistance-
trained women would not obtain increases in strength and power after a short
period of maintenance training. Additionally, there would be no difference
7-4
between the two UP protocols in maintaining strength qualities in previously
resistance-trained women.
7.3 Subjects
Subjects consisted of 16 females from the university population who had
at least nine months of resistance-training experience prior to the study, but who
were not competitive strength athletes. The subjects had no medical or physical
conditions that could limit their participation, and had just completed a 12-wk
periodised strength/power training programme. After the potential risks of
participating in the study were explained, all subjects gave written informed
consent, and limited their training activities to only the designated sessions of the
study. They were also asked to maintain similar dietary and activity habits
throughout the experimental period. The study had the approval of the Human
Ethics Committee of UWA. One subject pulled out due to reasons unrelated to
the study, and the remaining subjects completed 100 % of the training sessions.
Of the remaining subjects, the mean (± SD) subject characteristics for age, mass
and height are 22.2 ± 4.3 y, 64.6 ± 12.3 kg, and 168.8 ± 8.6 cm respectively.
7.4 Testing And Training Procedures
The final test of the prior resistance-training programme (Chapter 6)
served as the pre-test, with the post-test performed after three weeks of
maintenance training. As one subject pulled out before the start of the
maintenance study, the 15 remaining subjects were assigned (using the A-B-B-A
procedure in Chapter 5, Section 5.3.2) into the two training groups based on their
squat index (one-repetition maximum [1 RM] squat / body mass), and the closest
possible match for the bench press index (1 RM bench press / body mass) scores.
One group performed strength training on Monday and power training on
Thursday (daily undulating periodisation, DUP), while the other group performed
both strength and power training within the same training session (session
undulating periodisation, SUP). Training frequency was programmed at two
sessions a week, as this appears to be suitable for maintaining strength in
conditioned individuals (Fleck, 1994). Strength training was performed at 85 %
of 1 RM (Wathen et al., 2000), while power training was performed at 40 % of 1
RM (see Chapter 4) as these loads were found to be the suitable loads for
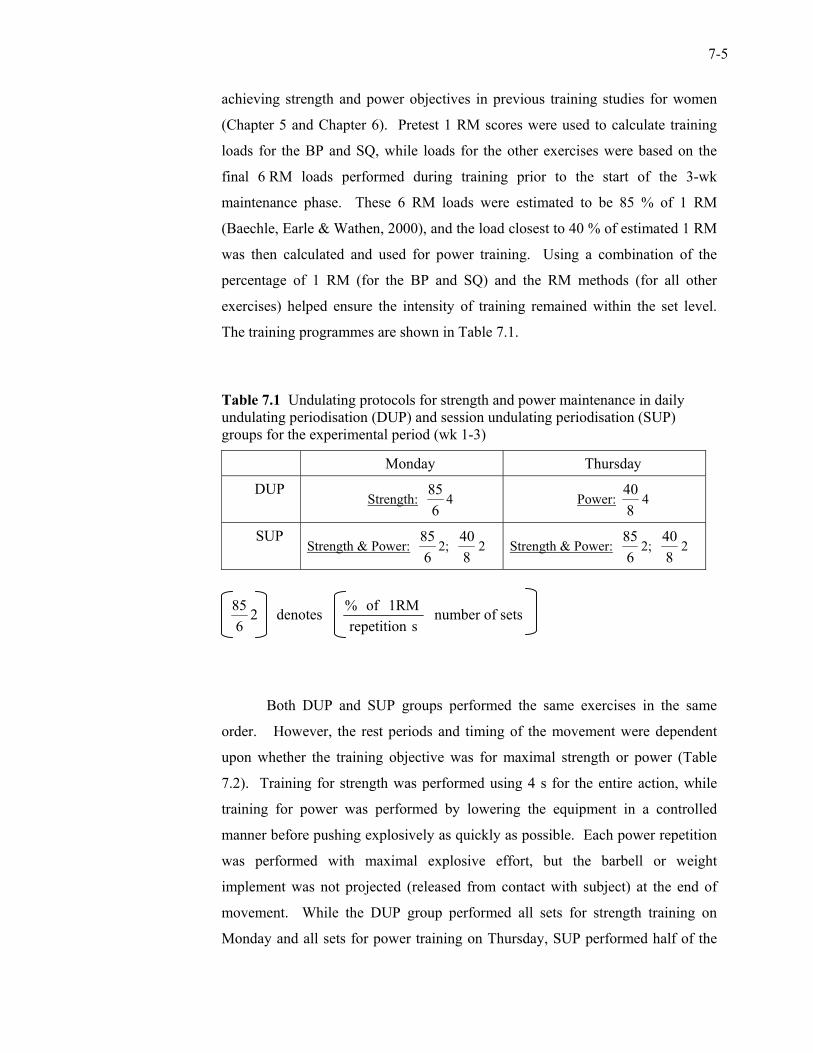
7-5
achieving strength and power objectives in previous training studies for women
(Chapter 5 and Chapter 6). Pretest 1 RM scores were used to calculate training
loads for the BP and SQ, while loads for the other exercises were based on the
final 6 RM loads performed during training prior to the start of the 3-wk
maintenance phase. These 6 RM loads were estimated to be 85 % of 1 RM
(Baechle, Earle & Wathen, 2000), and the load closest to 40 % of estimated 1 RM
was then calculated and used for power training. Using a combination of the
percentage of 1 RM (for the BP and SQ) and the RM methods (for all other
exercises) helped ensure the intensity of training remained within the set level.
The training programmes are shown in Table 7.1.
Table 7.1 Undulating protocols for strength and power maintenance in daily undulating periodisation (DUP) and session undulating periodisation (SUP) groups for the experimental period (wk 1-3)
Monday Thursday
DUP Strength:
685
4 Power: 840
4
SUP Strength & Power:
685
2; 840
2 Strength & Power: 6
852;
840
2
6
85 2 denotes srepetition
1RMof% number of sets
Both DUP and SUP groups performed the same exercises in the same
order. However, the rest periods and timing of the movement were dependent
upon whether the training objective was for maximal strength or power (Table
7.2). Training for strength was performed using 4 s for the entire action, while
training for power was performed by lowering the equipment in a controlled
manner before pushing explosively as quickly as possible. Each power repetition
was performed with maximal explosive effort, but the barbell or weight
implement was not projected (released from contact with subject) at the end of
movement. While the DUP group performed all sets for strength training on
Monday and all sets for power training on Thursday, SUP performed half of the
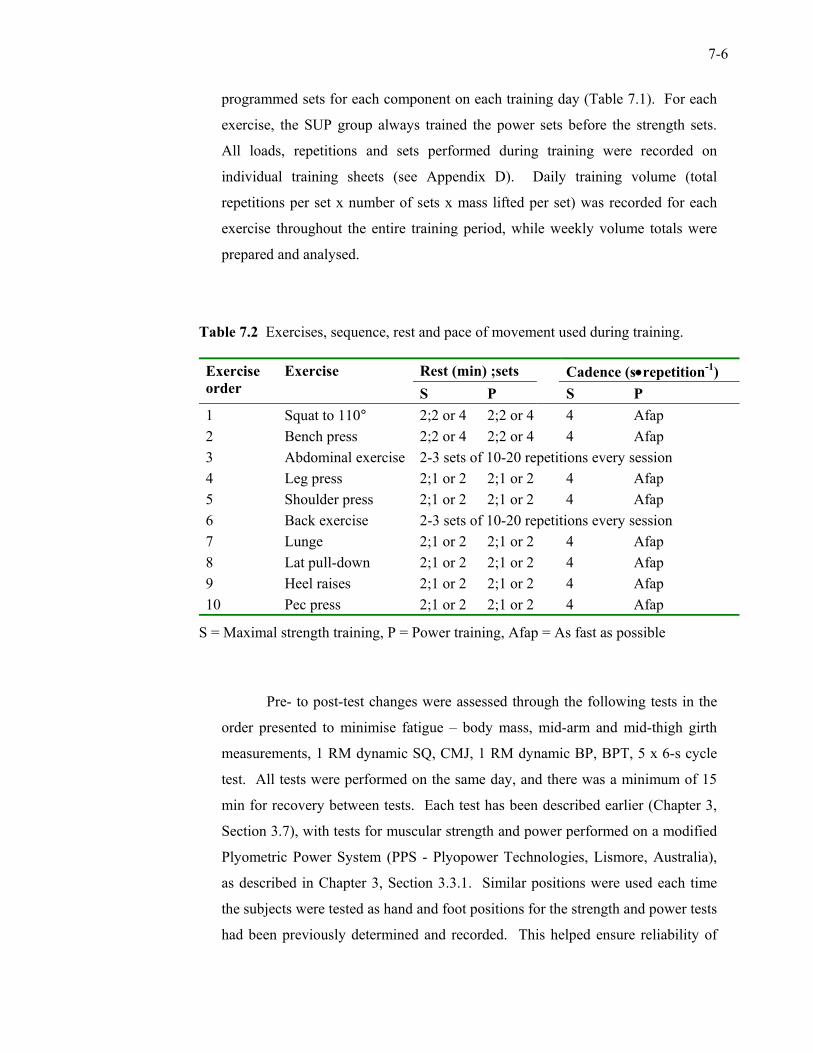
7-6
programmed sets for each component on each training day (Table 7.1). For each
exercise, the SUP group always trained the power sets before the strength sets.
All loads, repetitions and sets performed during training were recorded on
individual training sheets (see Appendix D). Daily training volume (total
repetitions per set x number of sets x mass lifted per set) was recorded for each
exercise throughout the entire training period, while weekly volume totals were
prepared and analysed.
Table 7.2 Exercises, sequence, rest and pace of movement used during training.
Rest (min) ;sets Cadence (s•repetition-1) Exercise order
Exercise S P S P
1 Squat to 110° 2;2 or 4 2;2 or 4 4 Afap 2 Bench press 2;2 or 4 2;2 or 4 4 Afap 3 Abdominal exercise 2-3 sets of 10-20 repetitions every session 4 Leg press 2;1 or 2 2;1 or 2 4 Afap 5 Shoulder press 2;1 or 2 2;1 or 2 4 Afap 6 Back exercise 2-3 sets of 10-20 repetitions every session 7 Lunge 2;1 or 2 2;1 or 2 4 Afap 8 Lat pull-down 2;1 or 2 2;1 or 2 4 Afap 9 Heel raises 2;1 or 2 2;1 or 2 4 Afap 10 Pec press 2;1 or 2 2;1 or 2 4 Afap
S = Maximal strength training, P = Power training, Afap = As fast as possible Pre- to post-test changes were assessed through the following tests in the
order presented to minimise fatigue – body mass, mid-arm and mid-thigh girth
measurements, 1 RM dynamic SQ, CMJ, 1 RM dynamic BP, BPT, 5 x 6-s cycle
test. All tests were performed on the same day, and there was a minimum of 15
min for recovery between tests. Each test has been described earlier (Chapter 3,
Section 3.7), with tests for muscular strength and power performed on a modified
Plyometric Power System (PPS - Plyopower Technologies, Lismore, Australia),
as described in Chapter 3, Section 3.3.1. Similar positions were used each time
the subjects were tested as hand and foot positions for the strength and power tests
had been previously determined and recorded. This helped ensure reliability of
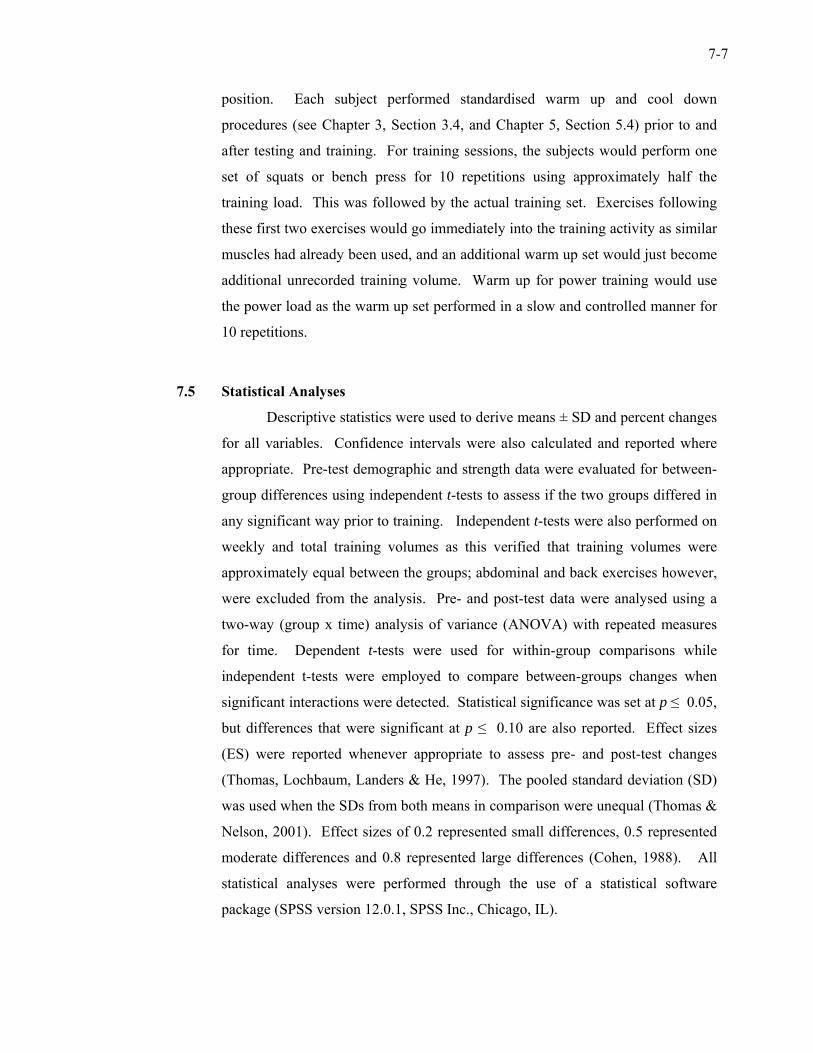
7-7
position. Each subject performed standardised warm up and cool down
procedures (see Chapter 3, Section 3.4, and Chapter 5, Section 5.4) prior to and
after testing and training. For training sessions, the subjects would perform one
set of squats or bench press for 10 repetitions using approximately half the
training load. This was followed by the actual training set. Exercises following
these first two exercises would go immediately into the training activity as similar
muscles had already been used, and an additional warm up set would just become
additional unrecorded training volume. Warm up for power training would use
the power load as the warm up set performed in a slow and controlled manner for
10 repetitions.
7.5 Statistical Analyses
Descriptive statistics were used to derive means ± SD and percent changes
for all variables. Confidence intervals were also calculated and reported where
appropriate. Pre-test demographic and strength data were evaluated for between-
group differences using independent t-tests to assess if the two groups differed in
any significant way prior to training. Independent t-tests were also performed on
weekly and total training volumes as this verified that training volumes were
approximately equal between the groups; abdominal and back exercises however,
were excluded from the analysis. Pre- and post-test data were analysed using a
two-way (group x time) analysis of variance (ANOVA) with repeated measures
for time. Dependent t-tests were used for within-group comparisons while
independent t-tests were employed to compare between-groups changes when
significant interactions were detected. Statistical significance was set at p ≤ 0.05,
but differences that were significant at p ≤ 0.10 are also reported. Effect sizes
(ES) were reported whenever appropriate to assess pre- and post-test changes
(Thomas, Lochbaum, Landers & He, 1997). The pooled standard deviation (SD)
was used when the SDs from both means in comparison were unequal (Thomas &
Nelson, 2001). Effect sizes of 0.2 represented small differences, 0.5 represented
moderate differences and 0.8 represented large differences (Cohen, 1988). All
statistical analyses were performed through the use of a statistical software
package (SPSS version 12.0.1, SPSS Inc., Chicago, IL).
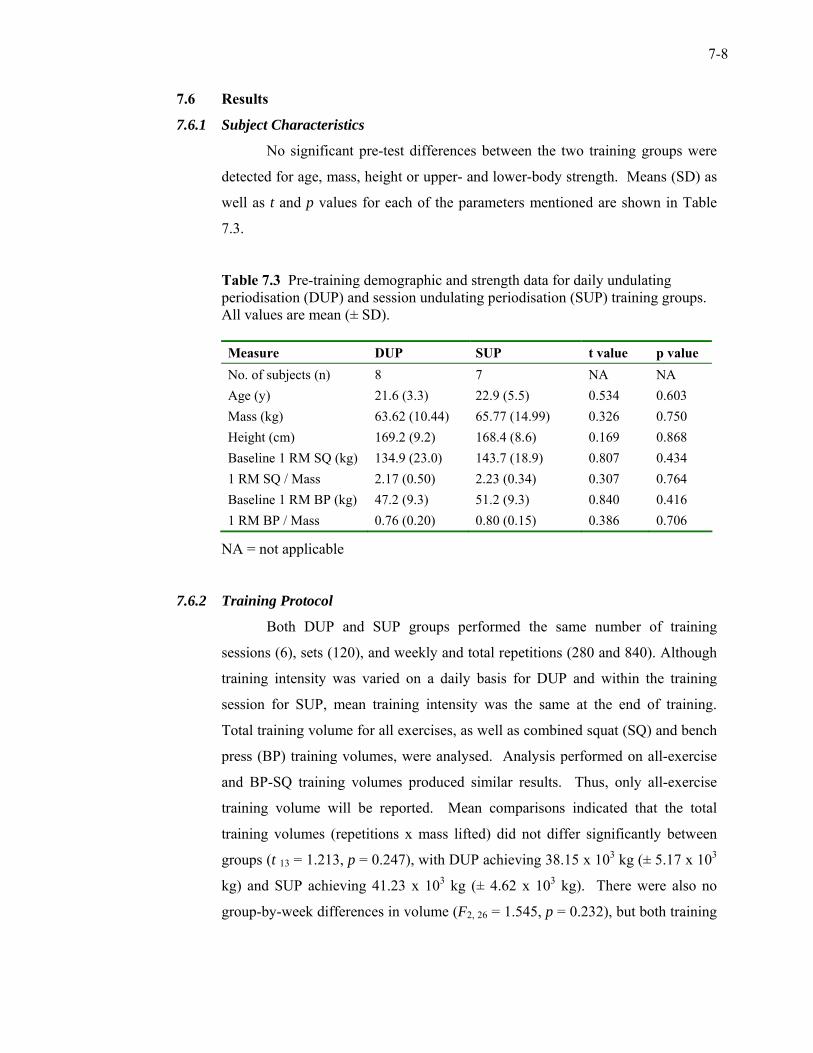
7-8
7.6 Results
7.6.1 Subject Characteristics
No significant pre-test differences between the two training groups were
detected for age, mass, height or upper- and lower-body strength. Means (SD) as
well as t and p values for each of the parameters mentioned are shown in Table
7.3.
Table 7.3 Pre-training demographic and strength data for daily undulating periodisation (DUP) and session undulating periodisation (SUP) training groups. All values are mean (± SD).
Measure DUP SUP t value p value No. of subjects (n) 8 7 NA NA Age (y) 21.6 (3.3) 22.9 (5.5) 0.534 0.603 Mass (kg) 63.62 (10.44) 65.77 (14.99) 0.326 0.750 Height (cm) 169.2 (9.2) 168.4 (8.6) 0.169 0.868 Baseline 1 RM SQ (kg) 134.9 (23.0) 143.7 (18.9) 0.807 0.434 1 RM SQ / Mass 2.17 (0.50) 2.23 (0.34) 0.307 0.764 Baseline 1 RM BP (kg) 47.2 (9.3) 51.2 (9.3) 0.840 0.416 1 RM BP / Mass 0.76 (0.20) 0.80 (0.15) 0.386 0.706
NA = not applicable 7.6.2 Training Protocol
Both DUP and SUP groups performed the same number of training
sessions (6), sets (120), and weekly and total repetitions (280 and 840). Although
training intensity was varied on a daily basis for DUP and within the training
session for SUP, mean training intensity was the same at the end of training.
Total training volume for all exercises, as well as combined squat (SQ) and bench
press (BP) training volumes, were analysed. Analysis performed on all-exercise
and BP-SQ training volumes produced similar results. Thus, only all-exercise
training volume will be reported. Mean comparisons indicated that the total
training volumes (repetitions x mass lifted) did not differ significantly between
groups (t 13 = 1.213, p = 0.247), with DUP achieving 38.15 x 10³ kg (± 5.17 x 10³
kg) and SUP achieving 41.23 x 10³ kg (± 4.62 x 10³ kg). There were also no
group-by-week differences in volume (F2, 26 = 1.545, p = 0.232), but both training
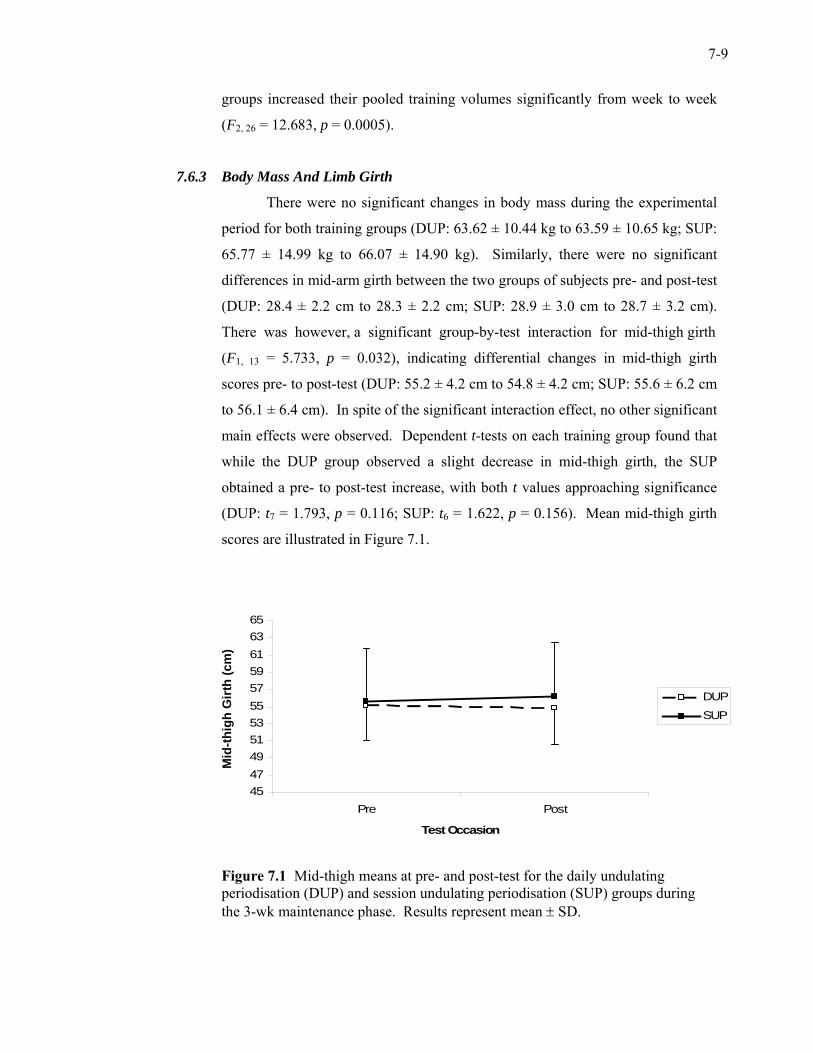
7-9
groups increased their pooled training volumes significantly from week to week
(F2, 26 = 12.683, p = 0.0005).
7.6.3 Body Mass And Limb Girth
There were no significant changes in body mass during the experimental
period for both training groups (DUP: 63.62 ± 10.44 kg to 63.59 ± 10.65 kg; SUP:
65.77 ± 14.99 kg to 66.07 ± 14.90 kg). Similarly, there were no significant
differences in mid-arm girth between the two groups of subjects pre- and post-test
(DUP: 28.4 ± 2.2 cm to 28.3 ± 2.2 cm; SUP: 28.9 ± 3.0 cm to 28.7 ± 3.2 cm).
There was however, a significant group-by-test interaction for mid-thigh girth
(F1, 13 = 5.733, p = 0.032), indicating differential changes in mid-thigh girth
scores pre- to post-test (DUP: 55.2 ± 4.2 cm to 54.8 ± 4.2 cm; SUP: 55.6 ± 6.2 cm
to 56.1 ± 6.4 cm). In spite of the significant interaction effect, no other significant
main effects were observed. Dependent t-tests on each training group found that
while the DUP group observed a slight decrease in mid-thigh girth, the SUP
obtained a pre- to post-test increase, with both t values approaching significance
(DUP: t7 = 1.793, p = 0.116; SUP: t6 = 1.622, p = 0.156). Mean mid-thigh girth
scores are illustrated in Figure 7.1.
Figure 7.1 Mid-thigh means at pre- and post-test for the daily undulating periodisation (DUP) and session undulating periodisation (SUP) groups during the 3-wk maintenance phase. Results represent mean ± SD.
4547495153555759616365
Pre Post
Test Occasion
DUP
SUP
Mid
-thig
h G
irth
(cm
)
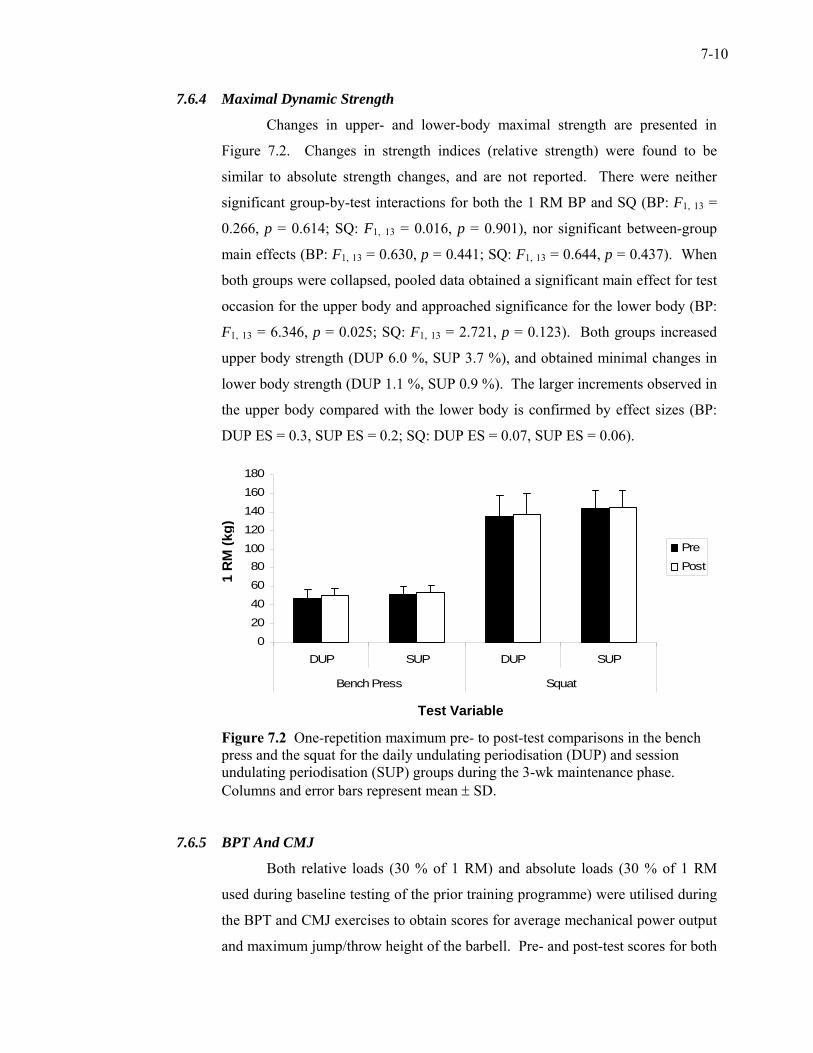
7-10
7.6.4 Maximal Dynamic Strength
Changes in upper- and lower-body maximal strength are presented in
Figure 7.2. Changes in strength indices (relative strength) were found to be
similar to absolute strength changes, and are not reported. There were neither
significant group-by-test interactions for both the 1 RM BP and SQ (BP: F1, 13 =
0.266, p = 0.614; SQ: F1, 13 = 0.016, p = 0.901), nor significant between-group
main effects (BP: F1, 13 = 0.630, p = 0.441; SQ: F1, 13 = 0.644, p = 0.437). When
both groups were collapsed, pooled data obtained a significant main effect for test
occasion for the upper body and approached significance for the lower body (BP:
F1, 13 = 6.346, p = 0.025; SQ: F1, 13 = 2.721, p = 0.123). Both groups increased
upper body strength (DUP 6.0 %, SUP 3.7 %), and obtained minimal changes in
lower body strength (DUP 1.1 %, SUP 0.9 %). The larger increments observed in
the upper body compared with the lower body is confirmed by effect sizes (BP:
DUP ES = 0.3, SUP ES = 0.2; SQ: DUP ES = 0.07, SUP ES = 0.06).
Figure 7.2 One-repetition maximum pre- to post-test comparisons in the bench press and the squat for the daily undulating periodisation (DUP) and session undulating periodisation (SUP) groups during the 3-wk maintenance phase. Columns and error bars represent mean ± SD.
7.6.5 BPT And CMJ
Both relative loads (30 % of 1 RM) and absolute loads (30 % of 1 RM
used during baseline testing of the prior training programme) were utilised during
the BPT and CMJ exercises to obtain scores for average mechanical power output
and maximum jump/throw height of the barbell. Pre- and post-test scores for both
0
20
40
60
80100
120
140
160
180
DUP SUP DUP SUP
Bench Press Squat
Pre
Post
1 R
M (k
g)
Test Variable
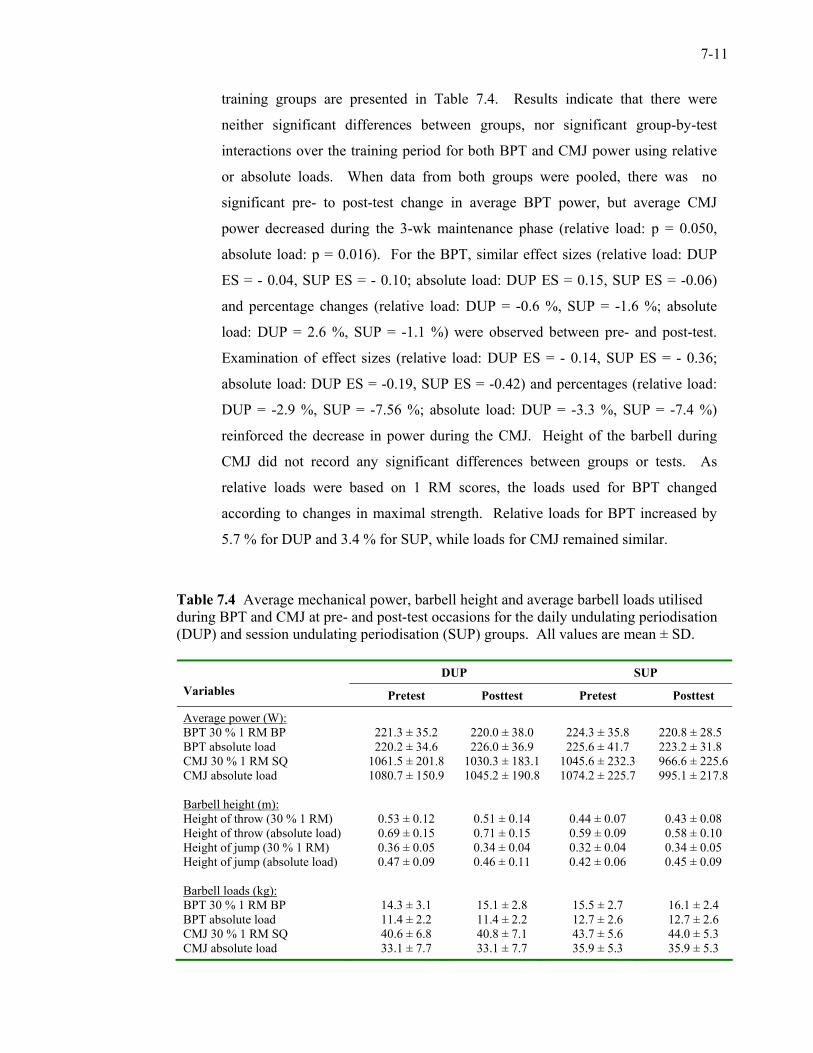
7-11
training groups are presented in Table 7.4. Results indicate that there were
neither significant differences between groups, nor significant group-by-test
interactions over the training period for both BPT and CMJ power using relative
or absolute loads. When data from both groups were pooled, there was no
significant pre- to post-test change in average BPT power, but average CMJ
power decreased during the 3-wk maintenance phase (relative load: p = 0.050,
absolute load: p = 0.016). For the BPT, similar effect sizes (relative load: DUP
ES = - 0.04, SUP ES = - 0.10; absolute load: DUP ES = 0.15, SUP ES = -0.06)
and percentage changes (relative load: DUP = -0.6 %, SUP = -1.6 %; absolute
load: DUP = 2.6 %, SUP = -1.1 %) were observed between pre- and post-test.
Examination of effect sizes (relative load: DUP ES = - 0.14, SUP ES = - 0.36;
absolute load: DUP ES = -0.19, SUP ES = -0.42) and percentages (relative load:
DUP = -2.9 %, SUP = -7.56 %; absolute load: DUP = -3.3 %, SUP = -7.4 %)
reinforced the decrease in power during the CMJ. Height of the barbell during
CMJ did not record any significant differences between groups or tests. As
relative loads were based on 1 RM scores, the loads used for BPT changed
according to changes in maximal strength. Relative loads for BPT increased by
5.7 % for DUP and 3.4 % for SUP, while loads for CMJ remained similar.
Table 7.4 Average mechanical power, barbell height and average barbell loads utilised during BPT and CMJ at pre- and post-test occasions for the daily undulating periodisation (DUP) and session undulating periodisation (SUP) groups. All values are mean ± SD.
DUP SUP
Variables Pretest Posttest Pretest Posttest
Average power (W): BPT 30 % 1 RM BP 221.3 ± 35.2 220.0 ± 38.0 224.3 ± 35.8 220.8 ± 28.50BPT absolute load 220.2 ± 34.6 226.0 ± 36.9 225.6 ± 41.7 223.2 ± 31.80CMJ 30 % 1 RM SQ 1061.5 ± 201.8 1030.3 ± 183.1 1045.6 ± 232.3 966.6 ± 225.6CMJ absolute load 1080.7 ± 150.9 1045.2 ± 190.8 1074.2 ± 225.7 995.1 ± 217.8 Barbell height (m): Height of throw (30 % 1 RM) 0.53 ± 0.12 0.51 ± 0.14 0.44 ± 0.07 0.43 ± 0.08 Height of throw (absolute load) 0.69 ± 0.15 0.71 ± 0.15 0.59 ± 0.09 0.58 ± 0.10 Height of jump (30 % 1 RM) 0.36 ± 0.05 0.34 ± 0.04 0.32 ± 0.04 0.34 ± 0.05 Height of jump (absolute load) 0.47 ± 0.09 0.46 ± 0.11 0.42 ± 0.06 0.45 ± 0.09 Barbell loads (kg): BPT 30 % 1 RM BP 14.3 ± 3.1 15.1 ± 2.8 15.5 ± 2.7 16.1 ± 2.4 BPT absolute load 11.4 ± 2.2 11.4 ± 2.2 12.7 ± 2.6 12.7 ± 2.6 CMJ 30 % 1 RM SQ 40.6 ± 6.8 40.8 ± 7.1 43.7 ± 5.6 44.0 ± 5.3 CMJ absolute load 33.1 ± 7.7 33.1 ± 7.7 35.9 ± 5.3 35.9 ± 5.3
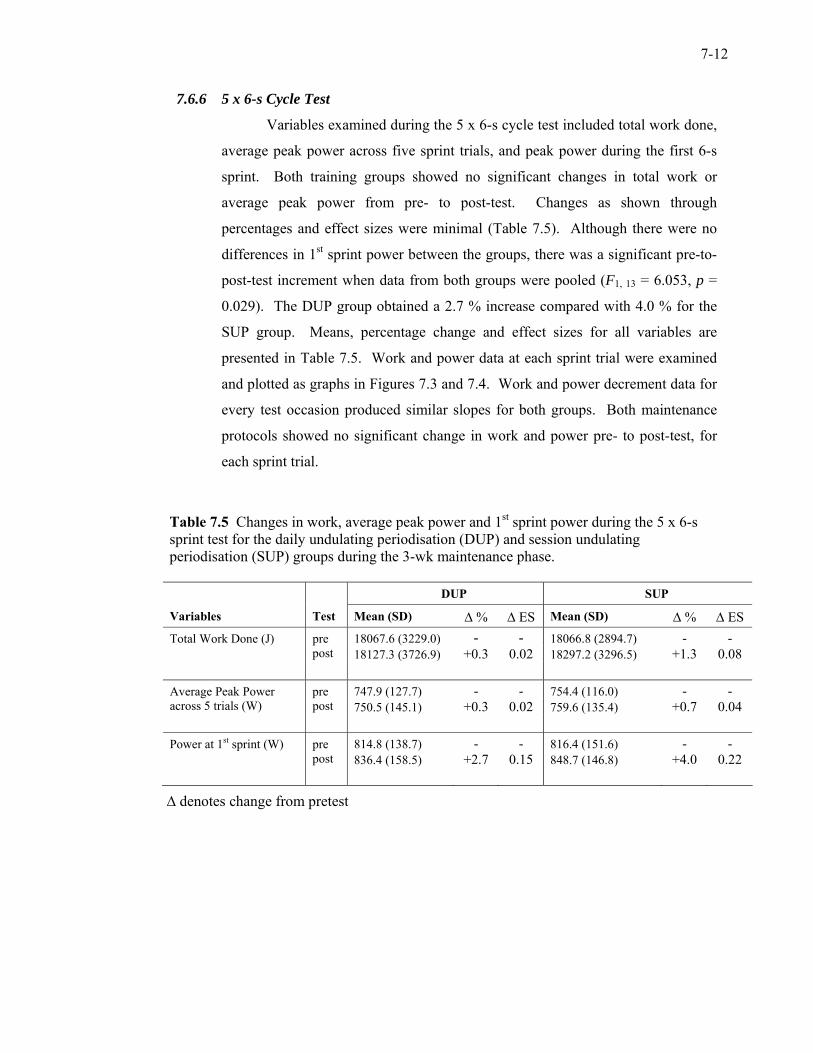
7-12
7.6.6 5 x 6-s Cycle Test
Variables examined during the 5 x 6-s cycle test included total work done,
average peak power across five sprint trials, and peak power during the first 6-s
sprint. Both training groups showed no significant changes in total work or
average peak power from pre- to post-test. Changes as shown through
percentages and effect sizes were minimal (Table 7.5). Although there were no
differences in 1st sprint power between the groups, there was a significant pre-to-
post-test increment when data from both groups were pooled (F1, 13 = 6.053, p =
0.029). The DUP group obtained a 2.7 % increase compared with 4.0 % for the
SUP group. Means, percentage change and effect sizes for all variables are
presented in Table 7.5. Work and power data at each sprint trial were examined
and plotted as graphs in Figures 7.3 and 7.4. Work and power decrement data for
every test occasion produced similar slopes for both groups. Both maintenance
protocols showed no significant change in work and power pre- to post-test, for
each sprint trial.
Table 7.5 Changes in work, average peak power and 1st sprint power during the 5 x 6-s sprint test for the daily undulating periodisation (DUP) and session undulating periodisation (SUP) groups during the 3-wk maintenance phase.
DUP SUP
Variables Test Mean (SD) ∆ % ∆ ES Mean (SD) ∆ % ∆ ES Total Work Done (J) pre 18067.6 (3229.0) - - 18066.8 (2894.7) - - post 18127.3 (3726.9) +0.3 0.02 18297.2 (3296.5) +1.3 0.08 Average Peak Power pre 747.9 (127.7) - - 754.4 (116.0) - - across 5 trials (W) post 750.5 (145.1) +0.3 0.02 759.6 (135.4) +0.7 0.04 Power at 1st sprint (W) pre 814.8 (138.7) - - 816.4 (151.6) - - post 836.4 (158.5) +2.7 0.15 848.7 (146.8) +4.0 0.22
∆ denotes change from pretest
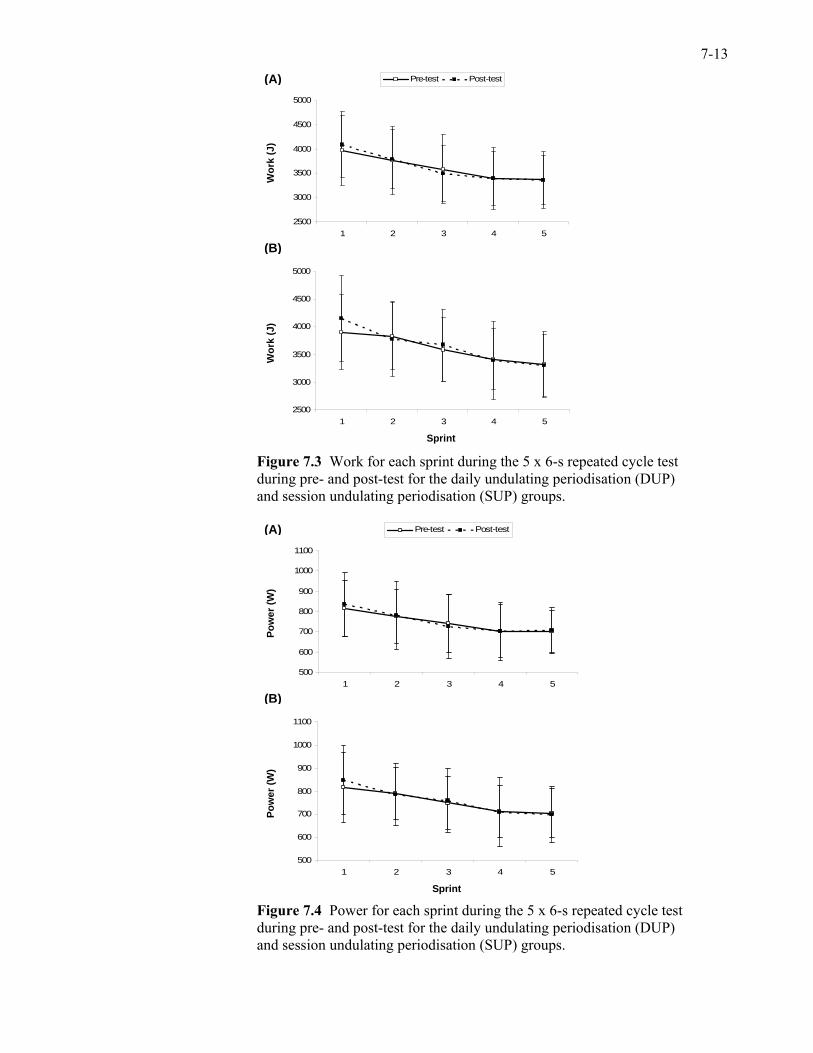
7-13
Figure 7.3 Work for each sprint during the 5 x 6-s repeated cycle test during pre- and post-test for the daily undulating periodisation (DUP) and session undulating periodisation (SUP) groups.
Figure 7.4 Power for each sprint during the 5 x 6-s repeated cycle test during pre- and post-test for the daily undulating periodisation (DUP) and session undulating periodisation (SUP) groups.
2500
3000
3500
4000
4500
5000
1 2 3 4 5
Pre-test Post-test
2500
3000
3500
4000
4500
5000
1 2 3 4 5
Wor
k (J
) W
ork
(J)
Sprint
(A)
(B)
500
600
700
800
900
1000
1100
1 2 3 4 5
Pre-test Post-test
500
600
700
800
900
1000
1100
1 2 3 4 5
Sprint
Pow
er (W
) Po
wer
(W)
(A)
(B)
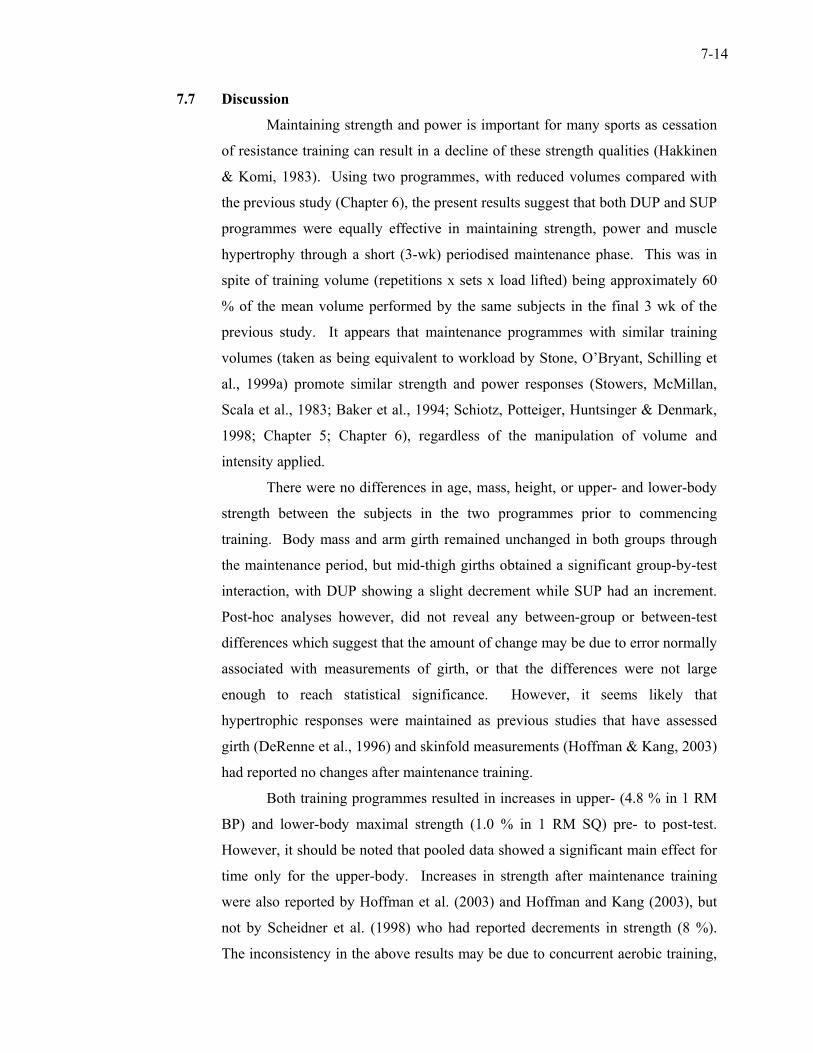
7-14
7.7 Discussion
Maintaining strength and power is important for many sports as cessation
of resistance training can result in a decline of these strength qualities (Hakkinen
& Komi, 1983). Using two programmes, with reduced volumes compared with
the previous study (Chapter 6), the present results suggest that both DUP and SUP
programmes were equally effective in maintaining strength, power and muscle
hypertrophy through a short (3-wk) periodised maintenance phase. This was in
spite of training volume (repetitions x sets x load lifted) being approximately 60
% of the mean volume performed by the same subjects in the final 3 wk of the
previous study. It appears that maintenance programmes with similar training
volumes (taken as being equivalent to workload by Stone, O’Bryant, Schilling et
al., 1999a) promote similar strength and power responses (Stowers, McMillan,
Scala et al., 1983; Baker et al., 1994; Schiotz, Potteiger, Huntsinger & Denmark,
1998; Chapter 5; Chapter 6), regardless of the manipulation of volume and
intensity applied.
There were no differences in age, mass, height, or upper- and lower-body
strength between the subjects in the two programmes prior to commencing
training. Body mass and arm girth remained unchanged in both groups through
the maintenance period, but mid-thigh girths obtained a significant group-by-test
interaction, with DUP showing a slight decrement while SUP had an increment.
Post-hoc analyses however, did not reveal any between-group or between-test
differences which suggest that the amount of change may be due to error normally
associated with measurements of girth, or that the differences were not large
enough to reach statistical significance. However, it seems likely that
hypertrophic responses were maintained as previous studies that have assessed
girth (DeRenne et al., 1996) and skinfold measurements (Hoffman & Kang, 2003)
had reported no changes after maintenance training.
Both training programmes resulted in increases in upper- (4.8 % in 1 RM
BP) and lower-body maximal strength (1.0 % in 1 RM SQ) pre- to post-test.
However, it should be noted that pooled data showed a significant main effect for
time only for the upper-body. Increases in strength after maintenance training
were also reported by Hoffman et al. (2003) and Hoffman and Kang (2003), but
not by Scheidner et al. (1998) who had reported decrements in strength (8 %).
The inconsistency in the above results may be due to concurrent aerobic training,
7-15
or other activities that were performed in all three studies, which may have
confounded strength and power responses (Leveritt, Abernethy, Barry & Logan,
1999). Additionally, larger strength increases were found in the upper body,
while the increments in the lower body were minimal for the present subjects.
This contrasts with the results of Hoffman et al. (2003) and Hoffman and Kang
(2003) who obtained larger strength increases in the lower body compared with
the upper body. A possible explanation is that while the present female subjects
were highly trained in their lower body (strength index = 2.2), their upper-body
strength was only moderately strong (strength index = 0.8). Previous studies have
suggested that stronger individuals with increased training experience have a
reduced capacity for strength adaptations and improvements (Hakkinen, 1985;
Baker 2001b); that is, the greater the strength, the smaller the scope for
improvement. It is possible that this premise applies not only to the individual,
but also to parts of the body that are stronger. Thus, the subjects from the present
study achieved strength improvements in the weaker upper-body, while
maintaining strength in the lower-body as it was better-trained.
Power training in this maintenance study was performed with loads
approximating 40 % of 1 RM. This load was much lower than those used by
Baker (1998, 2001b), Hoffman et al. (2003) and Hoffman and Kang (2003),
where loads were no less than 65 % of 1 RM. Power training had been previously
performed by both untrained and trained women for three consecutive weeks
using light loads (Chapters 5 and 6), with improved average mechanical power
outputs observed at the end of training. It was concluded that light loads
performed quickly and explosively could improve force and velocity, and thus
power, through the intention to perform movements forcefully and explosively
(Behm & Sale, 1993). However, it was not known if reduced training frequency
and volume, such as that performed in the present study, could maintain the
power adaptations previously achieved. The results of this study showed that
while upper-body power was maintained, with no differences between DUP and
SUP, lower-body power decreased by approximately 5.4 % in both groups (p ≤
0.05). While Baker (2001b) also found no changes in BPT power through a
maintenance phase, a decrement in power was not reported in the lower-body. It
may be that the total volume performed or the training frequency and intensity
was inadequate for maintaining lower-body power in the present female subjects.
7-16
Another possible explanation for the discrepancy in results between studies may
be that the subjects in the previous maintenance studies (Baker 2001b, Hoffman et
al., 2003; Hoffman & Kang, 2003) also performed other modes of training
(energy system, technical and tactical) which may provide additional stimulus for
power maintenance. The present subjects only performed the assigned training.
Future research into the use of light-load power training may need to observe a
team of female athletes through an entire competitive phase in order to examine
the interplay between the current maintenance programme and the additional
stimulus from match play and technical/tactical training. Additional studies may
also be needed to examine if trained women need to train for power with higher
percentages of 1 RM for the lower body to prevent the reported decrease in power
from occurring.
Most previous maintenance studies have examined the changes observed
in strength (DeRenne et al., 1996; Legg & Burnham, 1999; Hoffman et al., 2003;
Hoffman & Kang 2003), with few researchers observing changes in power (Baker
1998, 2001b). A comparison of power output scores between the trained women
from the present study with trained men (Baker 2001b) found that trained women
could produce only approximately 38.7 % and 59.2 % respectively of the upper-
and lower-body power scores produced by trained men. These sex discrepancies
in power output have been discussed by Holloway and Baechle (1990) and Fleck
and Kraemer (1997), who noted that on average, women have approximately two-
thirds of the power output of men, and that these differences are observed even in
competitive male and female weight-lifters. Differences in upper-body power are
especially large, probably due to sex-related differences in upper-body skeletal
frame size and the lower levels of fat-free mass found in the upper body of
women (Bishop, Cureton & Collins, 1987), which are associated with lesser
leverage advantage and smaller muscle mass. Unlike Baker’s study (2001b), the
present study also detailed subjects maintaining their lower-body strength, but
obtaining decrements in lower-body power. This suggests an uncoupling of
strength and power, that is not supported by the two previous periodisation studies
on women (Chapters 5 and 6). These differences should only be used to stimulate
further research on more effective modes to help women athletes achieve their
genetic potential, rather than to accept that the present results as unavoidable.
7-17
Few studies on periodisation have utilised cycle ergometer tests to
examine power production prior to and after training (Christian & Seymour, 1985;
O’Bryant, Byrd & Stone, 1988; McGee, Jessee, Stone & Blessing, 1992), and
none have utilised this assessment during the maintenance phase. The present
study may be the first to detect changes in anaerobic power after periodised
maintenance training using the 5 x 6-s cycle test. The present results suggest that
the maintenance programmes utilised in this study were able to maintain both
work and average peak power, and to significantly improve 1st sprint power
during repeated-sprint tasks on a cycle ergometer. This contradicted the decrease
in lower-body power observed during the CMJ, suggesting that cycle ergometer
tests may not be specific to the muscle action and the velocity at which resistance
training was performed (Bishop, Jenkins, Mackinnon, McEniery & Carey, 1999),
or that strength may be more important for repeated-sprint performances
compared with power. Future research on periodised resistance training may find
a repeated-jump test more specific than the repeated-cycle test in terms of
movement and energy requirements.
7.8 Conclusion
In conclusion, the main finding of the present study was that the two forms
of periodised maintenance training utilised in the study were able to maintain
upper-body strength and power adequately across a 3-wk phase in women.
Lower-body strength was similarly retained, but there was a small but significant
decrement in average mechanical power. As both protocols employed a similar
total volume (workload) and observed similar changes, it may be that the
manipulation of volume and intensity is less important than the amount of work
performed across the training period in maintaining strength and power. Strength
increments are still possible during maintenance training, but appear limited to
areas that are less developed initially. Further research is required to observe a
similar group of resistance-trained females simultaneously through maintenance
training and competition, and to examine if other percentages of 1 RM should be
used during power training in the maintenance phase. Future research should also
examine if different periodised maintenance protocols are needed for women to
ensure that their genetic potential is reached.
8-1
CHAPTER 8. CONCLUSIONS AND RECOMMENDATIONS 8.1 Summary Of Findings
Resistance training appears to be a vital component for the enhancement
and optimisation of woman’s health and functional capacity (Kraemer, Mazzetti,
Nindl et al., 2001). The use of resistance training for improving strength qualities
such as hypertrophy, maximal strength, endurance and power have gained
popularity over the past twenty years (Kraemer & Ratamess, 2004), and its use
among females have increased (Holloway & Baechle, 1990; Fleck & Kraemer,
1997). Although many resistance-training programmes now adhere to the concept
of periodisation, the number of studies examining its structure and design are few,
and even rarer, are periodised studies utilising female subjects. These studies on
periodisation (Stone, O’Bryant & Garhammer, 1981; Stowers, McMillan, Scala et
al., 1983; O’Bryant, Byrd & Stone, 1988; Willoughby 1993; Baker, Wilson &
Carlyon, 1994; Herrick & Stone, 1996; Rhea, Ball, Phillips & Burkett, 2002;
Kraemer, Hakkinen, Triplett-McBride et al., 2003; Kraemer, Nindl, Ratamess et
al., 2004a) have compared progressive resistance exercise (PRE), linear
periodisation (LP) and undulating periodisation (UP). Studies utilising
periodisation on the maintenance of strength and power are even rarer, with only
two published studies found (Baker 2001b; Hoffman, Wendell, Cooper & Kang,
2003).
To effectively compare the efficacy of any training programme, training
variables such as volume and intensity need to be equalised between comparative
programmes (Willoughby, 1993; Baker et al., 1994, Herrick & Stone, 1996). This
was not performed in a number of the previous studies, and thus it was difficult to
validate if the differences observed between comparative training programmes
were due to the effectiveness of the structure of the periodised programmes, or
because of differences in volume and intensity. Additionally, the optimal training
intensity to be used for power training is still being disputed, although it has been
suggested that training at the load that maximises average mechanical power may
develop power more efficiently (Wilson, Newton, Murphy & Humphries, 1993).
With this in mind, this thesis sought to first examine the load that produces the
maximal average mechanical power output during the bench press throw (BPT)
and countermovement jump (CMJ) exercises, in women of differing strength
8-2
levels. The results on the load that maximised power were then used in two
periodised resistance-training programmes (LP and UP) to observe changes in
strength qualities when untrained women adhered to these prescribed protocols.
As untrained women have demonstrated a tendency to show large improvements
regardless of training programmed used (Hakkinen and Komi, 1985a), the same
periodised programmes were utilised on women who were stronger and had
previous resistance-training experience. At the end of the training period, the
same group of trained female subjects were then put into groups to follow two
periodised maintenance programmes. All comparative programmes were
equalised in terms of training volume and intensity, and a summary of the
conclusions from all four studies in this thesis are reported in the following
paragraphs.
The results from the first study (Chapter 4) suggest that different
percentages of one-repetition maximum (1 RM) maximised average mechanical
power output for the upper- and lower-body during the BPT and CMJ. Power
output was maximised at 60 % of 1 RM for the BPT, while the load that
optimised power for the CMJ was 30 % of 1 RM. Although these loads
maximised mechanical power output, no statistical difference was found between
these loads and a range of other loads. During the BPT, both strong and weaker
women maximised power at 60 % of 1 RM, but high power outputs were
similarly produced at 40 - 50 % of 1 RM for strong women and at loads of 50, 70
and 80 % of 1 RM for weaker women. For the CMJ, both strong and weaker
women maximised power output at 30 % of 1 RM, with 40 % of 1 RM also
allowing the production of high power output for stronger women, while loads
between 40 – 60 % of 1 RM allowed for high average power output in weaker
women. It appears that within the range of loads that maximised power output,
stronger and more powerful female subjects, and also stronger and more powerful
parts of the body within the same subjects, utilise lower percentages of 1 RM to
produce high power compared to less strong and less powerful subjects and body
parts. A possible reason for the discrepancy between stronger and weaker
subjects/parts include the compelled use of higher forces by weaker parts at
higher loads, resulting in better power outputs for higher ranges of 1 RM for
weaker subjects/parts. Alternatively, stronger women performed the BPT and
CMJ exercises with higher absolute loads at every percentage of 1 RM, which
8-3
may, (a) require a stiff series elastic component that may reduce the transfer of
elastic strain energy, and (b) is less effective than lighter loads in utilising the pre-
movement silent period and consequent synchronisation of motor unit firing –
both of which may reduce average concentric power production at heavier loads
for stronger subjects. Women also seem to produce lower power outputs than
men regardless of resistance-training experience. However, the advantage in
power production that men have over women becomes less apparent when power
output scores are described relative to body mass, especially when comparisons
were between the present subjects and men with similar resistance-training
experience (low to moderate). Although highly-trained men still had higher
power output per kg body mass compared with the present subjects, it is possible
that women with increased training experience would also exhibit reduced
differences in power between sexes.
Although loads of 60 and 30 % respectively maximised power output for
strong and weaker women, the wide range of loads that also produced high power
outputs, together with conflicting results with some previous studies, made it safer
and more prudent for the researcher to utilise light loads of 30 and 40 % of 1 RM
for power training on untrained women in the second study (Chapter 5). The
comparison of LP and UP training with equalised volume and intensity suggest
that women who participated in recreational and amateur level sports but were
novices in resistance training, found both LP and UP programmes equally adept
in improving strength qualities, and personal preference may be used to decide
which programme to initiate. Thus, it appears that training programmes with
higher workloads and repetitions produce superior strength and power adaptations
(Baker et al., 1994; Herrick & Stone, 1996), and it is not specifically the variation
of training volume and intensity within a periodised programme that improves
strength qualities (O’Bryant et al., 1988; Willoughby, 1993; Kraemer & Fry,
1995; Marx, Kraemer, Nindl et al., 1998; Stone, Potteiger, Pierce et al., 2000).
An unusual observation though, was that hypertrophic responses observed
through ultrasonic measurements were larger, and occurred earlier than previously
reported. The improvement in muscle hypertrophy appears to be brought about
by increased training volumes, and is apparently associated with most of the
improvement in strength and power observed in the subjects. Another uncommon
result was that non-projected, light-load, explosive training was capable of
8-4
bringing about small increases in strength and power in untrained women. This
type of training however should be limited to short periods, as continued use of
light loads has been suggested to be detrimental to strength and power
performances (Baker et al., 1994), and in this study, was linked to a slight
decrease in muscle mass. Nevertheless, light-load, explosive training brought
about strength and power increments, and could possibly act as a form
psychological relief after a period of heavy training, reinforcing the need to
alternate heavy and light training for the alleviation of physical and mental stress
(Bompa, 1999). The use of the 5 x 6-s cycle test to detect changes in power
performance after periodised training suggest that this test may not be able to
adequately assess improvements in strength qualities after periodised resistance
training due to a lack of specificity between testing and training movements.
As the effectiveness of any training programme should be gauged against
trained rather than untrained individuals, the same periodised programmes were
used on stronger women with previous resistance-training experience to extend
the findings of the above study. Chapter 6 compared LP and UP training and
obtained results which suggest that comparable to the untrained females from the
previous study, moderately-trained females achieved similar strength and power
responses regardless of the training protocol used when training volume (total
repetitions x mass lifted) is similar over a short training period. These results
differed from a similar study conducted with moderately-trained men that found
UP to be superior (Rhea et al., 2002), and reinforces the importance of training
workloads and volume over the structure of periodised protocols in improving
muscular performance (Baker et al., 1994; Herrick & Stone, 1996). These
moderately-trained women were stronger per kg body mass, and were able to
produce similar amounts of power with heavier loads compared with the
untrained women. The greater strength and power observed in these women
however, appeared to be limited to the lower body, with upper-body strength and
power producing similar results to those noted in untrained women earlier. The
lack of upper-body strength and power is more apparent when comparisons are
made with trained men. Similar to the previous study (Chapter 5), non-projected,
light-load, explosive traditional power training was found to be effective in
improving strength and explosive power, and may be important in reducing
training stress that has been associated with high volume and intensity training.
8-5
Training volumes for the LP and UP groups affected muscle cross-sectional areas
(CSA) differently, but similar gains were observed at the end of training, with
increases in hypertrophy achieved earlier than previously reported. Similar to
untrained women, moderately-trained women also found repeated-sprint cycle
tests to be lack sensitivity to changes in power performance after periodised
strength/power training, suggesting that other assessment modes may be more
useful.
The final study in the thesis examined periodisation on the maintenance of
strength qualities. The resistance-trained female subjects from the previous study
(Chapter 6) found that training twice a week according to two UP maintenance
training programmes with equalised volumes and intensities increased upper-body
strength and maintained lower-body strength adequately across a 3-wk phase. It
has been suggested that stronger individuals with increased training experience
have a reduced capacity for strength adaptations and improvements (Hakkinen,
1985; Baker 2001b). The results from this study suggest that this premise may
also apply to stronger parts of the body as the stronger lower-body maintained
strength, while the weaker upper-body achieved strength improvements. As both
training groups achieved gains in upper-body strength while maintaining lower-
body strength, it is possible that the manipulation of volume and intensity is less
important than the amount of work performed across the training period.
However, as average mechanical power output results indicate that upper-body
power was maintained while lower-body power decreased, the frequency, volume
and intensity prescribed may not be sufficient to maintain power production for
better-trained parts of the body in trained female subjects. Furthermore, these
subjects performed only the assigned training without participating in competition
or other modes of training. Thus, it could be that previous maintenance studies
(Baker 2001b, Hoffman et al., 2003; Hoffman & Kang, 2003) did not observe
similar power output decrements due to the performance of other modes of
training (energy system, technical and tactical) which may provided additional
stimulus for power maintenance.
8-6
8.2 Recommendations And Future Research
The summary of conclusions from each study performed in the thesis led
the researcher to make the following suggestions and recommendations:
i Given the present study on optimal loads that maximise average
mechanical power in women during the BPT and CMJ have not found
concordance with some previous studies that utilised male subjects, it may
be more practical to utilise a range of loads rather than one particular load
for power training. It may be prudent for women who are novices to
power training to begin at percentages of 30 to 40 % of 1 RM, while
women with previous resistance training should also begin with lower
percentages of 1 RM before increasing to 50 and 60 % of 1 RM. Most
previous studies (including the present) do not support the use of 70 to 80
% of 1 RM for optimal power production. It is also important that training
for power should include the exertion force as quickly as possible in order
to maximise power production (Kawamori, Crum, Blumert et al., 2005).
ii To help compare loads that optimise power across different studies, future
research on loads for optimising power should emphasise the
standardisation of the measurement and data collection processes, with the
use of both force and position data (Dugan, Doyle, Humphries, Hasson &
Newton, 2004). Calculation of variables should also include body mass
during the performance of exercises that involve the body performing a
jump to avoid the underestimation of power (Dugan et al., 2004). The use
of standardised methodology should then be performed on different types
of exercises as previous studies have found the optimisation of power with
different exercises at different loads (Lund, Dolny & Browder, 2004;
Kawamori et al., 2005).
iii While the idea of training at the load that maximises average mechanical
power has garnered reasonable support, the results from the studies in this
thesis do not promote this idea. Upper-body training utilised loads that
were lower than the optimal load but increments in power output were
observed throughout the training period for both untrained and
moderately- trained women. Lower-body training was performed at the
loads that maximised power but power output decreased for the trained
women towards the end of training. However, as power training methods
8-7
differed from power assessment methods (power training was performed
without projecting the barbell, while power assessment was performed
with the projection of the barbell), future research should have subjects
train and test using similar methods and equipment. This would better
reflect the efficacy of using the optimal load to improve power.
iv Another possible research extension from this thesis would be to observe
if the training status of females changes the loading intensity (percentage
of 1 RM) that maximises power output. The load that maximises power
output would be first determined for a group of female subjects with little
previous resistance-training experience. Following this, the same group of
subjects would then be trained using the same periodised resistance
programme for 8 – 12 wk. The load that maximises power output would
then be determined again. This process of determining the optimal power
load and periodised training could be repeated through a few cycles to
investigate if improving strength and power levels would change the loads
that maximise power output.
v The female subjects in these studies exhibited a lack of upper-body
strength and power compared with male subjects of similar training
experience from previous research, and also compared with their lower
body. This reinforces the need to plan training according to the training
experience of the individual subject, and also according to the
requirements of specific muscle groups. The results from these studies
suggest that stronger parts of the body may require higher intensities and
volume for further increases in power.
vi The results from these studies suggest that non-projected, light-load,
explosive traditional power training was effective in improving strength
and explosive power in both untrained and moderately-trained women.
Thus, light-load training may be used for novice individuals who may be
anxious about training with heavy loads, or for reducing training stress
that has been associated with high-volume and high-intensity training in
previously-trained women. However, it is necessary to determine the
duration that light-load training can be performed without jeopardising
hypertrophic and strength responses.
8-8
vii The maintenance programmes utilised in Chapter 7 were found to be
generally capable of maintaining strength and power. However, as
stronger and more powerful parts of the body (lower body) demonstrated a
slight decrement in power, further research is needed to observe a similar
group of resistance-trained females simultaneously through maintenance
training and competition to observe if the same programmes with added
stimulus from competition were more adequate to maintain strength and
power through a similar training period. Additional research could
examine if other percentages of 1 RM could be used during power training
in the maintenance phase, or that the same training variables be used
through a longer maintenance phase. Future maintenance studies could
also examine the efficacy of other types of maintenance programmes.
viii Other possible areas of research pertaining to periodisation could be to:
a. compare the two periodisation programmes utilised in this thesis on
other female populations such as athletes, older women and children.
b. compare the two periodisation programmes utilised in this thesis on
females for muscular endurance.
c. compare the two periodisation programmes utilised in this thesis over
a longer training period.
d. utilise a repeated-jump test in place of the repeated-cycle test to assess
power output as the movement may be more specific to the training
protocols utilised.
e. assess other performance variables such as jumping, running and
throwing.
f. examine other models of periodisation emphasising different ways of
varying training variables.
8.3 Conclusion
Since more women are involved in physical activity for fitness, health and
competition, suitable periodised resistance-training programmes need to be
developed for them (Herrick & Stone, 1996). Although previous research on men
have reported that UP was more effective than LP (Rhea et al., 2002), the results
of this study did not support the efficacy of either LP or UP over the other during
a short period of time. Thus, both periodised programmes used in this thesis can
8-9
be recommended for untrained and moderately-trained women as both LP and UP
were found to be similarly effective for increasing upper- and lower-body
hypertrophy, strength and power. The results support the notion that the success
of the earlier LP models over the PRE models may have been due to higher
training volumes or higher intensity (Baker et al., 1994; Schiotz, Potteiger,
Huntsinger & Denmark, 1998), rather than the manipulation of training volume
and intensity as proposed by some researchers (Stone et al., 1981; Willoughby,
1993; Stone et al., 2000).
The results from this thesis also suggest that training one strength quality a
day a week can bring about positive changes in those strength qualities. Training
each strength quality for short periods of three weeks at the set intensity and
volume also brought about significant improvements in hypertrophy, strength and
power for both trained and untrained women, with muscle hypertrophy occurring
earlier than previously reported. Thus, it appears that what is most important for
conditioning coaches may be the individualisation of training programmes to
address the requirements and weaknesses of each individual. However, as studies
on periodised resistance-training utilising female subjects are scarce, more
comparative studies on the two programmes are needed, especially with trained
females over longer training periods. Future research need to provide data on
whether women need different periodisation strategies to achieve optimal
strength-power responses. However, until more information is obtained with
respect to the optimal setting for each training variable, the perfect training
regimen for optimum strength and power improvement will remain undesigned.
R-1
REFERENCES Abernethy, P., Wilson, G., & Logan, P. (1995). Strength and power assessment: Issues,
controversies and challenges. Sports Medicine, 19(6), 401-417. Abernethy, P. J., & Jurimae, J. (1996). Cross-sectional and longitudinal uses of
isoinertial, isometric, and isokinetic dynamometry. Medicine and Science in Sports and Exercise, 28(9), 1180-1187.
Allerheiligen, B. (2003). In-season strength training for power athletes. Strength and
Conditioning Journal, 25(3), 23-28. Anderson, T., & Kearney, J. T. (1982). Effects of three resistance training programs on
muscular strength and absolute and relative endurance. Research Quarterly for Exercise and Sport, 53, 1-7.
Atha, J. (1981). Strengthening muscle. Exercise and Sports Science Reviews, 9, 1-73. Baechle, T. R., Earle, R. W., & Wathen, D. (2000). Resistance training. In T. R. Baechle
& R. W. Earle (Eds.), Essentials of strength training and conditioning (2nd ed.). Champaign, IL: Human Kinetics.
Baker, D. (1995). Selecting the appropriate exercises and loads for speed-strength
development. Strength and Conditioning Coach, 3(2), 8-16. Baker, D. (1998). Applying the in-season periodization of strength and power training to
football. Strength and Conditioning Journal, 20(2), 18-24. Baker, D. (2001a). Comparison of upper-body strength and power between professional
and college-aged rugby league players. Journal of Strength and Conditioning Research, 15(1), 30-35.
Baker, D. (2001b). The effects of an in-season of concurrent training on the maintenance
of maximal strength and power in professional and college-aged rugby league football players. Journal of Strength and Conditioning Research, 15(2), 172-177.
Baker, D. (2002). Differences in strength and power among junior-high, senior-high,
college-aged, and elite professional rugby league players. Journal of Strength and Conditioning Research, 16(4), 581-585.
Baker, D. (2003). Acute effect of alternating heavy and light resistances on power output
during upper-body complex power training. Journal of Strength & Conditioning Research, 17(3), 493-497.
Baker, D., Nance, S., & Moore, M. (2001a). The load that maximizes the average
mechanical power output during explosive bench press throws in highly trained athletes. Journal of Strength and Conditioning Research, 15(1), 20-24.
R-2
Baker, D., Nance, S., & Moore, M. (2001b). The load that maximizes the average mechanical power output during jump squats in power-trained athletes. Journal of Strength and Conditioning Research, 15(1), 92-97.
Baker, D., Wilson, G., & Carlyon, R. (1994). Periodization: The effect on strength of
manipulating volume and intensity. Journal of Strength and Conditioning Research, 8(4), 235-242.
Bar-Or, O. (1987). The wingate anaerobic test: An update on methodology, reliability and
validity. Sports Medicine, 4, 381-394. Bassey, E. J., Fiatarone, M. A., & O'Neill, E. F. (1992). Leg extensor power and
functional performance in very old men and women. Clinical Science, 82, 321-327.
Behm, D. G., & Sale, D. G. (1993). Velocity specificity of resistance training. Sports
Medicine, 15(6), 374-388. Bell, G. J., Syrotuik, D. G., Attwood, K., & Quinney, H. A. (1993). Maintenance of
strength gains while performing endurance training in oarswomen. Canadian Journal of Applied Physiology, 18(1), 104-115.
Bemben, M. G. (2002). Use of diagnostic ultrasound for assessing muscle size. Journal of
Strength and Conditioning Research, 16(1), 103-108. Berger, R. A. (1962a). Effect of varied weight training programs on strength. Research
Quarterly, 33(2), 168-181. Berger, R. A. (1962b). Optimum repetitions for the development of strength. Research
Quarterly, 33(3), 334-338. Berger, R. A. (1963). Comparative effects of three weight training programs on strength.
Research Quarterly, 34(3), 168-181. Berger, R. A., & Hardage, B. (1967). Effect of maximum loads for each of ten repetitions
on strength improvement. Research Quarterly, 38(4), 715-718. Bishop, D., Edge, J., & Goodman, C. (2004). Muscle buffer capacity and aerobic fitness
are associated with repeated-sprint ability in women. European Journal of Applied Physiology, 92(4-5), 540-547.
Bishop, D., Jenkins, D. G., Mackinnon, L. T., McEniery, M., & Carey, M. F. (1999). The
effects of strength training on endurance performance and muscle characteristics. Medicine and Science in Sports and Exercise, 31(6), 886-891.
Bishop, D., Spencer, M., Duffield, R., & Lawrence, S. (2001). The validity of a repeated
sprint ability test. Journal of Science and Medicine in Sport, 4(1), 19-29. Bishop, P., Cureton, K., & Collins, M. (1987). Sex difference in muscular strength in
equally trained men and women. Ergonomics, 30(4), 675-687.
R-3
Bompa, T. O. (1993). Periodization of strength: The new wave in strength training. Toronto, Ontario: Veritas Publishing Inc.
Bompa, T. O. (1999). Periodization: Theory and methodology of training (4th ed.).
Champaign, IL: Human Kinetics. Charniga, A., Gambetta, V., Kraemer, W., Newton, H., O'Bryant, H. S., Palmieri, G., et
al. (1986). Periodization - part ii. National Strength and Conditioning Association Journal, 8(6), 17-25.
Charniga, A., Gambetta, V., Kraemer, W., Newton, H., O'Bryant, H. S., Palmieri, G., et
al. (1987). Periodization - part 3. National Strength and Conditioning Association Journal, 9(1), 17-26.
Chilibeck, P. D., Calder, A. W., Sale, D. G., & Webber, C. E. (1998). A comparison of
strength and muscle mass increases during resistance training in young women. European Journal of Applied Physiology & Occupational Physiology, 77(1-2), 170-175.
Christian, V. K., & Seymour, J. (1985). Specific power adaptations to strength-power
training. National Strength and Conditioning Association Journal, 5(6), 32-34. Clarke, D. H. (1973). Adaptations in strength and muscular endurance resulting from
exercise. Exercise and Sports Science Reviews, 1, 73-102. Clarke, D. H. (1994). Training for strength. In M. M. Shangold & E. Mirkin (Eds.),
Women and exercise: Physiology and sports medicine (2nd ed.). Philadelphia: F.A. Davies Company.
Cohen, J. (1988). Statistical power analysis for the behavioral sciences. Hillsdale,NJ:
Erlbaum. Costill, D. L., Daniels, D., Evans, W., Fink, W., Krahenbuhl, G., & Saltin, B. (1976).
Skeletal muscle enzymes and fiber composition in male and female track athletes. Journal of Applied Physiology, 40(2), 149-154.
Cronin, J., & Crewther, B. (2004). Training volume and strength and power development.
Journal of Science and Medicine in Sport, 7(2), 144-155. Cronin, J., McNair, P. J., & Marshall, R. N. (2001). Developing explosive power: A
comparison of technique and training. Journal of Science and Medicine in Sport, 4(1), 59-70.
Cronin, J. B., McNair, P. J., & Marshall, R. N. (2000). The role of maximal strength and
load on initial power production. Medicine and Science in Sports and Exercise, 32(10), 1763-1769.
Cronin, J. B., McNair, P. J., & Marshall, R. N. (2003). Force-velocity analysis of
strength-training techniques and load: Implications for training strategy and research. Journal of Strength and Conditioning Research, 17(1), 148-155.
R-4
Cronin, J. B., & Owen, G. J. (2004). Upper-body strength and power assessment in women using a chest pass. Journal of Strength and Conditioning Research, 18(3), 401-404.
DeRenne, C., Hetzler, R. K., Buxton, B. P., & Ho, K. W. (1996). Effects of training
frequency on strength maintenance in pubescent baseball players. Journal of Strength and Conditioning Research, 10(1), 8-14.
Dugan, E. L., Doyle, T. L., Humphries, B., Hasson, C. J., & Newton, R. U. (2004).
Determining the optimal load for jump squats: A review of methods and calculations. Journal of Strength and Conditioning Research, 18(3), 668-674.
Elliott, B. C., Wilson, G. J., & Kerr, G. K. (1989). A biomechanical analysis of the
sticking region in the bench press. Medicine and Science in Sports and Exercise, 21, 450-462.
Enoka, R. M. (1994). Neuromechanical basis of kinesiology (Vol. 2nd). Champaign,IL:
Human Kinetics Publishers. Faigenbaum, A. (2000). Age- and sex-related differences and their implications for
resistance exercise. In T. R. Baechle & R. W. Earle (Eds.), Essentials of strength training and conditioning (pp. 169-186). Champaign, IL: Human Kinetics.
Fleck, S. J. (1994). Detraining: Its effects on endurance and strength. Strength and
Conditioning, 16(1), 22-28. Fleck, S. J. (1999). Periodized strength training: A critical review. Journal of Strength
and Conditioning Research, 13(1), 82-89. Fleck, S. J., & Kraemer, W. J. (1988). Resistance training: Basic principles. The
Physician and Sports Medicine, 16(3), 160-171. Fleck, S. J., & Kraemer, W. J. (1997). Designing resistance training programs (2nd ed.).
Champaign,IL: Human Kinetics. Fry, A. C., Kraemer, W. J., Weseman, C. A., Conroy, B. P., Gordon, S. E., Hoffman, J.
R., et al. (1991). The effect of an off-season strength and conditioning program on starters and non-starters in women's intercollegiate volleyball. Journal of Applied Sports Science Research, 5, 174-181.
Giorgi, A., Wilson, G. J., Weatherby, R. P., & Murphy, A. J. (1998). Funtional isometric
weight training: Its effects on the development of muscular function and the endocrine system over an 8-week training period. Journal of Strength and Conditioning Research, 12(1), 18-25.
Golhoffer, A., & Kryolainen, H. (1991). Neuromuscular control of the human leg
extensor muscles in jump exercises under various stretch-load conditions. International Journal of Sports Medicine, 12(1), 34-40.
R-5
Graves, J. E., Pollock, M. L., Leggett, S. H., Braith, R. W., Carpenter, D. M., & Bishop, L. E. (1988). Effect of reduced training frequency on muscular strength. International Journal of Sports Medicine, 9, 316-319.
Haff, G. G., Carlock, J. M., Hartman, M. J., Kilgore, J. L., Kawamori, N., Jackson, J. R.,
et al. (2005). Force–time curve characteristics of dynamic and isometric muscle actions of elite women olympic weightlifters. Journal of Strength and Conditioning Research, 19(4), 741-748.
Hakkinen, K. (1985). Factors influencing trainability of muscular strength during short
term and prolonged training. National Strength and Conditioning Association Journal, 7(2), 32-37.
Hakkinen, K. (1993). Neuromuscular fatigue and recovery in male and female athletes
during heavy resistance exercise. International Journal of Sports Medicine, 14(2), 53-59.
Hakkinen, K., Alen, M., & Komi, P. V. (1985a). Changes in isometric force and
relaxation time, electromyographic and muscle fibre characteristics of human skeletal muscle during strength training and detraining. Acta Physiologica Scandinavica, 125, 573-585.
Hakkinen, K., & Komi, P. (1983). Electromyographic changes during strength training
and detraining. Medicine and Science in Sports and Exercise, 15(6), 455-460. Hakkinen, K., & Komi, P. V. (1985). Changes in electrical and mechanical behavior of
leg extensor muscles during heavy resistance strength training. Scandinavian Journal of Sports Science, 7, 55-64.
Hakkinen, K., Komi, P. V., & Alen, M. (1985b). Effect of explosive type strength
training on isometric force- and relaxation-time, electromyographic and muscle fibre characteristics of leg extensor muscle. Acta Physiologica Scandinavica, 125, 587-600.
Hakkinen, K., Komi, P. V., & Kauhanen, H. (1987). Scientific evaluation of specific
loading of the knee extensors with variable resistance, 'isokinetic' and barbell exercises. Medicine and Sport Science, 26, 224-237.
Harmen, E.A., Rosenstein, M.T., Frykman, P.N. & Rosenstein, R.M. (1990). The effects
of arms and countermovement on vertical jumping. Medicine and Science in Sports and Exercise, 22(6), 825-833.
Harris, G. R., Stone, M. H., O'Bryant, H. S., Proulx, M., & Johnson, R. L. (2000). Short-
term performance effects of high power, high force, or combined weight-training methods. Journal of Strength and Conditioning Research, 14(1), 14-20.
Herrick, A. B., & Stone, W. J. (1996). The effects of periodization versus progressive
resistance exercise on upper and lower body strength in women. Journal of Strength and Conditioning Research, 10(2), 72-76.
R-6
Heyward, V. H., Johannes-Ellis, S. M., & Romer, J. F. (1986). Gender differences in strength. Research Quarterly for Exercise and Sport, 57(2), 154-159.
Hoffman, J. (2002). Physiological aspects of sport training and performance.
Champaign,IL: Human Kinetics. Hoffman, J. R., Fry, A. C., Howard, R., Maresh, C. M., & Kraemer, W. J. (1991b).
Strength, speed and endurance changes during the course of a division i basketball season. Journal of Applied Sports Science Research, 5(3), 144-149.
Hoffman, J. R., & Kaminsky, M. (2000). Use of performance testing for monitoring
overtraining in elite youth basketballers. Strength and Conditioning Journal, 22(6), 54-62.
Hoffman, J. R., & Kang, J. (2003). Strength changes during an in-season resistance-
training program for football. Journal of Strength and Conditioning Research, 17(1), 109-114.
Hoffman, J. R., Maresh, C. M., Armstrong, L. E., & Kraemer, W. J. (1991a). Effects of
off-season and in-season resistance training programs on a collegiate male basketball team. Journal of Human Muscle Performance, 1, 48-55.
Hoffman, J. R., Wendell, M., Cooper, J., & Kang, J. (2003). Comparison between linear
and nonlinear in-season training programs in freshman football players. Journal of Strength and Conditioning Research, 17(3), 561-565.
Holloway, J. B., & Baechle, T. R. (1990). Strength training for female athletes. Sports
Medicine, 9(4), 216-228. Izquierdo, M., Häkkinen, K., Gonzalez-Badillo, J. J., Ibanez, J., & Gorostiaga, E. M.
(2002). Effects of long-term training specificity on maximal strength and power of the upper and lower extremities in athletes from different sports. European Journal of Applied Physiology, 87(3), 264-271.
Izquierdo, M., Hakkinen, K., Ibanez, J., Garrues, M., Anton, A., Zuniga, A., et al. (2001).
Effects of strength training on muscle power and serum hormones in middle-aged and older men. Journal of Applied Physiology, 90(4), 1497-1507.
Jones, K., Bishop, P., Hunter, G., & Fleisig, G. (2001). The effects of varying resistance-
training loads on intermediate- and high-velocity-specific adaptations. Journal of Strength and Conditioning Research, 15(3), 349-356.
Kaneko, M., Fuchimoto, T., Toji, H., & Suei, K. (1983). Training effect of differing loads
on the force-velocity relationship and mechanical power output in human muscle. Scandinavian Journal of Sports Science, 5(2), 50-55.
Kawamori, N., Crum, A. J., Blumert, P. A., Kulik, J. R., Childers, J. T., Wood, J. A., et
al. (2005). Influence of different relative intensities on power output during the hang power clean: Identification of the optimal load. Journal of Strength and Conditioning Research, 19(3), 698-708.
R-7
Kawamori, N., & Haff, G. G. (2004). The optimal training load for the development of muscular power. Journal of Strength and Conditioning Research, 18(3), 675-684.
Knuttgen, H. G., & Kraemer, W. J. (1987). Terminology and measurement in exercise
performance. Journal of Applied Sports Science Research, 1(1), 1-10. Kokkonen, J., Nelson, A. G., & Cornwell, A. (1998). Acute muscle stretching inhibits
maximal strength performance. Research Quarterly for Exercise and Sport, 69(4), 411-415.
Kraemer, W. J. (1997). A series of studies - the physiological basis for strength training
in american football: Fact over philosophy. Journal of Strength and Conditioning Research, 11(3), 131-142.
Kraemer, W. J., Adams, K., Cafarelli, E., Dudley, G. A., Dooly, C., Feigenbaum, M. S.,
et al. (2002). American college of sports medicine position stand. Progression models in resistance training for healthy adults. Medicine and Science in Sports and Exercise, 34(2), 364-380.
Kraemer, W. J., & Fleck, S. J. (1988). Resistance training: Exercise prescription. The
Physician and Sports Medicine, 16(6), 69-81. Kraemer, W. J., & Fry, A. C. (1995). Strength testing: Development and evaluation of
methodolgy. In P. J. Maud & C. Foster (Eds.), Phsiological assessment of human fitness. Champaign,IL: Human Kinetics.
Kraemer, W. J., Hakkinen, K., Triplett-Mcbride, N. T., Fry, A. C., Koziris, L. P.,
Ratamess, N. A., et al. (2003). Physiological changes with periodized resistance training in women tennis players. Medicine and Science in Sports and Exercise, 35(1), 157-168.
Kraemer, W. J., Mazzetti, S. A., Nindl, B. C., Gotshalk, L. A., Volek, J. S., Bush, J. A., et
al. (2001). Effect of resistance training on women's strength/power and occupational performances. Medicine and Science in Sports and Exercise, 33(6), 1011-1025.
Kraemer, W. J., Nindl, B. C., Ratamess, N. A., Gotshalk, L. A., Volek, J. S., Fleck, S. J.,
et al. (2004a). Changes in muscle hypertrophy in women with periodized resistance training. Medicine and Science in Sports and Exercise, 36(4), 697-708.
Kraemer, W. J., Noble, B. J., Clark, M. J., & Culver, B. W. (1987). Physiologic responses
to heavy-resistance exercise with very short rest periods. International Journal of Sports Medicine, 8(5), 247-252.
Kraemer, W. J., O'Bryant, H. S., Pendlay, G., Plisk, S., & Stone, M. H. (2004b).
Roundtable discussion: Periodization of training - part 1. National Strength and Conditioning Journal, 26(2), 50-69.
R-8
Kraemer, W. J., Ratamess, N., Fry, A. C., Triplett-McBride, T., Koziris, L. P., Bauer, J. A., et al. (2000). Influence of resistance training volume and periodization on physiological and performance adaptations in collegiate women tennis players. American Journal of Sports Medicine, 28(5), 626-633.
Kraemer, W. J., & Ratamess, N. A. (2004). Fundamentals of resistance training:
Progression and exercise prescription. Medicine and Science in Sports and Exercise, 36(4), 674-688.
Kramer, J. B., Stone, M. H., O'Bryant, H. S., Conley, M. S., Johnson, R. L., Nieman, D.
C., et al. (1997). Effects of single vs. Multiple sets of weight-training: Impact of volume, intensity, and variation. Journal of Strength and Conditioning Research, 11(3), 143-147.
Legg, D., & Burnham, R. (1999). In-season shoulder abduction strength changes in
football players. Journal of Strength and Conditioning Research, 13(4), 381-383. Leveritt, M., & Abernethy, P. J. (1999). Acute effects of high-intensity endurance
exercise on subsequent resistance activity. Journal of Strength and Conditioning Research, 13(1), 47-51.
Leveritt, M., Abernethy, P. J., Barry, B. K., & Logan, P. A. (1999). Concurrent strength
and endurance training: A review. Sports Medicine, 28(6), 413-427. Lund, R. J., Dolny, D. G., & Browder, K. D. (2004). Optimal loading during two
different leg-press movements in female rowers. Medicine and Science in Sports and Exercise, 36(1), 148-154.
Lyttle, A. D., Wilson, G. J., & Ostrowski, K. J. (1996). Enhancing performance: Maximal
power versus combined weights and plyometrics training. Journal of Strength and Conditioning Research, 10(3), 173-179.
Magnusson, S. P., Simonsen, E. B., Aagaard, P., & Kjaer, M. (1996). Biomechanical
responses to repeated stretches in human hamstring muscle in vivo. American Journal of Sports Medicine, 24(5), 622-628.
Marx, J. O., Ratamess, N. A., Nindl, B. C., Gotshalk, L. A., Volek, J. S., Dohi, K., et al.
(2001). Low-volume circuit versus high-volume periodized resistance training in women. Medicine and Science in Sports and Exercise, 33(4), 635-643.
Marx, J. Q., Kraemer, W. J., Nindl, B. C., Gotshalk, L. A., Duncan, N. D., Volek, J. S., et
al. (1998). The effect of periodization and volume of resistance training in women. Medicine and Science in Sports and Exercise, 30(5), S164: 935.
Mayhew, J. L., Ware, J. S., Johns, R. A., & Bemben, M. G. (1997). Changes in upper
body power following heavy-resistance strength training in college men. International Journal of Sports Medicine, 18(7), 516-520.
R-9
McBride, J. M., Triplett-McBride, T., Davie, A., & Newton, R. U. (1999). A comparison of strength and power characteristics between power lifters olympic lifters, and sprinters. Journal of Strength and Conditioning Research, 13(1), 58-66.
McBride, J. M., Triplett-McBride, T., Davie, A., & Newton, R. U. (2002). The effect of
heavy- vs. Light-load jump squats on the development of strength, power, and speed. Journal of Strength and Conditioning Research, 16(1), 75-82.
McGee, D., Jessee, T. C., Stone, M. H., & Blessing, D. (1992). Leg and hip endurance
adaptations to three weight-training programs. Journal of Applied Sports Science Research, 6(2), 92-95.
Moritani, T., Muro, M., Ishida, K., & Taguchi, S. (1987). Electro-physiological analyses
of the effects of muscle power training. Research Journal in Physical Education, 1, 23-32.
Moss, B. M., Refsnes, P. E., Abildgaard, A., Nicolaysen, K., & Jensen, J. (1997). Effects
of maximal effort strength training with different loads on dynamic strength, cross-sectional area, load-power and load-velocity relationships. European Journal of Applied Physiology and Occupational Physiology, 75(3), 193-199.
Mulligan, S. E., Fleck, S. J., Gordon, S. E., Koziris, L. P., Triplett, N. T., & Kraemer, W.
J. (1996). Influence of resistance exercise volume on serum growth hormone and cortisol concentrations in women. Journal of Strength and Conditioning Research, 10(4), 256-262.
Murphy, A. J., & Wilson, G. J. (1996). The assessment of human dynamic muscular
function: A comparison of isoinertial and isokinetic tests. The Journal of Sports Medicine and Physical Fitness, 36(3), 169-177.
Murphy, A. J., Wilson, G. J., & Pryor, J. F. (1994). Use of isoinertial force mass
relationship in the prediction of dynamic human performance. European Journal of Applied Physiology, 69, 250-257.
Murphy, A. J., Wilson, G. J., Pryor, J. F., & Newton, R. U. (1995). Isometric assessment
of muscular function: The effect of joint angle. Journal of Applied Biomechanics, 11, 205-215.
Neufer, P. D., Costill, D. L., Fielding, R. A., Flynn, M. G., & Kirwin, J. P. (1987). Effect
of reduced training on muscular strength and endurance in competitive swimmers. Medicine and Science in Sports and Exercise, 19(5), 486-490.
Newman, M. A., Tarpenning, K. M., & Marino, F. E. (2004). Relationships between
isokinetic knee strength, single-sprint performance, and repeated-sprint ability in football players. Journal of Strength and Conditioning Research, 18(4), 867-872.
Newton, R. U., & Dugan, E. (2002). Application of strength diagnosis. Strength and
Conditioning Journal, 24(5), 50-59.
R-10
Newton, R. U., Hakkinen, K., Hakkinen, A., McCormick, M., Volek, J., & Kraemer, W. J. (2002). Mixed-methods resistance training increases power and strength of young and older men. Medicine and Science in Sports and Exercise, 34(8), 1367-1375.
Newton, R. U., & Kraemer, W. J. (1994). Developing explosive muscular power:
Implications for a mixed methods training strategy. Strength and Conditioning Journal, 16(5), 20-31.
Newton, R. U., Kraemer, W. J., & Hakkinen, K. (1999). Effects of ballistic training on
preseason preparation of elite volleyball players. Medicine and Science in Sports and Exercise, 31(2), 323-330.
Newton, R. U., Kraemer, W. J., Hakkinen, K., Humphries, B. J., & Murphy, A. J. (1996).
Kinematics, kinetics, and muscle activation during explosive upper body movements. Journal of Applied Biomechanics, 12(1), 31-43.
Newton, R. U., Murphy, A. J., Humphries, B. J., Wilson, G. J., Kraemer, W. J., &
Hakkinen, K. (1997). Influence of load and stretch shortening cycle on the kinematics, kinetics and muscle activation that occurs during explosive upper-body movements. European Journal of Applied Physiology, 75(4), 333-342.
Nindl, B. C., Harman, E. A., Marx, J. O., Gotshalk, L. A., Frykman, P. N., Lammi, E., et
al. (2000). Regional body composition changes in women after 6 months of periodized physical training. Journal of Applied Physiology, 88(6), 2251-2259.
O'Bryant, H. S., Byrd, R., & Stone, M. H. (1988). Cycle ergometer performance and
maximum leg and hip strength adaptations to two different methods of weight-training. Journal of Applied Sports Science Research, 2(27-30).
O'Shea, P. (1966). Effects of selected weight training programs on the development of
strength and muscle hypertrophy. Research Quarterly, 37(1), 95-102. Ostrowski, K. J., Wilson, G. J., Weatherby, R., Murphy, P. W., & Lyttle, A. D. (1997).
The effect of weight training volume on hormonal output and muscular size and function. Journal of Strength and Conditioning Research, 11(3), 148-154.
Pauletto, B. (1986). Intensity. National Strength and Conditioning Association Journal,
8(1), 33-37. Poliquin, C. (1988). Five steps to increasing the effectiveness of your strength training
program. National Strength and Conditioning Association Journal, 10(3), 34-39. Poprawski, B. (1988). Aspects of strengh, power and speed in shot put training. New
Studies in Athletics, 3, 89-92. Rahmani, A., Viale, F., Dalleau, G., & Lacour, J. R. (2001). Force/velocity and
power/velocity relationships in squat exercise. European Journal of Applied Physiology, 83(3), 227-232.
R-11
Rhea, M. R. (2004). Determining the magnitude of treatment effects in strength training research through the use of the effect size. Journal of Strength and Conditioning Research, 18(4), 918-920.
Rhea, M.R. & Alderman, B.L. (2004). A meta-analysis of periodized versus
nonperiodized strength and power training programs. Research Quarterly for Exercise and Sport, 75(4), 413-422.
Rhea, M. R., Ball, S. D., Phillips, W. T., & Burkett, L. N. (2002). A comparison of linear
and daily undulating periodized programs with equated volume and intensity for strength. Journal of Strength and Conditioning Research, 16(2), 250-255.
Ross, W. D., & Marfell-Jones, M. J. (1991). Kinanthropometry. In J. D. MacDougall, H.
A. Wenger & H. J. Green (Eds.), Physiological testing of the high performance athlete (2nd ed.). Champaign.IL: Human Kinetics Books.
Sale, D. G. (1987). Influence of exercise and training on motor unit activation. Exercise
and Sports Science Reviews, 15, 95-151. Sale, D. G. (1991). Testing strength and power. In J. D. MacDougall, H. A. Wenger & H.
J. Green (Eds.), Physiological testting of the high-performance athlete. Champaign,IL: Human Kinetics Books.
Sale, D. G., MacDougall, J. D., Alway, S. E., & Sutton, J. R. (1987). Voluntary strength
and muscle characteristics in untrained men and women and male bodybuilders. Journal of Applied Physiology, 62(5), 1786-1793.
Scheidner, V., Arnold, B., Martin, K., Bell, D., & Crocker, P. (1998). Detraining effects
in college football players during the competitive season. Journal of Strength and Conditioning Research, 12(1), 42-45.
Schiotz, M. K., Potteiger, J. A., Huntsinger, P. G., & Denmark, D. C. (1998). The short-
term effects of periodized and constant-intensity training on body composition, strength, and performance. Journal of Strength and Conditioning Research, 12(3), 173-178.
Schlumberger, A., Stec, J., & Schmidtbleicher, D. (2001). Single- vs. Multiple-set
strength training in women. Journal of Strength and Conditioning Research, 15(3), 284-289.
Schmidtbleicher, D., & Haralambie, G. (1981). Changes in contractile properties of
muscle after strength training in man. European Journal of Applied Physiology, 46, 221-228.
Shepard, R. J. (2000). Exercise and training in women, part i: Influence of gender on
exercise and training responses. Canadian Journal of Applied Physiology, 25(1), 19-34.
R-12
Siegel, J. A., Gilders, R. M., Staron, R. S., & Hagerman, F. C. (2002). Human muscle power output during upper- and lower-body exercises. Journal of Strength & Conditioning Research., 16(2), 173-178.
Sporer, B. C., & Wenger, H. A. (2003). Effects of aerobic exercise on strength
performance following various periods of recovery. Journal of Strength and Conditioning Research, 17(4), 638-644.
Starkey, D. B., Pollock, M. L., Ishida, Y., Welsch, M. A., Brechue, W. F., Graves, J. E.,
et al. (1996). Effect of resistance training volume on strength and muscle thickness. Medicine and Science in Sports and Exercise, 28(10), 1311-1320.
Staron, R. S., Malicky, M. J., Leonardi, M. J., Falkel, J. E., Hagerman, F. C., & Dudley,
G. A. (1990). Muscle hypertrophy and fast fiber type conversions in heavy resistance-trained women. European Journal of Applied Physiology, 60(1), 71-79.
Steinhofer, D. (1997). Terminology and differentiation of training methods. Modern
Athlete and Coach, 35(1), 15-21. Stone, M., H., O'Bryant, H. S., Garhammer, J., McMillan, J., & Rozenek, R. (1982). A
theoretical model of strength training. National Strength and Conditioning Association Journal, 4(4), 36-39.
Stone, M. H., O'Bryant, H. S., & Garhammer, J. (1981). A hypothetical model for
strength training. Journal of Sports Medicine, 21, 342-351. Stone, M. H., O'Bryant, H. S., McCoy, L., Coglianese, R., Lehmkuhl, M., & Schilling, B.
(2003). Power and maximum strength relationships during performance of dynamic and static weighted jumps. Journal of Strength and Conditioning Research., 17(1), 140-147.
Stone, M. H., O'Bryant, H. S., Schilling, B. K., Johnson, R. L., Pierce, K. C., Haff, G. G.,
et al. (1999). Periodization: Effects of manipulating volume and intensity. Part 1. National Strength and Conditioning Association Journal, 21(2), 56-62.
Stone, M. H., Potteiger, J. A., Pierce, K. C., Proulx, C. M., O'Bryant, H. S., Johnson, R.
L., et al. (2000). Comparison of the effects of three different weight-training programs on the one repettion maximum squat. Journal of Strength and Conditioning Research, 14(3), 332-337.
Stone, M. H., Wilson, G. D., Blessing, D., & Rozenek, R. (1983). Cardiovascular
responses to short-term olympic style weight training in young men. Canadian Journal of Applied Sports Science, 8, 134-139.
Stowers, T., McMillan, J., Scala, D., Davis, V., Wilson, D., & Stone, M. (1983). The
short-term effects of three different strength-power training methods. National Strength and Conditioning Association Journal, 5(3), 24-27.
R-13
Tan, B. (1999). Manipulating resistance training program variables to optimize maximum strength in men: A review. Journal of Strength and Conditioning Research, 13(3), 289-304.
Thigpen, L. K., Moritani, T., Thiebaud, R., & Hargis, J. L. (1985). The accute effects of
static stretching on alpha motor neuron excitability. In D. A. Winter, R. W. Norman, R. P. Wells, K. C. Hayes & A. E. Patla (Eds.), Biomechanics ix-a. Champaign,IL: Human Kinetics.
Thomas, J. R., Lochbaum, M. R., Landers, D. M., & He, C. (1997). Planning significant
and meaningful research in exercise science: Estimating sample size. Research Quarterly for Exercise and Sport, 68(1), 33-43.
Thomas, J. R., & Nelson, J. K. (2001). Research methods in physical activity (4th ed.).
Champaign, IL: Human Kinetics. Thomas, M., Fiatarone, M. A., & Fielding, R. A. (1996). Leg power in young women:
Relationship to body composition, strength, and function. Medicine and Science in Sports and Exercise, 28(10), 1321-1326.
Vincent, W. J. (2005). Statistics in kinesiology (3rd ed.). Champaign,IL: Human Kinetics. Wallman, H. (2001). An introduction to periodization training for the triathlete. National
Strength and Conditioning Association Journal, 23(5), 55-64. Wathen, D., Baechle, T. R., & Earle, R. W. (2000). Training variation: Periodization. In
T. R. Baechle & R. W. Earle (Eds.), Essentials of strength training and conditioning (2nd ed., pp. 513-527). Champaign,IL: Human Kinetics.
Willoughby, D. S. (1993). The effects of mesocycle-length weight training programs
involving periodization and partially equated volumes on upper and lower body strength. Journal of Strength and Conditioning Research, 7(1), 2-8.
Wilmore, J. H. (1974). Alternative in strength, body composition and anthropometric
measurements consequent to a 10-week weight training program. Medicine and Science in Sports, 6(2), 133-138.
Wilson, G. J., & Murphy, A. J. (1996). Strength diagnosis: The use of test data to
determine specific strength training. Journal of Sports Sciences, 14(2), 167-173. Wilson, G. J., Murphy, A. J., & Giorgi, A. (1996). Weight and plyometric training:
Effects on eccentric and concentric force production. Canadian Journal of Applied Physiology., 21(4), 301-315.
Wilson, G. J., Murphy, A. J., & Pryor, J. F. (1994). Musculotendinous stiffness: Its
relationship to eccentric, isometric, and concentric performance. Journal of Applied Physiology, 76, 2714-2719.
R-14
Wilson, G. J., Newton, R. U., Murphy, A. J., & Humphries, B. J. (1993). The optimal training load for the development of dynamic athletic performance. Medicine and Science in Sports and Exercise., 25(11), 1279-1286.
Young, W. B., & Behm, D. G. (2003). Effects of running, static stretching and practice
jumps on explosive force production and jumping performance. Journal of Sports Medicine & Physical Fitness, 43(1), 21-27.
Young, W. B., & Bilby, G. E. (1993). The effect of voluntary effort to influence speed of
contraction on strength, muscular power and hypertrophy development. Journal of Strength & Conditioning Research., 7(3), 172-178.
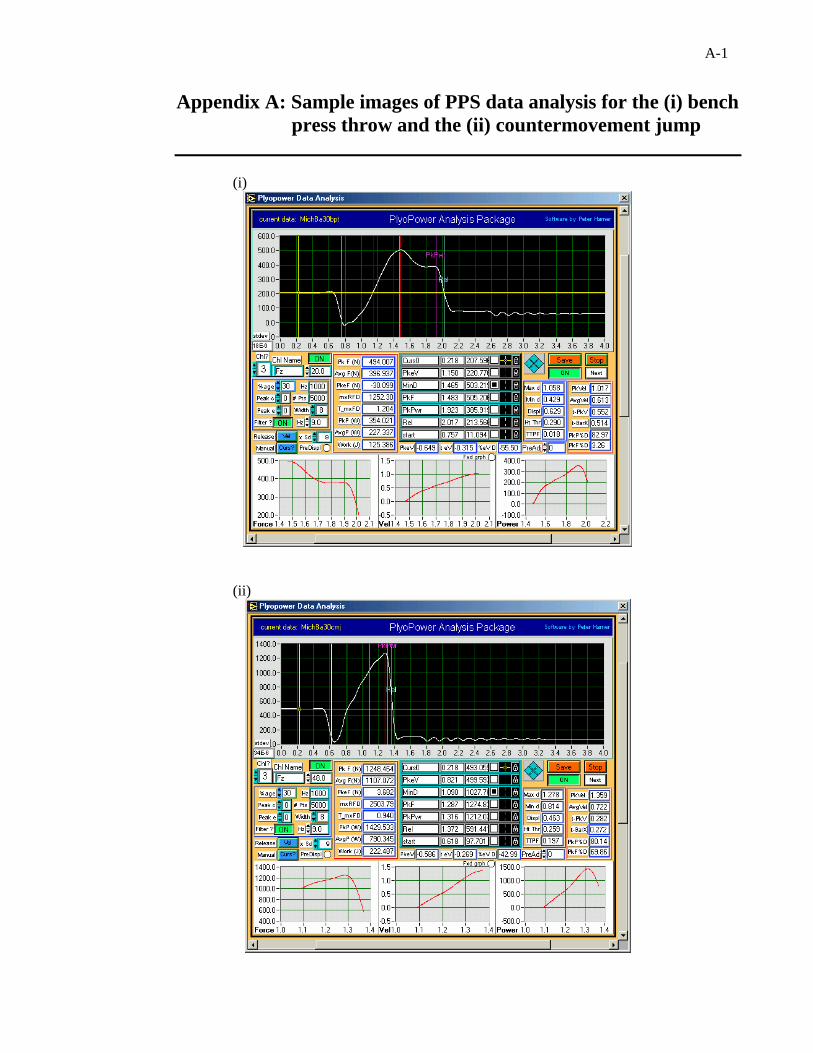
A-1
Appendix A: Sample images of PPS data analysis for the (i) bench press throw and the (ii) countermovement jump
(i)
(ii)

A-2
Appendix B: Informed consent for the subjects in Chapter 4 _____________________________________________________________________
CONSENT FORM
AVERAGE MECHANICAL POWER OUTPUT DURING THE BENCH PRESS THROW AND COUNTERMOVEMENTJUMP IN WOMEN
I, the undersigned (print your name) _______________________________________ do freely and voluntarily give consent to participate in the above study conducted by Lian Yee Kok, Dr David Bishop and Mr Peter Hamer, which purpose is to identify the loads that can generate the maximal mechanical power output during the squat jump and the bench press throw. I declare that the purposes and procedures of the study have been fully explained to me. My rights and obligations have also been explained to my satisfaction and I give my consent by signing this form on the understanding that:
1. this study will be carried out at no financial cost to myself; 2. in giving my consent I acknowledge that my participation in this research is
voluntary, and that I may withdraw my consent at any time without reason and without prejudice;
3. all information provided is treated as strictly confidential and will not be released by the investigator unless required to do so by law;
4. research data gathered for the study may be published provided that my name or other identifying information such as video images are not used;
…………………………………………….. ………………………………… Signature of participant Date …………………………………………….. ………………………………… Signature of investigator Date Further questions concerning this study can be referred to Lian Yee, Kok (9380 1383), Dr David Bishop (9380 7282) or Mr Peter Hamer (9380 2365). The Human Research Ethics Committee at The University of Western Australia requires that all participants are informed that, if they have any complaint regarding the manner in which a research study is conducted, it may be given to the researcher or, alternatively to the Secretary, Human Research Ethics Committee, Registrar’s Office, University of Western Australia, 35 Stirling Highway, Crawley, WA 6907 (tel. no. 9380 3703). All study participants will be provided with a copy of the Information Sheet and Consent Form for their personal records.
Human Movement and Exercise ScienceThe University of W estern Australia 35 Stirling Highway, Crawley W A 6009 Phone +61 8 9380 3919 Fax +61 8 9380 1039

A-3
Appendix C: Informed consent for the subjects in Chapter 5 _____________________________________________________________________
CONSENT FORM
ENHANCING MUSCULAR STRENGTH QUALITIES IN UNTRAINED WOMEN: LINEAR VERSUS UNDULATING PERIODISATION
I, the undersigned (print your name) _______________________________________ do freely and voluntarily give consent to participate in the above study conducted by Lian Yee Kok, Dr David Bishop and Mr Peter Hamer, which purpose is to compare the effectiveness of two periodised resistance training programmes on the development of strength qualities in women. I declare that the purposes and procedures of the study have been fully explained to me. My rights and obligations have also been explained to my satisfaction and I give my consent by signing this form on the understanding that:
5. this study will be carried out at no financial cost to myself; 6. in giving my consent I acknowledge that my participation in this research is
voluntary, and that I may withdraw my consent at any time without reason and without prejudice;
7. all information provided is treated as strictly confidential and will not be released by the investigator unless required to do so by law;
8. research data gathered for the study may be published provided that my name or other identifying information such as video images are not used;
…………………………………………….. ………………………………… Signaure of participant Date …………………………………………….. ………………………………… Signaure of investigator Date Further questions concerning this study can be referred to Lian Yee, Kok (9380 1383), Dr David Bishop (9380 7282) or Mr Peter Hamer (9380 2365). The Human Research Ethics Committee at The University of Western Australia requires that all participants are informed that, if they have any complaint regarding the manner in which a research study is conducted, it may be given to the researcher or, alternatively to the Secretary, Human Research Ethics Committee, Registrar’s Office, University of Western Australia, 35 Stirling Highway, Crawley, WA 6907 (tel. no. 9380 3703). All study participants will be provided with a copy of the Information Sheet and Consent Form for their personal records.
Human Movement and Exercise ScienceThe University of W estern Australia 35 Stirling Highway, Crawley W A 6009 Phone +61 8 9380 3919 Fax +61 8 9380 1039
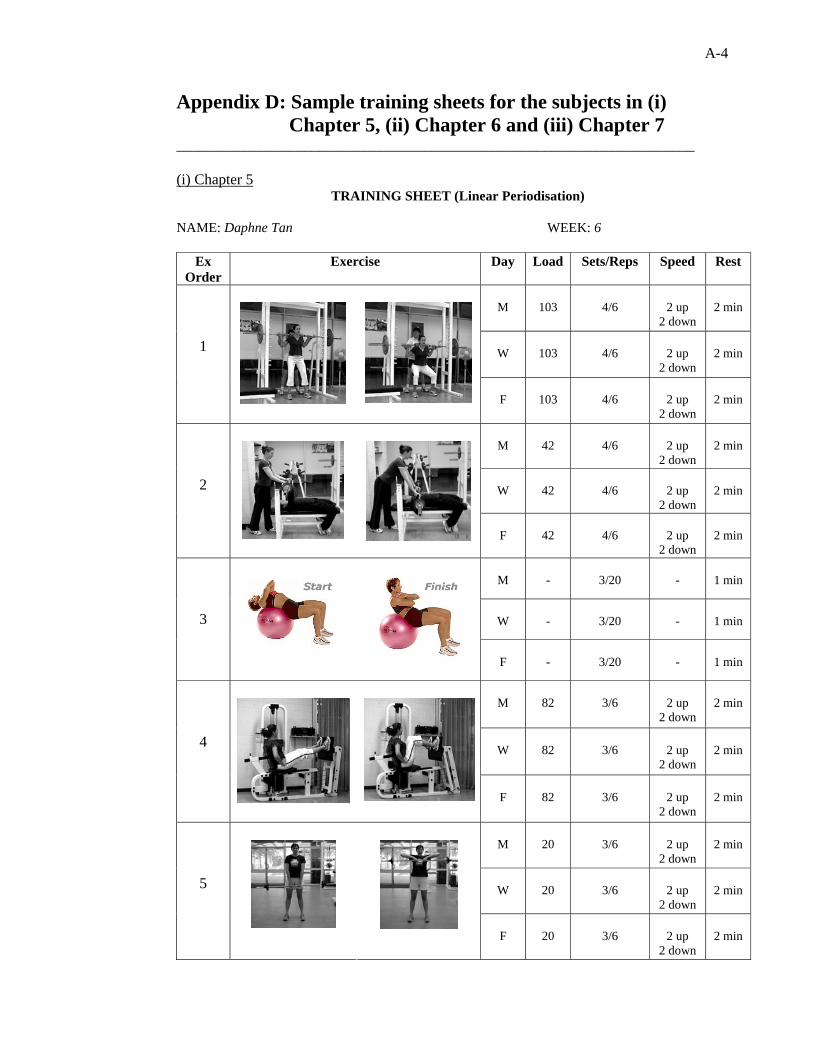
A-4
Appendix D: Sample training sheets for the subjects in (i) Chapter 5, (ii) Chapter 6 and (iii) Chapter 7
_____________________________________________________________________ (i) Chapter 5
TRAINING SHEET (Linear Periodisation) NAME: Daphne Tan WEEK: 6
Ex Order
Exercise Day Load Sets/Reps Speed Rest
M
103
4/6
2 up
2 down
2 min
W
103
4/6
2 up
2 down
2 min
1
F
103
4/6
2 up 2 down
2 min
M
42
4/6
2 up
2 down
2 min
W
42
4/6
2 up
2 down
2 min
2
F
42
4/6
2 up 2 down
2 min
M
-
3/20
-
1 min
W
-
3/20
-
1 min
3
F
-
3/20
-
1 min
M
82
3/6
2 up
2 down
2 min
W
82
3/6
2 up
2 down
2 min
4
F
82
3/6
2 up
2 down
2 min
M
20
3/6
2 up
2 down
2 min
W
20
3/6
2 up
2 down
2 min
5
F
20
3/6
2 up
2 down
2 min
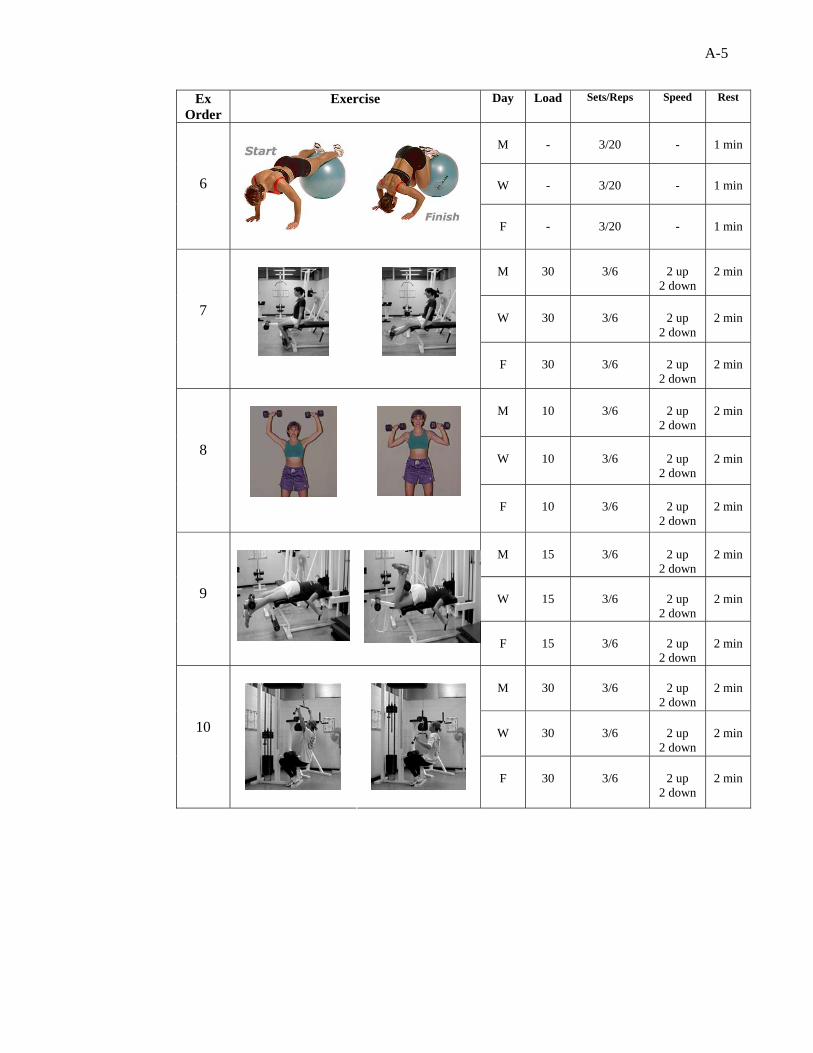
A-5
Ex Order
Exercise Day Load Sets/Reps Speed Rest
M
-
3/20
-
1 min
W
-
3/20
-
1 min
6
F
-
3/20
-
1 min
M
30
3/6
2 up
2 down
2 min
W
30
3/6
2 up
2 down
2 min
7
F
30
3/6
2 up
2 down
2 min
M
10
3/6
2 up
2 down
2 min
W
10
3/6
2 up
2 down
2 min
8
F
10
3/6
2 up
2 down
2 min
M
15
3/6
2 up
2 down
2 min
W
15
3/6
2 up
2 down
2 min
9
F
15
3/6
2 up
2 down
2 min
M
30
3/6
2 up
2 down
2 min
W
30
3/6
2 up
2 down
2 min
10
F
30
3/6
2 up
2 down
2 min
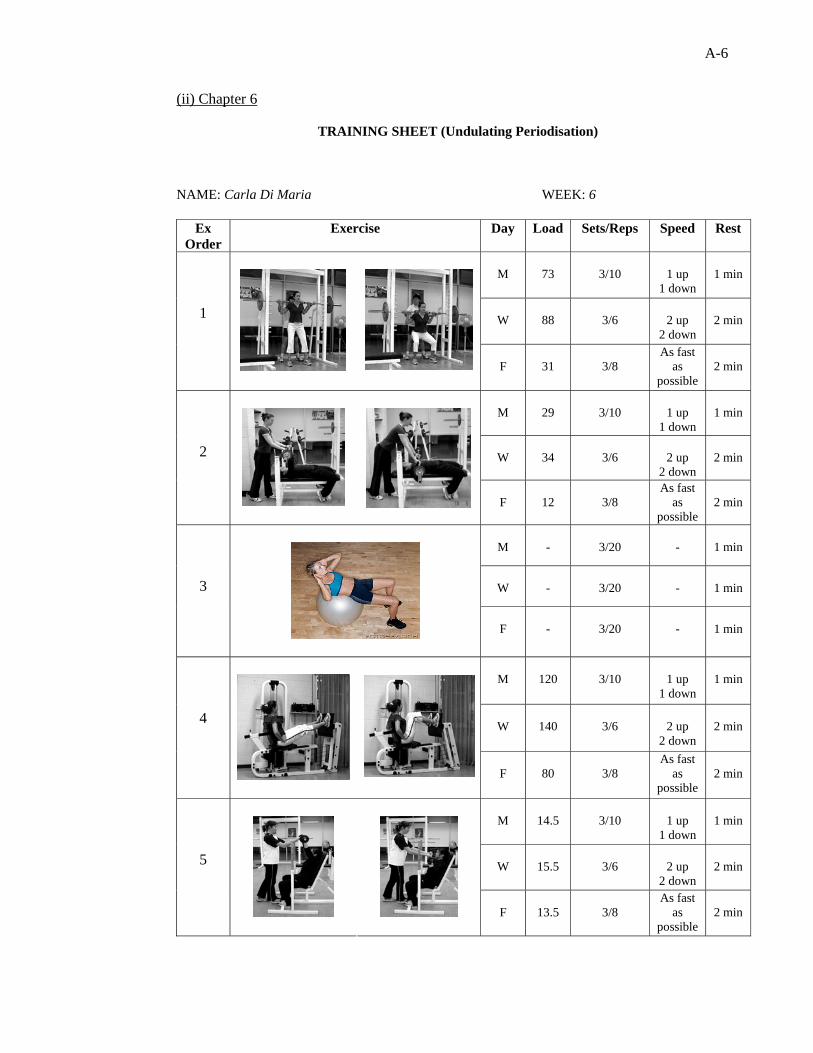
A-6
(ii) Chapter 6
TRAINING SHEET (Undulating Periodisation) NAME: Carla Di Maria WEEK: 6
Ex Order
Exercise Day Load Sets/Reps Speed Rest
M
73
3/10
1 up
1 down
1 min
W
88
3/6
2 up
2 down
2 min
1
F
31
3/8 As fast
as possible
2 min
M
29
3/10
1 up
1 down
1 min
W
34
3/6
2 up
2 down
2 min
2
F
12
3/8 As fast
as possible
2 min
M
-
3/20
-
1 min
W
-
3/20
-
1 min
3
F
-
3/20
-
1 min
M
120
3/10
1 up
1 down
1 min
W
140
3/6
2 up
2 down
2 min
4
F
80
3/8
As fast as
possible
2 min
M
14.5
3/10
1 up
1 down
1 min
W
15.5
3/6
2 up
2 down
2 min
5
F
13.5
3/8 As fast
as possible
2 min
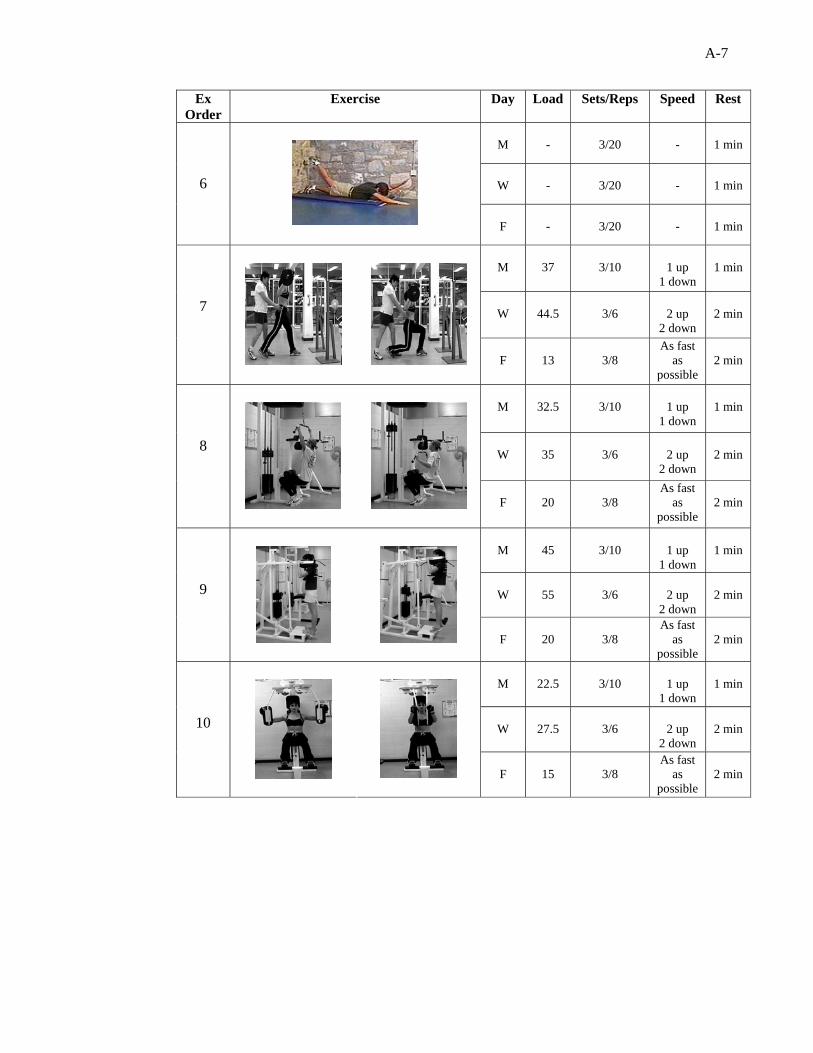
A-7
Ex Order
Exercise Day Load Sets/Reps Speed Rest
M
-
3/20
-
1 min
W
-
3/20
-
1 min
6
F
-
3/20
-
1 min
M
37
3/10
1 up
1 down
1 min
W
44.5
3/6
2 up
2 down
2 min
7
F
13
3/8 As fast
as possible
2 min
M
32.5
3/10
1 up
1 down
1 min
W
35
3/6
2 up
2 down
2 min
8
F
20
3/8 As fast
as possible
2 min
M
45
3/10
1 up
1 down
1 min
W
55
3/6
2 up
2 down
2 min
9
F
20
3/8 As fast
as possible
2 min
M
22.5
3/10
1 up
1 down
1 min
W
27.5
3/6
2 up
2 down
2 min
10
F
15
3/8 As fast
as possible
2 min
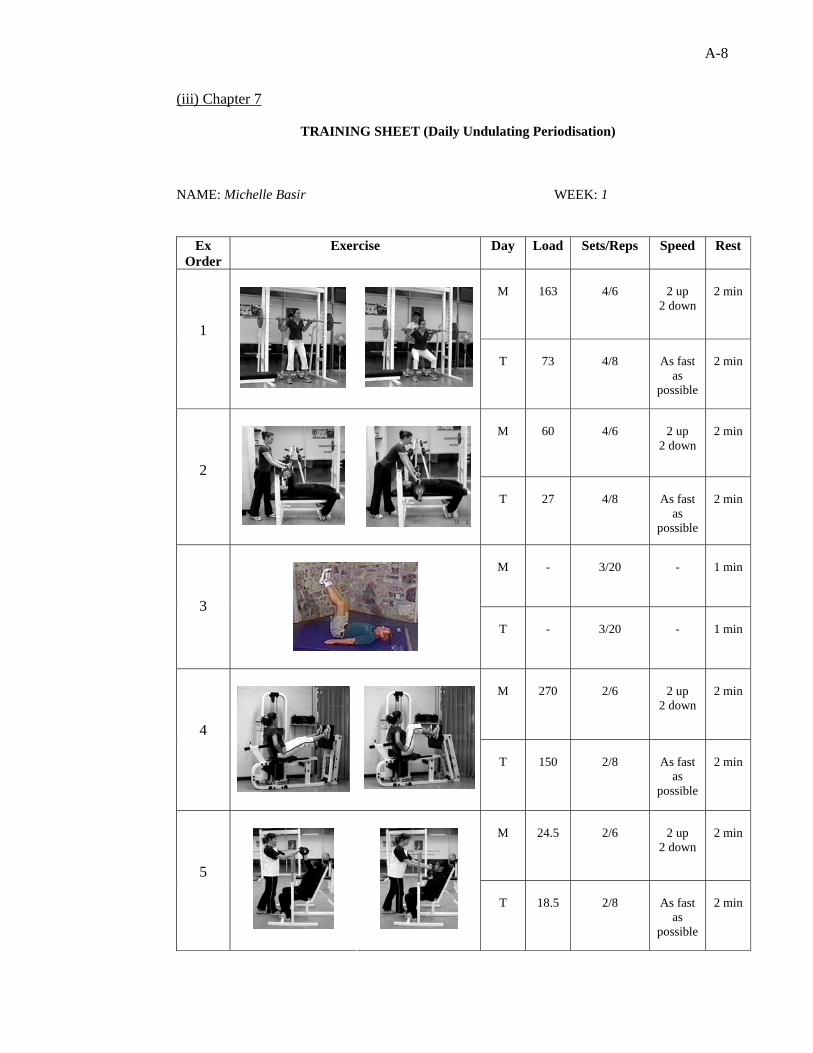
A-8
(iii) Chapter 7
TRAINING SHEET (Daily Undulating Periodisation) NAME: Michelle Basir WEEK: 1
Ex Order
Exercise Day Load Sets/Reps Speed Rest
M
163
4/6
2 up
2 down
2 min
1
T
73
4/8
As fast
as possible
2 min
M
60
4/6
2 up
2 down
2 min
2
T
27
4/8
As fast
as possible
2 min
M
-
3/20
-
1 min
3
T
-
3/20
-
1 min
M
270
2/6
2 up
2 down
2 min
4
T
150
2/8
As fast
as possible
2 min
M
24.5
2/6
2 up
2 down
2 min
5
T
18.5
2/8
As fast
as possible
2 min
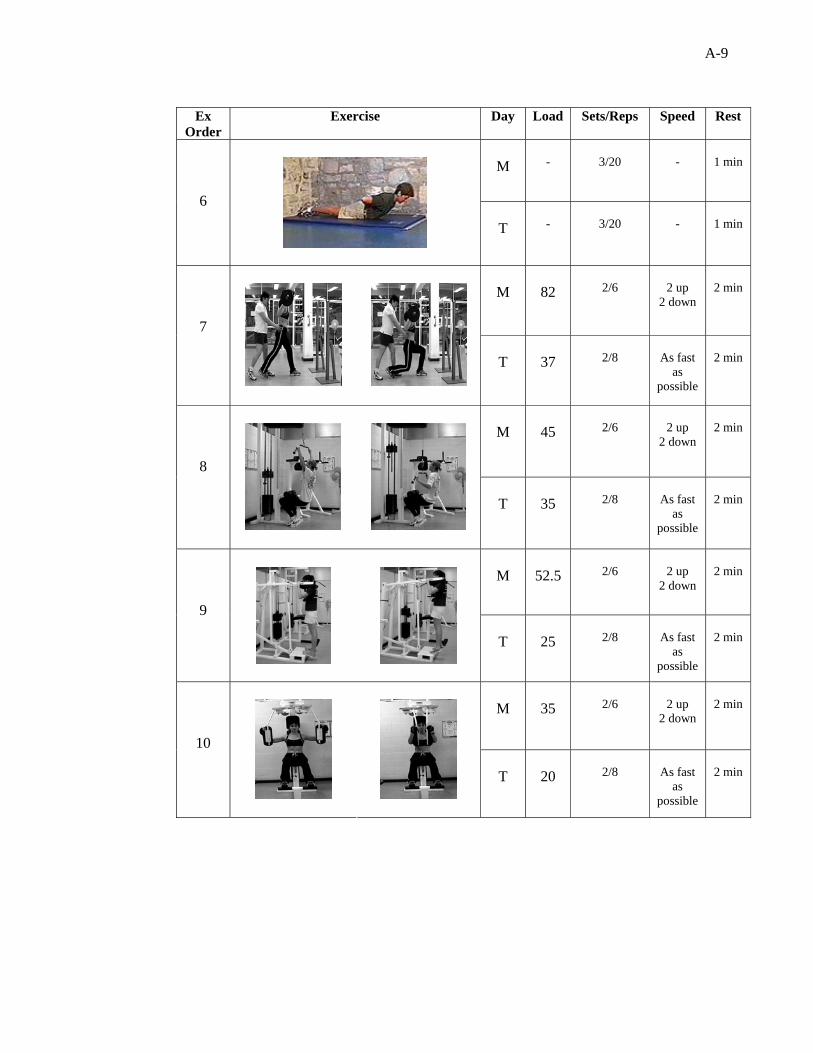
A-9
Ex
Order Exercise Day Load Sets/Reps Speed Rest
M
-
3/20
-
1 min
6
T
-
3/20
-
1 min
M
82
2/6
2 up
2 down
2 min
7
T
37
2/8
As fast
as possible
2 min
M
45
2/6
2 up
2 down
2 min
8
T
35
2/8
As fast
as possible
2 min
M
52.5
2/6
2 up
2 down
2 min
9
T
25
2/8
As fast
as possible
2 min
M
35
2/6
2 up
2 down
2 min
10
T
20
2/8
As fast
as possible
2 min
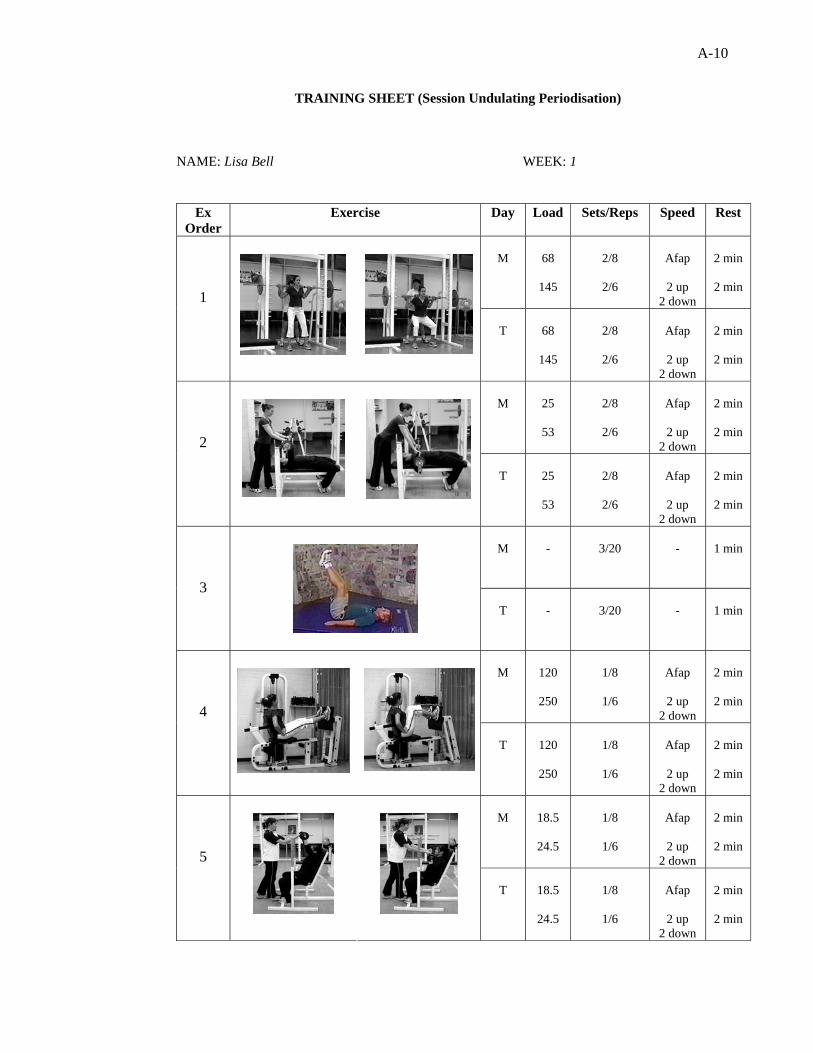
A-10
TRAINING SHEET (Session Undulating Periodisation) NAME: Lisa Bell WEEK: 1
Ex Order
Exercise Day Load Sets/Reps Speed Rest
M
68
145
2/8
2/6
Afap
2 up
2 down
2 min
2 min
1
T
68
145
2/8
2/6
Afap
2 up
2 down
2 min
2 min
M
25
53
2/8
2/6
Afap
2 up
2 down
2 min
2 min
2
T
25
53
2/8
2/6
Afap
2 up
2 down
2 min
2 min
M
-
3/20
-
1 min
3
T
-
3/20
-
1 min
M
120
250
1/8
1/6
Afap
2 up
2 down
2 min
2 min
4
T
120
250
1/8
1/6
Afap
2 up
2 down
2 min
2 min
M
18.5
24.5
1/8
1/6
Afap
2 up
2 down
2 min
2 min
5
T
18.5
24.5
1/8
1/6
Afap
2 up
2 down
2 min
2 min
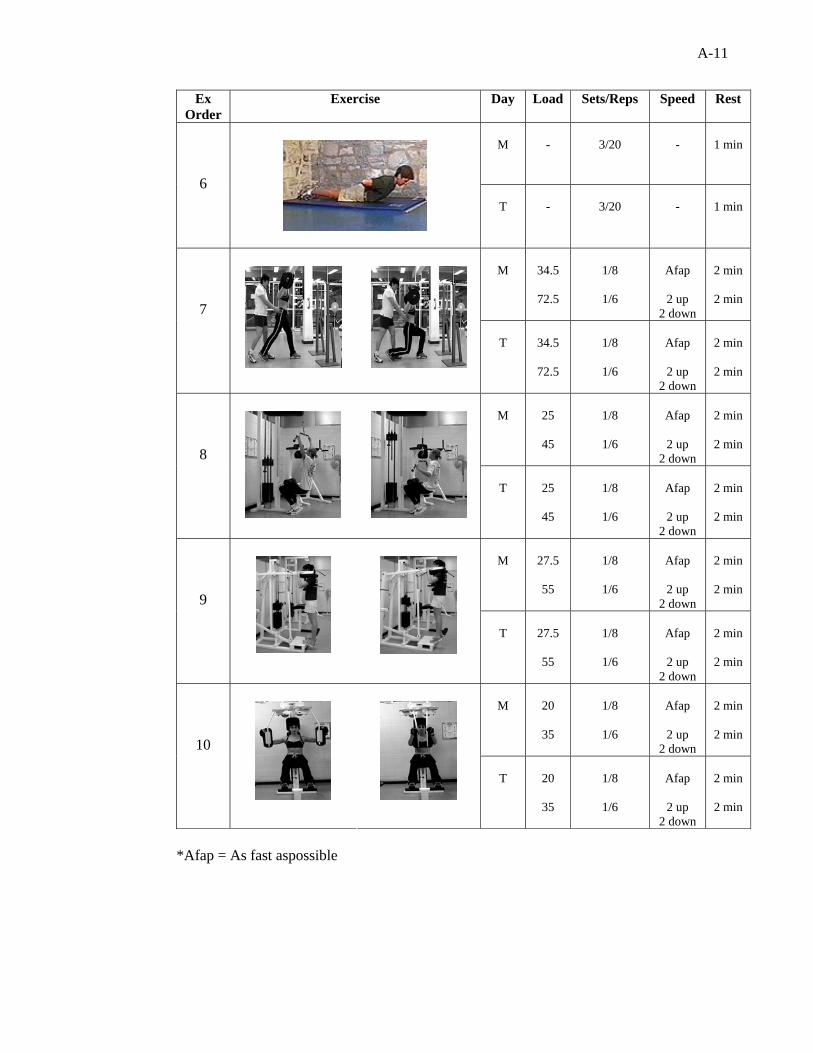
A-11
Ex Order
Exercise Day Load Sets/Reps Speed Rest
M
-
3/20
-
1 min
6
T
-
3/20
-
1 min
M
34.5
72.5
1/8
1/6
Afap
2 up
2 down
2 min
2 min
7
T
34.5
72.5
1/8
1/6
Afap
2 up
2 down
2 min
2 min
M
25
45
1/8
1/6
Afap
2 up
2 down
2 min
2 min
8
T
25
45
1/8
1/6
Afap
2 up
2 down
2 min
2 min
M
27.5
55
1/8
1/6
Afap
2 up
2 down
2 min
2 min
9
T
27.5
55
1/8
1/6
Afap
2 up
2 down
2 min
2 min
M
20
35
1/8
1/6
Afap
2 up
2 down
2 min
2 min
10
T
20
35
1/8
1/6
Afap
2 up
2 down
2 min
2 min
*Afap = As fast aspossible
Related Documents