COMPARING CLASS A COMPRESSED AIR FOAM SYSTEMS (CAFS) AGAINST PLAIN WATER SUPPRESSION IN LIVE FIRE GAS COOLING EXPERIMENTS FOR INTERIOR STRUCTURAL FIREFIGHTING A Thesis presented to the Faculty of California Polytechnic State University, San Luis Obispo In Partial Fulfillment of the Requirements for the Degree Master of Science in Fire Protection Engineering by Sean Carter Mitchell June 2013

Welcome message from author
This document is posted to help you gain knowledge. Please leave a comment to let me know what you think about it! Share it to your friends and learn new things together.
Transcript
COMPARING CLASS A COMPRESSED AIR FOAM SYSTEMS (CAFS) AGAINST PLAIN WATER SUPPRESSION IN LIVE FIRE GAS COOLING EXPERIMENTS FOR INTERIOR
STRUCTURAL FIREFIGHTING
A Thesis
presented to
the Faculty of California Polytechnic State University,
San Luis Obispo
In Partial Fulfillment
of the Requirements for the Degree
Master of Science in Fire Protection Engineering
by
Sean Carter Mitchell
June 2013

ii
© 2013
Sean Carter Mitchell
ALL RIGHTS RESERVED
iii
COMMITTEE MEMBERSHIP
TITLE: Comparing Class A Compressed Air Foam Systems (CAFS) Against Plain Water Suppression in Live Fire Gas Cooling Experiments for Interior Structural Firefighting
AUTHOR: Sean Carter Mitchell
DATE SUBMITTED: June 2013
COMMITTEE CHAIR: Thomas Korman, Ph.D, Associate Professor, Construction Management
COMMITTEE MEMBER: Christopher Dicus, Ph.D, Professor, Natural Resources Management & Environmental Sciences
COMMITTEE MEMBER: Frederick Mowrer, Ph.D, Professor, Fire Protection Engineering
iv
ABSTRACT
Comparing Class A Compressed Air Foam Systems (CAFS) Against Plain Water Suppression in Live Fire Gas Cooling Experiments for Interior Structural Firefighting
Sean Carter Mitchell
Wildland fire services have successfully integrated compressed air foam systems (CAFS) into their fire suppression arsenal over the last few decades to effectively increase the firefighting ability of water. Many urban fire departments have done the same, but far more still rely on plain water to extinguish Class A fires. Many claims have been made about the advantages and disadvantages of firefighting foams, but only limited research has been conducted on the subject to date. Fire departments need more information, beyond that provided by foam suppliers and CAFS equipment manufacturers, to make an independent decision on whether or not to adopt the technology. This thesis is part of a larger project sponsored by the United States Department of Homeland Security Assistance to Firefighter Grant Program (grant ID: EMW-2010-FP-01369) to evaluate the capabilities and limitations of compressed air foam systems (CAFS) for use in structural firefighting applications. Large-scale tests comparing water and foam suppression, which includes aspirated foam and CAFS, in a variety of scenarios were performed to measure the ability of the hose streams to reduce the temperature of a hot gas layer within a structure. These temperature reductions were recorded with thermocouples and are analyzed to determine which suppression agent has a superior gas cooling ability.
Keywords: Compressed air foam systems, CAFS, aspirated foam, water, suppression, structural firefighting, gas cooling, temperature, thermocouple, Class A, foam.
v
TABLE OF CONTENTS LIST OF TABLES ............................................................................................................................ vi
LIST OF FIGURES .......................................................................................................................... vii
1 INTRODUCTION ...................................................................................................................... 1
1.1 Background ...................................................................................................................... 1
1.2 Research Questions ......................................................................................................... 2
1.3 Thesis Statement ............................................................................................................. 3
1.4 Brief History of CAFS ....................................................................................................... 3
1.5 Hypothesis of How CAFS Works ..................................................................................... 4
1.6 Claimed Advantages ........................................................................................................ 6
1.7 Claimed Disadvantages ................................................................................................. 11
2 LITERATURE REVIEW OF PRIOR TESTING ...................................................................... 15
2.1 Comparison between Mock-Up and Acquired Structure Testing ................................... 15
2.2 Constructed Mock-Up Structures ................................................................................... 15
2.3 Acquired Structures ........................................................................................................ 24
2.4 Summary of Prior Testing .............................................................................................. 32
3 FIREGROUND EVOLUTIONS ............................................................................................... 33
4 GAS COOLING EXPERIMENTS ........................................................................................... 34
4.1 Description of Gas Cooling Test .................................................................................... 34
4.2 Instrumentation .............................................................................................................. 35
4.3 Nozzle Types and Settings ............................................................................................ 38
4.4 Procedure ....................................................................................................................... 40
4.5 Data Analysis and Results ............................................................................................. 43
4.6 Discussion ...................................................................................................................... 59
5 CONCLUSIONS AND RECOMMENDATIONS FOR FUTURE RESEARCH ........................ 61
5.1 Other Experiments ......................................................................................................... 61
5.2 Conclusion...................................................................................................................... 64
5.3 Recommendations ......................................................................................................... 65
LIST OF REFERENCES ................................................................................................................ 66
APPENDIX A – EXPERIMENTAL LISTING................................................................................... 69
APPENDIX B – TEMPERATURE GRAPHS .................................................................................. 72
APPENDIX C – TEMPERATURE DROPS .................................................................................. 104
vi
LIST OF TABLES
Table 2-1 UL 1994 Series I ............................................................................................................ 18
Table 2-2 UL 1994 Series II ........................................................................................................... 18
Table 2-3 Ingolstadt 1998 .............................................................................................................. 19
Table 2-4 Dortmund 1998 .............................................................................................................. 20
Table 2-5 UL 2008 ......................................................................................................................... 21
Table 2-6 NRC 2009 ...................................................................................................................... 22
Table 2-7 Carlow County 2010 ...................................................................................................... 23
Table 2-8 Grand Rapids 2011 ........................................................................................................ 24
Table 2-9 Sikeston 1990 ................................................................................................................ 25
Table 2-10 Salem 1993 .................................................................................................................. 26
Table 2-11 Boston 1994 ................................................................................................................. 27
Table 2-12 Fairfax County 1994 .................................................................................................... 28
Table 2-13 Matanuska-Susitna 1997 ............................................................................................. 29
Table 2-14 Los Angeles 2001 ........................................................................................................ 30
Table 2-15 Montgomery County 2002 ........................................................................................... 32
Table 4-1 Nozzles and Settings ..................................................................................................... 38
Table 4-2 Average Temperature Drops 1-ft Below Ceiling ............................................................ 45
Table 4-3 Average Temperature Drops 2-ft Below Ceiling ............................................................ 46
Table 4-4 Average Temperature Drops 6-ft Below Ceiling / 2-ft Below Soffit ................................ 47
Table 4-5 Average Temperature Drops 9-ft Below Ceiling / 5-ft Below Soffit ................................ 48
Table 4-6 P-Values 1-ft Below Ceiling ........................................................................................... 50
Table 4-7 Statistically Significant Tests 1-ft Below Ceiling ............................................................ 51
Table 4-8 P-Values 2-ft Below Ceiling ........................................................................................... 52
Table 4-9 Statistically Significant Tests 2-ft Below Ceiling ............................................................ 53
Table 4-10 P-Values 6-ft Below Ceiling / 2-ft Below Soffit ............................................................. 54
Table 4-11 Statistically Significant Tests 6-ft Below Ceiling / 2-ft Below Soffit .............................. 56
Table 4-12 P-Values 9-ft Below Ceiling / 5-ft Below Soffit ............................................................. 57
Table 4-13 Statistically Significant Tests 9-ft Below Ceiling / 5-ft Below Soffit .............................. 58
Table A-1 Gas Cooling Experiment Listing .................................................................................... 69
Table C-1 Color Code .................................................................................................................. 104
Table C-2 Temperature Drops 1-ft Below Ceiling ........................................................................ 104
Table C-3 Temperature Drops 2-ft Below Ceiling ........................................................................ 106
Table C-4 Temperature Drops 6-ft Below Ceiling / 2-ft Below Soffit ........................................... 108
Table C-5 Temperature Drops 9-ft Below Ceiling / 5-ft Below Soffit ........................................... 110
vii
LIST OF FIGURES
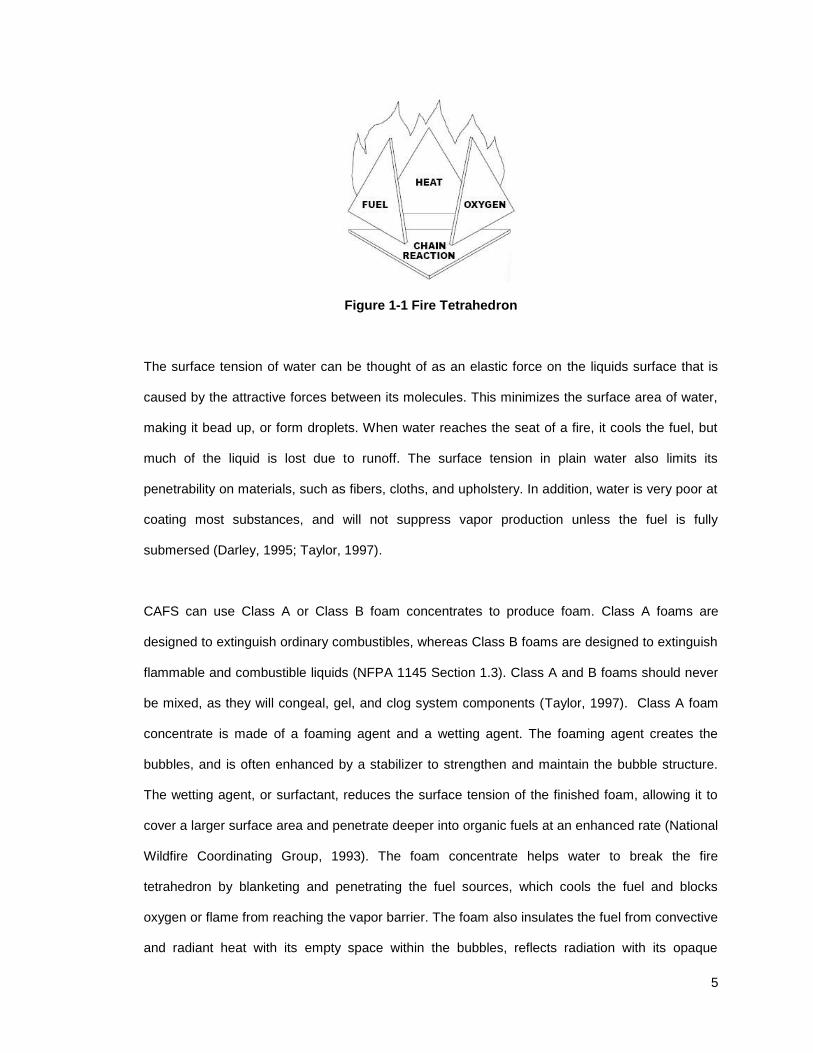
Figure 1-1 Fire Tetrahedron ............................................................................................................. 5
Figure 4-1 Burn Building ................................................................................................................ 34
Figure 4-2 Burn Building Floor Plan ............................................................................................... 34
Figure 4-3 Burning Wooden Pallets ............................................................................................... 34
Figure 4-4 Burn Building Interior .................................................................................................... 35
Figure 4-5 Burn Building Instrumentation ...................................................................................... 35
Figure 4-6 Thermocouple Arrays and Heat Flux Gauge/Radiometer ............................................ 36
Figure 4-7 Doorway Instrumentation .............................................................................................. 36
Figure 4-8 Type-K Inconel Shielded Thermocouples .................................................................... 37
Figure 4-9 Nozzle Types and Spray Patterns ................................................................................ 39
Figure 4-10 Typical 7/8" and 1 3/8” Solid Stream .......................................................................... 39
Figure 4-11 Straight Stream (SS) .................................................................................................. 39
Figure 4-12 30 Fog ......................................................................................................................... 40
Figure 4-13 60 Fog ......................................................................................................................... 40
Figure 4-14 Hoseline/Nozzle Monitor ............................................................................................. 41
Figure 4-15 Hand Held Position ..................................................................................................... 41
Figure 4-16 Thermocouple Locations and Heights That Were Analyzed ...................................... 42
Figure 5-1 Fire Suppression Buildings ........................................................................................... 61
Figure 5-2 Fire Suppression Building Floor Plan ........................................................................... 61
Figure 5-3 Burn Building Spray Pattern ......................................................................................... 61
Figure 5-4 Fire Suppression Building Spray Pattern ..................................................................... 62
Figure 5-5 Burn Room Fuel ........................................................................................................... 63
Figure 5-6 Dual Monitors................................................................................................................ 63
Figure 5-7 Attic Fire Test................................................................................................................ 63
Figure 5-8 Basement Buildings ...................................................................................................... 64
Figure B-1 Thermocouple Array 1, 25th Sept. 2012, Series 1 (Tests 1-11) .................................. 72
Figure B-2 Thermocouple Array 2, 25th Sept. 2012, Series 1 (Tests 1-11) .................................. 73
Figure B-3 Thermocouple Array 3, 25th Sept. 2012, Series 1 (Tests 1-11) .................................. 74
Figure B-4 Thermocouple Array 5, 25th Sept. 2012, Series 1 (Tests 1-11) .................................. 75
Figure B-5 Thermocouple Array 1, 25th Sept. 2012, Series 2 (Tests 12-16) ................................ 76
Figure B-6 Thermocouple Array 2, 25th Sept. 2012, Series 2 (Tests 12-16) ................................ 77
Figure B-7 Thermocouple Array 3, 25th Sept. 2012, Series 2 (Tests 12-16) ................................ 78
Figure B-8 Thermocouple Array 5, 25th Sept. 2012, Series 2 (Tests 12-16) ................................ 79
Figure B-9 Thermocouple Array 1, 26th Sept. 2012, Series 1 (Tests 17-32) ................................ 80
Figure B-10 Thermocouple Array 2, 26th Sept. 2012, Series 1 (Tests 17-32) .............................. 81
viii
Figure B-11 Thermocouple Array 3, 26th Sept. 2012, Series 1 (Tests 17-32) .............................. 82
Figure B-12 Thermocouple Array 5, 26th Sept. 2012, Series 1 (Tests 17-32) .............................. 83
Figure B-13 Thermocouple Array 1, 26th Sept. 2012, Series 2 (Tests 33-56) .............................. 84
Figure B-14 Thermocouple Array 2, 26th Sept. 2012, Series 2 (Tests 33-56) .............................. 85
Figure B-15 Thermocouple Array 3, 26th Sept. 2012, Series 2 (Tests 33-56) .............................. 86
Figure B-16 Thermocouple Array 5, 26th Sept. 2012, Series 2 (Tests 33-56) .............................. 87
Figure B-17 Thermocouple Array 1, 26th Sept. 2012, Series 3 (Tests 57-63) .............................. 88
Figure B-18 Thermocouple Array 2, 26th Sept. 2012, Series 3 (Tests 57-63) .............................. 89
Figure B-19 Thermocouple Array 3, 26th Sept. 2012, Series 3 (Tests 57-63) .............................. 90
Figure B-20 Thermocouple Array 5, 26th Sept. 2012, Series 3 (Tests 57-63) .............................. 91
Figure B-21 Thermocouple Array 1, 27th Sept. 2012, Series 1 (Tests 64-65) .............................. 92
Figure B-22 Thermocouple Array 2, 27th Sept. 2012, Series 1 (Tests 64-65) .............................. 93
Figure B-23 Thermocouple Array 3, 27th Sept. 2012, Series 1 (Tests 64-65) .............................. 94
Figure B-24 Thermocouple Array 5, 27th Sept. 2012, Series 1 (Tests 64-65) .............................. 95
Figure B-25 Thermocouple Array 1, 27th Sept. 2012, Series 2 (Tests 66-75) .............................. 96
Figure B-26 Thermocouple Array 2, 27th Sept. 2012, Series 2 (Tests 66-75) .............................. 97
Figure B-27 Thermocouple Array 3, 27th Sept. 2012, Series 2 (Tests 66-75) .............................. 98
Figure B-28 Thermocouple Array 5, 27th Sept. 2012, Series 2 (Tests 66-75) .............................. 99
Figure B-29 Thermocouple Array 1, 27th Sept. 2012, Series 3 (Tests 76-88) ............................ 100
Figure B-30 Thermocouple Array 2, 27th Sept. 2012, Series 3 (Tests 76-88) ............................ 101
Figure B-31 Thermocouple Array 3, 27th Sept. 2012, Series 3 (Tests 76-88) ............................ 102
Figure B-32 Thermocouple Array 5, 27th Sept. 2012, Series 3 (Tests 76-88) ............................ 103
1
1 INTRODUCTION
1.1 Background
The United States Department of Homeland Security Assistance to Firefighter Grant Program,
under grant ID: EMW-2010-FP-01369, sponsored this nationwide research project. A partnership
between the California Polytechnic State University San Luis Obispo (Cal Poly), the National
Institute of Standards and Technology (NIST), and the National Fire Protection Association’s Fire
Protection Research Foundation (FPRP), was formed to evaluate the capabilities and limitations
of compressed air foam systems (CAFS) for use in interior structural firefighting applications. The
overall goal of the project is to enhance the scientific knowledge base regarding its effectiveness
and safety implications in fireground operations. CAFS have been widely used by wildland fire
services since the 1970s, and many urban fire departments have adopted their use in the last few
decades. Those that have had a positive experience with CAFS claim it can knockdown fires
much faster, using less water, and reduce the possibility of rekindle. Many others, however, have
become skeptical of the new technology. For example, Montgomery County Fire & Rescue
Service (MCFRS) purchased thirty-six (36) CAFS, but in 2010 the fire chief issued a general
order prohibiting their use after an incident occurred where firefighters were burned while
performing interior structure suppression operations, citing that the technology lacked
comprehensive research.
Prior to this grant much of the research conducted has been performed by CAFS manufacturers.
The fire service needs independent research to decide whether or not the use of CAFS for interior
structural firefighting is effective, safe, and a justifiable investment. Pilot programs and testing
have been performed by independent fire departments that examine implementation and
effectiveness of CAFS; however, minimally instrumented tests were also performed by foam
solution suppliers and CAFS equipment manufacturers. Other studies have been conducted by
laboratories and universities, but still a lack of knowledge exists.
2
There is a demand for enhanced firefighting agents and systems within the fire service
community. During the 2005 National Fire Service Research Agenda Symposium, one of the
issues raised was to “improve extinguishing agents and delivery systems.” The purpose of this
research is said to “reduce the exposure of firefighters to the risks of interior fire suppression by
developing more effective extinguishing agents and systems. These advances should also result
in reductions in civilian deaths and injuries as well as property damage (National Fire Service
Research Agenda Symposium, 2005).”
The use of CAFS in wildland firefighting and structural firefighting is very different. In the wildland
environment CAFS is used directly on the burning fuel in open air. In an interior structural fire,
firefighters must be able to navigate an unfamiliar environment, and are often exposed to hot
combustion products. En route to the source of the fire, hot gas layers within the structure may
present a serious hazard, which must be cooled before personnel can safely proceed. These
conditions differ from wildland firefighting considerably and need to be better understood when
using CAFS as the primary means of suppression.
1.2 Research Questions
In order to evaluate the effectiveness of CAFS for interior structural firefighting, both large-scale
enclosure fire tests and fireground evolutions were performed. The large-scale tests involved
comparing water and foam suppression, which includes aspirated foam and CAFS, in a variety of
scenarios. They included:
1. What are the differences in hose stream spray distribution patterns?
2. Is CAFS able to reduce the temperature of a hot gas layer and improve the impact on
ventilation and movement of fire gases within the structure as good as or better than
plain water?
3. What effect does CAFS have on the thermal conditions, temperature and heat fluxes,
that a firefighter would be exposed to while advancing a hoseline down the corridor
toward a fire room and during the gas cooling and fire suppression phases?
3
The fireground evolutions involved developing test apparatuses and test procedures for
measuring safety-related parameters. They included:
1. Does CAFS have an increased nozzle reaction force?
2. Is there a greater force required to kink CAFS hoses under both static and flowing
conditions?
3. What are the hose stream throw and distribution characteristics of CAFS?
4. Does CAFS decrease the friction on a variety of wetted surfaces?
The focus of this thesis is on the second research question of the large-scale enclosure fire tests,
the gas cooling experiments.
1.3 Thesis Statement
Does the temperature data from the large-scale gas cooling experiments support or refute the
claimed advantages of using compressed air foam systems over plain water for interior structural
firefighting?
1.4 Brief History of CAFS
Fire suppression foams have a long history beginning 100 years ago. The first use of foam
additives to enhance the firefighting ability of water was documented in an 1877 chemical patent
to create foam (Taylor, 1997). The concept of compressed air foam was developed much later. In
the 1930s, the United Kingdom Royal Navy and the United States Navy both experimented with
the technology (Darley, 1995). The US Navy continued to use CAFS for flammable Class B liquid
fires in the 1940s. In the 1970s, the Texas Forest Service was the first to employ CAFS to use in
wildland firefighting (McKenzie, 1992). Their suppression system, known as the “Texas Snow
Job” for its snow like appearance on discharge, pioneered the Class A CAFS, using a pine soap
derivative acquired from paper mills to produce the foam (Fornell, 1991; Taylor, 1997). The next
big technological breakthroughs for CAFS were developed in the mid-1980s. A new type
synthetic hydrocarbon surfactant foaming agent was manufactured in Canada (Madrzykowski,
1988). Research conducted by the US Bureau of Land Management lead to innovations in the
4
design of rotary air compressors, centrifugal pumps, and direct-injection foam-proportioning
systems to better distribute the agent (Taylor, 1997). In 1988, CAFS received national attention
when it was used to pretreat Old Faithful Lodge at Yellowstone National Park, preventing its
destruction from a wildfire (Darley, 1995). In the 1990s, forestry officials hypothesized that, based
on their experience with CAFS, it could be successful in interior structural firefighting, which
interested many urban fire departments (Tinsley, 2002). To this date many fire departments have
adopted CAFS, but far more are still using plain water on Class A fires.
1.5 Hypothesis of How CAFS Works
CAFS produces foam that is generated by mixing water, compressed air, and by injecting a foam
concentrate. Each component is thought to contribute to the ability to fight the fire. Water is the
most critical part of the mixture for Class A fires, as foam cannot extinguish a fire on its own
(Steppan and Pabich, 2008), nor can air (unless it is rapidly cooling a small fuel source, such as a
lit candle). Water dismantles the fire tetrahedron by absorbing the heat of the fuel, cooling it
below its critical flame temperature. The fire tetrahedron is a convenient way to imagine the
requirements to support flaming combustion (refer to Figure 1-1). If one piece in the tetrahedron
is removed, the fire will be extinguished. Water is desirable as an extinguishing agent for a
number of reasons. It has a high thermal inertia and high latent heat of vaporization. It can absorb
more heat for its mass better than any other known element excluding mercury. Its latent heat of
vaporization is four (4) times that of any other non-flammable liquid, allowing it to expand up to
1,700 times is original size when vaporizing. Water also has a higher specific heat than most
other substances, which is the physical property that makes it an efficient extinguishing agent. It
is easily transported by pumps, because it remains constant over a wide range of temperatures,
and is generally available wherever humans live. Water’s high surface tension allows it to be
applied as small droplets or solid streams, but limits its extinguishing ability (Taylor, 1997; Lohr,
2002).
5
Figure 1-1 Fire Tetrahedron
The surface tension of water can be thought of as an elastic force on the liquids surface that is
caused by the attractive forces between its molecules. This minimizes the surface area of water,
making it bead up, or form droplets. When water reaches the seat of a fire, it cools the fuel, but
much of the liquid is lost due to runoff. The surface tension in plain water also limits its
penetrability on materials, such as fibers, cloths, and upholstery. In addition, water is very poor at
coating most substances, and will not suppress vapor production unless the fuel is fully
submersed (Darley, 1995; Taylor, 1997).
CAFS can use Class A or Class B foam concentrates to produce foam. Class A foams are
designed to extinguish ordinary combustibles, whereas Class B foams are designed to extinguish
flammable and combustible liquids (NFPA 1145 Section 1.3). Class A and B foams should never
be mixed, as they will congeal, gel, and clog system components (Taylor, 1997). Class A foam
concentrate is made of a foaming agent and a wetting agent. The foaming agent creates the
bubbles, and is often enhanced by a stabilizer to strengthen and maintain the bubble structure.
The wetting agent, or surfactant, reduces the surface tension of the finished foam, allowing it to
cover a larger surface area and penetrate deeper into organic fuels at an enhanced rate (National
Wildfire Coordinating Group, 1993). The foam concentrate helps water to break the fire
tetrahedron by blanketing and penetrating the fuel sources, which cools the fuel and blocks
oxygen or flame from reaching the vapor barrier. The foam also insulates the fuel from convective
and radiant heat with its empty space within the bubbles, reflects radiation with its opaque
6
surface, and interrupts the fire’s chemical chain rations (Taylor, 1997). These firefighting
characteristics of foam would not be possible without the addition of air.
Air is necessary to create the bubbles in foam. There are two primary methods of adding air to
the foam solution, to create the finished foam. The low energy method uses an aspirated nozzle
at the end of a hoseline, and is known as aspirated foam. The high energy method uses a
compressor or any compressed air source, and is known as compressed air foam. The base
components of a compressed air foam system include a centrifugal water pump, a foam
proportioning device, an air compressor, and a control valve. Foam concentrate is mixed with
water to create a foam solution, which is then pumped to combine with the compressed air. As
the solution and compressed air travel down the discharge line, scrubbing occurs between the
inner hose walls to form the consistent, long-lasting bubble structure. A medium type foam is
produced when one (1) gallon per minute flow of foam solution is matched for every cubic foot of
compressed air (i.e. 120-gpm solution and 120-cfm air). A dry foam is created by using increased
amounts of compressed air to reduce the amount of water in the foam (gpm solution < cfm air),
and is typically used in exposure protection. A wet foam is made by using increased amounts of
water to reduce the amount of compressed air in the foam (gpm solution > cfm air), and is
effective for initial attacks (Darley, 1995). Not all CAF systems are identical, but they all use the
basic mechanics outlined above to deliver an improved firefighting agent.
1.6 Claimed Advantages
Some of the claimed advantages that CAFS has over plain water, as reported by Taylor (1997),
Stern, and Routley (1996), are summarized below:
1. Class A foam is faster than plain water in fire suppression and extinguishment
2. Class A foam uses water efficiently and conservatively
3. Class A foam concentrate is relatively inexpensive
4. Class A foam creates a protective blanket
5. The foam is clearly discernible during and after application
7
6. The foam adheres to most surfaces and is retained much longer than plain water
7. CAFS hoselines are much lighter than water hoselines
8. The foam may increase preservation of fire forensic evidence
9. Class A foam supports wildland/urban interface attack
10. Class A foam may provide long term financial savings and less severe property damage
11. The foam may help reduce stress and fatigue on firefighters
12. Class A foam enhances the cooling ability of water
13. CAFS has a much longer throw distance than plain water
14. CAFS has a lower impact on the environment and equipment
1.6.1 Class A foam is faster than plain water in fire suppression and extinguishment
Shorter knockdown times have been observed in fireground operations and experimentation
when using Class A foam, or have been at least equally effective as plain water. In no written
cases has a foam solution performed worse than plain water when using comparable equipment.
1.6.2 Class A foam uses water efficiently and conservatively
The foam enhanced water will knockdown a fire with much less gallons of agent due to the
properties that enhance the effect of the water, especially when using CAFS. City of Boston in
1992 estimated that a fire engine using a 1,000-gpm pumper with a 700-gallon water tank, could
operate a single CAFS 1 3/4-inch attack line for about ten (10) minutes before needing an
additional water supply. Using plain water with the same configuration could only operate for
approximately three (3) to four (4) minutes. Water conservation is particularly important when
operating in rural areas with limited water supply. Using less water also translates to reduced
water damage from overhaul.
1.6.3 Class A foam concentrate is relatively inexpensive
The foam is proportioned at rates between 0.1% and 1.0%. To produce 1,000 gallons of Class A
foam solution at a concentration of 0.5%, five (5) gallons of foam concentrate would be required
8
with 995 gallons of water. At a rate of $18/gallon (see cost calculations below) for concentrate this
amounts to $90 per 1,000 gallons of agent. This cost is estimated by one fire department to be
offset by the savings in diesel fuel that result from shorter field operation durations. Reduced
property damage could also justify the extra cost of foam concentrate.
The cost per gallon of foam concentrate is calculated from the expenses incurred by the Cambria
Community Service District Fire Department during the fireground evolutions. A five (5) gallon pail
of PHOS-CHeK Class A foam concentrate costs $82.74 (from supplier ALLSTAR Fire Equipment,
Inc.). Ten (10) pails cost $827.40. With 7.5% Cambria, CA sales tax ($62.06), the total comes to
$889.46. The after tax price per gallon of concentrate is:
($827.40 + $62.06) / (5 gallons/pail * 10 pails) = $17.79/gallon ≈ $18/gallon
1.6.4 Class A foam creates a protective blanket
In addition to cooling the fuel of a fire, the foam solution can also separate the fuel from receiving
oxygen by creating a vapor barrier. The barrier also insulates combustibles from radiant heat and
flame impingement, can prevent ignition of pretreated exposures, and reduces the chance of re-
kindling after fire suppression.
1.6.5 The foam is clearly discernible during and after application
Unlike water which is transparent, the foam is opaque and can be easily seen on treated areas.
The nozzle operator can therefore protect more surfaces subject to radiant heat or flame
impingement by eliminating application redundancy.
1.6.6 The foam adheres to most surfaces and is retained much longer than plain water
Water tends to run-off surfaces very easy providing short exposure protection, unless applied
constantly. Class A foam has a much slower run-off time, and is even effective on sloped and
vertical surfaces, providing longer exposure protection and less water damage. The foam solution
9
also penetrates Class A fuels much deeper than plain water, due to its reduced surface tension.
The foam can also cling to water resistant materials, such as vinyl, glass, and paint.
1.6.7 CAFS hoselines are much lighter than water hoselines
As compared to plain water or aspirated foam hoselines of the same length and diameter, CAFS
hoselines are lighter because they are mostly filled with air. This reduces stress and fatigue on
firefighters, and allows for more maneuverable attack lines. Larger diameter CAFS lines can also
be easily handled.
1.6.8 The foam may increase preservation of fire forensic evidence
Class A foam solutions can penetrate and extinguish deep-seated Class A fires, due to its wetting
ability. This can amount to less agent used in overhaul, and therefore less damage caused by the
hose stream impact, better preserving the area for investigators to determine the source of the
fire. The foam will also evaporate over time, uncovering additional evidence.
1.6.9 Class A foam supports wildland/urban interface attack
Class A type foams were first designed to fight wildland fires and control interface fires. It has
been adapted for portable use, brush and fire engines, and aerial platforms (fixed wing and rotary
aircraft).
1.6.10 Class A foam may provide long term financial savings and less severe property
damage
Although not conclusively documented, it is believed that savings can come from shorter
deployments of fire department resources and reduced property damage that would normally
occur by using plain water. Quicker extinguishment and exposure protection, as a result of using
foam, would tie up less operators and cause less water damage to property.
10
1.6.11 The foam may help reduce stress and fatigue on firefighters
Shorter fireground operation durations in suppression, overhaul, and company turn-around could
reduce physical stress on firefighters. Lighter CAFS hoselines enhance this effect, due to their
easier maneuverability.
1.6.12 Class A foam enhances the cooling ability of water
Plain water’s primary fire extinguishing ability is to cool the fuel of a fire, but is not that efficient in
doing so due to its natural properties. The U.S. Department of Agriculture estimates that less than
ten percent (10%) of water applied to an unconfined fire contributes to extinguishment. Class A
foam’s surfactant properties, which decreases the water molecule’s surface tension and enables
water to penetrate fuel, allows CAFS to increase the water’s cooling ability to eighty percent
(80%).
1.6.13 CAFS has a much longer throw distance than plain water
The compressed air pump generates additional forces within the hose stream, propelling the
suppression agent much further. The International Fire Safety Training Association estimates the
fire stream can reach twice as far as plain water or nozzle-aspirated foam. Four (4) break-
horsepower is generated from 40-gpm of water. Adding 20-cfm of air to 40-gpm of water will add
ten (10) break-horsepower, which will increase stream flow by a factor of three (3). A 100-ft CAFS
stream has been reported from a 25-gpm to 50-gpm flow, and a 200-ft CAFS stream from a 180-
gpm (1 1/2-inch deck gun) flow. With this increased throw distance, fire crews can safely attack a
structure fire from the exterior at much further standoff distances.
1.6.14 CAFS has a lower impact on the environment and equipment
Less knockdown time and suppression agent quantity is characteristic of CAFS, and as a result,
reduces the amount of toxic and unburnt products released into the air and collected in run-off
water. CAFS also allows fire engines to idle at lower revolutions per minute, produces no water
hammer within hoselines as a result of mixture compression, and requires less operating
11
pressure due to the lack of friction; all of which reduces the wear and tear on firefighting
equipment.
1.7 Claimed Disadvantages
The primary limitations and claimed disadvantages of CAFS, as discussed in Taylor’s (1997)
applied research project, include increased corrosion, increased slip hazards, slug flow, water
contamination, and increased cost. Other drawbacks to CAFS found in the literature are: line
bursts, nozzle reaction force, and kinking potential.
1. Class A foam concentrate is mildly corrosive
2. Class A foam can be more slippery than plain water
3. Slug flow can result from a CAFS malfunction
4. Class A foam concentrate may be hazardous to the environment
5. CAFS may be too expensive to implement
6. CAFS hoselines exposed to radiant heat are more prone to burst failure
7. CAFS produces a greater nozzle reaction force
8. CAFS may have a greater tendency to kink hoselines
1.7.1 Class A foam concentrate is mildly corrosive
It is comparable to a triple strength dish detergent. Exposure can cause bodily irritation (to the
skin, eyes, and upper respiratory tract), contact dermatitis, and sensitization dermatitis. It may be
corrosive to metals components, such as tanks and pump parts, and apparatus paint and
finishes. It can also reduce the use life of leather gear. Wearing full turnout gear and a self-
contained breathing apparatus is advised when using Class A foams, and should be cleaned
whenever exposed to foam concentrate.
12
1.7.2 Class A foam can be more slippery than plain water
Some fire departments have reported Class A foam concentrate as a falling or slipping hazard.
Others indicate that the foam only creates a slight increase in slip hazard, compared to plain
water, or no additional hazard whatsoever.
1.7.3 Slug flow can result from a CAFS malfunction
This condition occurs when water and compressed air separates within the hoseline, because air
is unable to bond with the water due to insufficient surfactant. This causes a violent serpentine
hose motion or pulsation, and an inadequate suppression agent mixture (Darley, 1995; Taylor,
1997). To reduce the chance of slug flow, CAFS systems should be selected with a mechanical
fail-safe that shuts down the air pump when foam does not flow. Some evidence also suggests
that slug flow may wear out hoselines faster, resulting in earlier separation of interior hoseliners
or coupling failure. In the event of a hoseline burst or coupling blow off failure, the broken
hoseline ends will be much more hazardous than a ruptured plain water hoseline, as the built up
CAFS pressure from air compression due to hoseline shutoff causes greater whipping/moving
forces (Fornell, 1991). This may have been a factor that contributed to the death of two (2)
German firefighters in 2005, and will be discussed later. All hoselines, therefore, should be
approved for CAFS use by the manufacture.
1.7.4 Class A foam concentrate may be hazardous to the environment
Finished foams (foam solutions that are properly proportioned with water and foam concentrate)
are considered biodegradable, when the concentrate is approved by the USDA Forrest Service
and NFPA 1150; although long term impacts have not been documented. Ground water can
become contaminated, however, when it comes in contact with foam concentrate. Care should be
taken whenever the concentrate is handled.
13
1.7.5 CAFS may be too expensive to implement
New equipment, training, and maintenance will likely incur expenditures that are too difficult to
justify. The cost for a new CAF system can be as high as $50,000 to $35,000 per engine (Lyon,
2009; Stern and Routley, 1996) or fifteen percent (15%) of the engine base price (Duncan, 1994).
Foam concentrate is nearly $18 per gallon, which can add up when proportioned at higher
percentages (as high as 1.0% for some applications). Training and system maintenance may also
present high costs that cannot easily be predicted.
1.7.6 CAFS hoselines exposed to radiant heat are more prone to burst failure
One of the most dangerous faults with CAFS became infamous in 2005 when two (2) German
firefighters were killed after becoming trapped during a fire. Although the main cause of death
was carbon monoxide poisoning, as a result of the historical wooden construction and more
recent renovations that did not remove the stairwell from other rooms, it presented new concerns
for using CAFS. While stuck on the upper floor, their CAFS line became exposed to radiant heat
from the fire involved story below. This led to a hoseline burst, which would have happened
several minutes later, had they been using a plain water line. Post incident testing confirmed that
a CAFS line exposed to radiant heat or glowing embers will fail much faster than a water line due
to the foams reduced heat capacity (de Vries, 2007).
1.7.7 CAFS produces a greater nozzle reaction force
One of the lessons learned from the Los Angeles Fire Department during their field experiments
was that a fully charged CAF line has a very strong nozzle reaction. They recommend using
pistol-grips, or other auxiliary support devices, with CAFS as the hose stream has enough energy
to kick up loose objects. They also suggest wearing eye protection when working up close
(Cavette, 2001). Another set of tests by the Morristown Fire Bureau concluded the same thing,
that CAFS lines produce greater nozzle reactions when trying to achieve the same gallons per
minute of solution as plain water hoselines (Taylor, 1997).
14
1.7.8 CAFS may have a greater tendency to kink hoselines
CAFS hoselines can become kinked due to the air and foam mixture making up two-thirds (2/3) of
the product content. A survey reported that thirty-seven (37) out of seventy (70) firefighters had
problems with kinking during training or firefighting. Slug flow may also develop when a hoseline
kinks, as the consistency of the foam is changed by the restricted flow. One article claims that
kinked hoselines will actually improve the finished foam product. Another suggests that kinking is
normally caused by improperly deployed hoselines, not specifically caused by the CAFS agent
(Lyon, 2009). During 146 field tests using CAFS, the Boston Fire Department had only two (2)
cases of hoseline kinks (Routley, 1994), indicating that kinking is not as big of a problem as some
may believe.
15
2 LITERATURE REVIEW OF PRIOR TESTING
2.1 Comparison between Mock-Up and Acquired Structure Testing
The only way to know whether the claims about CAFS are true is through well documented live
fire field testing. Field testing is most commonly performed using constructed mock-up structures
or acquired structures. With a mock-up structure, one or more rooms are constructed using
noncombustible material, and are filled with fuel packages that can consist of wall boards, carpet,
furniture, wooden pallets, or wood cribs. The benefit of a mock up structure is that multiple tests
can be conducted using the same room configuration, as the spent fuel is replaced with identical
fuel loads. The drawback to this method is that it is not a real building, and lacks structural
features such as an attic space or other rooms where a fire could spread. Testing in acquired
structures offers the most realistic method for testing the effectiveness of CAFS, as it creates a
fire scenario that is as close to an actual 911 call as possible. The structures burned are typically
slated for demolition; therefore, there is usually some degree of dilapidation within the structure.
These buildings, unless lined with noncombustible material, can only be used once. Repeat
testing is usually not an option or is limited. Finding buildings with identical floor plans can also be
a limitation. Several articles documenting the effectiveness of CAFS verses plane water using
either mock-up structures or real buildings are summarized below.
2.2 Constructed Mock-Up Structures
The following are interior structural fire suppression tests that compare foam agents against
water, conducted in test rooms built specifically for multiple experiments. These tests are better
representations of an actual fire than open air wooden crib or hydrocarbon pan fire tests (of which
there are many published), as the hot gases produced by the fire are confined to the test room.
The hot gases can pose an extreme hazard to building occupants and emergency responders,
and are therefore important test parameters. The tests included in the literature review are:
Underwriters Laboratories, 1994
Ingolstadt, 1998
16
Dortmund, 1998
Underwriters Laboratories, 2008
National Research Council of Canada, 2009
Carlow County Fire and Rescue Service, 2010
Grand Rapids Fire Department, 2011
Underwriters Laboratories, 1994
In 1994, the Fire Protection Research Foundation (FPRF) performed a series of tests at the
Underwriters Laboratories (UL) in Northbrook, Illinois comparing water, Class A foam solution,
and Class A compressed air foam (CAF). The test enclosure measured 8-ft by 12-ft by 8-ft high,
and was adjacent to an 8-ft by 8-ft calorimeter collection hood positioned over the doorway
opening. The walls of the structure were fitted with plywood, while the ceiling was covered in tiles.
The first series of tests (Series I) used a residential fuel package, consisting of a wood crib and
simulated furniture made of polyether cushions with wooden support frames. The second series
of tests (Series II) used a corner style upholstered sofa scenario, made of polyether mattresses to
simulate the cushions on a steel frame. For each series the heat release rate was recorded
verses time, as well as the time and quantity of agent required to reduce the rate of heat release
to 500-kW. Thermocouples measured the heat while the rate of heat release was measured by
oxygen consumption calorimetry. Additional instrumentation was also set up to record foam
solution/water flow rate, smoke density, and heat flux. Data demonstrated that both the Class A
foam solution and CAF provided enhanced structural fire suppression performance compared to
water alone.
Series I tests produced the following findings for seven (7) total experiments (one [1] free burn,
two [2] tests using water indirectly and directly, two [2] tests using Class A foam solution indirectly
and directly, and two [2] tests using CAF indirectly; all using a 5-gpm flow rate). The Class A foam
solution applied directly to the fuel took slightly less time to suppress, used a little less quantity of
agent, and had a somewhat lower total heat release (from agent application until rate of heat
17
release was reduced to 500-kW) than plain water suppression. Applied indirectly, water and the
Class A foam solution had near identical: suppression times, quantity of agent used, and total
heat release (from application until rate reduced to 500-kW). The CAF direct suppression time
and quantity of agent used mimicked the water and Class A foam solution values for one run, but
were slightly more for the second run, and had higher total heat release for both runs.
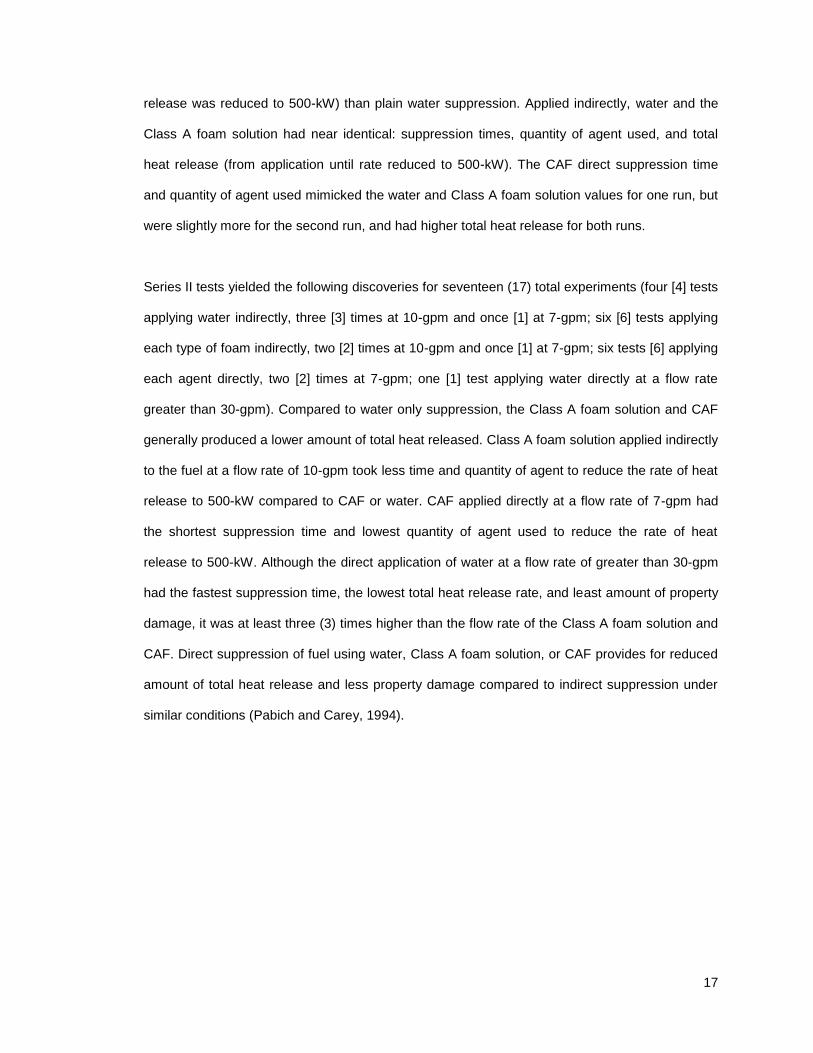
Series II tests yielded the following discoveries for seventeen (17) total experiments (four [4] tests
applying water indirectly, three [3] times at 10-gpm and once [1] at 7-gpm; six [6] tests applying
each type of foam indirectly, two [2] times at 10-gpm and once [1] at 7-gpm; six tests [6] applying
each agent directly, two [2] times at 7-gpm; one [1] test applying water directly at a flow rate
greater than 30-gpm). Compared to water only suppression, the Class A foam solution and CAF
generally produced a lower amount of total heat released. Class A foam solution applied indirectly
to the fuel at a flow rate of 10-gpm took less time and quantity of agent to reduce the rate of heat
release to 500-kW compared to CAF or water. CAF applied directly at a flow rate of 7-gpm had
the shortest suppression time and lowest quantity of agent used to reduce the rate of heat
release to 500-kW. Although the direct application of water at a flow rate of greater than 30-gpm
had the fastest suppression time, the lowest total heat release rate, and least amount of property
damage, it was at least three (3) times higher than the flow rate of the Class A foam solution and
CAF. Direct suppression of fuel using water, Class A foam solution, or CAF provides for reduced
amount of total heat release and less property damage compared to indirect suppression under
similar conditions (Pabich and Carey, 1994).
18
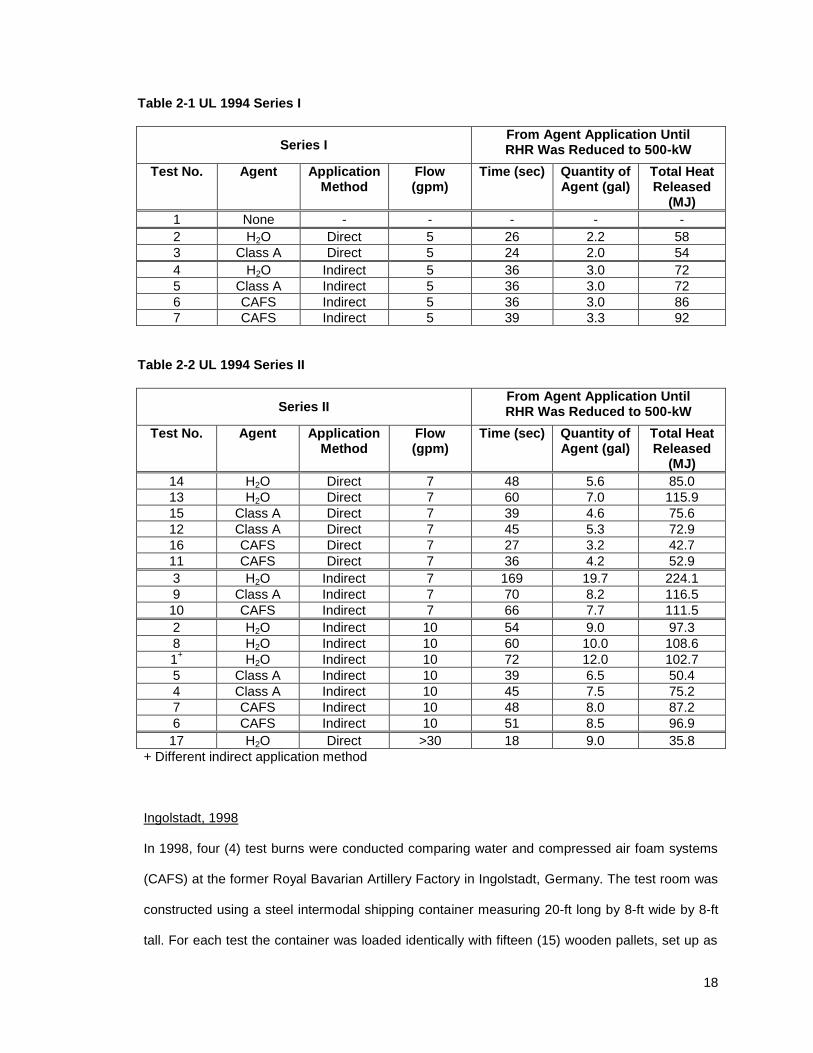
Table 2-1 UL 1994 Series I
Series I From Agent Application Until RHR Was Reduced to 500-kW
Test No. Agent Application Method
Flow (gpm)
Time (sec) Quantity of Agent (gal)
Total Heat Released
(MJ)
1 None - - - - -
2 H2O Direct 5 26 2.2 58
3 Class A Direct 5 24 2.0 54
4 H2O Indirect 5 36 3.0 72
5 Class A Indirect 5 36 3.0 72
6 CAFS Indirect 5 36 3.0 86
7 CAFS Indirect 5 39 3.3 92
Table 2-2 UL 1994 Series II
Series II From Agent Application Until RHR Was Reduced to 500-kW
Test No. Agent Application Method
Flow (gpm)
Time (sec) Quantity of Agent (gal)
Total Heat Released
(MJ)
14 H2O Direct 7 48 5.6 85.0
13 H2O Direct 7 60 7.0 115.9
15 Class A Direct 7 39 4.6 75.6
12 Class A Direct 7 45 5.3 72.9
16 CAFS Direct 7 27 3.2 42.7
11 CAFS Direct 7 36 4.2 52.9
3 H2O Indirect 7 169 19.7 224.1
9 Class A Indirect 7 70 8.2 116.5
10 CAFS Indirect 7 66 7.7 111.5
2 H2O Indirect 10 54 9.0 97.3
8 H2O Indirect 10 60 10.0 108.6
1+ H2O Indirect 10 72 12.0 102.7
5 Class A Indirect 10 39 6.5 50.4
4 Class A Indirect 10 45 7.5 75.2
7 CAFS Indirect 10 48 8.0 87.2
6 CAFS Indirect 10 51 8.5 96.9
17 H2O Direct >30 18 9.0 35.8
+ Different indirect application method
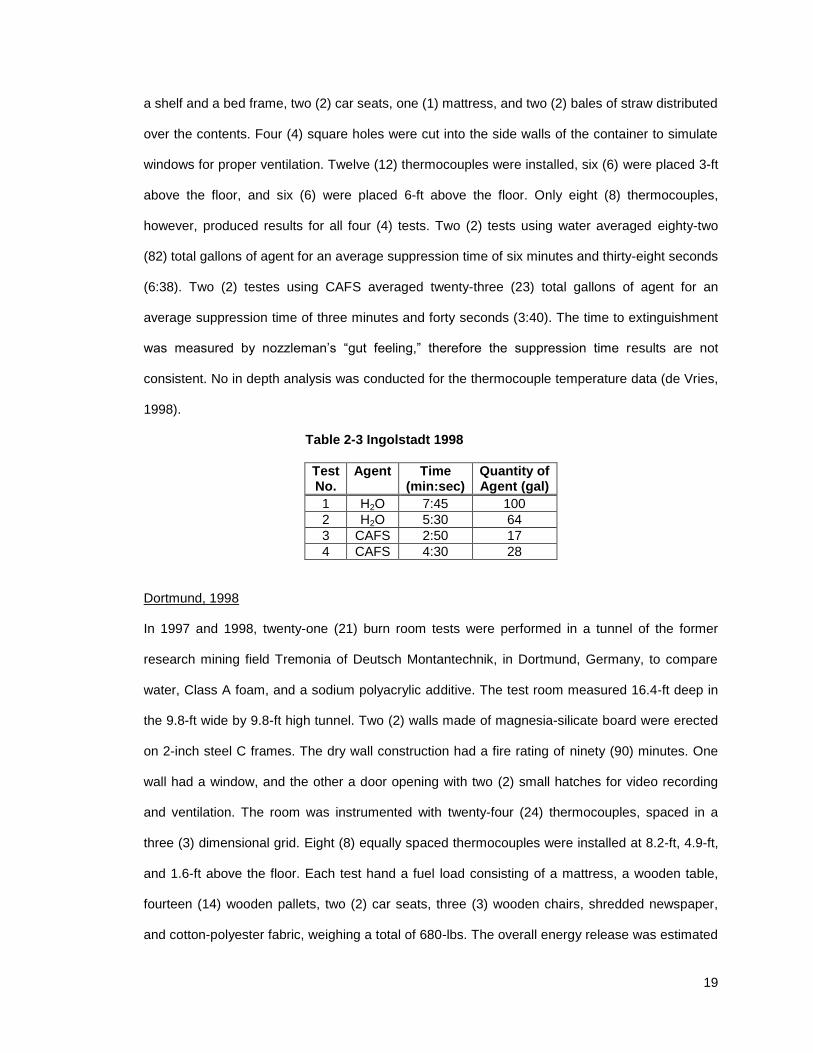
Ingolstadt, 1998
In 1998, four (4) test burns were conducted comparing water and compressed air foam systems
(CAFS) at the former Royal Bavarian Artillery Factory in Ingolstadt, Germany. The test room was
constructed using a steel intermodal shipping container measuring 20-ft long by 8-ft wide by 8-ft
tall. For each test the container was loaded identically with fifteen (15) wooden pallets, set up as
19
a shelf and a bed frame, two (2) car seats, one (1) mattress, and two (2) bales of straw distributed
over the contents. Four (4) square holes were cut into the side walls of the container to simulate
windows for proper ventilation. Twelve (12) thermocouples were installed, six (6) were placed 3-ft
above the floor, and six (6) were placed 6-ft above the floor. Only eight (8) thermocouples,
however, produced results for all four (4) tests. Two (2) tests using water averaged eighty-two
(82) total gallons of agent for an average suppression time of six minutes and thirty-eight seconds
(6:38). Two (2) testes using CAFS averaged twenty-three (23) total gallons of agent for an
average suppression time of three minutes and forty seconds (3:40). The time to extinguishment
was measured by nozzleman’s “gut feeling,” therefore the suppression time results are not
consistent. No in depth analysis was conducted for the thermocouple temperature data (de Vries,
1998).
Table 2-3 Ingolstadt 1998
Test No.
Agent Time (min:sec)
Quantity of Agent (gal)
1 H2O 7:45 100
2 H2O 5:30 64
3 CAFS 2:50 17
4 CAFS 4:30 28
Dortmund, 1998
In 1997 and 1998, twenty-one (21) burn room tests were performed in a tunnel of the former
research mining field Tremonia of Deutsch Montantechnik, in Dortmund, Germany, to compare
water, Class A foam, and a sodium polyacrylic additive. The test room measured 16.4-ft deep in
the 9.8-ft wide by 9.8-ft high tunnel. Two (2) walls made of magnesia-silicate board were erected
on 2-inch steel C frames. The dry wall construction had a fire rating of ninety (90) minutes. One
wall had a window, and the other a door opening with two (2) small hatches for video recording
and ventilation. The room was instrumented with twenty-four (24) thermocouples, spaced in a
three (3) dimensional grid. Eight (8) equally spaced thermocouples were installed at 8.2-ft, 4.9-ft,
and 1.6-ft above the floor. Each test hand a fuel load consisting of a mattress, a wooden table,
fourteen (14) wooden pallets, two (2) car seats, three (3) wooden chairs, shredded newspaper,
and cotton-polyester fabric, weighing a total of 680-lbs. The overall energy release was estimated
20
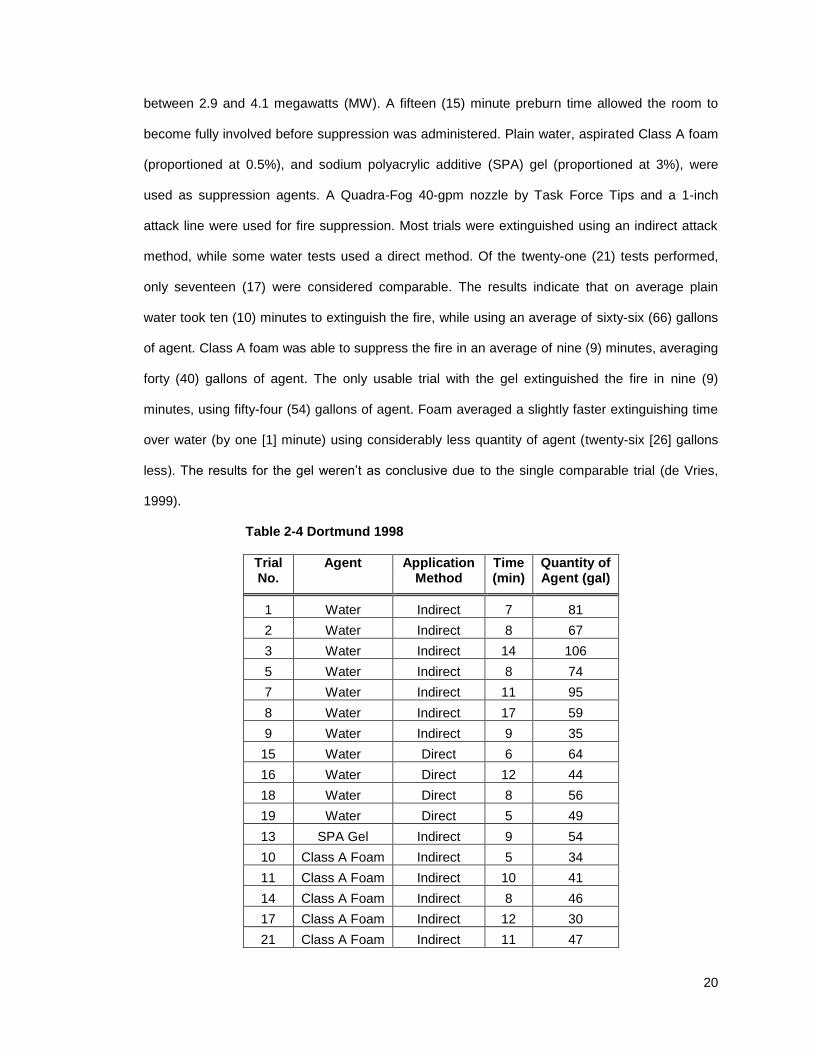
between 2.9 and 4.1 megawatts (MW). A fifteen (15) minute preburn time allowed the room to
become fully involved before suppression was administered. Plain water, aspirated Class A foam
(proportioned at 0.5%), and sodium polyacrylic additive (SPA) gel (proportioned at 3%), were
used as suppression agents. A Quadra-Fog 40-gpm nozzle by Task Force Tips and a 1-inch
attack line were used for fire suppression. Most trials were extinguished using an indirect attack
method, while some water tests used a direct method. Of the twenty-one (21) tests performed,
only seventeen (17) were considered comparable. The results indicate that on average plain
water took ten (10) minutes to extinguish the fire, while using an average of sixty-six (66) gallons
of agent. Class A foam was able to suppress the fire in an average of nine (9) minutes, averaging
forty (40) gallons of agent. The only usable trial with the gel extinguished the fire in nine (9)
minutes, using fifty-four (54) gallons of agent. Foam averaged a slightly faster extinguishing time
over water (by one [1] minute) using considerably less quantity of agent (twenty-six [26] gallons
less). The results for the gel weren’t as conclusive due to the single comparable trial (de Vries,
1999).
Table 2-4 Dortmund 1998
Trial No.
Agent Application Method
Time (min)
Quantity of Agent (gal)
1 Water Indirect 7 81
2 Water Indirect 8 67
3 Water Indirect 14 106
5 Water Indirect 8 74
7 Water Indirect 11 95
8 Water Indirect 17 59
9 Water Indirect 9 35
15 Water Direct 6 64
16 Water Direct 12 44
18 Water Direct 8 56
19 Water Direct 5 49
13 SPA Gel Indirect 9 54
10 Class A Foam Indirect 5 34
11 Class A Foam Indirect 10 41
14 Class A Foam Indirect 8 46
17 Class A Foam Indirect 12 30
21 Class A Foam Indirect 11 47
21
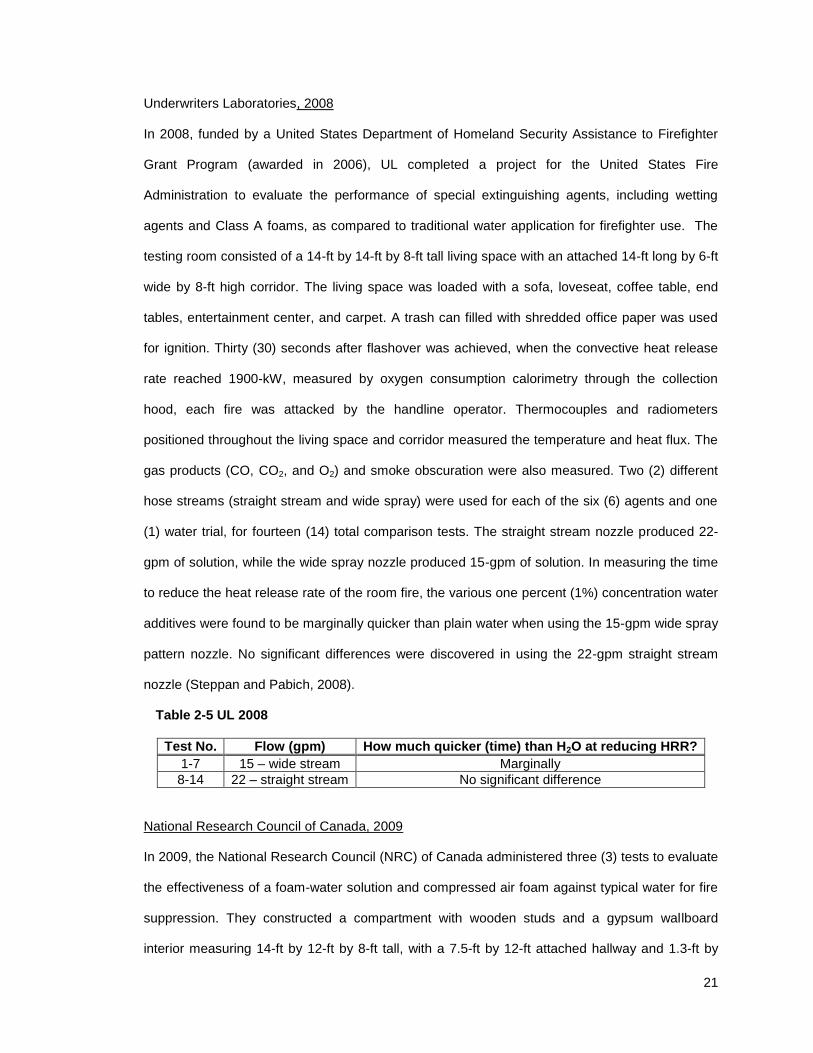
Underwriters Laboratories, 2008
In 2008, funded by a United States Department of Homeland Security Assistance to Firefighter
Grant Program (awarded in 2006), UL completed a project for the United States Fire
Administration to evaluate the performance of special extinguishing agents, including wetting
agents and Class A foams, as compared to traditional water application for firefighter use. The
testing room consisted of a 14-ft by 14-ft by 8-ft tall living space with an attached 14-ft long by 6-ft
wide by 8-ft high corridor. The living space was loaded with a sofa, loveseat, coffee table, end
tables, entertainment center, and carpet. A trash can filled with shredded office paper was used
for ignition. Thirty (30) seconds after flashover was achieved, when the convective heat release
rate reached 1900-kW, measured by oxygen consumption calorimetry through the collection
hood, each fire was attacked by the handline operator. Thermocouples and radiometers
positioned throughout the living space and corridor measured the temperature and heat flux. The
gas products (CO, CO2, and O2) and smoke obscuration were also measured. Two (2) different
hose streams (straight stream and wide spray) were used for each of the six (6) agents and one
(1) water trial, for fourteen (14) total comparison tests. The straight stream nozzle produced 22-
gpm of solution, while the wide spray nozzle produced 15-gpm of solution. In measuring the time
to reduce the heat release rate of the room fire, the various one percent (1%) concentration water
additives were found to be marginally quicker than plain water when using the 15-gpm wide spray
pattern nozzle. No significant differences were discovered in using the 22-gpm straight stream
nozzle (Steppan and Pabich, 2008).
Table 2-5 UL 2008
Test No. Flow (gpm) How much quicker (time) than H2O at reducing HRR?
1-7 15 – wide stream Marginally
8-14 22 – straight stream No significant difference
National Research Council of Canada, 2009
In 2009, the National Research Council (NRC) of Canada administered three (3) tests to evaluate
the effectiveness of a foam-water solution and compressed air foam against typical water for fire
suppression. They constructed a compartment with wooden studs and a gypsum wallboard
interior measuring 14-ft by 12-ft by 8-ft tall, with a 7.5-ft by 12-ft attached hallway and 1.3-ft by
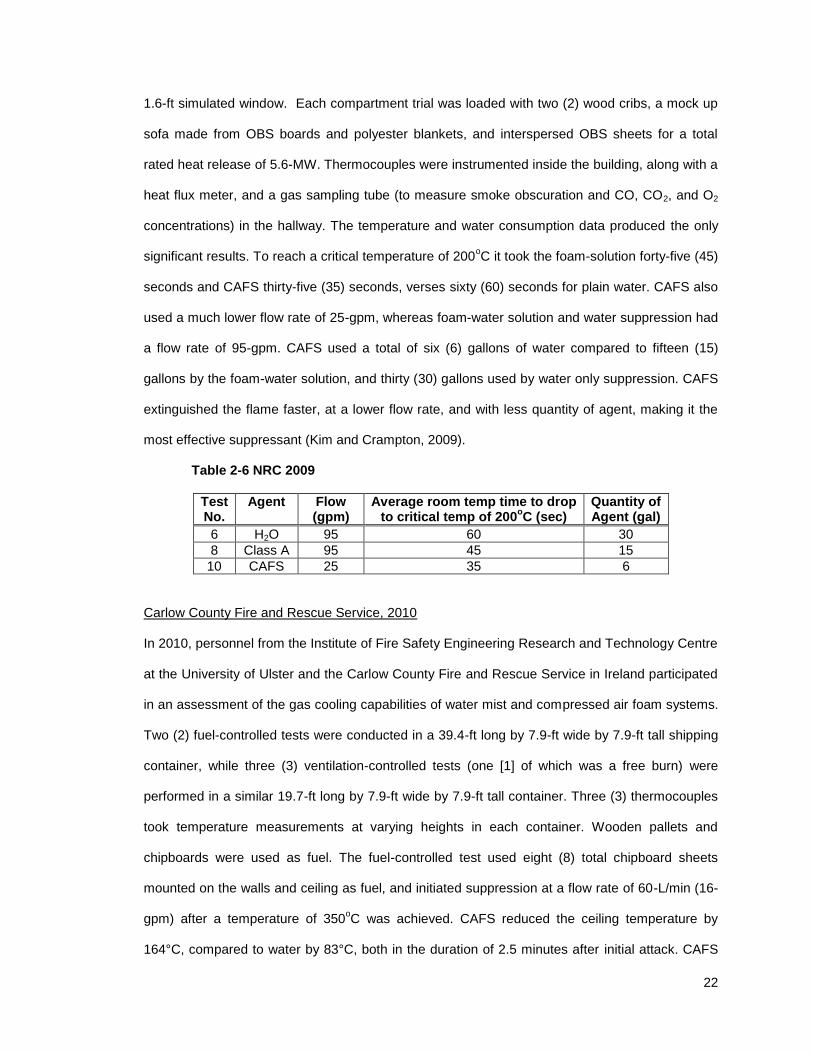
22
1.6-ft simulated window. Each compartment trial was loaded with two (2) wood cribs, a mock up
sofa made from OBS boards and polyester blankets, and interspersed OBS sheets for a total
rated heat release of 5.6-MW. Thermocouples were instrumented inside the building, along with a
heat flux meter, and a gas sampling tube (to measure smoke obscuration and CO, CO2, and O2
concentrations) in the hallway. The temperature and water consumption data produced the only
significant results. To reach a critical temperature of 200oC it took the foam-solution forty-five (45)
seconds and CAFS thirty-five (35) seconds, verses sixty (60) seconds for plain water. CAFS also
used a much lower flow rate of 25-gpm, whereas foam-water solution and water suppression had
a flow rate of 95-gpm. CAFS used a total of six (6) gallons of water compared to fifteen (15)
gallons by the foam-water solution, and thirty (30) gallons used by water only suppression. CAFS
extinguished the flame faster, at a lower flow rate, and with less quantity of agent, making it the
most effective suppressant (Kim and Crampton, 2009).
Table 2-6 NRC 2009
Test No.
Agent Flow (gpm)
Average room temp time to drop to critical temp of 200
oC (sec)
Quantity of Agent (gal)
6 H2O 95 60 30
8 Class A 95 45 15
10 CAFS 25 35 6
Carlow County Fire and Rescue Service, 2010
In 2010, personnel from the Institute of Fire Safety Engineering Research and Technology Centre
at the University of Ulster and the Carlow County Fire and Rescue Service in Ireland participated
in an assessment of the gas cooling capabilities of water mist and compressed air foam systems.
Two (2) fuel-controlled tests were conducted in a 39.4-ft long by 7.9-ft wide by 7.9-ft tall shipping
container, while three (3) ventilation-controlled tests (one [1] of which was a free burn) were
performed in a similar 19.7-ft long by 7.9-ft wide by 7.9-ft tall container. Three (3) thermocouples
took temperature measurements at varying heights in each container. Wooden pallets and
chipboards were used as fuel. The fuel-controlled test used eight (8) total chipboard sheets
mounted on the walls and ceiling as fuel, and initiated suppression at a flow rate of 60-L/min (16-
gpm) after a temperature of 350oC was achieved. CAFS reduced the ceiling temperature by
164°C, compared to water by 83°C, both in the duration of 2.5 minutes after initial attack. CAFS
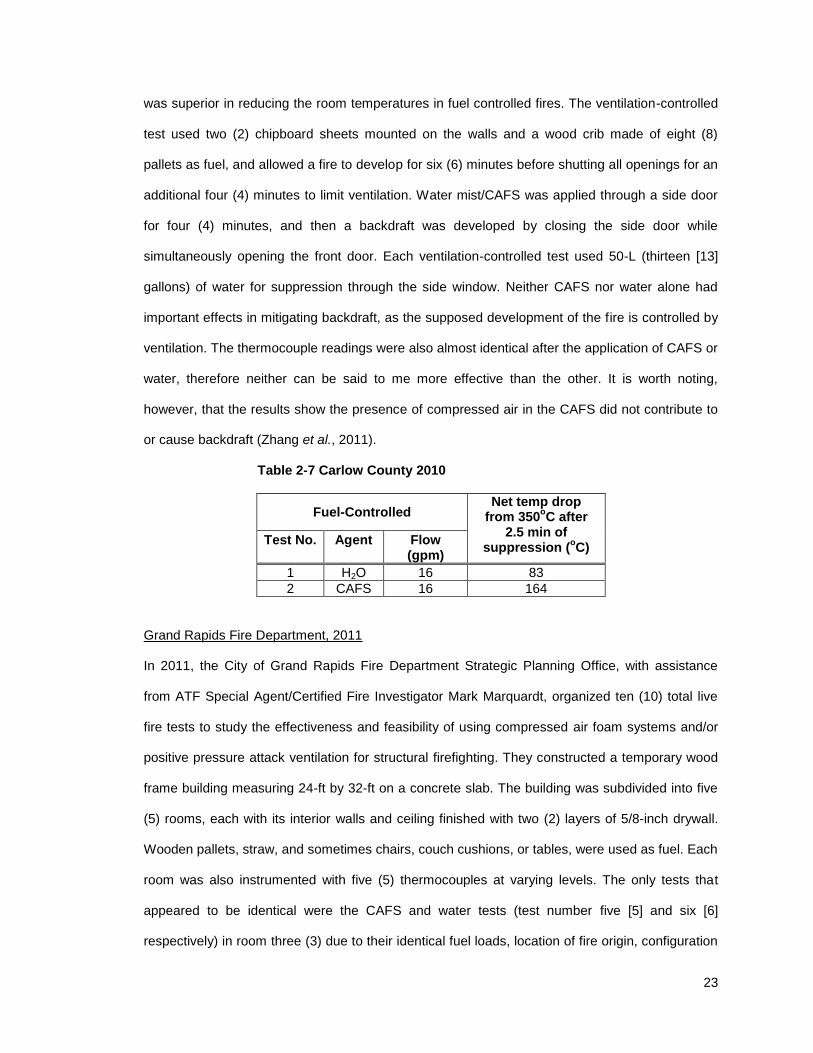
23
was superior in reducing the room temperatures in fuel controlled fires. The ventilation-controlled
test used two (2) chipboard sheets mounted on the walls and a wood crib made of eight (8)
pallets as fuel, and allowed a fire to develop for six (6) minutes before shutting all openings for an
additional four (4) minutes to limit ventilation. Water mist/CAFS was applied through a side door
for four (4) minutes, and then a backdraft was developed by closing the side door while
simultaneously opening the front door. Each ventilation-controlled test used 50-L (thirteen [13]
gallons) of water for suppression through the side window. Neither CAFS nor water alone had
important effects in mitigating backdraft, as the supposed development of the fire is controlled by
ventilation. The thermocouple readings were also almost identical after the application of CAFS or
water, therefore neither can be said to me more effective than the other. It is worth noting,
however, that the results show the presence of compressed air in the CAFS did not contribute to
or cause backdraft (Zhang et al., 2011).
Table 2-7 Carlow County 2010
Fuel-Controlled Net temp drop
from 350oC after
2.5 min of suppression (
oC)
Test No. Agent Flow (gpm)
1 H2O 16 83
2 CAFS 16 164
Grand Rapids Fire Department, 2011
In 2011, the City of Grand Rapids Fire Department Strategic Planning Office, with assistance
from ATF Special Agent/Certified Fire Investigator Mark Marquardt, organized ten (10) total live
fire tests to study the effectiveness and feasibility of using compressed air foam systems and/or
positive pressure attack ventilation for structural firefighting. They constructed a temporary wood
frame building measuring 24-ft by 32-ft on a concrete slab. The building was subdivided into five
(5) rooms, each with its interior walls and ceiling finished with two (2) layers of 5/8-inch drywall.
Wooden pallets, straw, and sometimes chairs, couch cushions, or tables, were used as fuel. Each
room was also instrumented with five (5) thermocouples at varying levels. The only tests that
appeared to be identical were the CAFS and water tests (test number five [5] and six [6]
respectively) in room three (3) due to their identical fuel loads, location of fire origin, configuration
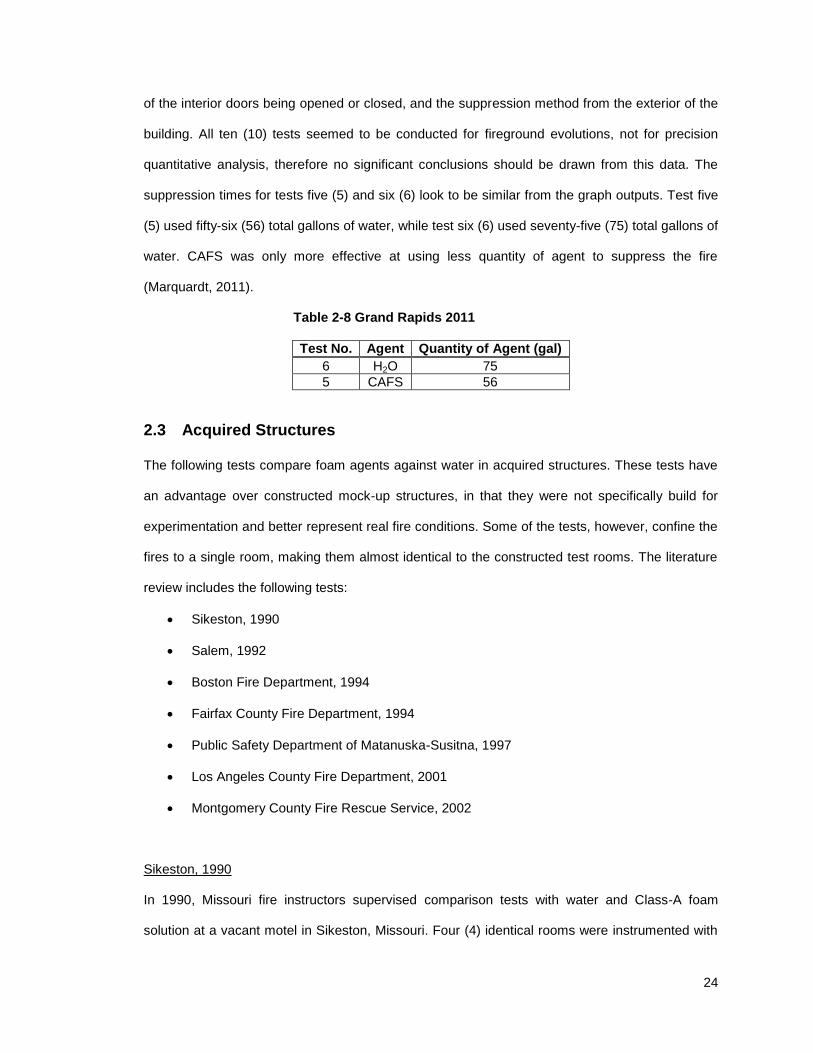
24
of the interior doors being opened or closed, and the suppression method from the exterior of the
building. All ten (10) tests seemed to be conducted for fireground evolutions, not for precision
quantitative analysis, therefore no significant conclusions should be drawn from this data. The
suppression times for tests five (5) and six (6) look to be similar from the graph outputs. Test five
(5) used fifty-six (56) total gallons of water, while test six (6) used seventy-five (75) total gallons of
water. CAFS was only more effective at using less quantity of agent to suppress the fire
(Marquardt, 2011).
Table 2-8 Grand Rapids 2011
Test No. Agent Quantity of Agent (gal)
6 H2O 75
5 CAFS 56
2.3 Acquired Structures
The following tests compare foam agents against water in acquired structures. These tests have
an advantage over constructed mock-up structures, in that they were not specifically build for
experimentation and better represent real fire conditions. Some of the tests, however, confine the
fires to a single room, making them almost identical to the constructed test rooms. The literature
review includes the following tests:
Sikeston, 1990
Salem, 1992
Boston Fire Department, 1994
Fairfax County Fire Department, 1994
Public Safety Department of Matanuska-Susitna, 1997
Los Angeles County Fire Department, 2001
Montgomery County Fire Rescue Service, 2002
Sikeston, 1990
In 1990, Missouri fire instructors supervised comparison tests with water and Class-A foam
solution at a vacant motel in Sikeston, Missouri. Four (4) identical rooms were instrumented with
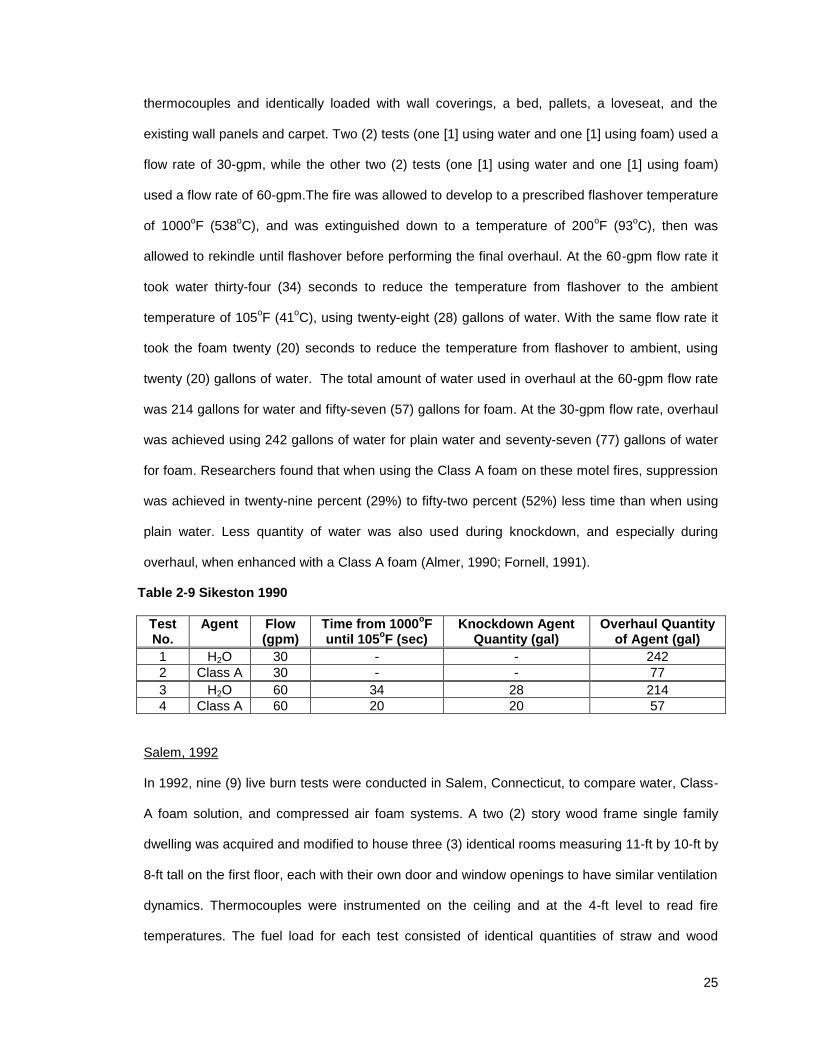
25
thermocouples and identically loaded with wall coverings, a bed, pallets, a loveseat, and the
existing wall panels and carpet. Two (2) tests (one [1] using water and one [1] using foam) used a
flow rate of 30-gpm, while the other two (2) tests (one [1] using water and one [1] using foam)
used a flow rate of 60-gpm.The fire was allowed to develop to a prescribed flashover temperature
of 1000oF (538
oC), and was extinguished down to a temperature of 200
oF (93
oC), then was
allowed to rekindle until flashover before performing the final overhaul. At the 60-gpm flow rate it
took water thirty-four (34) seconds to reduce the temperature from flashover to the ambient
temperature of 105oF (41
oC), using twenty-eight (28) gallons of water. With the same flow rate it
took the foam twenty (20) seconds to reduce the temperature from flashover to ambient, using
twenty (20) gallons of water. The total amount of water used in overhaul at the 60-gpm flow rate
was 214 gallons for water and fifty-seven (57) gallons for foam. At the 30-gpm flow rate, overhaul
was achieved using 242 gallons of water for plain water and seventy-seven (77) gallons of water
for foam. Researchers found that when using the Class A foam on these motel fires, suppression
was achieved in twenty-nine percent (29%) to fifty-two percent (52%) less time than when using
plain water. Less quantity of water was also used during knockdown, and especially during
overhaul, when enhanced with a Class A foam (Almer, 1990; Fornell, 1991).
Table 2-9 Sikeston 1990
Test No.
Agent Flow (gpm)
Time from 1000oF
until 105oF (sec)
Knockdown Agent Quantity (gal)
Overhaul Quantity of Agent (gal)
1 H2O 30 - - 242
2 Class A 30 - - 77
3 H2O 60 34 28 214
4 Class A 60 20 20 57
Salem, 1992
In 1992, nine (9) live burn tests were conducted in Salem, Connecticut, to compare water, Class-
A foam solution, and compressed air foam systems. A two (2) story wood frame single family
dwelling was acquired and modified to house three (3) identical rooms measuring 11-ft by 10-ft by
8-ft tall on the first floor, each with their own door and window openings to have similar ventilation
dynamics. Thermocouples were instrumented on the ceiling and at the 4-ft level to read fire
temperatures. The fuel load for each test consisted of identical quantities of straw and wood
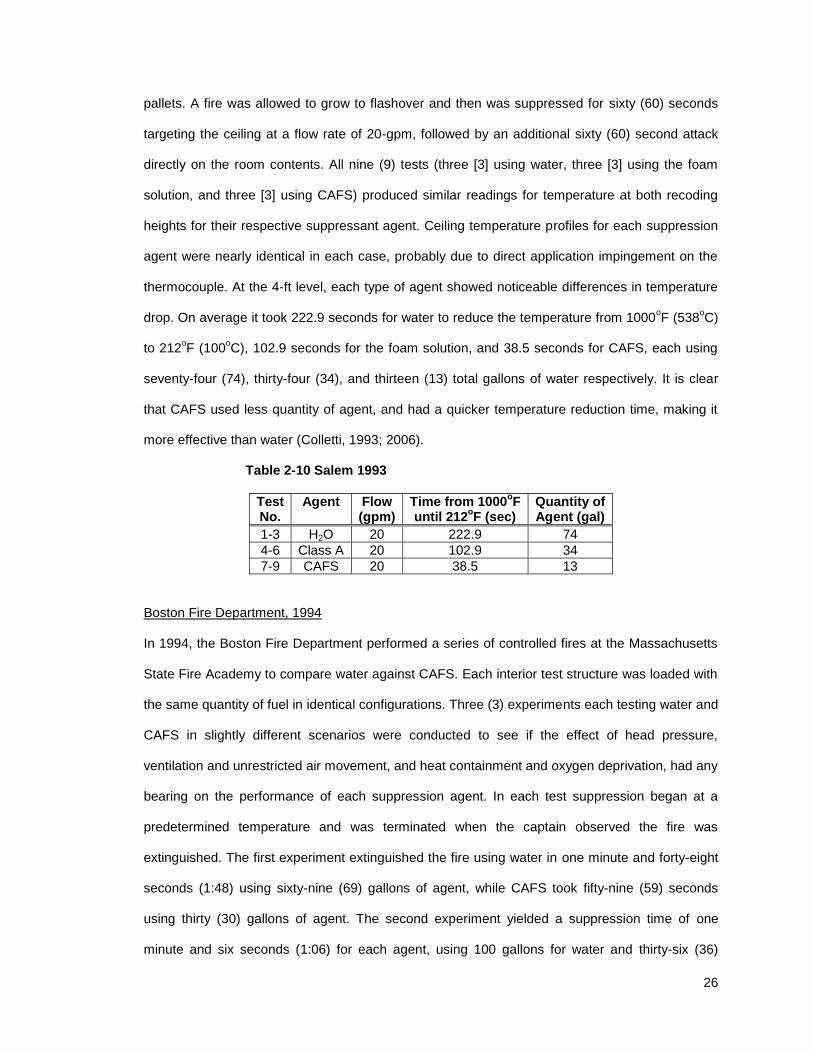
26
pallets. A fire was allowed to grow to flashover and then was suppressed for sixty (60) seconds
targeting the ceiling at a flow rate of 20-gpm, followed by an additional sixty (60) second attack
directly on the room contents. All nine (9) tests (three [3] using water, three [3] using the foam
solution, and three [3] using CAFS) produced similar readings for temperature at both recoding
heights for their respective suppressant agent. Ceiling temperature profiles for each suppression
agent were nearly identical in each case, probably due to direct application impingement on the
thermocouple. At the 4-ft level, each type of agent showed noticeable differences in temperature
drop. On average it took 222.9 seconds for water to reduce the temperature from 1000oF (538
oC)
to 212oF (100
oC), 102.9 seconds for the foam solution, and 38.5 seconds for CAFS, each using
seventy-four (74), thirty-four (34), and thirteen (13) total gallons of water respectively. It is clear
that CAFS used less quantity of agent, and had a quicker temperature reduction time, making it
more effective than water (Colletti, 1993; 2006).
Table 2-10 Salem 1993
Test No.
Agent Flow (gpm)
Time from 1000oF
until 212oF (sec)
Quantity of Agent (gal)
1-3 H2O 20 222.9 74
4-6 Class A 20 102.9 34
7-9 CAFS 20 38.5 13
Boston Fire Department, 1994
In 1994, the Boston Fire Department performed a series of controlled fires at the Massachusetts
State Fire Academy to compare water against CAFS. Each interior test structure was loaded with
the same quantity of fuel in identical configurations. Three (3) experiments each testing water and
CAFS in slightly different scenarios were conducted to see if the effect of head pressure,
ventilation and unrestricted air movement, and heat containment and oxygen deprivation, had any
bearing on the performance of each suppression agent. In each test suppression began at a
predetermined temperature and was terminated when the captain observed the fire was
extinguished. The first experiment extinguished the fire using water in one minute and forty-eight
seconds (1:48) using sixty-nine (69) gallons of agent, while CAFS took fifty-nine (59) seconds
using thirty (30) gallons of agent. The second experiment yielded a suppression time of one
minute and six seconds (1:06) for each agent, using 100 gallons for water and thirty-six (36)
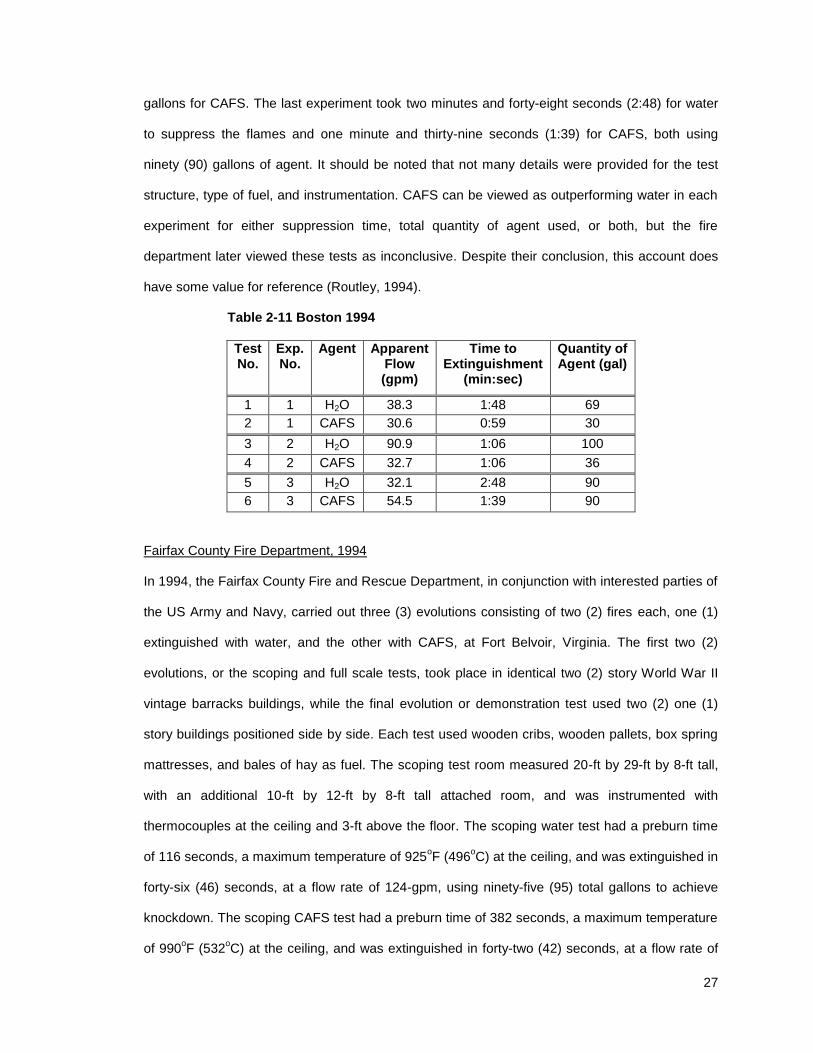
27
gallons for CAFS. The last experiment took two minutes and forty-eight seconds (2:48) for water
to suppress the flames and one minute and thirty-nine seconds (1:39) for CAFS, both using
ninety (90) gallons of agent. It should be noted that not many details were provided for the test
structure, type of fuel, and instrumentation. CAFS can be viewed as outperforming water in each
experiment for either suppression time, total quantity of agent used, or both, but the fire
department later viewed these tests as inconclusive. Despite their conclusion, this account does
have some value for reference (Routley, 1994).
Table 2-11 Boston 1994
Test No.
Exp. No.
Agent Apparent Flow (gpm)
Time to Extinguishment
(min:sec)
Quantity of Agent (gal)
1 1 H2O 38.3 1:48 69
2 1 CAFS 30.6 0:59 30
3 2 H2O 90.9 1:06 100
4 2 CAFS 32.7 1:06 36
5 3 H2O 32.1 2:48 90
6 3 CAFS 54.5 1:39 90
Fairfax County Fire Department, 1994
In 1994, the Fairfax County Fire and Rescue Department, in conjunction with interested parties of
the US Army and Navy, carried out three (3) evolutions consisting of two (2) fires each, one (1)
extinguished with water, and the other with CAFS, at Fort Belvoir, Virginia. The first two (2)
evolutions, or the scoping and full scale tests, took place in identical two (2) story World War II
vintage barracks buildings, while the final evolution or demonstration test used two (2) one (1)
story buildings positioned side by side. Each test used wooden cribs, wooden pallets, box spring
mattresses, and bales of hay as fuel. The scoping test room measured 20-ft by 29-ft by 8-ft tall,
with an additional 10-ft by 12-ft by 8-ft tall attached room, and was instrumented with
thermocouples at the ceiling and 3-ft above the floor. The scoping water test had a preburn time
of 116 seconds, a maximum temperature of 925oF (496
oC) at the ceiling, and was extinguished in
forty-six (46) seconds, at a flow rate of 124-gpm, using ninety-five (95) total gallons to achieve
knockdown. The scoping CAFS test had a preburn time of 382 seconds, a maximum temperature
of 990oF (532
oC) at the ceiling, and was extinguished in forty-two (42) seconds, at a flow rate of
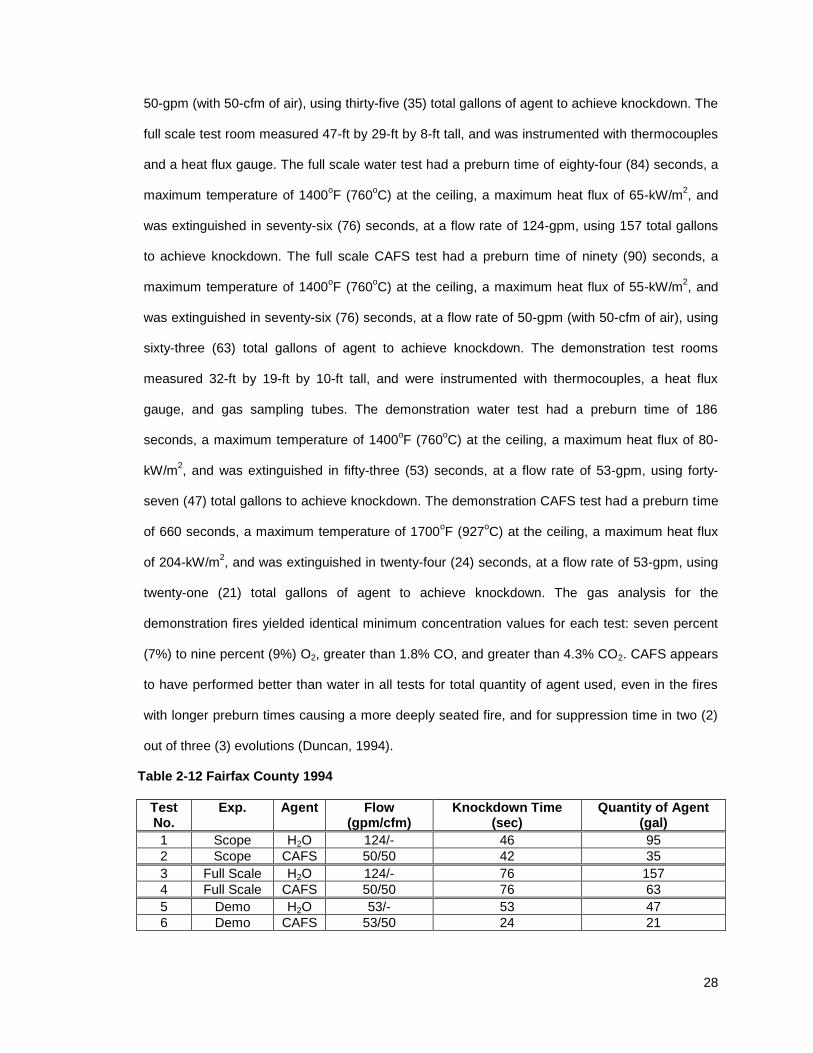
28
50-gpm (with 50-cfm of air), using thirty-five (35) total gallons of agent to achieve knockdown. The
full scale test room measured 47-ft by 29-ft by 8-ft tall, and was instrumented with thermocouples
and a heat flux gauge. The full scale water test had a preburn time of eighty-four (84) seconds, a
maximum temperature of 1400oF (760
oC) at the ceiling, a maximum heat flux of 65-kW/m
2, and
was extinguished in seventy-six (76) seconds, at a flow rate of 124-gpm, using 157 total gallons
to achieve knockdown. The full scale CAFS test had a preburn time of ninety (90) seconds, a
maximum temperature of 1400oF (760
oC) at the ceiling, a maximum heat flux of 55-kW/m
2, and
was extinguished in seventy-six (76) seconds, at a flow rate of 50-gpm (with 50-cfm of air), using
sixty-three (63) total gallons of agent to achieve knockdown. The demonstration test rooms
measured 32-ft by 19-ft by 10-ft tall, and were instrumented with thermocouples, a heat flux
gauge, and gas sampling tubes. The demonstration water test had a preburn time of 186
seconds, a maximum temperature of 1400oF (760
oC) at the ceiling, a maximum heat flux of 80-
kW/m2, and was extinguished in fifty-three (53) seconds, at a flow rate of 53-gpm, using forty-
seven (47) total gallons to achieve knockdown. The demonstration CAFS test had a preburn time
of 660 seconds, a maximum temperature of 1700oF (927
oC) at the ceiling, a maximum heat flux
of 204-kW/m2, and was extinguished in twenty-four (24) seconds, at a flow rate of 53-gpm, using
twenty-one (21) total gallons of agent to achieve knockdown. The gas analysis for the
demonstration fires yielded identical minimum concentration values for each test: seven percent
(7%) to nine percent (9%) O2, greater than 1.8% CO, and greater than 4.3% CO2. CAFS appears
to have performed better than water in all tests for total quantity of agent used, even in the fires
with longer preburn times causing a more deeply seated fire, and for suppression time in two (2)
out of three (3) evolutions (Duncan, 1994).
Table 2-12 Fairfax County 1994
Test No.
Exp. Agent Flow (gpm/cfm)
Knockdown Time (sec)
Quantity of Agent (gal)
1 Scope H2O 124/- 46 95
2 Scope CAFS 50/50 42 35
3 Full Scale H2O 124/- 76 157
4 Full Scale CAFS 50/50 76 63
5 Demo H2O 53/- 53 47
6 Demo CAFS 53/50 24 21
29
Public Safety Department of Matanuska-Susitna, 1997
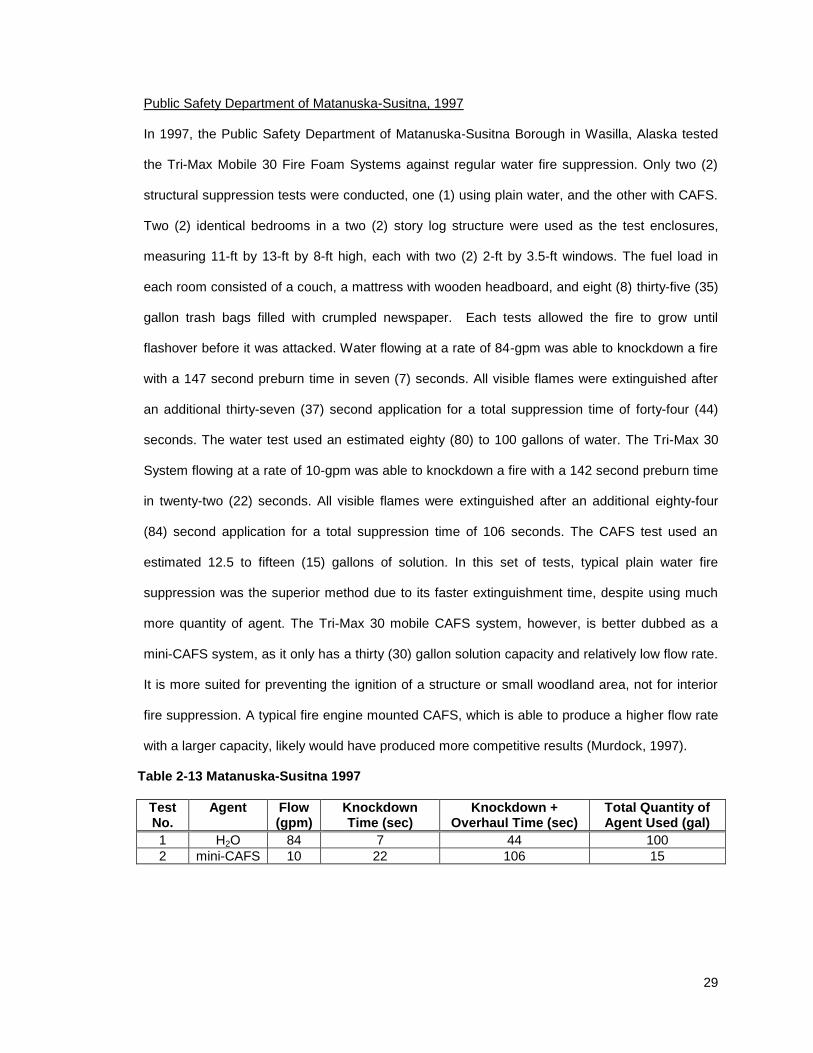
In 1997, the Public Safety Department of Matanuska-Susitna Borough in Wasilla, Alaska tested
the Tri-Max Mobile 30 Fire Foam Systems against regular water fire suppression. Only two (2)
structural suppression tests were conducted, one (1) using plain water, and the other with CAFS.
Two (2) identical bedrooms in a two (2) story log structure were used as the test enclosures,
measuring 11-ft by 13-ft by 8-ft high, each with two (2) 2-ft by 3.5-ft windows. The fuel load in
each room consisted of a couch, a mattress with wooden headboard, and eight (8) thirty-five (35)
gallon trash bags filled with crumpled newspaper. Each tests allowed the fire to grow until
flashover before it was attacked. Water flowing at a rate of 84-gpm was able to knockdown a fire
with a 147 second preburn time in seven (7) seconds. All visible flames were extinguished after
an additional thirty-seven (37) second application for a total suppression time of forty-four (44)
seconds. The water test used an estimated eighty (80) to 100 gallons of water. The Tri-Max 30
System flowing at a rate of 10-gpm was able to knockdown a fire with a 142 second preburn time
in twenty-two (22) seconds. All visible flames were extinguished after an additional eighty-four
(84) second application for a total suppression time of 106 seconds. The CAFS test used an
estimated 12.5 to fifteen (15) gallons of solution. In this set of tests, typical plain water fire
suppression was the superior method due to its faster extinguishment time, despite using much
more quantity of agent. The Tri-Max 30 mobile CAFS system, however, is better dubbed as a
mini-CAFS system, as it only has a thirty (30) gallon solution capacity and relatively low flow rate.
It is more suited for preventing the ignition of a structure or small woodland area, not for interior
fire suppression. A typical fire engine mounted CAFS, which is able to produce a higher flow rate
with a larger capacity, likely would have produced more competitive results (Murdock, 1997).
Table 2-13 Matanuska-Susitna 1997
Test No.
Agent Flow (gpm)
Knockdown Time (sec)
Knockdown + Overhaul Time (sec)
Total Quantity of Agent Used (gal)
1 H2O 84 7 44 100
2 mini-CAFS 10 22 106 15
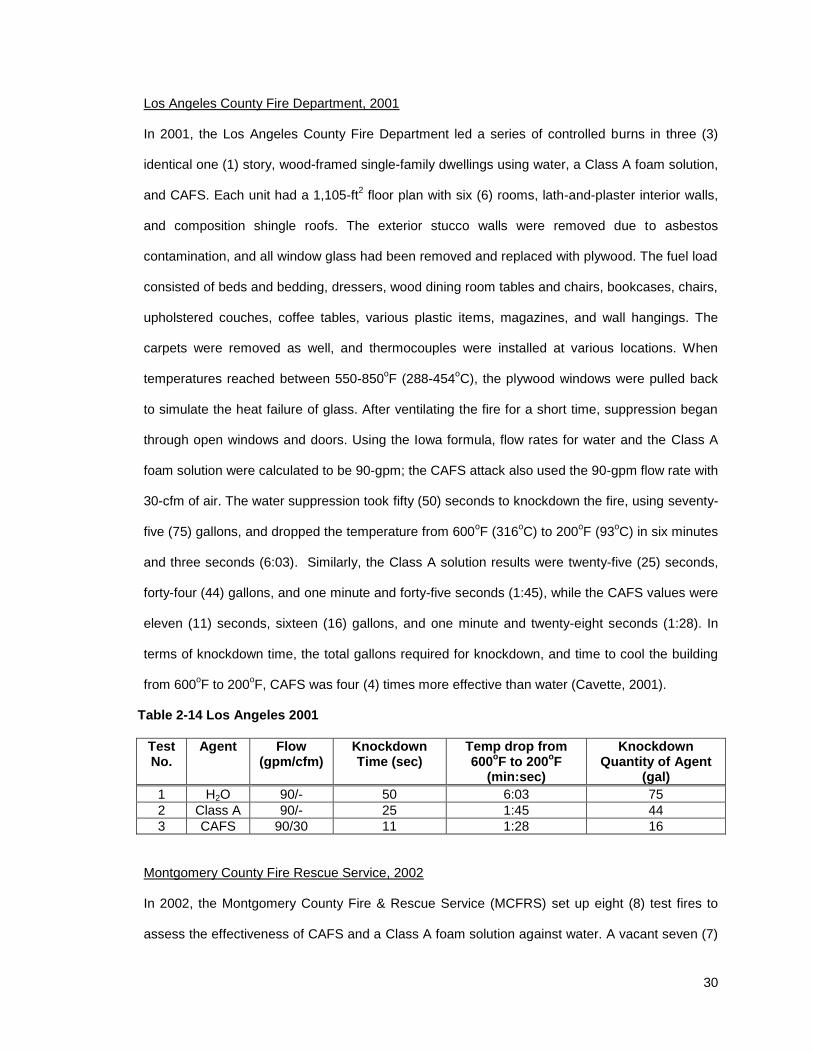
30
Los Angeles County Fire Department, 2001
In 2001, the Los Angeles County Fire Department led a series of controlled burns in three (3)
identical one (1) story, wood-framed single-family dwellings using water, a Class A foam solution,
and CAFS. Each unit had a 1,105-ft2 floor plan with six (6) rooms, lath-and-plaster interior walls,
and composition shingle roofs. The exterior stucco walls were removed due to asbestos
contamination, and all window glass had been removed and replaced with plywood. The fuel load
consisted of beds and bedding, dressers, wood dining room tables and chairs, bookcases, chairs,
upholstered couches, coffee tables, various plastic items, magazines, and wall hangings. The
carpets were removed as well, and thermocouples were installed at various locations. When
temperatures reached between 550-850oF (288-454
oC), the plywood windows were pulled back
to simulate the heat failure of glass. After ventilating the fire for a short time, suppression began
through open windows and doors. Using the Iowa formula, flow rates for water and the Class A
foam solution were calculated to be 90-gpm; the CAFS attack also used the 90-gpm flow rate with
30-cfm of air. The water suppression took fifty (50) seconds to knockdown the fire, using seventy-
five (75) gallons, and dropped the temperature from 600oF (316
oC) to 200
oF (93
oC) in six minutes
and three seconds (6:03). Similarly, the Class A solution results were twenty-five (25) seconds,
forty-four (44) gallons, and one minute and forty-five seconds (1:45), while the CAFS values were
eleven (11) seconds, sixteen (16) gallons, and one minute and twenty-eight seconds (1:28). In
terms of knockdown time, the total gallons required for knockdown, and time to cool the building
from 600oF to 200
oF, CAFS was four (4) times more effective than water (Cavette, 2001).
Table 2-14 Los Angeles 2001
Test No.
Agent Flow (gpm/cfm)
Knockdown Time (sec)
Temp drop from 600
oF to 200
oF
(min:sec)
Knockdown Quantity of Agent
(gal)
1 H2O 90/- 50 6:03 75
2 Class A 90/- 25 1:45 44
3 CAFS 90/30 11 1:28 16
Montgomery County Fire Rescue Service, 2002
In 2002, the Montgomery County Fire & Rescue Service (MCFRS) set up eight (8) test fires to
assess the effectiveness of CAFS and a Class A foam solution against water. A vacant seven (7)
31
story high-rise office building was used for testing. The fifth floor was modified to house a 29-ft by
9-ft by 9.5-ft tall burn room made of double layer 1/2-inch plywood under 1/2-inch gypsum board
held in place with ceiling anchors. Eight (8) thermocouples were installed throughout the room.
Each agent was to suppress its respective fire using the calculated flow rate of 50-gpm. The
attack hoseline was connected to the building’s standpipe that was supplied suppressant by the
fire engine and local hydrant. The fuel package was composed of three (3) identical sets of six (6)
wooden pallets and three (3) bales of straw. Soon after temperatures peaked each fire was
suppressed. The evaluation of the effectiveness of all three (3) agents was not fully achieved for
a number of reasons. Testing could only be conducted for a single day due to staffing limitations,
and the difficult labor involved in preparing each test condensed the total number of runs to eight
(8). Synthetic fuels were not allowed, neither were heavy fuel loads, and all exterior window glass
was to remain intact, resulting in unchallenging fires and statistically insignificant data. The burn
room was also under ventilated, yielding peak fire temperatures with very short durations, and a
significant amount of un-burnt fuel which failed to bring the room to flashover. For one or more of
these reasons, four (4) of the eight (8) tests were considered failures.
The following tests were deemed successful. Burn number five (5) was the hottest burning water
suppressed fire, using sixty (60) gallons of agent flowing for a total of eighty (80) seconds, with a
preburn time of 300 seconds, and a peak temperature of 1420oF (771
oC). It took the ceiling
temperature 150 seconds to drop to 300oF (149
oC), and the 4-ft level temperature ninety-five (95)
seconds to fall to 212oF (100
oC). Burn number seven (7) was the hottest burning CAFS
suppressed fire, using eighteen (18) gallons of agent flowing for twenty-five (25) seconds, with a
preburn time of 340 seconds, and a peak temperature of 1390oF (754
oC). It took the ceiling
temperature sixty-five (65) seconds to lower to 212oF (100
oC), and the 4-ft level temperature forty
(40) seconds to descend to 212oF (100
oC). Burn number eight (8) used CAFS to extinguish the
fire, with twenty-two (22) gallons of agent, and a maximum temperature of 1160oF (627
oC). Burn
number six (6) used a Class A foam solution to extinguish the fire, with forty-six (43) gallons of
agent, and a maximum temperature of 1200oF (649
oC) that decayed very quickly. Test number
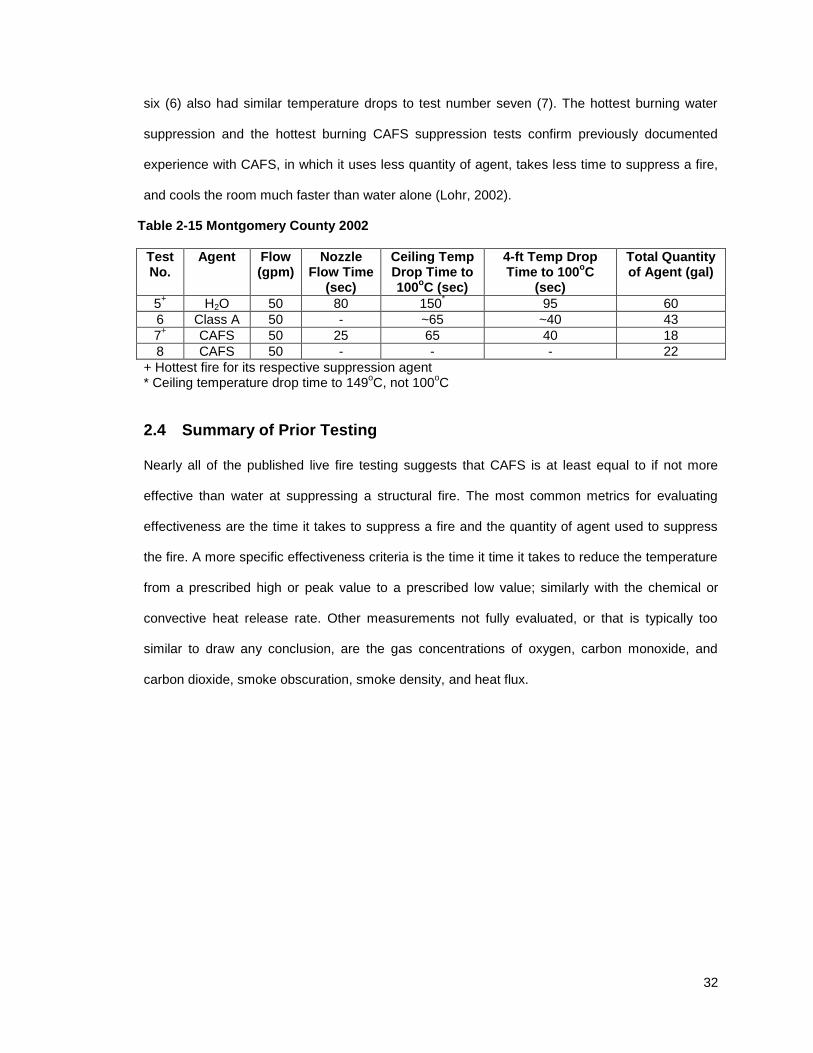
32
six (6) also had similar temperature drops to test number seven (7). The hottest burning water
suppression and the hottest burning CAFS suppression tests confirm previously documented
experience with CAFS, in which it uses less quantity of agent, takes less time to suppress a fire,
and cools the room much faster than water alone (Lohr, 2002).
Table 2-15 Montgomery County 2002
Test No.
Agent Flow (gpm)
Nozzle Flow Time
(sec)
Ceiling Temp Drop Time to 100
oC (sec)
4-ft Temp Drop Time to 100
oC
(sec)
Total Quantity of Agent (gal)
5+ H2O 50 80 150
* 95 60
6 Class A 50 - ~65 ~40 43
7+ CAFS 50 25 65 40 18
8 CAFS 50 - - - 22
+ Hottest fire for its respective suppression agent * Ceiling temperature drop time to 149
oC, not 100
oC
2.4 Summary of Prior Testing
Nearly all of the published live fire testing suggests that CAFS is at least equal to if not more
effective than water at suppressing a structural fire. The most common metrics for evaluating
effectiveness are the time it takes to suppress a fire and the quantity of agent used to suppress
the fire. A more specific effectiveness criteria is the time it time it takes to reduce the temperature
from a prescribed high or peak value to a prescribed low value; similarly with the chemical or
convective heat release rate. Other measurements not fully evaluated, or that is typically too
similar to draw any conclusion, are the gas concentrations of oxygen, carbon monoxide, and
carbon dioxide, smoke obscuration, smoke density, and heat flux.
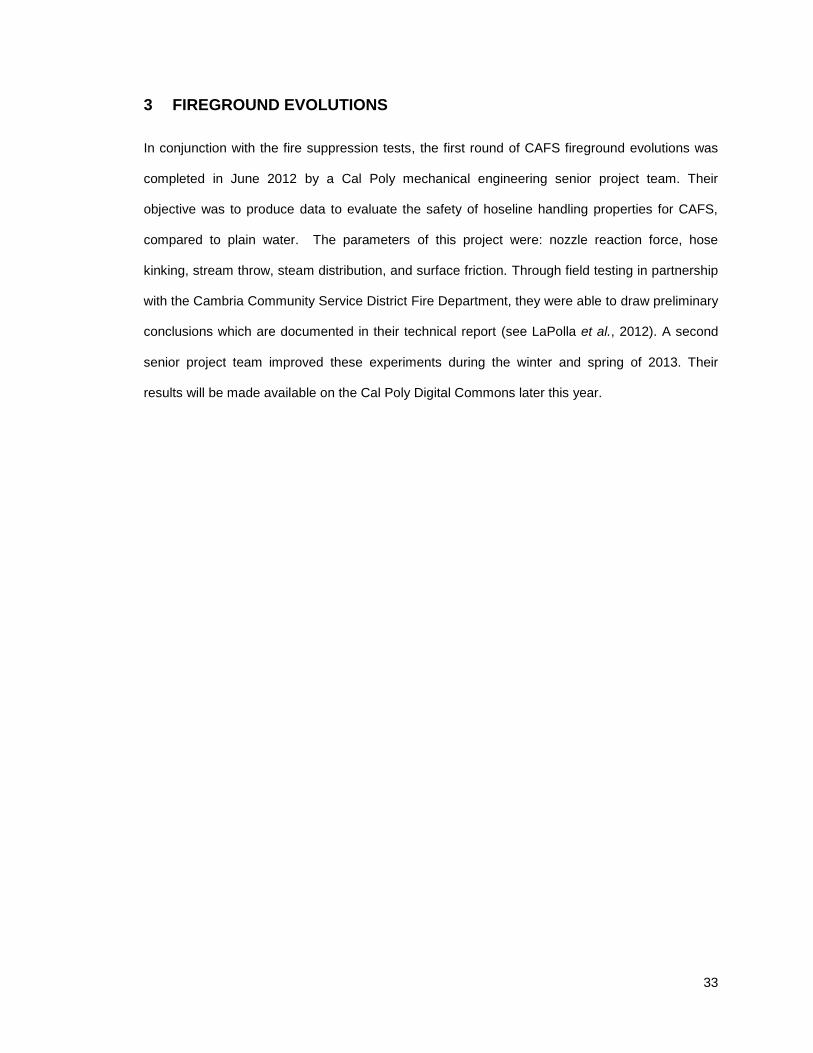
33
3 FIREGROUND EVOLUTIONS
In conjunction with the fire suppression tests, the first round of CAFS fireground evolutions was
completed in June 2012 by a Cal Poly mechanical engineering senior project team. Their
objective was to produce data to evaluate the safety of hoseline handling properties for CAFS,
compared to plain water. The parameters of this project were: nozzle reaction force, hose
kinking, stream throw, steam distribution, and surface friction. Through field testing in partnership
with the Cambria Community Service District Fire Department, they were able to draw preliminary
conclusions which are documented in their technical report (see LaPolla et al., 2012). A second
senior project team improved these experiments during the winter and spring of 2013. Their
results will be made available on the Cal Poly Digital Commons later this year.
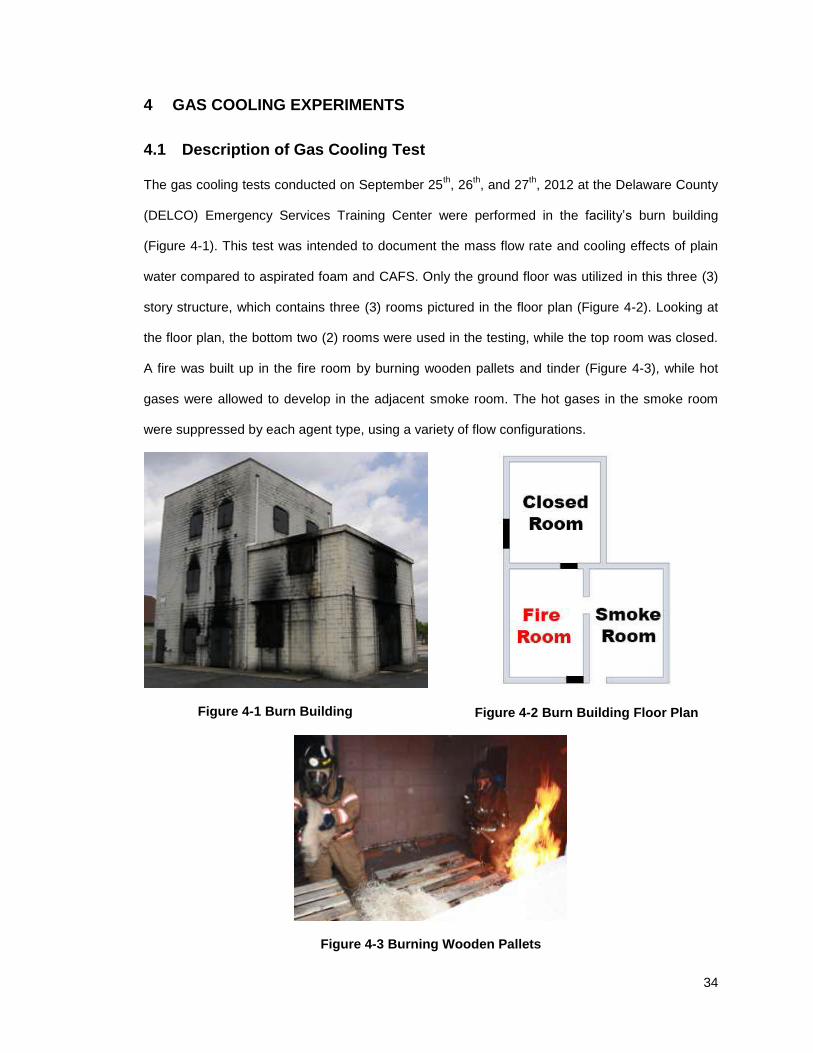
34
4 GAS COOLING EXPERIMENTS
4.1 Description of Gas Cooling Test
The gas cooling tests conducted on September 25th, 26
th, and 27
th, 2012 at the Delaware County
(DELCO) Emergency Services Training Center were performed in the facility’s burn building
(Figure 4-1). This test was intended to document the mass flow rate and cooling effects of plain
water compared to aspirated foam and CAFS. Only the ground floor was utilized in this three (3)
story structure, which contains three (3) rooms pictured in the floor plan (Figure 4-2). Looking at
the floor plan, the bottom two (2) rooms were used in the testing, while the top room was closed.
A fire was built up in the fire room by burning wooden pallets and tinder (Figure 4-3), while hot
gases were allowed to develop in the adjacent smoke room. The hot gases in the smoke room
were suppressed by each agent type, using a variety of flow configurations.
Figure 4-1 Burn Building
Figure 4-2 Burn Building Floor Plan
Figure 4-3 Burning Wooden Pallets
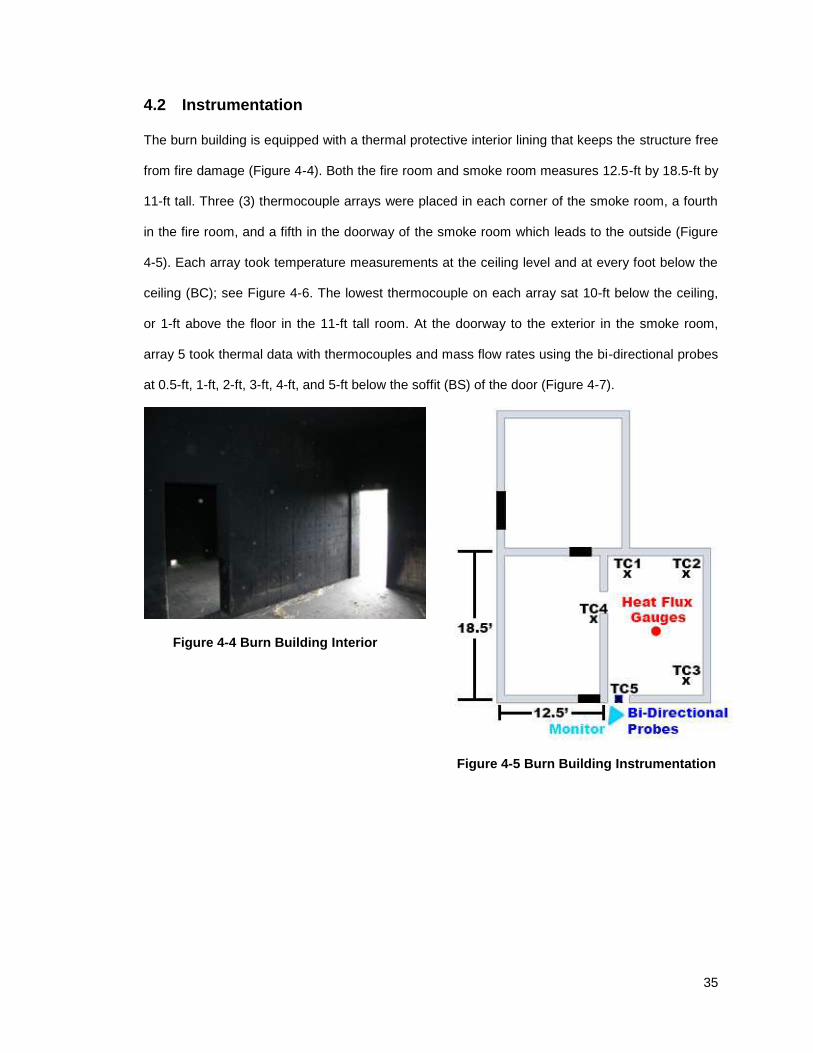
35
4.2 Instrumentation
The burn building is equipped with a thermal protective interior lining that keeps the structure free
from fire damage (Figure 4-4). Both the fire room and smoke room measures 12.5-ft by 18.5-ft by
11-ft tall. Three (3) thermocouple arrays were placed in each corner of the smoke room, a fourth
in the fire room, and a fifth in the doorway of the smoke room which leads to the outside (Figure
4-5). Each array took temperature measurements at the ceiling level and at every foot below the
ceiling (BC); see Figure 4-6. The lowest thermocouple on each array sat 10-ft below the ceiling,
or 1-ft above the floor in the 11-ft tall room. At the doorway to the exterior in the smoke room,
array 5 took thermal data with thermocouples and mass flow rates using the bi-directional probes
at 0.5-ft, 1-ft, 2-ft, 3-ft, 4-ft, and 5-ft below the soffit (BS) of the door (Figure 4-7).
Figure 4-4 Burn Building Interior
Figure 4-5 Burn Building Instrumentation
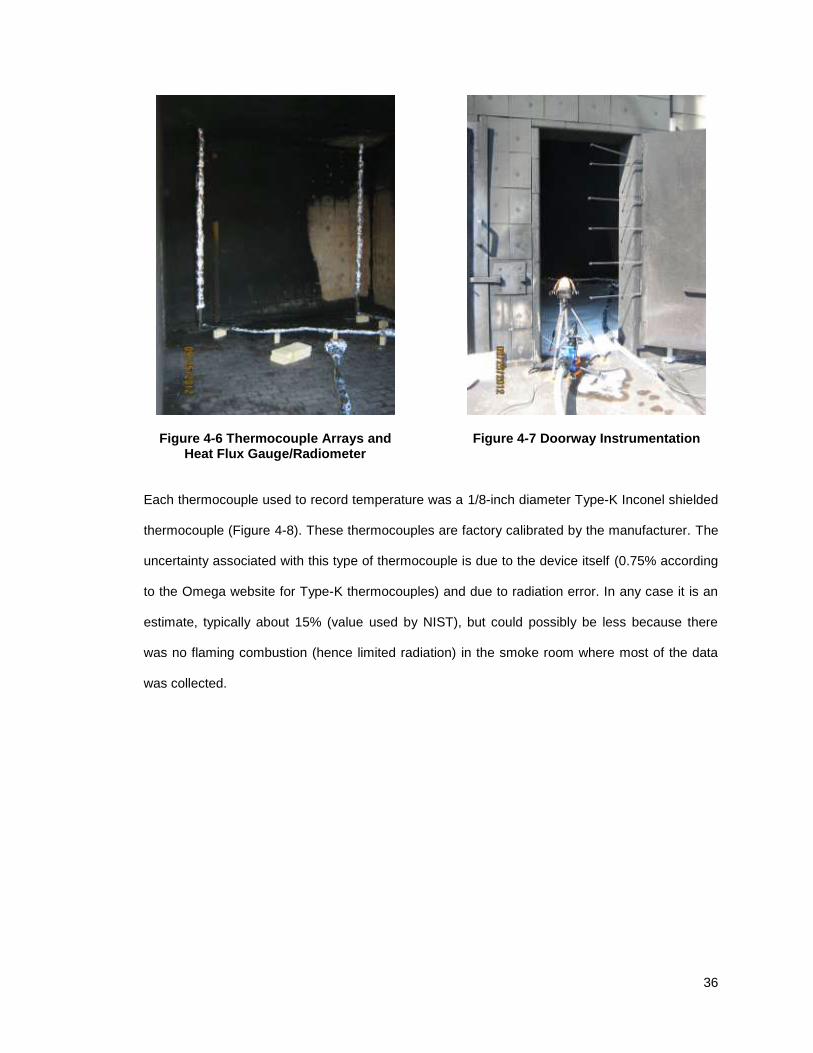
36
Figure 4-6 Thermocouple Arrays and Heat Flux Gauge/Radiometer
Figure 4-7 Doorway Instrumentation
Each thermocouple used to record temperature was a 1/8-inch diameter Type-K Inconel shielded
thermocouple (Figure 4-8). These thermocouples are factory calibrated by the manufacturer. The
uncertainty associated with this type of thermocouple is due to the device itself (0.75% according
to the Omega website for Type-K thermocouples) and due to radiation error. In any case it is an
estimate, typically about 15% (value used by NIST), but could possibly be less because there
was no flaming combustion (hence limited radiation) in the smoke room where most of the data
was collected.
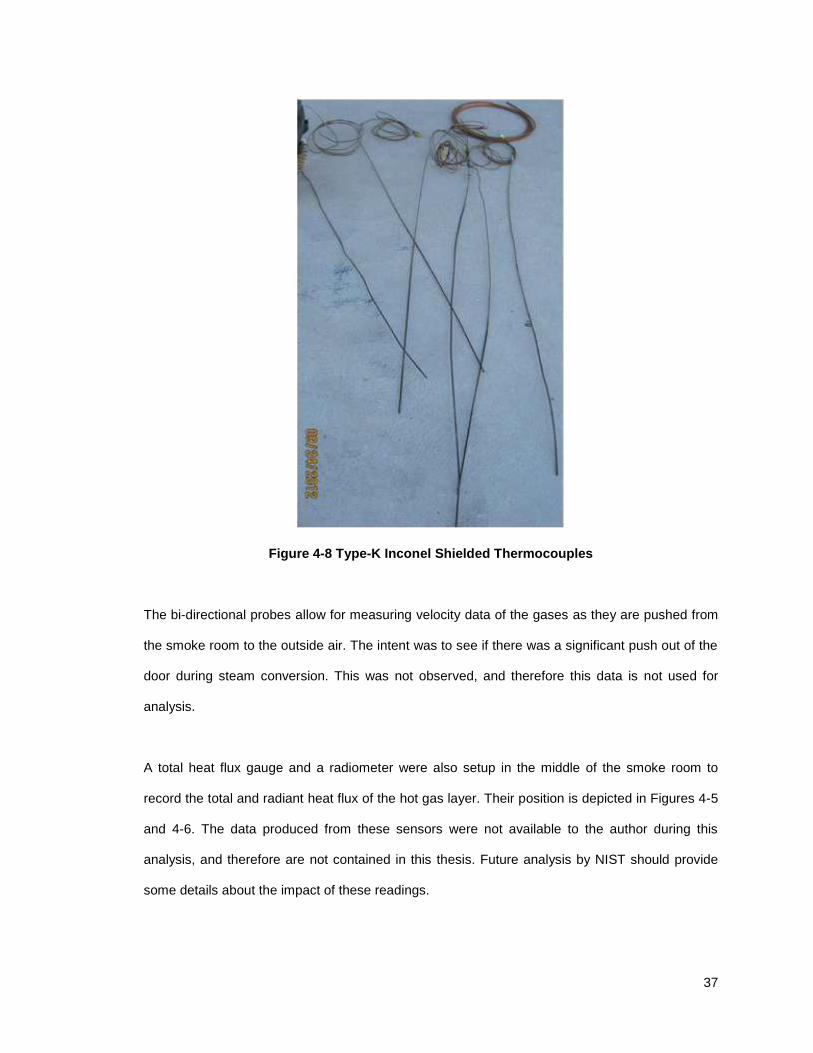
37
Figure 4-8 Type-K Inconel Shielded Thermocouples
The bi-directional probes allow for measuring velocity data of the gases as they are pushed from
the smoke room to the outside air. The intent was to see if there was a significant push out of the
door during steam conversion. This was not observed, and therefore this data is not used for
analysis.
A total heat flux gauge and a radiometer were also setup in the middle of the smoke room to
record the total and radiant heat flux of the hot gas layer. Their position is depicted in Figures 4-5
and 4-6. The data produced from these sensors were not available to the author during this
analysis, and therefore are not contained in this thesis. Future analysis by NIST should provide
some details about the impact of these readings.
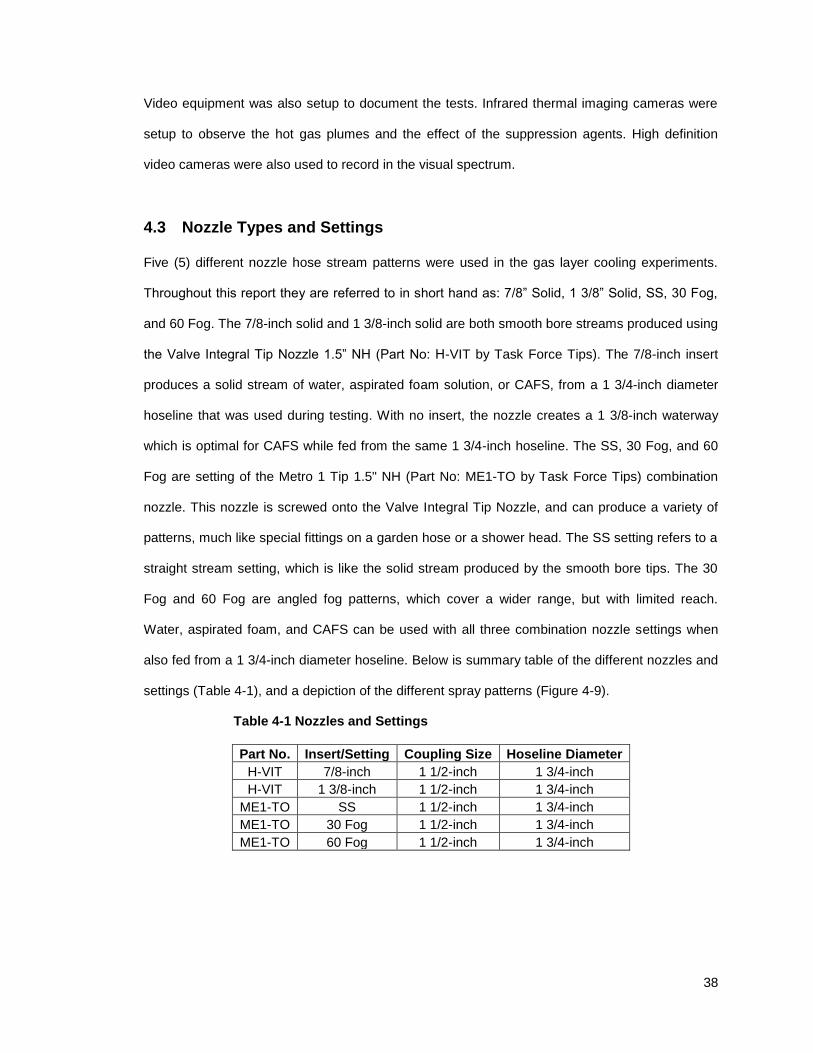
38
Video equipment was also setup to document the tests. Infrared thermal imaging cameras were
setup to observe the hot gas plumes and the effect of the suppression agents. High definition
video cameras were also used to record in the visual spectrum.
4.3 Nozzle Types and Settings
Five (5) different nozzle hose stream patterns were used in the gas layer cooling experiments.
Throughout this report they are referred to in short hand as: 7/8” Solid, 1 3/8” Solid, SS, 30 Fog,
and 60 Fog. The 7/8-inch solid and 1 3/8-inch solid are both smooth bore streams produced using
the Valve Integral Tip Nozzle 1.5” NH (Part No: H-VIT by Task Force Tips). The 7/8-inch insert
produces a solid stream of water, aspirated foam solution, or CAFS, from a 1 3/4-inch diameter
hoseline that was used during testing. With no insert, the nozzle creates a 1 3/8-inch waterway
which is optimal for CAFS while fed from the same 1 3/4-inch hoseline. The SS, 30 Fog, and 60
Fog are setting of the Metro 1 Tip 1.5" NH (Part No: ME1-TO by Task Force Tips) combination
nozzle. This nozzle is screwed onto the Valve Integral Tip Nozzle, and can produce a variety of
patterns, much like special fittings on a garden hose or a shower head. The SS setting refers to a
straight stream setting, which is like the solid stream produced by the smooth bore tips. The 30
Fog and 60 Fog are angled fog patterns, which cover a wider range, but with limited reach.
Water, aspirated foam, and CAFS can be used with all three combination nozzle settings when
also fed from a 1 3/4-inch diameter hoseline. Below is summary table of the different nozzles and
settings (Table 4-1), and a depiction of the different spray patterns (Figure 4-9).
Table 4-1 Nozzles and Settings
Part No. Insert/Setting Coupling Size Hoseline Diameter
H-VIT 7/8-inch 1 1/2-inch 1 3/4-inch
H-VIT 1 3/8-inch 1 1/2-inch 1 3/4-inch
ME1-TO SS 1 1/2-inch 1 3/4-inch
ME1-TO 30 Fog 1 1/2-inch 1 3/4-inch
ME1-TO 60 Fog 1 1/2-inch 1 3/4-inch
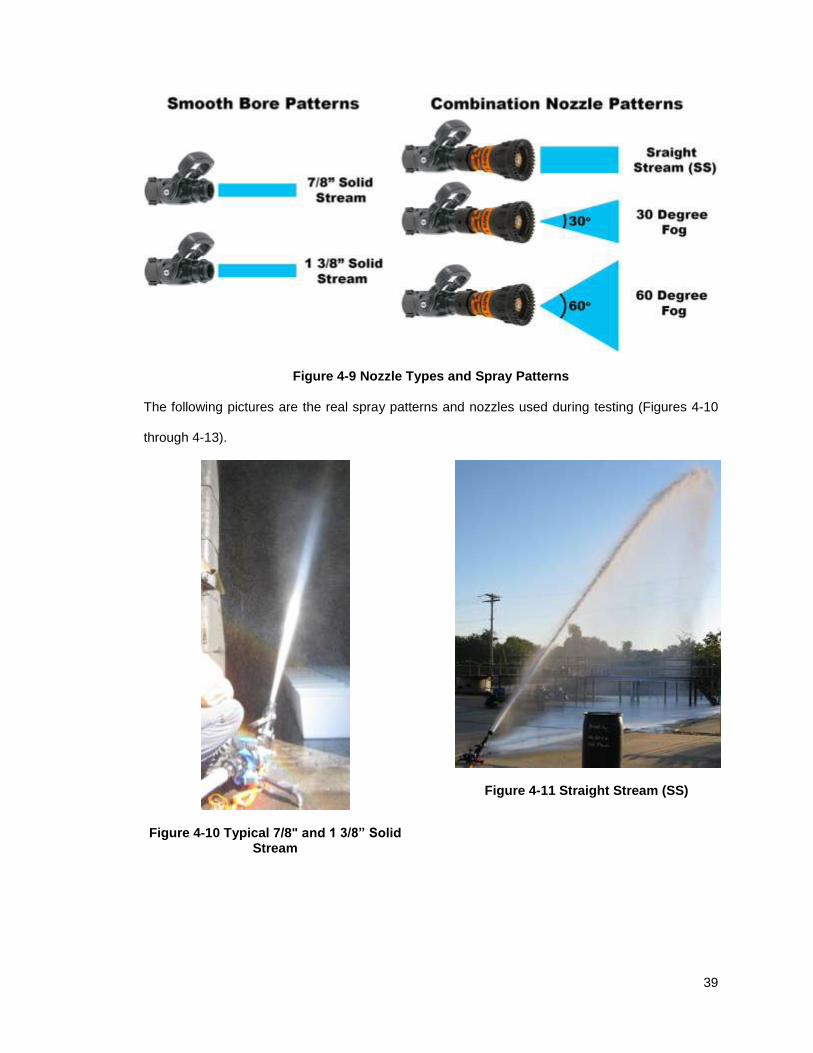
39
Figure 4-9 Nozzle Types and Spray Patterns
The following pictures are the real spray patterns and nozzles used during testing (Figures 4-10
through 4-13).
Figure 4-10 Typical 7/8" and 1 3/8” Solid Stream
Figure 4-11 Straight Stream (SS)
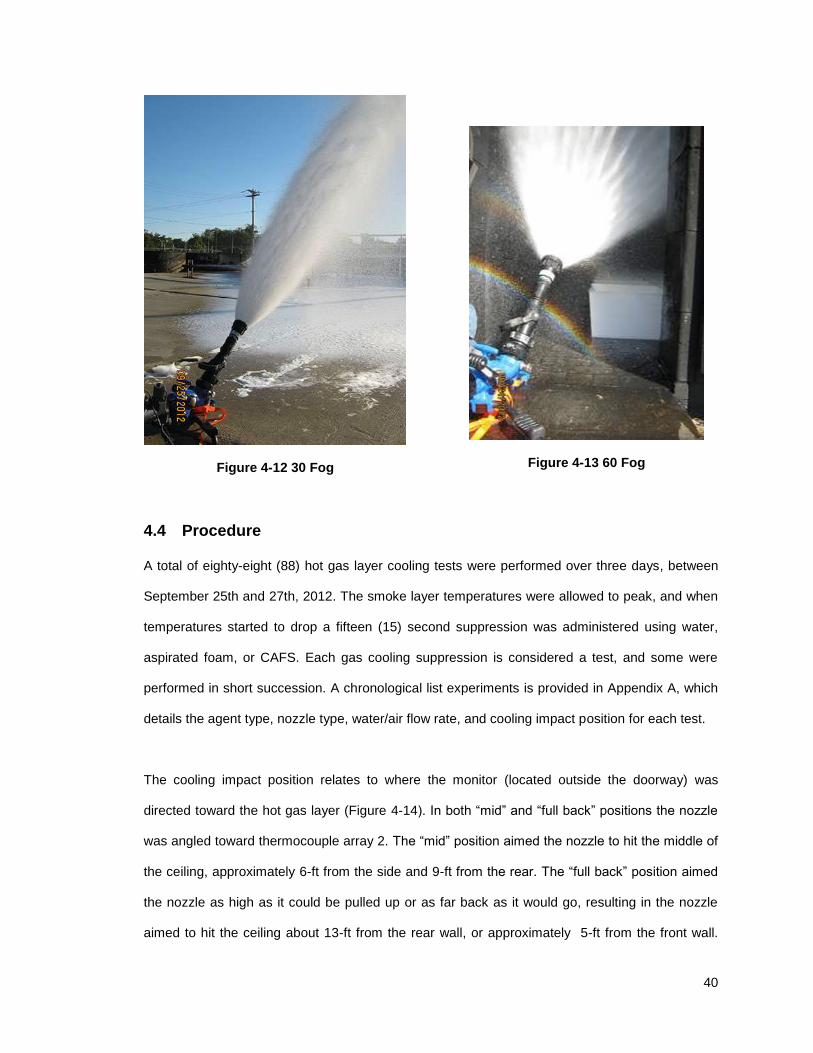
40
Figure 4-12 30 Fog
Figure 4-13 60 Fog
4.4 Procedure
A total of eighty-eight (88) hot gas layer cooling tests were performed over three days, between
September 25th and 27th, 2012. The smoke layer temperatures were allowed to peak, and when
temperatures started to drop a fifteen (15) second suppression was administered using water,
aspirated foam, or CAFS. Each gas cooling suppression is considered a test, and some were
performed in short succession. A chronological list experiments is provided in Appendix A, which
details the agent type, nozzle type, water/air flow rate, and cooling impact position for each test.
The cooling impact position relates to where the monitor (located outside the doorway) was
directed toward the hot gas layer (Figure 4-14). In both “mid” and “full back” positions the nozzle
was angled toward thermocouple array 2. The “mid” position aimed the nozzle to hit the middle of
the ceiling, approximately 6-ft from the side and 9-ft from the rear. The “full back” position aimed
the nozzle as high as it could be pulled up or as far back as it would go, resulting in the nozzle
aimed to hit the ceiling about 13-ft from the rear wall, or approximately 5-ft from the front wall.
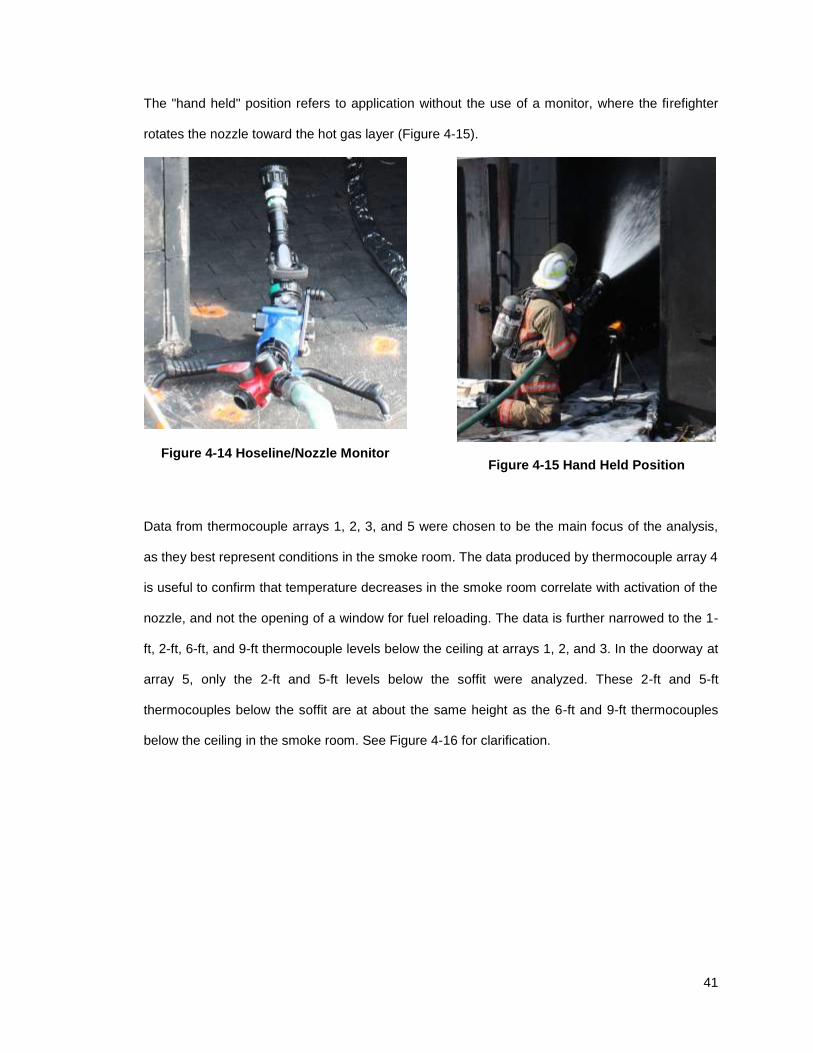
41
The "hand held" position refers to application without the use of a monitor, where the firefighter
rotates the nozzle toward the hot gas layer (Figure 4-15).
Figure 4-14 Hoseline/Nozzle Monitor
Figure 4-15 Hand Held Position
Data from thermocouple arrays 1, 2, 3, and 5 were chosen to be the main focus of the analysis,
as they best represent conditions in the smoke room. The data produced by thermocouple array 4
is useful to confirm that temperature decreases in the smoke room correlate with activation of the
nozzle, and not the opening of a window for fuel reloading. The data is further narrowed to the 1-
ft, 2-ft, 6-ft, and 9-ft thermocouple levels below the ceiling at arrays 1, 2, and 3. In the doorway at
array 5, only the 2-ft and 5-ft levels below the soffit were analyzed. These 2-ft and 5-ft
thermocouples below the soffit are at about the same height as the 6-ft and 9-ft thermocouples
below the ceiling in the smoke room. See Figure 4-16 for clarification.
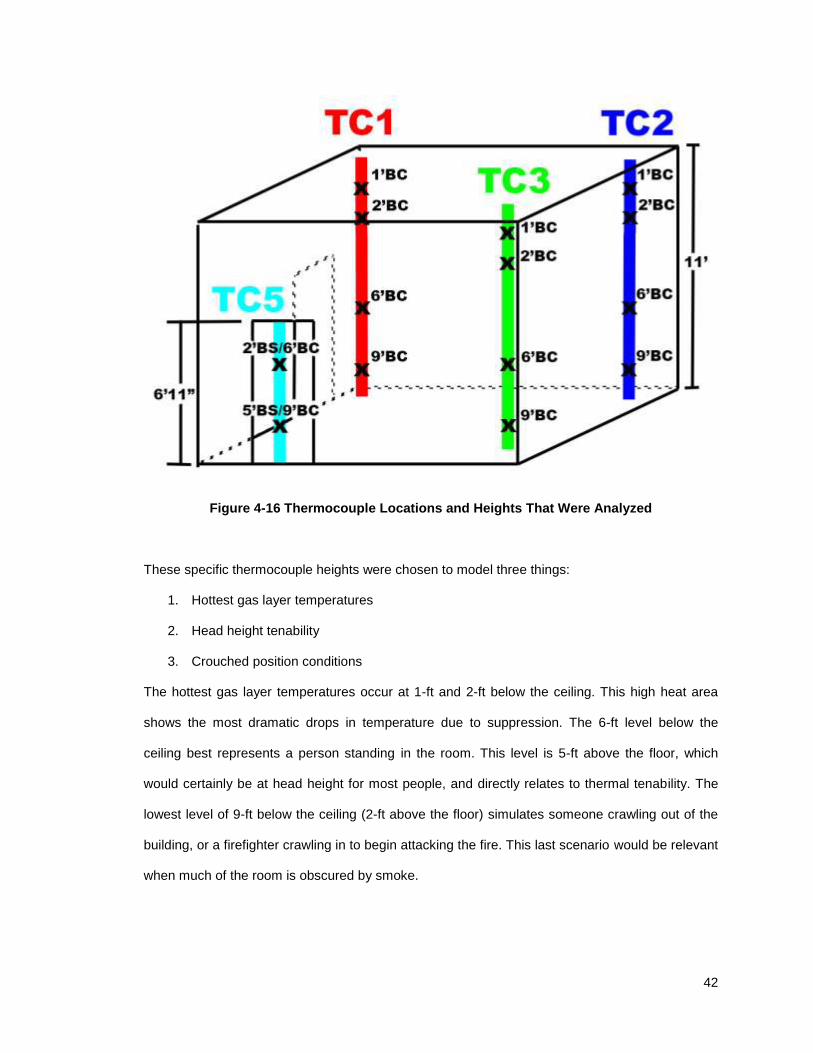
42
Figure 4-16 Thermocouple Locations and Heights That Were Analyzed
These specific thermocouple heights were chosen to model three things:
1. Hottest gas layer temperatures
2. Head height tenability
3. Crouched position conditions
The hottest gas layer temperatures occur at 1-ft and 2-ft below the ceiling. This high heat area
shows the most dramatic drops in temperature due to suppression. The 6-ft level below the
ceiling best represents a person standing in the room. This level is 5-ft above the floor, which
would certainly be at head height for most people, and directly relates to thermal tenability. The
lowest level of 9-ft below the ceiling (2-ft above the floor) simulates someone crawling out of the
building, or a firefighter crawling in to begin attacking the fire. This last scenario would be relevant
when much of the room is obscured by smoke.
43
4.5 Data Analysis and Results
Graphs of the temperatures recorded by each thermocouple array are provided for each test
series (see Appendix B), which contain multiple experiments. The series relate to the sets of data
between turning the data acquisition system. Starting the data acquisition begins with series 1. If
the acquisition system crashes or the operator shuts it down, this ends series 1. Every plot color
codes the thermocouple height, and has been marked to easily distinguish the peak high and low
temperatures associated with the agent suppression.
Example nomenclature for the graph legends is as follows:
GC1_0-30mBC Gas Cooling Experiment, Thermocouple Array 1, 0.30 meters Below Ceiling
GC5_1-52mBS Gas Cooling Experiment, Thermocouple Array 5, 1.52 meters Below Soffit
Below are height conversions for the thermocouple levels:
0.30m = 1-ft
0.61m = 2-ft
1.52m = 5-ft
1.83m = 6-ft
2.74m = 9-ft
The temperature drops displayed on the graphs were measured digitally, using Adobe Photoshop
CS6, and scaled to approximate the magnitude of each drop. Each temperature drop for every
test, at every height, was calculated and is tabulated in Appendix C. For each respective
thermocouple level, the temperature drops were averaged to produce a uniform room
temperature by height. These uniform temperatures were then averaged again to compare the
three agent types (H2O, aspirated foam, and CAFS) against their nozzle type, flow rate, and
cooling impact position. A final comparison was also made of all tests by agent type, regardless
of nozzle type, flow rate, and cooling impact position. Analysis A includes tables that summarize
these averaged temperature drops. Analysis B on the contrary, does not average these
44
temperature drops, but instead examines each thermocouple reading in Appendix C through
statistical significance tests. Like analysis A, the statistical tests are also grouped by nozzle type,
water flow rate, cooling impact position, and agent only.
4.5.1 Data Analysis A – Averaging Temperature Drops
The tables below contain averaged temperature drops for all the tests performed. Within the
tables the number in parenthesis represents the quantity of tests averaged for that particular
criteria and agent type. For example, thirty-four (34) total tests were performed using the 7/8-inch
solid stream nozzle insert, twenty-one (21) using water, three (3) using aspirated foam, and ten
(10) using CAFS. The numbers in the square brackets are the standard deviations for each
respective temperature drop population. The values in red are the differences between the
highest average temperature drop and the average temperature drop for that particular agent. All
the data is provided for completeness, but only certain parts are relevant. The 7/8-inch solid, SS,
and 30 degree fog nozzles tested all three agent types, making them comparable, whereas the 1
3/8-inch solid and 60 degree fog nozzles only ran CAFS and water respectively, and therefore are
not comparable. Likewise for the water flow rates, the 110-gpm and 180-gpm tests cannot be
compared to any other agent. Other tests are comparable to at least one other agent type, but
have small sample sizes. The 150-gpm and 115-gpm water flow rates, for example, are not as
conclusive as say the 120-gpm water flow rate tests.
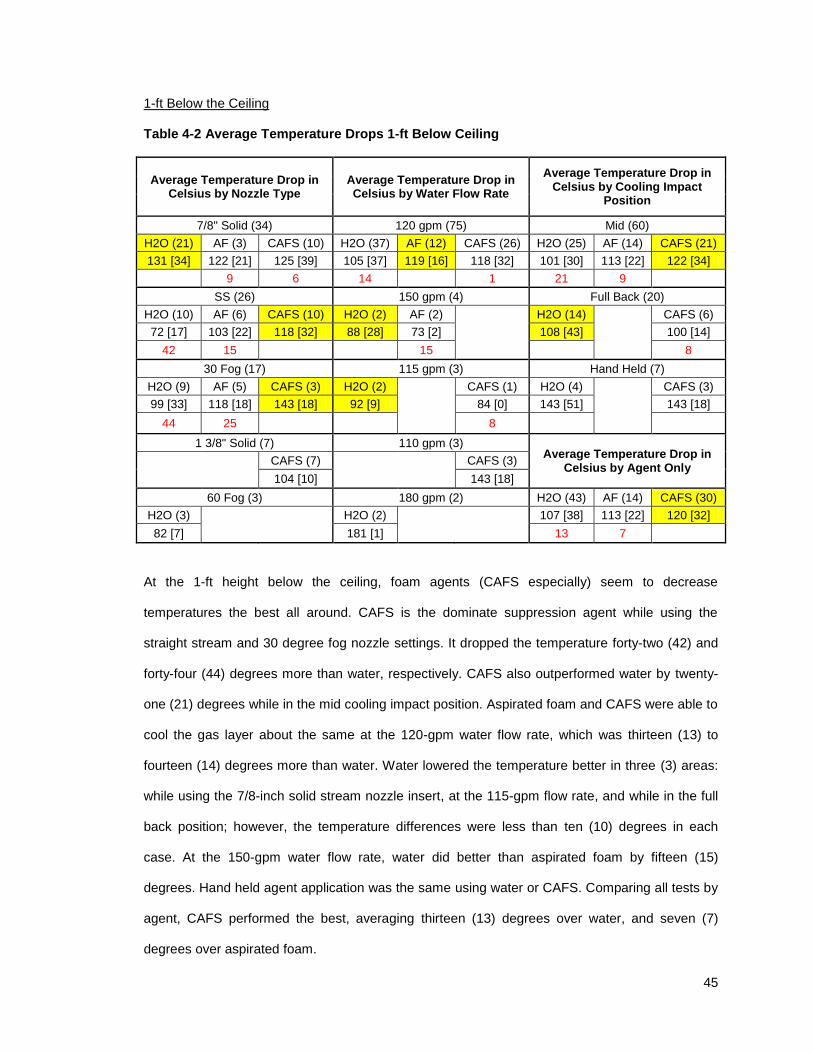
45
1-ft Below the Ceiling
Table 4-2 Average Temperature Drops 1-ft Below Ceiling
Average Temperature Drop in Celsius by Nozzle Type
Average Temperature Drop in Celsius by Water Flow Rate
Average Temperature Drop in Celsius by Cooling Impact
Position
7/8" Solid (34) 120 gpm (75) Mid (60)
H2O (21) AF (3) CAFS (10) H2O (37) AF (12) CAFS (26) H2O (25) AF (14) CAFS (21)
131 [34] 122 [21] 125 [39] 105 [37] 119 [16] 118 [32] 101 [30] 113 [22] 122 [34]
9 6 14 1 21 9
SS (26) 150 gpm (4) Full Back (20)
H2O (10) AF (6) CAFS (10) H2O (2) AF (2) H2O (14)
CAFS (6)
72 [17] 103 [22] 118 [32] 88 [28] 73 [2] 108 [43]
100 [14]
42 15 15 8
30 Fog (17) 115 gpm (3) Hand Held (7)
H2O (9) AF (5) CAFS (3) H2O (2)
CAFS (1) H2O (4)
CAFS (3)
99 [33] 118 [18] 143 [18] 92 [9]
84 [0] 143 [51]
143 [18]
44 25
8
1 3/8" Solid (7) 110 gpm (3) Average Temperature Drop in
Celsius by Agent Only
CAFS (7)
CAFS (3)
104 [10] 143 [18]
60 Fog (3) 180 gpm (2) H2O (43) AF (14) CAFS (30)
H2O (3)
H2O (2)
107 [38] 113 [22] 120 [32]
82 [7] 181 [1] 13 7
At the 1-ft height below the ceiling, foam agents (CAFS especially) seem to decrease
temperatures the best all around. CAFS is the dominate suppression agent while using the
straight stream and 30 degree fog nozzle settings. It dropped the temperature forty-two (42) and
forty-four (44) degrees more than water, respectively. CAFS also outperformed water by twenty-
one (21) degrees while in the mid cooling impact position. Aspirated foam and CAFS were able to
cool the gas layer about the same at the 120-gpm water flow rate, which was thirteen (13) to
fourteen (14) degrees more than water. Water lowered the temperature better in three (3) areas:
while using the 7/8-inch solid stream nozzle insert, at the 115-gpm flow rate, and while in the full
back position; however, the temperature differences were less than ten (10) degrees in each
case. At the 150-gpm water flow rate, water did better than aspirated foam by fifteen (15)
degrees. Hand held agent application was the same using water or CAFS. Comparing all tests by
agent, CAFS performed the best, averaging thirteen (13) degrees over water, and seven (7)
degrees over aspirated foam.
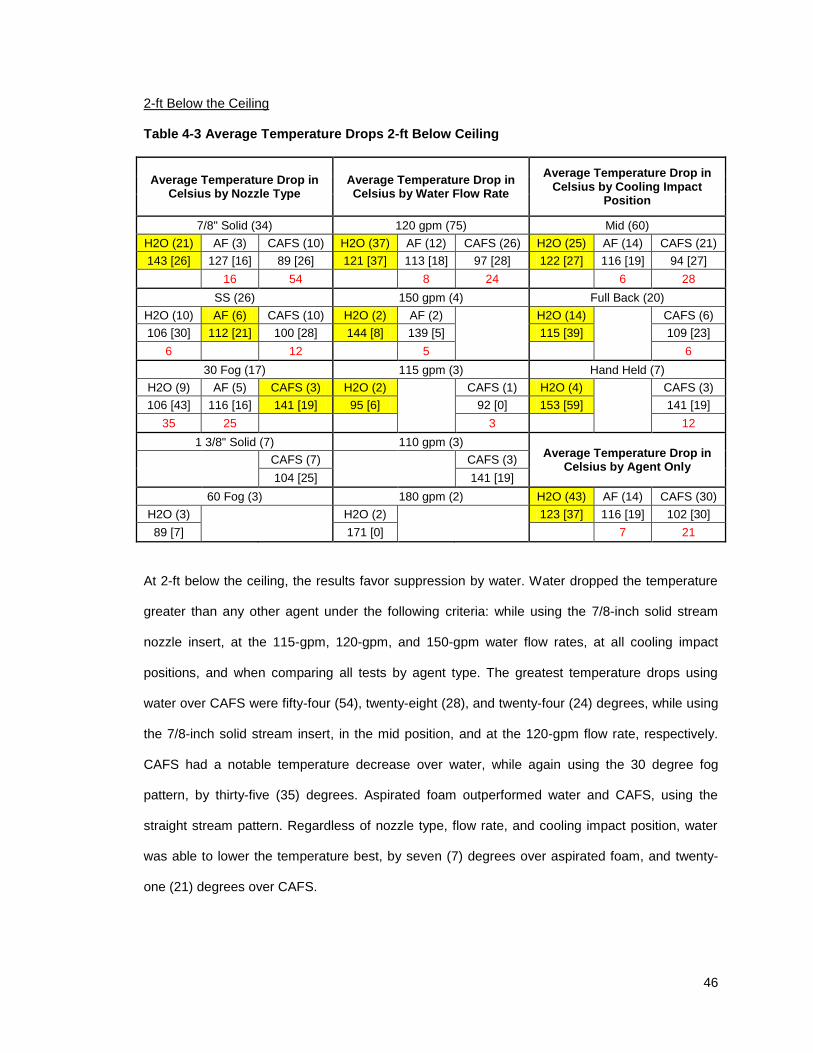
46
2-ft Below the Ceiling
Table 4-3 Average Temperature Drops 2-ft Below Ceiling
Average Temperature Drop in Celsius by Nozzle Type
Average Temperature Drop in Celsius by Water Flow Rate
Average Temperature Drop in Celsius by Cooling Impact
Position
7/8" Solid (34) 120 gpm (75) Mid (60)
H2O (21) AF (3) CAFS (10) H2O (37) AF (12) CAFS (26) H2O (25) AF (14) CAFS (21)
143 [26] 127 [16] 89 [26] 121 [37] 113 [18] 97 [28] 122 [27] 116 [19] 94 [27]
16 54 8 24 6 28
SS (26) 150 gpm (4) Full Back (20)
H2O (10) AF (6) CAFS (10) H2O (2) AF (2) H2O (14)
CAFS (6)
106 [30] 112 [21] 100 [28] 144 [8] 139 [5] 115 [39]
109 [23]
6 12 5 6
30 Fog (17) 115 gpm (3) Hand Held (7)
H2O (9) AF (5) CAFS (3) H2O (2)
CAFS (1) H2O (4)
CAFS (3)
106 [43] 116 [16] 141 [19] 95 [6]
92 [0] 153 [59]
141 [19]
35 25
3
12
1 3/8" Solid (7) 110 gpm (3) Average Temperature Drop in
Celsius by Agent Only
CAFS (7)
CAFS (3)
104 [25] 141 [19]
60 Fog (3) 180 gpm (2) H2O (43) AF (14) CAFS (30)
H2O (3)
H2O (2)
123 [37] 116 [19] 102 [30]
89 [7] 171 [0] 7 21
At 2-ft below the ceiling, the results favor suppression by water. Water dropped the temperature
greater than any other agent under the following criteria: while using the 7/8-inch solid stream
nozzle insert, at the 115-gpm, 120-gpm, and 150-gpm water flow rates, at all cooling impact
positions, and when comparing all tests by agent type. The greatest temperature drops using
water over CAFS were fifty-four (54), twenty-eight (28), and twenty-four (24) degrees, while using
the 7/8-inch solid stream insert, in the mid position, and at the 120-gpm flow rate, respectively.
CAFS had a notable temperature decrease over water, while again using the 30 degree fog
pattern, by thirty-five (35) degrees. Aspirated foam outperformed water and CAFS, using the
straight stream pattern. Regardless of nozzle type, flow rate, and cooling impact position, water
was able to lower the temperature best, by seven (7) degrees over aspirated foam, and twenty-
one (21) degrees over CAFS.
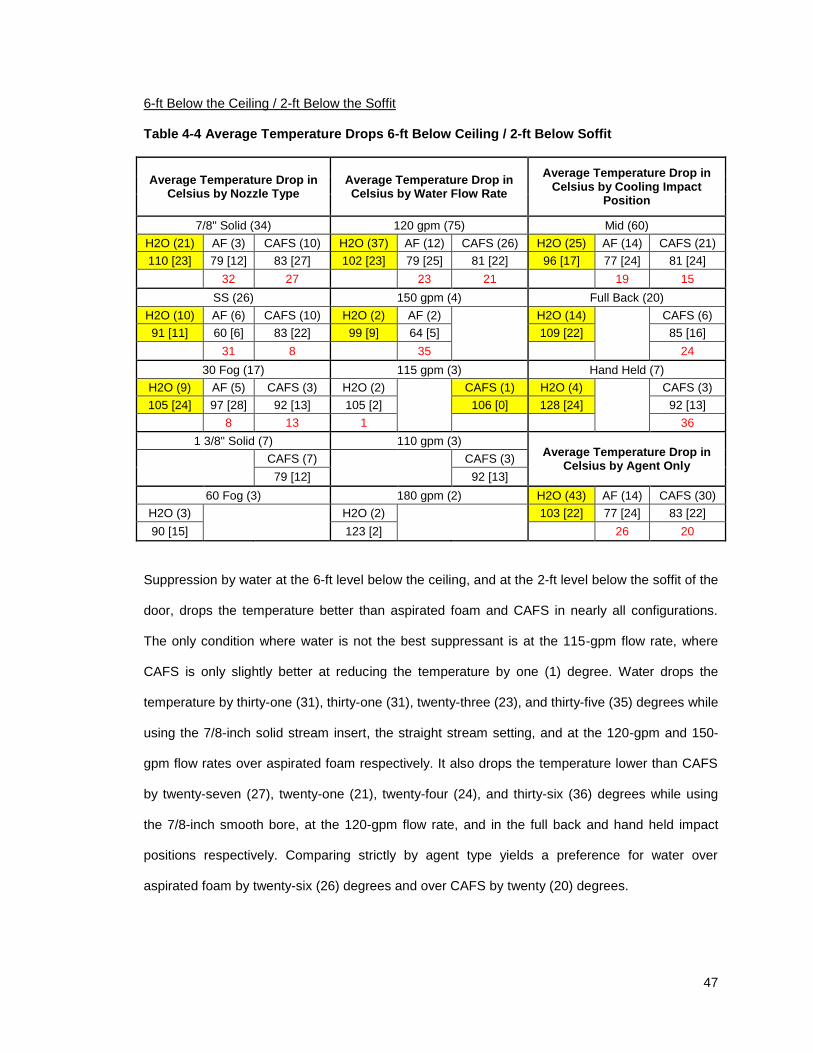
47
6-ft Below the Ceiling / 2-ft Below the Soffit
Table 4-4 Average Temperature Drops 6-ft Below Ceiling / 2-ft Below Soffit
Average Temperature Drop in Celsius by Nozzle Type
Average Temperature Drop in Celsius by Water Flow Rate
Average Temperature Drop in Celsius by Cooling Impact
Position
7/8" Solid (34) 120 gpm (75) Mid (60)
H2O (21) AF (3) CAFS (10) H2O (37) AF (12) CAFS (26) H2O (25) AF (14) CAFS (21)
110 [23] 79 [12] 83 [27] 102 [23] 79 [25] 81 [22] 96 [17] 77 [24] 81 [24]
32 27 23 21 19 15
SS (26) 150 gpm (4) Full Back (20)
H2O (10) AF (6) CAFS (10) H2O (2) AF (2) H2O (14)
CAFS (6)
91 [11] 60 [6] 83 [22] 99 [9] 64 [5] 109 [22]
85 [16]
31 8 35 24
30 Fog (17) 115 gpm (3) Hand Held (7)
H2O (9) AF (5) CAFS (3) H2O (2)
CAFS (1) H2O (4)
CAFS (3)
105 [24] 97 [28] 92 [13] 105 [2]
106 [0] 128 [24]
92 [13]
8 13 1
36
1 3/8" Solid (7) 110 gpm (3) Average Temperature Drop in
Celsius by Agent Only
CAFS (7)
CAFS (3)
79 [12] 92 [13]
60 Fog (3) 180 gpm (2) H2O (43) AF (14) CAFS (30)
H2O (3)
H2O (2)
103 [22] 77 [24] 83 [22]
90 [15] 123 [2] 26 20
Suppression by water at the 6-ft level below the ceiling, and at the 2-ft level below the soffit of the
door, drops the temperature better than aspirated foam and CAFS in nearly all configurations.
The only condition where water is not the best suppressant is at the 115-gpm flow rate, where
CAFS is only slightly better at reducing the temperature by one (1) degree. Water drops the
temperature by thirty-one (31), thirty-one (31), twenty-three (23), and thirty-five (35) degrees while
using the 7/8-inch solid stream insert, the straight stream setting, and at the 120-gpm and 150-
gpm flow rates over aspirated foam respectively. It also drops the temperature lower than CAFS
by twenty-seven (27), twenty-one (21), twenty-four (24), and thirty-six (36) degrees while using
the 7/8-inch smooth bore, at the 120-gpm flow rate, and in the full back and hand held impact
positions respectively. Comparing strictly by agent type yields a preference for water over
aspirated foam by twenty-six (26) degrees and over CAFS by twenty (20) degrees.
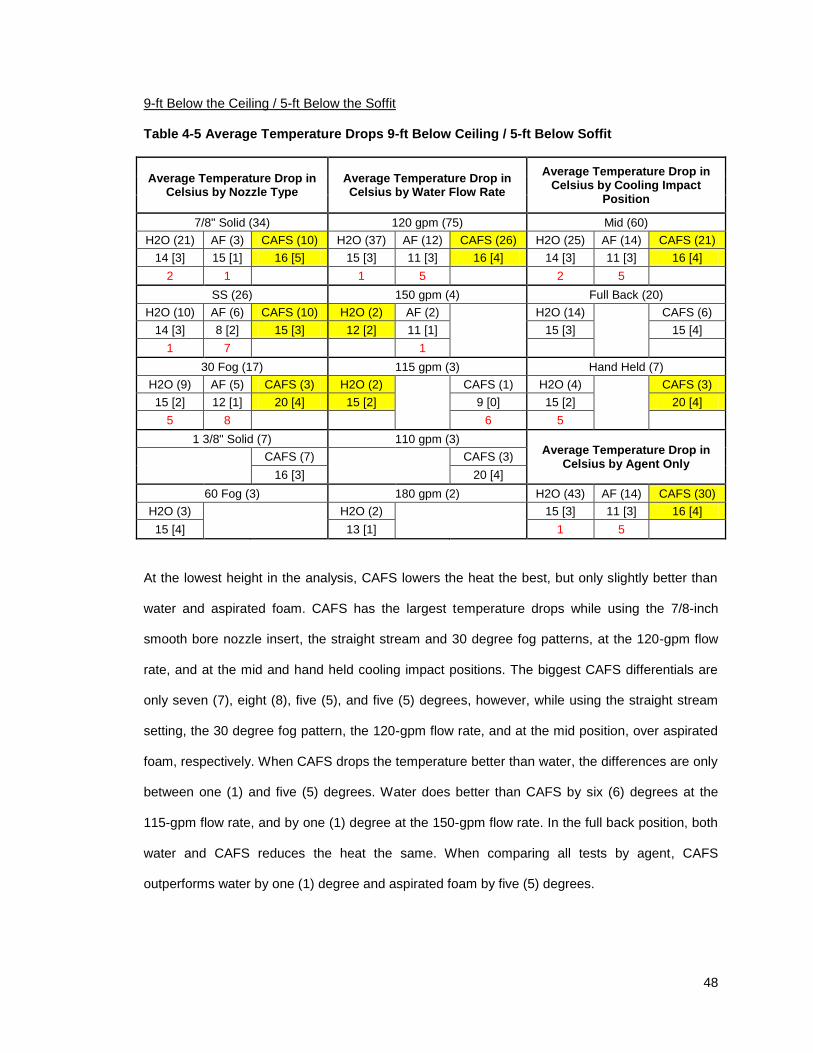
48
9-ft Below the Ceiling / 5-ft Below the Soffit
Table 4-5 Average Temperature Drops 9-ft Below Ceiling / 5-ft Below Soffit
Average Temperature Drop in Celsius by Nozzle Type
Average Temperature Drop in Celsius by Water Flow Rate
Average Temperature Drop in Celsius by Cooling Impact
Position
7/8" Solid (34) 120 gpm (75) Mid (60)
H2O (21) AF (3) CAFS (10) H2O (37) AF (12) CAFS (26) H2O (25) AF (14) CAFS (21)
14 [3] 15 [1] 16 [5] 15 [3] 11 [3] 16 [4] 14 [3] 11 [3] 16 [4]
2 1 1 5 2 5
SS (26) 150 gpm (4) Full Back (20)
H2O (10) AF (6) CAFS (10) H2O (2) AF (2) H2O (14)
CAFS (6)
14 [3] 8 [2] 15 [3] 12 [2] 11 [1] 15 [3]
15 [4]
1 7 1
30 Fog (17) 115 gpm (3) Hand Held (7)
H2O (9) AF (5) CAFS (3) H2O (2)
CAFS (1) H2O (4)
CAFS (3)
15 [2] 12 [1] 20 [4] 15 [2]
9 [0] 15 [2]
20 [4]
5 8
6 5
1 3/8" Solid (7) 110 gpm (3) Average Temperature Drop in
Celsius by Agent Only
CAFS (7)
CAFS (3)
16 [3] 20 [4]
60 Fog (3) 180 gpm (2) H2O (43) AF (14) CAFS (30)
H2O (3)
H2O (2)
15 [3] 11 [3] 16 [4]
15 [4] 13 [1] 1 5
At the lowest height in the analysis, CAFS lowers the heat the best, but only slightly better than
water and aspirated foam. CAFS has the largest temperature drops while using the 7/8-inch
smooth bore nozzle insert, the straight stream and 30 degree fog patterns, at the 120-gpm flow
rate, and at the mid and hand held cooling impact positions. The biggest CAFS differentials are
only seven (7), eight (8), five (5), and five (5) degrees, however, while using the straight stream
setting, the 30 degree fog pattern, the 120-gpm flow rate, and at the mid position, over aspirated
foam, respectively. When CAFS drops the temperature better than water, the differences are only
between one (1) and five (5) degrees. Water does better than CAFS by six (6) degrees at the
115-gpm flow rate, and by one (1) degree at the 150-gpm flow rate. In the full back position, both
water and CAFS reduces the heat the same. When comparing all tests by agent, CAFS
outperforms water by one (1) degree and aspirated foam by five (5) degrees.
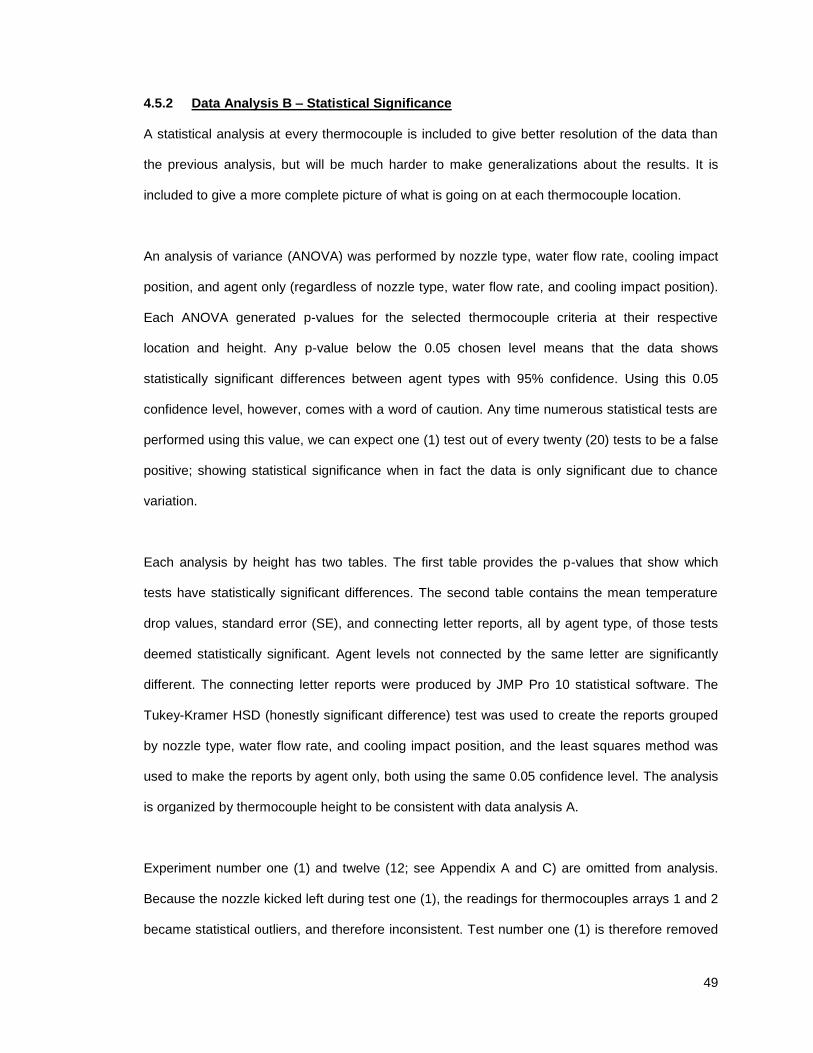
49
4.5.2 Data Analysis B – Statistical Significance
A statistical analysis at every thermocouple is included to give better resolution of the data than
the previous analysis, but will be much harder to make generalizations about the results. It is
included to give a more complete picture of what is going on at each thermocouple location.
An analysis of variance (ANOVA) was performed by nozzle type, water flow rate, cooling impact
position, and agent only (regardless of nozzle type, water flow rate, and cooling impact position).
Each ANOVA generated p-values for the selected thermocouple criteria at their respective
location and height. Any p-value below the 0.05 chosen level means that the data shows
statistically significant differences between agent types with 95% confidence. Using this 0.05
confidence level, however, comes with a word of caution. Any time numerous statistical tests are
performed using this value, we can expect one (1) test out of every twenty (20) tests to be a false
positive; showing statistical significance when in fact the data is only significant due to chance
variation.
Each analysis by height has two tables. The first table provides the p-values that show which
tests have statistically significant differences. The second table contains the mean temperature
drop values, standard error (SE), and connecting letter reports, all by agent type, of those tests
deemed statistically significant. Agent levels not connected by the same letter are significantly
different. The connecting letter reports were produced by JMP Pro 10 statistical software. The
Tukey-Kramer HSD (honestly significant difference) test was used to create the reports grouped
by nozzle type, water flow rate, and cooling impact position, and the least squares method was
used to make the reports by agent only, both using the same 0.05 confidence level. The analysis
is organized by thermocouple height to be consistent with data analysis A.
Experiment number one (1) and twelve (12; see Appendix A and C) are omitted from analysis.
Because the nozzle kicked left during test one (1), the readings for thermocouples arrays 1 and 2
became statistical outliers, and therefore inconsistent. Test number one (1) is therefore removed
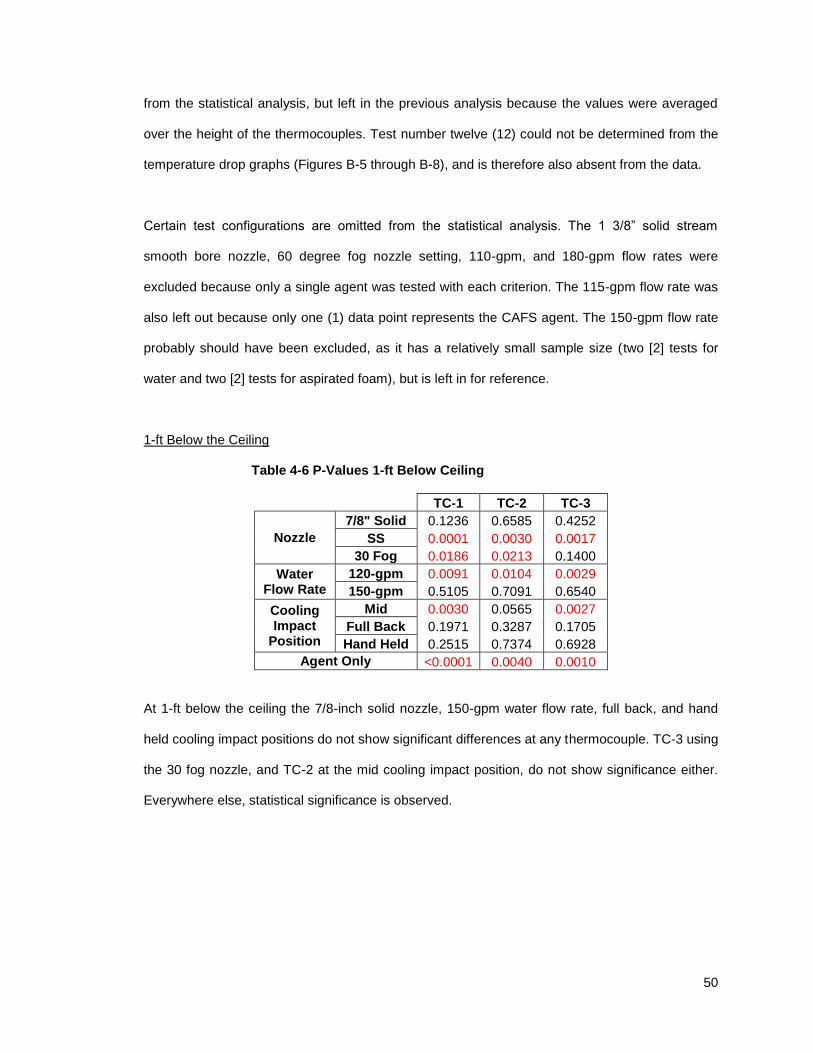
50
from the statistical analysis, but left in the previous analysis because the values were averaged
over the height of the thermocouples. Test number twelve (12) could not be determined from the
temperature drop graphs (Figures B-5 through B-8), and is therefore also absent from the data.
Certain test configurations are omitted from the statistical analysis. The 1 3/8” solid stream
smooth bore nozzle, 60 degree fog nozzle setting, 110-gpm, and 180-gpm flow rates were
excluded because only a single agent was tested with each criterion. The 115-gpm flow rate was
also left out because only one (1) data point represents the CAFS agent. The 150-gpm flow rate
probably should have been excluded, as it has a relatively small sample size (two [2] tests for
water and two [2] tests for aspirated foam), but is left in for reference.
1-ft Below the Ceiling
Table 4-6 P-Values 1-ft Below Ceiling
TC-1 TC-2 TC-3
Nozzle
7/8" Solid 0.1236 0.6585 0.4252
SS 0.0001 0.0030 0.0017
30 Fog 0.0186 0.0213 0.1400
Water Flow Rate
120-gpm 0.0091 0.0104 0.0029
150-gpm 0.5105 0.7091 0.6540
Cooling Impact
Position
Mid 0.0030 0.0565 0.0027
Full Back 0.1971 0.3287 0.1705
Hand Held 0.2515 0.7374 0.6928
Agent Only <0.0001 0.0040 0.0010
At 1-ft below the ceiling the 7/8-inch solid nozzle, 150-gpm water flow rate, full back, and hand
held cooling impact positions do not show significant differences at any thermocouple. TC-3 using
the 30 fog nozzle, and TC-2 at the mid cooling impact position, do not show significance either.
Everywhere else, statistical significance is observed.
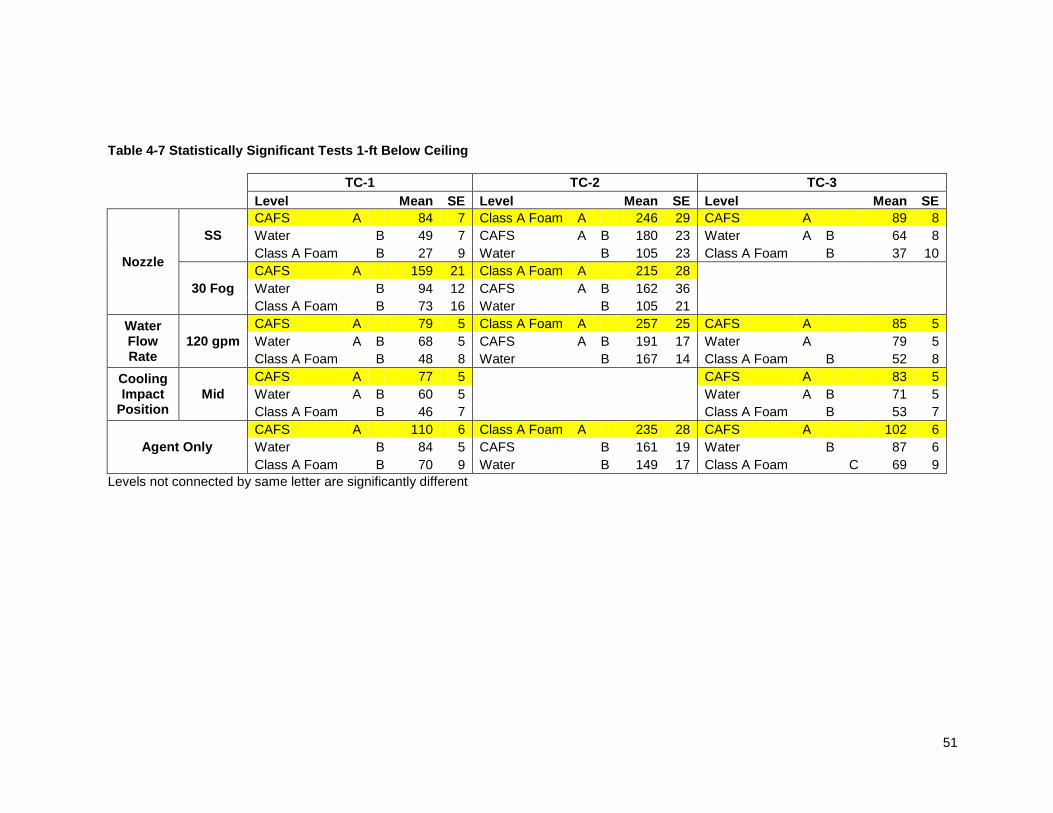
51
Table 4-7 Statistically Significant Tests 1-ft Below Ceiling
TC-1 TC-2 TC-3
Level Mean SE Level Mean SE Level Mean SE
Nozzle
SS
CAFS A 84 7 Class A Foam A 246 29 CAFS A 89 8
Water B 49 7 CAFS A B 180 23 Water A B
64 8
Class A Foam B 27 9 Water B 105 23 Class A Foam B 37 10
30 Fog
CAFS A 159 21 Class A Foam A 215 28
Water B 94 12 CAFS A B 162 36
Class A Foam B 73 16 Water B 105 21
Water Flow Rate
120 gpm
CAFS A 79 5 Class A Foam A 257 25 CAFS A 85 5
Water A B 68 5 CAFS A B 191 17 Water A
79 5
Class A Foam B 48 8 Water B 167 14 Class A Foam B 52 8
Cooling Impact
Position Mid
CAFS A 77 5 CAFS A 83 5
Water A B 60 5
Water A B
71 5
Class A Foam B 46 7 Class A Foam B 53 7
Agent Only
CAFS A 110 6 Class A Foam A 235 28 CAFS A 102 6
Water B 84 5 CAFS B 161 19 Water B 87 6
Class A Foam B 70 9 Water B 149 17 Class A Foam C 69 9
Levels not connected by same letter are significantly different
52
There is an obvious trend favoring foam agents that depends on the location of the thermocouple,
and is consistent regardless of nozzle, flow rate, cooling impact position, or agent only. At every
configuration TC-1 and TC-3 have the same pattern in descending order of mean temperature
drop: CAFS, water, and Class A foam (aspirated foam). At these locations CAFS is always more
significant than aspirated foam. At TC-1 CAFS is clearly more significant than water using the SS
and 30 fog nozzle setting, and by comparing agent only, but not as significant for the 120-gpm
flow rate or the mid position. At TC-3 CAFS is not significantly different than water for the SS
nozzle setting, 120-gpm flow rate, or mid position, but is for agent only. At TC-2 the profile in
descending average temperature drop is: aspirated foam, CAFS, and water. Here aspirated foam
is clearly better at dropping the temperature than water, but only marginally better than CAFS
(except by agent only). Similar to the 1-ft height below the ceiling results of data analysis A, the
tests seem to have larger and more significant temperature drops with CAFS or aspirated foam
than with water.
2-ft Below the Ceiling
Table 4-8 P-Values 2-ft Below Ceiling
TC-1 TC-2 TC-3
Nozzle
7/8" Solid 0.1473 <0.0001 0.3535
SS 0.0021 0.0132 0.0031
30 Fog 0.2509 0.0212 0.1296
Water Flow Rate
120-gpm 0.0449 0.0005 0.0017
150-gpm 0.4625 0.8509 0.6586
Cooling Impact
Position
Mid 0.0794 <0.0001 0.0017
Full Back 0.3521 0.5353 0.5985
Hand Held 0.9639 0.7666 0.6764
Agent Only 0.1068 <0.0001 0.0022
2-ft below the ceiling does not show significant differences at any location for the 150-gpm water
flow rate, nor for the full back and hand held cooling impact positions. The SS nozzle setting
shows significance at all locations, while the 7/8-inch solid and 30 fog nozzle settings are only
significant at TC-2. The mid cooling impact position and agent only comparison show differences
at TC-2 and TC-3.
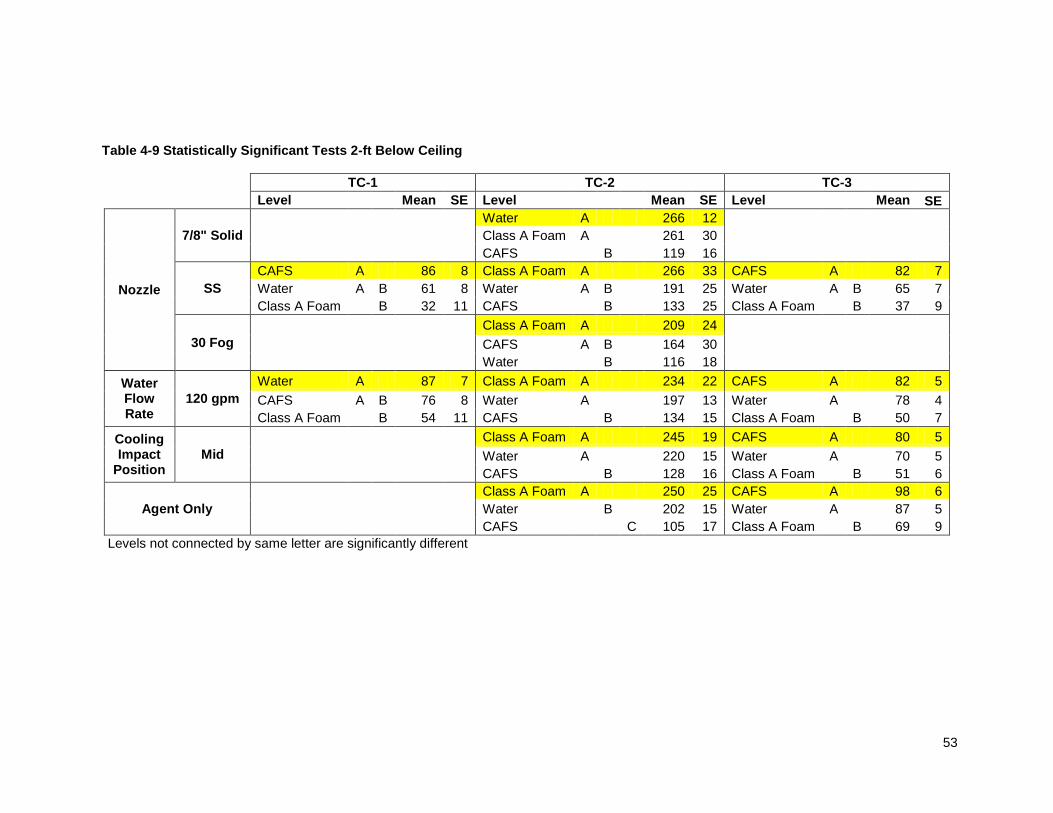
53
Table 4-9 Statistically Significant Tests 2-ft Below Ceiling
TC-1 TC-2 TC-3
Level Mean SE Level Mean SE Level Mean SE
Nozzle
7/8" Solid
Water A 266 12
Class A Foam A
261 30
CAFS B 119 16
SS
CAFS A 86 8 Class A Foam A 266 33 CAFS A 82 7
Water A B 61 8 Water A B
191 25 Water A B 65 7
Class A Foam B 32 11 CAFS B 133 25 Class A Foam B 37 9
30 Fog
Class A Foam A 209 24
CAFS A B
164 30
Water B 116 18
Water Flow Rate
120 gpm
Water A 87 7 Class A Foam A 234 22 CAFS A 82 5
CAFS A B 76 8 Water A
197 13 Water A 78 4
Class A Foam B 54 11 CAFS B 134 15 Class A Foam B 50 7
Cooling Impact
Position Mid
Class A Foam A 245 19 CAFS A 80 5
Water A
220 15 Water A 70 5
CAFS B 128 16 Class A Foam B 51 6
Agent Only
Class A Foam A 250 25 CAFS A 98 6
Water B 202 15 Water A 87 5
CAFS C 105 17 Class A Foam B 69 9
Levels not connected by same letter are significantly different
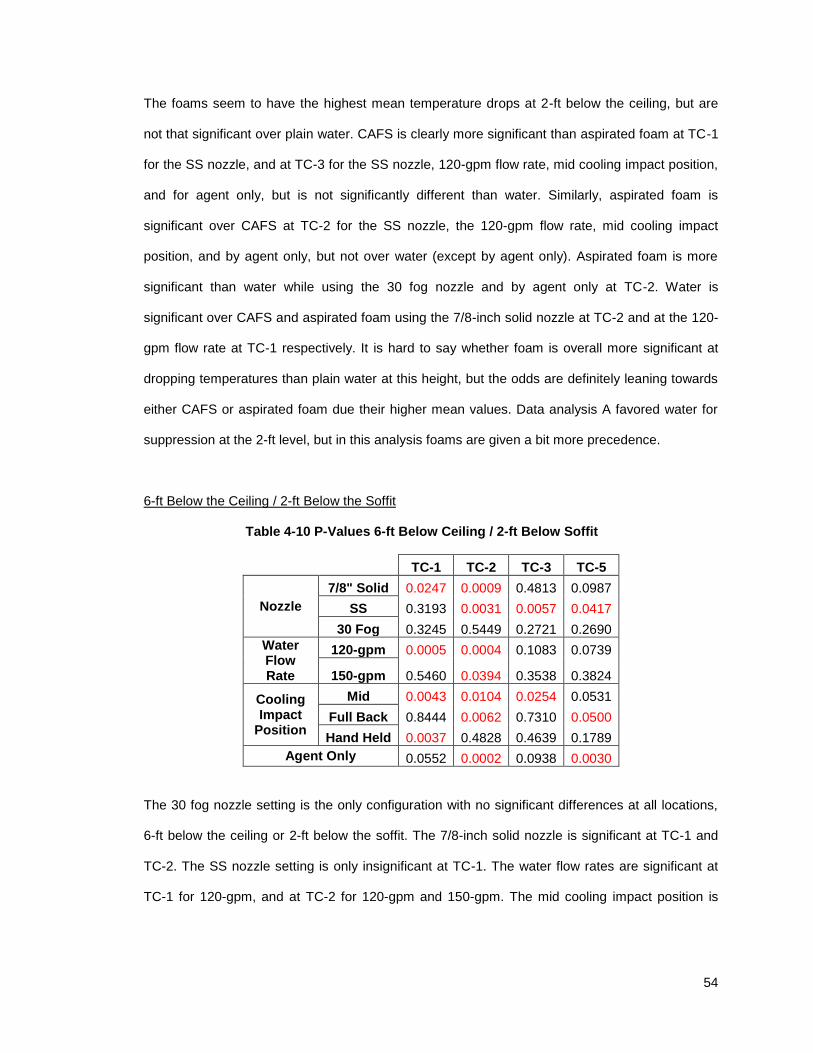
54
The foams seem to have the highest mean temperature drops at 2-ft below the ceiling, but are
not that significant over plain water. CAFS is clearly more significant than aspirated foam at TC-1
for the SS nozzle, and at TC-3 for the SS nozzle, 120-gpm flow rate, mid cooling impact position,
and for agent only, but is not significantly different than water. Similarly, aspirated foam is
significant over CAFS at TC-2 for the SS nozzle, the 120-gpm flow rate, mid cooling impact
position, and by agent only, but not over water (except by agent only). Aspirated foam is more
significant than water while using the 30 fog nozzle and by agent only at TC-2. Water is
significant over CAFS and aspirated foam using the 7/8-inch solid nozzle at TC-2 and at the 120-
gpm flow rate at TC-1 respectively. It is hard to say whether foam is overall more significant at
dropping temperatures than plain water at this height, but the odds are definitely leaning towards
either CAFS or aspirated foam due their higher mean values. Data analysis A favored water for
suppression at the 2-ft level, but in this analysis foams are given a bit more precedence.
6-ft Below the Ceiling / 2-ft Below the Soffit
Table 4-10 P-Values 6-ft Below Ceiling / 2-ft Below Soffit
TC-1 TC-2 TC-3 TC-5
Nozzle
7/8" Solid 0.0247 0.0009 0.4813 0.0987
SS 0.3193 0.0031 0.0057 0.0417
30 Fog 0.3245 0.5449 0.2721 0.2690
Water Flow Rate
120-gpm 0.0005 0.0004 0.1083 0.0739
150-gpm 0.5460 0.0394 0.3538 0.3824
Cooling Impact
Position
Mid 0.0043 0.0104 0.0254 0.0531
Full Back 0.8444 0.0062 0.7310 0.0500
Hand Held 0.0037 0.4828 0.4639 0.1789
Agent Only 0.0552 0.0002 0.0938 0.0030
The 30 fog nozzle setting is the only configuration with no significant differences at all locations,
6-ft below the ceiling or 2-ft below the soffit. The 7/8-inch solid nozzle is significant at TC-1 and
TC-2. The SS nozzle setting is only insignificant at TC-1. The water flow rates are significant at
TC-1 for 120-gpm, and at TC-2 for 120-gpm and 150-gpm. The mid cooling impact position is

55
only negligible at TC-5. TC-2 and TC-5 only show major differences with the full back position,
and by agent only. The hand held position is only considerable at TC-1.
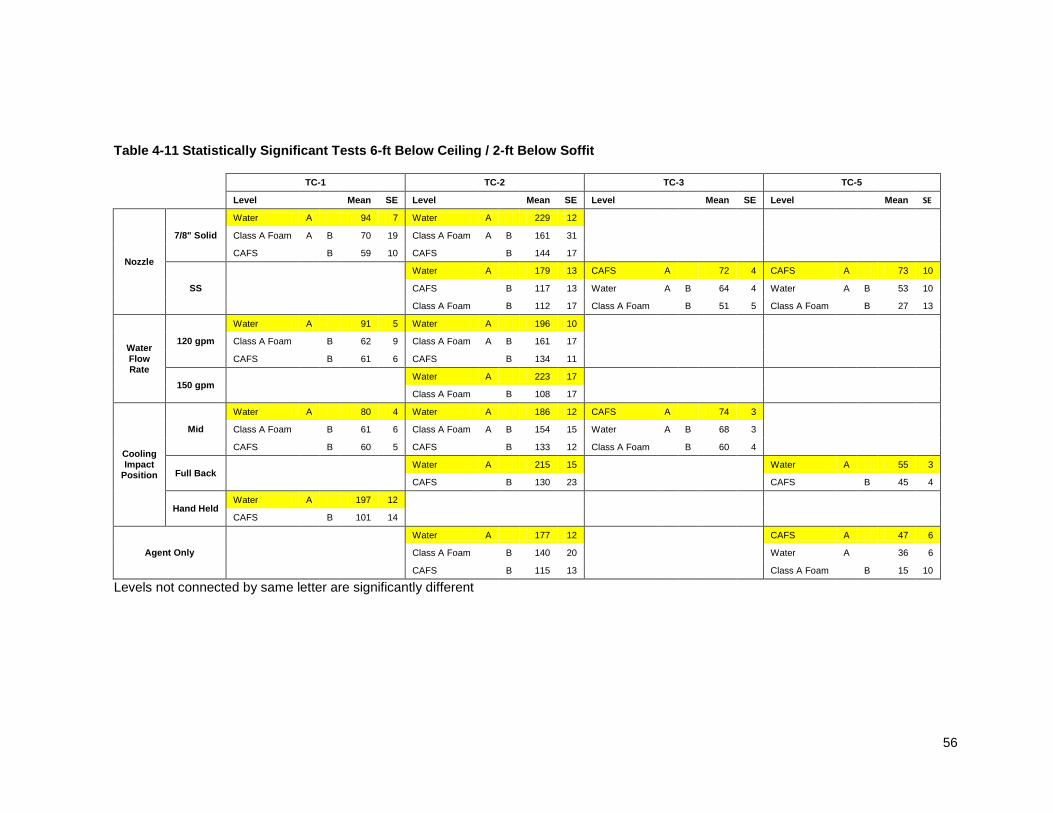
56
Table 4-11 Statistically Significant Tests 6-ft Below Ceiling / 2-ft Below Soffit
TC-1 TC-2 TC-3 TC-5
Level Mean SE Level Mean SE Level Mean SE Level Mean SE
Nozzle
7/8" Solid
Water A 94 7 Water A 229 12
Class A Foam A B 70 19 Class A Foam A B 161 31
CAFS B 59 10 CAFS B 144 17
SS
Water A 179 13 CAFS A 72 4 CAFS A 73 10
CAFS B 117 13 Water A B 64 4 Water A B 53 10
Class A Foam B 112 17 Class A Foam B 51 5 Class A Foam B 27 13
Water Flow Rate
120 gpm
Water A 91 5 Water A 196 10
Class A Foam B 62 9 Class A Foam A B 161 17
CAFS B 61 6 CAFS B 134 11
150 gpm Water A 223 17
Class A Foam B 108 17
Cooling Impact
Position
Mid
Water A 80 4 Water A 186 12 CAFS A 74 3
Class A Foam B 61 6 Class A Foam A B 154 15 Water A B 68 3
CAFS B 60 5 CAFS B 133 12 Class A Foam B 60 4
Full Back Water A 215 15 Water A 55 3
CAFS B 130 23 CAFS B 45 4
Hand Held Water A 197 12
CAFS B 101 14
Agent Only
Water A 177 12 CAFS A 47 6
Class A Foam B 140 20
Water A 36 6
CAFS B 115 13 Class A Foam B 15 10
Levels not connected by same letter are significantly different
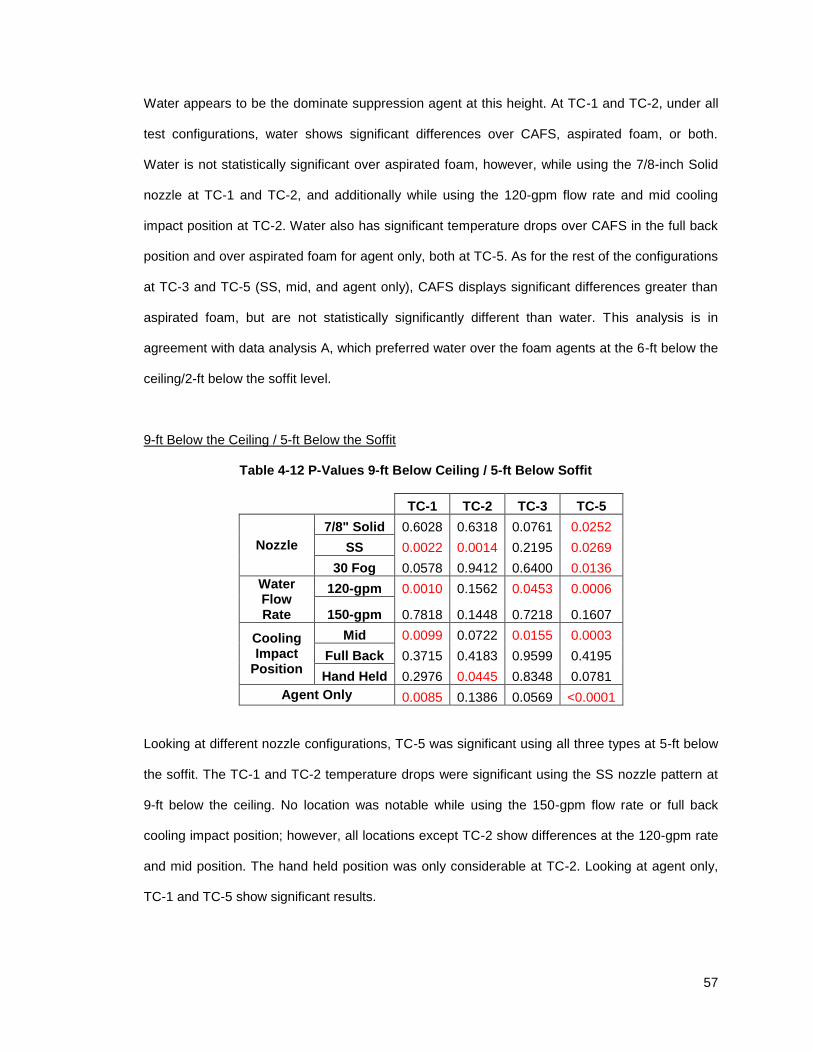
57
Water appears to be the dominate suppression agent at this height. At TC-1 and TC-2, under all
test configurations, water shows significant differences over CAFS, aspirated foam, or both.
Water is not statistically significant over aspirated foam, however, while using the 7/8-inch Solid
nozzle at TC-1 and TC-2, and additionally while using the 120-gpm flow rate and mid cooling
impact position at TC-2. Water also has significant temperature drops over CAFS in the full back
position and over aspirated foam for agent only, both at TC-5. As for the rest of the configurations
at TC-3 and TC-5 (SS, mid, and agent only), CAFS displays significant differences greater than
aspirated foam, but are not statistically significantly different than water. This analysis is in
agreement with data analysis A, which preferred water over the foam agents at the 6-ft below the
ceiling/2-ft below the soffit level.
9-ft Below the Ceiling / 5-ft Below the Soffit
Table 4-12 P-Values 9-ft Below Ceiling / 5-ft Below Soffit
TC-1 TC-2 TC-3 TC-5
Nozzle
7/8" Solid 0.6028 0.6318 0.0761 0.0252
SS 0.0022 0.0014 0.2195 0.0269
30 Fog 0.0578 0.9412 0.6400 0.0136
Water Flow Rate
120-gpm 0.0010 0.1562 0.0453 0.0006
150-gpm 0.7818 0.1448 0.7218 0.1607
Cooling Impact
Position
Mid 0.0099 0.0722 0.0155 0.0003
Full Back 0.3715 0.4183 0.9599 0.4195
Hand Held 0.2976 0.0445 0.8348 0.0781
Agent Only 0.0085 0.1386 0.0569 <0.0001
Looking at different nozzle configurations, TC-5 was significant using all three types at 5-ft below
the soffit. The TC-1 and TC-2 temperature drops were significant using the SS nozzle pattern at
9-ft below the ceiling. No location was notable while using the 150-gpm flow rate or full back
cooling impact position; however, all locations except TC-2 show differences at the 120-gpm rate
and mid position. The hand held position was only considerable at TC-2. Looking at agent only,
TC-1 and TC-5 show significant results.
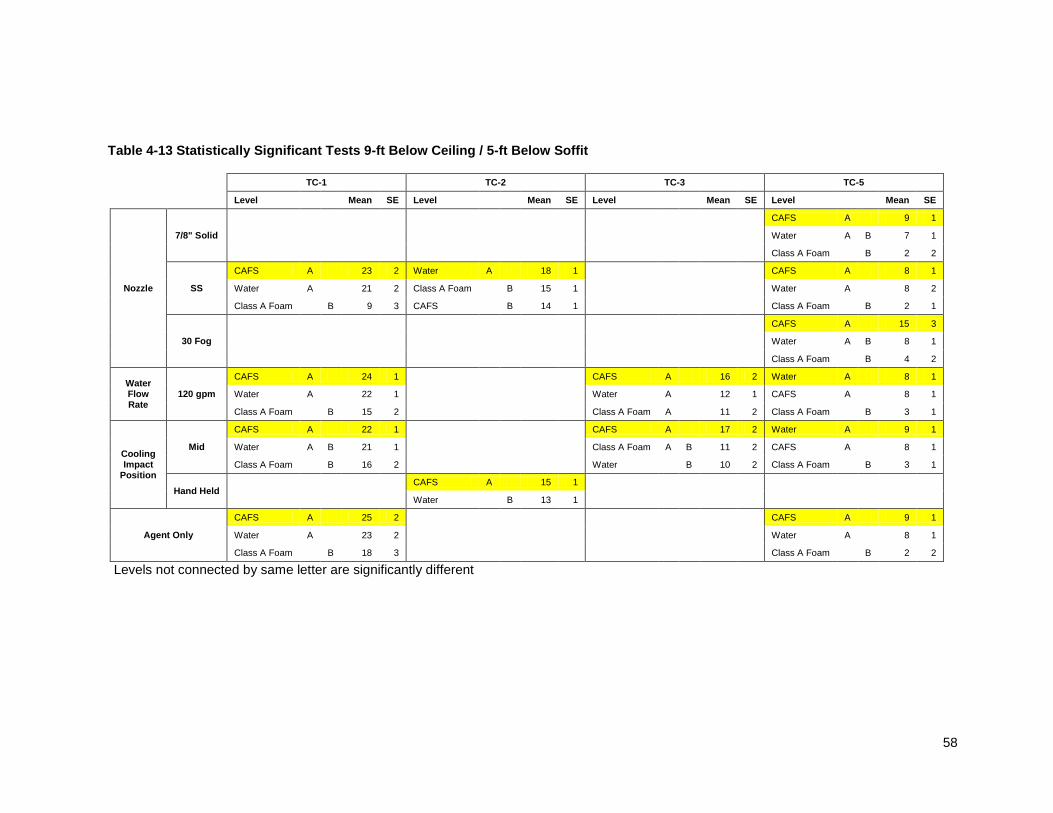
58
Table 4-13 Statistically Significant Tests 9-ft Below Ceiling / 5-ft Below Soffit
TC-1 TC-2 TC-3 TC-5
Level Mean SE Level Mean SE Level Mean SE Level Mean SE
Nozzle
7/8" Solid
CAFS A 9 1
Water A B 7 1
Class A Foam B 2 2
SS
CAFS A 23 2 Water A 18 1 CAFS A 8 1
Water A 21 2 Class A Foam B 15 1
Water A 8 2
Class A Foam B 9 3 CAFS B 14 1 Class A Foam B 2 1
30 Fog
CAFS A 15 3
Water A B 8 1
Class A Foam B 4 2
Water Flow Rate
120 gpm
CAFS A 24 1 CAFS A 16 2 Water A 8 1
Water A 22 1
Water A
12 1 CAFS A 8 1
Class A Foam B 15 2 Class A Foam A 11 2 Class A Foam B 3 1
Cooling Impact
Position
Mid
CAFS A 22 1 CAFS A 17 2 Water A 9 1
Water A B 21 1
Class A Foam A B 11 2 CAFS A 8 1
Class A Foam B 16 2 Water B 10 2 Class A Foam B 3 1
Hand Held CAFS A 15 1
Water B 13 1
Agent Only
CAFS A 25 2 CAFS A 9 1
Water A 23 2
Water A 8 1
Class A Foam B 18 3 Class A Foam B 2 2
Levels not connected by same letter are significantly different
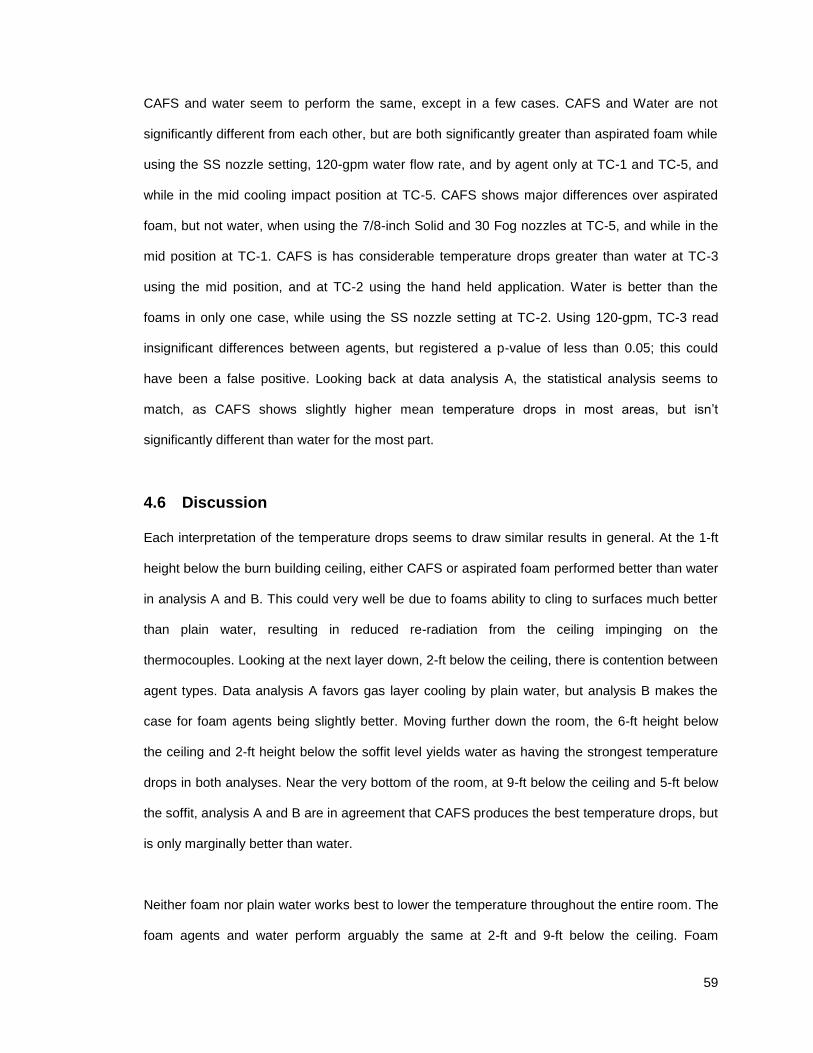
59
CAFS and water seem to perform the same, except in a few cases. CAFS and Water are not
significantly different from each other, but are both significantly greater than aspirated foam while
using the SS nozzle setting, 120-gpm water flow rate, and by agent only at TC-1 and TC-5, and
while in the mid cooling impact position at TC-5. CAFS shows major differences over aspirated
foam, but not water, when using the 7/8-inch Solid and 30 Fog nozzles at TC-5, and while in the
mid position at TC-1. CAFS is has considerable temperature drops greater than water at TC-3
using the mid position, and at TC-2 using the hand held application. Water is better than the
foams in only one case, while using the SS nozzle setting at TC-2. Using 120-gpm, TC-3 read
insignificant differences between agents, but registered a p-value of less than 0.05; this could
have been a false positive. Looking back at data analysis A, the statistical analysis seems to
match, as CAFS shows slightly higher mean temperature drops in most areas, but isn’t
significantly different than water for the most part.
4.6 Discussion
Each interpretation of the temperature drops seems to draw similar results in general. At the 1-ft
height below the burn building ceiling, either CAFS or aspirated foam performed better than water
in analysis A and B. This could very well be due to foams ability to cling to surfaces much better
than plain water, resulting in reduced re-radiation from the ceiling impinging on the
thermocouples. Looking at the next layer down, 2-ft below the ceiling, there is contention between
agent types. Data analysis A favors gas layer cooling by plain water, but analysis B makes the
case for foam agents being slightly better. Moving further down the room, the 6-ft height below
the ceiling and 2-ft height below the soffit level yields water as having the strongest temperature
drops in both analyses. Near the very bottom of the room, at 9-ft below the ceiling and 5-ft below
the soffit, analysis A and B are in agreement that CAFS produces the best temperature drops, but
is only marginally better than water.
Neither foam nor plain water works best to lower the temperature throughout the entire room. The
foam agents and water perform arguably the same at 2-ft and 9-ft below the ceiling. Foam
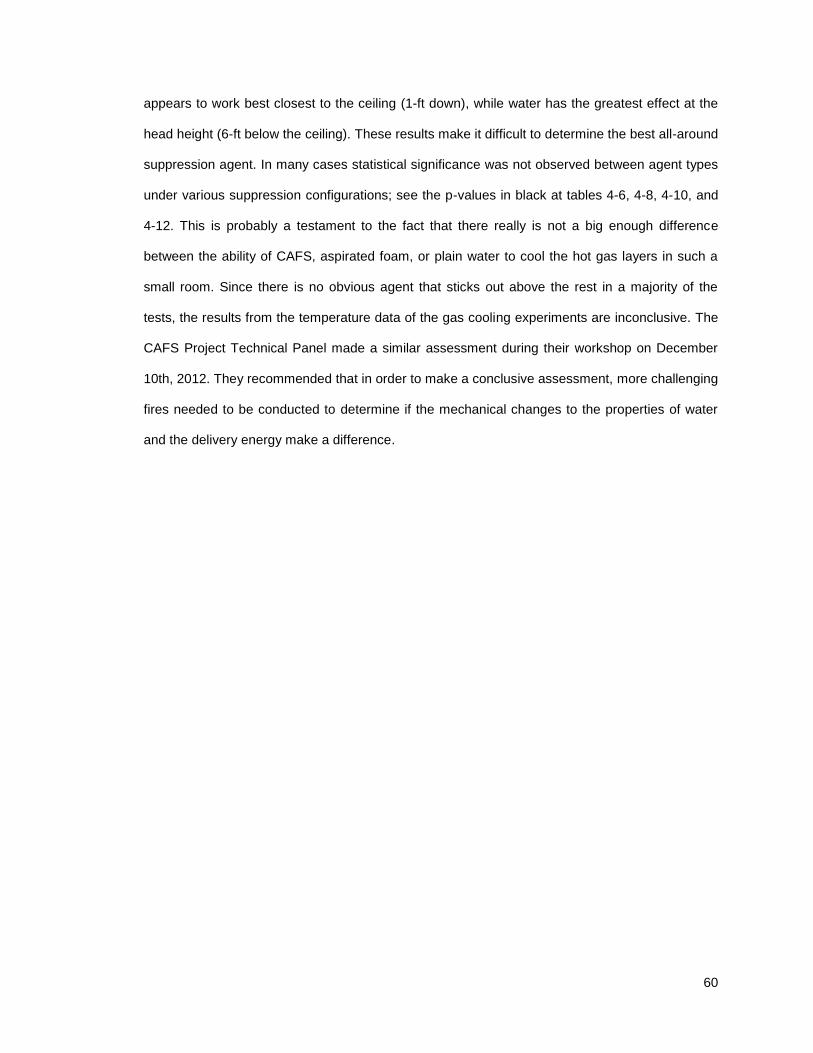
60
appears to work best closest to the ceiling (1-ft down), while water has the greatest effect at the
head height (6-ft below the ceiling). These results make it difficult to determine the best all-around
suppression agent. In many cases statistical significance was not observed between agent types
under various suppression configurations; see the p-values in black at tables 4-6, 4-8, 4-10, and
4-12. This is probably a testament to the fact that there really is not a big enough difference
between the ability of CAFS, aspirated foam, or plain water to cool the hot gas layers in such a
small room. Since there is no obvious agent that sticks out above the rest in a majority of the
tests, the results from the temperature data of the gas cooling experiments are inconclusive. The
CAFS Project Technical Panel made a similar assessment during their workshop on December
10th, 2012. They recommended that in order to make a conclusive assessment, more challenging
fires needed to be conducted to determine if the mechanical changes to the properties of water
and the delivery energy make a difference.
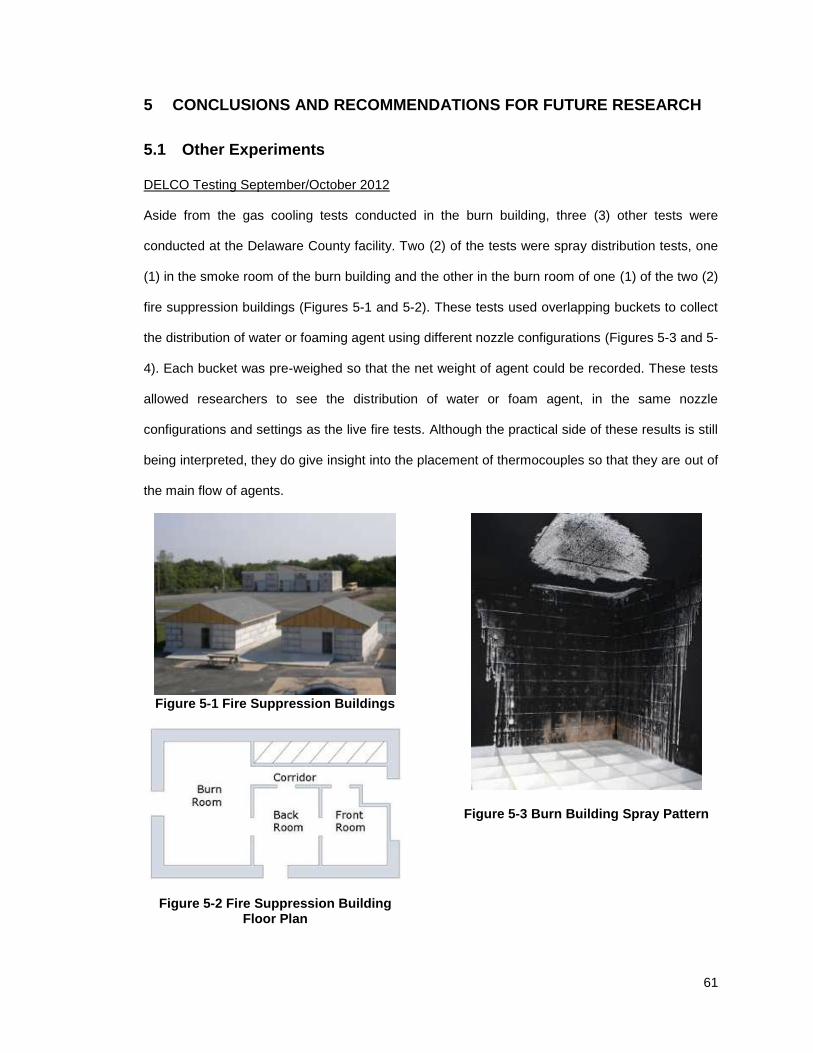
61
5 CONCLUSIONS AND RECOMMENDATIONS FOR FUTURE RESEARCH
5.1 Other Experiments
DELCO Testing September/October 2012
Aside from the gas cooling tests conducted in the burn building, three (3) other tests were
conducted at the Delaware County facility. Two (2) of the tests were spray distribution tests, one
(1) in the smoke room of the burn building and the other in the burn room of one (1) of the two (2)
fire suppression buildings (Figures 5-1 and 5-2). These tests used overlapping buckets to collect
the distribution of water or foaming agent using different nozzle configurations (Figures 5-3 and 5-
4). Each bucket was pre-weighed so that the net weight of agent could be recorded. These tests
allowed researchers to see the distribution of water or foam agent, in the same nozzle
configurations and settings as the live fire tests. Although the practical side of these results is still
being interpreted, they do give insight into the placement of thermocouples so that they are out of
the main flow of agents.
Figure 5-1 Fire Suppression Buildings
Figure 5-2 Fire Suppression Building Floor Plan
Figure 5-3 Burn Building Spray Pattern
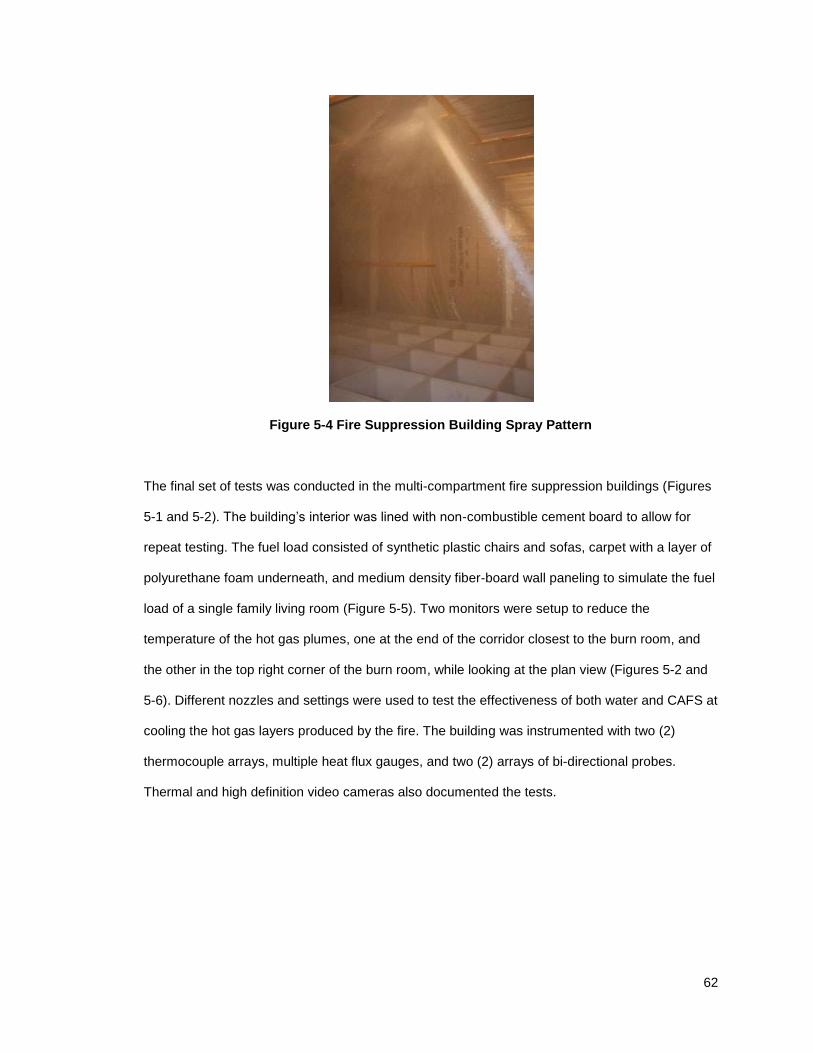
62
Figure 5-4 Fire Suppression Building Spray Pattern
The final set of tests was conducted in the multi-compartment fire suppression buildings (Figures
5-1 and 5-2). The building’s interior was lined with non-combustible cement board to allow for
repeat testing. The fuel load consisted of synthetic plastic chairs and sofas, carpet with a layer of
polyurethane foam underneath, and medium density fiber-board wall paneling to simulate the fuel
load of a single family living room (Figure 5-5). Two monitors were setup to reduce the
temperature of the hot gas plumes, one at the end of the corridor closest to the burn room, and
the other in the top right corner of the burn room, while looking at the plan view (Figures 5-2 and
5-6). Different nozzles and settings were used to test the effectiveness of both water and CAFS at
cooling the hot gas layers produced by the fire. The building was instrumented with two (2)
thermocouple arrays, multiple heat flux gauges, and two (2) arrays of bi-directional probes.
Thermal and high definition video cameras also documented the tests.
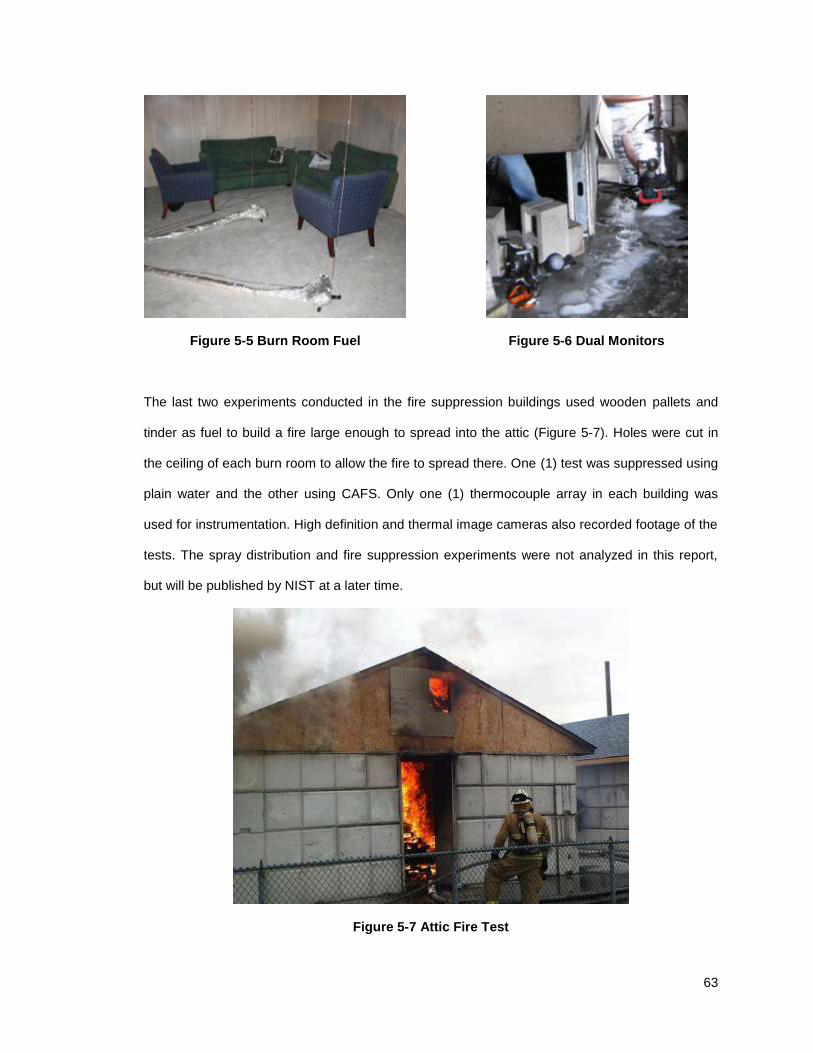
63
Figure 5-5 Burn Room Fuel
Figure 5-6 Dual Monitors
The last two experiments conducted in the fire suppression buildings used wooden pallets and
tinder as fuel to build a fire large enough to spread into the attic (Figure 5-7). Holes were cut in
the ceiling of each burn room to allow the fire to spread there. One (1) test was suppressed using
plain water and the other using CAFS. Only one (1) thermocouple array in each building was
used for instrumentation. High definition and thermal image cameras also recorded footage of the
tests. The spray distribution and fire suppression experiments were not analyzed in this report,
but will be published by NIST at a later time.
Figure 5-7 Attic Fire Test
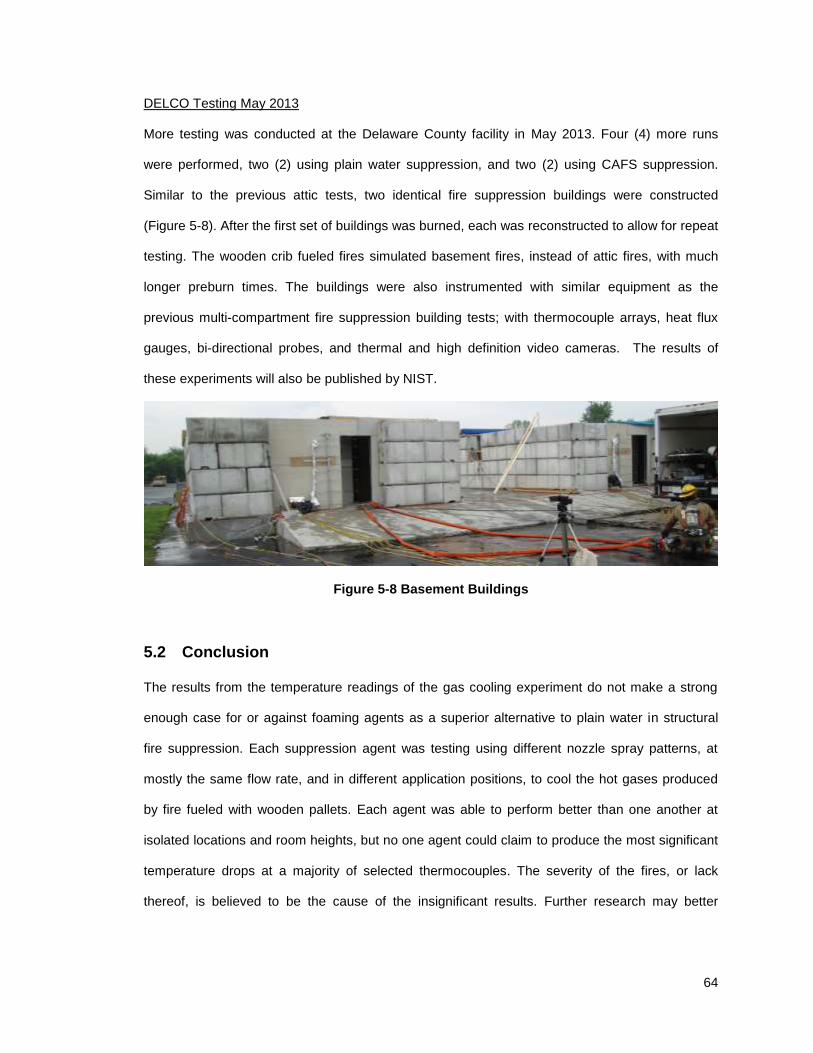
64
DELCO Testing May 2013
More testing was conducted at the Delaware County facility in May 2013. Four (4) more runs
were performed, two (2) using plain water suppression, and two (2) using CAFS suppression.
Similar to the previous attic tests, two identical fire suppression buildings were constructed
(Figure 5-8). After the first set of buildings was burned, each was reconstructed to allow for repeat
testing. The wooden crib fueled fires simulated basement fires, instead of attic fires, with much
longer preburn times. The buildings were also instrumented with similar equipment as the
previous multi-compartment fire suppression building tests; with thermocouple arrays, heat flux
gauges, bi-directional probes, and thermal and high definition video cameras. The results of
these experiments will also be published by NIST.
Figure 5-8 Basement Buildings
5.2 Conclusion
The results from the temperature readings of the gas cooling experiment do not make a strong
enough case for or against foaming agents as a superior alternative to plain water in structural
fire suppression. Each suppression agent was testing using different nozzle spray patterns, at
mostly the same flow rate, and in different application positions, to cool the hot gases produced
by fire fueled with wooden pallets. Each agent was able to perform better than one another at
isolated locations and room heights, but no one agent could claim to produce the most significant
temperature drops at a majority of selected thermocouples. The severity of the fires, or lack
thereof, is believed to be the cause of the insignificant results. Further research may better
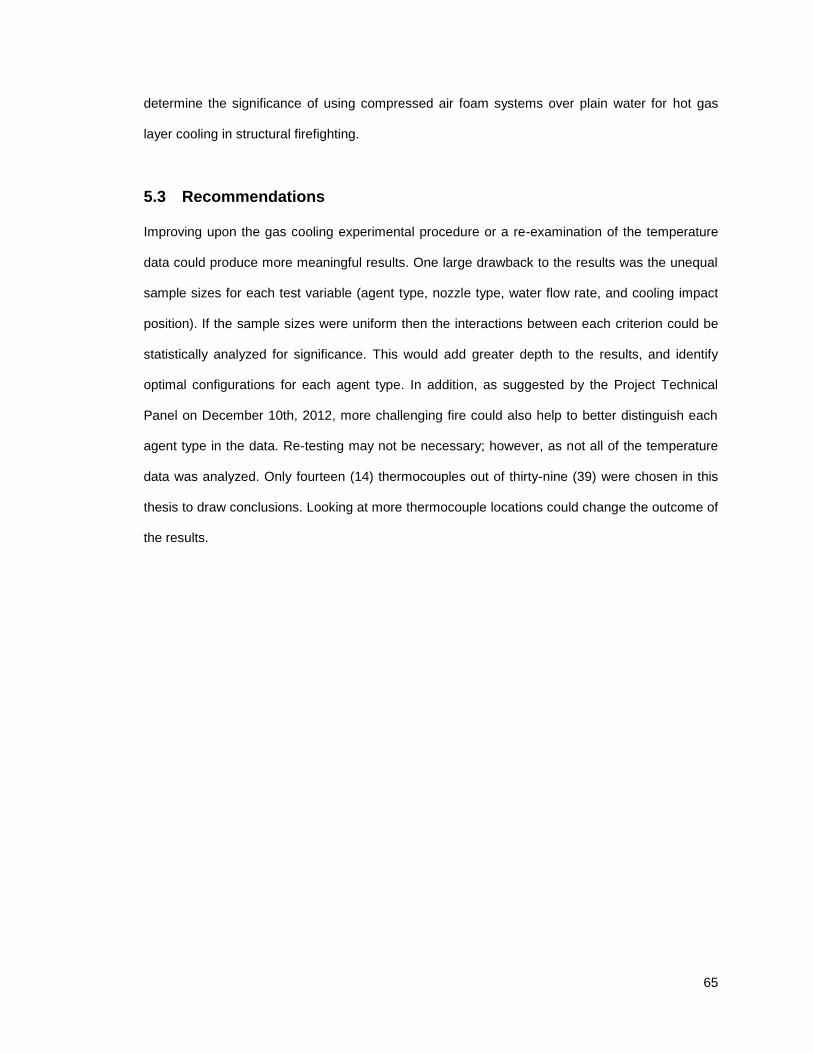
65
determine the significance of using compressed air foam systems over plain water for hot gas
layer cooling in structural firefighting.
5.3 Recommendations
Improving upon the gas cooling experimental procedure or a re-examination of the temperature
data could produce more meaningful results. One large drawback to the results was the unequal
sample sizes for each test variable (agent type, nozzle type, water flow rate, and cooling impact
position). If the sample sizes were uniform then the interactions between each criterion could be
statistically analyzed for significance. This would add greater depth to the results, and identify
optimal configurations for each agent type. In addition, as suggested by the Project Technical
Panel on December 10th, 2012, more challenging fire could also help to better distinguish each
agent type in the data. Re-testing may not be necessary; however, as not all of the temperature
data was analyzed. Only fourteen (14) thermocouples out of thirty-nine (39) were chosen in this
thesis to draw conclusions. Looking at more thermocouple locations could change the outcome of
the results.
66
LIST OF REFERENCES
(Almer, 1990) Almer, S, prod. American Heat: Class A foam tests: Sikeston, MO [Video
magazine]. Edit. C Emg, and C Wilson. 1990. Videocassette. 17 Feb 2013.
(Cavette, 2001) Cavette, Chris. "Bubbles beat water." Fire Chief. 01 JUL 2001: n. page. Web. 22
Feb. 2013. <http://firechief.com/suppression/foam/firefighting_bubbles_beat_water>.
(Colletti, 1993) Colletti, Dominic. "Quantifying the Effects of Class A Foam in Structure
Firefighting: The Salem Tests." Fire Engineering. 01 Feb 1993: 41-44. Print.
<http://www.cafsinstitute.org/pdf/Salem Tests.pdf>.
(Colletti, 2006) Colletti, Dominic. The Compressed Air Foam Systems Handbook. 1st. Royersford:
Lyon's Publishing, 2006. 113-118. Print.
(Darley, 1995) Darley, Paul. "The Use of Class "A" Foam and Compressed Air Foam Systems
(CAFS) in Firefighting." Foam Applications for Wildland & Urban Fire Management. 7.
Boise: 1995. 15-22. Print.
(de Vries, 1998) de Vries, Holger. "CAFS goes to Germany." Fire Chief. 42.8 (1998): 116-121.
Print.
(de Vries, 1999) de Vries, Holger. "Foam follow function: The Tremonia and Wattenscheid trials."
Fire Chief. 01 Aug 1999: 110-118. Print.
<http://firechief.com/suppression/foam/firefighting_foam_follow_function>.
(de Vries, 2007) de Vries, Holger. "Heat Stress." Fire Chief. 01 OCT 2007: 60-70. Print.
<http://firechief.com/suppression/foam/firefighting_heat_stress>.
(Duncan, 1994) Duncan, Samuel. "Evaluation of NDI Compressed Air Foam Systems (CAFS)
Applied as a Retrofit." Defense Technical Information Center. U.S. Army Tank-
Automotive Command, Development and Engineering Center, 28 Sep 1994. Web. 19
Feb 2013. <http://www.dtic.mil/cgi-
bin/GetTRDoc?Location=U2&doc=GetTRDoc.pdf&AD=ADA284942>.
(Fornell, 1991) Fornell, David. Fire Stream Management Handbook. 1st. Saddle Brook: Fire
Engineering, 1991. 301-328. Print.
(Kim and Crampton, 2009) Kim, Andrew, and George Crampton. "Evaluation of fire suppression
effectiveness of manually applied compressed air-foam (CAF) system." Foams. Quincy:
The Fire Protection Research Foundation, 2009. 1-3. Web. 15 Feb. 2013.
67
<http://www.nfpa.org/assets/files//2009
proceedings/Evaluation_of_the_Fire_Suppression_Effectiveness_of_Manually.pdf>.
(LaPolla et al., 2012) LaPolla, Justin, Alexander Morano and Vincent Luchsinger. "Compressed
Air Foam Firegrounds Evolution Tests." Diss. California Polytechnic State University,
2012. Web. <http://digitalcommons.calpoly.edu/mesp/110/>.
(Lohr, 2002) Lohr, Steven. "The Use of Compressed Air Foam to Enhance Fire Fighting Water
Supplies in Montgomery County, MD." United States Fire Administration. National Fire
Academy, 01 Jun 2002. Web. 23 Feb 2013.
<http://www.usfa.fema.gov/pdf/efop/efo34560.pdf>.
(Lyon, 2009) Lyon, Tracy. United States. Fire Administration. Tactical Use of Compressed Air
Foam. Emmitsburg, 2009. Web. <http://www.usfa.fema.gov/pdf/efop/efo43975.pdf>.
(Madrzykowski, 1988) Madrzykowski, Daniel. United States. Department of Commerce. Study of
the Ignition Inhibiting Properties of Compressed Air Foam. Gaithersburg: National
Institute of Standards and Technology, 1988. Web. <http://www.nist.gov/manuscript-
publication-search.cfm?pub_id=910351>.
(Marquardt, 2011) Marquardt, Mark. Grand Rapids, Michigan. Fire Department. GRFD Live Burn
Demonstration and Testing CAFS and PPA. Grand Rapids: Strategic Planning Office,
2011. Web. <ftp://ftp.grand-rapids.mi.us/>.
(McKenzie, 1992) McKenzie, Dan. United States. Department of Agriculture. Compressed Air
Foam Systems for Use in Wildland Fire Applications. San Dimas: Technology and
Development Center, 1992. Print.
(Murdock, 1997) Murdock, Johnny I. Compressed Air Foam Systems: a Project Pertaining to an
Adoption Decision. Emmitsburg, MD: National Fire Academy, 1997. Print.
(National Fire Service Research Agenda Symposium, 2005) Report of the National Fire Service
Research Agenda Symposium. Emmitsburg: National Fallen Firefighters Foundation,
2005. 33. Web. 8 May. 2013.
<http://www.everyonegoeshome.com/symposium/report.pdf>.
(National Wildfire Coordinating Group, 1993) United States. Forest Service. Foam vs Fire - Class
A Foam for Wildland Fires. Boise: The National Wildfire Coordinating Group, 1993. Web.
<http://www.fs.fed.us/t-d/php/library_card.php?p_num=9351 1208>.
NFPA 1145, Guide for the Use of Class A Foams in Manual Structural Fire Fighting (National Fire
Protection Association 2011)
68
(Pabich and Carey, 1994) Pabich, Martin, and William Carey. "Class A Foam for Structural Fire
Fighting - Room Burn Tests." National Fire Protection Association. National Fire
Protection Research Foundation, n.d. Web. 12 Feb 2013.
<http://www.nfpa.org/assets/files/PDF/Research/Class_A_Foam_for_Structural_Fire_Fig
hting.pdf>.
(Routley, 1994) Routley, J. "Compressed Air Foam for Structural Fire Fighting: A Field Test."
United States Fire Administration. United States Fire Administration, 01 Jan 1994. Web.
19 Feb 2013. <http://www.usfa.fema.gov/downloads/pdf/publications/tr-074.pdf>.
(Steppan and Pabich, 2008) Steppan, Daniel, and Martin Pabich. "Performance of Special
Extinguishment Agents for Firefighter Use." Underwriters Laboratories. Underwriters
Laboratories, 30 Sep 2008. Web. 15 Feb 2013.
<http://www.ul.com/global/documents/offerings/industries/buildingmaterials/fireservice/ext
inguishingagents/DHS Grant Final Report - Project 07CA42526 - Performance of Special
Extinguishment Agents for Fire Fighter Use - Sept. 30_2008.pdf>.
(Stern and Routley, 1996) Stern, Jeff, and J. Gordon Routley. United States. Fire Administration.
Class A Foam for Structural Firefighting. Emmitsburg: U.S. Fire Administration, 1996.
Web. <http://www.usfa.fema.gov/downloads/pdf/publications/tr-083.pdf>.
(Taylor, 1997) Taylor, Robert. United States. Fire Administration. Compressed Air Foam Systems
in Limited Staffing Conditions. Emmitsburg: U.S. Fire Administration, 1997. Web.
<http://www.usfa.fema.gov/downloads/pdf/tr_98rt.pdf>.
(Tinsley, 2002) Tinsley, Michael. United States. Fire Administration. Compressed Air Foam
Systems: Live Fire Application and Corresponding Temperature Degradation.
Emmitsburg: U.S. Fire Administration, 2002. Web.
<http://www.usfa.fema.gov/pdf/efop/efo33907.pdf>.
(Zhang et al., 2011) Zhang, Jianping, Michael Delichatsios, and Alan O’ Neill. "Assessment of gas
cooling capabilities of compressed air foam systems in fuel and ventilation-controlled
compartment fires." Journal of Fire Sciences. 29.6 (2011): 543–554. Web. 16 Feb. 2013.
<http://jfs.sagepub.com/content/29/6/543>.
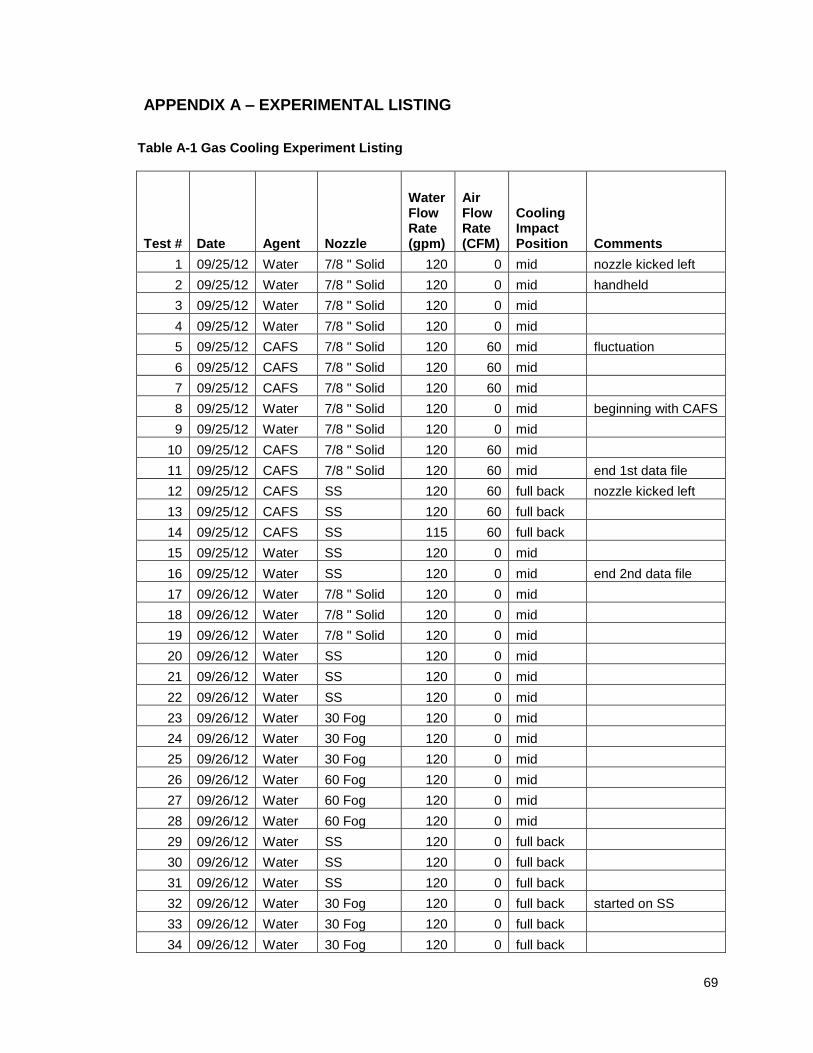
69
APPENDIX A – EXPERIMENTAL LISTING
Table A-1 Gas Cooling Experiment Listing
Test # Date Agent Nozzle
Water Flow Rate (gpm)
Air Flow Rate (CFM)
Cooling Impact Position Comments
1 09/25/12 Water 7/8 " Solid 120 0 mid nozzle kicked left
2 09/25/12 Water 7/8 " Solid 120 0 mid handheld
3 09/25/12 Water 7/8 " Solid 120 0 mid
4 09/25/12 Water 7/8 " Solid 120 0 mid
5 09/25/12 CAFS 7/8 " Solid 120 60 mid fluctuation
6 09/25/12 CAFS 7/8 " Solid 120 60 mid
7 09/25/12 CAFS 7/8 " Solid 120 60 mid
8 09/25/12 Water 7/8 " Solid 120 0 mid beginning with CAFS
9 09/25/12 Water 7/8 " Solid 120 0 mid
10 09/25/12 CAFS 7/8 " Solid 120 60 mid
11 09/25/12 CAFS 7/8 " Solid 120 60 mid end 1st data file
12 09/25/12 CAFS SS 120 60 full back nozzle kicked left
13 09/25/12 CAFS SS 120 60 full back
14 09/25/12 CAFS SS 115 60 full back
15 09/25/12 Water SS 120 0 mid
16 09/25/12 Water SS 120 0 mid end 2nd data file
17 09/26/12 Water 7/8 " Solid 120 0 mid
18 09/26/12 Water 7/8 " Solid 120 0 mid
19 09/26/12 Water 7/8 " Solid 120 0 mid
20 09/26/12 Water SS 120 0 mid
21 09/26/12 Water SS 120 0 mid
22 09/26/12 Water SS 120 0 mid
23 09/26/12 Water 30 Fog 120 0 mid
24 09/26/12 Water 30 Fog 120 0 mid
25 09/26/12 Water 30 Fog 120 0 mid
26 09/26/12 Water 60 Fog 120 0 mid
27 09/26/12 Water 60 Fog 120 0 mid
28 09/26/12 Water 60 Fog 120 0 mid
29 09/26/12 Water SS 120 0 full back
30 09/26/12 Water SS 120 0 full back
31 09/26/12 Water SS 120 0 full back
32 09/26/12 Water 30 Fog 120 0 full back started on SS
33 09/26/12 Water 30 Fog 120 0 full back
34 09/26/12 Water 30 Fog 120 0 full back
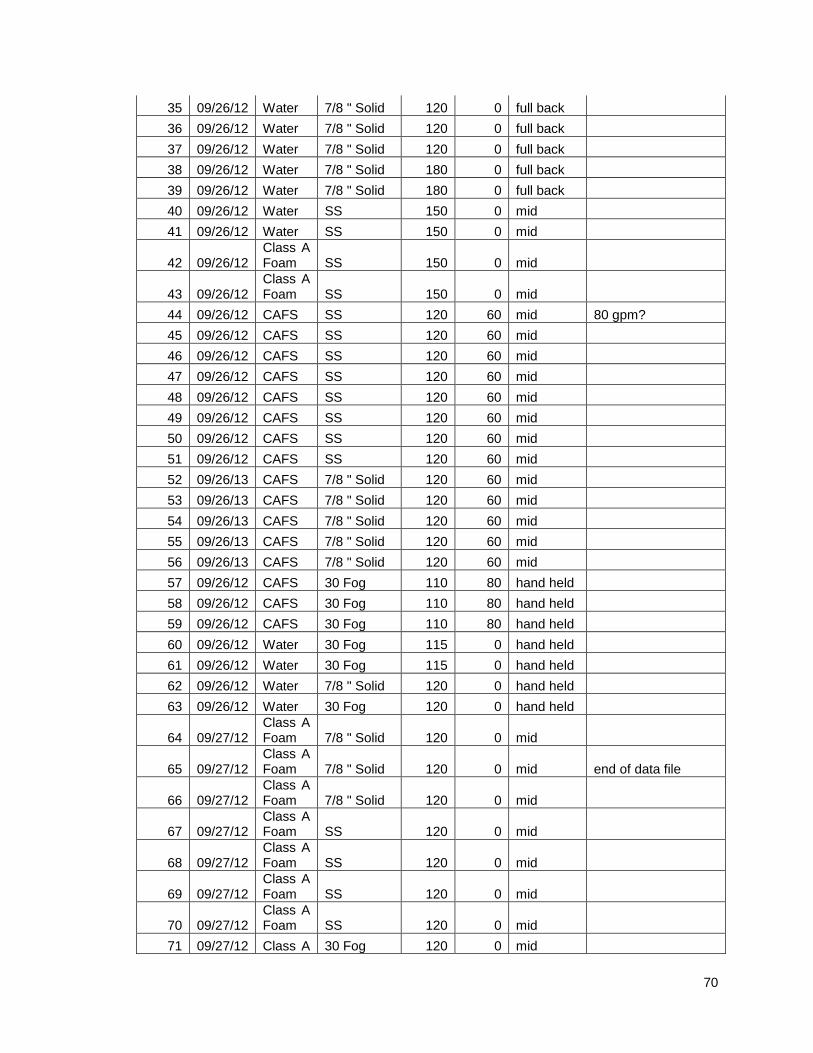
70
35 09/26/12 Water 7/8 " Solid 120 0 full back
36 09/26/12 Water 7/8 " Solid 120 0 full back
37 09/26/12 Water 7/8 " Solid 120 0 full back
38 09/26/12 Water 7/8 " Solid 180 0 full back
39 09/26/12 Water 7/8 " Solid 180 0 full back
40 09/26/12 Water SS 150 0 mid
41 09/26/12 Water SS 150 0 mid
42 09/26/12 Class A Foam SS 150 0 mid
43 09/26/12 Class A Foam SS 150 0 mid
44 09/26/12 CAFS SS 120 60 mid 80 gpm?
45 09/26/12 CAFS SS 120 60 mid
46 09/26/12 CAFS SS 120 60 mid
47 09/26/12 CAFS SS 120 60 mid
48 09/26/12 CAFS SS 120 60 mid
49 09/26/12 CAFS SS 120 60 mid
50 09/26/12 CAFS SS 120 60 mid
51 09/26/12 CAFS SS 120 60 mid
52 09/26/13 CAFS 7/8 " Solid 120 60 mid
53 09/26/13 CAFS 7/8 " Solid 120 60 mid
54 09/26/13 CAFS 7/8 " Solid 120 60 mid
55 09/26/13 CAFS 7/8 " Solid 120 60 mid
56 09/26/13 CAFS 7/8 " Solid 120 60 mid
57 09/26/12 CAFS 30 Fog 110 80 hand held
58 09/26/12 CAFS 30 Fog 110 80 hand held
59 09/26/12 CAFS 30 Fog 110 80 hand held
60 09/26/12 Water 30 Fog 115 0 hand held
61 09/26/12 Water 30 Fog 115 0 hand held
62 09/26/12 Water 7/8 " Solid 120 0 hand held
63 09/26/12 Water 30 Fog 120 0 hand held
64 09/27/12 Class A Foam 7/8 " Solid 120 0 mid
65 09/27/12 Class A Foam 7/8 " Solid 120 0 mid end of data file
66 09/27/12 Class A Foam 7/8 " Solid 120 0 mid
67 09/27/12 Class A Foam SS 120 0 mid
68 09/27/12 Class A Foam SS 120 0 mid
69 09/27/12 Class A Foam SS 120 0 mid
70 09/27/12 Class A Foam SS 120 0 mid
71 09/27/12 Class A 30 Fog 120 0 mid
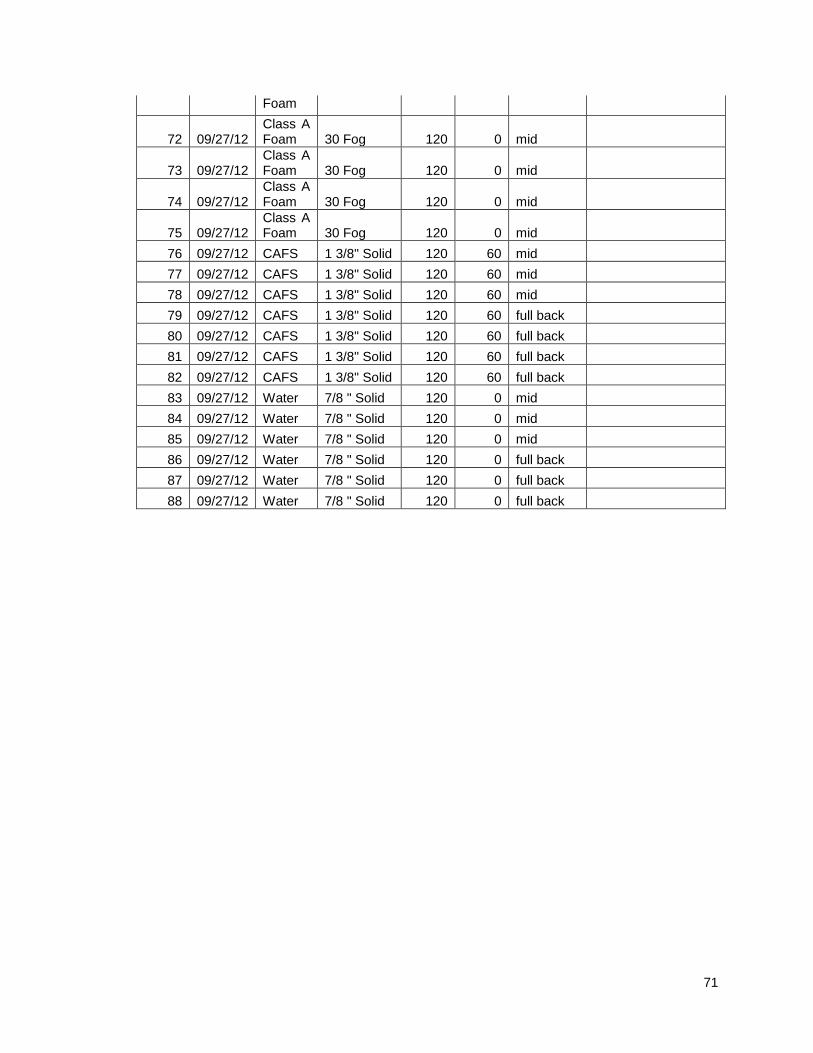
71
Foam
72 09/27/12 Class A Foam 30 Fog 120 0 mid
73 09/27/12 Class A Foam 30 Fog 120 0 mid
74 09/27/12 Class A Foam 30 Fog 120 0 mid
75 09/27/12 Class A Foam 30 Fog 120 0 mid
76 09/27/12 CAFS 1 3/8" Solid 120 60 mid
77 09/27/12 CAFS 1 3/8" Solid 120 60 mid
78 09/27/12 CAFS 1 3/8" Solid 120 60 mid
79 09/27/12 CAFS 1 3/8" Solid 120 60 full back
80 09/27/12 CAFS 1 3/8" Solid 120 60 full back
81 09/27/12 CAFS 1 3/8" Solid 120 60 full back
82 09/27/12 CAFS 1 3/8" Solid 120 60 full back
83 09/27/12 Water 7/8 " Solid 120 0 mid
84 09/27/12 Water 7/8 " Solid 120 0 mid
85 09/27/12 Water 7/8 " Solid 120 0 mid
86 09/27/12 Water 7/8 " Solid 120 0 full back
87 09/27/12 Water 7/8 " Solid 120 0 full back
88 09/27/12 Water 7/8 " Solid 120 0 full back
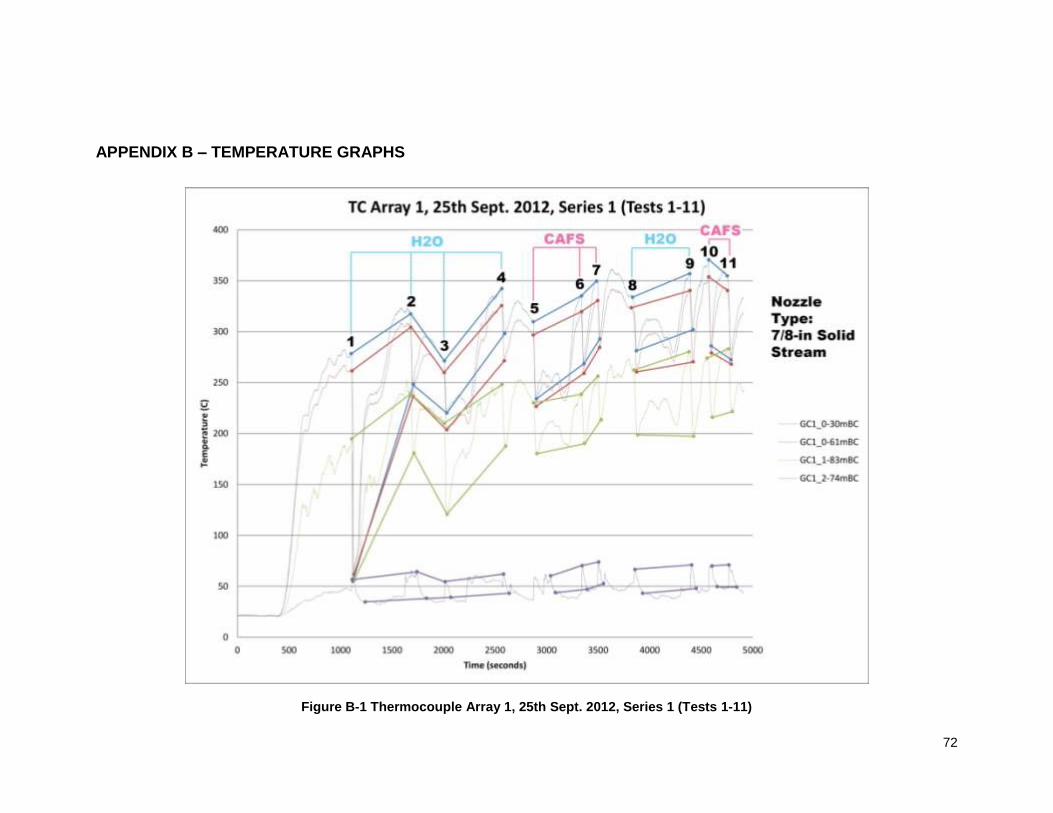
72
APPENDIX B – TEMPERATURE GRAPHS
Figure B-1 Thermocouple Array 1, 25th Sept. 2012, Series 1 (Tests 1-11)
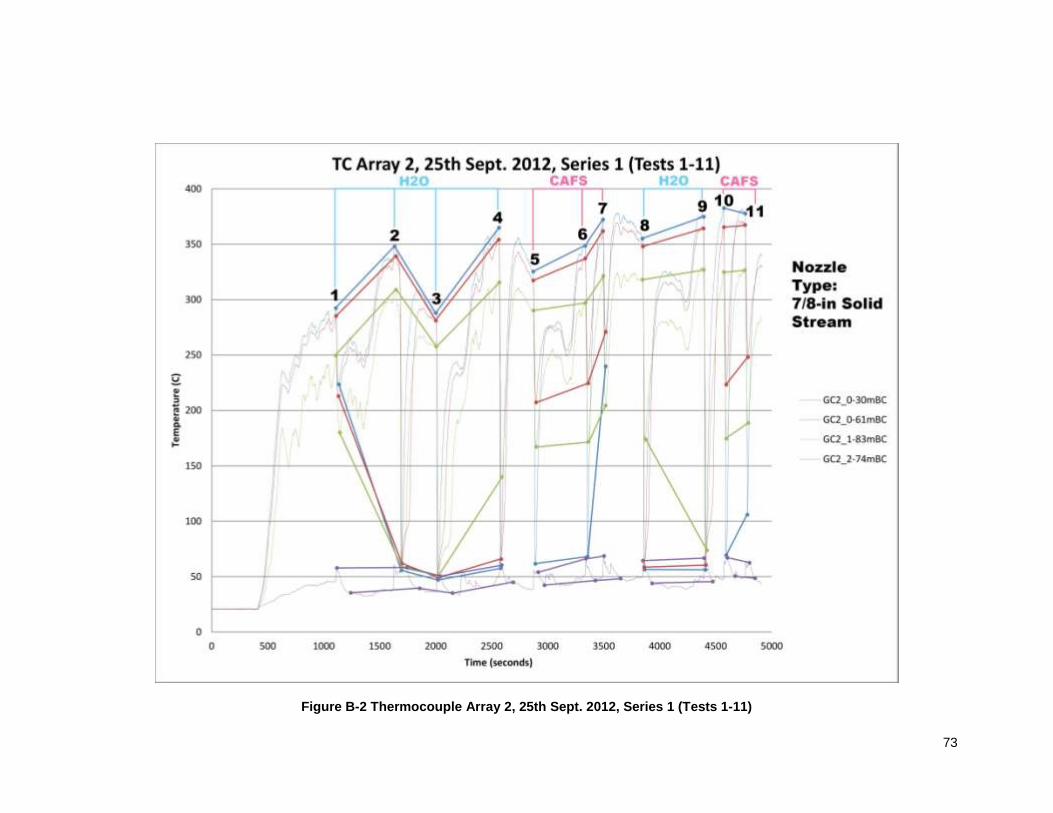
73
Figure B-2 Thermocouple Array 2, 25th Sept. 2012, Series 1 (Tests 1-11)
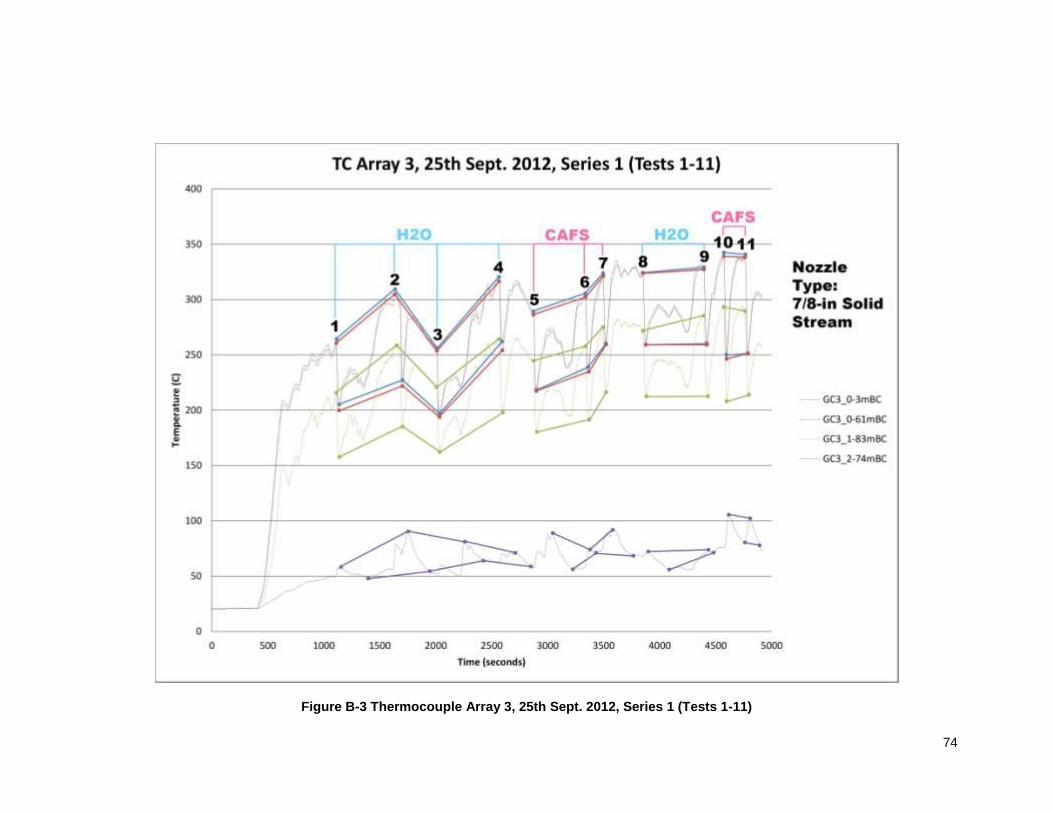
74
Figure B-3 Thermocouple Array 3, 25th Sept. 2012, Series 1 (Tests 1-11)
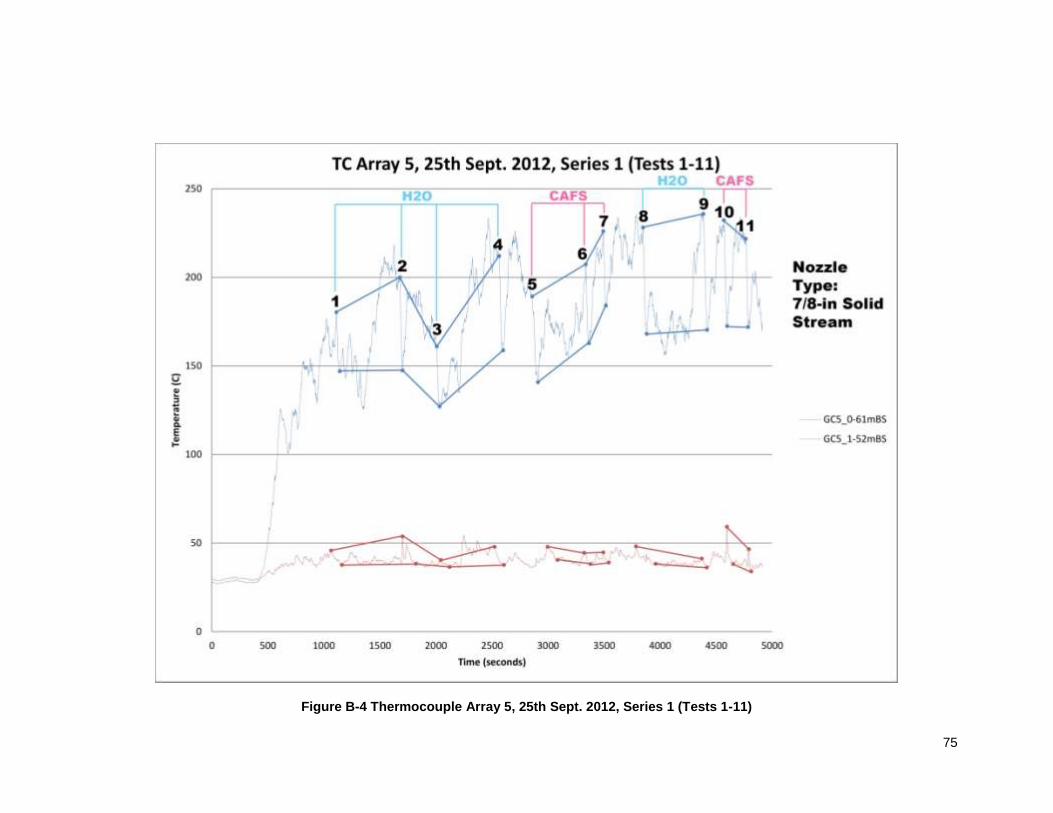
75
Figure B-4 Thermocouple Array 5, 25th Sept. 2012, Series 1 (Tests 1-11)
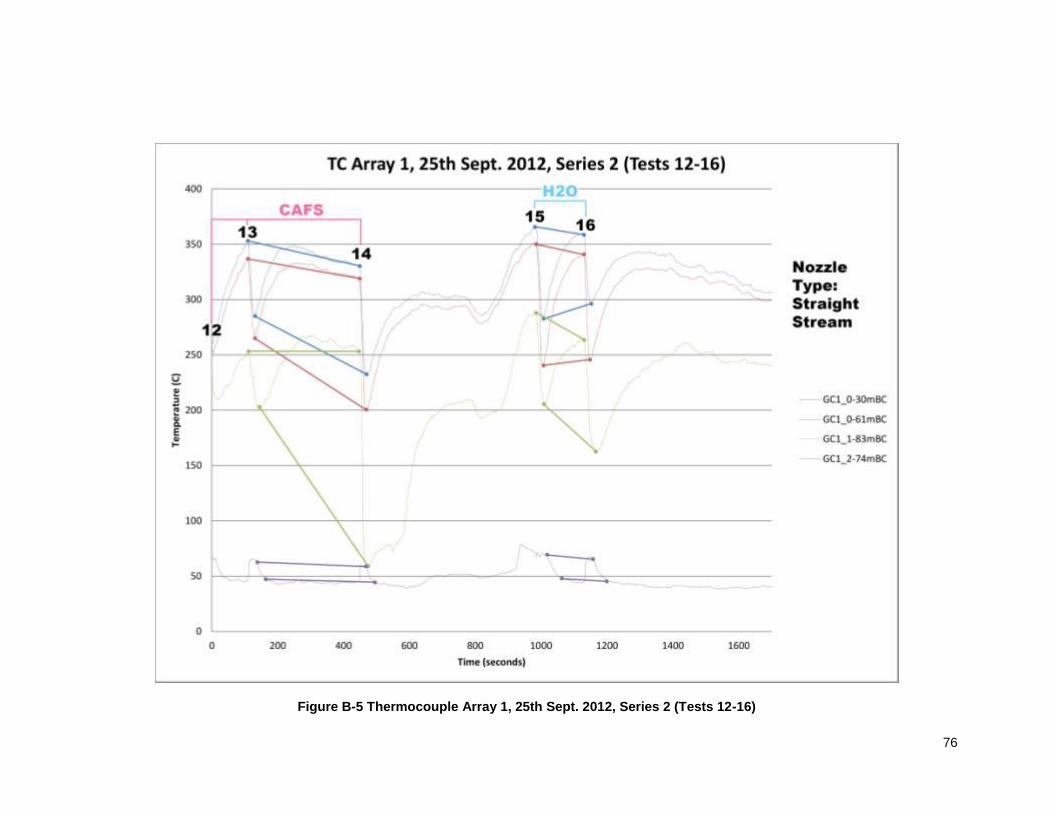
76
Figure B-5 Thermocouple Array 1, 25th Sept. 2012, Series 2 (Tests 12-16)
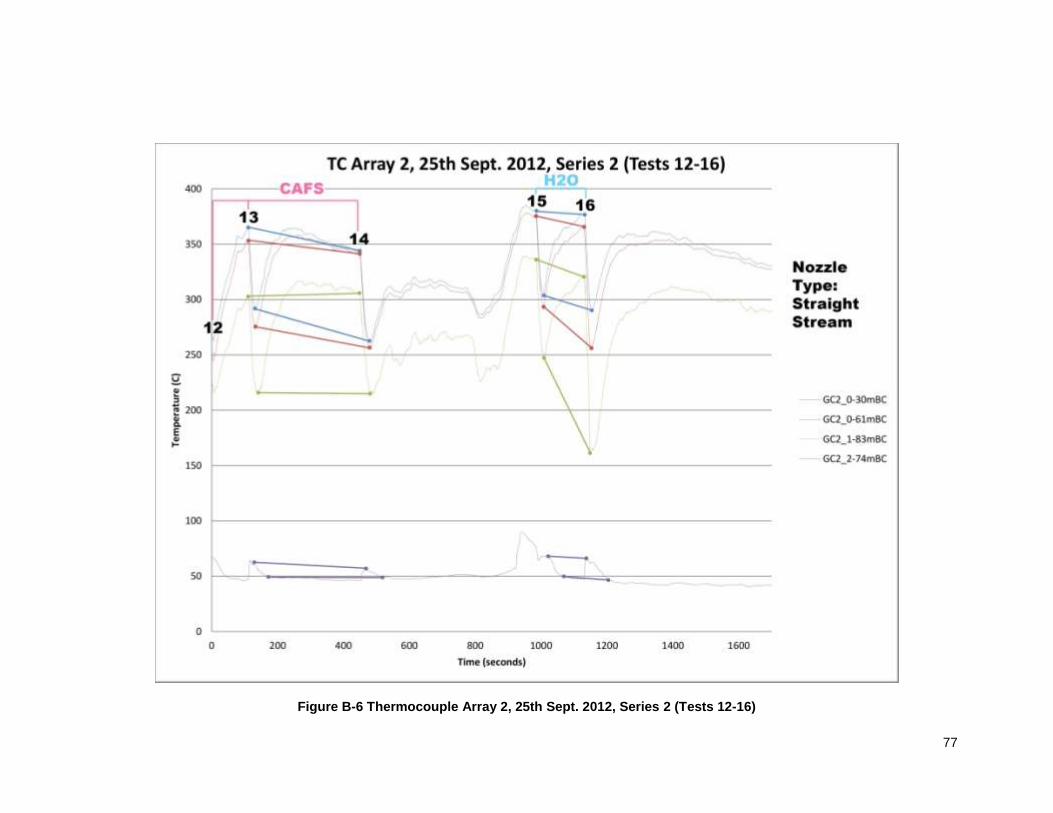
77
Figure B-6 Thermocouple Array 2, 25th Sept. 2012, Series 2 (Tests 12-16)
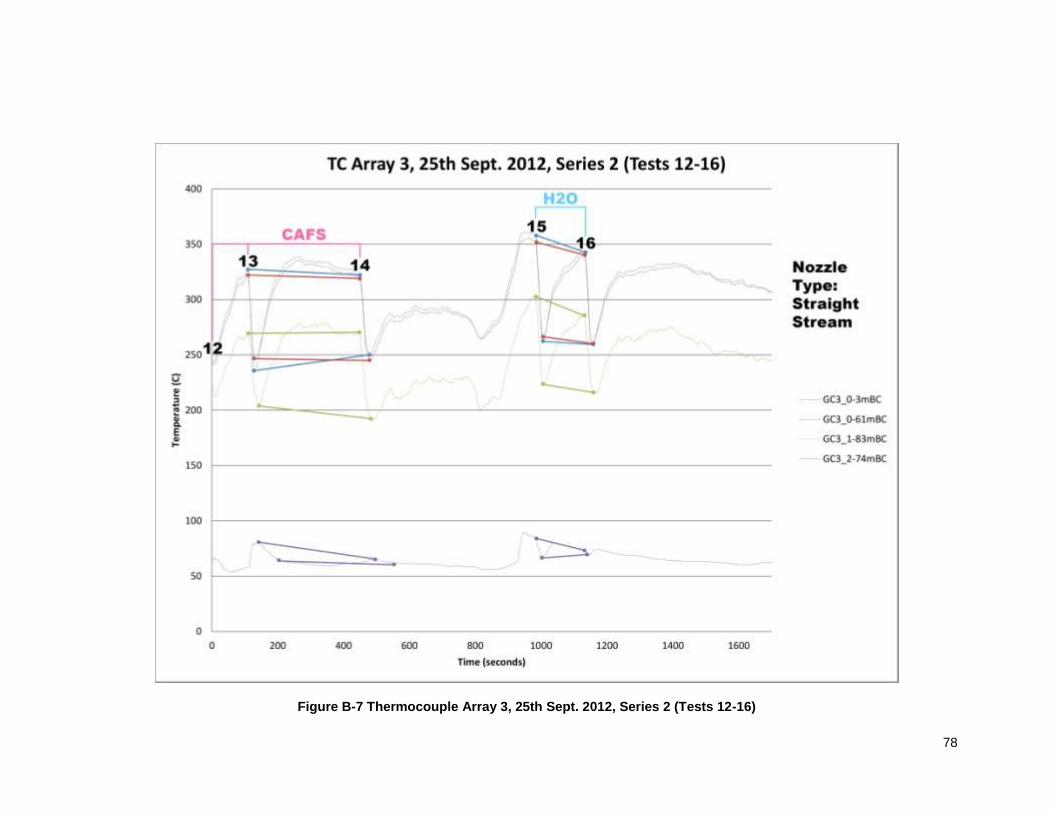
78
Figure B-7 Thermocouple Array 3, 25th Sept. 2012, Series 2 (Tests 12-16)
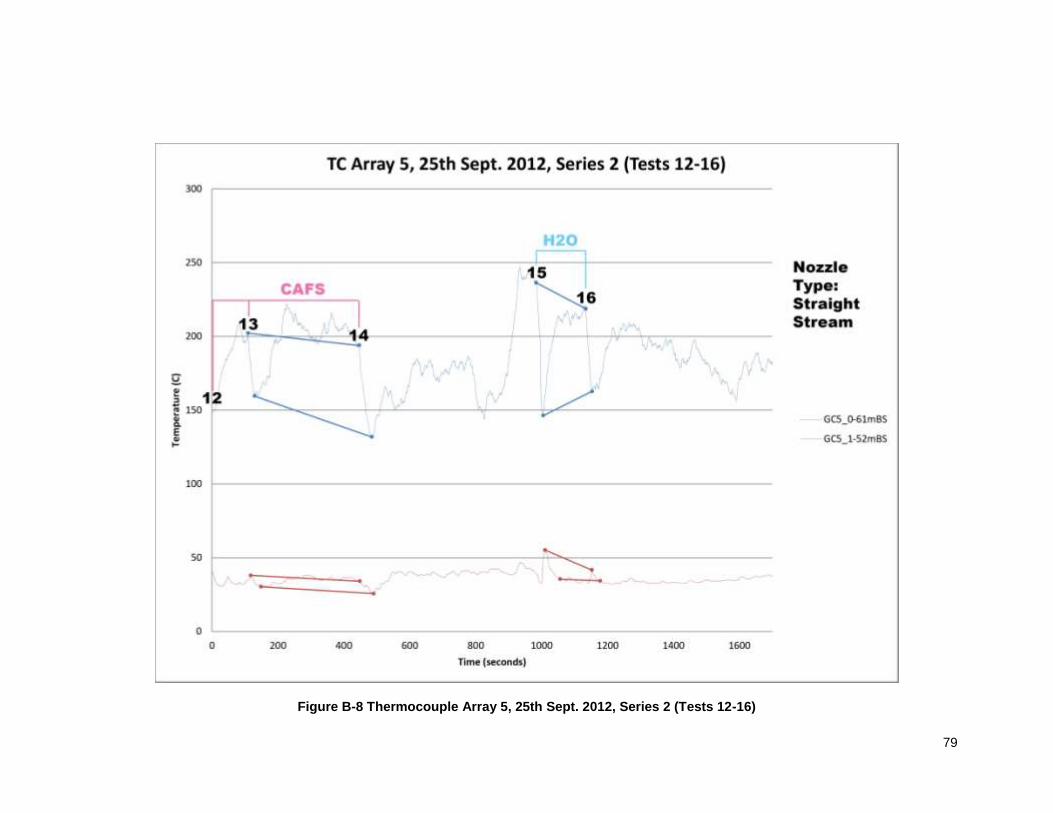
79
Figure B-8 Thermocouple Array 5, 25th Sept. 2012, Series 2 (Tests 12-16)
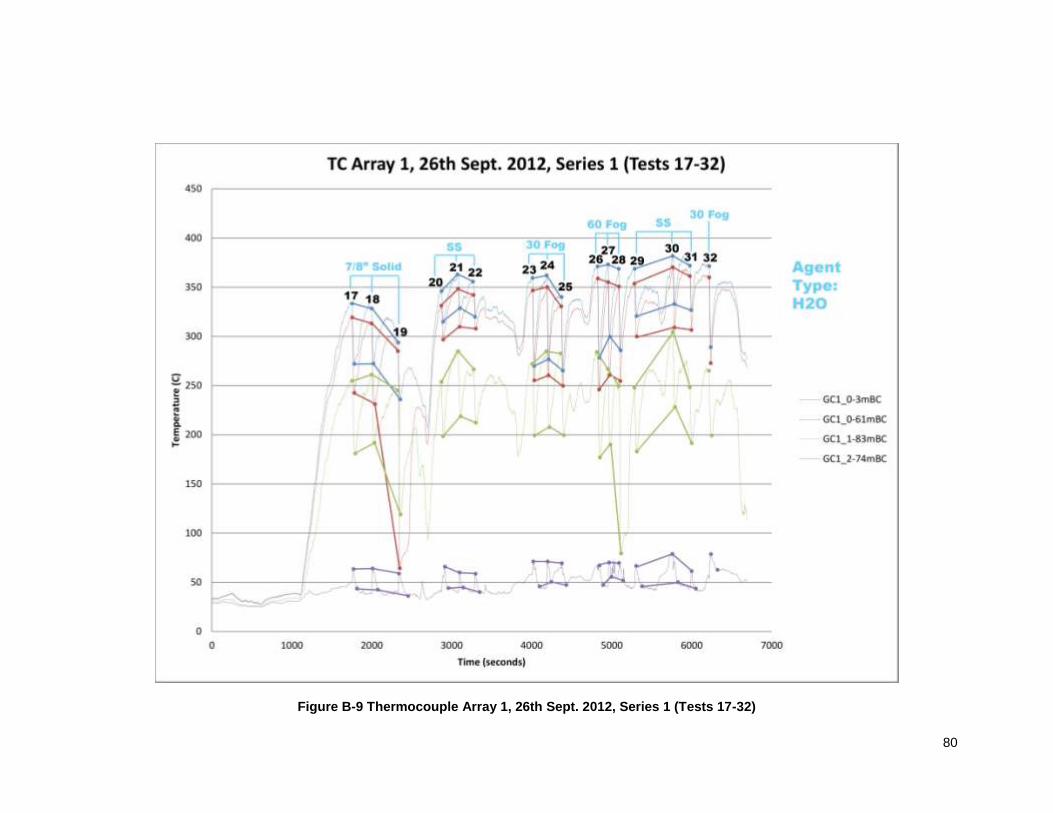
80
Figure B-9 Thermocouple Array 1, 26th Sept. 2012, Series 1 (Tests 17-32)
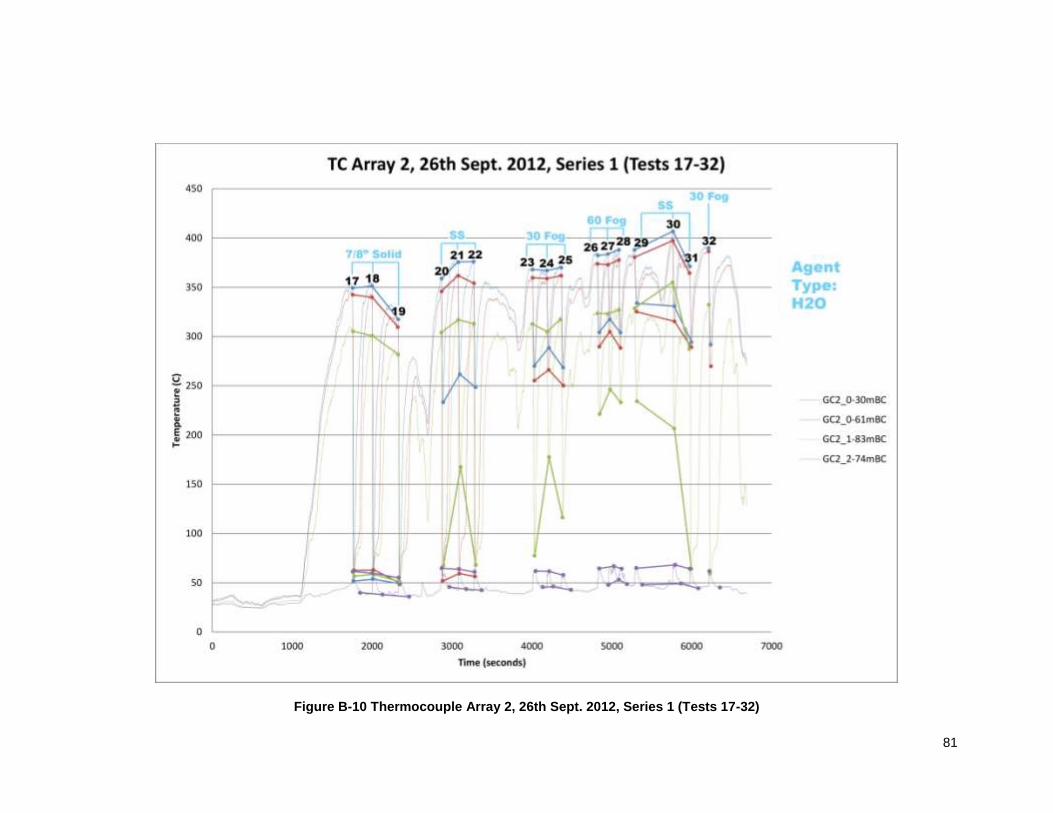
81
Figure B-10 Thermocouple Array 2, 26th Sept. 2012, Series 1 (Tests 17-32)
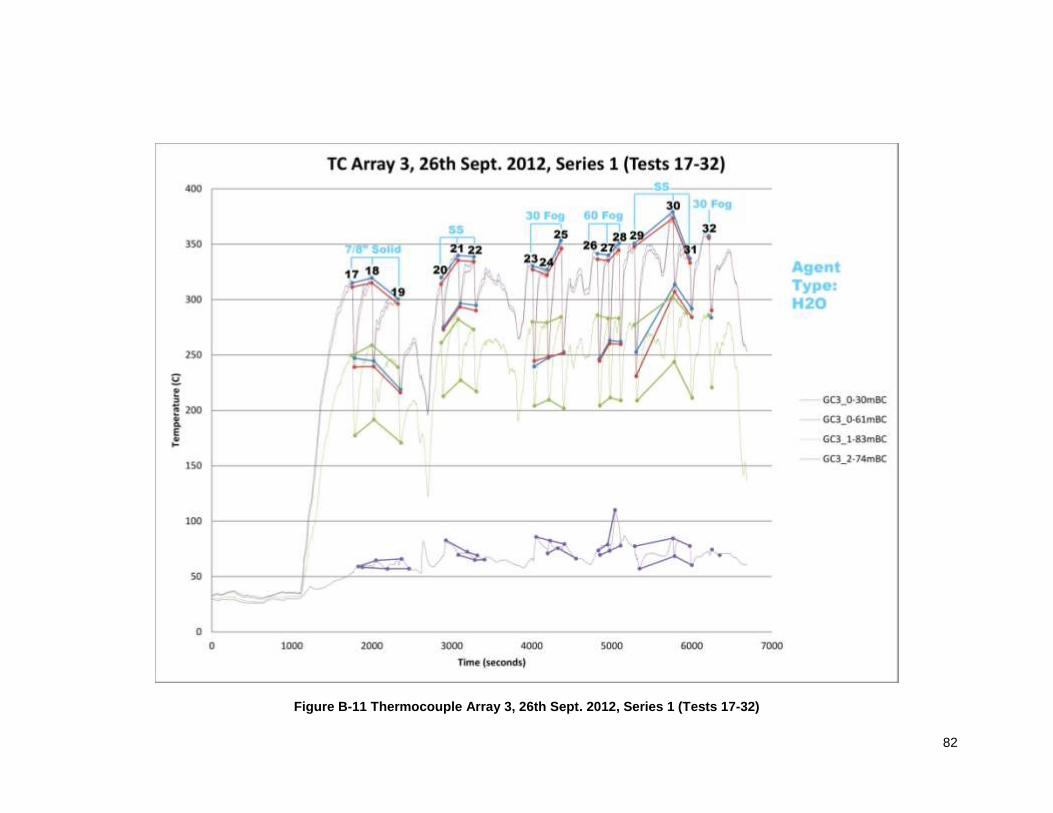
82
Figure B-11 Thermocouple Array 3, 26th Sept. 2012, Series 1 (Tests 17-32)
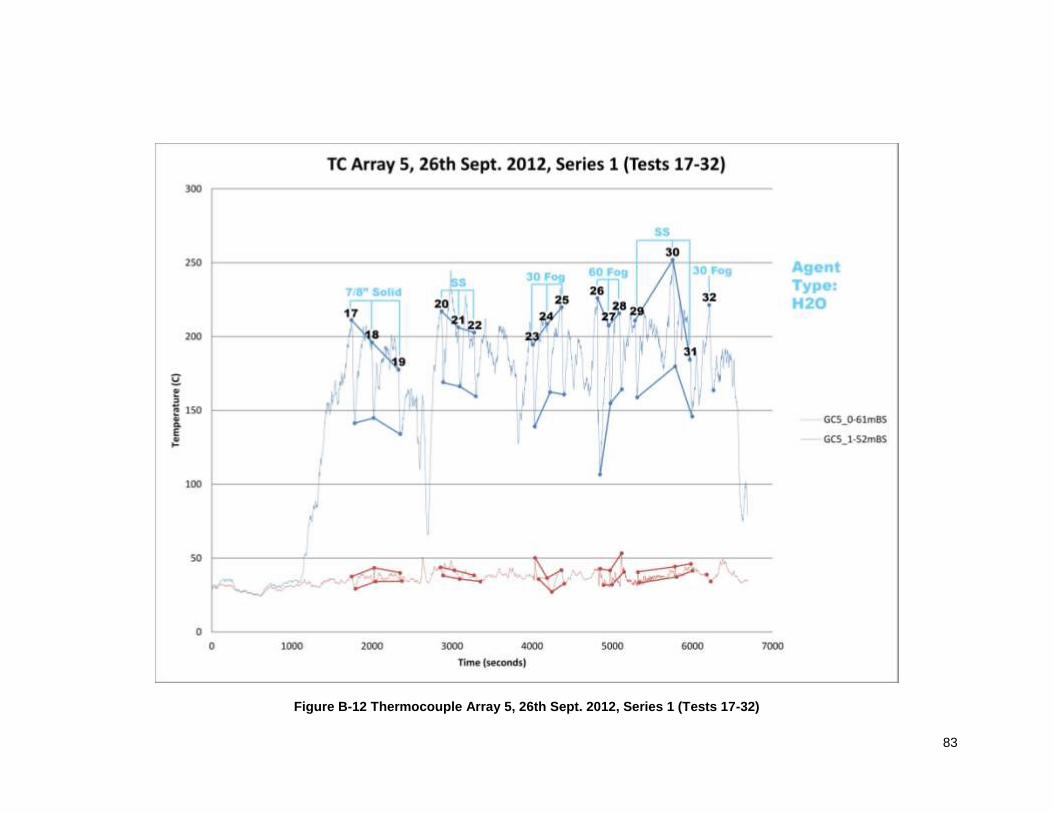
83
Figure B-12 Thermocouple Array 5, 26th Sept. 2012, Series 1 (Tests 17-32)
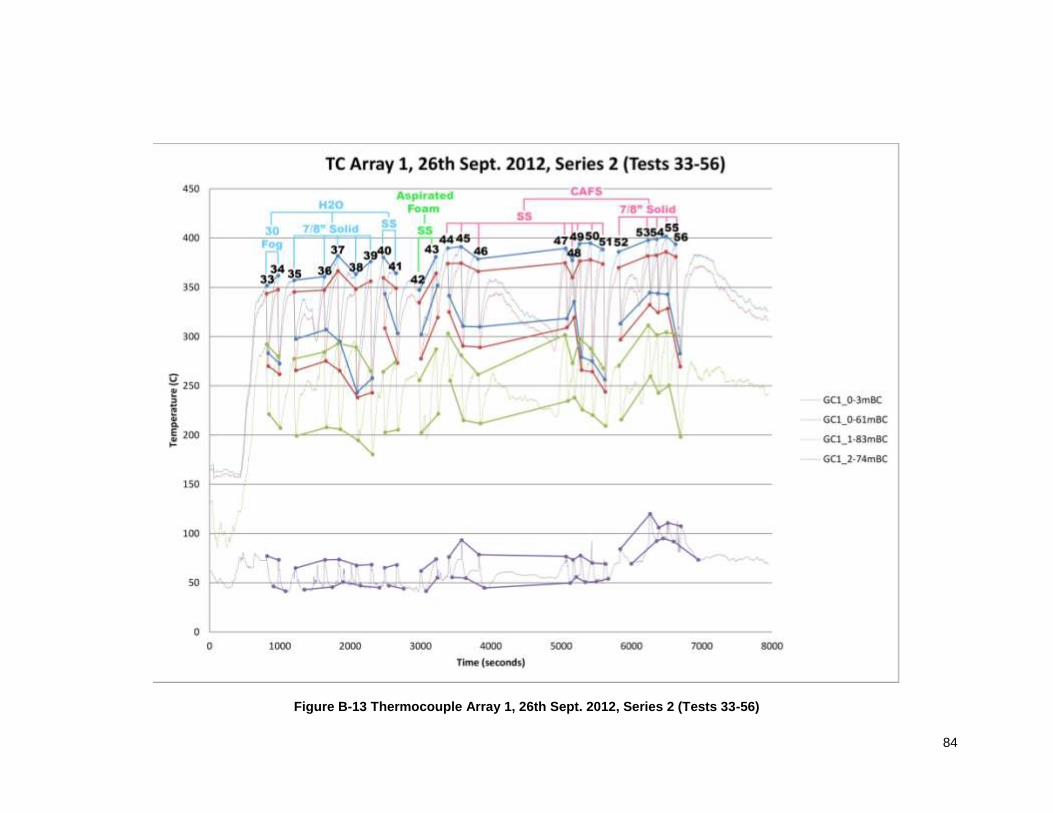
84
Figure B-13 Thermocouple Array 1, 26th Sept. 2012, Series 2 (Tests 33-56)
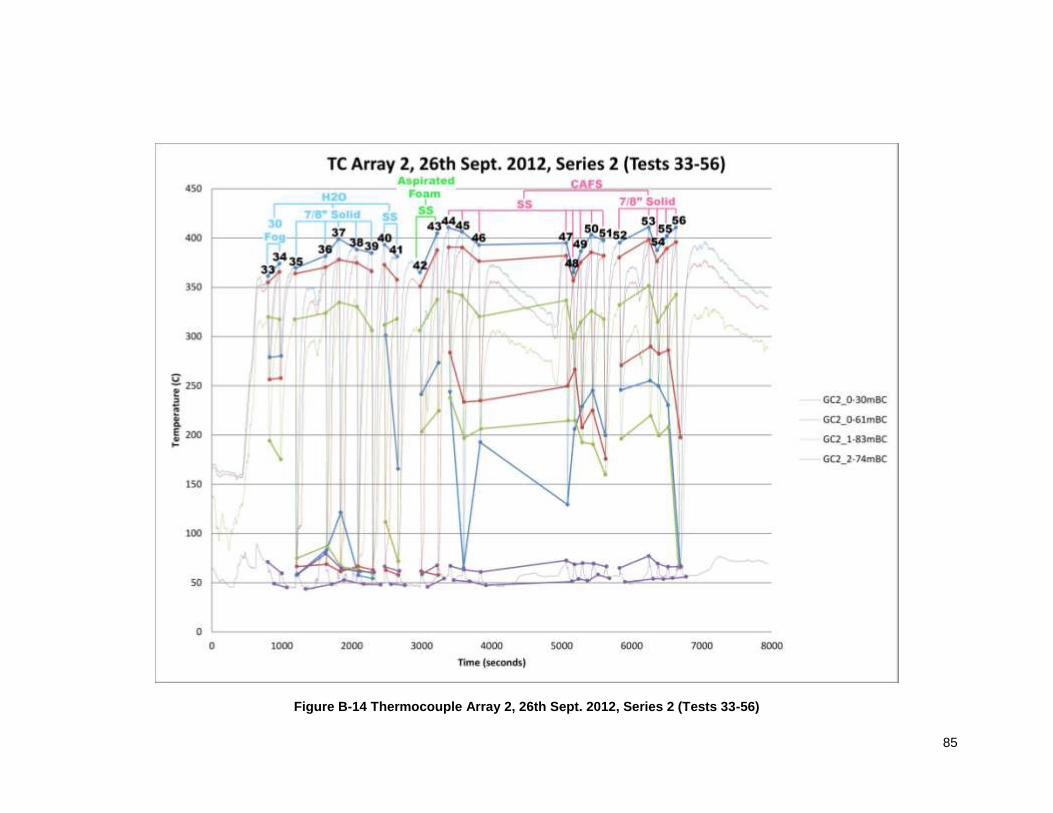
85
Figure B-14 Thermocouple Array 2, 26th Sept. 2012, Series 2 (Tests 33-56)
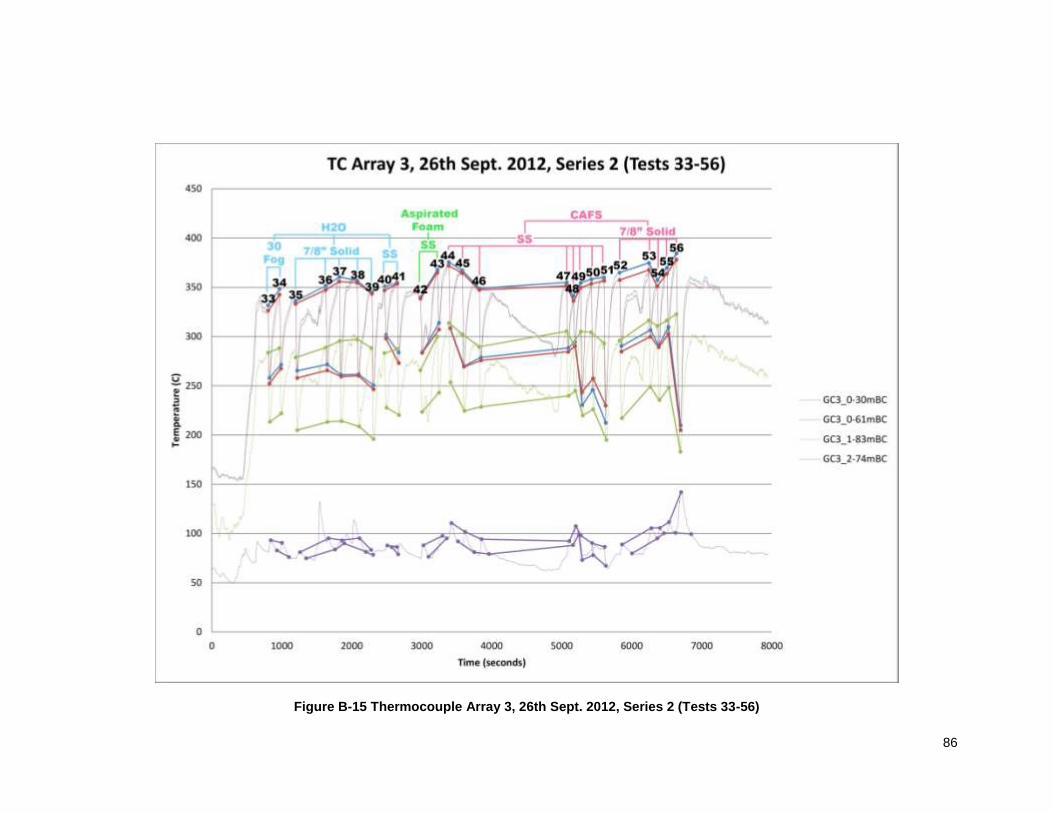
86
Figure B-15 Thermocouple Array 3, 26th Sept. 2012, Series 2 (Tests 33-56)
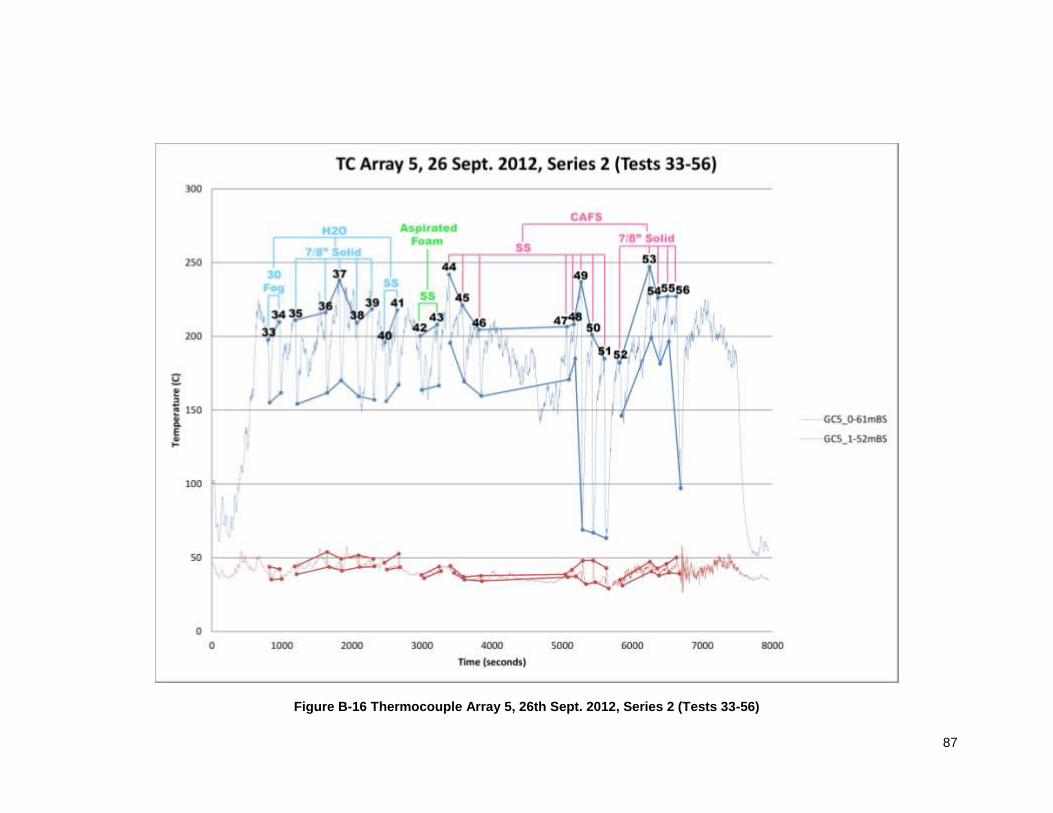
87
Figure B-16 Thermocouple Array 5, 26th Sept. 2012, Series 2 (Tests 33-56)
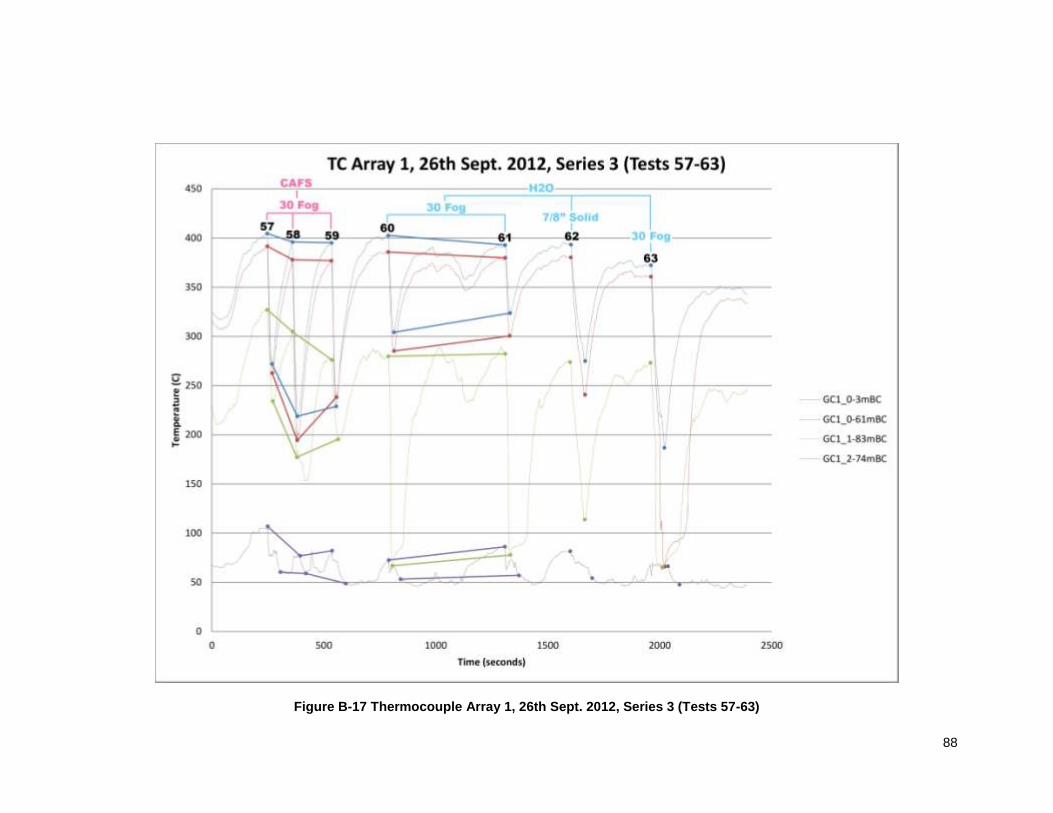
88
Figure B-17 Thermocouple Array 1, 26th Sept. 2012, Series 3 (Tests 57-63)
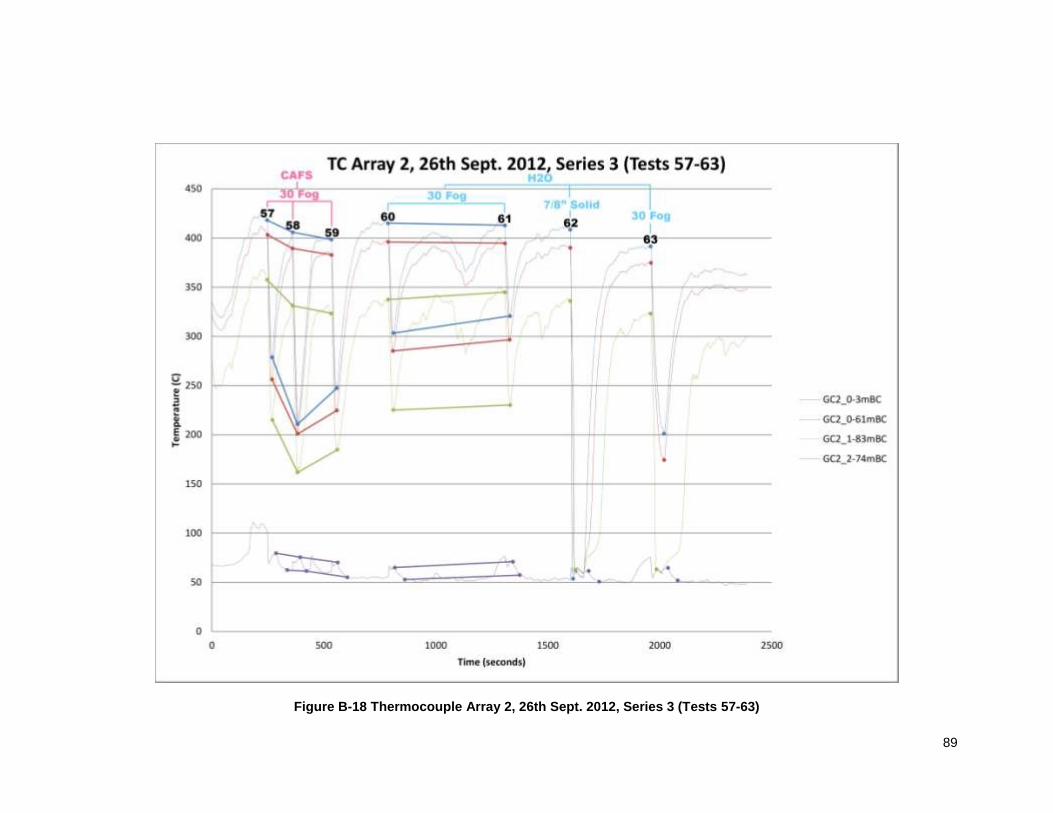
89
Figure B-18 Thermocouple Array 2, 26th Sept. 2012, Series 3 (Tests 57-63)
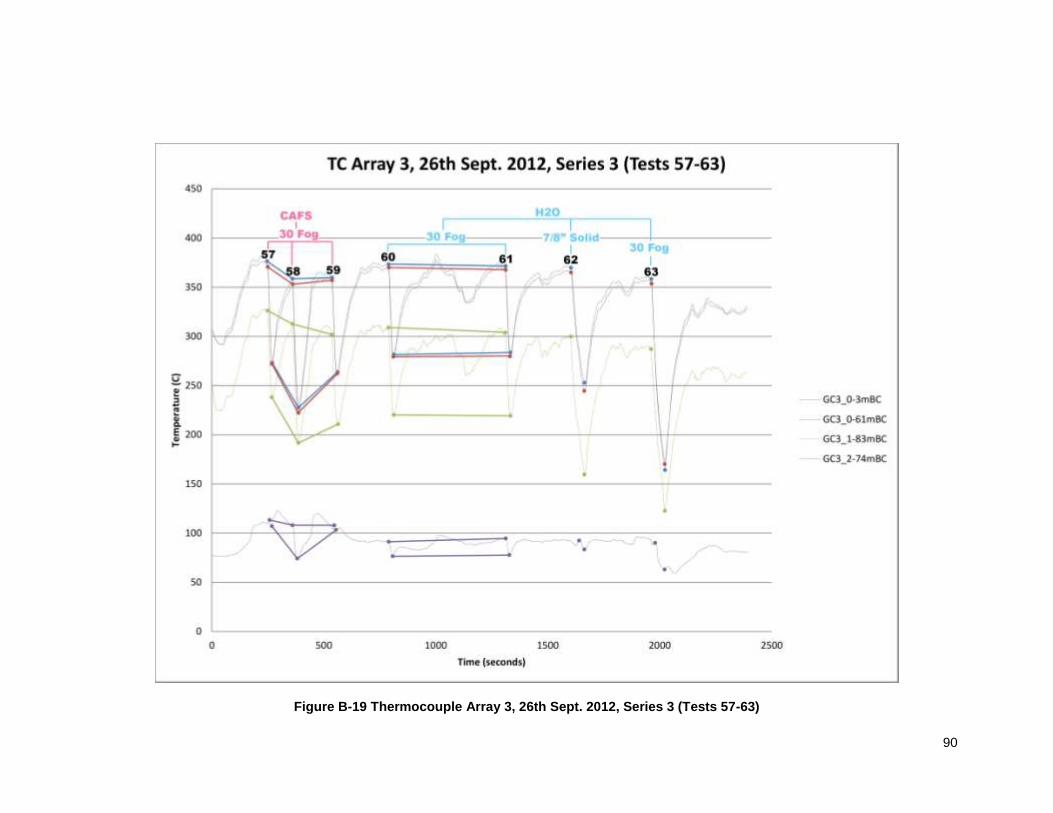
90
Figure B-19 Thermocouple Array 3, 26th Sept. 2012, Series 3 (Tests 57-63)
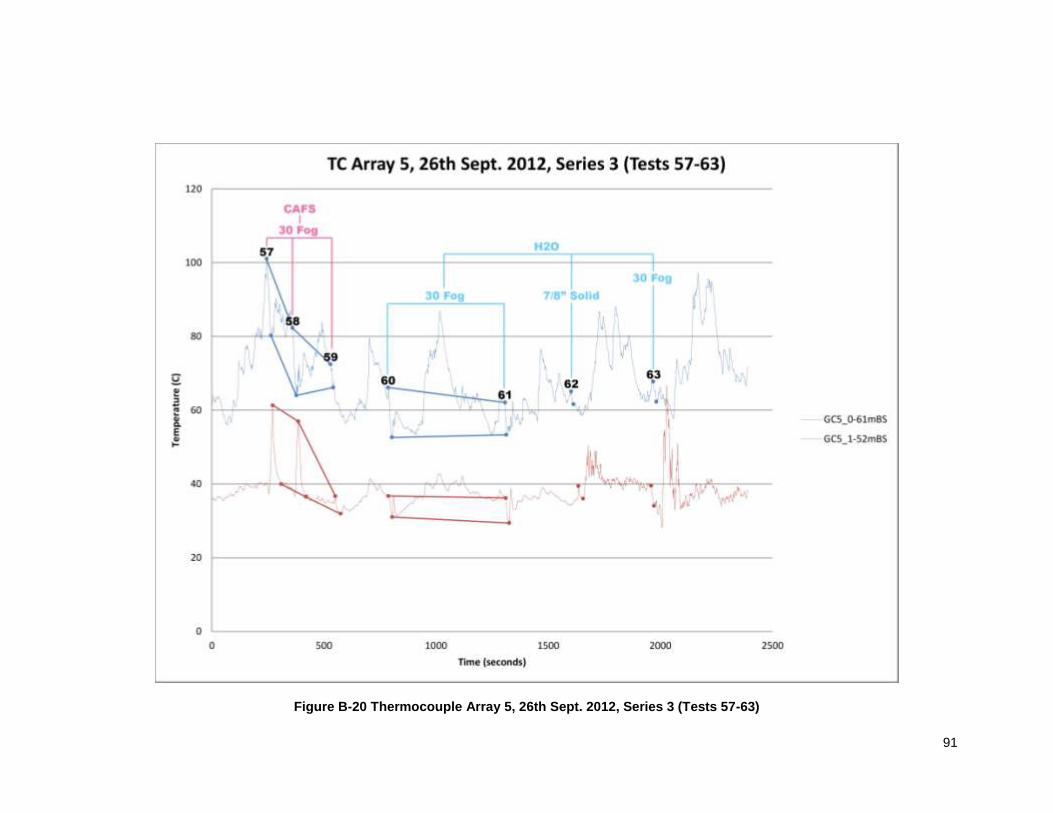
91
Figure B-20 Thermocouple Array 5, 26th Sept. 2012, Series 3 (Tests 57-63)
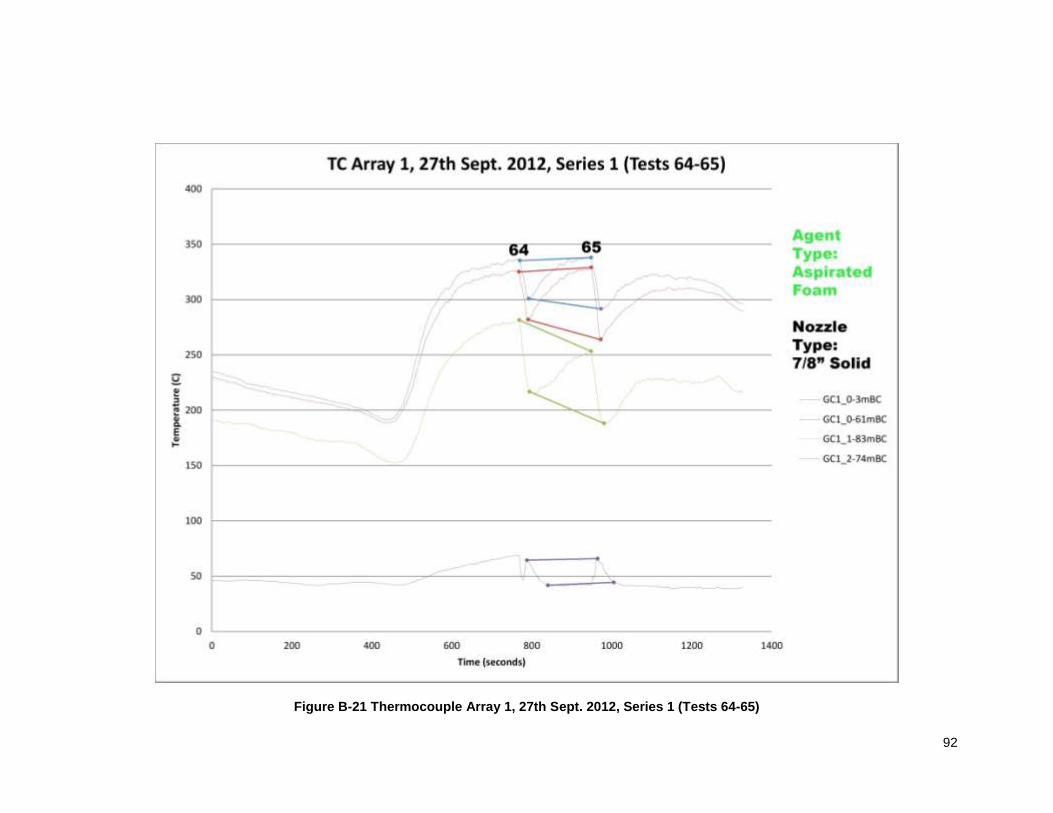
92
Figure B-21 Thermocouple Array 1, 27th Sept. 2012, Series 1 (Tests 64-65)
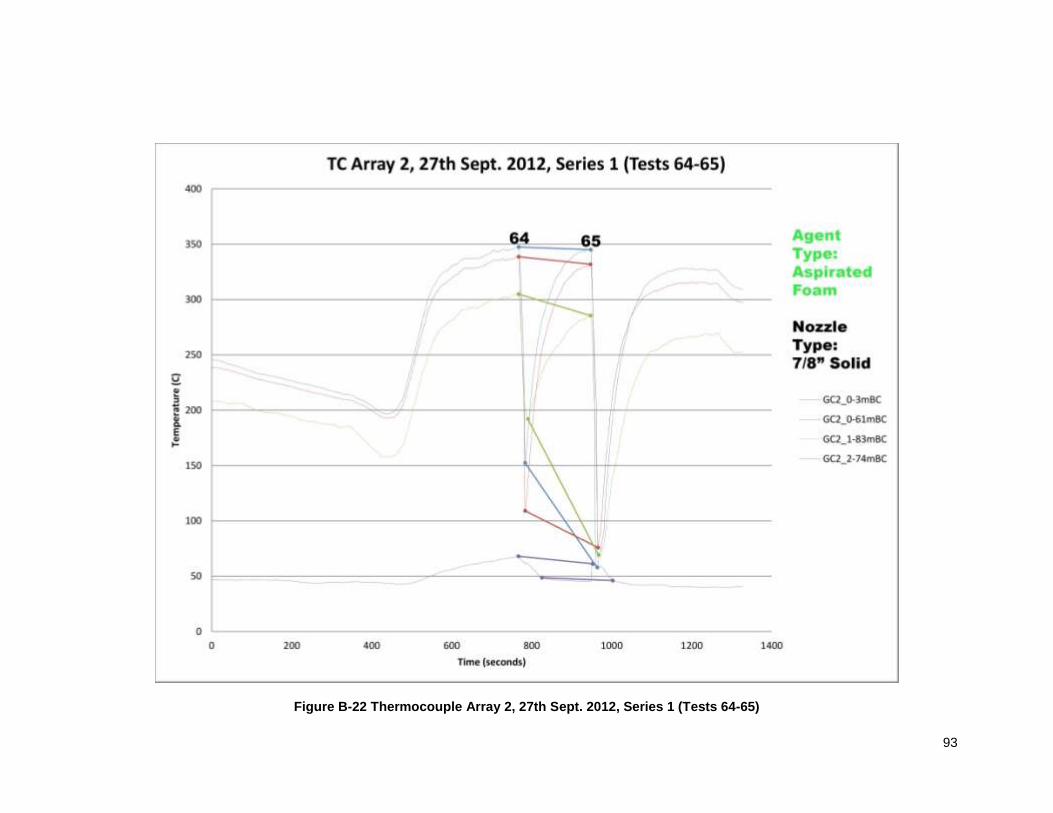
93
Figure B-22 Thermocouple Array 2, 27th Sept. 2012, Series 1 (Tests 64-65)
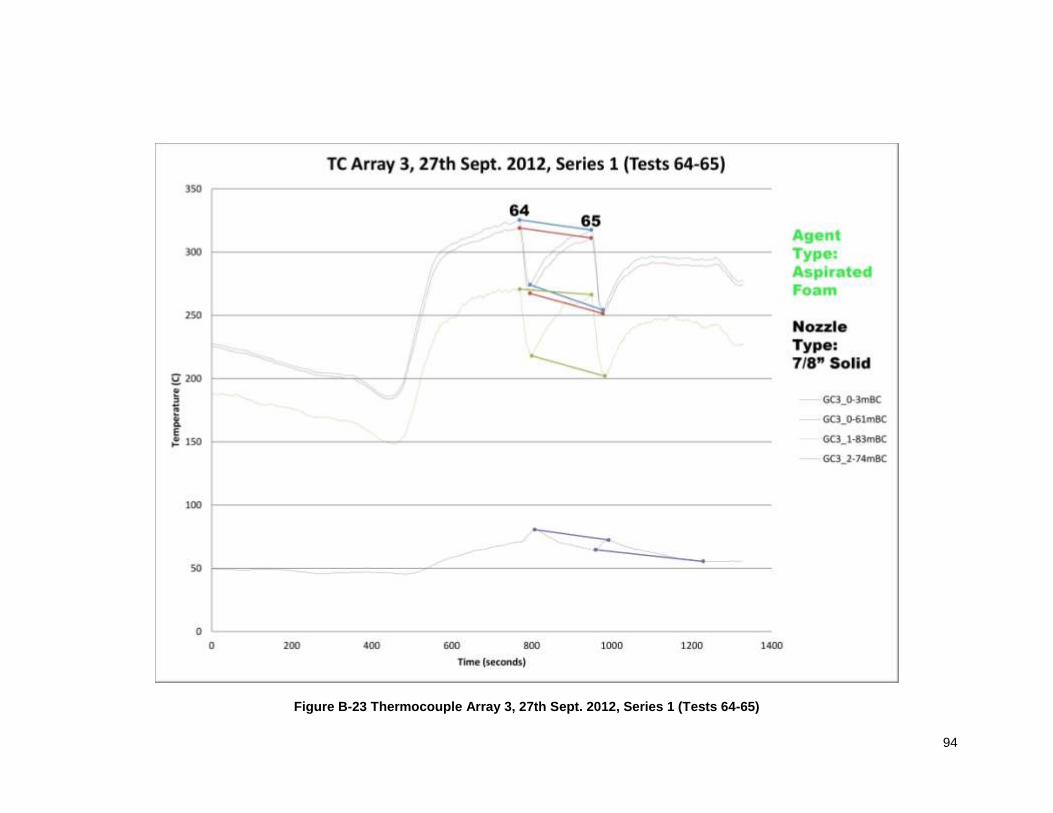
94
Figure B-23 Thermocouple Array 3, 27th Sept. 2012, Series 1 (Tests 64-65)
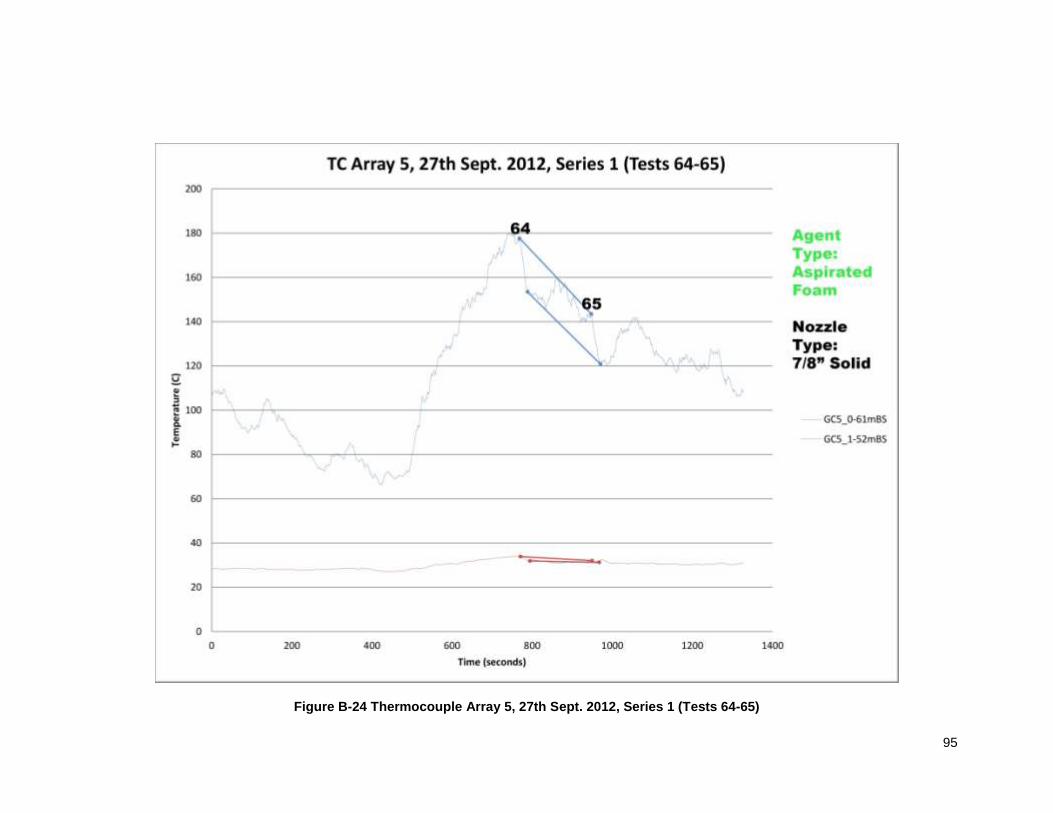
95
Figure B-24 Thermocouple Array 5, 27th Sept. 2012, Series 1 (Tests 64-65)
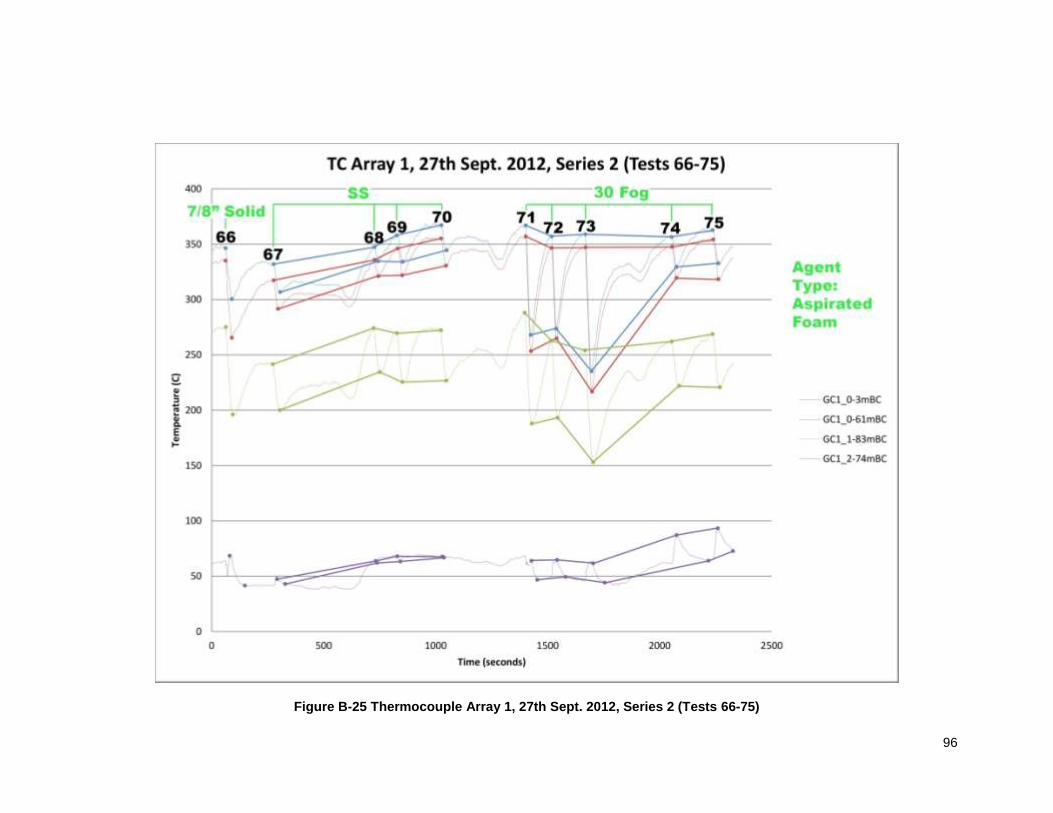
96
Figure B-25 Thermocouple Array 1, 27th Sept. 2012, Series 2 (Tests 66-75)
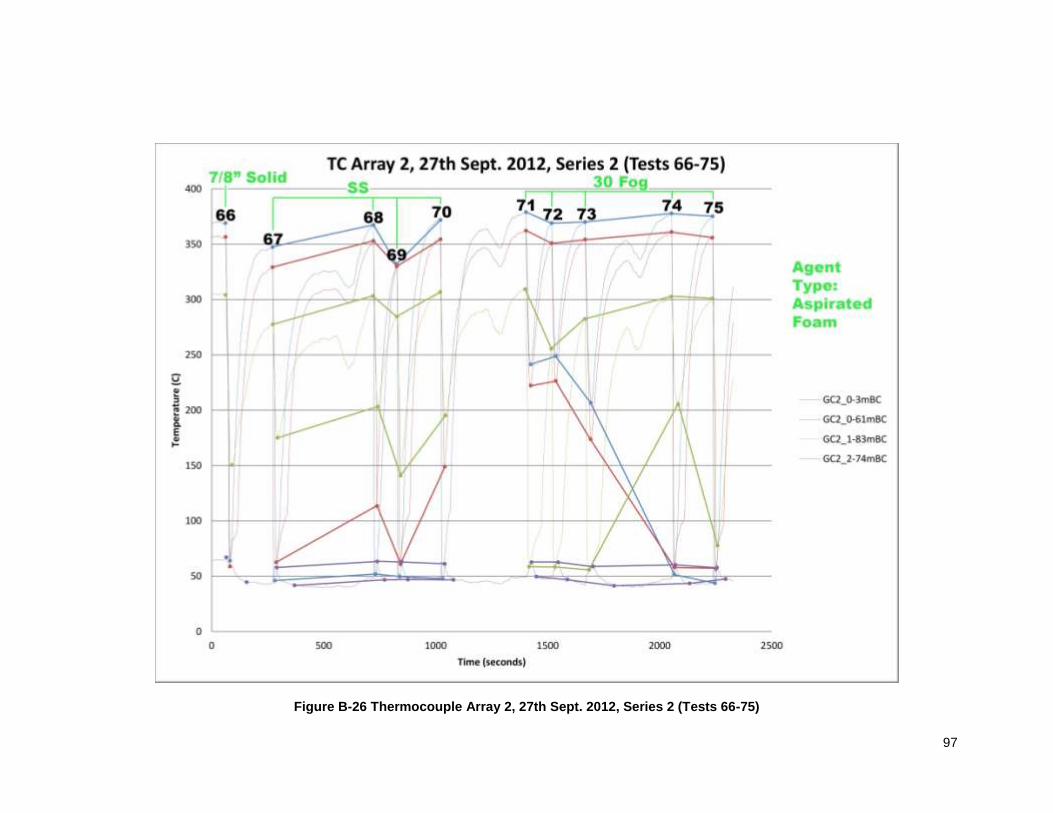
97
Figure B-26 Thermocouple Array 2, 27th Sept. 2012, Series 2 (Tests 66-75)
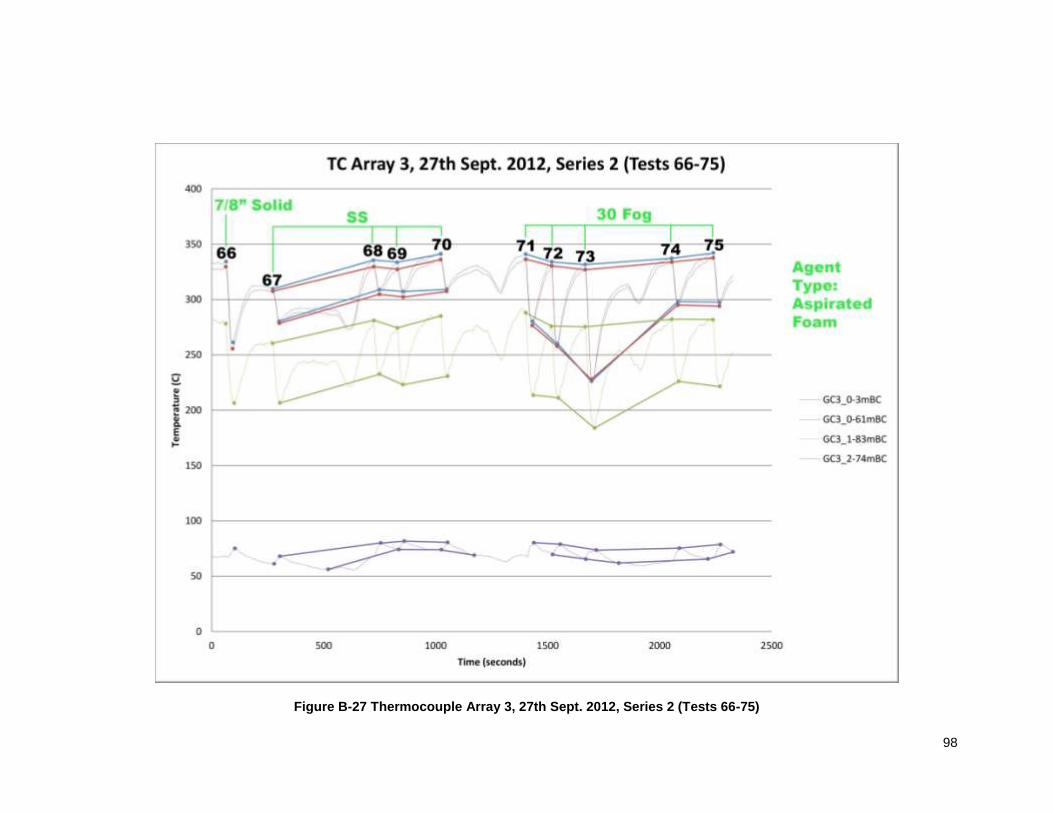
98
Figure B-27 Thermocouple Array 3, 27th Sept. 2012, Series 2 (Tests 66-75)
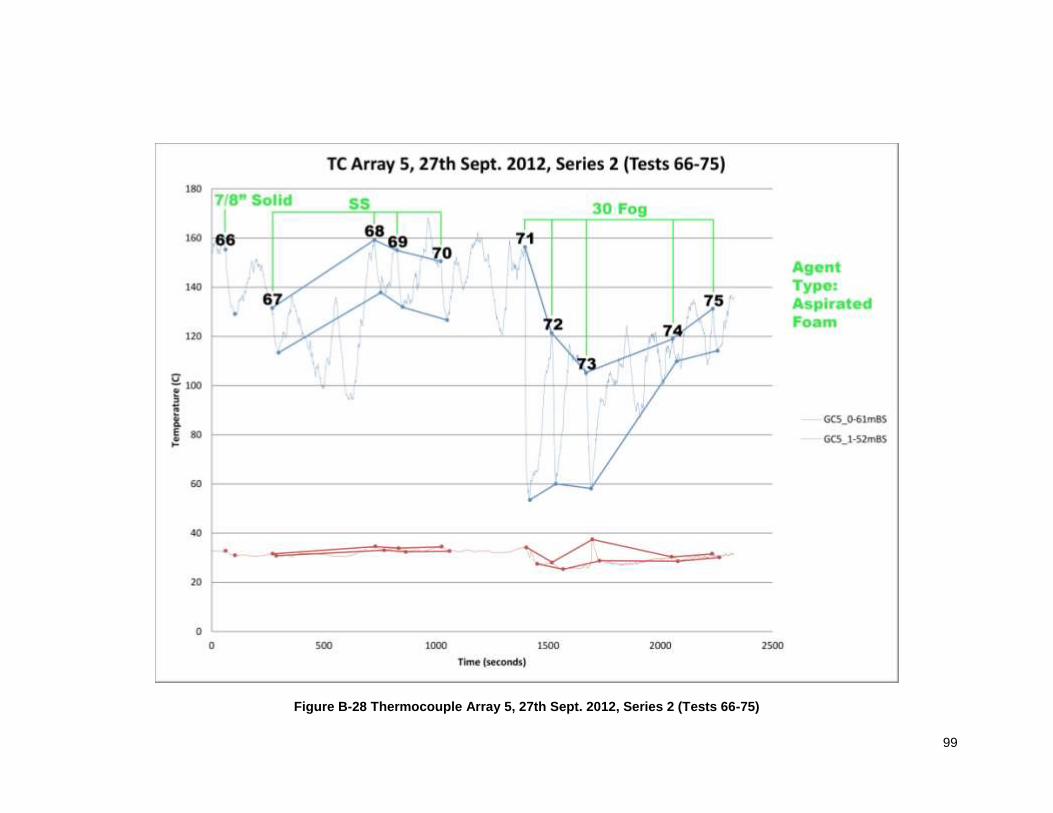
99
Figure B-28 Thermocouple Array 5, 27th Sept. 2012, Series 2 (Tests 66-75)
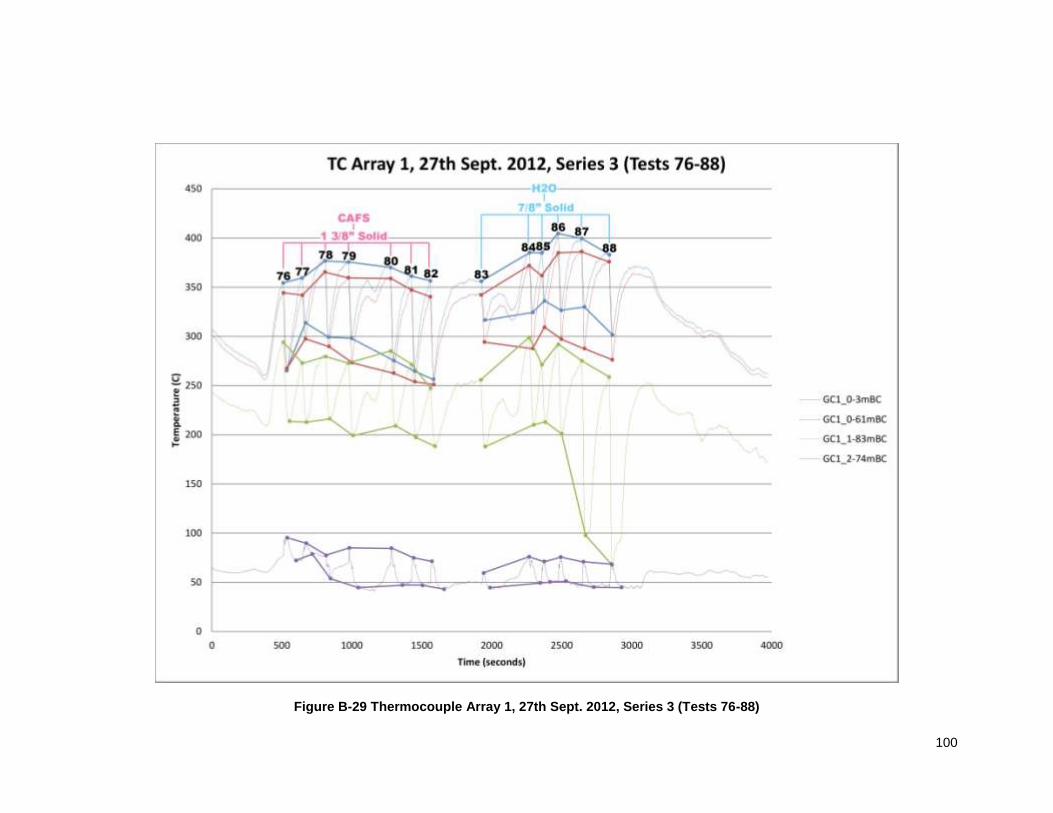
100
Figure B-29 Thermocouple Array 1, 27th Sept. 2012, Series 3 (Tests 76-88)

101
Figure B-30 Thermocouple Array 2, 27th Sept. 2012, Series 3 (Tests 76-88)
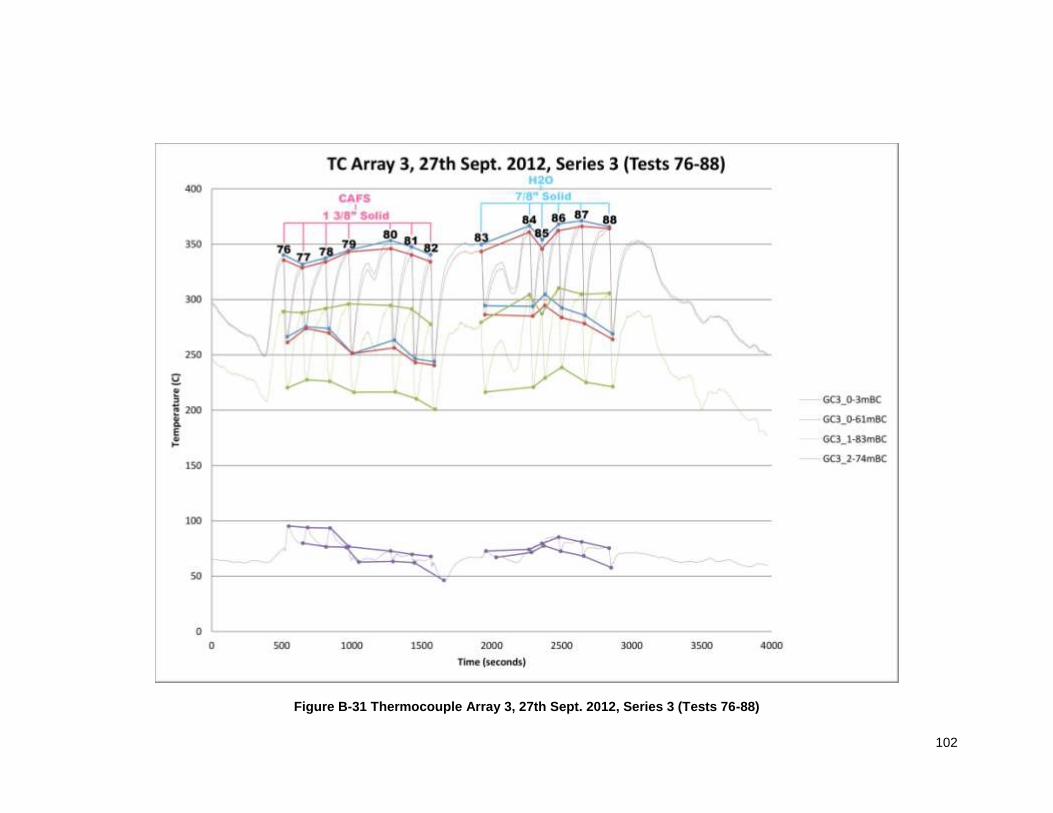
102
Figure B-31 Thermocouple Array 3, 27th Sept. 2012, Series 3 (Tests 76-88)
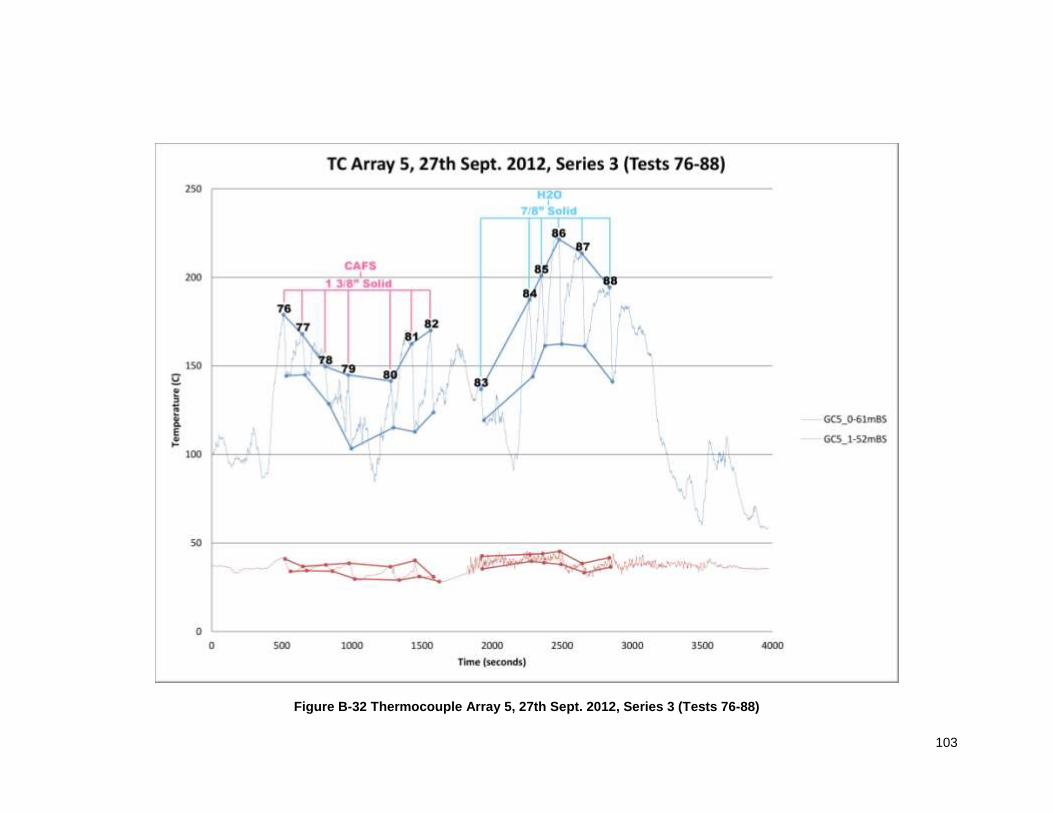
103
Figure B-32 Thermocouple Array 5, 27th Sept. 2012, Series 3 (Tests 76-88)
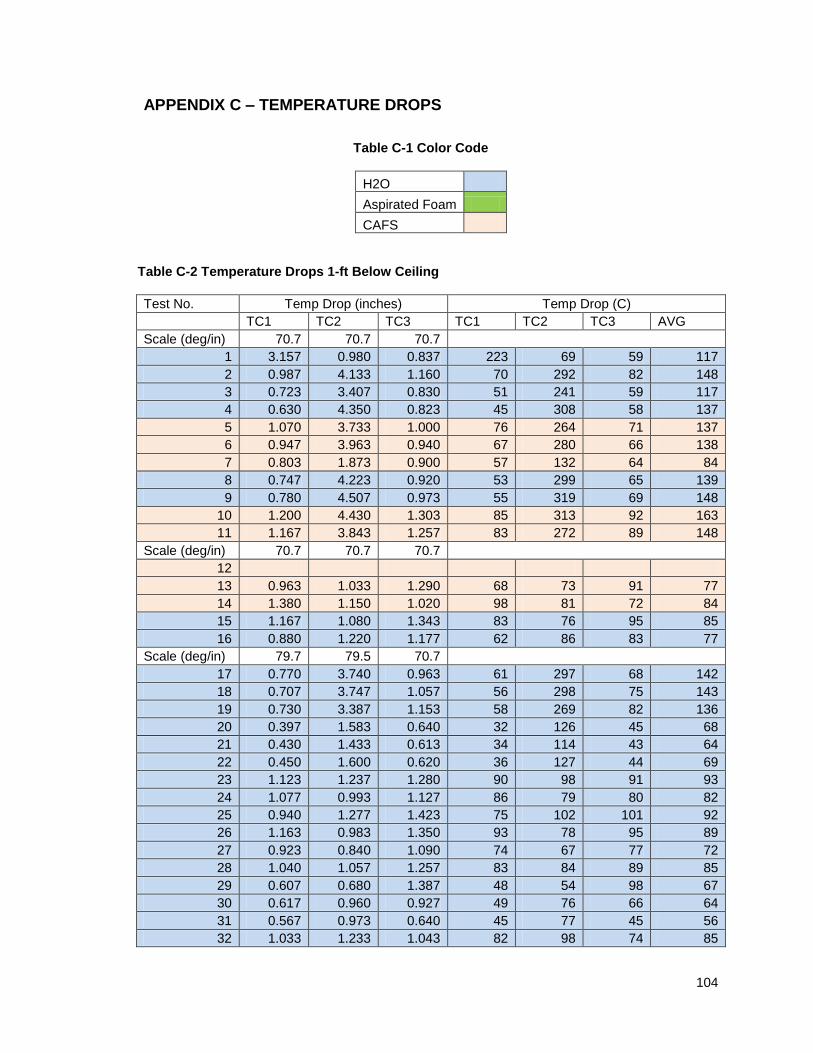
104
APPENDIX C – TEMPERATURE DROPS
Table C-1 Color Code
H2O
Aspirated Foam
CAFS
Table C-2 Temperature Drops 1-ft Below Ceiling
Test No. Temp Drop (inches) Temp Drop (C)
TC1 TC2 TC3 TC1 TC2 TC3 AVG
Scale (deg/in) 70.7 70.7 70.7
1 3.157 0.980 0.837 223 69 59 117
2 0.987 4.133 1.160 70 292 82 148
3 0.723 3.407 0.830 51 241 59 117
4 0.630 4.350 0.823 45 308 58 137
5 1.070 3.733 1.000 76 264 71 137
6 0.947 3.963 0.940 67 280 66 138
7 0.803 1.873 0.900 57 132 64 84
8 0.747 4.223 0.920 53 299 65 139
9 0.780 4.507 0.973 55 319 69 148
10 1.200 4.430 1.303 85 313 92 163
11 1.167 3.843 1.257 83 272 89 148
Scale (deg/in) 70.7 70.7 70.7
12
13 0.963 1.033 1.290 68 73 91 77
14 1.380 1.150 1.020 98 81 72 84
15 1.167 1.080 1.343 83 76 95 85
16 0.880 1.220 1.177 62 86 83 77
Scale (deg/in) 79.7 79.5 70.7
17 0.770 3.740 0.963 61 297 68 142
18 0.707 3.747 1.057 56 298 75 143
19 0.730 3.387 1.153 58 269 82 136
20 0.397 1.583 0.640 32 126 45 68
21 0.430 1.433 0.613 34 114 43 64
22 0.450 1.600 0.620 36 127 44 69
23 1.123 1.237 1.280 90 98 91 93
24 1.077 0.993 1.127 86 79 80 82
25 0.940 1.277 1.423 75 102 101 92
26 1.163 0.983 1.350 93 78 95 89
27 0.923 0.840 1.090 74 67 77 72
28 1.040 1.057 1.257 83 84 89 85
29 0.607 0.680 1.387 48 54 98 67
30 0.617 0.960 0.927 49 76 66 64
31 0.567 0.973 0.640 45 77 45 56
32 1.033 1.233 1.043 82 98 74 85
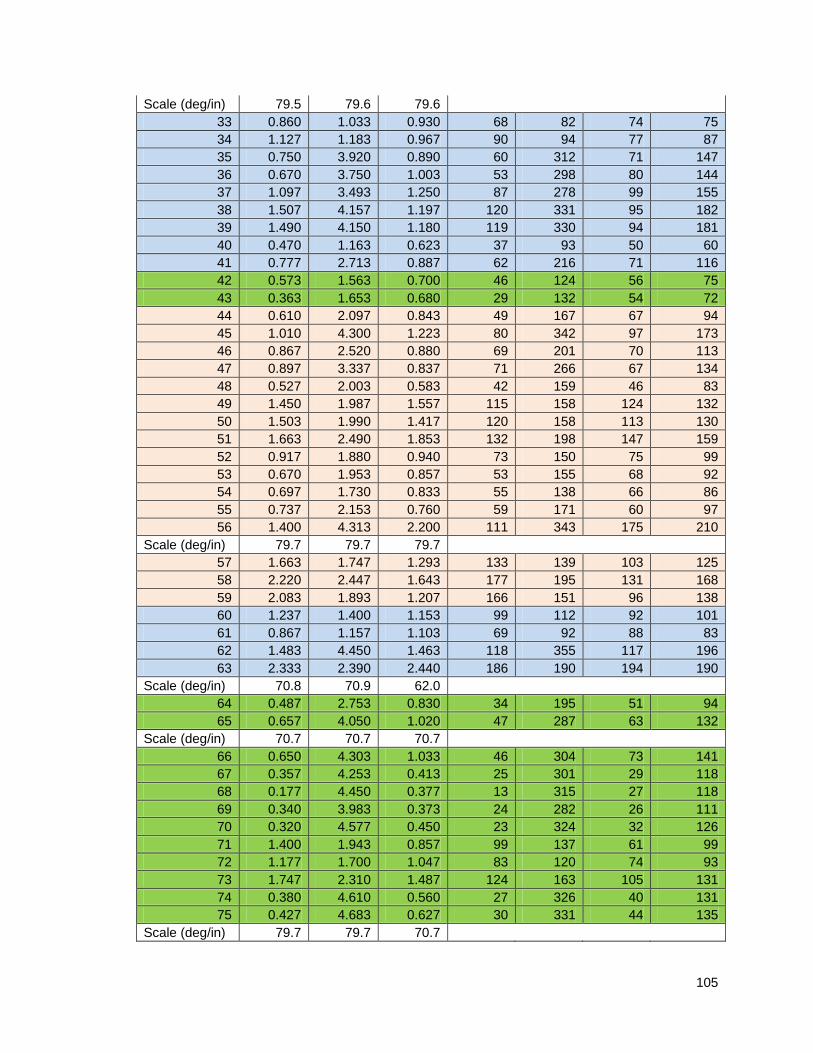
105
Scale (deg/in) 79.5 79.6 79.6
33 0.860 1.033 0.930 68 82 74 75
34 1.127 1.183 0.967 90 94 77 87
35 0.750 3.920 0.890 60 312 71 147
36 0.670 3.750 1.003 53 298 80 144
37 1.097 3.493 1.250 87 278 99 155
38 1.507 4.157 1.197 120 331 95 182
39 1.490 4.150 1.180 119 330 94 181
40 0.470 1.163 0.623 37 93 50 60
41 0.777 2.713 0.887 62 216 71 116
42 0.573 1.563 0.700 46 124 56 75
43 0.363 1.653 0.680 29 132 54 72
44 0.610 2.097 0.843 49 167 67 94
45 1.010 4.300 1.223 80 342 97 173
46 0.867 2.520 0.880 69 201 70 113
47 0.897 3.337 0.837 71 266 67 134
48 0.527 2.003 0.583 42 159 46 83
49 1.450 1.987 1.557 115 158 124 132
50 1.503 1.990 1.417 120 158 113 130
51 1.663 2.490 1.853 132 198 147 159
52 0.917 1.880 0.940 73 150 75 99
53 0.670 1.953 0.857 53 155 68 92
54 0.697 1.730 0.833 55 138 66 86
55 0.737 2.153 0.760 59 171 60 97
56 1.400 4.313 2.200 111 343 175 210
Scale (deg/in) 79.7 79.7 79.7
57 1.663 1.747 1.293 133 139 103 125
58 2.220 2.447 1.643 177 195 131 168
59 2.083 1.893 1.207 166 151 96 138
60 1.237 1.400 1.153 99 112 92 101
61 0.867 1.157 1.103 69 92 88 83
62 1.483 4.450 1.463 118 355 117 196
63 2.333 2.390 2.440 186 190 194 190
Scale (deg/in) 70.8 70.9 62.0
64 0.487 2.753 0.830 34 195 51 94
65 0.657 4.050 1.020 47 287 63 132
Scale (deg/in) 70.7 70.7 70.7
66 0.650 4.303 1.033 46 304 73 141
67 0.357 4.253 0.413 25 301 29 118
68 0.177 4.450 0.377 13 315 27 118
69 0.340 3.983 0.373 24 282 26 111
70 0.320 4.577 0.450 23 324 32 126
71 1.400 1.943 0.857 99 137 61 99
72 1.177 1.700 1.047 83 120 74 93
73 1.747 2.310 1.487 124 163 105 131
74 0.380 4.610 0.560 27 326 40 131
75 0.427 4.683 0.627 30 331 44 135
Scale (deg/in) 79.7 79.7 70.7
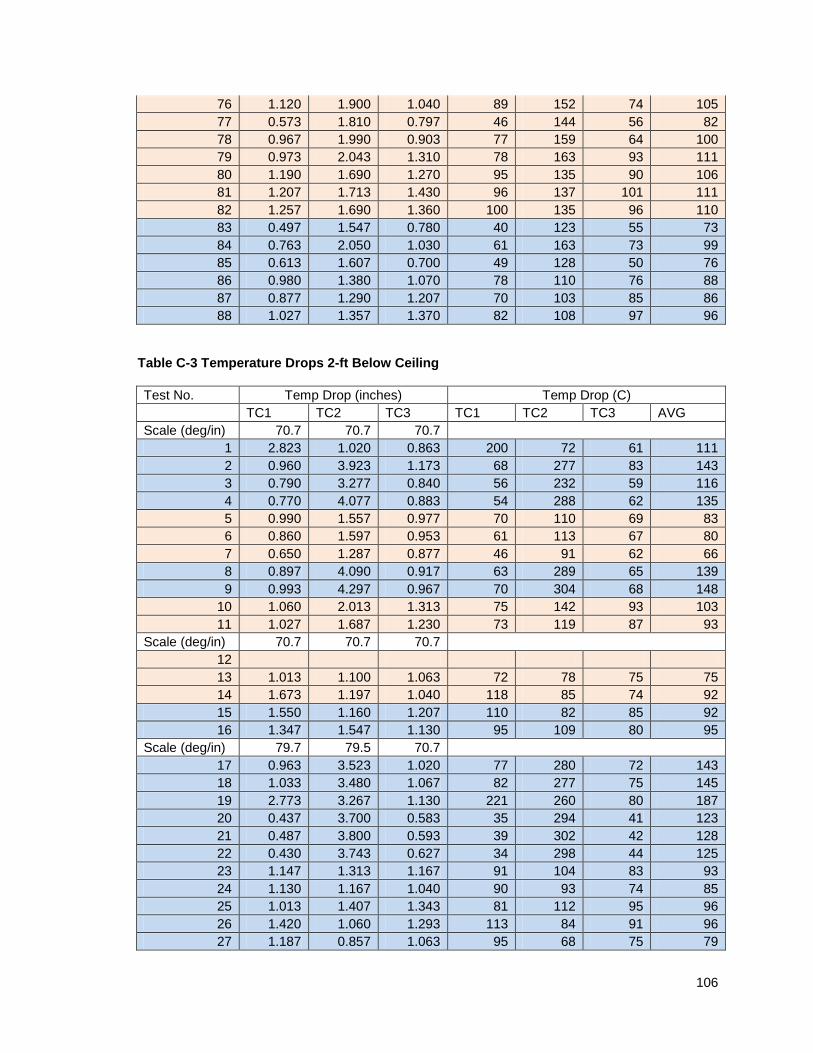
106
76 1.120 1.900 1.040 89 152 74 105
77 0.573 1.810 0.797 46 144 56 82
78 0.967 1.990 0.903 77 159 64 100
79 0.973 2.043 1.310 78 163 93 111
80 1.190 1.690 1.270 95 135 90 106
81 1.207 1.713 1.430 96 137 101 111
82 1.257 1.690 1.360 100 135 96 110
83 0.497 1.547 0.780 40 123 55 73
84 0.763 2.050 1.030 61 163 73 99
85 0.613 1.607 0.700 49 128 50 76
86 0.980 1.380 1.070 78 110 76 88
87 0.877 1.290 1.207 70 103 85 86
88 1.027 1.357 1.370 82 108 97 96
Table C-3 Temperature Drops 2-ft Below Ceiling
Test No. Temp Drop (inches) Temp Drop (C)
TC1 TC2 TC3 TC1 TC2 TC3 AVG
Scale (deg/in) 70.7 70.7 70.7
1 2.823 1.020 0.863 200 72 61 111
2 0.960 3.923 1.173 68 277 83 143
3 0.790 3.277 0.840 56 232 59 116
4 0.770 4.077 0.883 54 288 62 135
5 0.990 1.557 0.977 70 110 69 83
6 0.860 1.597 0.953 61 113 67 80
7 0.650 1.287 0.877 46 91 62 66
8 0.897 4.090 0.917 63 289 65 139
9 0.993 4.297 0.967 70 304 68 148
10 1.060 2.013 1.313 75 142 93 103
11 1.027 1.687 1.230 73 119 87 93
Scale (deg/in) 70.7 70.7 70.7
12
13 1.013 1.100 1.063 72 78 75 75
14 1.673 1.197 1.040 118 85 74 92
15 1.550 1.160 1.207 110 82 85 92
16 1.347 1.547 1.130 95 109 80 95
Scale (deg/in) 79.7 79.5 70.7
17 0.963 3.523 1.020 77 280 72 143
18 1.033 3.480 1.067 82 277 75 145
19 2.773 3.267 1.130 221 260 80 187
20 0.437 3.700 0.583 35 294 41 123
21 0.487 3.800 0.593 39 302 42 128
22 0.430 3.743 0.627 34 298 44 125
23 1.147 1.313 1.167 91 104 83 93
24 1.130 1.167 1.040 90 93 74 85
25 1.013 1.407 1.343 81 112 95 96
26 1.420 1.060 1.293 113 84 91 96
27 1.187 0.857 1.063 95 68 75 79
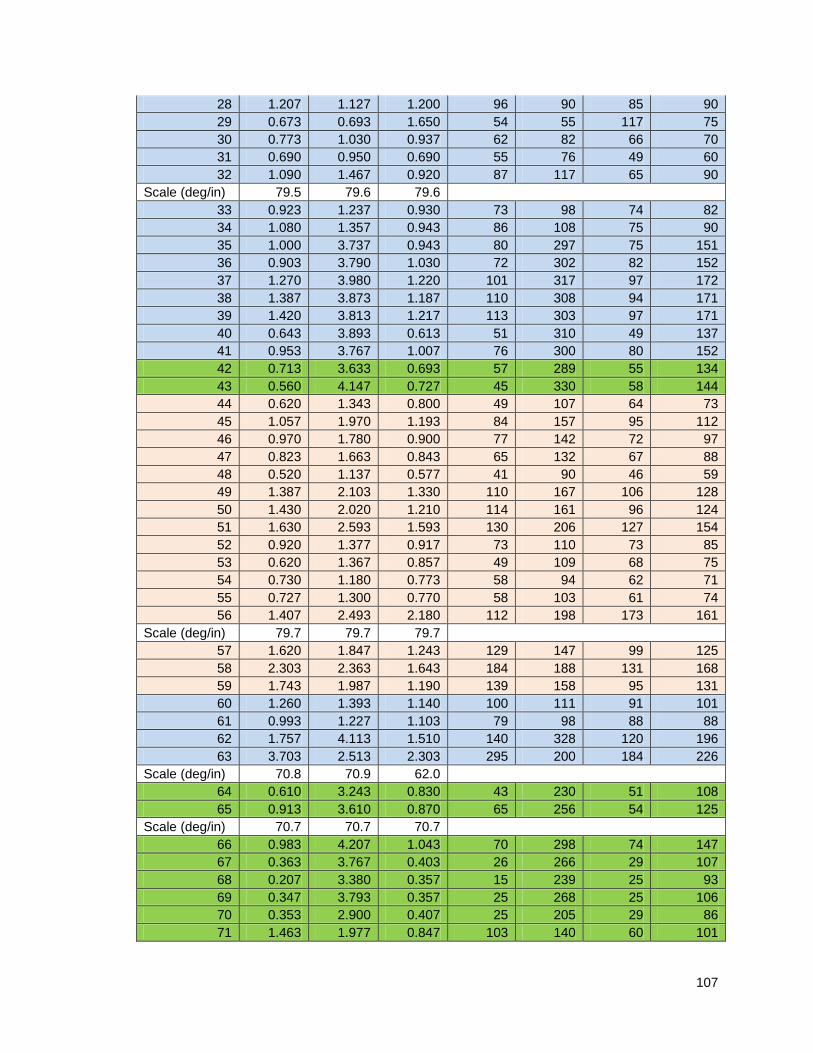
107
28 1.207 1.127 1.200 96 90 85 90
29 0.673 0.693 1.650 54 55 117 75
30 0.773 1.030 0.937 62 82 66 70
31 0.690 0.950 0.690 55 76 49 60
32 1.090 1.467 0.920 87 117 65 90
Scale (deg/in) 79.5 79.6 79.6
33 0.923 1.237 0.930 73 98 74 82
34 1.080 1.357 0.943 86 108 75 90
35 1.000 3.737 0.943 80 297 75 151
36 0.903 3.790 1.030 72 302 82 152
37 1.270 3.980 1.220 101 317 97 172
38 1.387 3.873 1.187 110 308 94 171
39 1.420 3.813 1.217 113 303 97 171
40 0.643 3.893 0.613 51 310 49 137
41 0.953 3.767 1.007 76 300 80 152
42 0.713 3.633 0.693 57 289 55 134
43 0.560 4.147 0.727 45 330 58 144
44 0.620 1.343 0.800 49 107 64 73
45 1.057 1.970 1.193 84 157 95 112
46 0.970 1.780 0.900 77 142 72 97
47 0.823 1.663 0.843 65 132 67 88
48 0.520 1.137 0.577 41 90 46 59
49 1.387 2.103 1.330 110 167 106 128
50 1.430 2.020 1.210 114 161 96 124
51 1.630 2.593 1.593 130 206 127 154
52 0.920 1.377 0.917 73 110 73 85
53 0.620 1.367 0.857 49 109 68 75
54 0.730 1.180 0.773 58 94 62 71
55 0.727 1.300 0.770 58 103 61 74
56 1.407 2.493 2.180 112 198 173 161
Scale (deg/in) 79.7 79.7 79.7
57 1.620 1.847 1.243 129 147 99 125
58 2.303 2.363 1.643 184 188 131 168
59 1.743 1.987 1.190 139 158 95 131
60 1.260 1.393 1.140 100 111 91 101
61 0.993 1.227 1.103 79 98 88 88
62 1.757 4.113 1.510 140 328 120 196
63 3.703 2.513 2.303 295 200 184 226
Scale (deg/in) 70.8 70.9 62.0
64 0.610 3.243 0.830 43 230 51 108
65 0.913 3.610 0.870 65 256 54 125
Scale (deg/in) 70.7 70.7 70.7
66 0.983 4.207 1.043 70 298 74 147
67 0.363 3.767 0.403 26 266 29 107
68 0.207 3.380 0.357 15 239 25 93
69 0.347 3.793 0.357 25 268 25 106
70 0.353 2.900 0.407 25 205 29 86
71 1.463 1.977 0.847 103 140 60 101
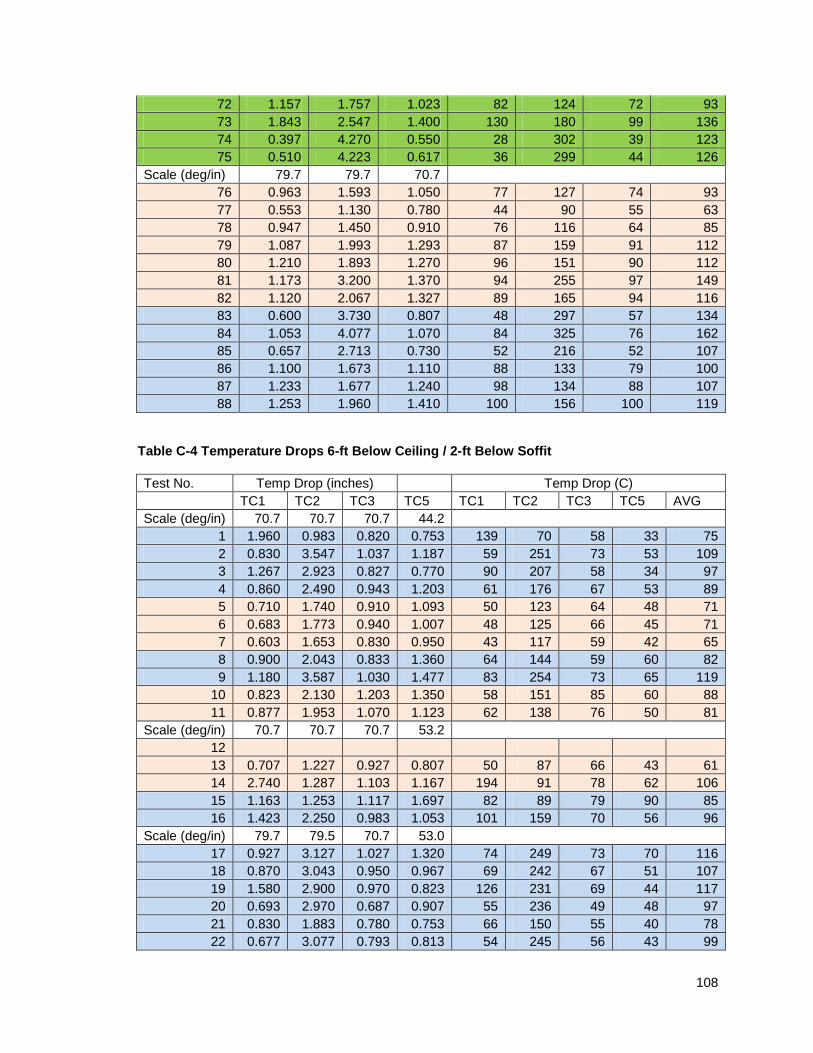
108
72 1.157 1.757 1.023 82 124 72 93
73 1.843 2.547 1.400 130 180 99 136
74 0.397 4.270 0.550 28 302 39 123
75 0.510 4.223 0.617 36 299 44 126
Scale (deg/in) 79.7 79.7 70.7
76 0.963 1.593 1.050 77 127 74 93
77 0.553 1.130 0.780 44 90 55 63
78 0.947 1.450 0.910 76 116 64 85
79 1.087 1.993 1.293 87 159 91 112
80 1.210 1.893 1.270 96 151 90 112
81 1.173 3.200 1.370 94 255 97 149
82 1.120 2.067 1.327 89 165 94 116
83 0.600 3.730 0.807 48 297 57 134
84 1.053 4.077 1.070 84 325 76 162
85 0.657 2.713 0.730 52 216 52 107
86 1.100 1.673 1.110 88 133 79 100
87 1.233 1.677 1.240 98 134 88 107
88 1.253 1.960 1.410 100 156 100 119
Table C-4 Temperature Drops 6-ft Below Ceiling / 2-ft Below Soffit
Test No. Temp Drop (inches) Temp Drop (C)
TC1 TC2 TC3 TC5 TC1 TC2 TC3 TC5 AVG
Scale (deg/in) 70.7 70.7 70.7 44.2
1 1.960 0.983 0.820 0.753 139 70 58 33 75
2 0.830 3.547 1.037 1.187 59 251 73 53 109
3 1.267 2.923 0.827 0.770 90 207 58 34 97
4 0.860 2.490 0.943 1.203 61 176 67 53 89
5 0.710 1.740 0.910 1.093 50 123 64 48 71
6 0.683 1.773 0.940 1.007 48 125 66 45 71
7 0.603 1.653 0.830 0.950 43 117 59 42 65
8 0.900 2.043 0.833 1.360 64 144 59 60 82
9 1.180 3.587 1.030 1.477 83 254 73 65 119
10 0.823 2.130 1.203 1.350 58 151 85 60 88
11 0.877 1.953 1.070 1.123 62 138 76 50 81
Scale (deg/in) 70.7 70.7 70.7 53.2
12
13 0.707 1.227 0.927 0.807 50 87 66 43 61
14 2.740 1.287 1.103 1.167 194 91 78 62 106
15 1.163 1.253 1.117 1.697 82 89 79 90 85
16 1.423 2.250 0.983 1.053 101 159 70 56 96
Scale (deg/in) 79.7 79.5 70.7 53.0
17 0.927 3.127 1.027 1.320 74 249 73 70 116
18 0.870 3.043 0.950 0.967 69 242 67 51 107
19 1.580 2.900 0.970 0.823 126 231 69 44 117
20 0.693 2.970 0.687 0.907 55 236 49 48 97
21 0.830 1.883 0.780 0.753 66 150 55 40 78
22 0.677 3.077 0.793 0.813 54 245 56 43 99
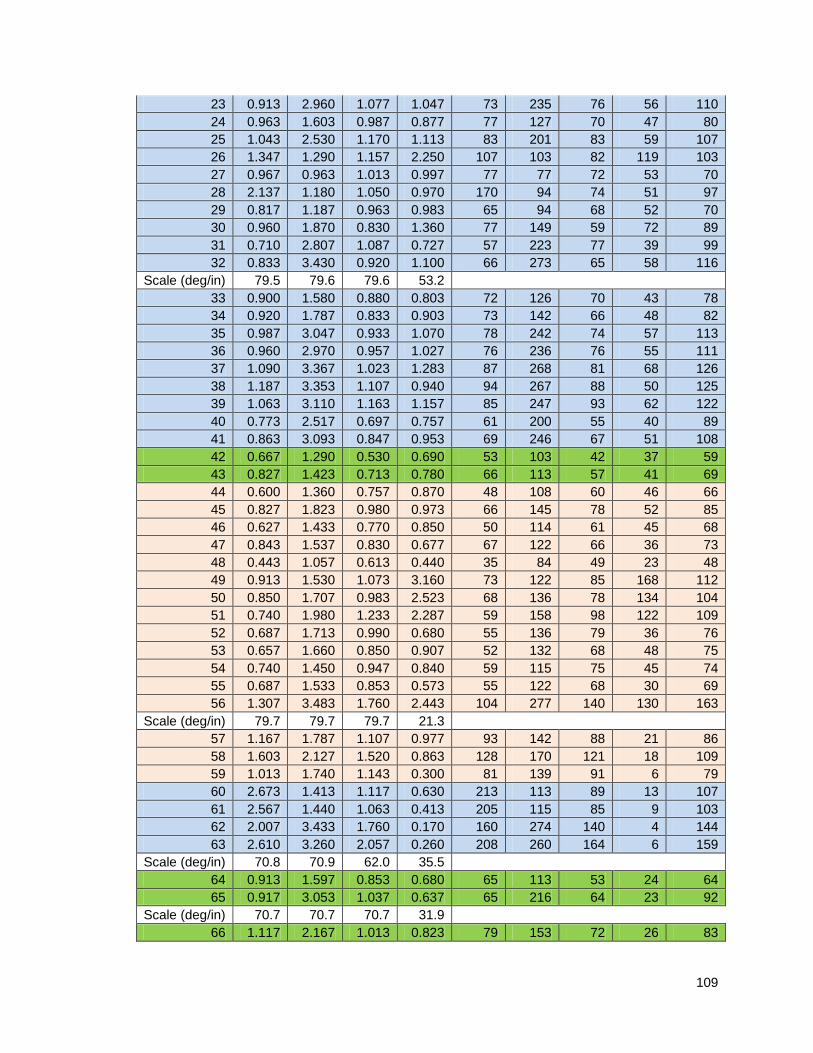
109
23 0.913 2.960 1.077 1.047 73 235 76 56 110
24 0.963 1.603 0.987 0.877 77 127 70 47 80
25 1.043 2.530 1.170 1.113 83 201 83 59 107
26 1.347 1.290 1.157 2.250 107 103 82 119 103
27 0.967 0.963 1.013 0.997 77 77 72 53 70
28 2.137 1.180 1.050 0.970 170 94 74 51 97
29 0.817 1.187 0.963 0.983 65 94 68 52 70
30 0.960 1.870 0.830 1.360 77 149 59 72 89
31 0.710 2.807 1.087 0.727 57 223 77 39 99
32 0.833 3.430 0.920 1.100 66 273 65 58 116
Scale (deg/in) 79.5 79.6 79.6 53.2
33 0.900 1.580 0.880 0.803 72 126 70 43 78
34 0.920 1.787 0.833 0.903 73 142 66 48 82
35 0.987 3.047 0.933 1.070 78 242 74 57 113
36 0.960 2.970 0.957 1.027 76 236 76 55 111
37 1.090 3.367 1.023 1.283 87 268 81 68 126
38 1.187 3.353 1.107 0.940 94 267 88 50 125
39 1.063 3.110 1.163 1.157 85 247 93 62 122
40 0.773 2.517 0.697 0.757 61 200 55 40 89
41 0.863 3.093 0.847 0.953 69 246 67 51 108
42 0.667 1.290 0.530 0.690 53 103 42 37 59
43 0.827 1.423 0.713 0.780 66 113 57 41 69
44 0.600 1.360 0.757 0.870 48 108 60 46 66
45 0.827 1.823 0.980 0.973 66 145 78 52 85
46 0.627 1.433 0.770 0.850 50 114 61 45 68
47 0.843 1.537 0.830 0.677 67 122 66 36 73
48 0.443 1.057 0.613 0.440 35 84 49 23 48
49 0.913 1.530 1.073 3.160 73 122 85 168 112
50 0.850 1.707 0.983 2.523 68 136 78 134 104
51 0.740 1.980 1.233 2.287 59 158 98 122 109
52 0.687 1.713 0.990 0.680 55 136 79 36 76
53 0.657 1.660 0.850 0.907 52 132 68 48 75
54 0.740 1.450 0.947 0.840 59 115 75 45 74
55 0.687 1.533 0.853 0.573 55 122 68 30 69
56 1.307 3.483 1.760 2.443 104 277 140 130 163
Scale (deg/in) 79.7 79.7 79.7 21.3
57 1.167 1.787 1.107 0.977 93 142 88 21 86
58 1.603 2.127 1.520 0.863 128 170 121 18 109
59 1.013 1.740 1.143 0.300 81 139 91 6 79
60 2.673 1.413 1.117 0.630 213 113 89 13 107
61 2.567 1.440 1.063 0.413 205 115 85 9 103
62 2.007 3.433 1.760 0.170 160 274 140 4 144
63 2.610 3.260 2.057 0.260 208 260 164 6 159
Scale (deg/in) 70.8 70.9 62.0 35.5
64 0.913 1.597 0.853 0.680 65 113 53 24 64
65 0.917 3.053 1.037 0.637 65 216 64 23 92
Scale (deg/in) 70.7 70.7 70.7 31.9
66 1.117 2.167 1.013 0.823 79 153 72 26 83
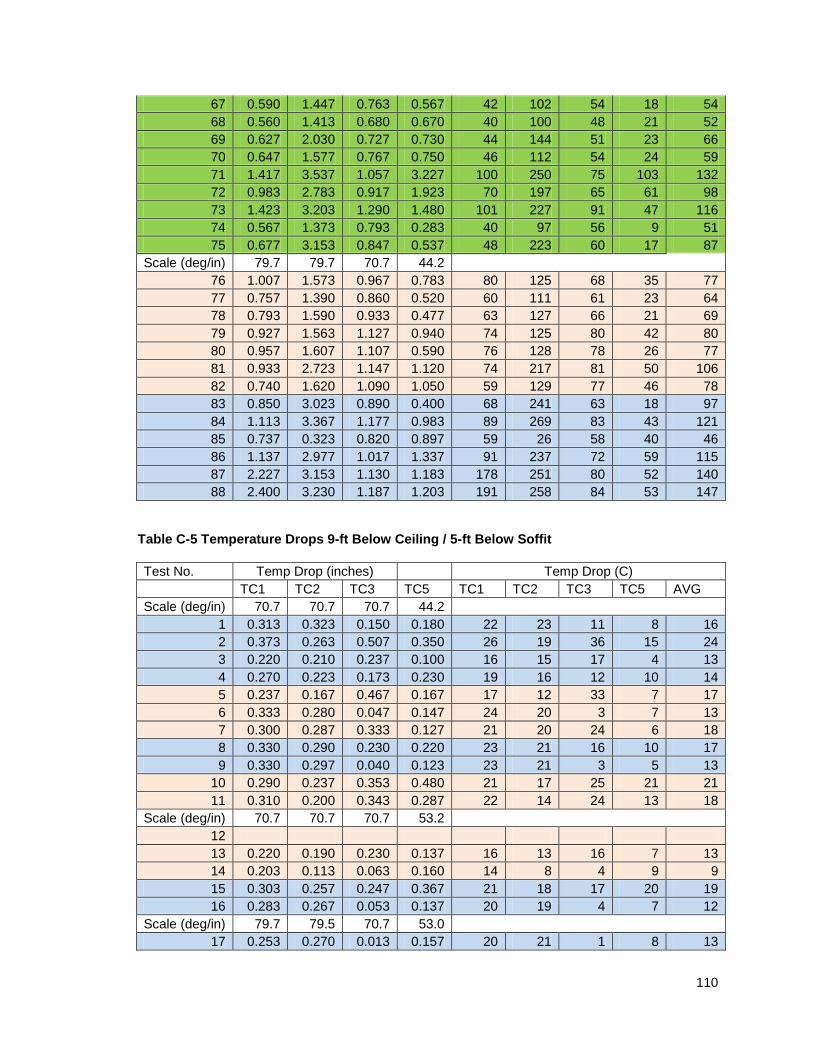
110
67 0.590 1.447 0.763 0.567 42 102 54 18 54
68 0.560 1.413 0.680 0.670 40 100 48 21 52
69 0.627 2.030 0.727 0.730 44 144 51 23 66
70 0.647 1.577 0.767 0.750 46 112 54 24 59
71 1.417 3.537 1.057 3.227 100 250 75 103 132
72 0.983 2.783 0.917 1.923 70 197 65 61 98
73 1.423 3.203 1.290 1.480 101 227 91 47 116
74 0.567 1.373 0.793 0.283 40 97 56 9 51
75 0.677 3.153 0.847 0.537 48 223 60 17 87
Scale (deg/in) 79.7 79.7 70.7 44.2
76 1.007 1.573 0.967 0.783 80 125 68 35 77
77 0.757 1.390 0.860 0.520 60 111 61 23 64
78 0.793 1.590 0.933 0.477 63 127 66 21 69
79 0.927 1.563 1.127 0.940 74 125 80 42 80
80 0.957 1.607 1.107 0.590 76 128 78 26 77
81 0.933 2.723 1.147 1.120 74 217 81 50 106
82 0.740 1.620 1.090 1.050 59 129 77 46 78
83 0.850 3.023 0.890 0.400 68 241 63 18 97
84 1.113 3.367 1.177 0.983 89 269 83 43 121
85 0.737 0.323 0.820 0.897 59 26 58 40 46
86 1.137 2.977 1.017 1.337 91 237 72 59 115
87 2.227 3.153 1.130 1.183 178 251 80 52 140
88 2.400 3.230 1.187 1.203 191 258 84 53 147
Table C-5 Temperature Drops 9-ft Below Ceiling / 5-ft Below Soffit
Test No. Temp Drop (inches) Temp Drop (C)
TC1 TC2 TC3 TC5 TC1 TC2 TC3 TC5 AVG
Scale (deg/in) 70.7 70.7 70.7 44.2
1 0.313 0.323 0.150 0.180 22 23 11 8 16
2 0.373 0.263 0.507 0.350 26 19 36 15 24
3 0.220 0.210 0.237 0.100 16 15 17 4 13
4 0.270 0.223 0.173 0.230 19 16 12 10 14
5 0.237 0.167 0.467 0.167 17 12 33 7 17
6 0.333 0.280 0.047 0.147 24 20 3 7 13
7 0.300 0.287 0.333 0.127 21 20 24 6 18
8 0.330 0.290 0.230 0.220 23 21 16 10 17
9 0.330 0.297 0.040 0.123 23 21 3 5 13
10 0.290 0.237 0.353 0.480 21 17 25 21 21
11 0.310 0.200 0.343 0.287 22 14 24 13 18
Scale (deg/in) 70.7 70.7 70.7 53.2
12
13 0.220 0.190 0.230 0.137 16 13 16 7 13
14 0.203 0.113 0.063 0.160 14 8 4 9 9
15 0.303 0.257 0.247 0.367 21 18 17 20 19
16 0.283 0.267 0.053 0.137 20 19 4 7 12
Scale (deg/in) 79.7 79.5 70.7 53.0
17 0.253 0.270 0.013 0.157 20 21 1 8 13
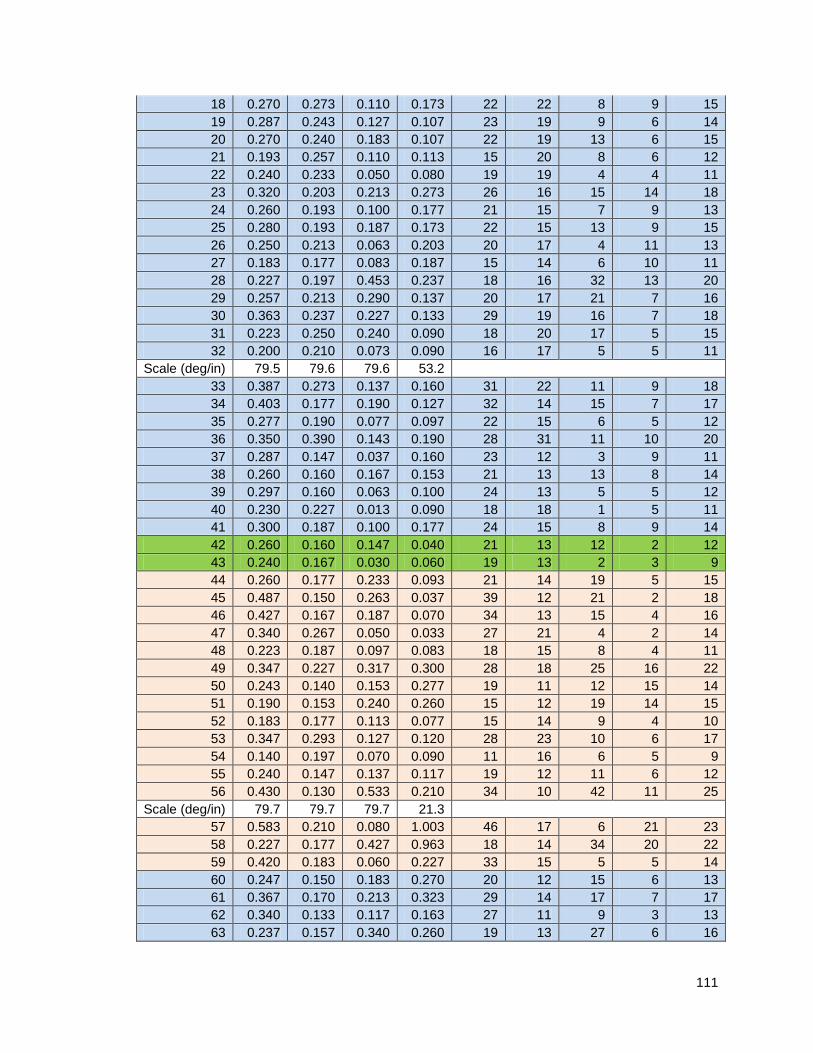
111
18 0.270 0.273 0.110 0.173 22 22 8 9 15
19 0.287 0.243 0.127 0.107 23 19 9 6 14
20 0.270 0.240 0.183 0.107 22 19 13 6 15
21 0.193 0.257 0.110 0.113 15 20 8 6 12
22 0.240 0.233 0.050 0.080 19 19 4 4 11
23 0.320 0.203 0.213 0.273 26 16 15 14 18
24 0.260 0.193 0.100 0.177 21 15 7 9 13
25 0.280 0.193 0.187 0.173 22 15 13 9 15
26 0.250 0.213 0.063 0.203 20 17 4 11 13
27 0.183 0.177 0.083 0.187 15 14 6 10 11
28 0.227 0.197 0.453 0.237 18 16 32 13 20
29 0.257 0.213 0.290 0.137 20 17 21 7 16
30 0.363 0.237 0.227 0.133 29 19 16 7 18
31 0.223 0.250 0.240 0.090 18 20 17 5 15
32 0.200 0.210 0.073 0.090 16 17 5 5 11
Scale (deg/in) 79.5 79.6 79.6 53.2
33 0.387 0.273 0.137 0.160 31 22 11 9 18
34 0.403 0.177 0.190 0.127 32 14 15 7 17
35 0.277 0.190 0.077 0.097 22 15 6 5 12
36 0.350 0.390 0.143 0.190 28 31 11 10 20
37 0.287 0.147 0.037 0.160 23 12 3 9 11
38 0.260 0.160 0.167 0.153 21 13 13 8 14
39 0.297 0.160 0.063 0.100 24 13 5 5 12
40 0.230 0.227 0.013 0.090 18 18 1 5 11
41 0.300 0.187 0.100 0.177 24 15 8 9 14
42 0.260 0.160 0.147 0.040 21 13 12 2 12
43 0.240 0.167 0.030 0.060 19 13 2 3 9
44 0.260 0.177 0.233 0.093 21 14 19 5 15
45 0.487 0.150 0.263 0.037 39 12 21 2 18
46 0.427 0.167 0.187 0.070 34 13 15 4 16
47 0.340 0.267 0.050 0.033 27 21 4 2 14
48 0.223 0.187 0.097 0.083 18 15 8 4 11
49 0.347 0.227 0.317 0.300 28 18 25 16 22
50 0.243 0.140 0.153 0.277 19 11 12 15 14
51 0.190 0.153 0.240 0.260 15 12 19 14 15
52 0.183 0.177 0.113 0.077 15 14 9 4 10
53 0.347 0.293 0.127 0.120 28 23 10 6 17
54 0.140 0.197 0.070 0.090 11 16 6 5 9
55 0.240 0.147 0.137 0.117 19 12 11 6 12
56 0.430 0.130 0.533 0.210 34 10 42 11 25
Scale (deg/in) 79.7 79.7 79.7 21.3
57 0.583 0.210 0.080 1.003 46 17 6 21 23
58 0.227 0.177 0.427 0.963 18 14 34 20 22
59 0.420 0.183 0.060 0.227 33 15 5 5 14
60 0.247 0.150 0.183 0.270 20 12 15 6 13
61 0.367 0.170 0.213 0.323 29 14 17 7 17
62 0.340 0.133 0.117 0.163 27 11 9 3 13
63 0.237 0.157 0.340 0.260 19 13 27 6 16
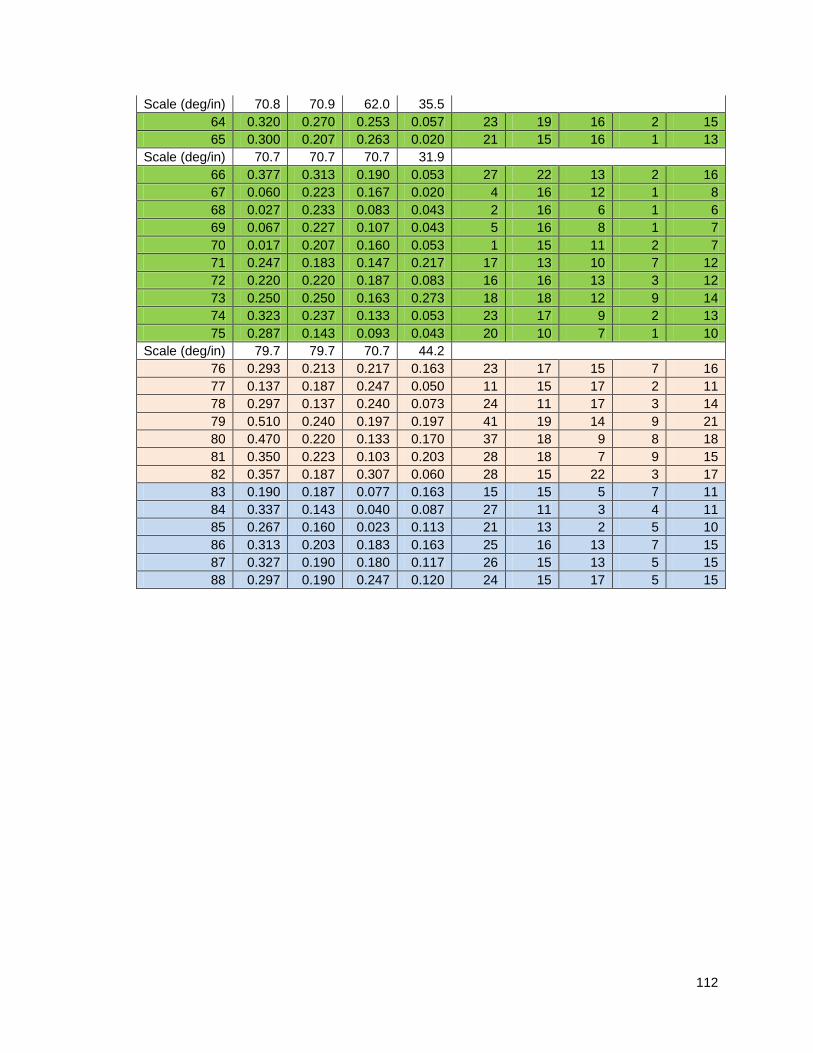
112
Scale (deg/in) 70.8 70.9 62.0 35.5
64 0.320 0.270 0.253 0.057 23 19 16 2 15
65 0.300 0.207 0.263 0.020 21 15 16 1 13
Scale (deg/in) 70.7 70.7 70.7 31.9
66 0.377 0.313 0.190 0.053 27 22 13 2 16
67 0.060 0.223 0.167 0.020 4 16 12 1 8
68 0.027 0.233 0.083 0.043 2 16 6 1 6
69 0.067 0.227 0.107 0.043 5 16 8 1 7
70 0.017 0.207 0.160 0.053 1 15 11 2 7
71 0.247 0.183 0.147 0.217 17 13 10 7 12
72 0.220 0.220 0.187 0.083 16 16 13 3 12
73 0.250 0.250 0.163 0.273 18 18 12 9 14
74 0.323 0.237 0.133 0.053 23 17 9 2 13
75 0.287 0.143 0.093 0.043 20 10 7 1 10
Scale (deg/in) 79.7 79.7 70.7 44.2
76 0.293 0.213 0.217 0.163 23 17 15 7 16
77 0.137 0.187 0.247 0.050 11 15 17 2 11
78 0.297 0.137 0.240 0.073 24 11 17 3 14
79 0.510 0.240 0.197 0.197 41 19 14 9 21
80 0.470 0.220 0.133 0.170 37 18 9 8 18
81 0.350 0.223 0.103 0.203 28 18 7 9 15
82 0.357 0.187 0.307 0.060 28 15 22 3 17
83 0.190 0.187 0.077 0.163 15 15 5 7 11
84 0.337 0.143 0.040 0.087 27 11 3 4 11
85 0.267 0.160 0.023 0.113 21 13 2 5 10
86 0.313 0.203 0.183 0.163 25 16 13 7 15
87 0.327 0.190 0.180 0.117 26 15 13 5 15
88 0.297 0.190 0.247 0.120 24 15 17 5 15
Related Documents