Environ. Sci. Technol. 1988, 22, 548-556 Swackhamer, D. L.; Charles, M. J.; Hites, R. A. Anal. Chem. 1987, 59, 913. Harvey, G. R.; Steinhauer, W. G. Atmos. Environ. 1974, 8, 777-782. Bidleman, T. F.; Olney, E. E. Nature (London) 1975,257, 475-477. Atlas, E.; Giam, C. S. Science (Washington, DE.) 1981,211, 163-165. Ballschmiter, K.; Zell, M. Int. J. Enuiron. Anal. Chem. 1980, 8, 15-35. Swain, W. R. J. Great Lakes Res. 1978, 4, 398-407. Kaminsky, R.; Hites, R. A. Environ. Sci. Technol. 1984,18, 275-279. Eisenreich, S. J.; Hollod, G. J.; Johnson, T. C. Environ. Sci. Technol. 1979, 13, 569-573. Swackhamer, D. L.; McVeety, B. D.; Hites, R. A. Environ. Sci. Technol., in press. Niimi, A. J. Can. J. Fish. Aquat. Sci. 1983, 40, 306-312. Neely, W. B.; Branson, D. R.; Blau, G. E. Enuiron. Sei. Technol. 1984,8, 1113-1115. Chiou, C. T.; Freed, V. H.; Schmedding,D. W.; Kohnert, R. L. Enuiron. Sei. Technol. 1977, 11, 475-478. Veith, G. D.; DeFoe, D. L.; Bergstedt, B. V. J. Fish. Res. Board Can. 1979, 36, 1040-1048. Kenaga, E. E. Environ. Sei. Technol. 1980,14, 553-556. Konemann, H.; Leeuwen, K. V. Chemosphere 1980,9,3-19. Mackay, D. Environ. Sei. Technol. 1982,16, 274-278. Chiou, C. T. Enuiron. Sei. Technol. 1985, 19, 57-62. (30) Oliver,B. G.; Niimi, A. J. Environ. Sei. Technol. 1983,17, (31) Thomann, R. V.; Connolly, J. P. Environ. Sei. Technol. (32) Weininger, D. Ph.D. Dissertation, University of Wisconsin, Madison, WI, 1978. (33) Farrington, J. W.; Westall, J. In The Role of the Oceans as a Waste Disposal Option; Kullenberg, G., Ed.; Reidel Dordrecht, The Netherlands, 1986; pp 361-425. (34) Farrington, J. W.; Davis, A. C.; Brownawell, B. J.; Tripp, B. W.; Clifford, C. H.; Livramento, J. B. In Organic Marine Geochemistry; Sohn, M. L., Ed.; ACS Symposium Series 305; American Chemical Society: Washington, DC, 1986; (35) Kuehl, D. W.; Cook, P. M.; Batterman, A. R.; Lothenbach, D. B. Chemosphere 1985, 14,427-437. (36) Opperhuizen, A,; van der Velde, E. W.; Gobas, F. A. P. C.; Liem, D. A. K.; van der Steen, J. M. D. Chemosphere 1985, (37) Opperhuizen, A. Ph.D. Dissertation, University of Am- (38) Matsuo, M. Chemosphere 1980, 9, 671-675. 287-291. 1984,18,65-71. pp 174-197. 14, 1871-1896. sterdam, Netherlands, 1986. Received for review February 10, 1987. Revised manuscript received November 3, 1987. Accepted December 16, 1987. This work was supported by the US. Environmental Protection Agency through Grant R808865. Comparative Toxicology for Risk Assessment of Marine Fishes and Crustaceanst Glenn W. Suter I I * and Aaron E. Rosen Environmental Sciences Division, Oak Ridge National Laboratory, Oak Ridge, Tennessee 3783 1 W The goal of this study was to collect data on the effects of chemicals on marine fishes and crustaceans and to evaluate the predictive power of the data for assessing risks to marine resources. The data sets consisted of acute median lethal concentrations (LC50s) and chronic maxi- mum acceptable toxicant concentrations (MATCs). They were analyzed with regression models and simple com- parisons. The conclusions include the following: (1) the variability found in the marine data was comparable to that found in freshwater data; (2) the standard marine test fish Cyprinodon uariegatus appears to be representative of marine fishes; (3) the responses of marine crustaceans are so highly diverse that the concept of a representative crustacean is questionable; (4) mysid and penaeid shrimp appear to be particularly sensitive to toxic chemicals. These conclusions are subject to the constraints of the existing limited data base and should be confirmed by a systematic study of the relative sensitivity of marine or- ganisms to chemicals with diverse modes of action. Introduction Fishes and crustaceans inhabiting coastal marine waters are subject to the effects of a variety of pollutants plus habitat loss, harvesting, entrainment in water intakes, and natural stresses. Changes in the abundance of these or- ganisms are apparent but difficult to explain. The goal of this study was to collect data on the effects of chemicals on marine fishes and crustaceans and evaluate the pre- dictive power of the data using environmental risk as- ‘Publication No. 2792, Environmental Sciences Division, Oak Ridge National Laboratory. sessment methods developed for the U.S. Environmental Protection Agency (EPA) (1). The results would be a tool for determining where pollutants may be affecting coastal stocks of fishes and crustaceans. The specific objectives were as follows: (1) to evaluate the utility of existing marine toxicity data for developing the types of taxonomic and acute-chronic extrapolation formulas that have been used for risk analysis of toxic effects on freshwater organisms (2,3), (2) to examine the representativeness of the standard marine test species, (3) to compare the relative sensitivities of toxicants of different marine species, (4) to evaluate the feasibility of extrapo- lating from freshwater to marine species. Methods Data Sets. We used four data sets in this study. The first is a marine chronic toxicity data set consigting of data from studies reporting acceptable life cycle, partial life cycle, or early life stage maximum acceptable toxicant concentrations (MATCs) for marine or estuarine fishes or crustaceans. The MATC is the geometric mean of the lowest concentration producing a statistically significant effect and the highest concentrationproducing no such effect on survival, growth, or fecundity in any life stage in a life cycle, partial life cycle, or early life stage test. It is used as a threshold for toxic effects in exposures of indefinite duration but does not correspond to any par- ticular level or type of effect on any particular life stage. The MATCs and associated 96-h median lethal concen- trations (LC508) for 114 species-chemical pairs are listed in Table I. The second is an equivalent set of chronic data for freshwater fishes, containing the results of 177 chronic tets (1). The third is a set of chronic data (MATCs and 548 Environ. Sci. Technol., Vol. 22, No. 5, 1988 0013-936X/88/0922-0548$01.50/0 @ 1988 American Chemical Society

Welcome message from author
This document is posted to help you gain knowledge. Please leave a comment to let me know what you think about it! Share it to your friends and learn new things together.
Transcript
Environ. Sci. Technol. 1988, 22, 548-556
Swackhamer, D. L.; Charles, M. J.; Hites, R. A. Anal. Chem. 1987, 59, 913. Harvey, G. R.; Steinhauer, W. G. Atmos. Environ. 1974, 8, 777-782. Bidleman, T. F.; Olney, E. E. Nature (London) 1975,257, 475-477. Atlas, E.; Giam, C. S. Science (Washington, DE. ) 1981,211, 163-165. Ballschmiter, K.; Zell, M. Int. J. Enuiron. Anal. Chem. 1980, 8, 15-35. Swain, W. R. J. Great Lakes Res. 1978, 4, 398-407. Kaminsky, R.; Hites, R. A. Environ. Sci. Technol. 1984,18, 275-279. Eisenreich, S. J.; Hollod, G. J.; Johnson, T. C. Environ. Sci. Technol. 1979, 13, 569-573. Swackhamer, D. L.; McVeety, B. D.; Hites, R. A. Environ. Sci. Technol., in press. Niimi, A. J. Can. J. Fish. Aquat. Sci. 1983, 40, 306-312. Neely, W. B.; Branson, D. R.; Blau, G. E. Enuiron. Sei. Technol. 1984,8, 1113-1115. Chiou, C. T.; Freed, V. H.; Schmedding, D. W.; Kohnert, R. L. Enuiron. Sei. Technol. 1977, 11, 475-478. Veith, G. D.; DeFoe, D. L.; Bergstedt, B. V. J. Fish. Res. Board Can. 1979, 36, 1040-1048. Kenaga, E. E. Environ. Sei. Technol. 1980,14, 553-556. Konemann, H.; Leeuwen, K. V. Chemosphere 1980,9,3-19. Mackay, D. Environ. Sei. Technol. 1982,16, 274-278. Chiou, C. T. Enuiron. Sei. Technol. 1985, 19, 57-62.
(30) Oliver, B. G.; Niimi, A. J. Environ. Sei. Technol. 1983,17,
(31) Thomann, R. V.; Connolly, J. P. Environ. Sei. Technol.
(32) Weininger, D. Ph.D. Dissertation, University of Wisconsin, Madison, WI, 1978.
(33) Farrington, J. W.; Westall, J. In The Role of the Oceans as a Waste Disposal Option; Kullenberg, G., Ed.; Reidel Dordrecht, The Netherlands, 1986; pp 361-425.
(34) Farrington, J. W.; Davis, A. C.; Brownawell, B. J.; Tripp, B. W.; Clifford, C. H.; Livramento, J. B. In Organic Marine Geochemistry; Sohn, M. L., Ed.; ACS Symposium Series 305; American Chemical Society: Washington, DC, 1986;
(35) Kuehl, D. W.; Cook, P. M.; Batterman, A. R.; Lothenbach, D. B. Chemosphere 1985, 14,427-437.
(36) Opperhuizen, A,; van der Velde, E. W.; Gobas, F. A. P. C.; Liem, D. A. K.; van der Steen, J. M. D. Chemosphere 1985,
(37) Opperhuizen, A. Ph.D. Dissertation, University of Am-
(38) Matsuo, M. Chemosphere 1980, 9, 671-675.
287-291.
1984,18,65-71.
pp 174-197.
14, 1871-1896.
sterdam, Netherlands, 1986.
Received for review February 10, 1987. Revised manuscript received November 3, 1987. Accepted December 16, 1987. This work was supported by the US. Environmental Protection Agency through Grant R808865.
Comparative Toxicology for Risk Assessment of Marine Fishes and Crust aceanst
Glenn W. Suter I I * and Aaron E. Rosen
Environmental Sciences Division, Oak Ridge National Laboratory, Oak Ridge, Tennessee 3783 1
W The goal of this study was to collect data on the effects of chemicals on marine fishes and crustaceans and to evaluate the predictive power of the data for assessing risks to marine resources. The data sets consisted of acute median lethal concentrations (LC50s) and chronic maxi- mum acceptable toxicant concentrations (MATCs). They were analyzed with regression models and simple com- parisons. The conclusions include the following: (1) the variability found in the marine data was comparable to that found in freshwater data; (2) the standard marine test fish Cyprinodon uariegatus appears to be representative of marine fishes; (3) the responses of marine crustaceans are so highly diverse that the concept of a representative crustacean is questionable; (4) mysid and penaeid shrimp appear to be particularly sensitive to toxic chemicals. These conclusions are subject to the constraints of the existing limited data base and should be confirmed by a systematic study of the relative sensitivity of marine or- ganisms to chemicals with diverse modes of action.
Introduction Fishes and crustaceans inhabiting coastal marine waters
are subject to the effects of a variety of pollutants plus habitat loss, harvesting, entrainment in water intakes, and natural stresses. Changes in the abundance of these or- ganisms are apparent but difficult to explain. The goal of this study was to collect data on the effects of chemicals on marine fishes and crustaceans and evaluate the pre- dictive power of the data using environmental risk as-
‘Publication No. 2792, Environmental Sciences Division, Oak Ridge National Laboratory.
sessment methods developed for the U.S. Environmental Protection Agency (EPA) (1). The results would be a tool for determining where pollutants may be affecting coastal stocks of fishes and crustaceans.
The specific objectives were as follows: (1) to evaluate the utility of existing marine toxicity data for developing the types of taxonomic and acute-chronic extrapolation formulas that have been used for risk analysis of toxic effects on freshwater organisms ( 2 , 3 ) , (2) to examine the representativeness of the standard marine test species, (3) to compare the relative sensitivities of toxicants of different marine species, (4) to evaluate the feasibility of extrapo- lating from freshwater to marine species.
Methods Data Sets. We used four data sets in this study. The
first is a marine chronic toxicity data set consigting of data from studies reporting acceptable life cycle, partial life cycle, or early life stage maximum acceptable toxicant concentrations (MATCs) for marine or estuarine fishes or crustaceans. The MATC is the geometric mean of the lowest concentration producing a statistically significant effect and the highest concentrationproducing no such effect on survival, growth, or fecundity in any life stage in a life cycle, partial life cycle, or early life stage test. It is used as a threshold for toxic effects in exposures of indefinite duration but does not correspond to any par- ticular level or type of effect on any particular life stage. The MATCs and associated 96-h median lethal concen- trations (LC508) for 114 species-chemical pairs are listed in Table I. The second is an equivalent set of chronic data for freshwater fishes, containing the results of 177 chronic tets (1). The third is a set of chronic data (MATCs and
548 Environ. Sci. Technol., Vol. 22, No. 5, 1988 0013-936X/88/0922-0548$01.50/0 @ 1988 American Chemical Society
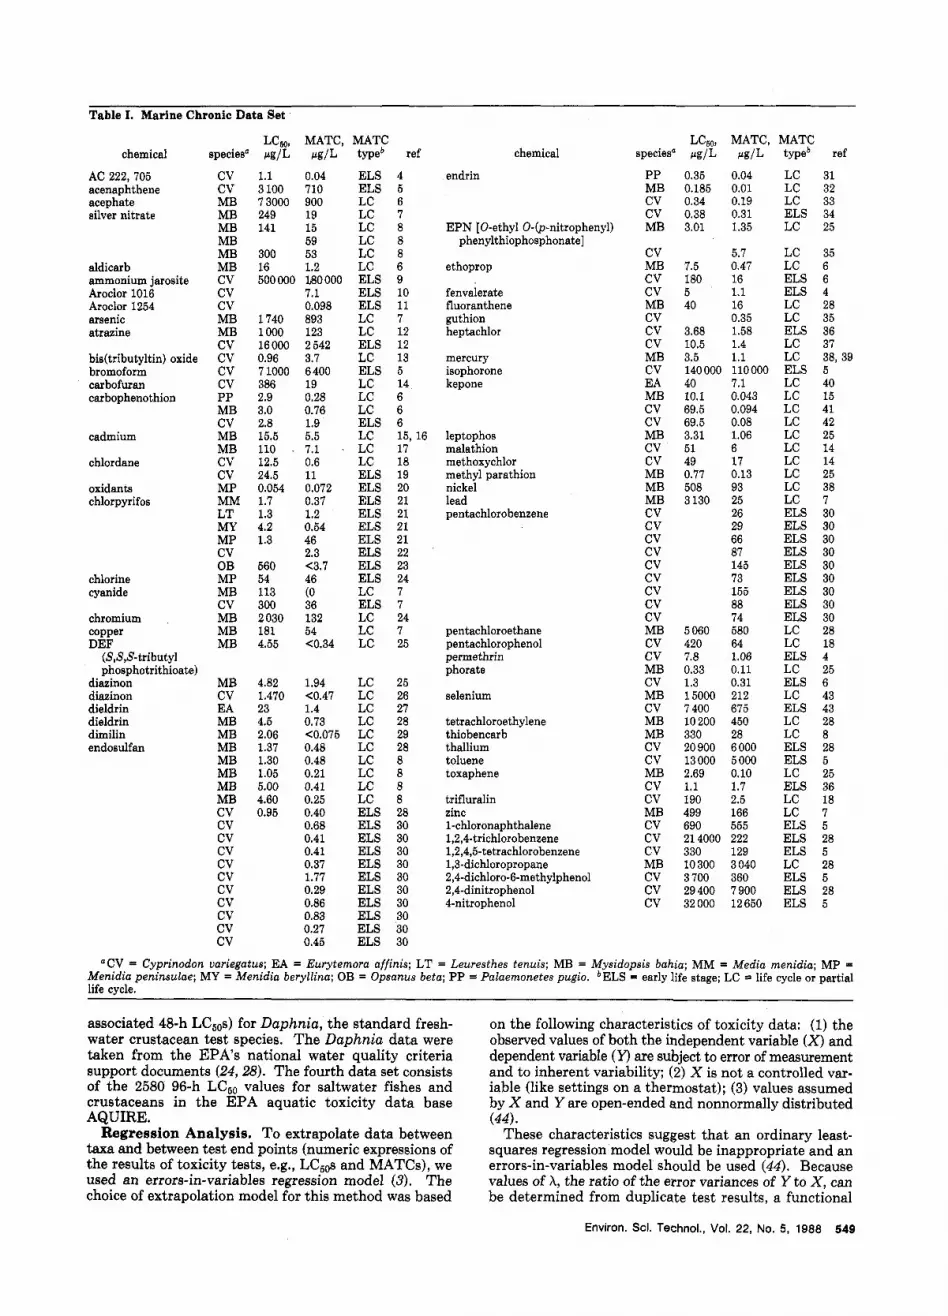
Table 1. Marine Chronic Data Set
chemical
AC 222, 705 acenaphthene acephate silver nitrate
aldicarb ammonium jarosite Aroclor 1016 Aroclor 1254 arsenic atrazine
bis(tributy1tin) oxide bromoform carbofuran carbophenothion
cadmium
chlordane
oxidants chlorpyrifos
chlorine cyanide
chromium copper DEF
(S,S,S-tributyl phosphotrithioate)
diazinon diazinon dieldrin dieldrin dimilin endosulfan
speciesa
cv cv MB MB MB MB MB MB cv cv cv MB MB cv cv cv cv PP MB cv MB MB cv cv MP MM LT MY MP cv OB MP MB cv MB MB MB
MB cv EA MB MB MB MB MB MB MB cv cv cv cv cv cv cv cv cv cv cv
LCW, CCgIL
1.1 3 100 7 3000 249 141
300 16 500 000
1740 1 000 16 000 0.96 7 1000 386 2.9 3.0 2.8 15.5 110 . 12.5 24.5 0.054 1.7 1.3 4.2 1.3
560 54 113 300 2 030 181 4.55
4.82 1.470 23 4.5 2.06 1.37 1.30 1.05 5.00 4.60 0.95
MATC,
0.04 710 900 19 15 59 53 1.2 BO 000 7.1 0.098 893 123 2 542 3.7 6 400 19 0.28 0.76 1.9 5.5 7.1 ~
0.6 11 0.072 0.37 1.2 0.54 46 2.3 <3.7 46 (0 36 132 54 <0.34
CCglL
1.94 <0.47 1.4 0.73 <0.075 0.48 0.48 0.21 0.41 0.26 0.40 0.68 0.41 0.41 0.37 1.77 0.29 0.86 0.83 0.27 0.45
MATC typeb
ELS ELS LC LC LC LC LC LC ELS ELS ELS LC LC ELS LC ELS LC LC LC ELS LC LC LC ELS ELS ELS ELS ELS ELS ELS ELS ELS LC ELS LC LC LC
LC LC LC LC LC LC LC LC LC LC ELS ELS ELS ELS ELS ELS ELS ELS ELS ELS ELS
ref
4 5 6 7 8 8 8 6 9 10 11 7 12 12 13 5 14 6 6 6 15, 16 17 18 19 20 21 21 21 21 22 23 24 7 7 24 7 25
25 26 27 28 29 28 8 8 8 8 28 30 30 30 30 30 30 30 30 30 30
chemical
endrin
EPN [0-ethyl 0-(p-nitrophen phenylthiophosphonate]
ethoprop
fenvalerate fluoranthene guthion heptachlor
mercury isophorone kepone
leptophos malathion methoxychlor methyl parathion nickel lead pentachlorobenzene
pentachloroethane pentachlorophenol permethrin phorate
selenium
tetrachloroethylene thiobencarb thallium toluene toxaphene
trifluralin zinc 1-chloronaphthalene 1,2,4-trichlorobenzene 1,2,4,5-tetrachlorobenzene 1,3-dichloropropane 2,4-dichloro-6-methylphenol 2,4-dinitrophenol 4-nitrophenol
speciesn
PP MB cv cv
iyl) MB
cv MB cv cv MB cv cv cv MB cv EA MB cv cv MB cv cv MB MB MB cv cv cv cv cv cv cv cv cv MB cv cv MB cv MB cv MB MB cv cv MB cv cv MB cv cv cv MB cv cv cv
Lc60, CCdL
0.35 0.185 0.34 0.38 3.01
7.5 180 5 40
3.68 10.5 3.5 140 000 40 10.1 69.5 69.5 3.31 51 49 0.77 508 3 130
5 060 420 7.8 0.33 1.3 15000 7 400 10 200 330 20 900 13 000 2.69 1.1 190 499 690 21 4000 330 10 300 3 700 29 400 32 000
MATC,
0.04 0.01 0.19 0.31 1.35
5.7 0.47 16 1.1 16 0.35 1.58 1.4 1.1 110000 7.1 0.043 0.094 0.08 1.06 6 17 0.13 93 25 26 29 66 87 145 73 155 88 74 580 64 1.06 0.11 0.31 212 675 450 28 6 000 5 000 0.10 1.7 2.5 166 555 222 129 3 040 360 7 900 12 650
P g I L MATC
LC LC LC ELS LC
LC LC ELS ELS LC LC ELS LC LC ELS LC LC LC LC LC LC LC LC LC LC ELS ELS ELS ELS ELS ELS ELS ELS ELS LC LC ELS LC ELS LC ELS LC LC ELS ELS LC ELS LC LC ELS ELS ELS LC ELS ELS ELS
typeb ref
31 32 33 34 25
35 6 6 4 28 35 36 37 38, 39 5 40 15 41 42 25 14 14 25 38 7 30 30 30 30 30 30 30 30 30 28 18 4 25 6 43 43 28 8 28 5 25 36 18 7 5 28 5 28 5 28 5
"CV = Cyprinodon variegatus; EA = Eurytemora affinis; LT = Leuresthes tenuis; MB = Mysidopsis bahia; MM = Media menidia; MP = Menidia peninsulae; MY = Menidia beryllina; OB = Opsanus beta; PP = PaEaemonetes pugio. *ELS = early life stage; LC = life cycle or partial life cvcle.
associated 48-h LC50s) for Daphnia, the standard fresh- water crustacean test species. The Daphnia data were taken from the EPA's national water quality criteria support documents (24,28). The fourth data set consists of the 2580 96-h LCKn values for saltwater fishes and crustaceans in the EPA aquatic toxicity data base AQUIRE. Regression Analysis. To extrapolate data between
taxa and between test end points (numeric expressions of the results of toxicity tests, e.g., LCb0s and MATCs), we used an errors-in-variables regression model (3). The choice of extrapolation model for this method was based
on the following characteristics of toxicity data: (1) the observed values of both the independent variable (X) and dependent variable (Y) are subject to error of measurement and to inherent variability; (2) X is not R controlled var- iable (like settings on a thermostat); (3) values assumed by X and Yare open-ended and nonnormally distributed (44).
These characteristics suggest that an ordinary least- squares regression model would be inappropriate and an errors-in-variables model should be used (44). Because values of A, the ratio of the error variances of Y to X , can be determined from duplicate test results, a functional
Environ. Sci. Technol., Vol. 22, No. 5, 1988 549
errors-in-variables model is identifiable and provides maximum likelihood estimators of the regression param- eters. For further discussion of errors-in-variables re- gression models, see papers by Ricker (44) and Mandel (45).
The estimators of the slope (@) and intercept (a) are b = (Cy2 - XCx2 + [ ( C y 2 - XCx2)2 + 4X(Cxy)2]1/2)/2Cxy
and
where x = X i - X and y = Yi - P for i = 1 ... n. The variance of a single predicted Y value for a given
X value ( X = X,) is the sum of the error variance of Y and the variance of a fitted value as given by Mandel (46). It is estimated as var(YX,) =
sz(l + l / n + [l + (b2/X) l2[(X0 - X ) 2 / C u 2 ] )
where ss = (b2Cx2 - 2bCxy + Cy2)/n - 2 and Cu2 = C x 2 + (2b ) /XCxy + (b/M2Cy2.
This variance is the appropriate value to use in calcu- lating confidence intervals and risk estimates because the interest in this case is the certainty concerning an indi- vidual future observation of Y, such as a toxic threshold for an untested species-chemical combination. This var- iance is larger than the variance on the mean of a yIX,, which in turn is larger than the variance of the regression coefficient. Confidence intervals calculated from this variance are larger than those that are conventionally re- ported and are referred to as prediction intervals (46).
For ease in using this method, we reduce the variance formula to
a = g - b a
var(YXo) = F, + F2(X0 - X ) 2 and, where the inverse regression is useful, the variance of a predicted X value is
var(XIYo) = G1 + G2(Y0 - n2 We provide values for Fl, F2, G1, and G2 in Tables 11, IV, VI, and VII. These variances are used to calculate 95% prediction intervals and can be used in calculating risks of toxic effects (3 ) .
This model requires that A, the ratio of the point vari- ances of Y to x, be estimated. When extrapolating be- tween common bench marks for organisms aggregated at the same taxonomic level, X was set to 1. Otherwise X was set to the ratios of the n-weighted means of the variances of bench marks from replicate tests. When extrapolating from Lcbos to MATCs for fishes, X was set to the ratio of the mean of variances of all sets of replicate fish MATCs to the mean of variances of all sets of replicate fish LC5,s.
Relative Sensitivity. The possibility that certain species might be particularly sensitive or insensitive to toxic chemicals was examined by ranking and by using the ratio LCm(sp.x)/LCm(sp.r), where sp.r is any species in the AQUIRE data set for which there are a t least eight 96-h LC50 values and sp.x is any species that has a 96-h Lc60 for any chemical in common with sp.r. MATC values from the acute-chronic data set were assessed analogously. The geometric mean, standard error, and range of the quotients of these ratios were determined for each sp.r.
General. All the data used in the regressions are log transformed, and the reported results are for the trans- formed values. Log transformations were used to induce homogeneity of variance. Test results expressed as greater than or less than values were not used except for ranking. Where replicate data existed for a single combination of
test type, species, and chemical, one replicate was chosen at random for each analysis (using the mean of replicates would have artificially reduced the variance).
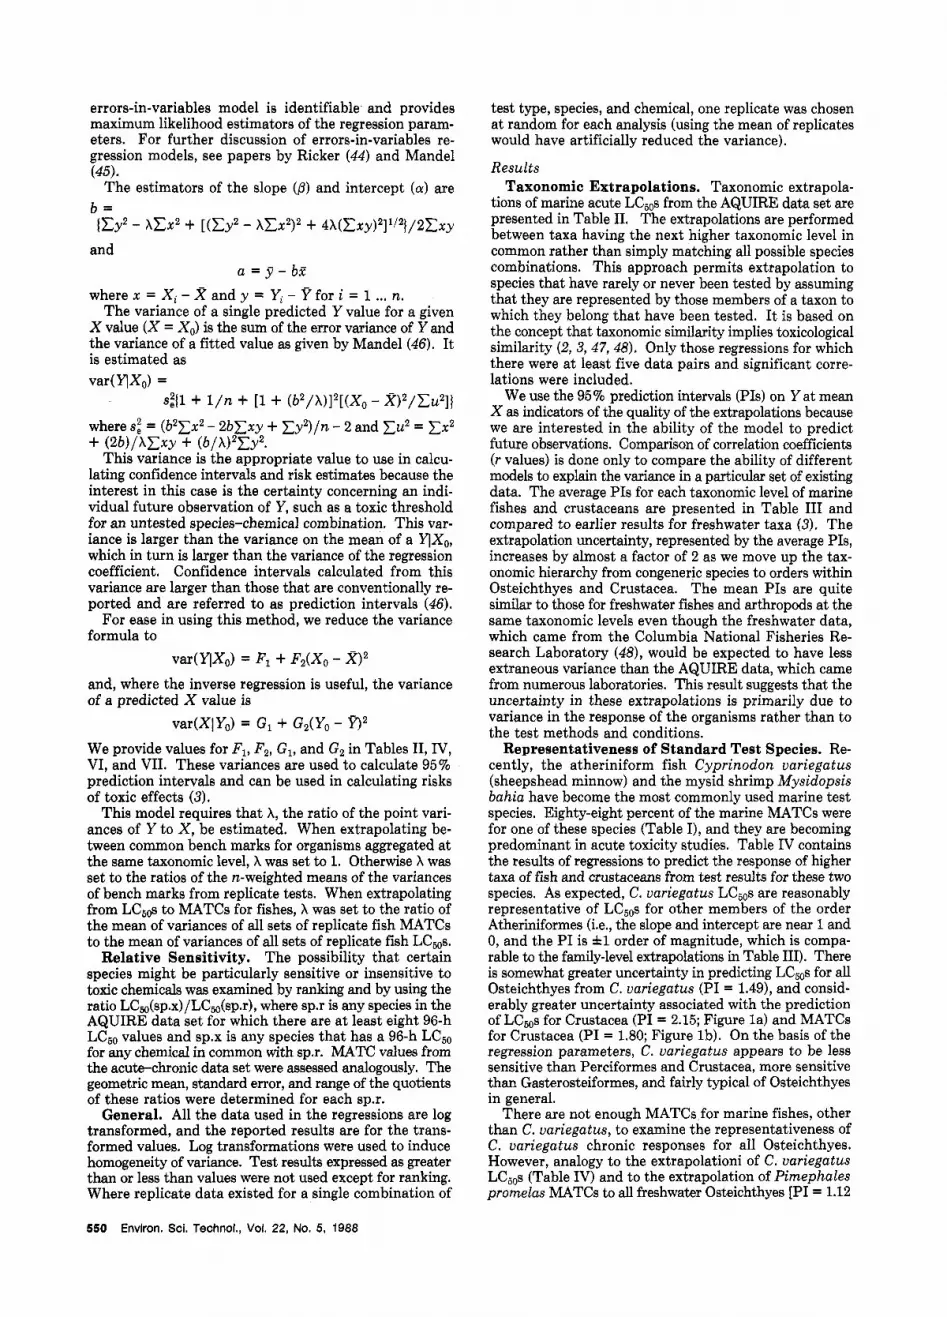
Results Taxonomic Extrapolations. Taxonomic extrapola-
tions of marine acute LC5,s from the AQUIRE data set are presented in Table 11. The extrapolations are performed between taxa having the next higher taxonomic level in common rather than simply matching all possible species combinations. This approach permits extrapolation to species that have rarely or never been tested by assuming that they are represented by those members of a taxon to which they belong that have been tested. I t is based on the concept that taxonomic similarity implies toxicological similarity (2, 3 ,47,48) . Only those regressions for which there were at least five data pairs and significant corre- lations were included.
We use the 95% prediction intervals (PIS) on Y at mean X as indicators of the quality of the extrapolations because we are interested in the ability of the model to predict future observations. Comparison of correlation coefficients (r values) is done only to compare the ability of different models to explain the variance in a particular set of existing data. The average PIS for each taxonomic level of marine fishes and crustaceans are presented in Table I11 and compared to earlier results for freshwater taxa (3). The extrapolation uncertainty, represented by the average PIS, increases by almost a factor of 2 as we move up the tax- onomic hierarchy from congeneric species to orders within Osteichthyes and Crustacea. The mean PIS are quite similar to those for freshwater fishes and arthropods at the same taxonomic levels even though the freshwater data, which came from the Columbia National Fisheries Re- search Laboratory (48), would be expected to have less extraneous variance than the AQUIRE data, which came from numerous laboratories. This result suggests that the uncertainty in these extrapolations is primarily due to variance in the response of the organisms rather than to the test methods and conditions.
Representativeness of Standard Test Species. Re- cently, the atheriniform fish Cyprinodon variegatus (sheepshead minnow) and the mysid shrimp Mysidopsis bahia have become the most commonly used marine test species. Eighty-eight percent of the marine MATCs were for one of these species (Table I), and they are becoming predominant in acute toxicity studies. Table IV contains the results of regressions to predict the response of higher taxa of fish and crustaceans from test results for these two species. As expected, C. variegatus LC5,s are reasonably representative of LCs0s for other members of the order Atheriniformes (i.e., the slope and intercept are near 1 and 0, and the PI is i l order of magnitude, which is compa- rable to the family-level extrapolations in Table 111). There is somewhat greater uncertainty in predicting LCms for all Osteichthyes from C. variegatus (PI = 1.49), and consid- erably greater uncertainty associated with the prediction of LCb0s for Crustacea (PI = 2.15; Figure la) and MATCs for Crustacea (PI = 1.80; Figure Ib). On the basis of the regression parameters, C. variegatus appears to be less sensitive than Perciformes and Crustacea, more sensitive than Gasterosteiformes, and fairly typical of Osteichthyes in general.
There are not enough MATCs for marine fishes, other than C. variegatus, to examine the representativeness of C. variegatus chronic responses for all Osteichthyes. However, analogy to the extrapolationi of C. variegatus LC5,s (Table IV) and to the extrapolation of Pimephales promelas MATCs to all freshwater Osteichthyes [PI = 1.12
550 Envlron. Sci. Technol., VoI. 22, No. 5, 1988
m 3 m O d m m 3 0 ~ m ~ ~ ~ 0 d 3 + 0 0 ~ 0 0 0 0 0 + 0 0 0 0 0 r l 0 0 0 0 000000000000000000
m t - m m t - o + m m m m r l d m m m m ~ 3 3 3 t - o m m m N m m m m d w m 3 0 0 0 0 0 0 0 0 0 0 A 0 0 0 0 0 0 0 0
m 3 w + d d d 3 3 m m 2 8 ~ 8 8 ~ 0 0 0 0 0 0 a y 0 0 0 0 -q '-
a
Environ. Sci. Technol., Vol. 22, No. 5, 1988 551
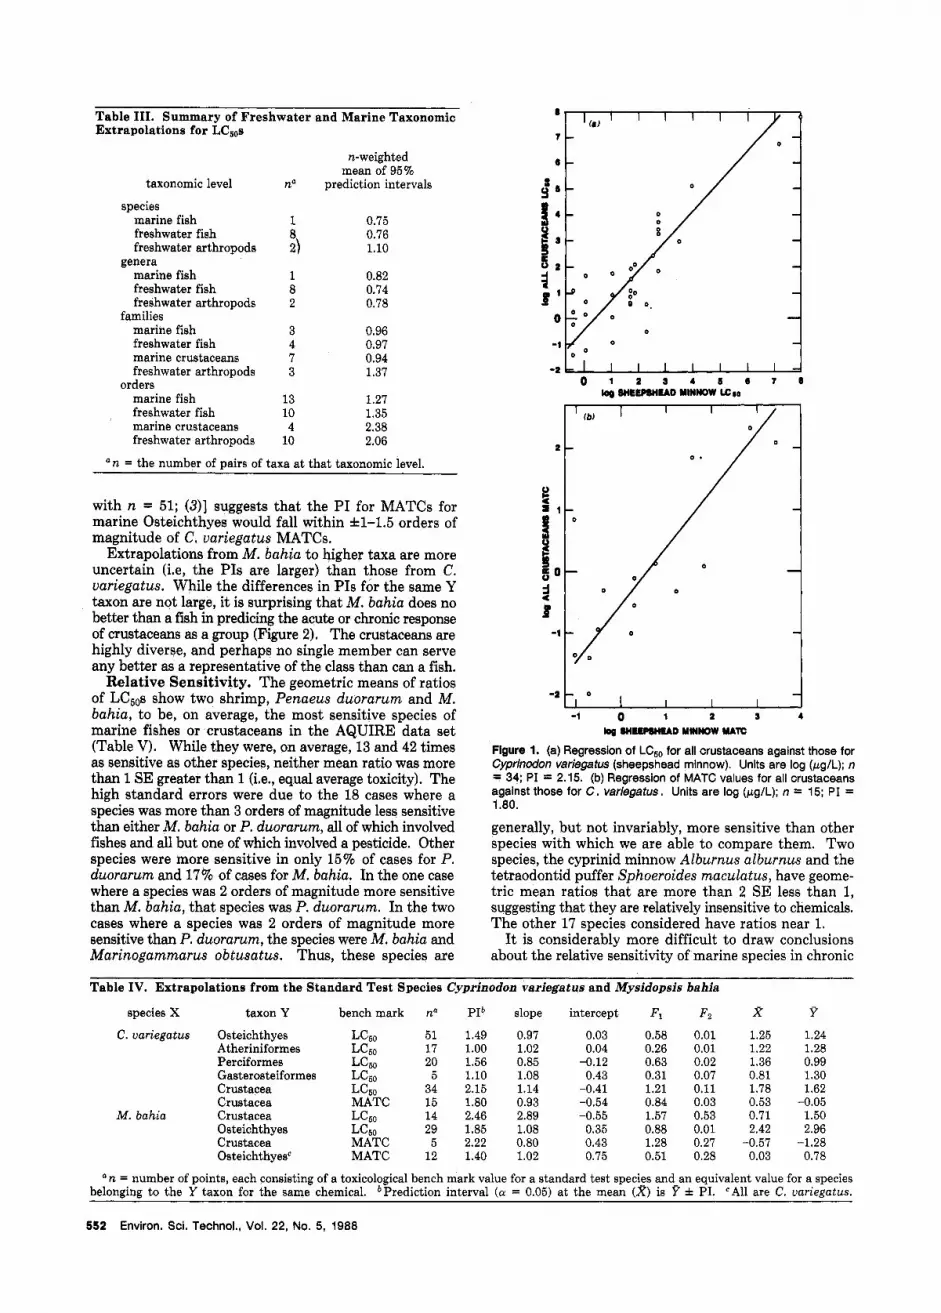
Table 111. Summary of Freshwater and Marine Taxonomic Extrapolations for LCsos
n-weighted mean of 95%
taxonomic level no prediction intervals
species marine fish freshwater fish freshwater arthropods
marine fish freshwater fish freshwater arthropods
marine fish freshwater fish marine crustaceans freshwater arthropods
marine fish freshwater fish marine crustaceans freshwater arthropods
genera
families
orders
1
3 1 8 2
3 4 7 3
13 10 4
10
0.75 0.76 1.10
0.82 0.74 0.78
0.96 0.97 0.94 1.37
1.27 1.35 2.38 2.06
a n = the number of pairs of taxa at that taxonomic level.
with n = 51; (3)] suggests that the PI for MATCs for marine Osteichthyes would fall within f l-1.5 orders of magnitude of C. variegatus MATCs.
Extrapolations from M. bahia to higher taxa are more uncertain (i.e, the PIS are larger) than those from C. uariegatus. While the differences in PIS for the same Y taxon are not large, it is surprising that M. bahia does no better than a fish in predicing the acute or chronic response of crustaceans as a group (Figure 2). The crustaceans are highly diverse, and perhaps no single member can serve any better as a representative of the class than can a fish.
Relative Sensitivity. The geometric means of ratios of LC50s show two shrimp, Penaeus duorarum and M. bahia, to be, on average, the most sensitive species of marine fishes or crustaceans in the AQUIRE data set (Table V). While they were, on average, 13 and 42 times as sensitive as other species, neither mean ratio was more than 1 SE greater than 1 (Le., equal average toxicity). The high standard errors were due to the 18 cases where a species was more than 3 orders of magnitude less sensitive than either M. bahia or P. duorarum, all of which involved fishes and all but one of which involved a pesticide. Other species were more sensitive in only 15% of cases for P. duorarum and 17% of cases for M. bahia. In the one case where a species was 2 orders of magnitude more sensitive than M. bahia, that species was P. duorarum. In the two cases where a species was 2 orders of magnitude more sensitive than P. duorarum, the species were M. bahia and Marinogammarus obtusatus. Thus, these species are
-2 0 I I I I 1 -1 0 1 2 5 4
lop WEWWIUD MINNOW NATC
Flgure 1. (a) Regresslon of LCs0 for all crustaceans against those for Cyprinw‘on variegatus (sheepshead minnow). Units are log (pgIL); n = 34; P I = 2.15. (b) Regression of MATC values for all crustaceans against those for C. variegatus. Units are log (pgIL); n = 15; P I = 1.80.
generally, but not invariably, more sensitive than other species with which we are able to compare them. Two species, the cyprinid minnow Alburnus alburnus and the tetraodontid puffer Sphoeroides maculatus, have geome- tric mean ratios that are more than 2 SE less than 1, suggesting that they are relatively insensitive to chemicals. The other 17 species considered have ratios near 1.
I t is considerably more difficult to draw conclusions about the relative sensitivity of marine species in chronic
Table IV. Extrapolations from the Standard Test Species Cyprinodon variegatus and Mysidopsis bahia
species X taxon Y benchmark no PIb slope intercept F, F2 x P C. variegatus Osteichthyes LCSO 51 1.49 0.97 0.03 0.58 0.01 1.25 1.24
Atheriniformes Lc50 17 1.00 1.02 0.04 0.26 0.01 1.22 1.28 Perciformes LC60 20 1.56 0.85 -0.12 0.63 0.02 1.36 0.99 Gasterosteiformes LCso 5 1.10 1.08 0.43 0.31 0.07 0.81 1.30 Crustacea LC60 34 2.15 1.14 -0.41 1.21 0.11 1.78 1.62 Crustacea MATC 15 1.80 0.93 -0.54 0.84 0.03 0.53 -0.05
M. bahia Crustacea Lc50 14 2.46 2.89 -0.55 1.57 0.53 0.71 1.50 Osteichthyes Lc50 29 1.85 1.08 0.35 0.88 0.01 2.42 2.96 Crustacea MATC 5 2.22 0.80 0.43 1.28 0.27 -0.57 -1.28 Osteichthyese MATC 12 1.40 1.02 0.75 0.51 0.28 0.03 0.78
belonging to the Y taxon for the same chemical. *Prediction interval (a = 0.05) at the mean (X) is a n = number of points, each consisting of a toxicological bench mark value for a standard test species and an equivalent value for a species
& PI. “All are C. uariegatus.
552 Environ. Sci. Technol., Vol. 22, No. 5, 1988
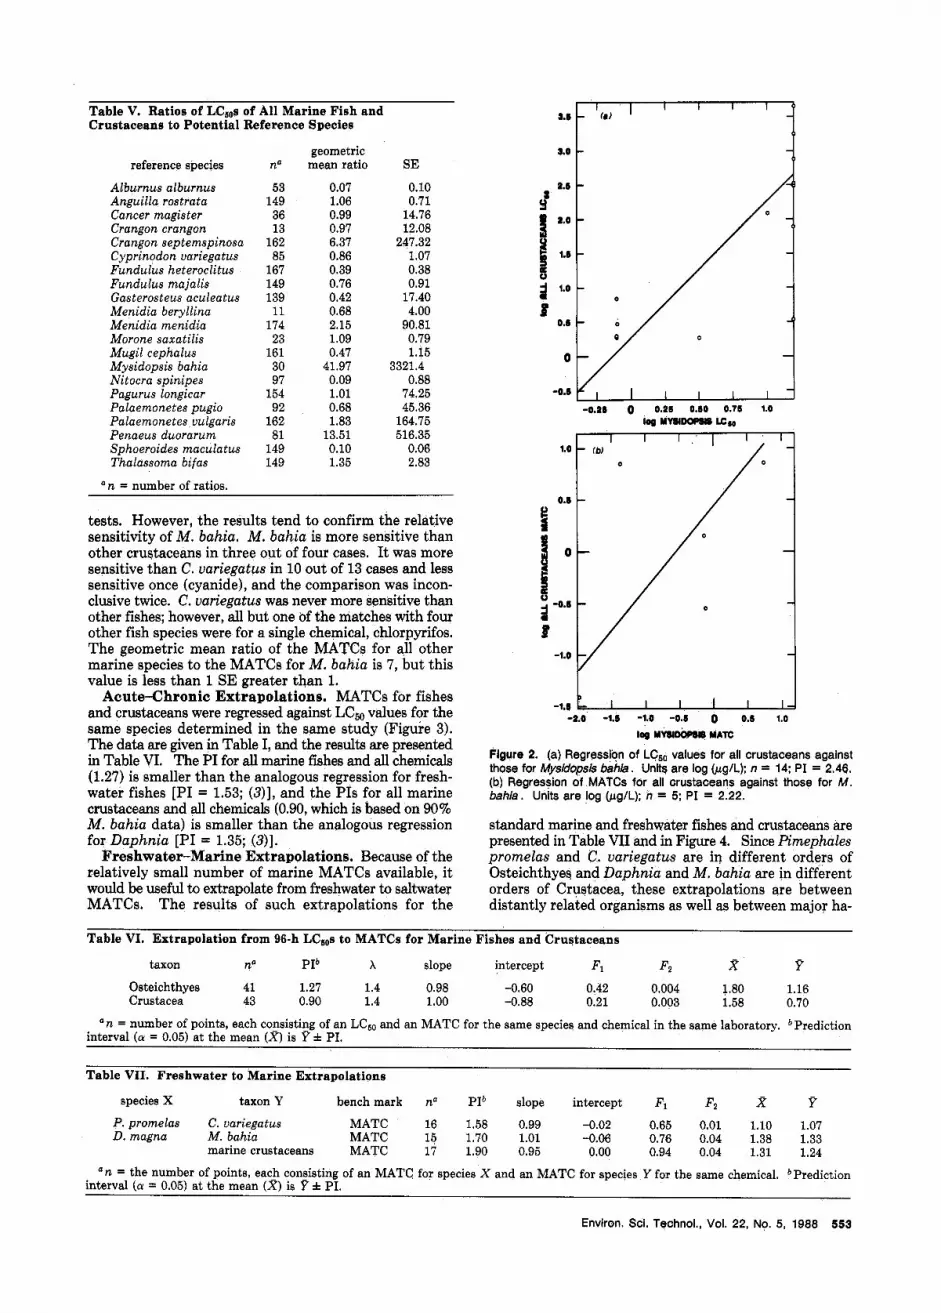
Table V. Ratios of LC,,a of All Marine Fish and Crustaceans to Potential Reference Species
reference species
Alburnus alburnus Anguilla rostrata Cancer magister Crangon crangon Crangon septemspinosa Cyprinodon variegatus Fundulus heteroclitus Fundulus majalis Gasterosteus aculeatus Menidia beryllina Menidia menidia Morone saxatilis Mugil cephalus Mysidopsis bahia Nitocra spinipes Pagurus longicar Palaemonetes pugio Palaemonetes vulgaris Penaeus duorarum Sphoeroides maculatus Thalassoma bifas
O n = number of ratios.
na
53 149 36 13
162 85
167 149 139 11
174 23
161 30 97
154 92
162 81
149 149
geometric mean ratio
0.07 1.06 0.99 0.97 6.37 0.86 0.39 0.76 0.42 0.68 2.15 1.09 0.47
41.97 0.09 1.01 0.68 1.83
13.51 0.10 1.35
SE 0.10 0.71
14.76 12.08
247.32 1.07 0.38 0.91
17.40 4.00
90.81 0.79 1.15
0.88 74.25 45.36
164.75 516.35
0.06 2.83
3321.4
tests. However, the results tend to confirm the relative sensitivity of M. bahia. M. bahia is more sensitive than other crustaceans in three out of four cases. It was more sensitive than C. variegatus in 10 out of 13 cases and less sensitive once (cyanide), and the comparison was incon- clusive twice. C. uariegatus was never more sensitive than other fishes; however, all but one of the matches with four other fish species were for a single chemical, chlorpyrifos. The geometric mean ratio of the MATCs for all other marine species to the MATCs for M. bahia is 7, but this value is less than 1 SE greater than 1.
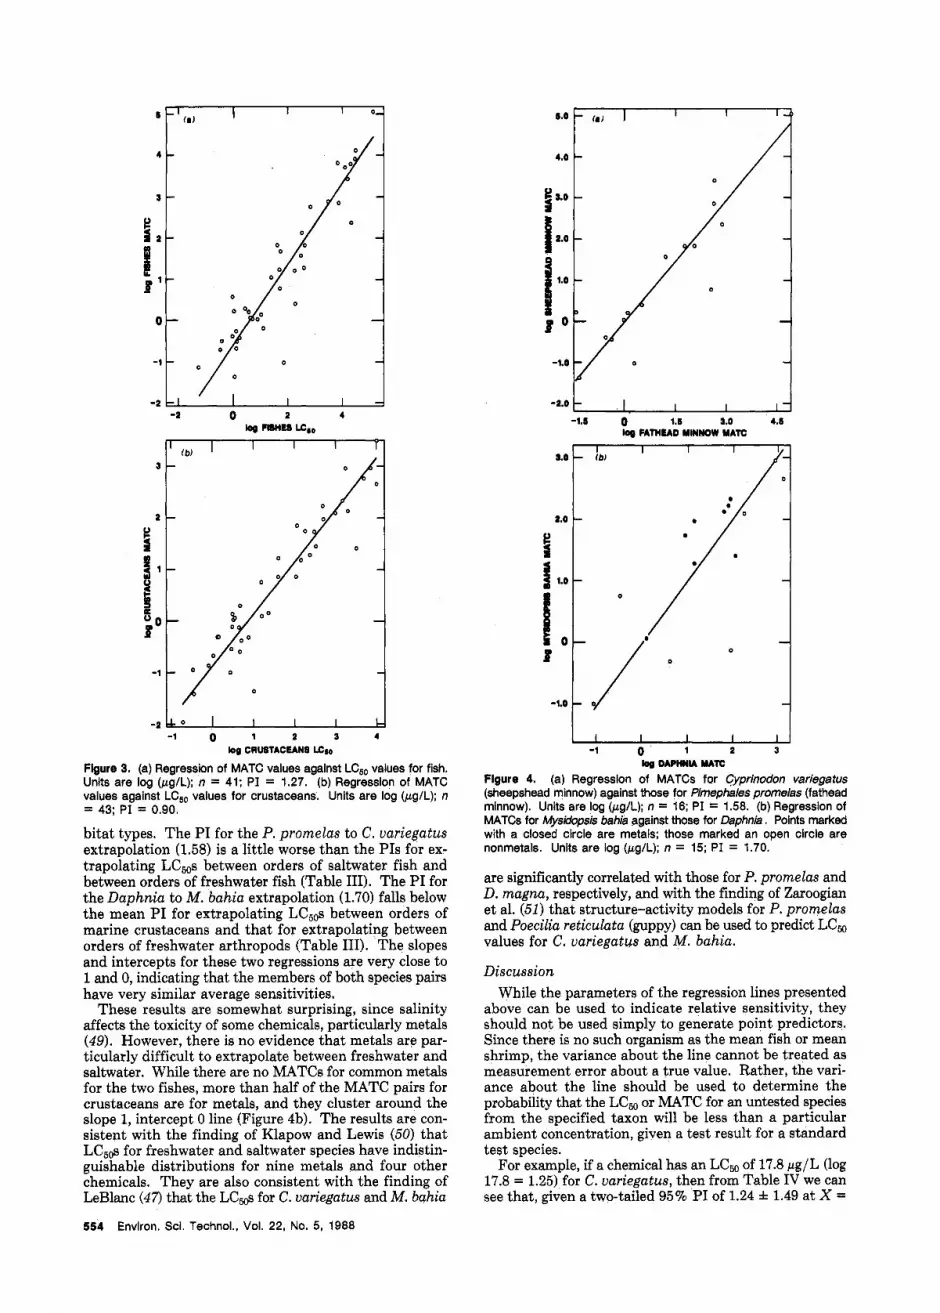
Acute-Chronic Extrapolations. MATCs for fishes and crustaceans were regressed against LCm values for the same species determined in the same study (Figure 3). The data are given in Table I, and the results are presented in Table VI. The PI for all marine fishes and all chemicals (1.27) is smaller than the analogous regression for fresh- water fishes [PI = 1.53; (3)], and the PIS for all marine crustaceans and all chemicals (0.90, which is based on 90% M. bahia data) is smaller than the analogous regression for Daphnia [PI = 1.35; (3)].
Freshwater-Marine Extrapolations. Because of the relatively small number of marine MATCs available, it would be useful to extrapolate from freshwater to saltwater MATCs. The results of such extrapolations for the
j 1.0
B 0.5
0
-0.5
1.0
0.5
0 s o
1 u j -0.5
B -1.0
t o / 1 0
- -
I I I -0.25 0 0.25 0.50 0.75 1.0 -0.25 0 0.25 0.50 0.75 1.0
-1.8 -2.0 -1.5 -1.0 -0.5 0 0.5 1.0
log YWDOPSI8 YATC
Flgure 2. (a) Regression of LC,, values for all crustaceans against those for Mysldopsls bahla . Unltq are log &g/L): n = 14; P I = 2.46. (b) Regression of MATCs for all orustaceans against those for M. bahia. Units are log (pg/L); n = 5; P I = 2.22.
standard marine and freshwater fishes and crustaceans are presented in Table VI1 and in Figure 4. Since Pimephales promelas and C. variegatus are iq different orders of Osteichthyes and Daphnia and M. bahia are in different orders of Crustacea, these extrapolations are between distantly related organisms as well as between major ha-
Table VI, Extrapolation from 96-h LCsos to MATCs for Marine Fishes and Crustaceans
taxon n” PI* x slope intercept Fl FZ 8 P Osteichthyes 41 1.27 1.4 0.98 -0.60 0.42 0.004 1.80 1.16 Crustacea 43 0.90 1.4 1.00 -0.88 0.21 0.003 1.58 0.70
‘ n = number of points, each consisting of an LCE0 and an MATC for the same species and chemical in the same laboratory. Prediction interval (a = 0.05) at the mean (x) is
Table VII. Freshwater to Marine Extrapolations
* PI.
species X taxon Y bench mark no PIb slope intercept Fl F2 x P P. promelas C. variegatus MATC 16 1.58 0.99 -0.02 0.65 0.01 1.10 1.07 D. magna M. bahia MATC 15 1.70 1.01 -0.06 0.76 0.04 1.38 1.33
marine crustaceans MATC 17 1.90 0.95 0.00 0.94 0.04 1.31 1.24
“ n = the number of points, each consisting of an MATC for species X and an MATC for species Y for the same chemical. bPrediction interval (a = 0.05) at the mean ( X ) is Y * PI.
Envlron. Sci. Technol., Vol. 22, No. 5, 1988 553
-2 0 2 4 -1.5 Q 1.6 5.0 4.5
log FATHUD MINNOW M A E
. o I I I -1 Q 1 2 3 4
be CRUSTACEANS LCso
Flgure 3. (a) Regression of MATC values agalnst LCso values for fish. Unlts are log (pglL); n = 41: P I = 1.27. (b) Regression of MATC values against LC,, values for crustaceans. Units are log (pg/L): n = 43; P I = 0.90.
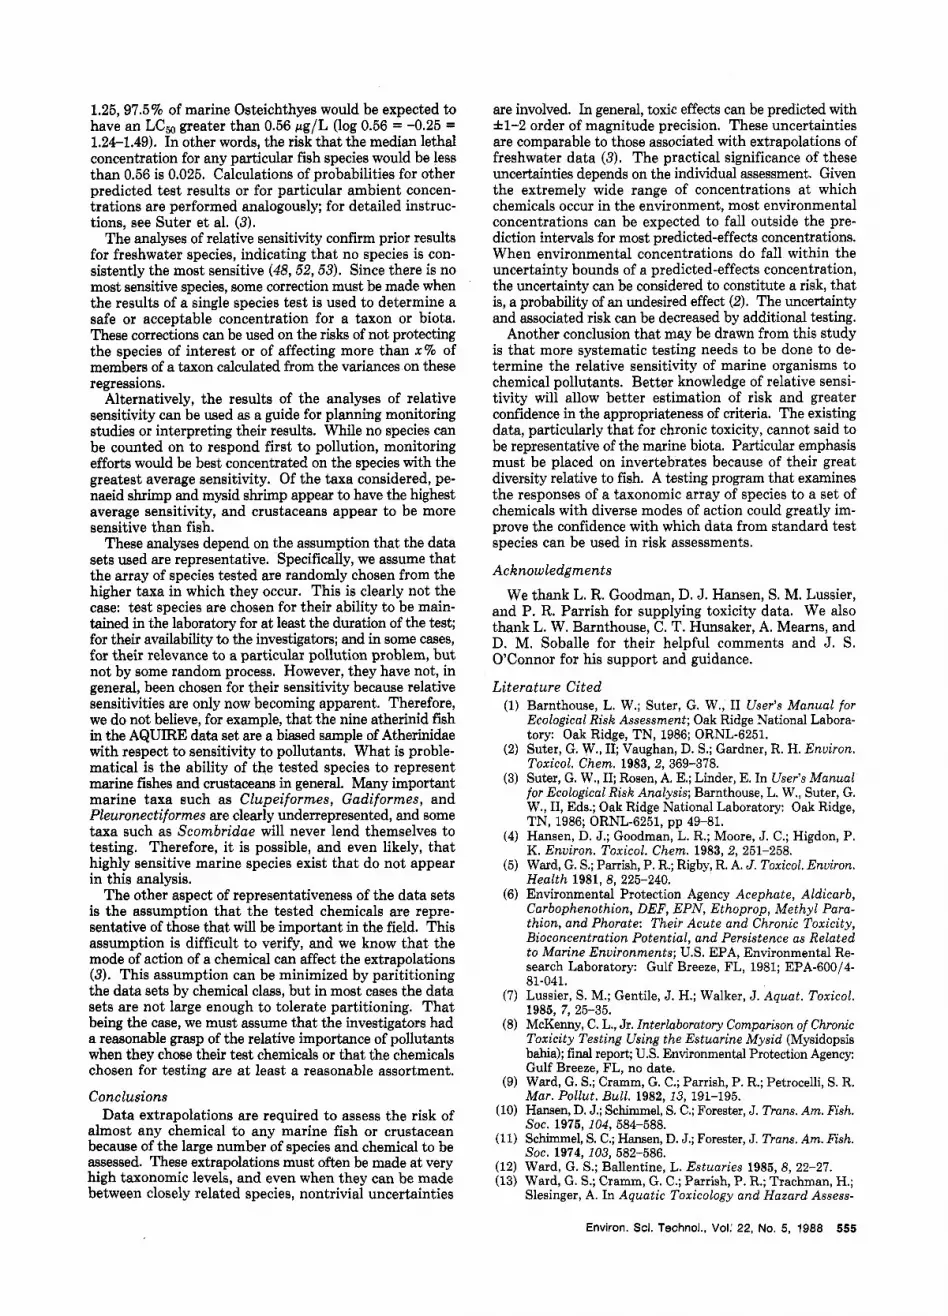
bitat types. The PI for the P. promelas to C. uariegatus extrapolation (1.58) is a little worse than the PIS for ex- trapolating LC50s between orders of saltwater fish and between orders of freshwater fish (Table 111). The PI for the Daphnia to M. bahia extrapolation (1.70) falls below the mean PI for extrapolating LC50s between orders of marine crustaceans and that for extrapolating between orders of freshwater arthropods (Table 111). The slopes and intercepts for these two regressions are very close to 1 and 0, indicating that the members of both species pairs have very similar average sensitivities.
These results are somewhat surprising, since salinity affects the toxicity of some chemicals, particularly metals (49). However, there is no evidence that metals are par- ticularly difficult to extrapolate between freshwater and saltwater. While there are no MATCs for common metals for the two fishes, more than half of the MATC pairs for crustaceans are for metals, and they cluster around the slope 1, intercept 0 line (Figure 4b). The results are con- sistent with the finding of Klapow and Lewis (50) that LC5,,s for freshwater and saltwater species have indistin- guishable distributions for nine metals and four other chemicals. They are also consistent with the finding of LeBlanc (47) that the LC@ for C. uariegatus and M. bahia
554 Envlron. Sci. Technol.. Vol. 22, No. 5, 1988
LO
2.0
i 1.0
I. ? - -1 0 1 2
log DAPHNIA M A E
Figure 4. (a) Regression of MATCs for Cyprinodon variegatus (sheepshead minnow) against those for Pimephales promelas (fathead mlnnow). Units are log bg/L); n = 16; PI = 1.58. (b) Regresslon of MATCs for Mys&psk bahia against those for Daphnia. Points marked with a closed clrcle are metals: those marked an open circle are nonmetals. Units are log (pg/L); n = 15; P I = 1.70.
are significantly correlated with those for P. promelas and D. magna, respectively, and with the finding of Zaroogian et al. (51) that structure-activity models for P. promelas and Poecilia reticulata (guppy) can be used to predict LCW values €or C. uariegatus and M. bahia.
Discussion While the parameters of the regression lines presented
above can be used to indicate relative sensitivity, they should not be used simply to generate point predictors. Since there is no such organism as the mean fish or mean shrimp, the variance about the line cannot be treated as measurement error about a true value. Rather, the vari- ance about the line should be used to determine the probability that the LC, or MATC for an untested species from the specified taxon will be less than a particular ambient concentration, given a test result for a standard test species.
For example, if a chemical has an LC, of 17.8 pg/L (log 17.8 = 1.25) for C. uariegatus, then from Table IV we can see that, given a two-tailed 95% PI of 1.24 f 1.49 at X =
1.25,97.5% of marine Osteichthyes would be expected to have an LCs0 greater than 0.56 pg/L (log 0.56 = -0.25 = 1.24-1.49). In other words, the risk that the median lethal concentration for any particular fish species would be less than 0.56 is 0.025. Calculations of probabilities for other predicted test results or for particular ambient concen- trations are performed analogously; for detailed instruc- tions, see Suter et al. (3).
The analyses of relative sensitivity confirm prior results for freshwater species, indicating that no species is con- sistently the most sensitive (48,52,53). Since there is no most sensitive species, some correction must be made when the results of a single species test is used to determine a safe or acceptable concentration for a taxon or biota. These corrections can be used on the risks of not protecting the species of interest or of affecting more than x % of members of a taxon calculated from the variances on these regressions.
Alternatively, the results of the analyses of relative sensitivity can be used as a guide for planning monitoring studies or interpreting their results. While no species can be counted on to respond first to pollution, monitoring efforts would be best concentrated on the species with the greatest average sensitivity. Of the taxa considered, pe- naeid shrimp and mysid shrimp appear to have the highest average sensitivity, and crustaceans appear to be more sensitive than fish.
These analyses depend on the assumption that the data sets used are representative. Specifically, we assume that the array of species tested are randomly chosen from the higher taxa in which they occur. This is clearly not the case: test species are chosen for their ability to be main- tained in the laboratory for at least the duration of the test; for their availability to the investigators; and in some cases, for their relevance to a particular pollution problem, but not by some random process. However, they have not, in general, been chosen for their sensitivity because relative sensitivities are only now becoming apparent. Therefore, we do not believe, for example, that the nine atherinid fish in the AQUIRE data set are a biased sample of Atherinidae with respect to sensitivity to pollutants. What is proble- matical is the ability of the tested species to represent marine fishes and crustaceans in general. Many important marine taxa such as Clupeiformes, Gadiformes, and Pleuronectiformes are clearly underrepresented, and some taxa such as Scombridae will never lend themselves to testing. Therefore, it is possible, and even likely, that highly sensitive marine species exist that do not appear in this analysis.
The other aspect of representativeness of the data sets is the assumption that the tested chemicals are repre- sentative of those that will be important in the field. This assumption is difficult to verify, and we know that the mode of action of a chemical can affect the extrapolations (3). This assumption can be minimized by parititioning the data sets by chemical class, but in most cases the data sets are not large enough to tolerate partitioning. That being the case, we must assume that the investigators had a reasonable grasp of the relative importance of pollutants3 when they chose their test chemicals or that the chemicals chosen for testing are a t least a reasonable assortment.
Conclusions Data extrapolations are required to assess the risk of
almost any chemical to any marine fish or crustacean because of the large number of species and chemical to be assessed. These extrapolations must often be made at very high taxonomic levels, and even when they can be made between closely related species, nontrivial uncertainties
are involved. In general, toxic effects can be predicted with f l-2 order of magnitude precision. These uncertainties are comparable to those associated with extrapolations of freshwater data (3) . The practical significance of these uncertainties depends on the individual assessment. Given the extremely wide range of concentrations at which chemicals occur in the environment, most environmental concentrations can be expected to fall outside the pre- diction intervals for most predicted-effects concentrations. When environmental concentrations do fall within the uncertainty bounds of a predicted-effects concentration, the uncertainty can be considered to constitute a risk, that is, a probability of an undesired effect (2). The uncertainty and associated risk can be decreased by additional testing.
Another conclusion that may be drawn from this study is that more systematic testing needs to be done to de- termine the relative sensitivity of marine organisms to chemical pollutants. Better knowledge of relative sensi- tivity will allow better estimation of risk and greater confidence in the appropriateness of criteria. The existing data, particularly that for chronic toxicity, cannot said to be representative of the marine biota. Particular emphasis must be placed on invertebrates because of their great diversity relative to fish. A testing program that examines the responses of a taxonomic array of species to a set of chemicals with diverse modes of action could greatly im- prove the confidence with which data from standard test species can be used in risk assessments.
Acknowledgments
We thank L. R. Goodman, D. J. Hansen, S. M. Lussier, and P. R. Parrish for supplying toxicity data. We also thank L. W. Barnthouse, C. T. Hunsaker, A. Mearns, and D. M. Soballe for their helpful comments and J. S. O’Connor for his support and guidance.
Literature Cited (1) Barnthouse, L. W.; Suter, G. W., I1 User’s Manual for
Ecological Risk Assessment; Oak Ridge National Labora- tory: Oak Ridge, TN, 1986; ORNL-6251.
(2) Suter, G. W., 11; Vaughan, D. S.; Gardner, R. H. Enuiron. Toxicol. Chem. 1983,2, 369-378.
(3) Suter, G. W., II; Rosen, A. E.; Linder, E. In User’s Manual for Ecological Risk Analysis; Barnthouse, L. W., Suter, G. W., 11, Eds.; Oak Ridge National Laboratory: Oak Ridge,
(4) Hansen, D. J.; Goodman, L. R.; Moore, J. C.; Higdon, P.
(5) Ward, G. S.; Parrish, P. R.; Rigby, R. A. J. Toxicol. Enuiron.
(6 ) Environmental Protection Agencv AceDhate. Aldicarb.
TN, 1986; ORNL-6251, pp 49-81.
K. Enuiron. Toxicol. Chem. 1983, 2, 251-258.
Health 1981,8, 225-240.
Carbophenothion, DEF, E P f i , Eihopro;, Methyl Para: thion, and Phorate: Their Acute and Chronic Toxicity, Bioconcentration Potential, and Persistence as Related to Marine Environments; U.S. EPA, Environmental Re- search Laboratory: Gulf Breeze, FL, 1981; EPA-60014-
Lussier, S. M.; Gentile, J. H.; Walker, J. Aquat. Toxicol.
McKenny, C. L., Jr. Interlaboratory Comparison of Chronic Toxicity Testing Using the Estuarine Mysid (Mysidopsis bahia); final report; U.S. Environmental Protection Agency: Gulf Breeze, FL, no date. Ward, G. S.; Cramm, G. C.; Parrish, P. R.; Petrocelli, S. R. Mar. Pollut. Bull. 1982, 13, 191-195. Hansen, D. J.; Schimmel, S. C.; Forester, J. Trans. Am. Fish.
Schimmel, S. C.; Hansen, D. J.; Forester, J. Trans. Am. Fish.
Ward, G. S.; Ballentine, L. Estuaries 1985, 8, 22-27. Ward, G. S.; Cramm, G. C.; Parrish, P. R.; Trachman, H.; Slesinger, A. In Aquatic Toxicology and Hazard Assess-
81-041.
1985, 7, 25-35.
SOC. 1975,104,584-588.
SOC. 1974,103, 582-586.
Environ. Sci. Technol., Vol.’ 22, No. 5, 1988 555
ment: Fourth Conference; Branson, D. R., Dickson, K. L., Eds.; American Society for Testing and Materials: Phila- delphia, PA, 1981; ASTM STP 737, pp 183-200.
(14) Parrish, P. R.; Dyar, E. E.; Lindberg, M. A,; Shanika, C. N.; Enos, J. M. Chronic Toxicity o f Methoxychlor, Mala- thion, and Carbofuran to Sheepshead Minnows (Cypri- nodon variegatus); U.S. Environmental Protection Agency: Gulf Breeze, FL, 1977; EPA-60013-77-059.
(15) Nimmo, D. R.; Bahner, L. H.; Rigby, R. A,; Sheppard, J. M.; Wilson, A. J., Jr. In Aquatic Toxicology and Hazard Evaluation; Mayer, F. L., Hamelink, J. L., Eds.; American Society for Testing and Materials: Philadelphia, PA, 1977;
(16) Nimmo, D. R.; Rigby, R. A.; Bahner, L. H.; Sheppard, J. M. Bull. Environ. Contam. Toxicol. 1978, 7, 80-85.
(17) Gentile, S. M.; Gentile, J. H.; Walker, J.; Heltshe, J. F. Hydrobiologia 1982, 93, 195-204.
(18) Parrish, P. R.; Dyar, E. E.; Enos, J. M.; Wilson, W. G. Chronic Toxicity o f Chlordan, Trifluralin, and Penta- chlorophenol t o Sheepshead Minnow (Cyprinodon uarie- gatus); U.S. Environmental Protection Agency: Gulf Breeze,
(19) Parrish, P. R.; Schimmel, S. C.; Hansen, D. J.; Patrick, P. M.; Forester, J. J. Toxicol. Environ. Health 1976, I , 485-494.
(20) Goodman, L. R.; Middaugh, D. P.; Hansen, D. J.; Higdon, P. K.; Cripe, G. M. Enuiron. Toxicol. Chem. 1983, 2,
(21) Goodman, L. R.; Hansen, D. J.; Middaugh, D. P.; Cripe, G. M.; Moore, J. C. In Aquatic Toxicology and Hazard Assessment, Seventh Symposium; Cardwell, R. D., Purdy, R., Bahner, R. C., Eds.; American Society for Testing and Materials: Philadelphia, PA, 1985; pp 145-154.
(22) Cripe, G. M.; Hansen, D. J.; Macauley, S. F.; Forester, J. In Aquatic Toxicology and Hazard Assessment, N i n t h Symposium; Poston, T. M., Purdy, R., Eds.; American Society for Testing and Materials: Philadelphia, PA, 1986;
(23) Hansen, D. J.; Goodman, L. R.; Cripe, G. M.; Macauley,
(24) Environmental Protection Agency Fed. Regist. 1985, 50,
(25) Nimmo, D. R.; Hamaker, T. L.; Mathews, E.; Moore, J. C. In Biological Monitoring of Marine Pollutants; Vernberg, J., Calabrese, A., Thurberg, F., Vernberg, W. B., Eds.; American Press: New York, 1981; pp 3-19.
(26) Goodman, L. R.; Hansen, D. J.; Coopage, D. L.; Moore, J. C.; Mathews, W. Trans. Am. Fish. SOC. 1979,108,479-488.
(27) Daniels, R. E.; Allan, J. D. Can. J . Fish. Aquat. Sci. 1981, 38,485-494.
(28) Environmental Protection Agency Fed. Regist. 1980, 45, 79318-79379.
(29) Nimmo, D. R.; Hamaker, T. L.; Moore, J. C.; Wood, R. A. In Aquatic Toxicology; Eaton, J. G., Parrish, P. R., Hen- dricks, A. C., Eds.; American Society for Testing and Ma- terials: Philadelphia, PA, 1980; ASTM STP 707, pp 366-376.
(30) Hansen, D. J.; Cripe, G. M. Interlaboratory Comparison of the Early Life-Stage Tes t Using the Sheepshead Min- now (Cyprinodon variegatus); U.S. Environmental Pro- tection Agency: Gulf Breeze, FL, 1984; EPA-600/X-84-081.
(31) ‘Tyler-Schroeder, D. B. In Aquatic Toxicology; Marking L. L., Kimerle, R. A., Eds.; American Society for Testing and Materials: Philadelphia, PA, 1979; ASTM STP 667, pp
(32) McKenny, C. L., Jr. Interrelationships Between Energy Metabolism, Growth Dynamics and Reproduction During the Life-Cycle of Mysidopsis bahia as Influenced by
ASTM STP 634, pp 109-116.
FL, 1978; EPA-60013-78-010.
337-342.
pp 450-460.
S. F. Ecotoxicol. Environ. Saf. 1986, 11, 15-22.
30784-30796.
159-170.
Sublethal Endrin Exposure; U.S. Environmental Protection Agency: Gulf Breeze, FL, 1982; EPA 600/D-82-080.
(33) Hansen, D. J.; Schimmel, S. C.; Forester, J. J . Toxicol. Enuiron. Heal th 1977,3, 721-733.
(34) Schimmel, S. C.; Parrish, P. R.; Hansen, D. J.; Patrick, J. M., Jr.; Forester, J. In Proceedings, 28th Conference, Southeastern Association of Game and Fish Commis- sioners; Southeastern Association of Game and Fish Com- missioners: Baton Rouge, LA, 1974; pp 187-194.
(35) Cripe, G. M.; Goodman, L. R.; Hansen, D. J. Aquat. Toxicol.
(36) Goodman, L. R.; Hansen, D. J.; Crouch, J. A.; Forester, J. In Proceedings, 30th Annual Conference, Southeastern Association of Game and Fish Commissioners; South- eastern Association of Game and Fish Commissioners: Baton Rouge, LA, 1976; pp 192-202.
(37) Aquatic Toxicity and Hazard Evaluation; Hansen, D. J.; Parrish, P. R.; Mayer, F. L.; Hamelink, J. L., Eds.; American Society for Testing and Materials: Philadelphia, PA, 1977;
(38) Gentile, J. H.; Gentile, S. M.; Hairston, N. G., Jr.; Sullivan, B. K. Hydrobiologia 1982, 93, 179-187.
(39) Gentile, J. H.; Gentile, S. M.; Hoffman, G.; Heltshe, J. F.; Hairston, N., Jr . Environ. Toxicol. Chem. 1983,2,61-68.
(40) Allan, J. D.; Daniels, R. E. “Sublethal Effects of Pollutants: Life Table Evaluation of Chronic Exposure of Eurytemora aff inis (Copepoda) to Kepone”; Technical Report No. 61; Water Resources Research Center, University of Maryland College Park, MD, 1980.
(41) Goodman, L. R.; Hansen, D. J.; Manning, C. S.; Faas, L. F. Arch. Environ. Contam. Toxicol. 1982, 11, 335-342.
(42) Hansen, D. J.; Goodman, L. R.; Wilson, A. J., Jr . Chesa- peake Sci. 1977,18, 227-232.
(43) Ward, G. S.; Hollister, T. A,; Parrish, P. R. Northeast Gulf Sci. 1981, 2, 73-78.
(44) Ricker, W. E. J. Fish. Res. Board Can. 1973,30,409-434. (45) Mandel, J. J. Qual. Technol. 1984, 16, 1-14. (46) Wonnacott, R. J.; Wonnacott, T. H. Introductory Statistics,
(47) LeBlanc, G. A. Environ. Toxicol. Chem. 1984, 3, 47-60. (48) Mayer, F. L.; Ellersieck, M. R. Manual of Acute Toxicity:
Interpretation and Data Base for 410 Chemicals and 66 Species of Freshwater Animals; U.S. Fish and Wildlife Service: Washington, DC, 1986; Resource Pub. 160.
(49) Engel, E. W.; Fowler, B. A. E H P , Environ. Health Persp.
(50) Klapow, L. A.; Lewis, R. H. J.-Water Pollut. Control Fed.
(51) Zaroogian, G.; Heltshe, J. F.; Johnson, M. Aquat. Toxicol.
(52) Kenaga, E. E. Environ. Sci. Technol. 1978,12,1322-1329. (53) Patrick, R.; Cairns, J.; Scheier, A. Prog. Fish-Cult. 1968,
1984, 5, 255-266.
ASTM STP 634, pp 117-126.
4th ed.; Wiley: New York, 1985.
1979, 28, 81-88.
1979, 51, 2054-2070.
1985, 6, 251-270.
30. 137-140.
Received for review September 15, 1986. Revised manuscript received September 14, 1987. Accepted December 8, 1987. Research sponsored by the National Oceanographic and At- mospheric Adminis trat ion ( N O A A ) through Interagency Agreement 40-1535-84 with the U.S. Department of Energy, under Contract DE-AC05-840R21400 with Mart in Marietta Energy Systems, Inc. This paper has been reviewed by N O A A and approved for publication. Such approval does not signify that the contents of this paper necessarily represent the official position of the U.S. Government or o f N O A A , nor does the mention of trade names or commercial products constitute en- dorsement or recommendation for their use.
556 Environ. Sci. Technol., Vol. 22, No. 5, 1988
Related Documents


![[Toxicology] toxicology introduction](https://static.cupdf.com/doc/110x72/55c46616bb61ebb3478b4643/toxicology-toxicology-introduction.jpg)


