Comparative Toxicogenomic Analysis of the Hepatotoxic Effects of TCDD in Sprague Dawley Rats and C57BL/6 Mice Darrell R. Boverhof,* , † Lyle D. Burgoon,* , † Colleen Tashiro,‡ Bonnie Sharratt,‡ Brock Chittim,‡ Jack R. Harkema,§ , † Donna L. Mendrick, ¶ and Timothy R. Zacharewski* , † ,1 *Department of Biochemistry and Molecular Biology and †Center for Integrative Toxicology, National Food Safety and Toxicology Center, Michigan State University, East Lansing, Michigan 48824; ‡Wellington Laboratories Inc., Guelph, Ontario N1G 3M5, Canada; §Department of Pathobiology and Diagnostic Investigation, National Food Safety and Toxicology Center, Michigan State University, East Lansing, Michigan 48824; and ¶ Gene Logic Inc., Gaithersburg, Maryland 20879 Received July 12, 2006; accepted September 1, 2006 In an effort to further characterize conserved and species- specific mechanisms of 2,3,7,8-tetrachlorodibenzo-p-dioxin (TCDD)–mediated toxicity, comparative temporal and dose- response microarray analyses were performed on hepatic tissue from immature, ovariectomized Sprague Dawley rats and C57BL/ 6 mice. For temporal studies, rats and mice were gavaged with 10 or 30 mg/kg of TCDD, respectively, and sacrificed after 2, 4, 8, 12, 18, 24, 72, or 168 h while dose-response studies were performed at 24h. Hepatic gene expression profiles were monitored using custom cDNA microarrays containing 8567 (rat) or 13,361 (mouse) cDNA clones. Affymetrix data from male rats treated with 40 mg/kg TCDD were also included to expand the species comparison. In total, 3087 orthologous genes were represented in the cross-species comparison. Comparative analysis identified 33 orthologous genes that were commonly regulated by TCDD as well as 185 rat-specific and 225 mouse-specific responses. Func- tional annotation using Gene Ontology identified conserved gene responses associated with xenobiotic/chemical stress and amino acid and lipid metabolism. Rat-specific gene expression responses were associated with cellular growth and lipid metabolism while mouse-specific responses were associated with lipid uptake/ metabolism and immune responses. The common and species- specific gene expression responses were also consistent with complementary histopathology, clinical chemistry, hepatic lipid analyses, and reports in the literature. These data expand our understanding of TCDD-mediated gene expression responses and indicate that species-specific toxicity may be mediated by differ- ences in gene expression which may help explain the wide range of species sensitivities and will have important implications in risk assessment strategies. Key Words: TCDD; toxicogenomics; liver; cross-species comparison. 2,3,7,8-Tetrachlorodibenzo-p-dioxin (TCDD) and related compounds are ubiquitous environmental contaminants that elicit a broad spectrum of toxic and biochemical responses in a tissue-, sex-, age-, and species-specific manner (Poland and Knutson, 1982). These responses include a wasting syndrome, tumor promotion, teratogenesis, immunotoxicity, modulation of endocrine systems, and hepatotoxicity which are mediated by the aryl hydrocarbon receptor (AhR), a member of the basic- helix-loop-helix-PAS (bHLH-PAS) family (Denison and Heath-Pagliuso, 1998; Poland and Knutson, 1982). The pro- posed mechanism involves ligand binding to the cytoplasmic AhR and translocation to the nucleus where it forms a hetero- dimer with the aryl hydrocarbon receptor nuclear translocator (ARNT), another member of the bHLH-PAS family. This heterodimer binds specific DNA elements, termed dioxin response elements (DREs), in the regulatory regions of target genes leading to changes in gene expression (Hankinson, 1995). Evidence suggests that TCDD-mediated toxicity is due to the continuous and inappropriate AhR-mediated regu- lation of target genes (Denison et al., 2002). The obligatory involvement of the AhR/ARNT signaling pathway in mediating the toxic and biochemical responses to TCDD has been well established by studies which reported decreased susceptibility to TCDD-mediated toxicity in mice with low-affinity AhR alleles (Okey et al., 1989) and resistance to toxicity in AhR-null mice (Gonzalez and Fernandez- Salguero, 1998; Peters et al., 1999; Vorderstrasse et al., 2001). Han/Wistar rats display a 1000-fold resistance to TCDD-mediated lethality when compared to the Long-Evans strain which is attributed to a genetic polymorphism in the AhR resulting in a 38 amino acid deletion from the transactivation domain (Pohjanvirta et al., 1999). More recent studies have shown that mice possessing mutations in the AhR nuclear localization/DRE-binding domain and mice harboring a hypo- morphic ARNT allele fail to exhibit classical TCDD toxicities (Bunger et al., 2003; Walisser et al., 2004). Although the mechanism of AhR/ARNT-mediated changes in gene 1 To whom correspondence should be addressed at: Department of Biochem- istry and Molecular Biology, Michigan State University, 501 Biochemistry Building, Wilson Road, East Lansing, MI 48824-1319. Fax: (517) 353-9334. E-mail: [email protected]. Ó The Author 2006. Published by Oxford University Press on behalf of the Society of Toxicology. All rights reserved. For Permissions, please email: [email protected] TOXICOLOGICAL SCIENCES 94(2), 398–416 (2006) doi:10.1093/toxsci/kfl100 Advance Access publication September 7, 2006 by guest on February 21, 2016 http://toxsci.oxfordjournals.org/ Downloaded from

Welcome message from author
This document is posted to help you gain knowledge. Please leave a comment to let me know what you think about it! Share it to your friends and learn new things together.
Transcript
Comparative Toxicogenomic Analysis of the Hepatotoxic Effects ofTCDD in Sprague Dawley Rats and C57BL/6 Mice
Darrell R. Boverhof,*,† Lyle D. Burgoon,*,† Colleen Tashiro,‡ Bonnie Sharratt,‡ Brock Chittim,‡ Jack R. Harkema,§,†Donna L. Mendrick,¶ and Timothy R. Zacharewski*,†,1
*Department of Biochemistry and Molecular Biology and †Center for Integrative Toxicology, National Food Safety and Toxicology Center,
Michigan State University, East Lansing, Michigan 48824; ‡Wellington Laboratories Inc., Guelph, Ontario N1G 3M5, Canada;
§Department of Pathobiology and Diagnostic Investigation, National Food Safety and Toxicology Center, Michigan State University,
East Lansing, Michigan 48824; and ¶Gene Logic Inc., Gaithersburg, Maryland 20879
Received July 12, 2006; accepted September 1, 2006
In an effort to further characterize conserved and species-
specific mechanisms of 2,3,7,8-tetrachlorodibenzo-p-dioxin(TCDD)–mediated toxicity, comparative temporal and dose-
response microarray analyses were performed on hepatic tissue
from immature, ovariectomized Sprague Dawley rats and C57BL/
6 mice. For temporal studies, rats and mice were gavaged with 10
or 30 mg/kg of TCDD, respectively, and sacrificed after 2, 4, 8, 12,
18, 24, 72, or 168 h while dose-response studies were performed at
24h. Hepatic gene expression profiles were monitored using
custom cDNA microarrays containing 8567 (rat) or 13,361
(mouse) cDNA clones. Affymetrix data from male rats treated
with 40 mg/kg TCDD were also included to expand the species
comparison. In total, 3087 orthologous genes were represented in
the cross-species comparison. Comparative analysis identified 33
orthologous genes that were commonly regulated by TCDD as
well as 185 rat-specific and 225 mouse-specific responses. Func-
tional annotation using Gene Ontology identified conserved gene
responses associated with xenobiotic/chemical stress and amino
acid and lipid metabolism. Rat-specific gene expression responses
were associated with cellular growth and lipid metabolism while
mouse-specific responses were associated with lipid uptake/
metabolism and immune responses. The common and species-
specific gene expression responses were also consistent with
complementary histopathology, clinical chemistry, hepatic lipid
analyses, and reports in the literature. These data expand our
understanding of TCDD-mediated gene expression responses and
indicate that species-specific toxicity may be mediated by differ-
ences in gene expression which may help explain the wide range of
species sensitivities and will have important implications in risk
assessment strategies.
Key Words: TCDD; toxicogenomics; liver; cross-species
comparison.
2,3,7,8-Tetrachlorodibenzo-p-dioxin (TCDD) and relatedcompounds are ubiquitous environmental contaminants thatelicit a broad spectrum of toxic and biochemical responses ina tissue-, sex-, age-, and species-specific manner (Poland andKnutson, 1982). These responses include a wasting syndrome,tumor promotion, teratogenesis, immunotoxicity, modulationof endocrine systems, and hepatotoxicity which are mediatedby the aryl hydrocarbon receptor (AhR), a member of the basic-helix-loop-helix-PAS (bHLH-PAS) family (Denison andHeath-Pagliuso, 1998; Poland and Knutson, 1982). The pro-posed mechanism involves ligand binding to the cytoplasmicAhR and translocation to the nucleus where it forms a hetero-dimer with the aryl hydrocarbon receptor nuclear translocator(ARNT), another member of the bHLH-PAS family. Thisheterodimer binds specific DNA elements, termed dioxinresponse elements (DREs), in the regulatory regions of targetgenes leading to changes in gene expression (Hankinson,1995). Evidence suggests that TCDD-mediated toxicity isdue to the continuous and inappropriate AhR-mediated regu-lation of target genes (Denison et al., 2002).
The obligatory involvement of the AhR/ARNT signalingpathway in mediating the toxic and biochemical responses toTCDD has been well established by studies which reporteddecreased susceptibility to TCDD-mediated toxicity in micewith low-affinity AhR alleles (Okey et al., 1989) and resistanceto toxicity in AhR-null mice (Gonzalez and Fernandez-Salguero, 1998; Peters et al., 1999; Vorderstrasse et al.,2001). Han/Wistar rats display a 1000-fold resistance toTCDD-mediated lethality when compared to the Long-Evansstrain which is attributed to a genetic polymorphism in the AhRresulting in a 38 amino acid deletion from the transactivationdomain (Pohjanvirta et al., 1999). More recent studies haveshown that mice possessing mutations in the AhR nuclearlocalization/DRE-binding domain and mice harboring a hypo-morphic ARNT allele fail to exhibit classical TCDD toxicities(Bunger et al., 2003; Walisser et al., 2004). Although themechanism of AhR/ARNT-mediated changes in gene
1 To whom correspondence should be addressed at: Department of Biochem-
istry and Molecular Biology, Michigan State University, 501 Biochemistry
Building, Wilson Road, East Lansing, MI 48824-1319. Fax: (517) 353-9334.
E-mail: [email protected].
� The Author 2006. Published by Oxford University Press on behalf of the Society of Toxicology. All rights reserved.For Permissions, please email: [email protected]
TOXICOLOGICAL SCIENCES 94(2), 398–416 (2006)
doi:10.1093/toxsci/kfl100
Advance Access publication September 7, 2006
by guest on February 21, 2016http://toxsci.oxfordjournals.org/
Dow
nloaded from
expression is well established, the gene expression responsesinvolved in mediating the observed toxic and biochemicaleffects remain poorly understood.
Rodents exhibit a wide range of sensitivities to the toxiceffects of TCDD with LD50 values ranging from 1 lg/kg in theguinea pig (Schwetz et al., 1973) to > 1000 lg/kg in thehamster (Olson et al., 1980). Sprague Dawley rats and C57BL/6 mice have been used extensively to study TCDD-mediatedtoxicity and exhibit oral LD50 values of 30 lg/kg and 120lg/kg, respectively (Bickel 1982; Vos et al., 1974). Rats arealso more sensitive to effects on body weight gain, liver weight,thymus weight, and vitamin A homeostasis, while effects onhepatic ethoxyresorufin O-deethylase activity are similar(Fletcher et al., 2001). AhR-binding affinity for TCDD issimilar between these species and therefore does not explainthe difference in sensitivity (Denison et al., 1986; Poland et al.,1976). Studies have indicated that the rat and mouse AhR arecomparable but not identical molecular species and differ intheir molecular weights (Denison et al., 1986). Comparison ofamino acid sequences reveals high homology with the excep-tion of a 42 amino acid truncation at the C-terminal end of themouse AhR when compared to the rat. Differences in the AhRtransactivation domain may be responsible for differential geneexpression responses and altered sensitivity of these strains asproposed for Han/Wistar and Long-Evans rats (Okey et al.,2005). Alternatively, differences in genomic sequences atpromoter and enhancer regions may result in species-specificgene expression responses which could also contribute to thedifferential sensitivity (Sun et al., 2004).
Cross-species comparisons of global gene expression re-sponses represent a powerful approach to investigate themolecular mechanisms involved in TCDD-mediated toxicity.In order to further characterize the spectrum of AhR/ARNT-responsive transcripts and their relationship to hepatotoxicity,the present study has compared temporal and dose-dependenthepatic gene expression responses to TCDD in SpragueDawley rats and C57BL/6 mice. Results indicate both con-served and species-specific gene expression responses whichhave extended our understanding of the AhR regulon and mayhelp to explain the altered sensitivity in these species.
MATERIALS AND METHODS
Animal handling. Female Sprague Dawley rats and C57BL/6 mice,
ovariectomized by the vendor on postnatal day (PND) 20 and all having body
weights within 10% of the average body weight, were obtained from Charles
River Laboratories (Raleigh, NC) on PND day 25. This animal model is utilized
by our laboratory for a variety of studies and was employed in the present study
for consistency and to facilitate future comparisons. Animals were housed in
polycarbonate cages containing cellulose fiber chips (Aspen Chip Labora-
tory Bedding, Northeastern Products, Warrensberg, NY) in a 23�C high-
efficiency particulate air-filtered environment with 30–40% humidity and a
12-h light/dark cycle (0700 h–1900 h). Animals were allowed free access to
deionized water and Harlan Teklad 22/5 Rodent Diet 8640 (Madison, WI) and
acclimatized for 4 days prior to dosing. On the fourth day, animals were
weighed, and a stock solution of TCDD (provided by S. Safe, Texas A&M
University, College Station, TX) was diluted in sesame oil (Sigma, St Louis,
MO) to achieve the desired dose based on the average weight. All procedures
were performed with the approval of the Michigan State University All-
University Committee on Animal Use and Care.
Time course and dose-response studies. For the time course studies, rats
were treated by gavage with 0.1 ml of sesame oil for a nominal dose of
0 (vehicle control) or 10 lg/kg body weight of TCDD while mice received
30 lg/kg body weight of TCDD. A minimum of five animals were treated per
dose group and time point, and all groups for each dose and time point were
housed in separate cages. Both rats and mice were sacrificed 2, 4, 8, 12, 18,
24, 72, or 168 h after dosing. For the dose-response studies, rats were gavaged
with 0.1 ml of vehicle or 0.001, 0.01, 0.1, 1, 10, 30, or 100 lg/kg TCDD
while mice received 0.1 ml of vehicle or 0.001, 0.01, 0.1, 1, 10, 100, or 300
lg/kg TCDD, and both species were sacrificed 24 h after dosing. All treatments
were staggered to ensure that exposure was within 5% of the desired duration.
Doses were chosen to elicit moderate hepatotoxic effects while avoiding overt
toxicity in longer term studies. Animals were sacrificed by cervical dislocation
and tissue samples were removed, weighed, flash-frozen in liquid nitrogen and
stored at � 80�C until further use. In each study, the right lobe of the liver was
fixed in 10% neutral buffered formalin (NBF, Sigma), for histological analysis.
Clinical chemistry and histological analyses. Blood samples were
collected at sacrifice by cardiac puncture and placed in Vacutainer SST gel
and clot activator tubes (Becton Dickinson, Franklin Lakes, NJ). Serum was
separated by centrifugation at 1500 3 g for 10 min and then stored at � 80�Cuntil analysis. As sample was limiting, only select endpoints were monitored
and included blood urea nitrogen (BUN), creatinine, free fatty acids (FFA),
glucose (GLU), total bilirubin (TBIL), alanine aminotransferase (ALT),
cholesterol (CHOL), and triglycerides (TRIG).
Formalin fixed hepatic tissues were sectioned and processed sequentially in
ethanol, xylene, and paraffin using a Thermo Electron Excelsior (Waltham,
MA). Tissues were then embedded in paraffin using a Miles Tissue Tek II
embedding center after which paraffin blocks were sectioned at 5 microns with
a rotary microtome. Sections were placed on glass microscope slides, dried, and
stained with hematoxylin and eosin. All histological processing was performed
at the Michigan State University Histology Laboratory (http://humanpathology.
msu.edu/histology/index.html). For Oil Red O staining, liver cryosections were
fixed in NBF, stained with Oil Red O solution, and washed and counterstained
with hematoxylin.
Thin layer chromatography of liver lipid extracts. To qualitatively
characterize the lipid content of the liver, samples were homogenized in
methanol, acidified with HCl, and lipids extracted with chloroform:methanol
(2:1) containing 1mM butylated hydroxytoluene (BHT). The protein and
aqueous phases were reextracted with chloroform, and the organic phases were
pooled, dried under nitrogen, resuspended in chloroform and 1mM BHT, and
stored at � 80�C. Lipid extracts were then fractionated by thin-layer
chromatography (TLC; LK6D Silica G 60A; Whatman Inc., Florham Park,
NJ) with hexane:diethyl ether:acetic acid (90:30:1) and developed with iodine
(Sigma). The location of lipids was compared with authentic standards for
triacylglycerol, diacylglycerol, and CHOL ester (Nu-Chek Prep, Elysian, MN).
Quantification of TCDD in liver samples. Liver samples were processed
in parallel with laboratory blanks and a reference or background sample at
Wellington Laboratories Inc., (Guelph, ON, Canada). Samples were weighed,
spiked with 13C12 TCDD surrogate, digested with sulfuric acid, and extracted.
Extracts were cleaned, concentrated, and spiked with an injection standard.
Analysis was performed on a high-resolution gas chromatograph/high-resolution
mass spectrometer (HRMS) using a Hewlett Packard 5890 Series II GC
interfaced to a VG 70SE HRMS. The HRMS was operated in the electron
ionization/selective ion recording mode at 10,000 resolution. A 60-m DB5
column (J&W Scientific, Folsom, CA) with an internal diameter of 0.25 mm
and film thickness of 0.25 lm was utilized. Injection volumes were 2 ll and
used a splitless injection.
COMPARATIVE TOXICOGENOMICS OF TCDD IN RATS AND MICE 399
by guest on February 21, 2016http://toxsci.oxfordjournals.org/
Dow
nloaded from
RNA isolation. Frozen liver samples (approximately 70 mg) were trans-
ferred to 1.0 ml of Trizol (Invitrogen, Carlsbad, CA) and homogenized using
a Mixer Mill 300 tissue homogenizer (Retsch, Germany). Total RNA was
isolated according to the manufacturer’s protocol with an additional phenol:
chloroform extraction. Isolated RNA was resuspended in RNA storage solution
(Ambion Inc., Austin, TX), quantified (A260) and assessed for purity by
determining the A260/A280 ratio and by visual inspection of 1.0 lg on
a denaturing gel.
cDNA microarray experimental designs. Custom rat cDNA arrays,
consisting of 8567 features representing 3022 unique genes (Unigene build
no. 48), and mouse cDNA arrays, consisting of 13,361 features, representing
7885 unique genes (Unigene build no. 144), were used for gene expression
analysis. Temporal changes in gene expression were assessed using an
independent reference design in which samples from TCDD-treated animals
were cohybridized with time-matched vehicle controls. Dose-response changes
in gene expression were analyzed using a common reference design in which
samples from TCDD-treated mice were cohybridized with a common vehicle
control. All experiments were performed with a minimum of three biological
replicates with two independent labelings of each sample (incorporating a dye
swap) for each time point or dose group.
cDNA microarray analysis of differential gene expression. Detailed
protocols for microarray preparation, labeling of the cDNA probe, sample
hybridization, and washing can be found at http://dbzach.fst.msu.edu/
interfaces/microarray.html. Briefly, PCR-amplified DNA was robotically
arrayed onto epoxy-coated glass slides (Schott-Nexterion, Duryea, PA) using
an Omnigrid arrayer (GeneMachines, San Carlos, CA) equipped with Chip-
maker 2 pins (Telechem) at the Research Technology Support Facility (http://
www.genomics.msu.edu). Total RNA (30 lg) was reverse transcribed in the
presence of Cy3- or Cy5-dUTP (Amersham, Piscataway, NJ) to create fluor-
labeled cDNA which was purified using a Qiagen PCR purification kit (Qiagen,
Valencia, CA). Cy3 and Cy5 samples were mixed, vacuum dried, and
resuspended in 48 ll of hybridization buffer (40% formamide, 43 SSC, 1%
SDS) and hybridized on the array under a 22 3 60 mm lifterslip (Erie Scientific
Company, Portsmouth, NH) for 18–24 h in a 42�C water bath. Slides were then
washed, dried by centrifugation, and scanned at 635 nm (Cy5) and 532 nm
(Cy3) on an Affymetrix 428 Array Scanner (Santa Clara, CA). Images were
analyzed for feature and background intensities using GenePix Pro 5.0
(Molecular Devices, Union City, CA).
Affymetrix analysis of TCDD-mediated gene expression responses in
male Sprague Dawley rats. Due to the limited coverage of the rat cDNA array
and the immaturity rat genome annotation, Affymetrix GeneChip microarray
data for TCDD-mediated hepatic gene expression responses in adult male
Sprague Dawley rats were obtained to facilitate a more extensive cross-species
comparison. Animal housing, treatments, and Affymetrix arrays were con-
ducted according to good laboratory practice at Gene Logic Inc., laboratories as
described previously (Fletcher et al., 2005). Briefly, rats were treated with 40
lg/kg TCDD and sacrificed 6, 24, or 168 h after treatment. Changes in gene
expression were monitored using Affymetrix U34A arrays which consist of
8977 probe sets representing 4928 unique rat genes.
Microarray data normalization and analysis. All data were normalized
using a semiparametric approach (Eckel et al., 2005). Model-based t values
were calculated from normalized data, comparing treated and vehicle responses
per time point or dose group. Empirical Bayes analysis was used to calculate
posterior probabilities (P1(t) value) of activity on a per-gene and time-point or
dose-group basis using the model-based t value (Eckel et al., 2004). A P1(t)
cutoff of 0.9999 combined with an absolute fold change greater than 1.5 was
used to identify a subset of differentially regulated genes to initially focus
analysis and data interpretation on the most reproducible differentially
regulated genes. Normalization and empirical Bayes analysis were performed
using SAS v9.1 (SAS Institute, Cary, NC) and R v2.0.1. Gene expression
changes that passed the threshold were subsequently analyzed using agglom-
erative hierarchical and k-means clustering using a standard correlation
distance metric (GeneSpring 6.0, Silicon Genetics, Redwood City, CA).
Dose-response analysis was performed using Graph Pad Prism 4.0 (GraphPad
Software, San Diego, CA). Functional categorization of differentially regulated
genes was performed using an in-house developed Gene Ontology tool and
GOMiner (Zeeberg et al., 2003).
Quantitative real-time PCR. Quantitative real-time PCR (QRTPCR)
verification of microarray responses was performed as described previously
(Boverhof et al., 2005). Briefly, 1.0 lg of total RNA was reverse transcribed by
SuperScript II using an anchored oligo-dT primer as described by the
manufacturer (Invitrogen). The cDNA (1.0 ll) was used as a template in a
30 ll PCR reaction containing 0.1lM of forward and reverse gene-specific
primers, 3mM MgCl2, 1.0mM dNTPs, 0.025 IU AmpliTaq Gold, and 13 SYBR
Green PCR buffer (Applied Biosystems, Foster City, CA). Gene names,
accession numbers, forward and reverse primer sequences, and amplicon sizes
are provided in Supplementary Table 1. PCR amplification was conducted on
an Applied Biosystems PRISM 7000 Sequence Detection System. cDNAs were
quantified using a standard curve approach and the copy number of each sample
was standardized to housekeeping genes to control for differences in RNA
loading, quality, and cDNA synthesis. For graphing purposes, the relative
expression levels were scaled such that the expression level of the time-
matched control group was equal to one.
Identification of DREs. Gene regulatory regions (� 10,000 relative to the
transcription start site [TSS] through the 5#-untranslated region [UTR]) were
obtained from the University of California, Santa Cruz, Genome Browser for rat
(assembly v3.4) and mouse (build 34) genes with a mature RefSeq accession.
All sequences were deposited into dbZach, an in-house data management
solution (Burgoon et al., 2006). Core DRE sequences (5#-GCGTG-3#) were
identified using an in-house response element application developed in Java.
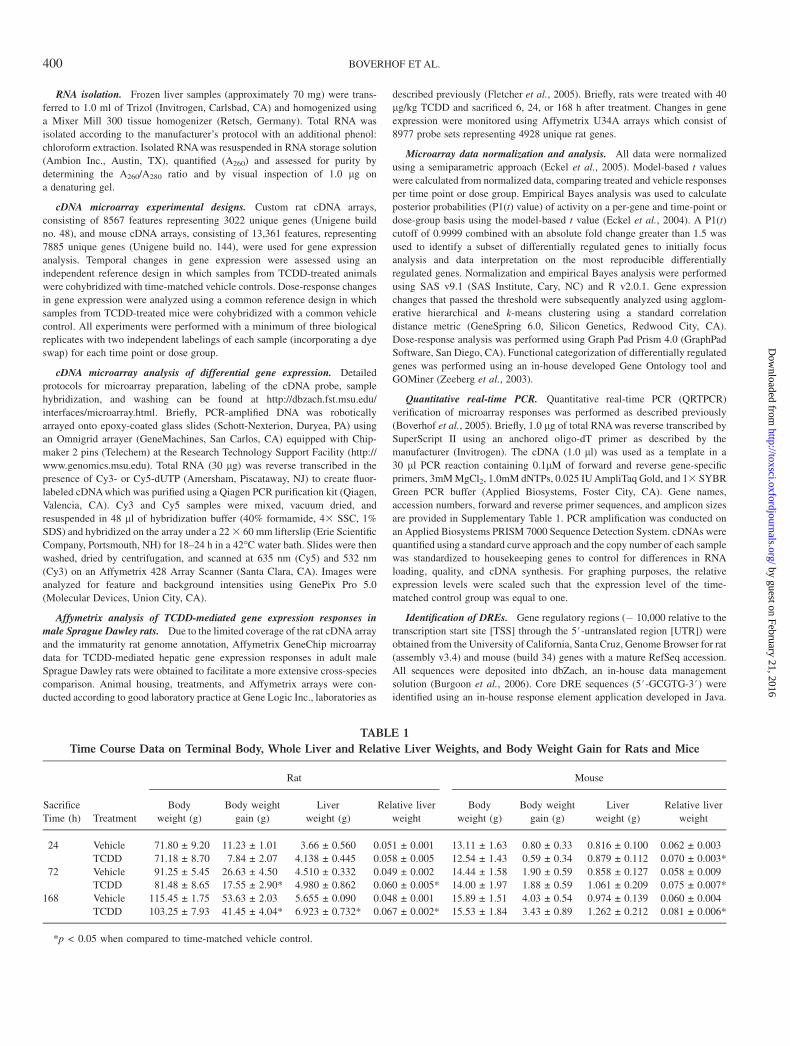
TABLE 1
Time Course Data on Terminal Body, Whole Liver and Relative Liver Weights, and Body Weight Gain for Rats and Mice
Rat Mouse
Sacrifice
Time (h) Treatment
Body
weight (g)
Body weight
gain (g)
Liver
weight (g)
Relative liver
weight
Body
weight (g)
Body weight
gain (g)
Liver
weight (g)
Relative liver
weight
24 Vehicle 71.80 ± 9.20 11.23 ± 1.01 3.66 ± 0.560 0.051 ± 0.001 13.11 ± 1.63 0.80 ± 0.33 0.816 ± 0.100 0.062 ± 0.003
TCDD 71.18 ± 8.70 7.84 ± 2.07 4.138 ± 0.445 0.058 ± 0.005 12.54 ± 1.43 0.59 ± 0.34 0.879 ± 0.112 0.070 ± 0.003*
72 Vehicle 91.25 ± 5.45 26.63 ± 4.50 4.510 ± 0.332 0.049 ± 0.002 14.44 ± 1.58 1.90 ± 0.59 0.858 ± 0.127 0.058 ± 0.009
TCDD 81.48 ± 8.65 17.55 ± 2.90* 4.980 ± 0.862 0.060 ± 0.005* 14.00 ± 1.97 1.88 ± 0.59 1.061 ± 0.209 0.075 ± 0.007*
168 Vehicle 115.45 ± 1.75 53.63 ± 2.03 5.655 ± 0.090 0.048 ± 0.001 15.89 ± 1.51 4.03 ± 0.54 0.974 ± 0.139 0.060 ± 0.004
TCDD 103.25 ± 7.93 41.45 ± 4.04* 6.923 ± 0.732* 0.067 ± 0.002* 15.53 ± 1.84 3.43 ± 0.89 1.262 ± 0.212 0.081 ± 0.006*
*p < 0.05 when compared to time-matched vehicle control.
400 BOVERHOF ET AL.
by guest on February 21, 2016http://toxsci.oxfordjournals.org/
Dow
nloaded from
For identification of conserved DREs, ClustalW was used to align the
regulatory regions of rat and mouse genes, and the resultant consensus
sequence was scanned to identify for DREs.
Statistical analysis. Statistical analysis, unless otherwise defined, was
performed using SAS v9.1. Data were analyzed using analysis of variance
followed by Dunnett or Tukey post hoc tests. Differences between treatment
groups were considered significant when p < 0.05.
RESULTS
Organ and Body Weights
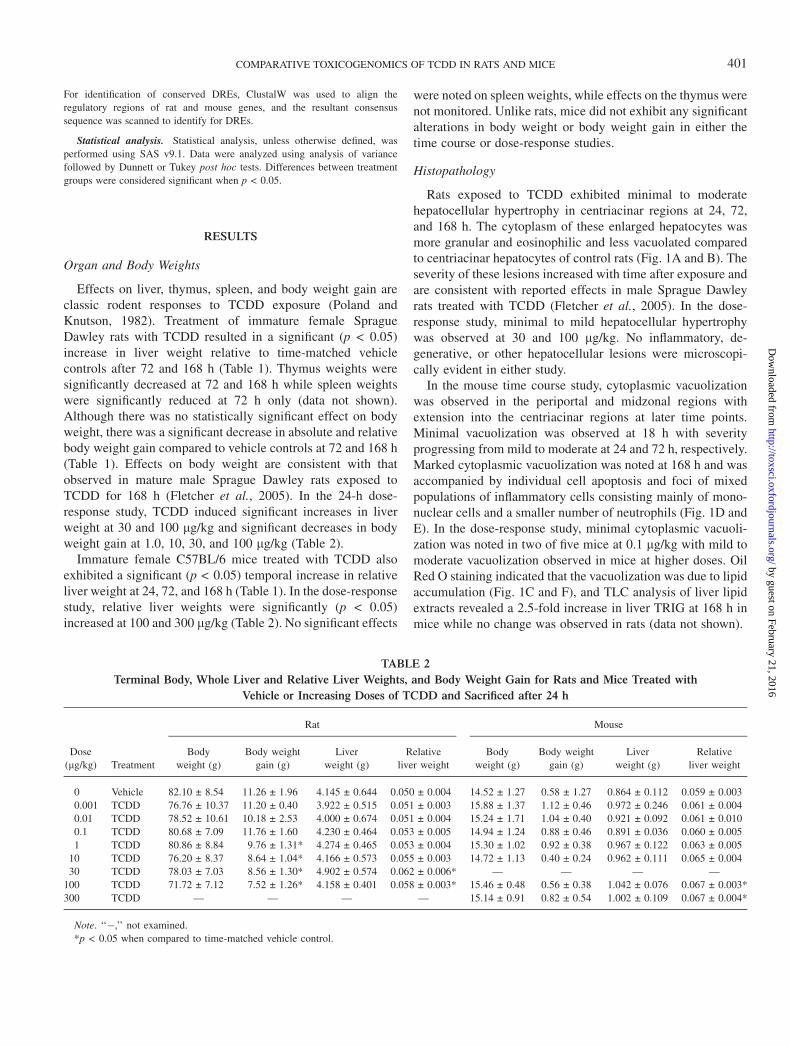
Effects on liver, thymus, spleen, and body weight gain areclassic rodent responses to TCDD exposure (Poland andKnutson, 1982). Treatment of immature female SpragueDawley rats with TCDD resulted in a significant (p < 0.05)increase in liver weight relative to time-matched vehiclecontrols after 72 and 168 h (Table 1). Thymus weights weresignificantly decreased at 72 and 168 h while spleen weightswere significantly reduced at 72 h only (data not shown).Although there was no statistically significant effect on bodyweight, there was a significant decrease in absolute and relativebody weight gain compared to vehicle controls at 72 and 168 h(Table 1). Effects on body weight are consistent with thatobserved in mature male Sprague Dawley rats exposed toTCDD for 168 h (Fletcher et al., 2005). In the 24-h dose-response study, TCDD induced significant increases in liverweight at 30 and 100 lg/kg and significant decreases in bodyweight gain at 1.0, 10, 30, and 100 lg/kg (Table 2).
Immature female C57BL/6 mice treated with TCDD alsoexhibited a significant (p < 0.05) temporal increase in relativeliver weight at 24, 72, and 168 h (Table 1). In the dose-responsestudy, relative liver weights were significantly (p < 0.05)increased at 100 and 300 lg/kg (Table 2). No significant effects
were noted on spleen weights, while effects on the thymus werenot monitored. Unlike rats, mice did not exhibit any significantalterations in body weight or body weight gain in either thetime course or dose-response studies.
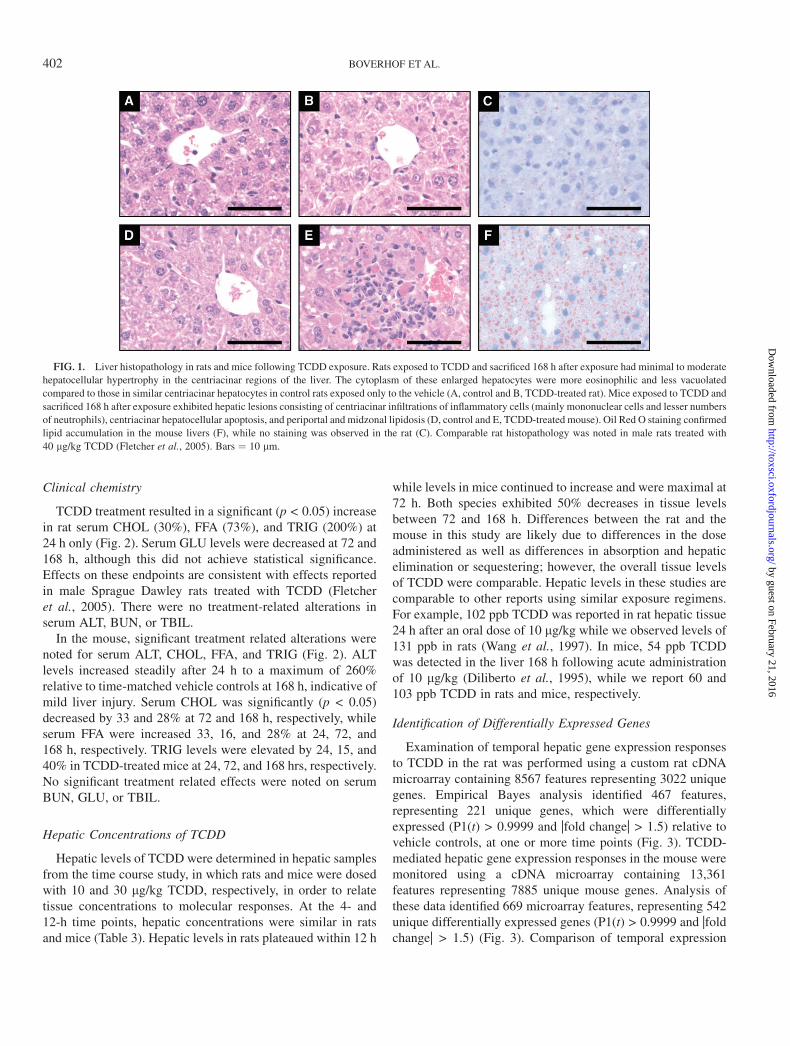
Histopathology
Rats exposed to TCDD exhibited minimal to moderatehepatocellular hypertrophy in centriacinar regions at 24, 72,and 168 h. The cytoplasm of these enlarged hepatocytes wasmore granular and eosinophilic and less vacuolated comparedto centriacinar hepatocytes of control rats (Fig. 1A and B). Theseverity of these lesions increased with time after exposure andare consistent with reported effects in male Sprague Dawleyrats treated with TCDD (Fletcher et al., 2005). In the dose-response study, minimal to mild hepatocellular hypertrophywas observed at 30 and 100 lg/kg. No inflammatory, de-generative, or other hepatocellular lesions were microscopi-cally evident in either study.
In the mouse time course study, cytoplasmic vacuolizationwas observed in the periportal and midzonal regions withextension into the centriacinar regions at later time points.Minimal vacuolization was observed at 18 h with severityprogressing from mild to moderate at 24 and 72 h, respectively.Marked cytoplasmic vacuolization was noted at 168 h and wasaccompanied by individual cell apoptosis and foci of mixedpopulations of inflammatory cells consisting mainly of mono-nuclear cells and a smaller number of neutrophils (Fig. 1D andE). In the dose-response study, minimal cytoplasmic vacuoli-zation was noted in two of five mice at 0.1 lg/kg with mild tomoderate vacuolization observed in mice at higher doses. OilRed O staining indicated that the vacuolization was due to lipidaccumulation (Fig. 1C and F), and TLC analysis of liver lipidextracts revealed a 2.5-fold increase in liver TRIG at 168 h inmice while no change was observed in rats (data not shown).
TABLE 2
Terminal Body, Whole Liver and Relative Liver Weights, and Body Weight Gain for Rats and Mice Treated with
Vehicle or Increasing Doses of TCDD and Sacrificed after 24 h
Rat Mouse
Dose
(lg/kg) Treatment
Body
weight (g)
Body weight
gain (g)
Liver
weight (g)
Relative
liver weight
Body
weight (g)
Body weight
gain (g)
Liver
weight (g)
Relative
liver weight
0 Vehicle 82.10 ± 8.54 11.26 ± 1.96 4.145 ± 0.644 0.050 ± 0.004 14.52 ± 1.27 0.58 ± 1.27 0.864 ± 0.112 0.059 ± 0.003
0.001 TCDD 76.76 ± 10.37 11.20 ± 0.40 3.922 ± 0.515 0.051 ± 0.003 15.88 ± 1.37 1.12 ± 0.46 0.972 ± 0.246 0.061 ± 0.004
0.01 TCDD 78.52 ± 10.61 10.18 ± 2.53 4.000 ± 0.674 0.051 ± 0.004 15.24 ± 1.71 1.04 ± 0.40 0.921 ± 0.092 0.061 ± 0.010
0.1 TCDD 80.68 ± 7.09 11.76 ± 1.60 4.230 ± 0.464 0.053 ± 0.005 14.94 ± 1.24 0.88 ± 0.46 0.891 ± 0.036 0.060 ± 0.005
1 TCDD 80.86 ± 8.84 9.76 ± 1.31* 4.274 ± 0.465 0.053 ± 0.004 15.30 ± 1.02 0.92 ± 0.38 0.967 ± 0.122 0.063 ± 0.005
10 TCDD 76.20 ± 8.37 8.64 ± 1.04* 4.166 ± 0.573 0.055 ± 0.003 14.72 ± 1.13 0.40 ± 0.24 0.962 ± 0.111 0.065 ± 0.004
30 TCDD 78.03 ± 7.03 8.56 ± 1.30* 4.902 ± 0.574 0.062 ± 0.006* — — — —
100 TCDD 71.72 ± 7.12 7.52 ± 1.26* 4.158 ± 0.401 0.058 ± 0.003* 15.46 ± 0.48 0.56 ± 0.38 1.042 ± 0.076 0.067 ± 0.003*
300 TCDD — — — — 15.14 ± 0.91 0.82 ± 0.54 1.002 ± 0.109 0.067 ± 0.004*
Note. ‘‘�,’’ not examined.
*p < 0.05 when compared to time-matched vehicle control.
COMPARATIVE TOXICOGENOMICS OF TCDD IN RATS AND MICE 401
by guest on February 21, 2016http://toxsci.oxfordjournals.org/
Dow
nloaded from
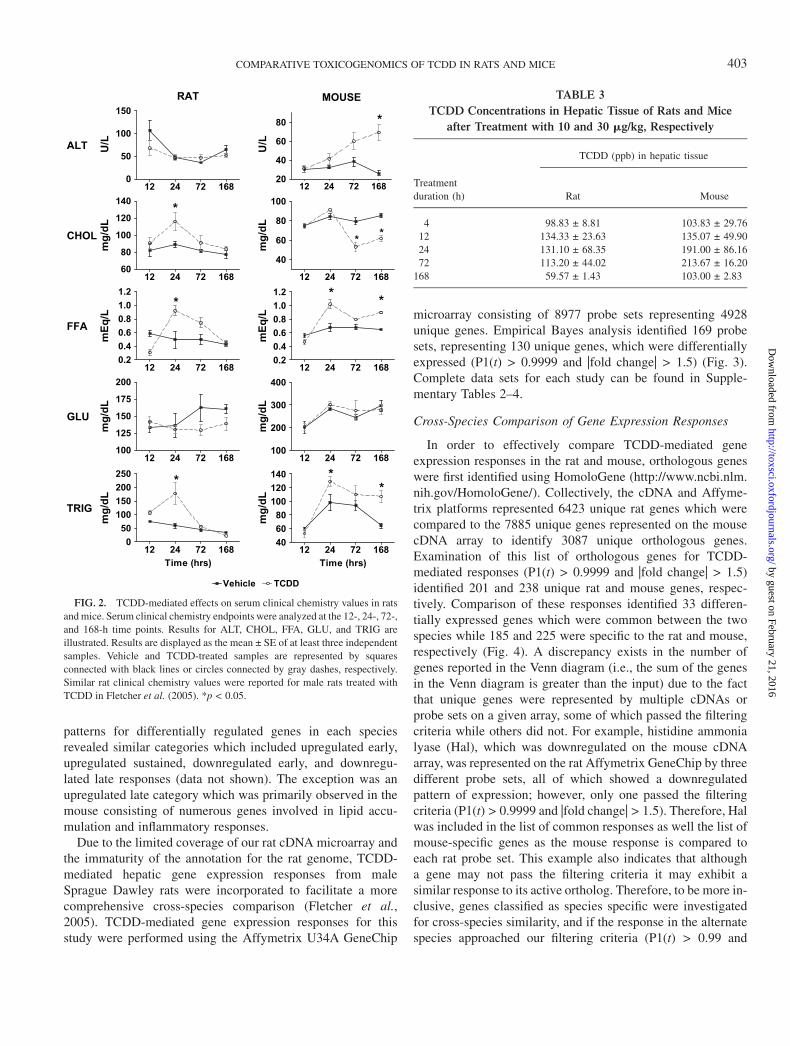
Clinical chemistry
TCDD treatment resulted in a significant (p < 0.05) increasein rat serum CHOL (30%), FFA (73%), and TRIG (200%) at24 h only (Fig. 2). Serum GLU levels were decreased at 72 and168 h, although this did not achieve statistical significance.Effects on these endpoints are consistent with effects reportedin male Sprague Dawley rats treated with TCDD (Fletcheret al., 2005). There were no treatment-related alterations inserum ALT, BUN, or TBIL.
In the mouse, significant treatment related alterations werenoted for serum ALT, CHOL, FFA, and TRIG (Fig. 2). ALTlevels increased steadily after 24 h to a maximum of 260%relative to time-matched vehicle controls at 168 h, indicative ofmild liver injury. Serum CHOL was significantly (p < 0.05)decreased by 33 and 28% at 72 and 168 h, respectively, whileserum FFA were increased 33, 16, and 28% at 24, 72, and168 h, respectively. TRIG levels were elevated by 24, 15, and40% in TCDD-treated mice at 24, 72, and 168 hrs, respectively.No significant treatment related effects were noted on serumBUN, GLU, or TBIL.
Hepatic Concentrations of TCDD
Hepatic levels of TCDD were determined in hepatic samplesfrom the time course study, in which rats and mice were dosedwith 10 and 30 lg/kg TCDD, respectively, in order to relatetissue concentrations to molecular responses. At the 4- and12-h time points, hepatic concentrations were similar in ratsand mice (Table 3). Hepatic levels in rats plateaued within 12 h
while levels in mice continued to increase and were maximal at72 h. Both species exhibited 50% decreases in tissue levelsbetween 72 and 168 h. Differences between the rat and themouse in this study are likely due to differences in the doseadministered as well as differences in absorption and hepaticelimination or sequestering; however, the overall tissue levelsof TCDD were comparable. Hepatic levels in these studies arecomparable to other reports using similar exposure regimens.For example, 102 ppb TCDD was reported in rat hepatic tissue24 h after an oral dose of 10 lg/kg while we observed levels of131 ppb in rats (Wang et al., 1997). In mice, 54 ppb TCDDwas detected in the liver 168 h following acute administrationof 10 lg/kg (Diliberto et al., 1995), while we report 60 and103 ppb TCDD in rats and mice, respectively.
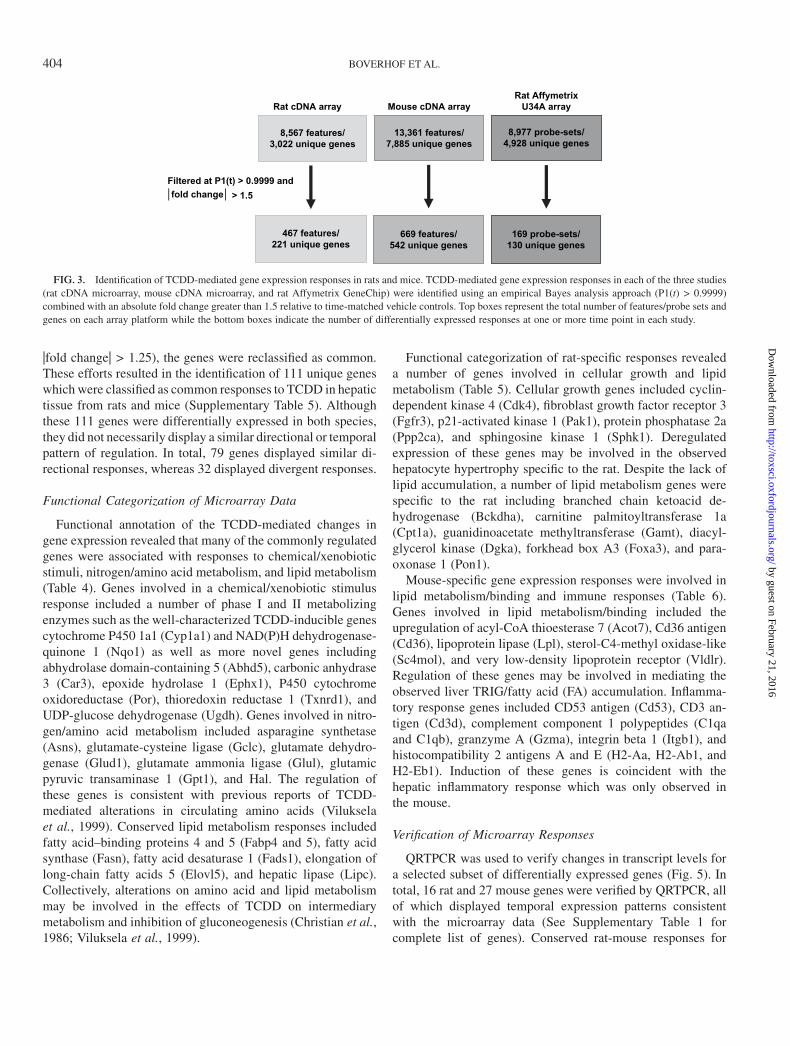
Identification of Differentially Expressed Genes
Examination of temporal hepatic gene expression responsesto TCDD in the rat was performed using a custom rat cDNAmicroarray containing 8567 features representing 3022 uniquegenes. Empirical Bayes analysis identified 467 features,representing 221 unique genes, which were differentiallyexpressed (P1(t) > 0.9999 and |fold change| > 1.5) relative tovehicle controls, at one or more time points (Fig. 3). TCDD-mediated hepatic gene expression responses in the mouse weremonitored using a cDNA microarray containing 13,361features representing 7885 unique mouse genes. Analysis ofthese data identified 669 microarray features, representing 542unique differentially expressed genes (P1(t) > 0.9999 and |foldchange| > 1.5) (Fig. 3). Comparison of temporal expression
FIG. 1. Liver histopathology in rats and mice following TCDD exposure. Rats exposed to TCDD and sacrificed 168 h after exposure had minimal to moderate
hepatocellular hypertrophy in the centriacinar regions of the liver. The cytoplasm of these enlarged hepatocytes were more eosinophilic and less vacuolated
compared to those in similar centriacinar hepatocytes in control rats exposed only to the vehicle (A, control and B, TCDD-treated rat). Mice exposed to TCDD and
sacrificed 168 h after exposure exhibited hepatic lesions consisting of centriacinar infiltrations of inflammatory cells (mainly mononuclear cells and lesser numbers
of neutrophils), centriacinar hepatocellular apoptosis, and periportal and midzonal lipidosis (D, control and E, TCDD-treated mouse). Oil Red O staining confirmed
lipid accumulation in the mouse livers (F), while no staining was observed in the rat (C). Comparable rat histopathology was noted in male rats treated with
40 lg/kg TCDD (Fletcher et al., 2005). Bars ¼ 10 lm.
402 BOVERHOF ET AL.
by guest on February 21, 2016http://toxsci.oxfordjournals.org/
Dow
nloaded from
patterns for differentially regulated genes in each speciesrevealed similar categories which included upregulated early,upregulated sustained, downregulated early, and downregu-lated late responses (data not shown). The exception was anupregulated late category which was primarily observed in themouse consisting of numerous genes involved in lipid accu-mulation and inflammatory responses.
Due to the limited coverage of our rat cDNA microarray andthe immaturity of the annotation for the rat genome, TCDD-mediated hepatic gene expression responses from maleSprague Dawley rats were incorporated to facilitate a morecomprehensive cross-species comparison (Fletcher et al.,2005). TCDD-mediated gene expression responses for thisstudy were performed using the Affymetrix U34A GeneChip
microarray consisting of 8977 probe sets representing 4928unique genes. Empirical Bayes analysis identified 169 probesets, representing 130 unique genes, which were differentiallyexpressed (P1(t) > 0.9999 and |fold change| > 1.5) (Fig. 3).Complete data sets for each study can be found in Supple-mentary Tables 2–4.
Cross-Species Comparison of Gene Expression Responses
In order to effectively compare TCDD-mediated geneexpression responses in the rat and mouse, orthologous geneswere first identified using HomoloGene (http://www.ncbi.nlm.nih.gov/HomoloGene/). Collectively, the cDNA and Affyme-trix platforms represented 6423 unique rat genes which werecompared to the 7885 unique genes represented on the mousecDNA array to identify 3087 unique orthologous genes.Examination of this list of orthologous genes for TCDD-mediated responses (P1(t) > 0.9999 and |fold change| > 1.5)identified 201 and 238 unique rat and mouse genes, respec-tively. Comparison of these responses identified 33 differen-tially expressed genes which were common between the twospecies while 185 and 225 were specific to the rat and mouse,respectively (Fig. 4). A discrepancy exists in the number ofgenes reported in the Venn diagram (i.e., the sum of the genesin the Venn diagram is greater than the input) due to the factthat unique genes were represented by multiple cDNAs orprobe sets on a given array, some of which passed the filteringcriteria while others did not. For example, histidine ammonialyase (Hal), which was downregulated on the mouse cDNAarray, was represented on the rat Affymetrix GeneChip by threedifferent probe sets, all of which showed a downregulatedpattern of expression; however, only one passed the filteringcriteria (P1(t) > 0.9999 and |fold change| > 1.5). Therefore, Halwas included in the list of common responses as well the list ofmouse-specific genes as the mouse response is compared toeach rat probe set. This example also indicates that althougha gene may not pass the filtering criteria it may exhibit asimilar response to its active ortholog. Therefore, to be more in-clusive, genes classified as species specific were investigatedfor cross-species similarity, and if the response in the alternatespecies approached our filtering criteria (P1(t) > 0.99 and
12 24 72 168
0
50
100
150
U/L
12 24 72 168
20
40
60
80 *
TCDDVehicle
12 24 72 168
60
80
100
120
140
*
mg
/d
L
12 24 72 168
40
60
80
100
**
12 24 72 168
0.2
0.4
0.6
0.8
1.0
1.2
*
mE
q/L
12 24 72 168
0.2
0.4
0.6
0.8
1.0
1.2
**
12 24 72 168
100
125
150
175
200
mg
/d
L
12 24 72 168
100
200
300
400
12 24 72 168
0
50
100
150
200
250
*
Time (hrs)
mg
/d
L
U/L
mg
/d
Lm
Eq
/L
mg
/d
Lm
g/d
L
12 24 72 168
40
60
80
100
120
140 *
*
Time (hrs)
RAT MOUSE
ALT
TRIG
GLU
FFA
CHOL
FIG. 2. TCDD-mediated effects on serum clinical chemistry values in rats
and mice. Serum clinical chemistry endpoints were analyzed at the 12-, 24-, 72-,
and 168-h time points. Results for ALT, CHOL, FFA, GLU, and TRIG are
illustrated. Results are displayed as the mean ± SE of at least three independent
samples. Vehicle and TCDD-treated samples are represented by squares
connected with black lines or circles connected by gray dashes, respectively.
Similar rat clinical chemistry values were reported for male rats treated with
TCDD in Fletcher et al. (2005). *p < 0.05.
TABLE 3
TCDD Concentrations in Hepatic Tissue of Rats and Mice
after Treatment with 10 and 30 mg/kg, Respectively
TCDD (ppb) in hepatic tissue
Treatment
duration (h) Rat Mouse
4 98.83 ± 8.81 103.83 ± 29.76
12 134.33 ± 23.63 135.07 ± 49.90
24 131.10 ± 68.35 191.00 ± 86.16
72 113.20 ± 44.02 213.67 ± 16.20
168 59.57 ± 1.43 103.00 ± 2.83
COMPARATIVE TOXICOGENOMICS OF TCDD IN RATS AND MICE 403
by guest on February 21, 2016http://toxsci.oxfordjournals.org/
Dow
nloaded from
|fold change| > 1.25), the genes were reclassified as common.These efforts resulted in the identification of 111 unique geneswhich were classified as common responses to TCDD in hepatictissue from rats and mice (Supplementary Table 5). Althoughthese 111 genes were differentially expressed in both species,they did not necessarily display a similar directional or temporalpattern of regulation. In total, 79 genes displayed similar di-rectional responses, whereas 32 displayed divergent responses.
Functional Categorization of Microarray Data
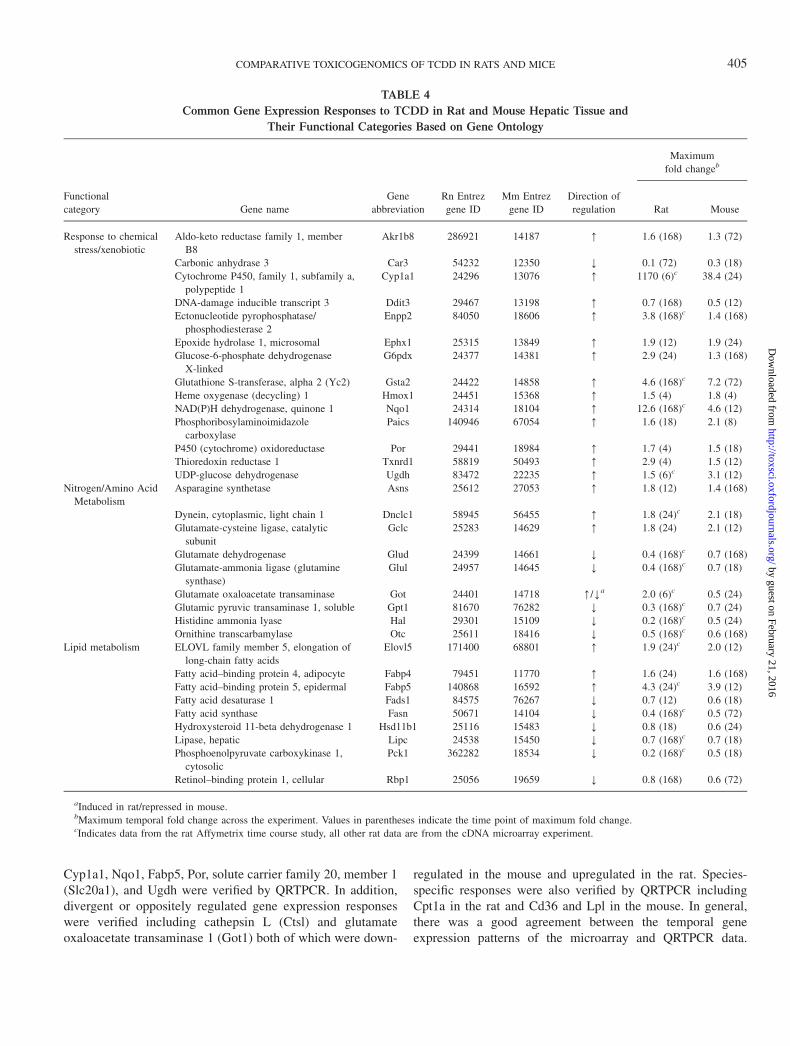
Functional annotation of the TCDD-mediated changes ingene expression revealed that many of the commonly regulatedgenes were associated with responses to chemical/xenobioticstimuli, nitrogen/amino acid metabolism, and lipid metabolism(Table 4). Genes involved in a chemical/xenobiotic stimulusresponse included a number of phase I and II metabolizingenzymes such as the well-characterized TCDD-inducible genescytochrome P450 1a1 (Cyp1a1) and NAD(P)H dehydrogenase-quinone 1 (Nqo1) as well as more novel genes includingabhydrolase domain-containing 5 (Abhd5), carbonic anhydrase3 (Car3), epoxide hydrolase 1 (Ephx1), P450 cytochromeoxidoreductase (Por), thioredoxin reductase 1 (Txnrd1), andUDP-glucose dehydrogenase (Ugdh). Genes involved in nitro-gen/amino acid metabolism included asparagine synthetase(Asns), glutamate-cysteine ligase (Gclc), glutamate dehydro-genase (Glud1), glutamate ammonia ligase (Glul), glutamicpyruvic transaminase 1 (Gpt1), and Hal. The regulation ofthese genes is consistent with previous reports of TCDD-mediated alterations in circulating amino acids (Vilukselaet al., 1999). Conserved lipid metabolism responses includedfatty acid–binding proteins 4 and 5 (Fabp4 and 5), fatty acidsynthase (Fasn), fatty acid desaturase 1 (Fads1), elongation oflong-chain fatty acids 5 (Elovl5), and hepatic lipase (Lipc).Collectively, alterations on amino acid and lipid metabolismmay be involved in the effects of TCDD on intermediarymetabolism and inhibition of gluconeogenesis (Christian et al.,1986; Viluksela et al., 1999).
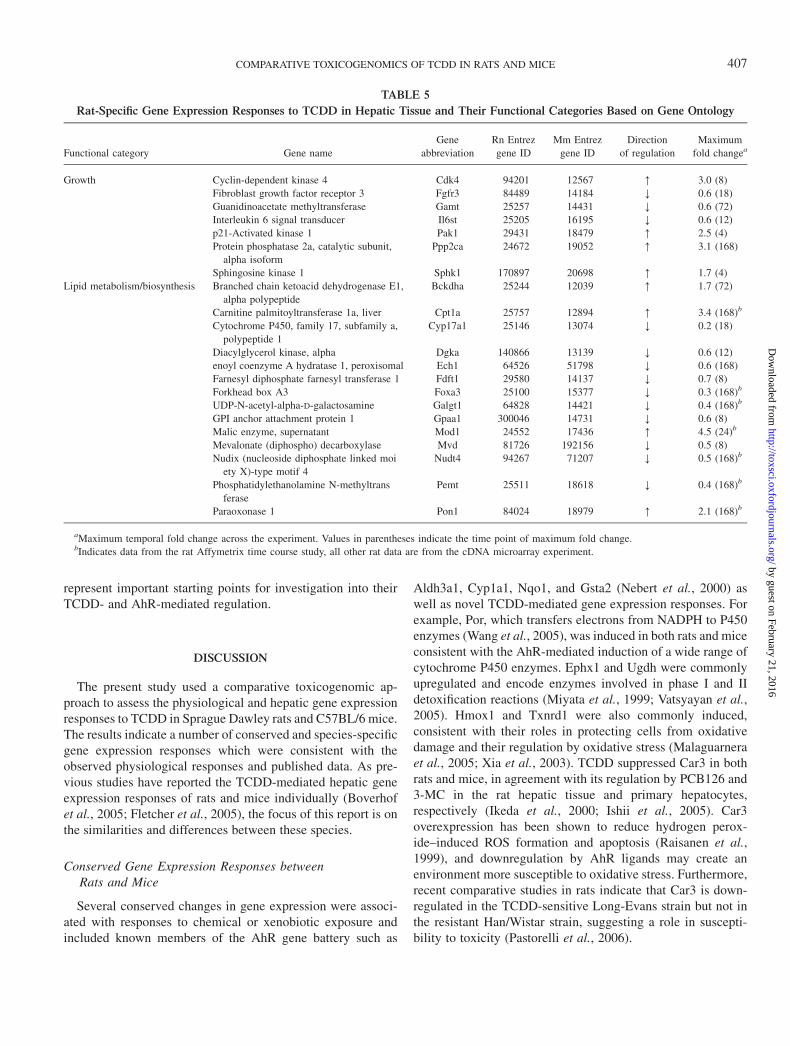
Functional categorization of rat-specific responses revealeda number of genes involved in cellular growth and lipidmetabolism (Table 5). Cellular growth genes included cyclin-dependent kinase 4 (Cdk4), fibroblast growth factor receptor 3(Fgfr3), p21-activated kinase 1 (Pak1), protein phosphatase 2a(Ppp2ca), and sphingosine kinase 1 (Sphk1). Deregulatedexpression of these genes may be involved in the observedhepatocyte hypertrophy specific to the rat. Despite the lack oflipid accumulation, a number of lipid metabolism genes werespecific to the rat including branched chain ketoacid de-hydrogenase (Bckdha), carnitine palmitoyltransferase 1a(Cpt1a), guanidinoacetate methyltransferase (Gamt), diacyl-glycerol kinase (Dgka), forkhead box A3 (Foxa3), and para-oxonase 1 (Pon1).
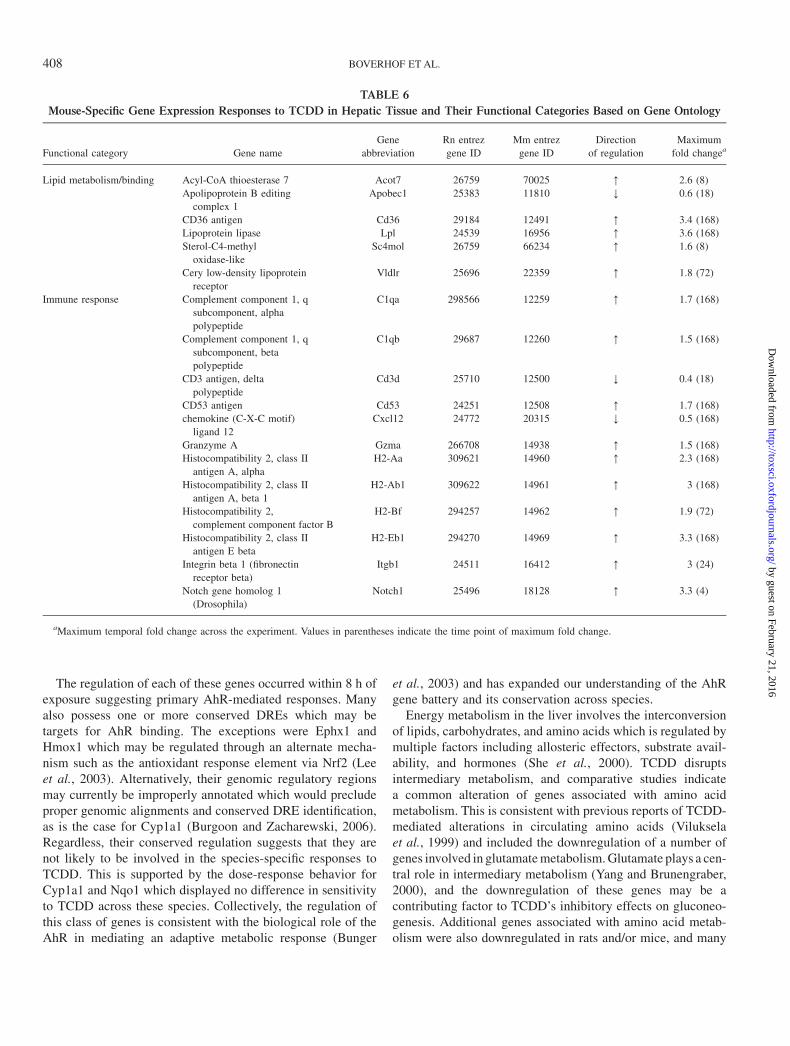
Mouse-specific gene expression responses were involved inlipid metabolism/binding and immune responses (Table 6).Genes involved in lipid metabolism/binding included theupregulation of acyl-CoA thioesterase 7 (Acot7), Cd36 antigen(Cd36), lipoprotein lipase (Lpl), sterol-C4-methyl oxidase-like(Sc4mol), and very low-density lipoprotein receptor (Vldlr).Regulation of these genes may be involved in mediating theobserved liver TRIG/fatty acid (FA) accumulation. Inflamma-tory response genes included CD53 antigen (Cd53), CD3 an-tigen (Cd3d), complement component 1 polypeptides (C1qaand C1qb), granzyme A (Gzma), integrin beta 1 (Itgb1), andhistocompatibility 2 antigens A and E (H2-Aa, H2-Ab1, andH2-Eb1). Induction of these genes is coincident with thehepatic inflammatory response which was only observed inthe mouse.
Verification of Microarray Responses
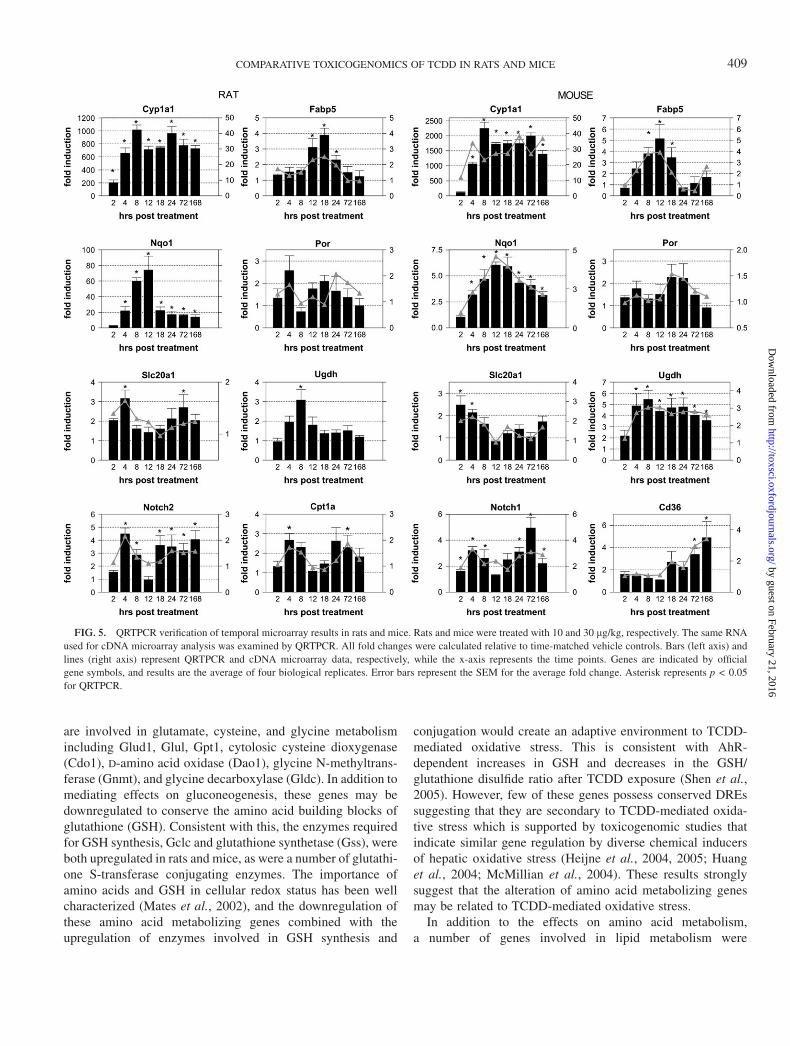
QRTPCR was used to verify changes in transcript levels fora selected subset of differentially expressed genes (Fig. 5). Intotal, 16 rat and 27 mouse genes were verified by QRTPCR, allof which displayed temporal expression patterns consistentwith the microarray data (See Supplementary Table 1 forcomplete list of genes). Conserved rat-mouse responses for
Filtered at P1(t) > 0.9999 and
fold change > 1.5
Rat Affymetrix
U34A array
8,977 probe-sets/
4,928 unique genes
169 probe-sets/
130 unique genes
Rat cDNA array
8,567 features/
3,022 unique genes
467 features/
221 unique genes
Mouse cDNA array
13,361 features/
7,885 unique genes
669 features/
542 unique genes
FIG. 3. Identification of TCDD-mediated gene expression responses in rats and mice. TCDD-mediated gene expression responses in each of the three studies
(rat cDNA microarray, mouse cDNA microarray, and rat Affymetrix GeneChip) were identified using an empirical Bayes analysis approach (P1(t) > 0.9999)
combined with an absolute fold change greater than 1.5 relative to time-matched vehicle controls. Top boxes represent the total number of features/probe sets and
genes on each array platform while the bottom boxes indicate the number of differentially expressed responses at one or more time point in each study.
404 BOVERHOF ET AL.
by guest on February 21, 2016http://toxsci.oxfordjournals.org/
Dow
nloaded from
Cyp1a1, Nqo1, Fabp5, Por, solute carrier family 20, member 1(Slc20a1), and Ugdh were verified by QRTPCR. In addition,divergent or oppositely regulated gene expression responseswere verified including cathepsin L (Ctsl) and glutamateoxaloacetate transaminase 1 (Got1) both of which were down-
regulated in the mouse and upregulated in the rat. Species-specific responses were also verified by QRTPCR includingCpt1a in the rat and Cd36 and Lpl in the mouse. In general,there was a good agreement between the temporal geneexpression patterns of the microarray and QRTPCR data.
TABLE 4
Common Gene Expression Responses to TCDD in Rat and Mouse Hepatic Tissue and
Their Functional Categories Based on Gene Ontology
Maximum
fold changeb
Functional
category Gene name
Gene
abbreviation
Rn Entrez
gene ID
Mm Entrez
gene ID
Direction of
regulation Rat Mouse
Response to chemical
stress/xenobiotic
Aldo-keto reductase family 1, member
B8
Akr1b8 286921 14187 [ 1.6 (168) 1.3 (72)
Carbonic anhydrase 3 Car3 54232 12350 Y 0.1 (72) 0.3 (18)
Cytochrome P450, family 1, subfamily a,
polypeptide 1
Cyp1a1 24296 13076 [ 1170 (6)c 38.4 (24)
DNA-damage inducible transcript 3 Ddit3 29467 13198 [ 0.7 (168) 0.5 (12)
Ectonucleotide pyrophosphatase/
phosphodiesterase 2
Enpp2 84050 18606 [ 3.8 (168)c 1.4 (168)
Epoxide hydrolase 1, microsomal Ephx1 25315 13849 [ 1.9 (12) 1.9 (24)
Glucose-6-phosphate dehydrogenase
X-linked
G6pdx 24377 14381 [ 2.9 (24) 1.3 (168)
Glutathione S-transferase, alpha 2 (Yc2) Gsta2 24422 14858 [ 4.6 (168)c 7.2 (72)
Heme oxygenase (decycling) 1 Hmox1 24451 15368 [ 1.5 (4) 1.8 (4)
NAD(P)H dehydrogenase, quinone 1 Nqo1 24314 18104 [ 12.6 (168)c 4.6 (12)
Phosphoribosylaminoimidazole
carboxylase
Paics 140946 67054 [ 1.6 (18) 2.1 (8)
P450 (cytochrome) oxidoreductase Por 29441 18984 [ 1.7 (4) 1.5 (18)
Thioredoxin reductase 1 Txnrd1 58819 50493 [ 2.9 (4) 1.5 (12)
UDP-glucose dehydrogenase Ugdh 83472 22235 [ 1.5 (6)c 3.1 (12)
Nitrogen/Amino Acid
Metabolism
Asparagine synthetase Asns 25612 27053 [ 1.8 (12) 1.4 (168)
Dynein, cytoplasmic, light chain 1 Dnclc1 58945 56455 [ 1.8 (24)c 2.1 (18)
Glutamate-cysteine ligase, catalytic
subunit
Gclc 25283 14629 [ 1.8 (24) 2.1 (12)
Glutamate dehydrogenase Glud 24399 14661 Y 0.4 (168)c 0.7 (168)
Glutamate-ammonia ligase (glutamine
synthase)
Glul 24957 14645 Y 0.4 (168)c 0.7 (18)
Glutamate oxaloacetate transaminase Got 24401 14718 [/Ya 2.0 (6)c 0.5 (24)
Glutamic pyruvic transaminase 1, soluble Gpt1 81670 76282 Y 0.3 (168)c 0.7 (24)
Histidine ammonia lyase Hal 29301 15109 Y 0.2 (168)c 0.5 (24)
Ornithine transcarbamylase Otc 25611 18416 Y 0.5 (168)c 0.6 (168)
Lipid metabolism ELOVL family member 5, elongation of
long-chain fatty acids
Elovl5 171400 68801 [ 1.9 (24)c 2.0 (12)
Fatty acid–binding protein 4, adipocyte Fabp4 79451 11770 [ 1.6 (24) 1.6 (168)
Fatty acid–binding protein 5, epidermal Fabp5 140868 16592 [ 4.3 (24)c 3.9 (12)
Fatty acid desaturase 1 Fads1 84575 76267 Y 0.7 (12) 0.6 (18)
Fatty acid synthase Fasn 50671 14104 Y 0.4 (168)c 0.5 (72)
Hydroxysteroid 11-beta dehydrogenase 1 Hsd11b1 25116 15483 Y 0.8 (18) 0.6 (24)
Lipase, hepatic Lipc 24538 15450 Y 0.7 (168)c 0.7 (18)
Phosphoenolpyruvate carboxykinase 1,
cytosolic
Pck1 362282 18534 Y 0.2 (168)c 0.5 (18)
Retinol–binding protein 1, cellular Rbp1 25056 19659 Y 0.8 (168) 0.6 (72)
aInduced in rat/repressed in mouse.bMaximum temporal fold change across the experiment. Values in parentheses indicate the time point of maximum fold change.cIndicates data from the rat Affymetrix time course study, all other rat data are from the cDNA microarray experiment.
COMPARATIVE TOXICOGENOMICS OF TCDD IN RATS AND MICE 405
by guest on February 21, 2016http://toxsci.oxfordjournals.org/
Dow
nloaded from
The microarray induction profile of Por was confirmed byQRTPCR and approached, but did not reach, statisticalsignificance due to temporal variability in the vehicle group.Microarray data compression was evident for genes such asCyp1a1 due to the smaller dynamic fluorescence intensityrange (0–65,535) of the microarrays which resulted in signalsaturation and compression of the true induction. Cross-hybridization of homologous probes to a given target sequenceon the microarray may also be a contributing factor especiallyin comparison to other, more gene-specific, measurementtechniques such as QRTPCR (Yuen et al., 2002).
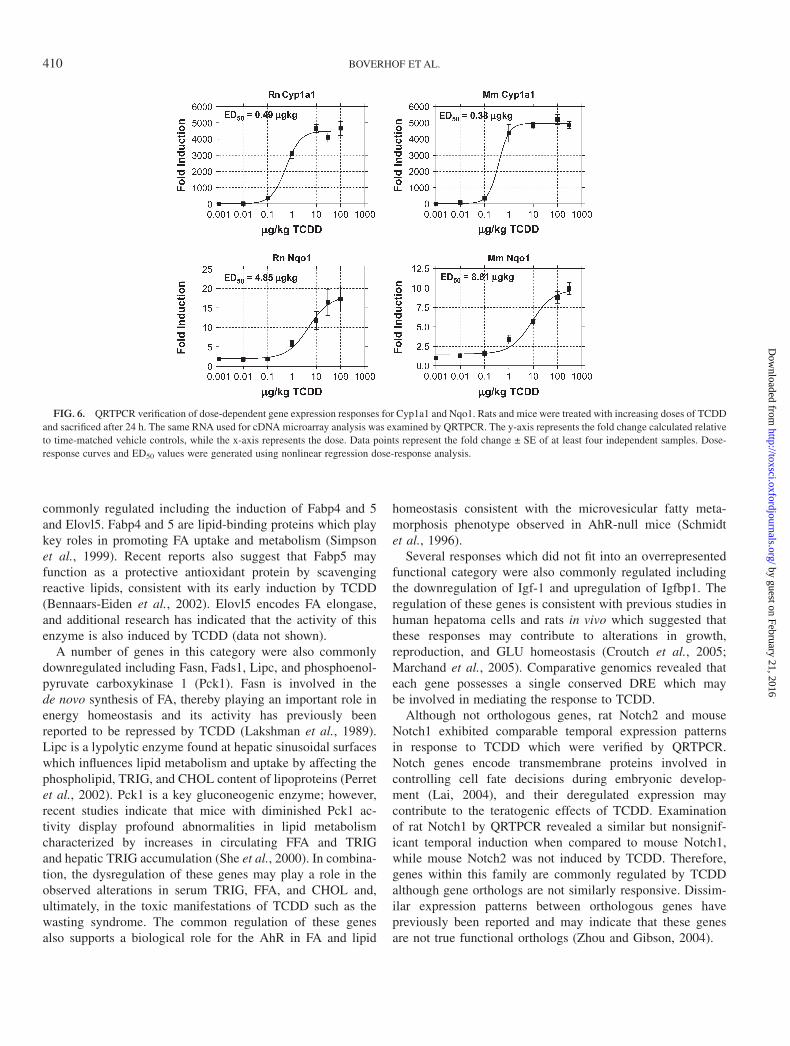
Dose-Response Analysis
Comparison of the dose-response and temporal data withineach species revealed a high correlation (r > 0.95) betweengene expression responses at their respective doses and timepoints. These data indicate the reproducibility of theseresponses across independent experiments for each species.Comparison of dose-response data across species for com-monly regulated genes did not reveal any overall differences inthe sensitivity to gene expression regulation across specieswhich was verified by QRTPCR for Cyp1a1 and Nqo1. Bothgenes were similarly induced in each species with Cyp1a1displaying ED50 values of 0.49 and 0.38 lg/kg in rats and mice,
respectively, while Nqo1 exhibited ED50 values of 4.85 and8.81 lg/kg, respectively (Fig. 6). These results suggest similarsensitivity for common TCDD-mediated gene expressionresponses across these species.
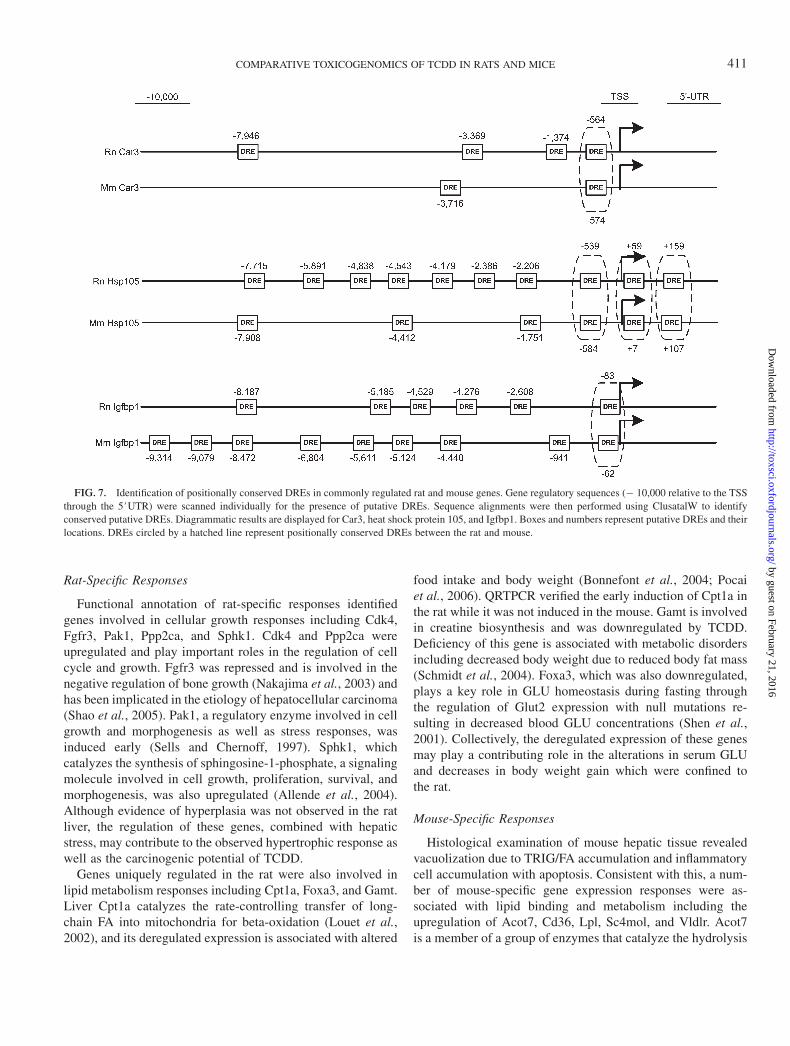
Identification of Conserved Putative DREs
The 111 genes classified as commonly regulated between therat and mouse were scanned for the DRE core sequence (5#-GCGTG-3#) in the range of � 10,000 relative to the TSSthrough the 5#UTR. The gene regulatory sequences wereobtained for all 111 mouse genes but only 95 rat genes dueto the incomplete annotation for this genome. The analysesrevealed that 94 rat and 110 mouse genes possessed one ormore DRE core elements with 94 possessing a DRE in both therat and mouse. Cross-species alignments revealed that 53 of the94 genes contained one or more positionally conserved DREs(Table 7 and Fig. 7) which have a higher likelihood of beingfunctional due to their evolutionary conservation (Frazer et al.,2003; McGuire et al., 2000). This included a number of genespreviously shown to be regulated in response to AhR ligandsincluding Car3 (Ikeda et al., 2000), Igf1 (Croutch et al., 2005),insulin-like growth factor–binding protein 1 (Igfbp1)(Marchand et al., 2005), Pck1 (Stahl et al., 1992), and Ugdh(Sun et al., 2004). The conserved putative DREs in these genes
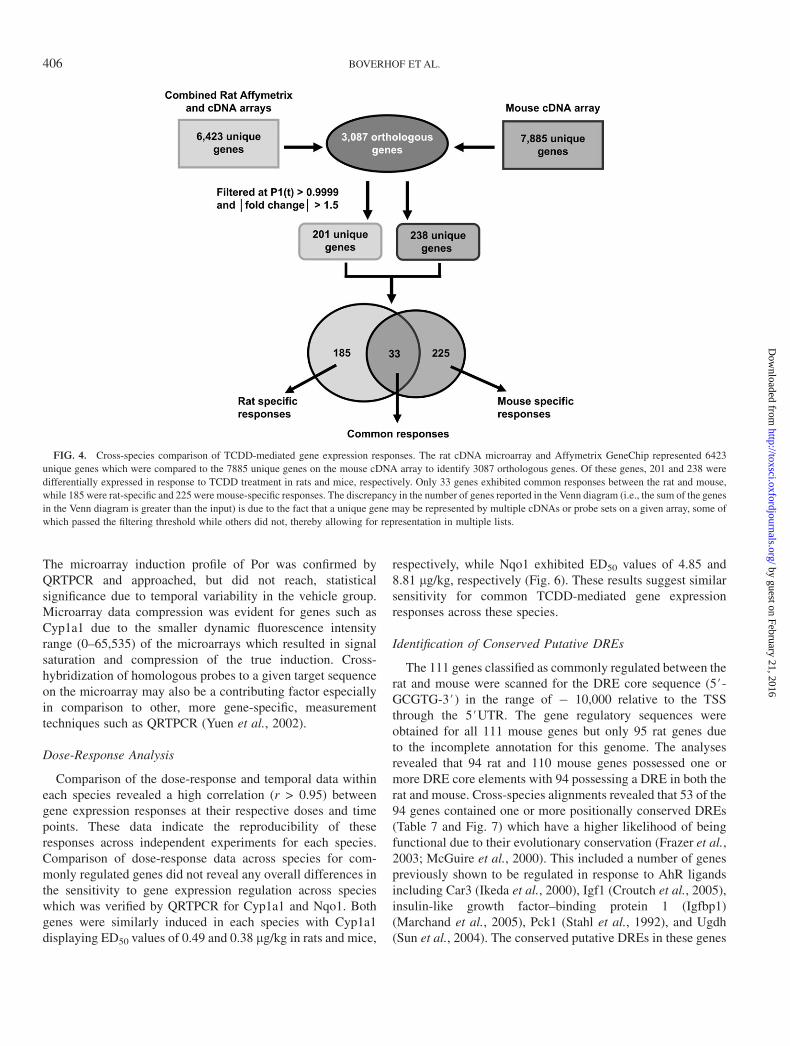
FIG. 4. Cross-species comparison of TCDD-mediated gene expression responses. The rat cDNA microarray and Affymetrix GeneChip represented 6423
unique genes which were compared to the 7885 unique genes on the mouse cDNA array to identify 3087 orthologous genes. Of these genes, 201 and 238 were
differentially expressed in response to TCDD treatment in rats and mice, respectively. Only 33 genes exhibited common responses between the rat and mouse,
while 185 were rat-specific and 225 were mouse-specific responses. The discrepancy in the number of genes reported in the Venn diagram (i.e., the sum of the genes
in the Venn diagram is greater than the input) is due to the fact that a unique gene may be represented by multiple cDNAs or probe sets on a given array, some of
which passed the filtering threshold while others did not, thereby allowing for representation in multiple lists.
406 BOVERHOF ET AL.
by guest on February 21, 2016http://toxsci.oxfordjournals.org/
Dow
nloaded from
represent important starting points for investigation into theirTCDD- and AhR-mediated regulation.
DISCUSSION
The present study used a comparative toxicogenomic ap-proach to assess the physiological and hepatic gene expressionresponses to TCDD in Sprague Dawley rats and C57BL/6 mice.The results indicate a number of conserved and species-specificgene expression responses which were consistent with theobserved physiological responses and published data. As pre-vious studies have reported the TCDD-mediated hepatic geneexpression responses of rats and mice individually (Boverhofet al., 2005; Fletcher et al., 2005), the focus of this report is onthe similarities and differences between these species.
Conserved Gene Expression Responses betweenRats and Mice
Several conserved changes in gene expression were associ-ated with responses to chemical or xenobiotic exposure andincluded known members of the AhR gene battery such as
Aldh3a1, Cyp1a1, Nqo1, and Gsta2 (Nebert et al., 2000) aswell as novel TCDD-mediated gene expression responses. Forexample, Por, which transfers electrons from NADPH to P450enzymes (Wang et al., 2005), was induced in both rats and miceconsistent with the AhR-mediated induction of a wide range ofcytochrome P450 enzymes. Ephx1 and Ugdh were commonlyupregulated and encode enzymes involved in phase I and IIdetoxification reactions (Miyata et al., 1999; Vatsyayan et al.,2005). Hmox1 and Txnrd1 were also commonly induced,consistent with their roles in protecting cells from oxidativedamage and their regulation by oxidative stress (Malaguarneraet al., 2005; Xia et al., 2003). TCDD suppressed Car3 in bothrats and mice, in agreement with its regulation by PCB126 and3-MC in the rat hepatic tissue and primary hepatocytes,respectively (Ikeda et al., 2000; Ishii et al., 2005). Car3overexpression has been shown to reduce hydrogen perox-ide–induced ROS formation and apoptosis (Raisanen et al.,1999), and downregulation by AhR ligands may create anenvironment more susceptible to oxidative stress. Furthermore,recent comparative studies in rats indicate that Car3 is down-regulated in the TCDD-sensitive Long-Evans strain but not inthe resistant Han/Wistar strain, suggesting a role in suscepti-bility to toxicity (Pastorelli et al., 2006).
TABLE 5
Rat-Specific Gene Expression Responses to TCDD in Hepatic Tissue and Their Functional Categories Based on Gene Ontology
Functional category Gene name
Gene
abbreviation
Rn Entrez
gene ID
Mm Entrez
gene ID
Direction
of regulation
Maximum
fold changea
Growth Cyclin-dependent kinase 4 Cdk4 94201 12567 [ 3.0 (8)
Fibroblast growth factor receptor 3 Fgfr3 84489 14184 Y 0.6 (18)
Guanidinoacetate methyltransferase Gamt 25257 14431 Y 0.6 (72)
Interleukin 6 signal transducer Il6st 25205 16195 Y 0.6 (12)
p21-Activated kinase 1 Pak1 29431 18479 [ 2.5 (4)
Protein phosphatase 2a, catalytic subunit,
alpha isoform
Ppp2ca 24672 19052 [ 3.1 (168)
Sphingosine kinase 1 Sphk1 170897 20698 [ 1.7 (4)
Lipid metabolism/biosynthesis Branched chain ketoacid dehydrogenase E1,
alpha polypeptide
Bckdha 25244 12039 [ 1.7 (72)
Carnitine palmitoyltransferase 1a, liver Cpt1a 25757 12894 [ 3.4 (168)b
Cytochrome P450, family 17, subfamily a,
polypeptide 1
Cyp17a1 25146 13074 Y 0.2 (18)
Diacylglycerol kinase, alpha Dgka 140866 13139 Y 0.6 (12)
enoyl coenzyme A hydratase 1, peroxisomal Ech1 64526 51798 Y 0.6 (168)
Farnesyl diphosphate farnesyl transferase 1 Fdft1 29580 14137 Y 0.7 (8)
Forkhead box A3 Foxa3 25100 15377 Y 0.3 (168)b
UDP-N-acetyl-alpha-D-galactosamine Galgt1 64828 14421 Y 0.4 (168)b
GPI anchor attachment protein 1 Gpaa1 300046 14731 Y 0.6 (8)
Malic enzyme, supernatant Mod1 24552 17436 [ 4.5 (24)b
Mevalonate (diphospho) decarboxylase Mvd 81726 192156 Y 0.5 (8)
Nudix (nucleoside diphosphate linked moi
ety X)-type motif 4
Nudt4 94267 71207 Y 0.5 (168)b
Phosphatidylethanolamine N-methyltrans
ferase
Pemt 25511 18618 Y 0.4 (168)b
Paraoxonase 1 Pon1 84024 18979 [ 2.1 (168)b
aMaximum temporal fold change across the experiment. Values in parentheses indicate the time point of maximum fold change.bIndicates data from the rat Affymetrix time course study, all other rat data are from the cDNA microarray experiment.
COMPARATIVE TOXICOGENOMICS OF TCDD IN RATS AND MICE 407
by guest on February 21, 2016http://toxsci.oxfordjournals.org/
Dow
nloaded from
The regulation of each of these genes occurred within 8 h ofexposure suggesting primary AhR-mediated responses. Manyalso possess one or more conserved DREs which may betargets for AhR binding. The exceptions were Ephx1 andHmox1 which may be regulated through an alternate mecha-nism such as the antioxidant response element via Nrf2 (Leeet al., 2003). Alternatively, their genomic regulatory regionsmay currently be improperly annotated which would precludeproper genomic alignments and conserved DRE identification,as is the case for Cyp1a1 (Burgoon and Zacharewski, 2006).Regardless, their conserved regulation suggests that they arenot likely to be involved in the species-specific responses toTCDD. This is supported by the dose-response behavior forCyp1a1 and Nqo1 which displayed no difference in sensitivityto TCDD across these species. Collectively, the regulation ofthis class of genes is consistent with the biological role of theAhR in mediating an adaptive metabolic response (Bunger
et al., 2003) and has expanded our understanding of the AhRgene battery and its conservation across species.
Energy metabolism in the liver involves the interconversionof lipids, carbohydrates, and amino acids which is regulated bymultiple factors including allosteric effectors, substrate avail-ability, and hormones (She et al., 2000). TCDD disruptsintermediary metabolism, and comparative studies indicatea common alteration of genes associated with amino acidmetabolism. This is consistent with previous reports of TCDD-mediated alterations in circulating amino acids (Vilukselaet al., 1999) and included the downregulation of a number ofgenes involved in glutamate metabolism. Glutamate plays a cen-tral role in intermediary metabolism (Yang and Brunengraber,2000), and the downregulation of these genes may be acontributing factor to TCDD’s inhibitory effects on gluconeo-genesis. Additional genes associated with amino acid metab-olism were also downregulated in rats and/or mice, and many
TABLE 6
Mouse-Specific Gene Expression Responses to TCDD in Hepatic Tissue and Their Functional Categories Based on Gene Ontology
Functional category Gene name
Gene
abbreviation
Rn entrez
gene ID
Mm entrez
gene ID
Direction
of regulation
Maximum
fold changea
Lipid metabolism/binding Acyl-CoA thioesterase 7 Acot7 26759 70025 [ 2.6 (8)
Apolipoprotein B editing
complex 1
Apobec1 25383 11810 Y 0.6 (18)
CD36 antigen Cd36 29184 12491 [ 3.4 (168)
Lipoprotein lipase Lpl 24539 16956 [ 3.6 (168)
Sterol-C4-methyl
oxidase-like
Sc4mol 26759 66234 [ 1.6 (8)
Cery low-density lipoprotein
receptor
Vldlr 25696 22359 [ 1.8 (72)
Immune response Complement component 1, q
subcomponent, alpha
polypeptide
C1qa 298566 12259 [ 1.7 (168)
Complement component 1, q
subcomponent, beta
polypeptide
C1qb 29687 12260 [ 1.5 (168)
CD3 antigen, delta
polypeptide
Cd3d 25710 12500 Y 0.4 (18)
CD53 antigen Cd53 24251 12508 [ 1.7 (168)
chemokine (C-X-C motif)
ligand 12
Cxcl12 24772 20315 Y 0.5 (168)
Granzyme A Gzma 266708 14938 [ 1.5 (168)
Histocompatibility 2, class II
antigen A, alpha
H2-Aa 309621 14960 [ 2.3 (168)
Histocompatibility 2, class II
antigen A, beta 1
H2-Ab1 309622 14961 [ 3 (168)
Histocompatibility 2,
complement component factor B
H2-Bf 294257 14962 [ 1.9 (72)
Histocompatibility 2, class II
antigen E beta
H2-Eb1 294270 14969 [ 3.3 (168)
Integrin beta 1 (fibronectin
receptor beta)
Itgb1 24511 16412 [ 3 (24)
Notch gene homolog 1
(Drosophila)
Notch1 25496 18128 [ 3.3 (4)
aMaximum temporal fold change across the experiment. Values in parentheses indicate the time point of maximum fold change.
408 BOVERHOF ET AL.
by guest on February 21, 2016http://toxsci.oxfordjournals.org/
Dow
nloaded from
are involved in glutamate, cysteine, and glycine metabolismincluding Glud1, Glul, Gpt1, cytolosic cysteine dioxygenase(Cdo1), D-amino acid oxidase (Dao1), glycine N-methyltrans-ferase (Gnmt), and glycine decarboxylase (Gldc). In addition tomediating effects on gluconeogenesis, these genes may bedownregulated to conserve the amino acid building blocks ofglutathione (GSH). Consistent with this, the enzymes requiredfor GSH synthesis, Gclc and glutathione synthetase (Gss), wereboth upregulated in rats and mice, as were a number of glutathi-one S-transferase conjugating enzymes. The importance ofamino acids and GSH in cellular redox status has been wellcharacterized (Mates et al., 2002), and the downregulation ofthese amino acid metabolizing genes combined with theupregulation of enzymes involved in GSH synthesis and
conjugation would create an adaptive environment to TCDD-mediated oxidative stress. This is consistent with AhR-dependent increases in GSH and decreases in the GSH/glutathione disulfide ratio after TCDD exposure (Shen et al.,2005). However, few of these genes possess conserved DREssuggesting that they are secondary to TCDD-mediated oxida-tive stress which is supported by toxicogenomic studies thatindicate similar gene regulation by diverse chemical inducersof hepatic oxidative stress (Heijne et al., 2004, 2005; Huanget al., 2004; McMillian et al., 2004). These results stronglysuggest that the alteration of amino acid metabolizing genesmay be related to TCDD-mediated oxidative stress.
In addition to the effects on amino acid metabolism,a number of genes involved in lipid metabolism were
FIG. 5. QRTPCR verification of temporal microarray results in rats and mice. Rats and mice were treated with 10 and 30 lg/kg, respectively. The same RNA
used for cDNA microarray analysis was examined by QRTPCR. All fold changes were calculated relative to time-matched vehicle controls. Bars (left axis) and
lines (right axis) represent QRTPCR and cDNA microarray data, respectively, while the x-axis represents the time points. Genes are indicated by official
gene symbols, and results are the average of four biological replicates. Error bars represent the SEM for the average fold change. Asterisk represents p < 0.05
for QRTPCR.
COMPARATIVE TOXICOGENOMICS OF TCDD IN RATS AND MICE 409
by guest on February 21, 2016http://toxsci.oxfordjournals.org/
Dow
nloaded from
commonly regulated including the induction of Fabp4 and 5and Elovl5. Fabp4 and 5 are lipid-binding proteins which playkey roles in promoting FA uptake and metabolism (Simpsonet al., 1999). Recent reports also suggest that Fabp5 mayfunction as a protective antioxidant protein by scavengingreactive lipids, consistent with its early induction by TCDD(Bennaars-Eiden et al., 2002). Elovl5 encodes FA elongase,and additional research has indicated that the activity of thisenzyme is also induced by TCDD (data not shown).
A number of genes in this category were also commonlydownregulated including Fasn, Fads1, Lipc, and phosphoenol-pyruvate carboxykinase 1 (Pck1). Fasn is involved in thede novo synthesis of FA, thereby playing an important role inenergy homeostasis and its activity has previously beenreported to be repressed by TCDD (Lakshman et al., 1989).Lipc is a lypolytic enzyme found at hepatic sinusoidal surfaceswhich influences lipid metabolism and uptake by affecting thephospholipid, TRIG, and CHOL content of lipoproteins (Perretet al., 2002). Pck1 is a key gluconeogenic enzyme; however,recent studies indicate that mice with diminished Pck1 ac-tivity display profound abnormalities in lipid metabolismcharacterized by increases in circulating FFA and TRIGand hepatic TRIG accumulation (She et al., 2000). In combina-tion, the dysregulation of these genes may play a role in theobserved alterations in serum TRIG, FFA, and CHOL and,ultimately, in the toxic manifestations of TCDD such as thewasting syndrome. The common regulation of these genesalso supports a biological role for the AhR in FA and lipid
homeostasis consistent with the microvesicular fatty meta-morphosis phenotype observed in AhR-null mice (Schmidtet al., 1996).
Several responses which did not fit into an overrepresentedfunctional category were also commonly regulated includingthe downregulation of Igf-1 and upregulation of Igfbp1. Theregulation of these genes is consistent with previous studies inhuman hepatoma cells and rats in vivo which suggested thatthese responses may contribute to alterations in growth,reproduction, and GLU homeostasis (Croutch et al., 2005;Marchand et al., 2005). Comparative genomics revealed thateach gene possesses a single conserved DRE which maybe involved in mediating the response to TCDD.
Although not orthologous genes, rat Notch2 and mouseNotch1 exhibited comparable temporal expression patternsin response to TCDD which were verified by QRTPCR.Notch genes encode transmembrane proteins involved incontrolling cell fate decisions during embryonic develop-ment (Lai, 2004), and their deregulated expression maycontribute to the teratogenic effects of TCDD. Examinationof rat Notch1 by QRTPCR revealed a similar but nonsignif-icant temporal induction when compared to mouse Notch1,while mouse Notch2 was not induced by TCDD. Therefore,genes within this family are commonly regulated by TCDDalthough gene orthologs are not similarly responsive. Dissim-ilar expression patterns between orthologous genes havepreviously been reported and may indicate that these genesare not true functional orthologs (Zhou and Gibson, 2004).
FIG. 6. QRTPCR verification of dose-dependent gene expression responses for Cyp1a1 and Nqo1. Rats and mice were treated with increasing doses of TCDD
and sacrificed after 24 h. The same RNA used for cDNA microarray analysis was examined by QRTPCR. The y-axis represents the fold change calculated relative
to time-matched vehicle controls, while the x-axis represents the dose. Data points represent the fold change ± SE of at least four independent samples. Dose-
response curves and ED50 values were generated using nonlinear regression dose-response analysis.
410 BOVERHOF ET AL.
by guest on February 21, 2016http://toxsci.oxfordjournals.org/
Dow
nloaded from
Rat-Specific Responses
Functional annotation of rat-specific responses identifiedgenes involved in cellular growth responses including Cdk4,Fgfr3, Pak1, Ppp2ca, and Sphk1. Cdk4 and Ppp2ca wereupregulated and play important roles in the regulation of cellcycle and growth. Fgfr3 was repressed and is involved in thenegative regulation of bone growth (Nakajima et al., 2003) andhas been implicated in the etiology of hepatocellular carcinoma(Shao et al., 2005). Pak1, a regulatory enzyme involved in cellgrowth and morphogenesis as well as stress responses, wasinduced early (Sells and Chernoff, 1997). Sphk1, whichcatalyzes the synthesis of sphingosine-1-phosphate, a signalingmolecule involved in cell growth, proliferation, survival, andmorphogenesis, was also upregulated (Allende et al., 2004).Although evidence of hyperplasia was not observed in the ratliver, the regulation of these genes, combined with hepaticstress, may contribute to the observed hypertrophic response aswell as the carcinogenic potential of TCDD.
Genes uniquely regulated in the rat were also involved inlipid metabolism responses including Cpt1a, Foxa3, and Gamt.Liver Cpt1a catalyzes the rate-controlling transfer of long-chain FA into mitochondria for beta-oxidation (Louet et al.,2002), and its deregulated expression is associated with altered
food intake and body weight (Bonnefont et al., 2004; Pocaiet al., 2006). QRTPCR verified the early induction of Cpt1a inthe rat while it was not induced in the mouse. Gamt is involvedin creatine biosynthesis and was downregulated by TCDD.Deficiency of this gene is associated with metabolic disordersincluding decreased body weight due to reduced body fat mass(Schmidt et al., 2004). Foxa3, which was also downregulated,plays a key role in GLU homeostasis during fasting throughthe regulation of Glut2 expression with null mutations re-sulting in decreased blood GLU concentrations (Shen et al.,2001). Collectively, the deregulated expression of these genesmay play a contributing role in the alterations in serum GLUand decreases in body weight gain which were confined tothe rat.
Mouse-Specific Responses
Histological examination of mouse hepatic tissue revealedvacuolization due to TRIG/FA accumulation and inflammatorycell accumulation with apoptosis. Consistent with this, a num-ber of mouse-specific gene expression responses were as-sociated with lipid binding and metabolism including theupregulation of Acot7, Cd36, Lpl, Sc4mol, and Vldlr. Acot7is a member of a group of enzymes that catalyze the hydrolysis
FIG. 7. Identification of positionally conserved DREs in commonly regulated rat and mouse genes. Gene regulatory sequences (� 10,000 relative to the TSS
through the 5#UTR) were scanned individually for the presence of putative DREs. Sequence alignments were then performed using ClusatalW to identify
conserved putative DREs. Diagrammatic results are displayed for Car3, heat shock protein 105, and Igfbp1. Boxes and numbers represent putative DREs and their
locations. DREs circled by a hatched line represent positionally conserved DREs between the rat and mouse.
COMPARATIVE TOXICOGENOMICS OF TCDD IN RATS AND MICE 411
by guest on February 21, 2016http://toxsci.oxfordjournals.org/
Dow
nloaded from
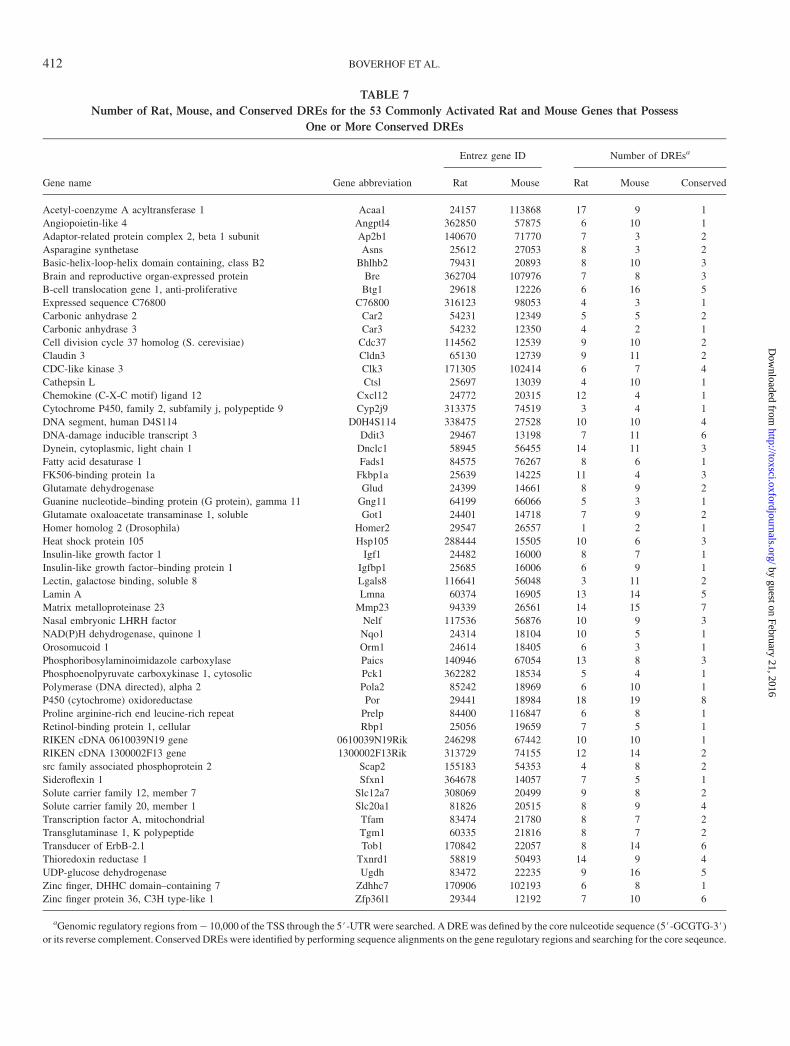
TABLE 7
Number of Rat, Mouse, and Conserved DREs for the 53 Commonly Activated Rat and Mouse Genes that Possess
One or More Conserved DREs
Entrez gene ID Number of DREsa
Gene name Gene abbreviation Rat Mouse Rat Mouse Conserved
Acetyl-coenzyme A acyltransferase 1 Acaa1 24157 113868 17 9 1
Angiopoietin-like 4 Angptl4 362850 57875 6 10 1
Adaptor-related protein complex 2, beta 1 subunit Ap2b1 140670 71770 7 3 2
Asparagine synthetase Asns 25612 27053 8 3 2
Basic-helix-loop-helix domain containing, class B2 Bhlhb2 79431 20893 8 10 3
Brain and reproductive organ-expressed protein Bre 362704 107976 7 8 3
B-cell translocation gene 1, anti-proliferative Btg1 29618 12226 6 16 5
Expressed sequence C76800 C76800 316123 98053 4 3 1
Carbonic anhydrase 2 Car2 54231 12349 5 5 2
Carbonic anhydrase 3 Car3 54232 12350 4 2 1
Cell division cycle 37 homolog (S. cerevisiae) Cdc37 114562 12539 9 10 2
Claudin 3 Cldn3 65130 12739 9 11 2
CDC-like kinase 3 Clk3 171305 102414 6 7 4
Cathepsin L Ctsl 25697 13039 4 10 1
Chemokine (C-X-C motif) ligand 12 Cxcl12 24772 20315 12 4 1
Cytochrome P450, family 2, subfamily j, polypeptide 9 Cyp2j9 313375 74519 3 4 1
DNA segment, human D4S114 D0H4S114 338475 27528 10 10 4
DNA-damage inducible transcript 3 Ddit3 29467 13198 7 11 6
Dynein, cytoplasmic, light chain 1 Dnclc1 58945 56455 14 11 3
Fatty acid desaturase 1 Fads1 84575 76267 8 6 1
FK506-binding protein 1a Fkbp1a 25639 14225 11 4 3
Glutamate dehydrogenase Glud 24399 14661 8 9 2
Guanine nucleotide–binding protein (G protein), gamma 11 Gng11 64199 66066 5 3 1
Glutamate oxaloacetate transaminase 1, soluble Got1 24401 14718 7 9 2
Homer homolog 2 (Drosophila) Homer2 29547 26557 1 2 1
Heat shock protein 105 Hsp105 288444 15505 10 6 3
Insulin-like growth factor 1 Igf1 24482 16000 8 7 1
Insulin-like growth factor–binding protein 1 Igfbp1 25685 16006 6 9 1
Lectin, galactose binding, soluble 8 Lgals8 116641 56048 3 11 2
Lamin A Lmna 60374 16905 13 14 5
Matrix metalloproteinase 23 Mmp23 94339 26561 14 15 7
Nasal embryonic LHRH factor Nelf 117536 56876 10 9 3
NAD(P)H dehydrogenase, quinone 1 Nqo1 24314 18104 10 5 1
Orosomucoid 1 Orm1 24614 18405 6 3 1
Phosphoribosylaminoimidazole carboxylase Paics 140946 67054 13 8 3
Phosphoenolpyruvate carboxykinase 1, cytosolic Pck1 362282 18534 5 4 1
Polymerase (DNA directed), alpha 2 Pola2 85242 18969 6 10 1
P450 (cytochrome) oxidoreductase Por 29441 18984 18 19 8
Proline arginine-rich end leucine-rich repeat Prelp 84400 116847 6 8 1
Retinol-binding protein 1, cellular Rbp1 25056 19659 7 5 1
RIKEN cDNA 0610039N19 gene 0610039N19Rik 246298 67442 10 10 1
RIKEN cDNA 1300002F13 gene 1300002F13Rik 313729 74155 12 14 2
src family associated phosphoprotein 2 Scap2 155183 54353 4 8 2
Sideroflexin 1 Sfxn1 364678 14057 7 5 1
Solute carrier family 12, member 7 Slc12a7 308069 20499 9 8 2
Solute carrier family 20, member 1 Slc20a1 81826 20515 8 9 4
Transcription factor A, mitochondrial Tfam 83474 21780 8 7 2
Transglutaminase 1, K polypeptide Tgm1 60335 21816 8 7 2
Transducer of ErbB-2.1 Tob1 170842 22057 8 14 6
Thioredoxin reductase 1 Txnrd1 58819 50493 14 9 4
UDP-glucose dehydrogenase Ugdh 83472 22235 9 16 5
Zinc finger, DHHC domain–containing 7 Zdhhc7 170906 102193 6 8 1
Zinc finger protein 36, C3H type-like 1 Zfp36l1 29344 12192 7 10 6
aGenomic regulatory regions from� 10,000 of the TSS through the 5#-UTR were searched. A DRE was defined by the core nulceotide sequence (5#-GCGTG-3#)or its reverse complement. Conserved DREs were identified by performing sequence alignments on the gene regulotary regions and searching for the core seqeunce.
412 BOVERHOF ET AL.
by guest on February 21, 2016http://toxsci.oxfordjournals.org/
Dow
nloaded from
of acyl-CoAs to the FFA and coenzyme A to regulate theirintracellular levels (Hunt et al., 2002). Cd36, also known as FAtransporter, is a receptor for high-affinity uptake of long-chainFA. Null mutations of this gene result in reduced FA uptake,while overexpression increases FA uptake and metabolism(Bonen et al., 2004; Febbraio et al., 1999). Lpl functions inTRIG and chylomicron metabolism and as a bridging factor forlipoprotein uptake (Weinstock et al., 1995). Previous reportshave shown that TCDD reduces Lpl activity in guinea pigadipose tissue (Brewster and Matsumura, 1984), suggestinga potential tissue- or species-specific effect. Mutations inSc4mol result in altered lipid metabolism and the accumulationof FA and TRIG (Li and Kaplan, 1996) while Vldlr mediatesthe internalization and degradation of TRIG-rich lipoproteinsand is required for optimal Lpl activity (Yagyu et al., 2002).Collectively, the regulation of these genes may play animportant role in mediating the increased uptake and accumu-lation of hepatic TRIG and FA.
A second functional category confined to the mouse involvedgenes associated with immune responses. The regulation of thiscategory was primarily observed at the late time pointsconsistent with histological observations of immune cellaccumulation and apoptosis at 168 h. These genes includedseveral cluster of differentiation and lymphocyte antigens (Cdand Ly antigens), complement components (C1qa and C1qb),and major histocompatabilty complex (MHC) molecules. Cdand Ly antigens are surface molecules on hematopoietic cellsimportant for immune signaling functions (Lai et al., 1998;Sumoza-Toledo and Santos-Argumedo, 2004). C1q compo-nents are members of the classical pathway of the immunecomplement response involved in apoptotic cell clearance. H2-Ab1 and H2-Eb1 belong to the MHC class II and are involvedin antigen presentation and processing (Alfonso et al., 2001).These changes in gene expression are likely a secondaryresponse to hepatic damage mediated by ROS or fattyaccumulation as induction was concurrent with histologicaldetection of immune cell infiltration and apoptosis. This isconsistent with the increases in serum ALT which wereobserved in the mouse and were unaltered in the rat.
CONCLUSIONS
The present study identified several conserved and species-specific hepatic gene expression responses which were pheno-typically anchored to the physiological, histopathological, andclinical chemistry effects elicited by TCDD. Conserved geneexpression responses were associated with xenobiotic andchemical stress consistent with the role of the AhR in mediatingadaptive metabolic responses. Common responses were alsoassociated with alterations in intermediary metabolism includ-ing amino acid and lipid metabolism. Rat-specific responseswere related to cellular growth and lipid metabolism which maybe involved in the observed physiological alterations on
hepatocyte hypertrophy and body weight. Meanwhile, mouse-specific responses were phenotypically anchored to TRIG andFA accumulation and immune responses. Overall, despite theconservation in AhR biology across the mouse and rat, thesedata indicate that differences in TCDD-mediated hepatotoxicitymay be mediated by different gene expression profiles, poten-tially through species-specific AhR regulons.
Many factors complicate comparative toxicology studiesincluding differences in absorption, distribution, metabolism,and elimination as well as age and gender. Comparativetoxicogenomic studies face additional difficulties which canlimit a complete and comprehensive assessment of the data.One obvious difficulty stems from differences in genesrepresented on array platforms for each species which limitsthe number of comparisons that can be made. This is furthercomplicated by the incomplete and unstable nature of annota-tion for the rat genome (Boverhof and Zacharewski, 2006). Inaddition, array probes for orthologous genes may representdifferent transcript regions which can limit the ability to detectand compare expression responses. Different responses mayalso be due to different levels of basal gene expression betweenthese species which could dictate the overall magnitude anddirection (induced or repressed) of TCDD’s modulating effect.Furthermore, genes currently annotated as orthologs may notbe functional orthologs and, as such, may not exhibit similarexpression responses. All these factors are confoundingvariables in the definitive assignment of these genes asspecies-specific responses to TCDD. Examination of additionaltarget tissues, more extensive cross-species comparisons, andmeta-analysis of existing data will further highlight andsubstantiate TCDD’s species-specific gene expression re-sponses which should be characterized in light of the physio-logical, molecular, and genomic variations between specieswhen deciphering their roles in toxicity. As the technologyadvances, toxicogenomic comparisons between rodent andhuman models of toxicity will help explain species-specifictoxicity and susceptibility, thereby decreasing the uncertaintiesin current risk assessment extrapolation practices.
SUPPLEMENTARY DATA
Supplementary Tables 1–5 are available online at http://toxsci.oxfordjournals.org./
ACKNOWLEDGMENTS
We thank Jeremy Burt, Ed Dere, and Josh Kwekel for critical reading of this
article. This work was supported by funds from National Institute of Health
grant R21-GM75838.
REFERENCES
Alfonso, C., Han, J.-O., Williams, G. S., and Karlsson, L. (2001). The Impact of
H2-DM on Humoral Immune Responses. J. Immunol. 167, 6348–6355.
COMPARATIVE TOXICOGENOMICS OF TCDD IN RATS AND MICE 413
by guest on February 21, 2016http://toxsci.oxfordjournals.org/
Dow
nloaded from
Allende, M. L., Sasaki, T., Kawai, H., Olivera, A., Mi, Y., van Echten-
Deckert, G., Hajdu, R., Rosenbach, M., Keohane, C. A., Mandala, S., et al.
(2004). Mice deficient in sphingosine kinase 1 are rendered lymphopenic by
FTY720. J. Biol. Chem. 279, 52487–52492.
Bennaars-Eiden, A., Higgins, L., Hertzel, A. V., Kapphahn, R. J., Ferrington,
D. A., and Bernlohr, D. A. (2002). Covalent modification of epithelial fatty
acid-binding protein by 4-hydroxynonenal in vitro and in vivo. Evidence for
a role in antioxidant biology. J. Biol. Chem. 277, 50693–50702.
Bickel, M. H. (1982). Polychlorinated persistent compounds. Experientia 38,
879–882.
Bonen, A., Campbell, S. E., Benton, C. R., Chabowski, A., Coort, S. L., Han,
X. X., Koonen, D. P., Glatz, J. F., and Luiken, J. J. (2004). Regulation of fatty
acid transport by fatty acid translocase/CD36. Proc. Nutr. Soc. 63,
245–249.
Bonnefont, J. P., Djouadi, F., Prip-Buus, C., Gobin, S., Munnich, A., and
Bastin, J. (2004). Carnitine palmitoyltransferases 1 and 2: Biochemical,
molecular and medical aspects. Mol. Asp. Med. 25, 495–520.
Boverhof, D. R., Burgoon, L. D., Tashiro, C., Chittim, B., Harkema, J. R.,
Jump, D. B., and Zacharewski, T. R. (2005). Temporal and dose-dependent
hepatic gene expression patterns in mice provide new insights into TCDD-
mediated hepatotoxicity. Toxicol Sci. 85, 1048–1063.
Boverhof, D. R., and Zacharewski, T. R. (2006). Toxicogenomics in risk
assessment: Applications and needs. Toxicol Sci. 89, 352–360.
Brewster, D. W., and Matsumura, F. (1984). TCDD (2,3,7,8-tetrachlorodi-
benzo-p-dioxin) reduces lipoprotein lipase activity in the adipose tissue of
the guinea pig. Biochem. Biophys. Res. Commun. 122, 810–817.
Bunger, M. K., Moran, S. M., Glover, E., Thomae, T. L., Lahvis, G. P., Lin,
B. C., and Bradfield, C. A. (2003). Resistance to 2,3,7,8-tetrachlorodibenzo-
p-dioxin toxicity and abnormal liver development in mice carrying a mutation
in the nuclear localization sequence of the aryl hydrocarbon receptor. J. Biol.
Chem. 278, 17767–17774.
Burgoon, L. D., Boutros, P. C., Dere, E., and Zacharewski, T. R. (2006).
dbZach: A MIAME-compliant toxicogenomic supportive relational data-
base. Toxicol. Sci. 90, 558–568.
Burgoon, L. D., and Zacharewski, T. R. (2006). Genome reanalysis of aryl
hydrocarbon receptor battery genes: Reconciliation of current and past
regulatory region annotations. In 45th Annual Meeting of the Society of
Toxicology, San Diego, CA. Toxicologist, Abstract 990, p. 989.
Christian, B. J., Menahan, L. A., and Peterson, R. E. (1986). Intermediary
metabolism of the mature rat following 2,3,7,8-tetrachlorodibenzo-p-dioxin
treatment. Toxicol. Appl. Pharmacol. 83, 360–378.
Croutch, C. R., Lebofsky, M., Schramm, K. W., Terranova, P. F., and
Rozman, K. K. (2005). 2,3,7,8-Tetrachlorodibenzo-p-dioxin (TCDD) and
1,2,3,4,7,8-hexachlorodibenzo-p-dioxin (HxCDD) alter body weight by
decreasing insulin-like growth factor I (IGF-I) signaling. Toxicol. Sci. 85,
560–571.
Denison, M. S., and Heath-Pagliuso, S. (1998). The Ah receptor: A regulator of
the biochemical and toxicological actions of structurally diverse chemicals.
Bull. Environ. Contam. Toxicol. 61, 557–568.
Denison, M. S., Pandini, A., Nagy, S. R., Baldwin, E. P., and Bonati, L. (2002).
Ligand binding and activation of the Ah receptor. Chem.-Biol. Interact. 141,
3–24.
Denison, M. S., Vella, L. M., and Okey, A. B. (1986). Structure and function of
the Ah receptor for 2,3,7,8-tetrachlorodibenzo-p-dioxin. Species difference
in molecular properties of the receptors from mouse and rat hepatic cytosols.
J. Biol. Chem. 261, 3987–3995.
Diliberto, J. J., Akubue, P. I., Luebke, R. W., and Birnbaum, L. S. (1995). Dose-
response relationships of tissue distribution and induction of Cyp1A1 and
Cyp1A2 enzymatic activities following acute exposure to 2,3,7,8-tetrachlor-
odibenzo-p-dioxin (TCDD) in mice. Toxicol. Appl. Pharmacol. 130,
197–208.
Eckel, J. E., Gennings, C., Chinchilli, V. M., Burgoon, L. D., and Zacharewski,
T. R. (2004). Empirical bayes gene screening tool for time-course or dose-
response microarray data. J. Biopharm. Stat. 14, 647–670.
Eckel, J. E., Gennings, C., Therneau, T. M., Burgoon, L. D., Boverhof, D. R.,
and Zacharewski, T. R. (2005). Normalization of two-channel microarray
experiments: A semiparametric approach. Bioinformatics. 21, 1078–1083
Febbraio, M., Abumrad, N. A., Hajjar, D. P., Sharma, K., Cheng, W., Pearce,
S. F. A., and Silverstein, R. L. (1999). A null mutation in murine CD36
reveals an important role in fatty acid and lipoprotein metabolism. J. Biol.
Chem. 274, 19055–19062.
Fletcher, N., Hanberg, A., and Hakansson, H. (2001). Hepatic vitamin A
depletion is a sensitive marker of 2,3,7,8-tetrachlorodibenzo-p-dioxin
(TCDD) exposure in four rodent species. Toxicol. Sci. 62, 166–175.
Fletcher, N., Wahlstrom, D., Lundberg, R., Nilsson, C. B., Nilsson, K. C.,
Stockling, K., Hellmold, H., and Hakansson, H. (2005). 2,3,7,8-Tetrachlor-
odibenzo-p-dioxin (TCDD) alters the mRNA expression of critical genes
associated with cholesterol metabolism, bile acid biosynthesis, and
bile transport in rat liver: A microarray study. Toxicol. Appl. Pharmacol.
207, 1–24.
Frazer, K. A., Elnitski, L., Church, D. M., Dubchak, I., and Hardison, R. C.
(2003). Cross-species sequence comparisons: A review of methods and
available resources. Genome Res. 13, 1–12.
Gonzalez, F. J., and Fernandez-Salguero, P. (1998). The aryl hydrocarbon
receptor: Studies using the AHR-null mice. Drug Metab. Dispos. 26,
1194–1198.
Hankinson, O. (1995). The aryl hydrocarbon receptor complex. Annu. Rev.
Pharmacol. Toxicol. 35, 307–340.
Heijne, W. H., Jonker, D., Stierum, R. H., van Ommen, B., and Groten, J. P.
(2005). Toxicogenomic analysis of gene expression changes in rat liver after
a 28-day oral benzene exposure. Mutat. Res. 575, 85–101.
Heijne, W. H., Slitt, A. L., van Bladeren, P. J., Groten, J. P., Klaassen, C. D.,
Stierum, R. H., and van Ommen, B. (2004). Bromobenzene-induced
hepatotoxicity at the transcriptome level. Toxicol. Sci. 79, 411–422.
Huang, Q., Jin, X., Gaillard, E. T., Knight, B. L., Pack, F. D., Stoltz, J. H.,
Jayadev, S., and Blanchard, K. T. (2004). Gene expression profiling reveals
multiple toxicity endpoints induced by hepatotoxicants. Mutat. Res. 549,
147–167.
Hunt, M. C., Solaas, K., Kase, B. F., and Alexson, S. E. (2002). Characteriza-
tion of an acyl-coA thioesterase that functions as a major regulator of
peroxisomal lipid metabolism. J. Biol. Chem. 277, 1128–1138.
Ikeda, M., Ishii, Y., Kato, H., Akazawa, D., Hatsumura, M., Ishida, T.,
Matsusue, K., Yamada, H., and Oguri, K. (2000). Suppression of carbonic
anhydrase III in rat liver by a dioxin-related toxic compound, coplanar
polychlorinated biphenyl, 3, 3#,4,4#,5-pentachlorobiphenyl. Arch. Biochem.
Biophys. 380, 159–164.
Ishii, Y., Akazawa, D., Aoki, Y., Yamada, H., and Oguri, K. (2005). Suppression
of carbonic anhydrase III mRNA level by an aryl hydrocarbon receptor
ligand in primary cultured hepatocytes of rat. Biol. Pharm. Bull. 28,
1087–1090.
Lai, E. C. (2004). Notch signaling: Control of cell communication and cell fate.
Development 131, 965–973.
Lai, L., Alaverdi, N., Maltais, L., and Morse, H. C., III. (1998). Mouse cell
surface antigens: Nomenclature and immunophenotyping. J. Immunol. 160,
3861–3868.
Lakshman, M. R., Chirtel, S. J., Chambers, L. L., and Coutlakis, P. J. (1989).
Effects of 2,3,7,8-tetrachlorodibenzo-p-dioxin on lipid synthesis and lipo-
genic enzymes in the rat. J. Pharmacol. Exp. Ther. 248, 62–66.
Lee, J.-M., Calkins, M. J., Chan, K., Kan, Y. W., and Johnson, J. A. (2003).
Identification of the NF-E2-related factor-2-dependent genes conferring
protection against oxidative stress in primary cortical astrocytes using
oligonucleotide microarray analysis. J. Biol. Chem. 278, 12029–12038.
414 BOVERHOF ET AL.
by guest on February 21, 2016http://toxsci.oxfordjournals.org/
Dow
nloaded from
Li, L., and Kaplan, J. (1996). Characterization of yeast methyl sterol oxidase
(ERG25) and identification of a human homologue. J. Biol. Chem. 271,
16927–16933.
Louet, J. F., Hayhurst, G., Gonzalez, F. J., Girard, J., and Decaux, J. F. (2002).
The coactivator PGC-1 is involved in the regulation of the liver carnitine
palmitoyltransferase I gene expression by cAMP in combination with HNF4
alpha and cAMP-response element-binding protein (CREB). J. Biol. Chem.
277, 37991–38000.
Malaguarnera, L., Madeddu, R., Palio, E., Arena, N., and Malaguarnera M.
(2005). Heme oxygenase-1 levels and oxidative stress-related parameters in
non-alcoholic fatty liver disease patients. J. Hepatol. 42, 585–591.
Marchand, A., Tomkiewicz, C., Marchandeau, J. P., Boitier, E., Barouki, R.,
and Garlatti, M. (2005). 2,3,7,8-Tetrachlorodibenzo-p-dioxin induces in-
sulin-like growth factor binding protein-1 gene expression and counteracts
the negative effect of insulin. Mol. Pharmacol. 67, 444–452.
Mates, J. M., Perez-Gomez, C., Nunez de Castro, I., Asenjo, M., and Marquez, J.
(2002). Glutamine and its relationship with intracellular redox status,
oxidative stress and cell proliferation/death. Int. J. Biochem. Cell. Biol. 34,
439–458.
McGuire, A. M., Hughes, J. D., and Church, G. M. (2000). Conservation of
DNA regulatory motifs and discovery of new motifs in microbial genomes.
Genome Res. 10, 744–757.
McMillian, M., Nie, A. Y., Parker, J. B., Leone, A., Bryant, S., Kemmerer, M.,
Herlich, J., Liu, Y., Yieh, L., Bittner, A., et al. (2004). A gene expression
signature for oxidant stress/reactive metabolites in rat liver. Biochem.
Pharmacol. 68, 2249–2261.
Miyata, M., Kudo, G., Lee, Y.-H., Yang, T. J., Gelboin, H. V., Fernandez-
Salguero, P., Kimura, S., and Gonzalez, F. J. (1999). Targeted disruption of
the microsomal epoxide hydrolase gene. Microsomal epoxide hydrolase is
required for the carcinogenic activity of 7,12-dimethylbenz[a]anthracene. J.
Biol. Chem. 274, 23963–23968.
Nakajima, A., Shimizu, S., Moriya, H., and Yamazaki, M. (2003). Expression
of fibroblast growth factor receptor-3 (FGFR3), signal transducer and
activator of transcription-1, and cyclin-dependent kinase inhibitor p21
during endochondral ossification: Differential role of FGFR3 in skeletal
development and fracture repair. Endocrinology 144, 4659–4668.
Nebert, D. W., Roe, A. L., Dieter, M. Z., Solis, W. A., Yang, Y., and Dalton, T. P.
(2000). Role of the aromatic hydrocarbon receptor and [Ah] gene battery in
the oxidative stress response, cell cycle control, and apoptosis. Biochem.
Pharmacol. 59, 65–85.
Okey, A. B., Franc, M. A., Moffat, I. D., Tijet, N., Boutros, P. C., Korkalainen, M.,
Tuomisto, J., and Pohjanvirta, R. (2005). Toxicological implications of poly-
morphisms in receptors for xenobiotic chemicals: The case of the aryl
hydrocarbon receptor. Toxicol. Appl. Pharmacol. 207, 43–51.
Okey, A. B., Vella, L. M., and Harper, P. A. (1989). Detection and
characterization of a low affinity form of cytosolic Ah receptor in livers of
mice nonresponsive to induction of cytochrome P1-450 by 3-methylcholan-
threne. Mol. Pharmacol. 35, 823–830.
Olson, J. R., Holscher, M. A., and Neal, R. A. (1980). Toxicity of 2,3,7,8-
tetrachlorodibenzo-p-dioxin in the golden Syrian hamster. Toxicol. Appl.
Pharmacol. 55, 67–78.
Pastorelli, R., Carpi, D., Campagna, R., Airoldi, L., Pohjanvirta, R., Viluksela, M.,
Hakansson, H., Boutros, P. C., Moffat, I. D., Okey, A. B., et al. (2006).
Differential expression profiling of the hepatic proteome in a rat model of dioxin
resistance: Correlation with genomic and transcriptomic analyses. Mol. Cell
Proteomics 5, 882–894.
Perret, B., Mabile, L., Martinez, L., Terce, F., Barbaras, R., and Collet, X.
(2002). Hepatic lipase: Structure/function relationship, synthesis, and
regulation. J. Lipid Res. 43, 1163–1169.
Peters, J. M., Narotsky, M. G., Elizondo, G., Fernandez-Salguero, P. M.,
Gonzalez, F. J., and Abbott, B. D. (1999). Amelioration of TCDD-induced
teratogenesis in aryl hydrocarbon receptor (AhR)-null mice. Toxicol. Sci. 47,
86–92.
Pocai, A., Lam, T. K., Obici, S., Gutierrez-Juarez, R., Muse, E. D., Arduini, A.,
and Rossetti, L. (2006). Restoration of hypothalamic lipid sensing normal-
izes energy and glucose homeostasis in overfed rats. J. Clin. Invest. 116,
1081–1091.
Pohjanvirta, R., Viluksela, M., Tuomisto, J. T., Unkila, M., Karasinska, J.,
Franc, M. A., Holowenko, M., Giannone, J. V., Harper, P. A., Tuomisto, J.
et al. (1999). Physicochemical differences in the AH receptors of the most
TCDD-susceptible and the most TCDD-resistant rat strains. Toxicol. Appl.
Pharmacol. 155, 82–95.
Poland, A., Glover, E., and Kende, A. S. (1976). Stereospecific, high affinity
binding of 2,3,7,8-tetrachlorodibenzo-p-dioxin by hepatic cytosol. Evidence
that the binding species is receptor for induction of aryl hydrocarbon
hydroxylase. J. Biol. Chem. 251, 4936–4946.
Poland, A., and Knutson, J. C. (1982). 2,3,7,8-tetrachlorodibenzo-p-dioxin and
related halogenated aromatic hydrocarbons: Examination of the mechanism
of toxicity. Annu. Rev. Pharmacol. Toxicol. 22, 517–554.
Raisanen, S. R., Lehenkari, P., Tasanen, M., Rahkila, P., Harkonen, P. L., and
Vaananen, H. K. (1999). Carbonic anhydrase III protects cells from hydrogen
peroxide-induced apoptosis. FASEB J. 13, 513–522.
Schmidt, A., Marescau, B., Boehm, E. A., Renema, W. K. J., Peco, R., Das, A.,
Steinfeld, R., Chan, S., Wallis, J., Davidoff, M., et al. (2004). Severely
altered guanidino compound levels, disturbed body weight homeostasis and
impaired fertility in a mouse model of guanidinoacetate N-methyltransferase
(GAMT) deficiency. Hum. Mol. Genet. 13, 905–921.
Schmidt, J. V., Su, G. H., Reddy, J. K., Simon, M. C., and Bradfield, C. A.
(1996). Characterization of a murine Ahr null allele: Involvement of the Ah
receptor in hepatic growth and development. Proc. Natl. Acad. Sci. USA. 93,
6731–6736.
Schwetz, B. A., Norris, J. M., Sparschu, G. L., Rowe, U. K., Gehring, P. J.,
Emerson, J. L., and Gerbig, C. G. (1973). Toxicology of chlorinated dibenzo-
p-dioxins. Environ. Health Perspect. 5, 87–99.
Sells, M., and Chernoff, J. (1997). Emerging from the Pak: The p21-activated
protein kinase family. Trends Cell Biol. 7, 162–167.
Shao, R. X., Otsuka, M., Kato, N., Taniguchi, H., Hoshida, Y., Moriyama, M.,
Kawabe, T., and Omata, M. (2005). Acyclic retinoid inhibits human
hepatoma cell growth by suppressing fibroblast growth factor-mediated
signaling pathways. Gastroenterology 128, 86–95.
She, P., Shiota, M., Shelton, K. D., Chalkley, R., Postic, C., and Magnuson,
M. A. (2000). Phosphoenolpyruvate carboxykinase is necessary for the
integration of hepatic energy metabolism. Mol. Cell. Biol. 20, 6508–6517.
Shen, D., Dalton, T. P., Nebert, D. W., and Shertzer, H. G. (2005). Glutathione
redox state regulates mitochondrial reactive oxygen production. J. Biol.
Chem. 280, 25305–25312.
Shen, W., Scearce, L. M., Brestelli, J. E., Sund, N. J., and Kaestner, K. H.
(2001). Foxa3 (hepatocyte nuclear factor 3gamma) is required for the
regulation of hepatic GLUT2 expression and the maintenance of
glucose homeostasis during a prolonged fast. J. Biol. Chem. 276,
42812–42817.
Simpson, M. A., LiCata, V. J., Ribarik Coe, N., and Bernlohr, D. A. (1999).
Biochemical and biophysical analysis of the intracellular lipid binding
proteins of adipocytes. Mol. Cell. Biochem. 192, 33–40.
Stahl, B. U., Beer, D. G., Weber, L. W., Lebofsky, M., and Rozman, K. (1992).
Decreased hepatic phosphoenolpyruvate carboxykinase gene expression
after 2,3,7,8-tetrachlorodibenzo-p-dioxin treatment: Implications for the
acute toxicity of chlorinated dibenzo-p-dioxins in the rat. Arch. Toxicol.
Suppl. 15, 151–155.
Sumoza-Toledo, A., and Santos-Argumedo, L. (2004). The spreading of B
lymphocytes induced by CD44 cross-linking requires actin, tubulin, and
vimentin rearrangements. J. Leukoc. Biol. 75, 233–239.
COMPARATIVE TOXICOGENOMICS OF TCDD IN RATS AND MICE 415
by guest on February 21, 2016http://toxsci.oxfordjournals.org/
Dow
nloaded from
Sun, Y. V., Boverhof, D. R., Burgoon, L. D., Fielden, M. R., and Zacharewski,
T. R. (2004). Comparative analysis of dioxin response elements in human,
mouse and rat genomic sequences. Nucleic Acids Res. 32, 4512–4523.
Vatsyayan, J., Peng, H. L., and Chang, H. Y. (2005). Analysis of human UDP-
glucose dehydrogenase gene promoter: Identification of an Sp1 binding site
crucial for the expression of the large transcript. J. Biochem. (Tokyo) 137,
703–709.
Viluksela, M., Unkila, M., Pohjanvirta, R., Tuomisto, J. T., Stahl, B. U.,
Rozman, K. K., and Tuomisto, J. (1999). Effects of 2,3,7,8-tetrachlorodi-
benzo-p-dioxin (TCDD) on liver phosphoenolpyruvate carboxykinase
(PEPCK) activity, glucose homeostasis and plasma amino acid concen-
trations in the most TCDD-susceptible and the most TCDD-resistant rat
strains. Arch. Toxicol. 73, 323–336.
Vorderstrasse, B. A., Steppan, L. B., Silverstone, A. E., and Kerkvliet, N. I.
(2001). Aryl hydrocarbon receptor-deficient mice generate normal immune
responses to model antigens and are resistant to TCDD-induced immune
suppression. Toxicol. Appl. Pharmacol. 171, 157–164.
Vos, J. G., Moore, J. A., and Zinkl, J. G. (1974). Toxicity of 2,3,7,8-
tetrachlorodibenzo-p-dioxin (TCDD) in C57B1/6 mice. Toxicol. Appl.
Pharmacol. 29, 229–241.
Walisser, J. A., Bunger, M. K., Glover, E., Harstad, E. B., and Bradfield, C. A.
(2004). Patent ductus venosus and dioxin resistance in mice harboring
a hypomorphic Arnt allele. J. Biol. Chem. 279, 16326–16331.
Wang, X., Santostefano, M. J., Evans, M. V., Richardson, V. M., Diliberto, J. J.,
and Birnbaum, L. S. (1997). Determination of parameters responsible for
pharmacokinetic behavior of TCDD in female Sprague-Dawley rats. Toxicol.
Appl. Pharmacol. 147, 151–168.
Wang, X. J., Chamberlain, M., Vassieva, O., Henderson, C. J., and Wolf, C. R.
(2005). Relationship between hepatic phenotype and changes in gene
expression in cytochrome P450 reductase (POR) null mice. Biochem. J.
388, 857–867.
Weinstock, P. H., Bisgaier, C. L., Aalto-Setala, K., Radner, H., Ramakrishnan, R.,
Levak-Frank, S., Essenburg, A. D., Zechner, R., and Breslow, J. L.
(1995). Severe hypertriglyceridemia, reduced high density lipoprotein, and
neonatal death in lipoprotein lipase knockout mice. Mild hypertriglycer-
idemia with impaired very low density lipoprotein clearance in hetero-
zygotes. J. Clin. Invest. 96, 2555–2568.
Xia, L., Nordman, T., Olsson, J. M., Damdimopoulos, A., Bjorkhem-Bergman,
L., Nalvarte, I., Eriksson, L. C., Arner, E. S. J., Spyrou, G., and Bjornstedt,
M. (2003). The mammalian cytosolic selenoenzyme thioredoxin reductase
reduces ubiquinone. A novel mechanism for defense against oxidative stress.
J. Biol. Chem. 278, 2141–2146.
Yagyu, H., Lutz, E. P., Kako, Y., Marks, S., Hu, Y., Choi, S. Y., Bensadoun, A.,
and Goldberg, I. J. (2002). Very low density lipoprotein (VLDL) receptor-
deficient mice have reduced lipoprotein lipase activity. Possible causes of
hypertriglyceridemia and reduced body mass with VLDL receptor de-
ficiency. J. Biol. Chem. 277, 10037–10043.
Yang, D., and Brunengraber, H. (2000). Glutamate, a window on liver
intermediary metabolism. J. Nutr. 130, 991S–994S.
Yuen, T., Wurmbach, E., Pfeffer, R. L., Ebersole, B. J., and Sealfon, S. C.
(2002). Accuracy and calibration of commercial oligonucleotide and custom
cDNA microarrays. Nucleic Acids Res. 30, e48.
Zeeberg, B. R., Feng, W., Wang, G., Wang, M. D., Fojo, A. T., Sunshine, M.,
Narasimhan, S., Kane, D. W., Reinhold, W. C., Lababidi, S., et al. (2003).
GoMiner: A resource for biological interpretation of genomic and proteomic
data. Genome Biol. 4, R28.
Zhou, X. J., and Gibson, G. (2004). Cross-species comparison of genome-wide
expression patterns. Genome Biol. 5, 232.
416 BOVERHOF ET AL.
by guest on February 21, 2016http://toxsci.oxfordjournals.org/
Dow
nloaded from
Related Documents