Faculty of Engineering Department of Textile Engineering “Comparative Study on Grey and Finished Fabric Inspection to Ensure Quality Garments” Course code: TE-4214 Course Title: Project (Thesis) Submitted By: Md. Jahidul Islam ID: 151-23-4099 Mahfoza Rahman Preety ID: 152-23-4321 Supervised By: Md. Mominur Rahman Assistant Professor A thesis submitted in partial fulfillment of the requirement for the degree of Bachelor of Science in Textile Engineering Advance in Apparel Manufacturing Technology May 2019

Welcome message from author
This document is posted to help you gain knowledge. Please leave a comment to let me know what you think about it! Share it to your friends and learn new things together.
Transcript
Faculty of Engineering
Department of Textile Engineering
“Comparative Study on Grey and Finished Fabric
Inspection to Ensure Quality Garments”
Course code: TE-4214 Course Title: Project (Thesis)
Submitted By:
Md. Jahidul Islam ID: 151-23-4099
Mahfoza Rahman Preety ID: 152-23-4321
Supervised By:
Md. Mominur Rahman
Assistant Professor
A thesis submitted in partial fulfillment of the requirement for the degree of
Bachelor of Science in Textile Engineering
Advance in Apparel Manufacturing Technology
May 2019
“Comparative Study on Grey and Finished Fabric Inspection to Ensure Quality Garments”
Page | ii ©Daffodil International University
LETTER OF APPROVAL
To,
The Head
Department of Textile Engineering
Daffodil International University
102, Shukrabad, Mirpur Rode. Dhaka 1207
Subject: Approval of project report of B.Sc. in TE Program
Dear sir,
I am just writing to let you know that this project report titled as “Comparative Study on Grey and
Finished Fabric Inspection to Ensure Quality Garments” has been prepared by the students Md.
Jahidul Islam bearing ID 151-23-4099 and Mahfoza Rahman Preety bearing ID 152-23-4321 is
completed for final evaluation. The whole report is prepared based on the proper investigation and
interruption through critical analysis empirical data with required belongings. The students were
directly involved in their project activities and the report become.
Vital to spark of much valuable information for the readers.
Therefore it will highly appreciate if you kindly accept this project report and consider it for final
evaluation.
Yours sincerely
Md. Mominur Rahman
Assistant Professor
Department of Textile Engineering
Daffodil International University
“Comparative Study on Grey and Finished Fabric Inspection to Ensure Quality Garments”
Page | iii ©Daffodil International University
DECLARATION
We hereby declare that, this project has been done by us under the supervision of Md. Mominur
Rahman, Assistant Professor, Department Of Textile Engineering, Daffodil International
University. We also declare that neither this project not any part of this project has been submitted
elsewhere for aware of any degree.
Submitted By:
Student Name ID Signature
Md. Jahidul Islam 151-23-4099
Mahfoza Rahman Preety 152-23-4321
Supervised By:
Md. Mominur Rahman
Assistant Professor
Department of Textile Engineering
Daffodil International University
“Comparative Study on Grey and Finished Fabric Inspection to Ensure Quality Garments”
Page | iv ©Daffodil International University
ACKNOWLEDGEMENT
At first we would like to express our deep appreciation to Allah for providing the opportunity to
complete our thesis on depth study of “Comparative Study on Grey and Finished Fabric Inspection to
Ensure Quality Garments”
We would like to thank Assistant Professor Md. Mominur Rahman for his leadership, guidance,
valuable suggestions and helping to us. Without his help we would not have been able to learn the
complicated Subject.
And we would like to thanks the management of the JK Knit Composite Limited and Meghna Knit
Composite Limited for giving us the opportunity to perform the thesis successfully.
We would like to thank our entire course mate in Daffodil international University, who kept us sane
& took part in this discuss while completing the course work.
Finally, we must acknowledge with due respect the constant support and parents.
“Comparative Study on Grey and Finished Fabric Inspection to Ensure Quality Garments”
Page | v ©Daffodil International University
ABSTRACT
This project is on “Comparative Study on Grey and Finished Fabric Inspection to Ensure Quality
Garments” Fabric inspection process is most important in Garments sector. If fabric faults is an
important parameter for rejection of fabrics. We have collected a large experience about this project.
We have increased our knowledge about how the inspection is done, problems of inspection & how
those problems are minimized. This study investigated the knit fabric inspection process in a garment
industry for the reasons of increasing faults and the priorities were determined for the improvement
studies regarding rejection percentage. During data collection, the fabric inspections faults were
determined. As a result, the knit fabric production process was concluded statistically. In addition,
there was a statistically significant relation the faults amounts in term of rejection. Finally some
suggestions are made for improving the quality of fabric inspection by minimizing the fabric
inspection faults.
“Comparative Study on Grey and Finished Fabric Inspection to Ensure Quality Garments”
Page | vi ©Daffodil International University
Table of Contents
Table of Contents LATTER OF APPROVAL ................................................................................................................... ii
DECLARATION ................................................................................................................................. iii
ACKNOWLEDGEMENT ................................................................................................................... iv
ABSTRACT .......................................................................................................................................... v
Table of Contents ................................................................................................................................. vi
Chapter – 1 ............................................................................................................................................ 1
1. Introduction: .................................................................................................................................. 2
1.1 Background of study ................................................................................................................... 2
1.2 Objective of the study ................................................................................................................. 2
1.3 Important of the study ................................................................................................................. 2
1.4 Limitation of the study ................................................................................................................ 3
Chapter – 2 ............................................................................................................................................ 4
2. Literature Survey ........................................................................................................................... 5
2.1 Fabric Inspection: .................................................................................................................... 5
2.2 Reasons of fabric inspection: ................................................................................................... 5
2.3 Objectives: ............................................................................................................................... 5
2.4 Flowchart of Fabric Inspection: ............................................................................................... 6
2.5 Method of fabric Inspection: ................................................................................................... 6
2.6 Four Point System: .................................................................................................................. 6
2.7 Fabric Inspection Procedure: ................................................................................................... 8
2.8 Fabric inspection tools: ............................................................................................................ 9
2.9 The Quality Inspector of eligibility Criteria: ........................................................................... 9
2.10 General inspection procedure: ............................................................................................... 9
“Comparative Study on Grey and Finished Fabric Inspection to Ensure Quality Garments”
Page | vii ©Daffodil International University
2.11 Four Point System of Textile Inspection: ............................................................................ 10
2.12 Importance of Fabric Inspection: ......................................................................................... 10
2.13 Limitations of Fabric Inspection: ........................................................................................ 11
2.14 Different Types of fault and their Causes and Remedies: ................................................... 11
Chapter – 3 .......................................................................................................................................... 14
3. Experimental Details ................................................................................................................... 15
3.1 Faults of Factory 1 (Grey) ..................................................................................................... 15
3.2 Causes of Faults of Factory 1 (Grey): ................................................................................... 16
3.3 Faults of Factory 2 (Grey): .................................................................................................... 21
3.4 Causes of Faults of Factory 2 (Grey): ................................................................................... 23
3.5 Faults of Factory 1 (Finished) ............................................................................................... 29
3.6 Causes of Faults of Factory 1 (Finished): .............................................................................. 30
3.7 Faults of Factory 2 (Finished): .............................................................................................. 36
3.8 Causes of Faults of Factory 2 (Finished): .............................................................................. 37
Chapter – 4 .......................................................................................................................................... 44
4.1 Comparison of grey fabric fault ................................................................................................ 45
4.1.1 Comparison factory 1 and factory 2 ................................................................................... 45
4.2 Comparison of causes of grey fabric faults ........................................................................... 46
4.2.1 Comparison of causes of factory 1 and factory 2 ............................................................... 46
4.3 Comparison of finished fabric fault ....................................................................................... 52
4.3.1 Comparison factory 1 and factory 2 ................................................................................... 52
4.4 Comparison of causes of finished fabric faults ..................................................................... 54
4.4.1 Comparison of causes of factory 1 and factory 2 ............................................................... 54
Chapter – 5 .......................................................................................................................................... 56
Conclusion:...................................................................................................................................... 57
References ........................................................................................................................................... 58
“Comparative Study on Grey and Finished Fabric Inspection to Ensure Quality Garments”
Page | viii ©Daffodil International University
List of Table:
3.1.1: Grey fabric faults of factory 1
3.2.1: Causes of faults of hole
3.2.2 Causes of faults of oil spot
3.2.3: Causes of faults of fly contamination
3.2.4: Causes of faults of slubs
3.2.5: Causes of faults of set up
3.3.1: Gray fabric faults of factory 2
3.4.1: Causes of faults of hole:
3.4.2: Causes of faults of oil spot
3.4.3: Causes of faults of fly contamination
3.4.4: Causes of faults of slubs
3.4.5: Causes of faults of set up
3.5.1: Finished fabric faults of factory – 1
3.6.1: Causes of faults of hole
3.6.2: Causes of faults of oil spot
3.6.3: Causes of faults of dyeing spot
3.6.4: Causes of faults of yellow spot
3.6.5: Causes of faults of yarn contamination
3.6.6: Causes of faults of crease mark
3.7.1: Finished fabric faults of factory 2
3.8.1: Causes of faults of hole
3.8.2: Causes of faults of spot/dust
3.8.3: Causes of faults of missing yarn
3.8.4: Causes of faults of set up
3.8.5: Causes of faults of loop
3.8.6: Causes of faults of slubs
4.1.2: Table of grey fabric faults comparison
“Comparative Study on Grey and Finished Fabric Inspection to Ensure Quality Garments”
Page | ix ©Daffodil International University
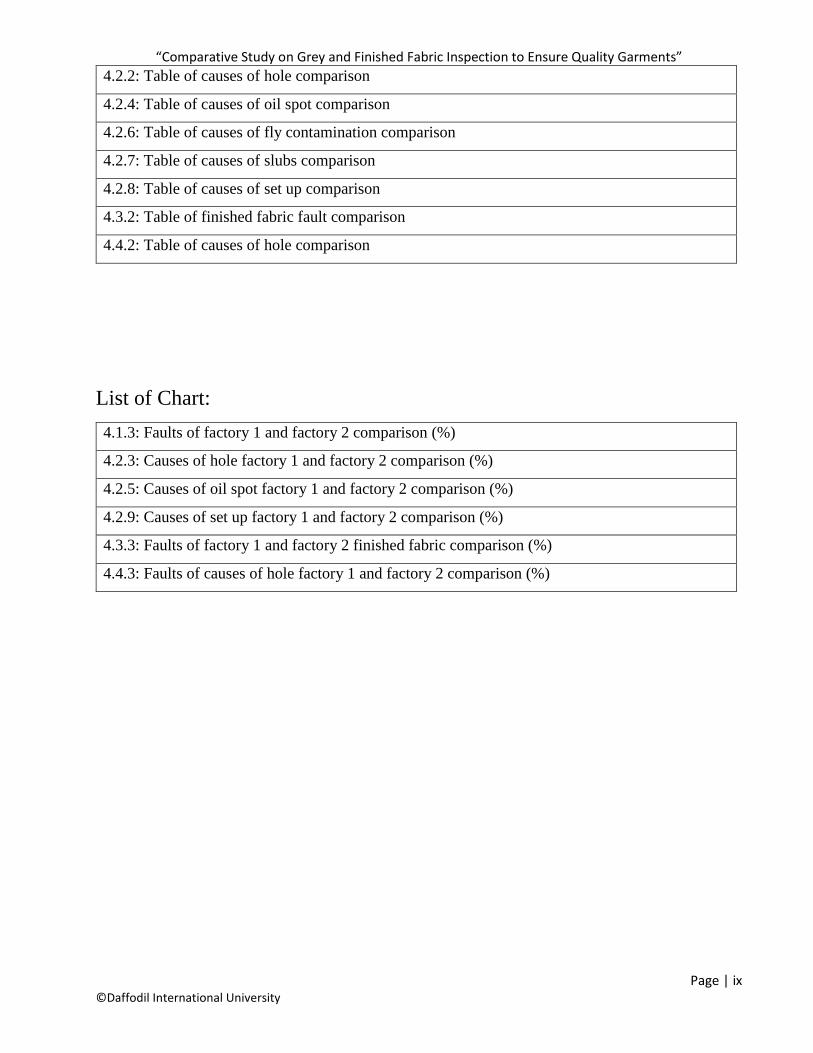
4.2.2: Table of causes of hole comparison
4.2.4: Table of causes of oil spot comparison
4.2.6: Table of causes of fly contamination comparison
4.2.7: Table of causes of slubs comparison
4.2.8: Table of causes of set up comparison
4.3.2: Table of finished fabric fault comparison
4.4.2: Table of causes of hole comparison
List of Chart:
4.1.3: Faults of factory 1 and factory 2 comparison (%)
4.2.3: Causes of hole factory 1 and factory 2 comparison (%)
4.2.5: Causes of oil spot factory 1 and factory 2 comparison (%)
4.2.9: Causes of set up factory 1 and factory 2 comparison (%)
4.3.3: Faults of factory 1 and factory 2 finished fabric comparison (%)
4.4.3: Faults of causes of hole factory 1 and factory 2 comparison (%)
“Comparative Study on Grey and Finished Fabric Inspection to Ensure Quality Garments”
Page | 1 ©Daffodil International University
Chapter – 1
Introduction
“Comparative Study on Grey and Finished Fabric Inspection to Ensure Quality Garments”
Page | 2 ©Daffodil International University
1. Introduction:
1.1 Background of study
In garments industry one of the most important is fabric inspection section. Fabric faults is a major
problem for production and quality. In fabric inspection section checking all types of fabric faults. In
this section checked will start after knitting, dyeing, finishing. So, in fabric inspection section we can
find all types of faults that is yarn knitting, dyeing and finishing faults. For this reason we selected this
topic.
1.2 Objective of the study
i. To know about the way of fabric inspection.
ii. To know about 4-point inspection system.
iii. To know about different types of fabric faults and its remedies.
iv. To know about the reasons of fabric faults and rejection.
v. To know about different type of fabric rejection and its remedies.
1.3 Important of the study
Fabric inspection section is most important section in garments industry.in fabric inspection section
they are find different types of faults and rejected fabric every factory produce reject fabric. Rejected
fabric increase the production cost. This paper will give a clear concept about different types of faults
rejected fabric and their causes and remedies of a garments industry. This paper has been made from
those people who require and introductory knowledge about fabrics faults, their causes and remedies
and rejected fabric and there percentage. This paper is especially helpful for textile student, who will
work in fabric inspection section, who will want to research this topic. This paper contain many
important and practical information.so, it will be helpful for all textile background people.
“Comparative Study on Grey and Finished Fabric Inspection to Ensure Quality Garments”
Page | 3 ©Daffodil International University
1.4 Limitation of the study
i. Time is too short for complete this paper.
ii. Lack of experiment.
iii. Lack of guide line.
iv. Problem about factory policy.
“Comparative Study on Grey and Finished Fabric Inspection to Ensure Quality Garments”
Page | 4 ©Daffodil International University
Chapter – 2
Literature Survey
“Comparative Study on Grey and Finished Fabric Inspection to Ensure Quality Garments”
Page | 5 ©Daffodil International University
2. Literature Survey
2.1 Fabric Inspection:
Fabric inspection can be characterized as the visual examination of fabric, so standards, specification
or requirement. It is a different section of garment industries. Inspection is an imperative angle pursued
preceding article of garment manufacturing to maintain a strategic distance from rejects because of
fabric quality and looking with startling misfortune in manufacturing. Fabric inspection is
accomplished for fault/defect rate, fabric development, fabric weight, shrinkage, start to finish or edge
to edge shading, shading, hand feel, length/width, print deformity and appearance. Fabric inspection
guarantees to limit the dismissal of cut boards or rejected pieces of garments because of fabric fault.
Cutting investigated and approve fabric guarantees completed article of fabric quality as well as
diminish rejects, improves proficiency and opportune conveyances.
2.2 Reasons of fabric inspection:
• To remove the fault and defects.
• To limit the future reoccurrences of the deformity.
• To decide quality and subsequently the cost of the texture.
• To supply data to legitimate dimensions of the board with regards to the characteristics being
delivered.
2.3 Objectives:
The primary target is discovery of texture surrenders and non-conformance as ahead of schedule as
could be expected under the circumstances. With the goal that the time and cash are not squandered
in the manufacturing process. A definitive objective of any quality control movement in attire' industry
is to fulfill the clients.
Main objective of inspection are the —
1) Detection of the defects.
2) Correcting of the defects.
“Comparative Study on Grey and Finished Fabric Inspection to Ensure Quality Garments”
Page | 6 ©Daffodil International University
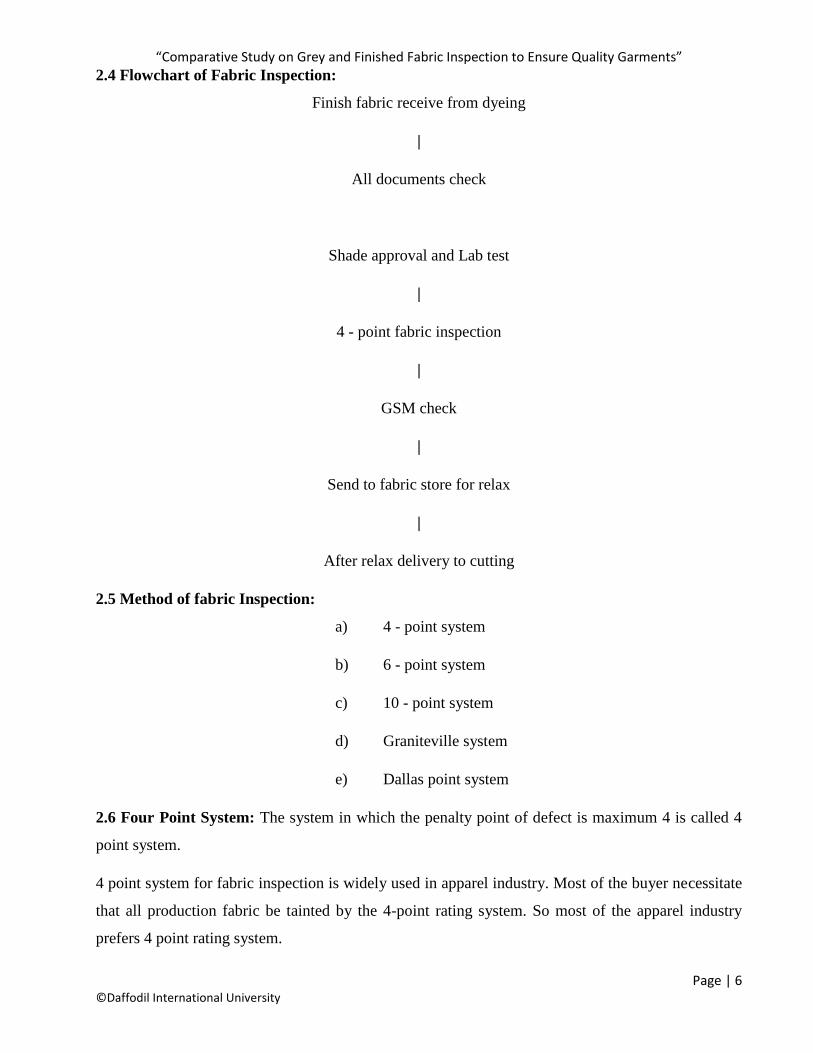
2.4 Flowchart of Fabric Inspection:
Finish fabric receive from dyeing
|
All documents check
Shade approval and Lab test
|
4 - point fabric inspection
|
GSM check
|
Send to fabric store for relax
|
After relax delivery to cutting
2.5 Method of fabric Inspection:
a) 4 - point system
b) 6 - point system
c) 10 - point system
d) Graniteville system
e) Dallas point system
2.6 Four Point System: The system in which the penalty point of defect is maximum 4 is called 4
point system.
4 point system for fabric inspection is widely used in apparel industry. Most of the buyer necessitate
that all production fabric be tainted by the 4-point rating system. So most of the apparel industry
prefers 4 point rating system.
“Comparative Study on Grey and Finished Fabric Inspection to Ensure Quality Garments”
Page | 7 ©Daffodil International University
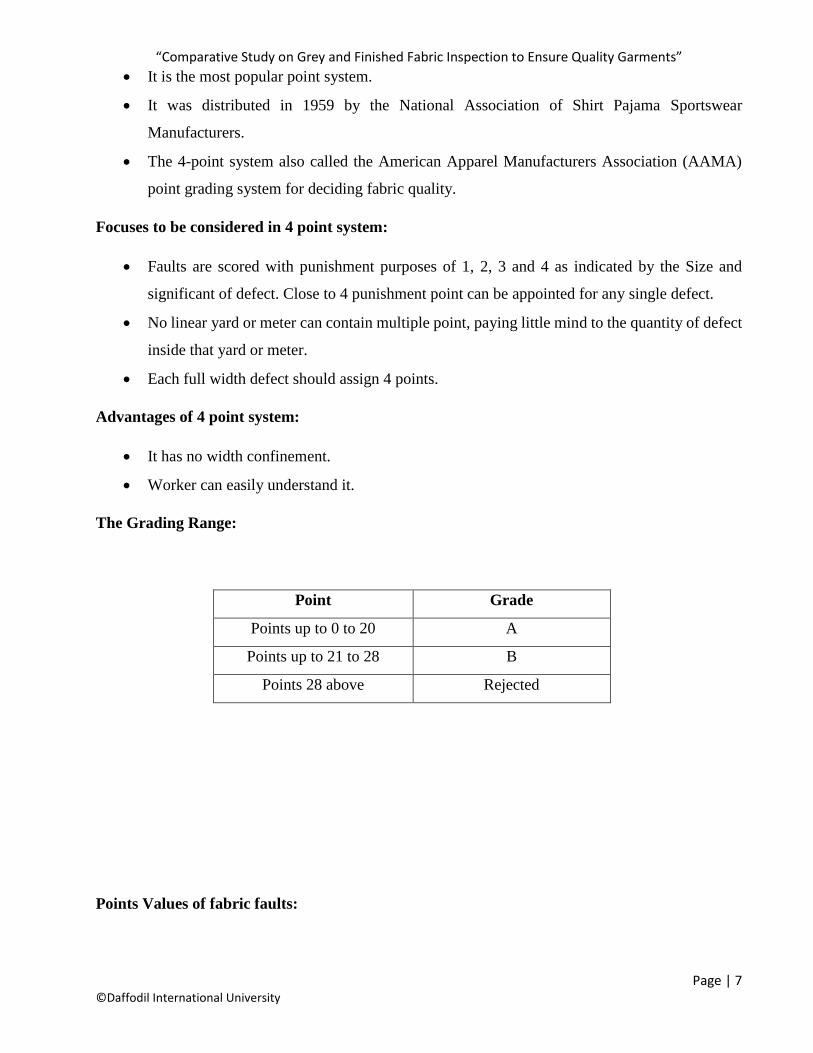
• It is the most popular point system.
• It was distributed in 1959 by the National Association of Shirt Pajama Sportswear
Manufacturers.
• The 4-point system also called the American Apparel Manufacturers Association (AAMA)
point grading system for deciding fabric quality.
Focuses to be considered in 4 point system:
• Faults are scored with punishment purposes of 1, 2, 3 and 4 as indicated by the Size and
significant of defect. Close to 4 punishment point can be appointed for any single defect.
• No linear yard or meter can contain multiple point, paying little mind to the quantity of defect
inside that yard or meter.
• Each full width defect should assign 4 points.
Advantages of 4 point system:
• It has no width confinement.
• Worker can easily understand it.
The Grading Range:
Point Grade
Points up to 0 to 20 A
Points up to 21 to 28 B
Points 28 above Rejected
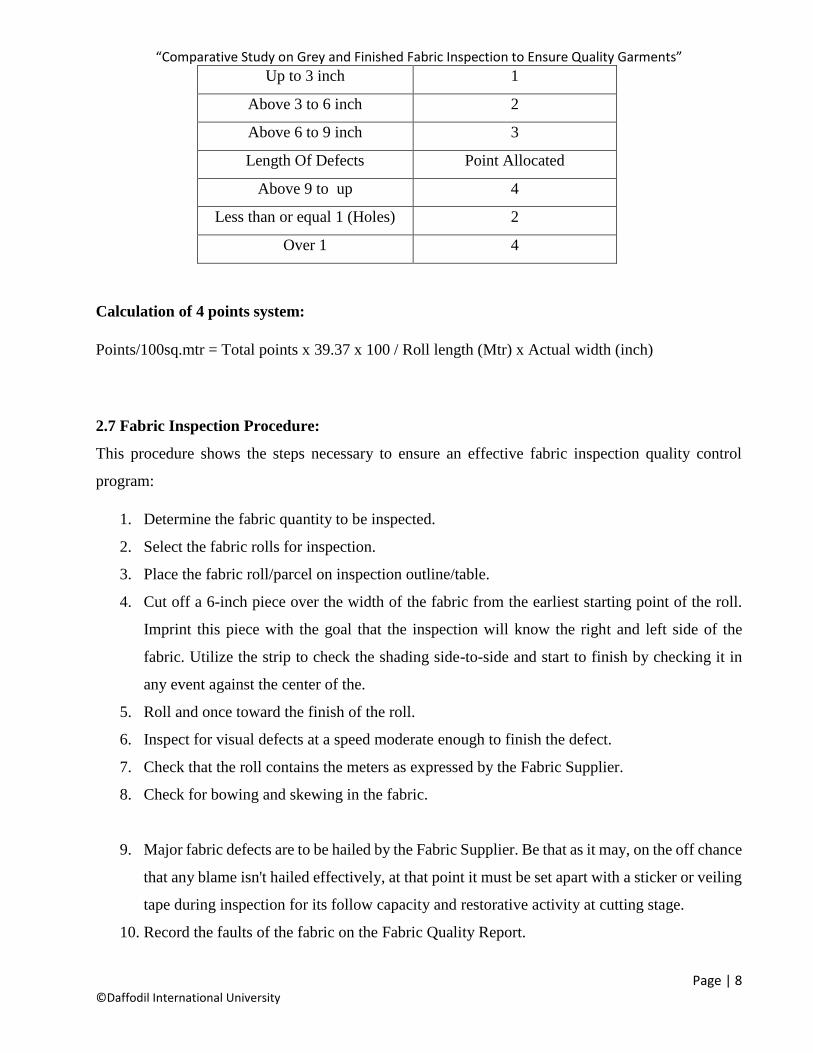
Points Values of fabric faults:
“Comparative Study on Grey and Finished Fabric Inspection to Ensure Quality Garments”
Page | 8 ©Daffodil International University
Up to 3 inch 1
Above 3 to 6 inch 2
Above 6 to 9 inch 3
Length Of Defects Point Allocated
Above 9 to up 4
Less than or equal 1 (Holes) 2
Over 1 4
Calculation of 4 points system:
Points/100sq.mtr = Total points x 39.37 x 100 / Roll length (Mtr) x Actual width (inch)
2.7 Fabric Inspection Procedure:
This procedure shows the steps necessary to ensure an effective fabric inspection quality control
program:
1. Determine the fabric quantity to be inspected.
2. Select the fabric rolls for inspection.
3. Place the fabric roll/parcel on inspection outline/table.
4. Cut off a 6-inch piece over the width of the fabric from the earliest starting point of the roll.
Imprint this piece with the goal that the inspection will know the right and left side of the
fabric. Utilize the strip to check the shading side-to-side and start to finish by checking it in
any event against the center of the.
5. Roll and once toward the finish of the roll.
6. Inspect for visual defects at a speed moderate enough to finish the defect.
7. Check that the roll contains the meters as expressed by the Fabric Supplier.
8. Check for bowing and skewing in the fabric.
9. Major fabric defects are to be hailed by the Fabric Supplier. Be that as it may, on the off chance
that any blame isn't hailed effectively, at that point it must be set apart with a sticker or veiling
tape during inspection for its follow capacity and restorative activity at cutting stage.
10. Record the faults of the fabric on the Fabric Quality Report.
“Comparative Study on Grey and Finished Fabric Inspection to Ensure Quality Garments”
Page | 9 ©Daffodil International University
2.8 Fabric inspection tools:
The person who is responsible for fabric inspection must have the following facilities / equipment in
good working condition.
1. Inspection edge with counter.
2. D - 65 light source (daylight)/TL - 84 light source at the investigation outline according to the
requirement of the client.
3. Measuring tape and pair of scissors.
4. Stickers or covering tape to recognize the faults.
5. Pick glass.
6. Taking reference snaps by digital camera.
7. Client's reference sample or master fabric sample.
2.9 The Quality Inspector of eligibility Criteria:
1. The person must be at any rate graduate.
2. Must have minimum two year experience in the textile industry.
3. Must be know about 4-point fabric inspection system.
4. Must be dynamic and physically fit.
5. Must not be colorblind.
2.10 General inspection procedure:
Fabric inspection is done in suitable and safe condition with enough ventilation and appropriate
lighting.
Fabric going through the frame must be between 45-60 degree angles to inspection and must be done
on proper Cool White light 2 F96 bright light bulbs above review area. Back light can be utilized as
and when required. Fabric speed on inspection machine must not be in excess of 15 yards for each
moment. All fabric inspection must be done when 80% of good or part is gotten. Standard approved
bulk day parcel principles for every single endorsed part should be accessible before inspection.
Approve standard of bulk day part should be available before beginning inspection for evaluating
shading, hand, weight, development, complete and visual appearance. Shade continuity inside a move
“Comparative Study on Grey and Finished Fabric Inspection to Ensure Quality Garments”
Page | 10 ©Daffodil International University
by checking shade variety among focus and selvage and the starting, center and end of each roll must
be evaluated and documented. Materials like knits must be assessed for weight against standard
approved weight. Fabric width must be checked from selvage to selvage against standard. All defects
must be hailed during inspection. The length of each roll inspection must be compared with length as
referenced on supplier ticketed tag and any deviation must be archived and reported to process for
extra substitution to maintain a strategic distance from lack.
In the event that yard dyed or printed fabric are being inspected the repeat estimation must be done
from starting, center and end of chosen rolls.
2.11 Four Point System of Textile Inspection:
Four Point System depends on punishment points given toward a deformity found while inspecting
fabric. Guideline is as beneath:
1. Not in excess of four punishment points might be given for any single defect.
2. No in excess of four punishment points might be given to one linear yard/meter paying little
heed to the quantity of defects found inside one yard/meter.
3. For consistent defects, for example, shading between side, middle side, side to side shading,
start to finish shading no punishment points are allocated but the roll is graded as second quality
and must be reported for to process for substitution.
2.12 Importance of Fabric Inspection:
As we realize that fabric are the main and costly raw materials of a piece of clothing. So it is essential
to use fabric productively and control wastage of fabric. Then again fabric defects are the most extreme
defects of pieces of clothing, for which many-unexpected problem may happen in a garments industry.
For example, short shipment, markdown, low cost etc.
To avoid all about problems from every above issue and to take preventive measures fabric inspection
is essential for a garments industry. It is additionally vital for the following aspects:
1. Improve product quality
2. Minimize waste
3. Reduce the expense
“Comparative Study on Grey and Finished Fabric Inspection to Ensure Quality Garments”
Page | 11 ©Daffodil International University
4. Avoid short shipment/Order wiping out
5. Increase profitability
6. Use grading system
2.13 Limitations of Fabric Inspection:
Actually the percentage of limitations for fabric inspection is very poor. Be that as it may, problem
can be happened if the inspection not be down correctly at the point when the controller inspect the
fabric.
Around then in the event that they don’t inspect the fabric correctly, don’t mark the faults. At that
point numerous problem will happen. It is major obligation of this section to deliver fabric to cutting
which fabric are properly checked. Else it will hamper the work of cutting section. And also west the
tine of production. So profitability will decrease. It is important to utilize the time appropriately for
better production and for timely shipment. And also used proper grading system. Must be grading
done in right way. Grade the fabric according to faults.
2.14 Different Types of fault and their Causes and Remedies:
Many types of fabric faults and their causes and remedies has given below.
Hole:
Causes:
• Presence in yarn knot.
• Weak point in yarn.
• Yarn tension excessively high.
• Yarn excessively dry.
• Broken needle head
Remedies:
• Use of level knot.
• Yarn normality control.
• Use of defensive filter creel.
“Comparative Study on Grey and Finished Fabric Inspection to Ensure Quality Garments”
Page | 12 ©Daffodil International University
• Change the needle
Missing yarn:
Causes:
• Missing of one end of double yarn
Remedies:
• Careful observation and instant machine stop when fault found
Needle line:
Causes:
• Bent needle latch
Remedies:
• Replace the needle.
Slubs:
Causes:
• Yarn fault
Remedies:
• Replace the yarn cone to a more uniform yarn cone
Drop needle:
Causes:
• Needle failed to receive the yarn while knitting, needle missing
Remedies:
• Reset the needle
“Comparative Study on Grey and Finished Fabric Inspection to Ensure Quality Garments”
Page | 13 ©Daffodil International University
Pin hole:
Causes:
• Due to missing stitches or loops
Remedies:
• Concentrate on needle and latch
Oil line:
Causes:
• Improper lubrication
Remedies:
• Proper lubrication
Fly contact:
Causes:
• Fly coming from the adjacent machine
Remedies:
• Separate one machine from other
Oil stain:
Causes:
• Dirty machine and improper handling of fabric
Remedies:
• Proper lubrication and clean machine
“Comparative Study on Grey and Finished Fabric Inspection to Ensure Quality Garments”
Page | 14 ©Daffodil International University
Chapter – 3
Experimental Details
“Comparative Study on Grey and Finished Fabric Inspection to Ensure Quality Garments”
Page | 15 ©Daffodil International University
3. Experimental Details
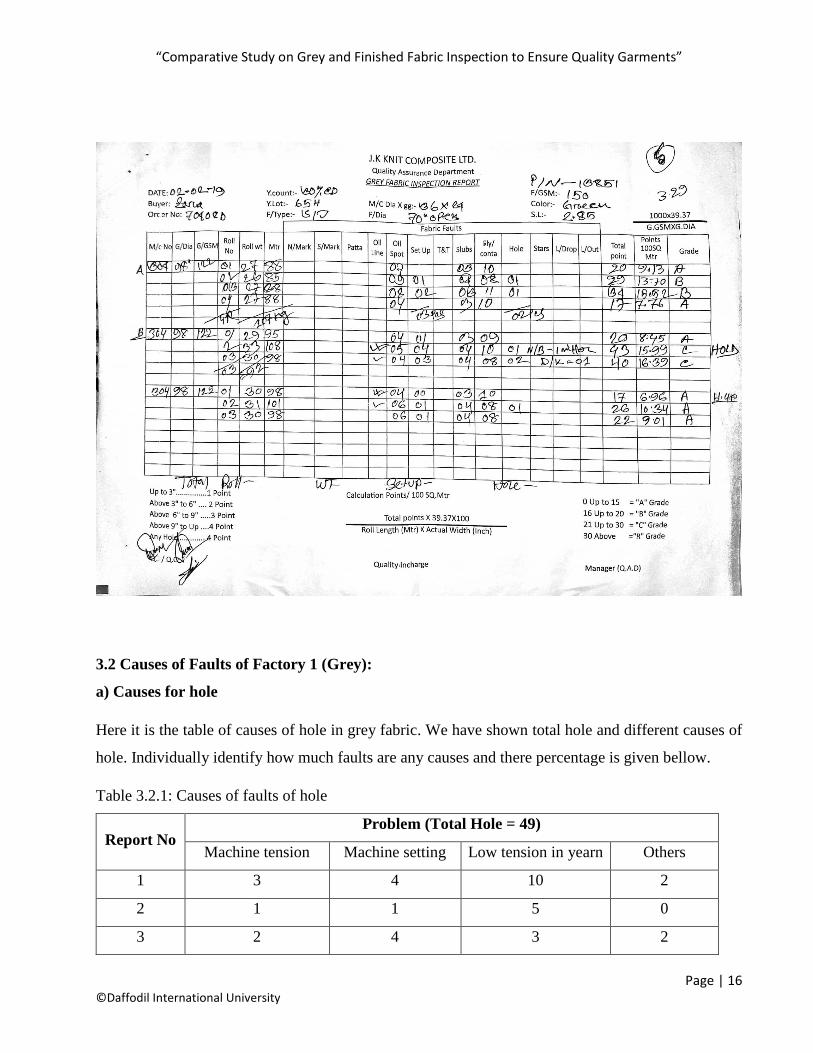
3.1 Faults of Factory 1 (Grey)
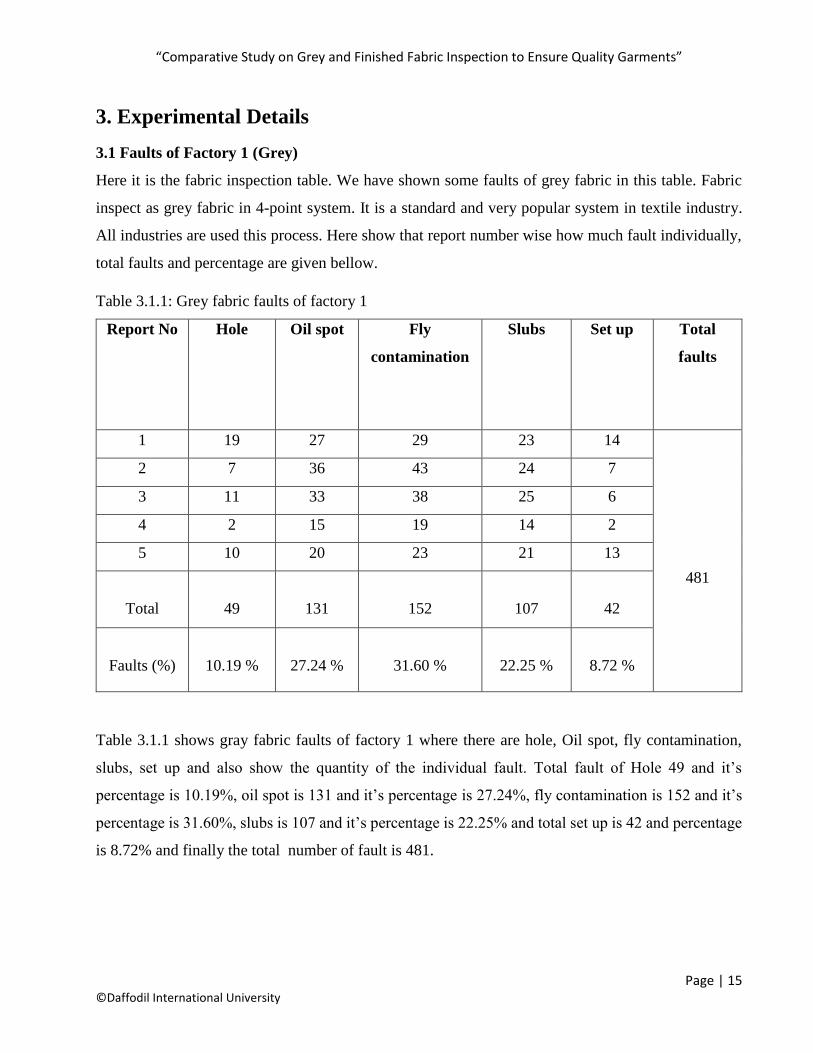
Here it is the fabric inspection table. We have shown some faults of grey fabric in this table. Fabric
inspect as grey fabric in 4-point system. It is a standard and very popular system in textile industry.
All industries are used this process. Here show that report number wise how much fault individually,
total faults and percentage are given bellow.
Table 3.1.1: Grey fabric faults of factory 1
Report No Hole Oil spot Fly
contamination
Slubs Set up Total
faults
1 19 27 29 23 14
481
2 7 36 43 24 7
3 11 33 38 25 6
4 2 15 19 14 2
5 10 20 23 21 13
Total
49
131
152
107
42
Faults (%)
10.19 %
27.24 %
31.60 %
22.25 %
8.72 %
Table 3.1.1 shows gray fabric faults of factory 1 where there are hole, Oil spot, fly contamination,
slubs, set up and also show the quantity of the individual fault. Total fault of Hole 49 and it’s
percentage is 10.19%, oil spot is 131 and it’s percentage is 27.24%, fly contamination is 152 and it’s
percentage is 31.60%, slubs is 107 and it’s percentage is 22.25% and total set up is 42 and percentage
is 8.72% and finally the total number of fault is 481.
“Comparative Study on Grey and Finished Fabric Inspection to Ensure Quality Garments”
Page | 16 ©Daffodil International University
3.2 Causes of Faults of Factory 1 (Grey):
a) Causes for hole
Here it is the table of causes of hole in grey fabric. We have shown total hole and different causes of
hole. Individually identify how much faults are any causes and there percentage is given bellow.
Table 3.2.1: Causes of faults of hole
Report No Problem (Total Hole = 49)
Machine tension Machine setting Low tension in yearn Others
1 3 4 10 2
2 1 1 5 0
3 2 4 3 2
“Comparative Study on Grey and Finished Fabric Inspection to Ensure Quality Garments”
Page | 17 ©Daffodil International University
4 0 0 2 0
5 0 3 7 0
Total 6 12 27 4
Faults (%) 12.24% 24.49% 55.11% 8.16%
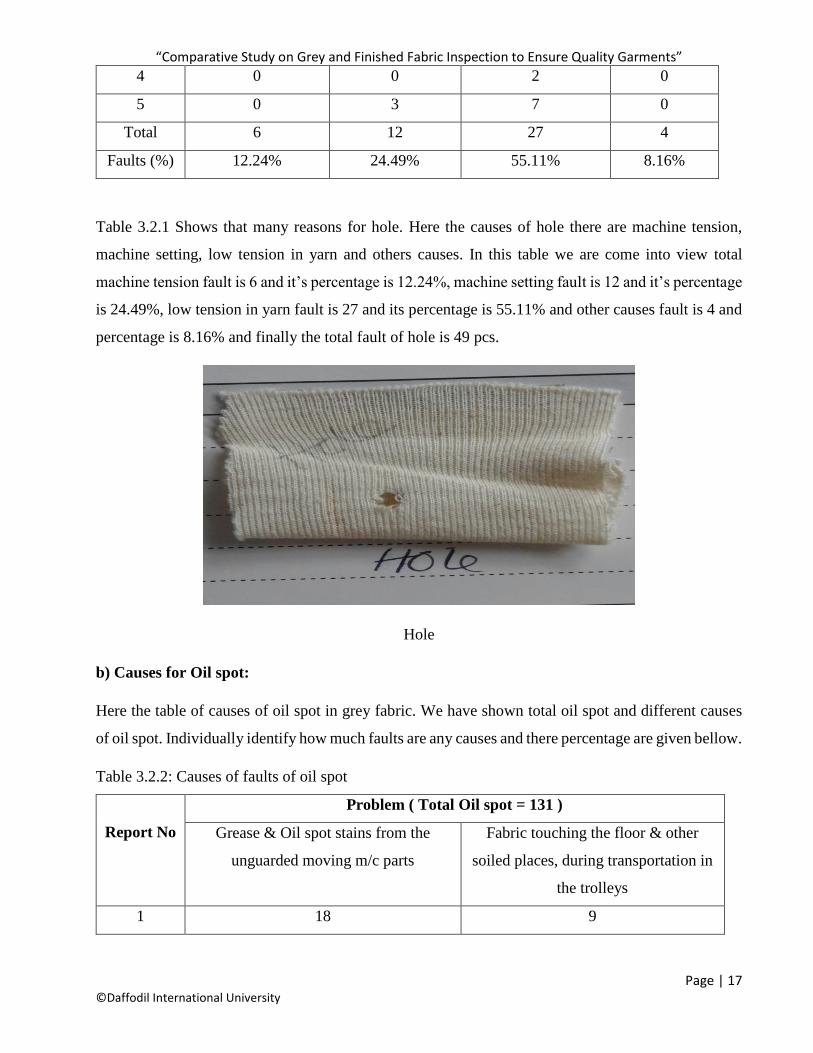
Table 3.2.1 Shows that many reasons for hole. Here the causes of hole there are machine tension,
machine setting, low tension in yarn and others causes. In this table we are come into view total
machine tension fault is 6 and it’s percentage is 12.24%, machine setting fault is 12 and it’s percentage
is 24.49%, low tension in yarn fault is 27 and its percentage is 55.11% and other causes fault is 4 and
percentage is 8.16% and finally the total fault of hole is 49 pcs.
Hole
b) Causes for Oil spot:
Here the table of causes of oil spot in grey fabric. We have shown total oil spot and different causes
of oil spot. Individually identify how much faults are any causes and there percentage are given bellow.
Table 3.2.2: Causes of faults of oil spot
Report No
Problem ( Total Oil spot = 131 )
Grease & Oil spot stains from the
unguarded moving m/c parts
Fabric touching the floor & other
soiled places, during transportation in
the trolleys
1 18 9
“Comparative Study on Grey and Finished Fabric Inspection to Ensure Quality Garments”
Page | 18 ©Daffodil International University
2 28 8
3 25 8
4 15 0
5 17 3
Total 103 28
Faults (%) 78.63% 21.37%
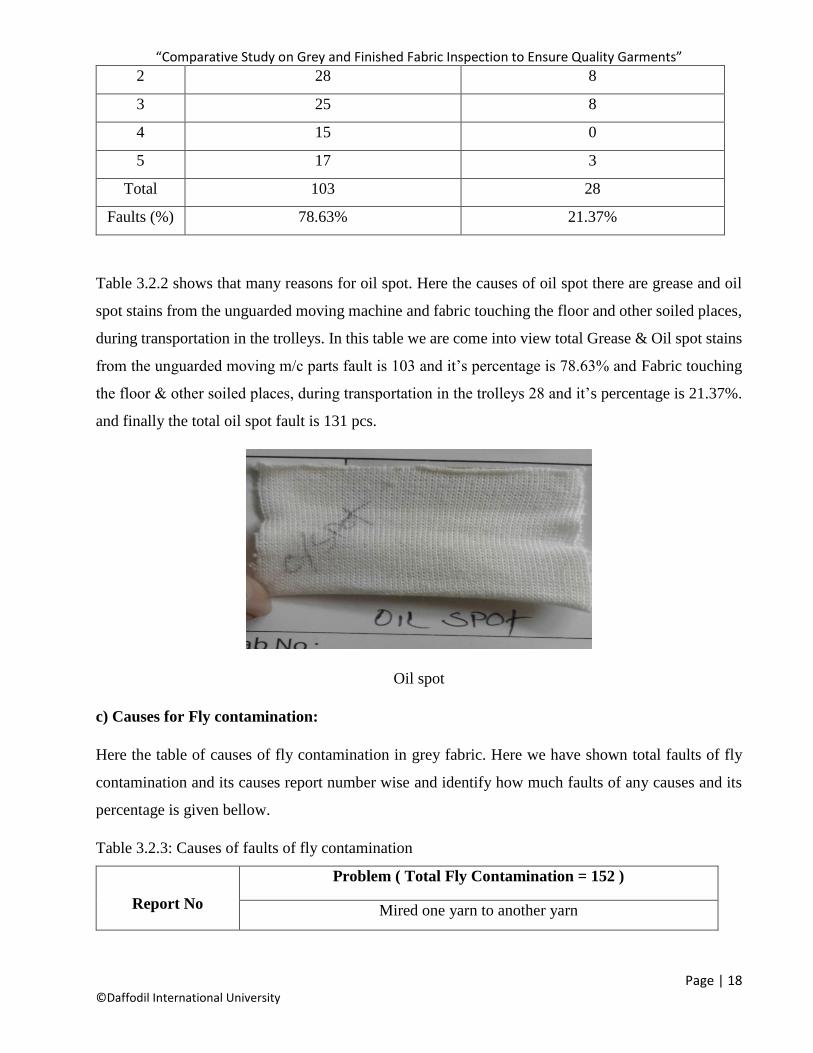
Table 3.2.2 shows that many reasons for oil spot. Here the causes of oil spot there are grease and oil
spot stains from the unguarded moving machine and fabric touching the floor and other soiled places,
during transportation in the trolleys. In this table we are come into view total Grease & Oil spot stains
from the unguarded moving m/c parts fault is 103 and it’s percentage is 78.63% and Fabric touching
the floor & other soiled places, during transportation in the trolleys 28 and it’s percentage is 21.37%.
and finally the total oil spot fault is 131 pcs.
Oil spot
c) Causes for Fly contamination:
Here the table of causes of fly contamination in grey fabric. Here we have shown total faults of fly
contamination and its causes report number wise and identify how much faults of any causes and its
percentage is given bellow.
Table 3.2.3: Causes of faults of fly contamination
Report No
Problem ( Total Fly Contamination = 152 )
Mired one yarn to another yarn
“Comparative Study on Grey and Finished Fabric Inspection to Ensure Quality Garments”
Page | 19 ©Daffodil International University
1 29
2 43
3 38
4 29
5 23
Total 152
Faults (%) 100%
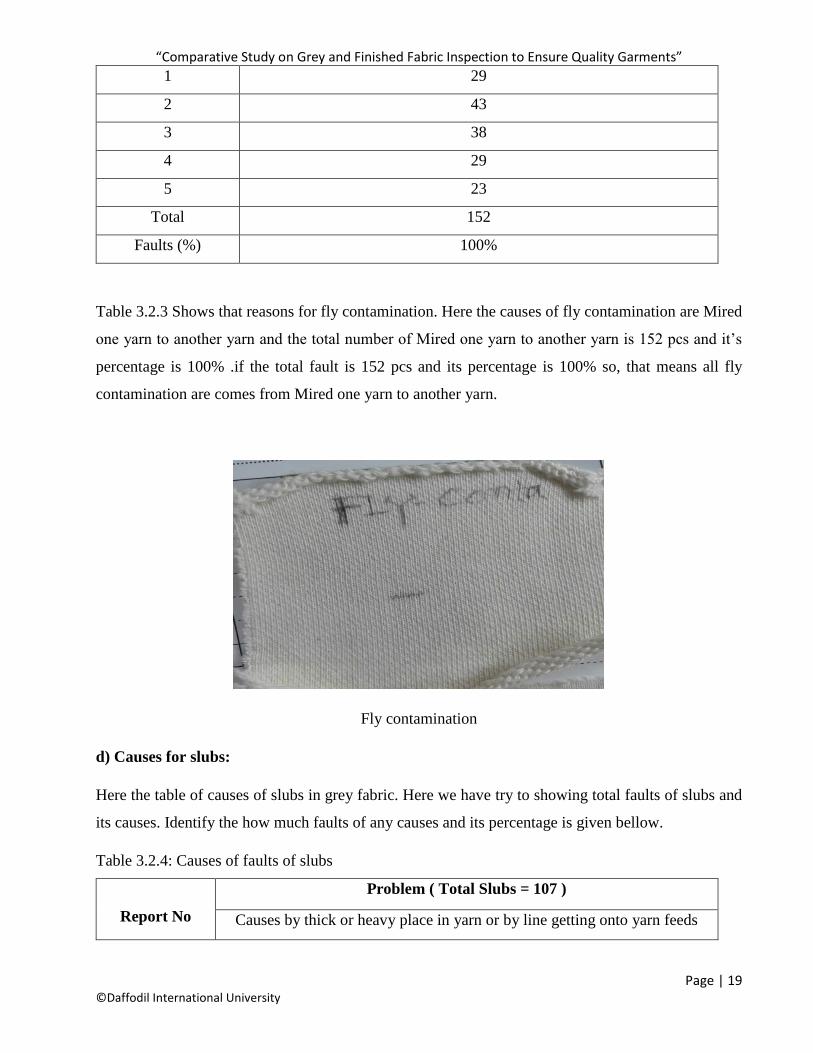
Table 3.2.3 Shows that reasons for fly contamination. Here the causes of fly contamination are Mired
one yarn to another yarn and the total number of Mired one yarn to another yarn is 152 pcs and it’s
percentage is 100% .if the total fault is 152 pcs and its percentage is 100% so, that means all fly
contamination are comes from Mired one yarn to another yarn.
Fly contamination
d) Causes for slubs:
Here the table of causes of slubs in grey fabric. Here we have try to showing total faults of slubs and
its causes. Identify the how much faults of any causes and its percentage is given bellow.
Table 3.2.4: Causes of faults of slubs
Report No
Problem ( Total Slubs = 107 )
Causes by thick or heavy place in yarn or by line getting onto yarn feeds
“Comparative Study on Grey and Finished Fabric Inspection to Ensure Quality Garments”
Page | 20 ©Daffodil International University
1 23
2 24
3 25
4 14
5 21
Total 107
Faults (%) 100%
Table 3.2.4 Shows that reasons for slubs. Here the causes of slubs are thick or heavy place in yarn or
by line getting onto yarn feeds and the total number of thick or heavy place in yarn or by line getting
onto yarn feeds is 107 pcs and it’s percentage is 100%. If the total fault is 107 pcs and percentage is
100% so, that means all slubs are comes from thick or heavy place in yarn or by line getting onto yarn
feeds.
Yarn slub
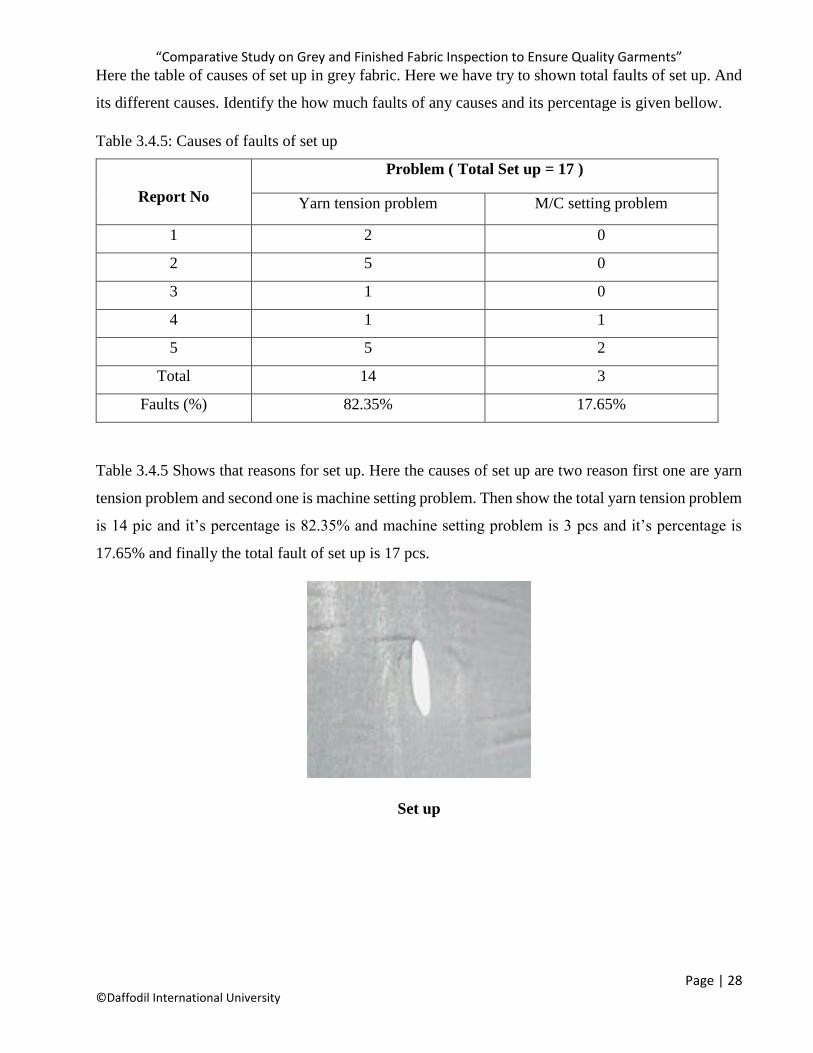
e) Causes for Set up:
Here the table of causes of set up in grey fabric. Here we have try to showing total faults of set up.
And its different causes. Identify the how much faults of any causes and its percentage is given bellow.
Table 3.2.5: Causes of faults of set up
Problem ( Total Set up = 42 )
“Comparative Study on Grey and Finished Fabric Inspection to Ensure Quality Garments”
Page | 21 ©Daffodil International University
Report No Yarn tension problem M/C setting problem
1 10 4
2 7 0
3 6 0
4 2 0
5 11 2
Total 36 6
Faults (%) 85.71% 14.29%
Table 3.2.5 Shows that reasons for set up. Here the causes of set up are two reason first one are yarn
tension problem and second one is machine setting problem. Then show the total yarn tension problem
is 36 pic and it’s percentage is 85.71% and machine setting problem is 6 pcs and it’s percentage is
14.29% and finally the total fault of set up is 42 pcs.
Set up
3.3 Faults of Factory 2 (Grey):
Here it is the fabric inspection table. We have shown some faults of grey fabric in this table. Fabric
inspect as grey fabric in 4-point system. It is a standard and very popular system in textile industry.
All industries are used this process. Here show that report number wise how much fault individually,
total faults and percentage are given bellow.
“Comparative Study on Grey and Finished Fabric Inspection to Ensure Quality Garments”
Page | 22 ©Daffodil International University
Table 3.3.1 Gray fabric faults of factory 2
Report No
Hole
Oil spot
Fly
contamination
Slubs
Set up
Total
fault
1 9 16 41 7 2
397
2 16 13 57 3 5
3 14 21 29 3 1
4 12 19 40 0 2
5 9 19 50 4 7
Total
60
86
217
17
17
Faults (%)
15.12 %
21.66%
54.66 %
4.28 %
4.28 %
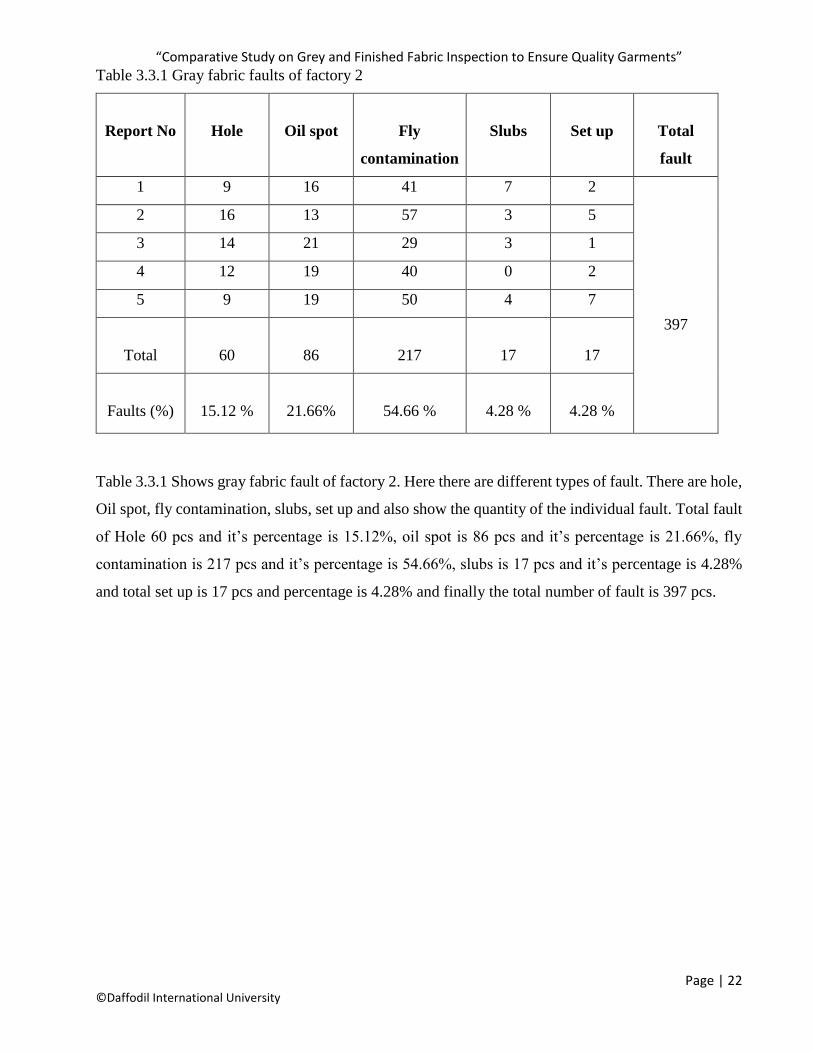
Table 3.3.1 Shows gray fabric fault of factory 2. Here there are different types of fault. There are hole,
Oil spot, fly contamination, slubs, set up and also show the quantity of the individual fault. Total fault
of Hole 60 pcs and it’s percentage is 15.12%, oil spot is 86 pcs and it’s percentage is 21.66%, fly
contamination is 217 pcs and it’s percentage is 54.66%, slubs is 17 pcs and it’s percentage is 4.28%
and total set up is 17 pcs and percentage is 4.28% and finally the total number of fault is 397 pcs.
“Comparative Study on Grey and Finished Fabric Inspection to Ensure Quality Garments”
Page | 23 ©Daffodil International University
3.4 Causes of Faults of Factory 2 (Grey):
a) Causes for hole
Here the table of causes of hole in grey fabric. Here we have shown total hole and different causes of
hole. Individually identify how much faults are any causes and there percentage is given bellow.
Table 3.4.1: Causes of faults of hole:
Report No
Problem ( Total Hole = 60 )
Machine tension Machine setting Low tension in yearn Others
1 3 4 2 0
2 7 6 3 0
3 5 6 2 1
4 4 6 1 1
5 3 2 2 2
Total 22 24 10 4
Faults (%) 36.67% 40% 16.67% 6.67%
“Comparative Study on Grey and Finished Fabric Inspection to Ensure Quality Garments”
Page | 24 ©Daffodil International University
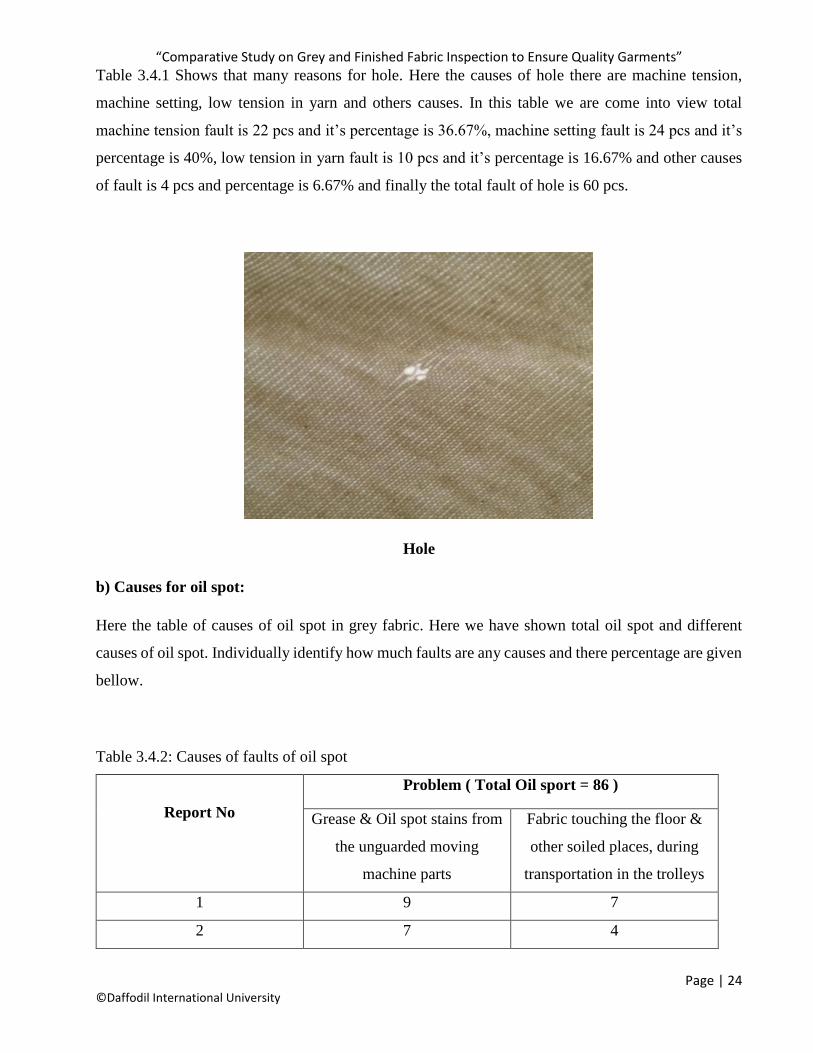
Table 3.4.1 Shows that many reasons for hole. Here the causes of hole there are machine tension,
machine setting, low tension in yarn and others causes. In this table we are come into view total
machine tension fault is 22 pcs and it’s percentage is 36.67%, machine setting fault is 24 pcs and it’s
percentage is 40%, low tension in yarn fault is 10 pcs and it’s percentage is 16.67% and other causes
of fault is 4 pcs and percentage is 6.67% and finally the total fault of hole is 60 pcs.
Hole
b) Causes for oil spot:
Here the table of causes of oil spot in grey fabric. Here we have shown total oil spot and different
causes of oil spot. Individually identify how much faults are any causes and there percentage are given
bellow.
Table 3.4.2: Causes of faults of oil spot
Report No
Problem ( Total Oil sport = 86 )
Grease & Oil spot stains from
the unguarded moving
machine parts
Fabric touching the floor &
other soiled places, during
transportation in the trolleys
1 9 7
2 7 4
“Comparative Study on Grey and Finished Fabric Inspection to Ensure Quality Garments”
Page | 25 ©Daffodil International University
3 20 1
4 17 2
5 19 0
Total 72 14
Faults (%) 83.72% 16.28%
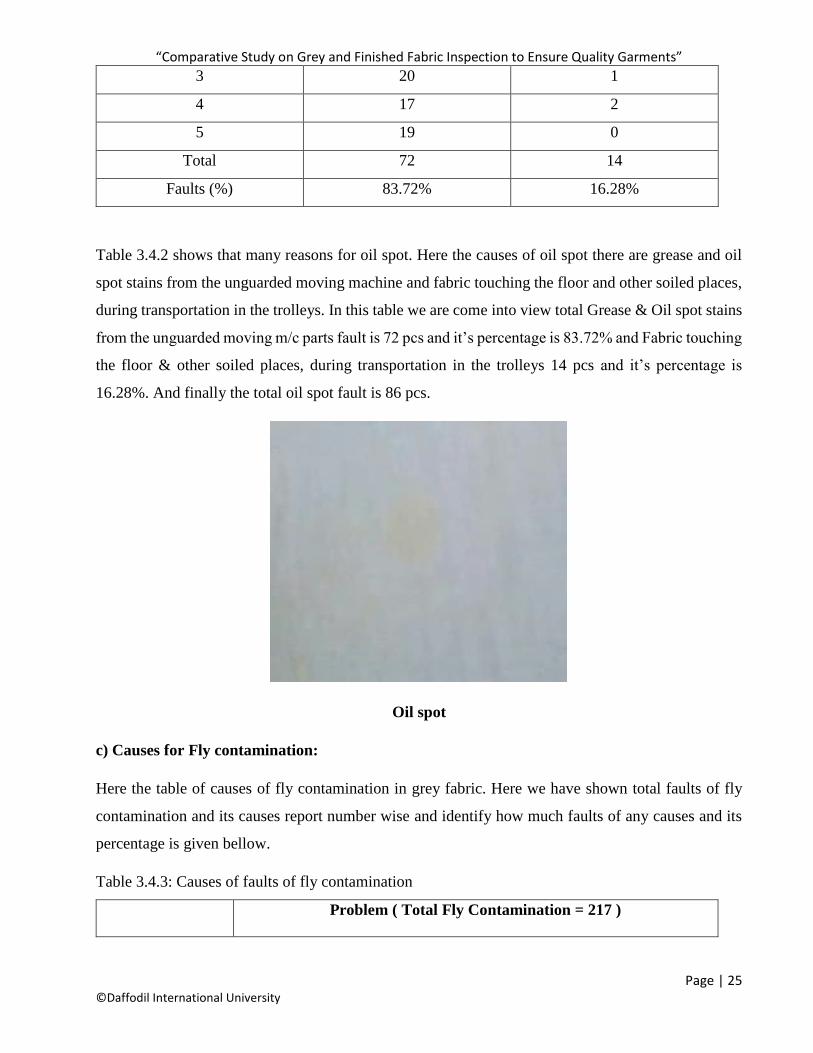
Table 3.4.2 shows that many reasons for oil spot. Here the causes of oil spot there are grease and oil
spot stains from the unguarded moving machine and fabric touching the floor and other soiled places,
during transportation in the trolleys. In this table we are come into view total Grease & Oil spot stains
from the unguarded moving m/c parts fault is 72 pcs and it’s percentage is 83.72% and Fabric touching
the floor & other soiled places, during transportation in the trolleys 14 pcs and it’s percentage is
16.28%. And finally the total oil spot fault is 86 pcs.
Oil spot
c) Causes for Fly contamination:
Here the table of causes of fly contamination in grey fabric. Here we have shown total faults of fly
contamination and its causes report number wise and identify how much faults of any causes and its
percentage is given bellow.
Table 3.4.3: Causes of faults of fly contamination
Problem ( Total Fly Contamination = 217 )
“Comparative Study on Grey and Finished Fabric Inspection to Ensure Quality Garments”
Page | 26 ©Daffodil International University
Report No Mired one yarn to another yarn
1 41
2 57
3 29
4 40
5 50
Total 217
Faults (%) 100%
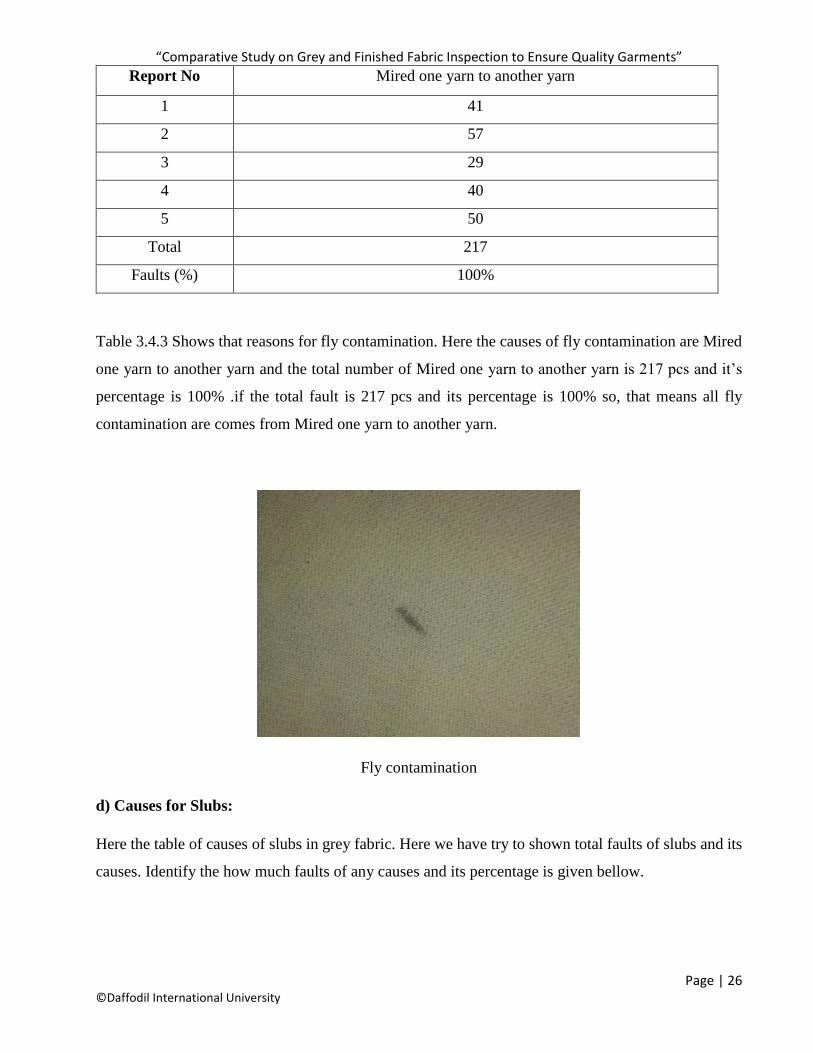
Table 3.4.3 Shows that reasons for fly contamination. Here the causes of fly contamination are Mired
one yarn to another yarn and the total number of Mired one yarn to another yarn is 217 pcs and it’s
percentage is 100% .if the total fault is 217 pcs and its percentage is 100% so, that means all fly
contamination are comes from Mired one yarn to another yarn.
Fly contamination
d) Causes for Slubs:
Here the table of causes of slubs in grey fabric. Here we have try to shown total faults of slubs and its
causes. Identify the how much faults of any causes and its percentage is given bellow.
“Comparative Study on Grey and Finished Fabric Inspection to Ensure Quality Garments”
Page | 27 ©Daffodil International University
Table 3.4.4: Causes of faults of slubs
Report No
Problem ( Total Slubs = 17 )
Causes by thick or heavy place in yarn or by line getting onto yarn feeds
1 7
2 3
3 3
4 0
5 4
Total 17
Faults (%) 100%
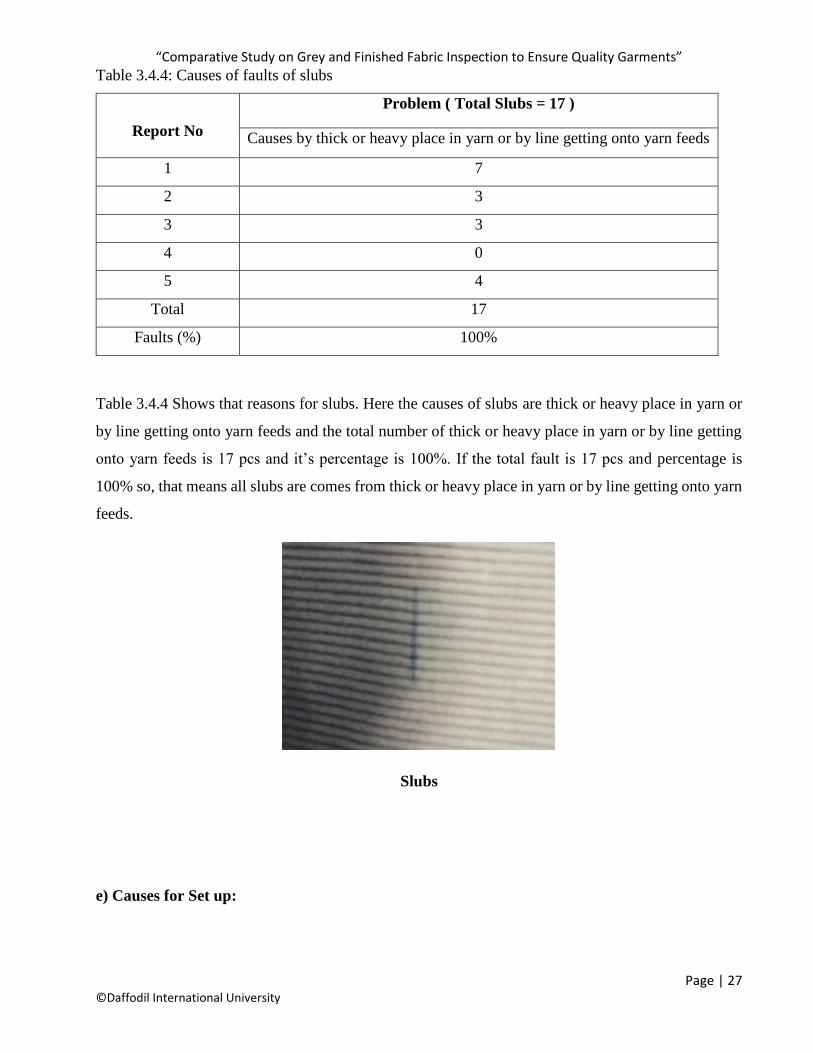
Table 3.4.4 Shows that reasons for slubs. Here the causes of slubs are thick or heavy place in yarn or
by line getting onto yarn feeds and the total number of thick or heavy place in yarn or by line getting
onto yarn feeds is 17 pcs and it’s percentage is 100%. If the total fault is 17 pcs and percentage is
100% so, that means all slubs are comes from thick or heavy place in yarn or by line getting onto yarn
feeds.
Slubs
e) Causes for Set up:
“Comparative Study on Grey and Finished Fabric Inspection to Ensure Quality Garments”
Page | 28 ©Daffodil International University
Here the table of causes of set up in grey fabric. Here we have try to shown total faults of set up. And
its different causes. Identify the how much faults of any causes and its percentage is given bellow.
Table 3.4.5: Causes of faults of set up
Report No
Problem ( Total Set up = 17 )
Yarn tension problem M/C setting problem
1 2 0
2 5 0
3 1 0
4 1 1
5 5 2
Total 14 3
Faults (%) 82.35% 17.65%
Table 3.4.5 Shows that reasons for set up. Here the causes of set up are two reason first one are yarn
tension problem and second one is machine setting problem. Then show the total yarn tension problem
is 14 pic and it’s percentage is 82.35% and machine setting problem is 3 pcs and it’s percentage is
17.65% and finally the total fault of set up is 17 pcs.
Set up
“Comparative Study on Grey and Finished Fabric Inspection to Ensure Quality Garments”
Page | 29 ©Daffodil International University
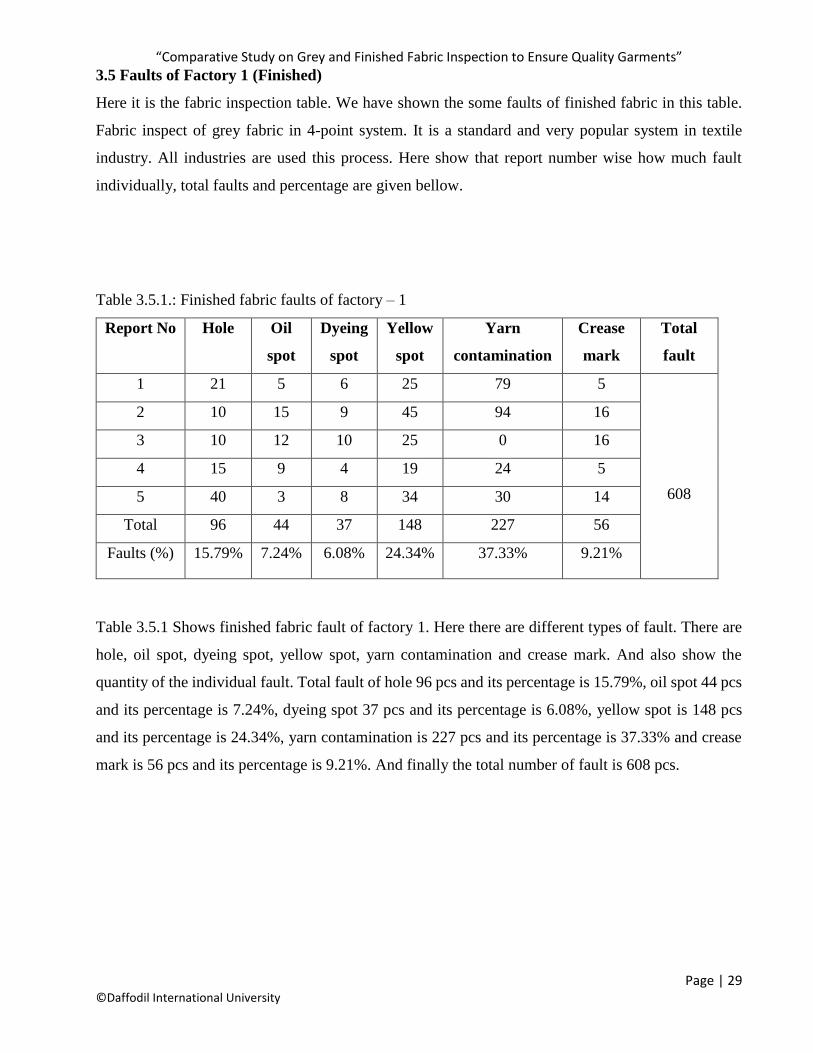
3.5 Faults of Factory 1 (Finished)
Here it is the fabric inspection table. We have shown the some faults of finished fabric in this table.
Fabric inspect of grey fabric in 4-point system. It is a standard and very popular system in textile
industry. All industries are used this process. Here show that report number wise how much fault
individually, total faults and percentage are given bellow.
Table 3.5.1.: Finished fabric faults of factory – 1
Report No Hole Oil
spot
Dyeing
spot
Yellow
spot
Yarn
contamination
Crease
mark
Total
fault
1 21 5 6 25 79 5
608
2 10 15 9 45 94 16
3 10 12 10 25 0 16
4 15 9 4 19 24 5
5 40 3 8 34 30 14
Total 96 44 37 148 227 56
Faults (%) 15.79% 7.24% 6.08% 24.34% 37.33% 9.21%
Table 3.5.1 Shows finished fabric fault of factory 1. Here there are different types of fault. There are
hole, oil spot, dyeing spot, yellow spot, yarn contamination and crease mark. And also show the
quantity of the individual fault. Total fault of hole 96 pcs and its percentage is 15.79%, oil spot 44 pcs
and its percentage is 7.24%, dyeing spot 37 pcs and its percentage is 6.08%, yellow spot is 148 pcs
and its percentage is 24.34%, yarn contamination is 227 pcs and its percentage is 37.33% and crease
mark is 56 pcs and its percentage is 9.21%. And finally the total number of fault is 608 pcs.
“Comparative Study on Grey and Finished Fabric Inspection to Ensure Quality Garments”
Page | 30 ©Daffodil International University
3.6 Causes of Faults of Factory 1 (Finished):
a) Causes for Hole:
Here the table of causes of hole in finished fabric. Here we have shown total hole and different causes
of hole. Individually identify how much faults are any causes and there percentage is given bellow.
Table 3.6.1: Causes of faults of hole
Report No
Problem ( Total Hole = 96 )
Knitting hole GSM hole Chemical hole
1 10 8 3
2 6 4 0
3 5 4 1
4 9 6 0
5 27 9 4
“Comparative Study on Grey and Finished Fabric Inspection to Ensure Quality Garments”
Page | 31 ©Daffodil International University
Total 57 31 8
Faults (%) 57.37% 32.29% 8.33%
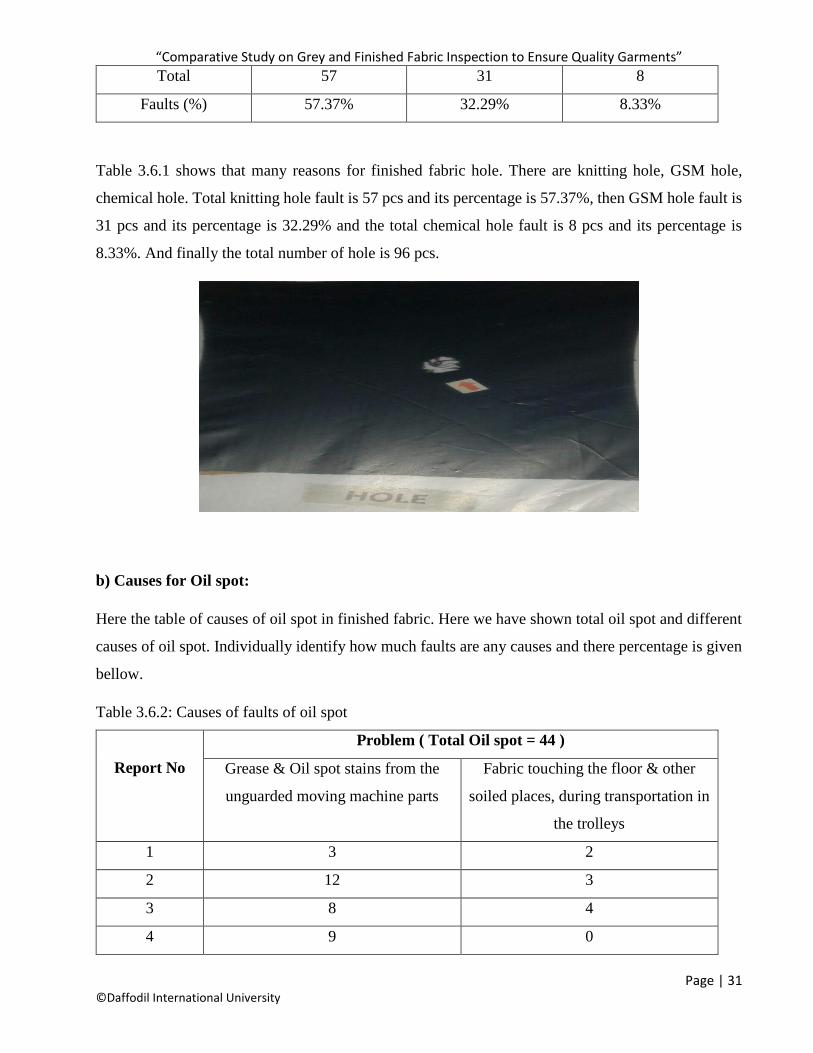
Table 3.6.1 shows that many reasons for finished fabric hole. There are knitting hole, GSM hole,
chemical hole. Total knitting hole fault is 57 pcs and its percentage is 57.37%, then GSM hole fault is
31 pcs and its percentage is 32.29% and the total chemical hole fault is 8 pcs and its percentage is
8.33%. And finally the total number of hole is 96 pcs.
b) Causes for Oil spot:
Here the table of causes of oil spot in finished fabric. Here we have shown total oil spot and different
causes of oil spot. Individually identify how much faults are any causes and there percentage is given
bellow.
Table 3.6.2: Causes of faults of oil spot
Report No
Problem ( Total Oil spot = 44 )
Grease & Oil spot stains from the
unguarded moving machine parts
Fabric touching the floor & other
soiled places, during transportation in
the trolleys
1 3 2
2 12 3
3 8 4
4 9 0
“Comparative Study on Grey and Finished Fabric Inspection to Ensure Quality Garments”
Page | 32 ©Daffodil International University
5 3 0
Total 35 9
Faults (%) 79.55% 20.45%
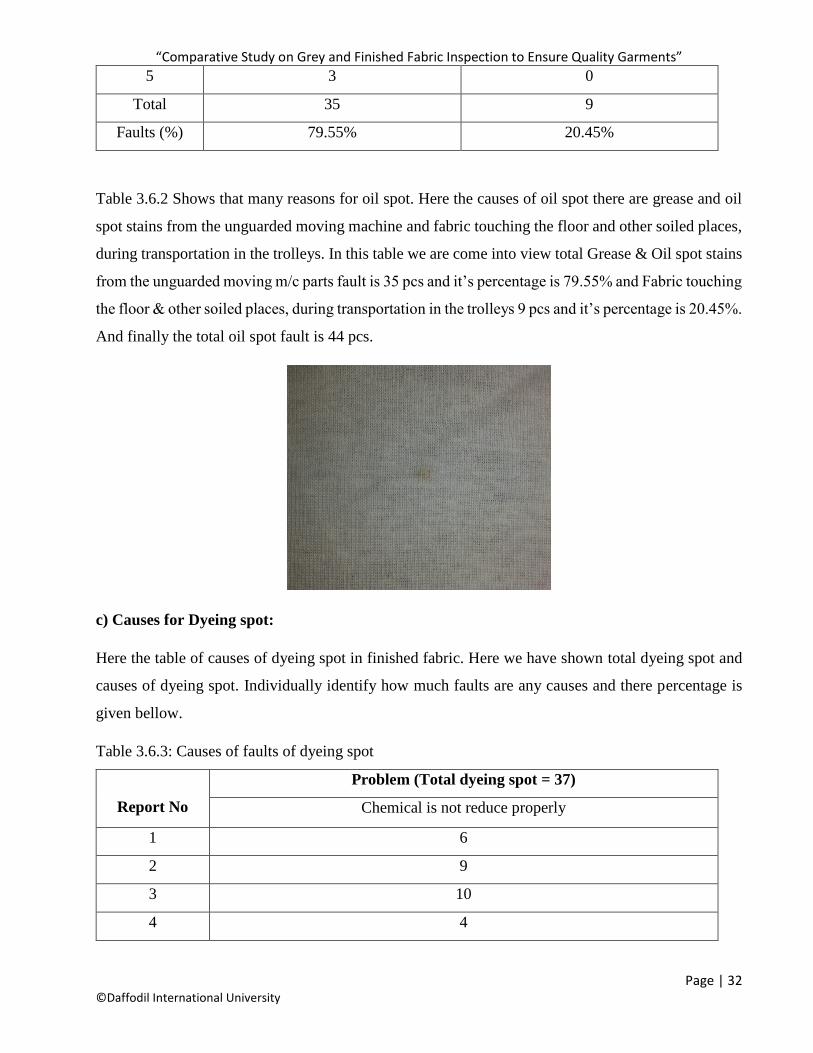
Table 3.6.2 Shows that many reasons for oil spot. Here the causes of oil spot there are grease and oil
spot stains from the unguarded moving machine and fabric touching the floor and other soiled places,
during transportation in the trolleys. In this table we are come into view total Grease & Oil spot stains
from the unguarded moving m/c parts fault is 35 pcs and it’s percentage is 79.55% and Fabric touching
the floor & other soiled places, during transportation in the trolleys 9 pcs and it’s percentage is 20.45%.
And finally the total oil spot fault is 44 pcs.
c) Causes for Dyeing spot:
Here the table of causes of dyeing spot in finished fabric. Here we have shown total dyeing spot and
causes of dyeing spot. Individually identify how much faults are any causes and there percentage is
given bellow.
Table 3.6.3: Causes of faults of dyeing spot
Report No
Problem (Total dyeing spot = 37)
Chemical is not reduce properly
1 6
2 9
3 10
4 4
“Comparative Study on Grey and Finished Fabric Inspection to Ensure Quality Garments”
Page | 33 ©Daffodil International University
5 8
Total 37
Faults (%) 100%
Table 3.6.3 Shows that reasons for dyeing spot. Here the causes of dyeing spot are Chemical is not
reduce properly and the total number of Chemical is not reduce properly is 37 pcs and it’s percentage
is 100% .if the total fault is 37 pcs and its percentage is 100% so, that means all dyeing spot are comes
from Chemical is not reduce properly.
d) Causes for Yellow spot:
Here the table of causes of yellow spot in finished fabric. Here we have try to shown the total yellow
spot and different causes of yellow spot. Individually identify how much faults are any causes and
there percentage is given bellow.
Table 3.6.4: Causes of faults of yellow spot
Report No
Problem (Total yellow spot = 148)
Many packing materials contain BHT
and anti - oxidant that causes
phenolic yellowing when it reacts
with not gasses in the air
Nitrous oxide is causes for phenolic
yellowing in fabric
1 17 8
2 35 10
3 10 15
4 12 7
5 23 11
Total 97 51
Faults (%) 65.54% 34.46%
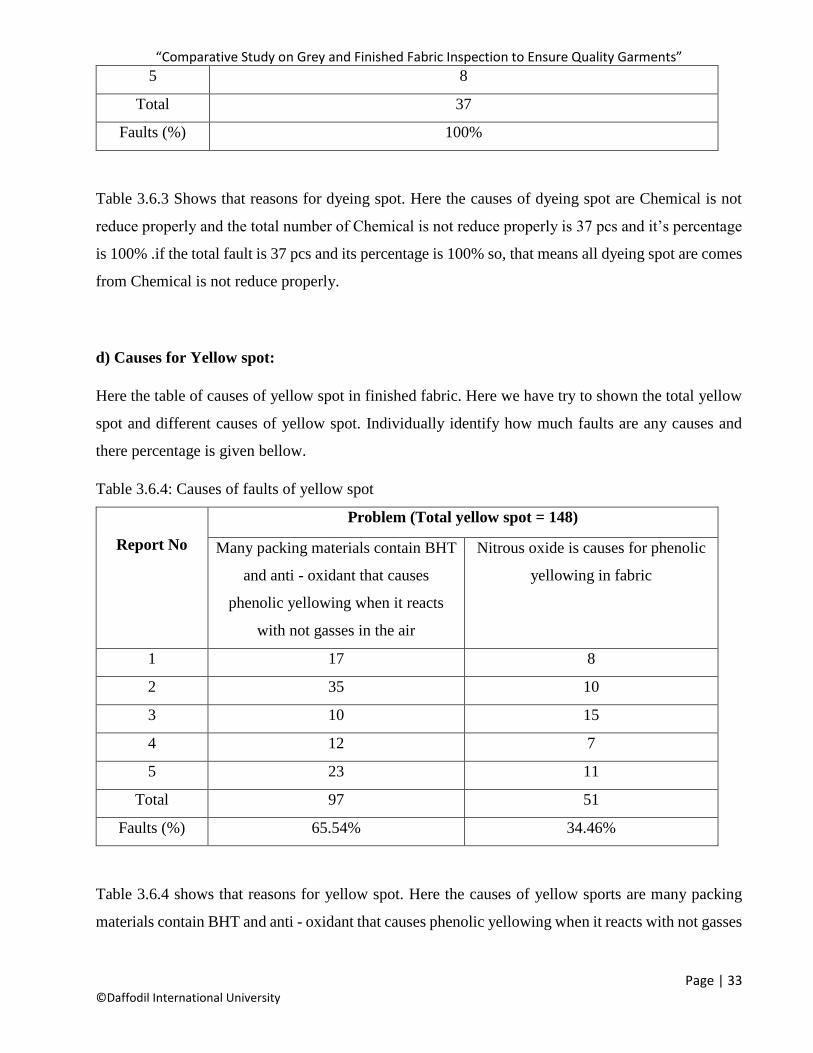
Table 3.6.4 shows that reasons for yellow spot. Here the causes of yellow sports are many packing
materials contain BHT and anti - oxidant that causes phenolic yellowing when it reacts with not gasses
“Comparative Study on Grey and Finished Fabric Inspection to Ensure Quality Garments”
Page | 34 ©Daffodil International University
in the air and Nitrous oxide is causes for phenolic yellowing in fabric. The total number of many
packing materials contain BHT and anti - oxidant that causes phenolic yellowing when it reacts with
not gasses in the air is 97pcs and its percentage is 65.54% and Nitrous oxide is causes for phenolic
yellowing in fabric is 51 pcs and its percentage is 34.46%. And finally the total number of yellow spot
is 148 pcs.
e) Causes for Yarn contamination:
Here the table of causes of yarn contamination in finished fabric. Here we have shown total yarn
contamination and causes of yarn contamination. Individually identify how much faults are any causes
and there percentage is given bellow.
Table 3.6.5: Causes of faults of yarn contamination
Report No
Problem (Total yarn contamination = 227)
Mired one yarn to another yarn
1 79
2 94
3 0
4 25
5 30
Total 227
Faults (%) 100%
“Comparative Study on Grey and Finished Fabric Inspection to Ensure Quality Garments”
Page | 35 ©Daffodil International University
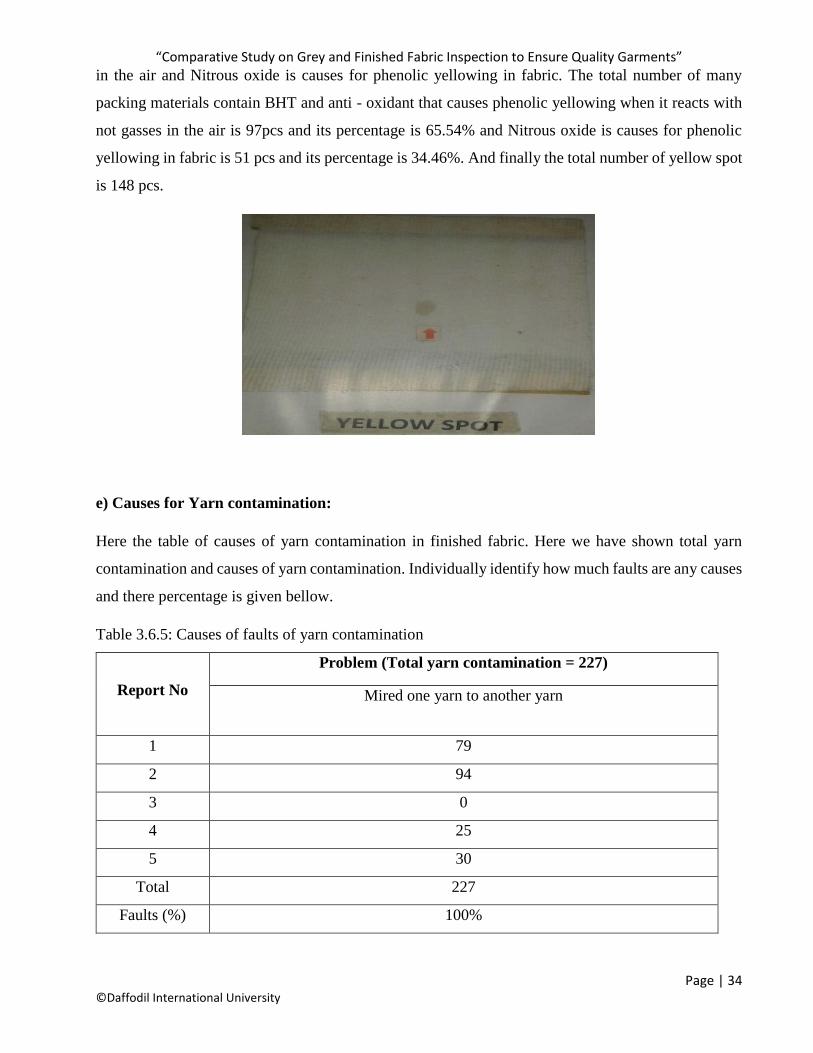
Table 3.6.5 shows that reasons for yarn contamination. Here the causes of yarn contamination are
Mired one yarn to another yarn is 227 pcs and it’s percentage is 100% .if the total fault is 227 pcs and
its percentage is 100% so, that means all yarn contamination are comes from Mired one yarn to another
yarn.
f) Causes for Crease mark:
Here the table of causes of crease mark in finished fabric. Here we have shown total crease mark and
causes of crease mark. Individually identify how much faults are any causes and there percentage is
given bellow.
Table 3.6.6: Causes of faults of crease mark
Report No
Problem (Total crease mark = 56)
When the fabric is pass from the roller some time the fabric is folded and the
pressure of roller then create crease mark.
1 5
2 16
3 16
4 5
5 14
Total 56
Faults (%) 100%
“Comparative Study on Grey and Finished Fabric Inspection to Ensure Quality Garments”
Page | 36 ©Daffodil International University
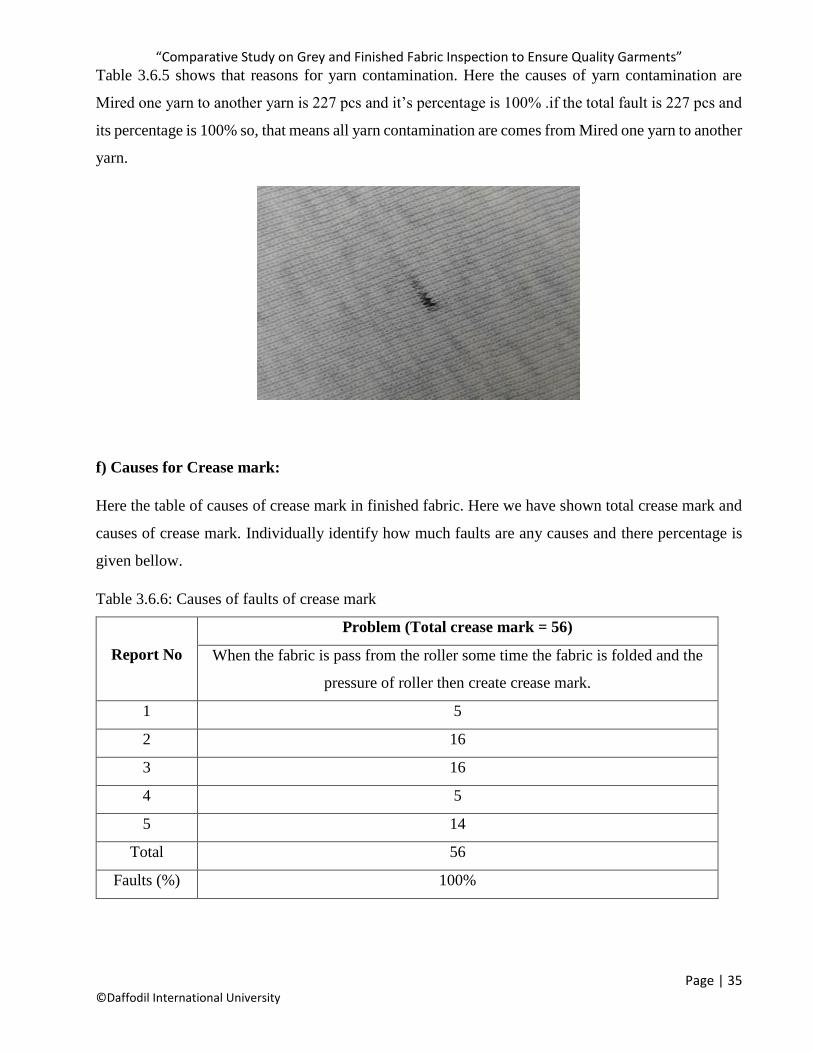
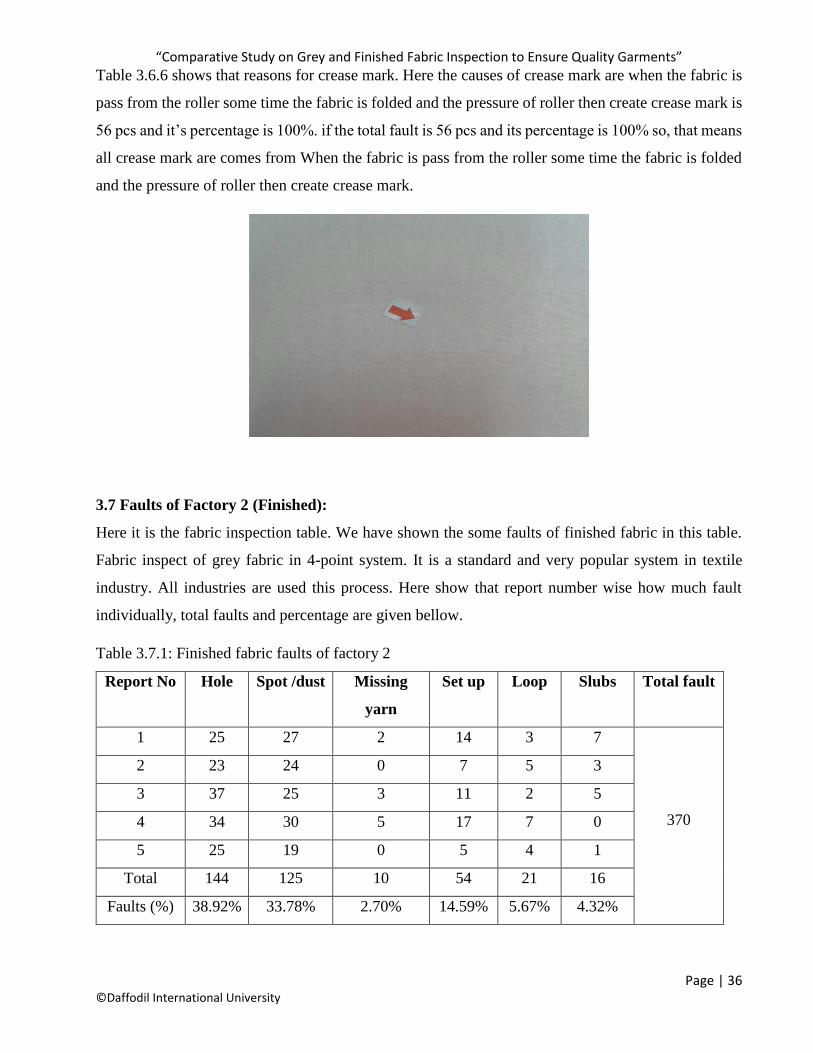
Table 3.6.6 shows that reasons for crease mark. Here the causes of crease mark are when the fabric is
pass from the roller some time the fabric is folded and the pressure of roller then create crease mark is
56 pcs and it’s percentage is 100%. if the total fault is 56 pcs and its percentage is 100% so, that means
all crease mark are comes from When the fabric is pass from the roller some time the fabric is folded
and the pressure of roller then create crease mark.
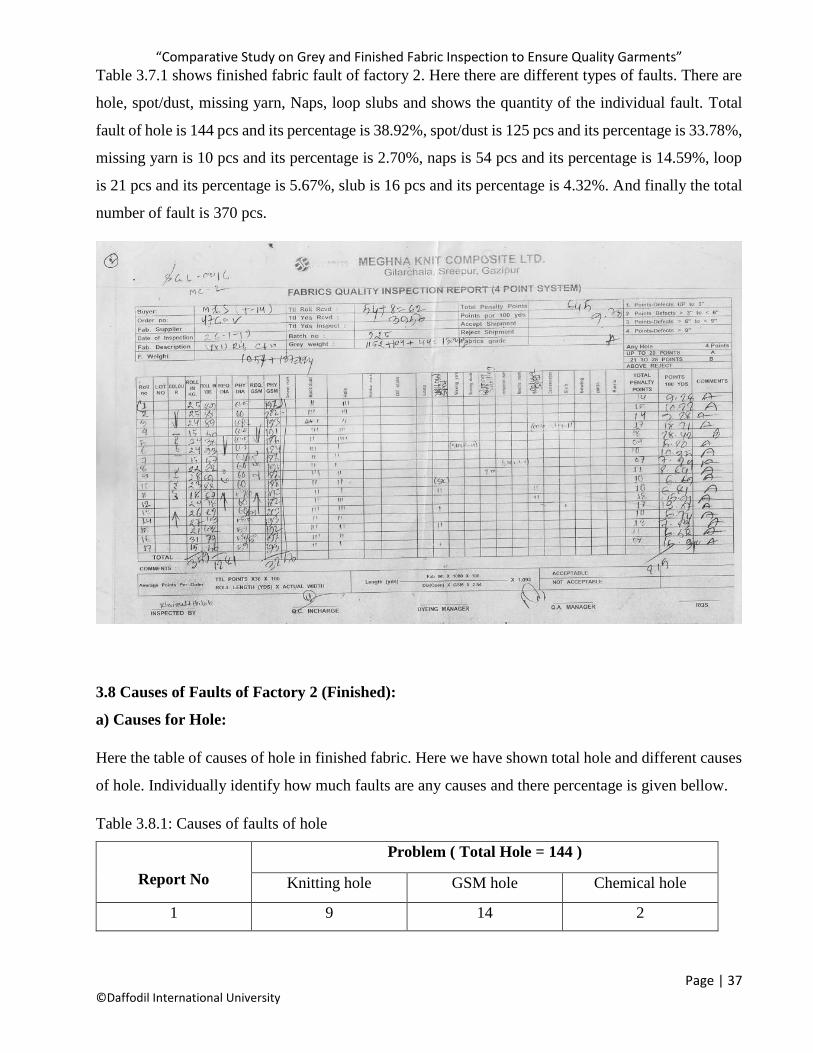
3.7 Faults of Factory 2 (Finished):
Here it is the fabric inspection table. We have shown the some faults of finished fabric in this table.
Fabric inspect of grey fabric in 4-point system. It is a standard and very popular system in textile
industry. All industries are used this process. Here show that report number wise how much fault
individually, total faults and percentage are given bellow.
Table 3.7.1: Finished fabric faults of factory 2
Report No Hole Spot /dust Missing
yarn
Set up Loop Slubs Total fault
1 25 27 2 14 3 7
370
2 23 24 0 7 5 3
3 37 25 3 11 2 5
4 34 30 5 17 7 0
5 25 19 0 5 4 1
Total 144 125 10 54 21 16
Faults (%) 38.92% 33.78% 2.70% 14.59% 5.67% 4.32%
“Comparative Study on Grey and Finished Fabric Inspection to Ensure Quality Garments”
Page | 37 ©Daffodil International University
Table 3.7.1 shows finished fabric fault of factory 2. Here there are different types of faults. There are
hole, spot/dust, missing yarn, Naps, loop slubs and shows the quantity of the individual fault. Total
fault of hole is 144 pcs and its percentage is 38.92%, spot/dust is 125 pcs and its percentage is 33.78%,
missing yarn is 10 pcs and its percentage is 2.70%, naps is 54 pcs and its percentage is 14.59%, loop
is 21 pcs and its percentage is 5.67%, slub is 16 pcs and its percentage is 4.32%. And finally the total
number of fault is 370 pcs.
3.8 Causes of Faults of Factory 2 (Finished):
a) Causes for Hole:
Here the table of causes of hole in finished fabric. Here we have shown total hole and different causes
of hole. Individually identify how much faults are any causes and there percentage is given bellow.
Table 3.8.1: Causes of faults of hole
Report No
Problem ( Total Hole = 144 )
Knitting hole GSM hole Chemical hole
1 9 14 2
“Comparative Study on Grey and Finished Fabric Inspection to Ensure Quality Garments”
Page | 38 ©Daffodil International University
2 16 7 0
3 18 17 2
4 17 16 1
5 11 9 5
Total 71 63 10
Faults (%) 49.31% 43.75% 6.94%
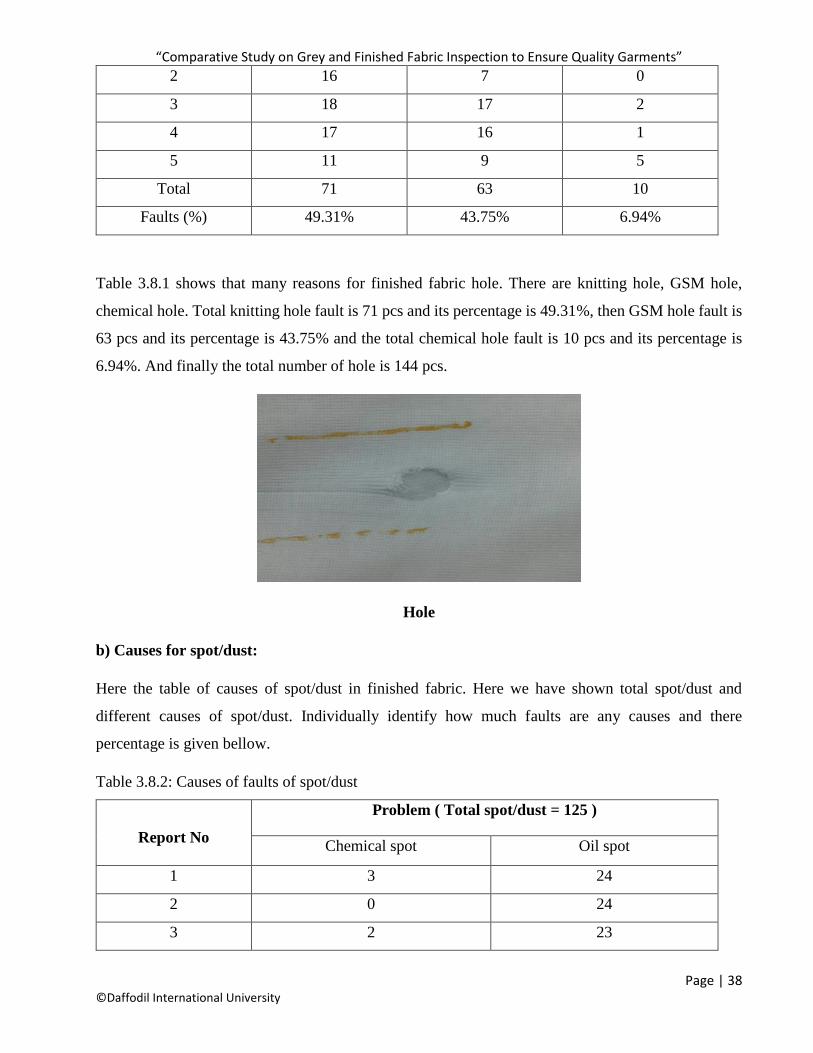
Table 3.8.1 shows that many reasons for finished fabric hole. There are knitting hole, GSM hole,
chemical hole. Total knitting hole fault is 71 pcs and its percentage is 49.31%, then GSM hole fault is
63 pcs and its percentage is 43.75% and the total chemical hole fault is 10 pcs and its percentage is
6.94%. And finally the total number of hole is 144 pcs.
Hole
b) Causes for spot/dust:
Here the table of causes of spot/dust in finished fabric. Here we have shown total spot/dust and
different causes of spot/dust. Individually identify how much faults are any causes and there
percentage is given bellow.
Table 3.8.2: Causes of faults of spot/dust
Report No
Problem ( Total spot/dust = 125 )
Chemical spot Oil spot
1 3 24
2 0 24
3 2 23
“Comparative Study on Grey and Finished Fabric Inspection to Ensure Quality Garments”
Page | 39 ©Daffodil International University
4 0 30
5 5 14
Total 10 115
Faults (%) 8% 92%
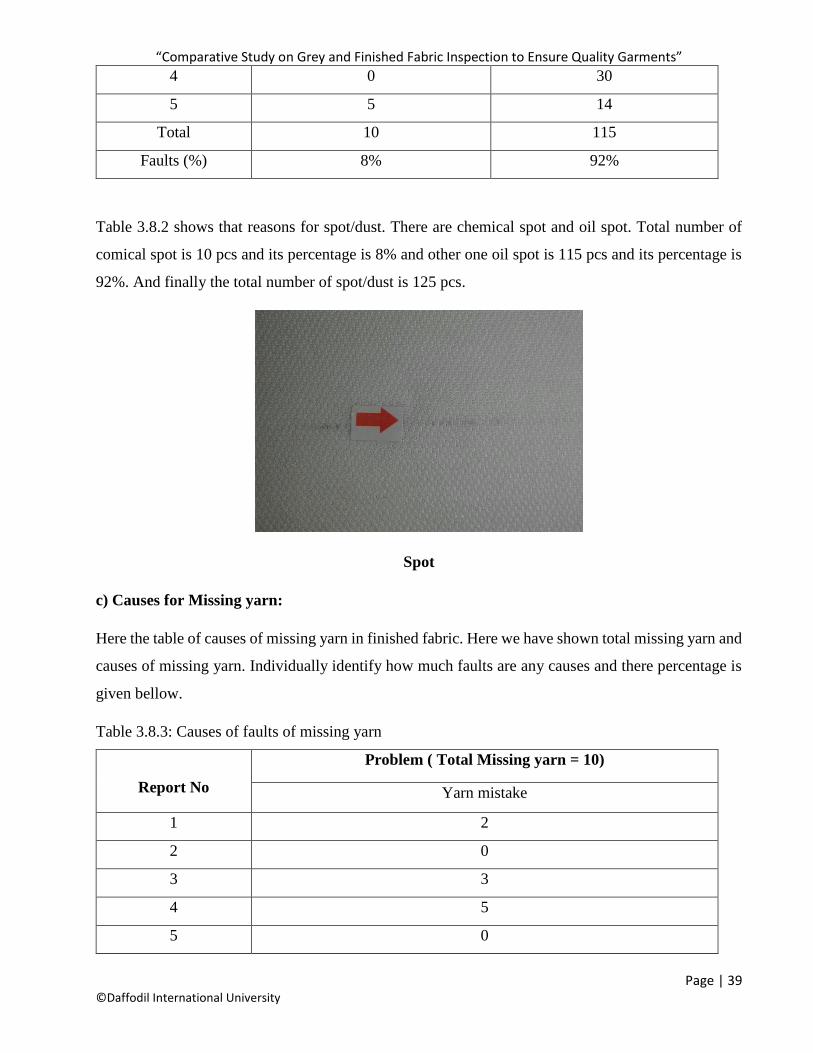
Table 3.8.2 shows that reasons for spot/dust. There are chemical spot and oil spot. Total number of
comical spot is 10 pcs and its percentage is 8% and other one oil spot is 115 pcs and its percentage is
92%. And finally the total number of spot/dust is 125 pcs.
Spot
c) Causes for Missing yarn:
Here the table of causes of missing yarn in finished fabric. Here we have shown total missing yarn and
causes of missing yarn. Individually identify how much faults are any causes and there percentage is
given bellow.
Table 3.8.3: Causes of faults of missing yarn
Report No
Problem ( Total Missing yarn = 10)
Yarn mistake
1 2
2 0
3 3
4 5
5 0
“Comparative Study on Grey and Finished Fabric Inspection to Ensure Quality Garments”
Page | 40 ©Daffodil International University
Total 10
Faults (%) 100%
Table 3.8.3 shows that reasons for missing yarn. Here the causes of missing yarn are Yarn mistake
and the total number of Yarn mistake is 10 pcs and it’s percentage is 100%. If the total fault is 10 pcs
and its percentage is 100% so, that means all Missing yarn are comes from Yarn mistake.
d) Causes for set up:
Here the table of causes of set up in finished fabric. Here we have shown total set up and different
causes of set up. Individually identify how much faults are any causes and there percentage is given
bellow.
Table 3.8.4: Causes of faults of set up
Report No Problem ( Total set up = 54)
Yarn tension Machine tension
1 9 5
2 7 0
3 8 3
4 12 5
5 2 3
Total 38 16
Faults (%) 70.37% 29.63%
Table 3.8.4 shows that reasons for set up. Here the causes of set up are two reason first one are yarn
tension and second one is machine setting. Then show the total yarn tension problem is 38 pic and it’s
percentage is 70.37% and machine setting problem is 16 pcs and it’s percentage is 29.63% and finally
the total fault of set up is 54 pcs.
“Comparative Study on Grey and Finished Fabric Inspection to Ensure Quality Garments”
Page | 41 ©Daffodil International University
Set up
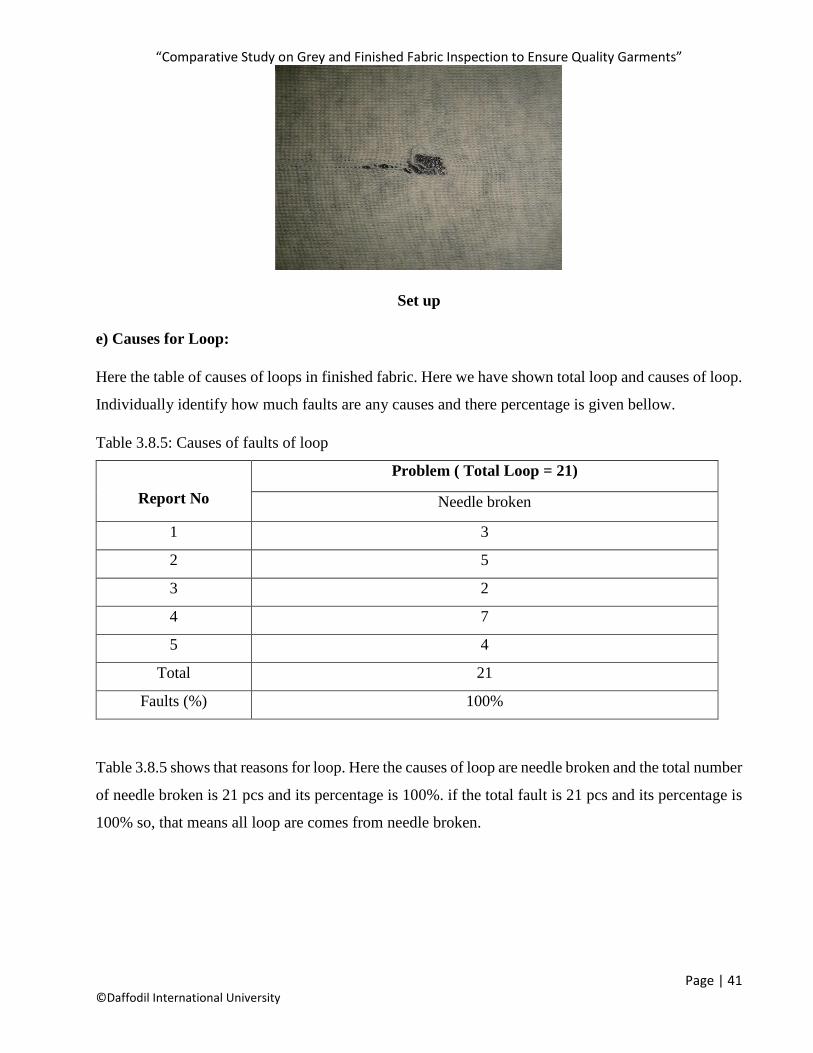
e) Causes for Loop:
Here the table of causes of loops in finished fabric. Here we have shown total loop and causes of loop.
Individually identify how much faults are any causes and there percentage is given bellow.
Table 3.8.5: Causes of faults of loop
Report No
Problem ( Total Loop = 21)
Needle broken
1 3
2 5
3 2
4 7
5 4
Total 21
Faults (%) 100%
Table 3.8.5 shows that reasons for loop. Here the causes of loop are needle broken and the total number
of needle broken is 21 pcs and its percentage is 100%. if the total fault is 21 pcs and its percentage is
100% so, that means all loop are comes from needle broken.
“Comparative Study on Grey and Finished Fabric Inspection to Ensure Quality Garments”
Page | 42 ©Daffodil International University
Loop
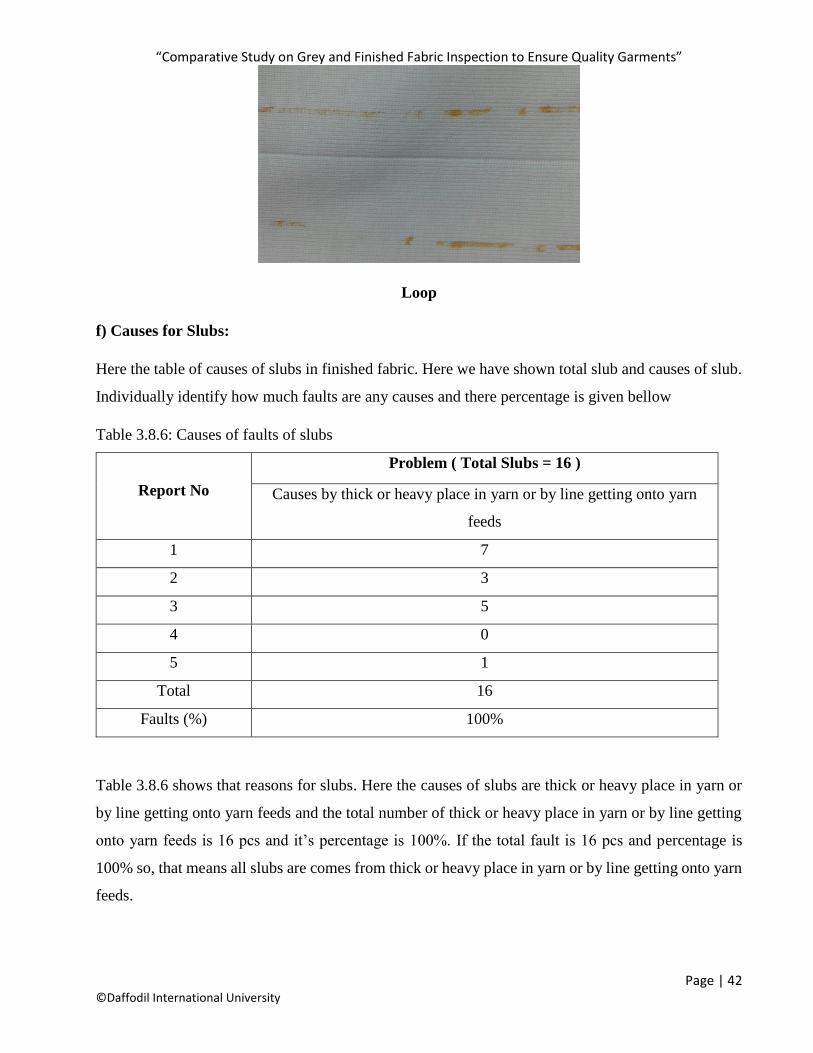
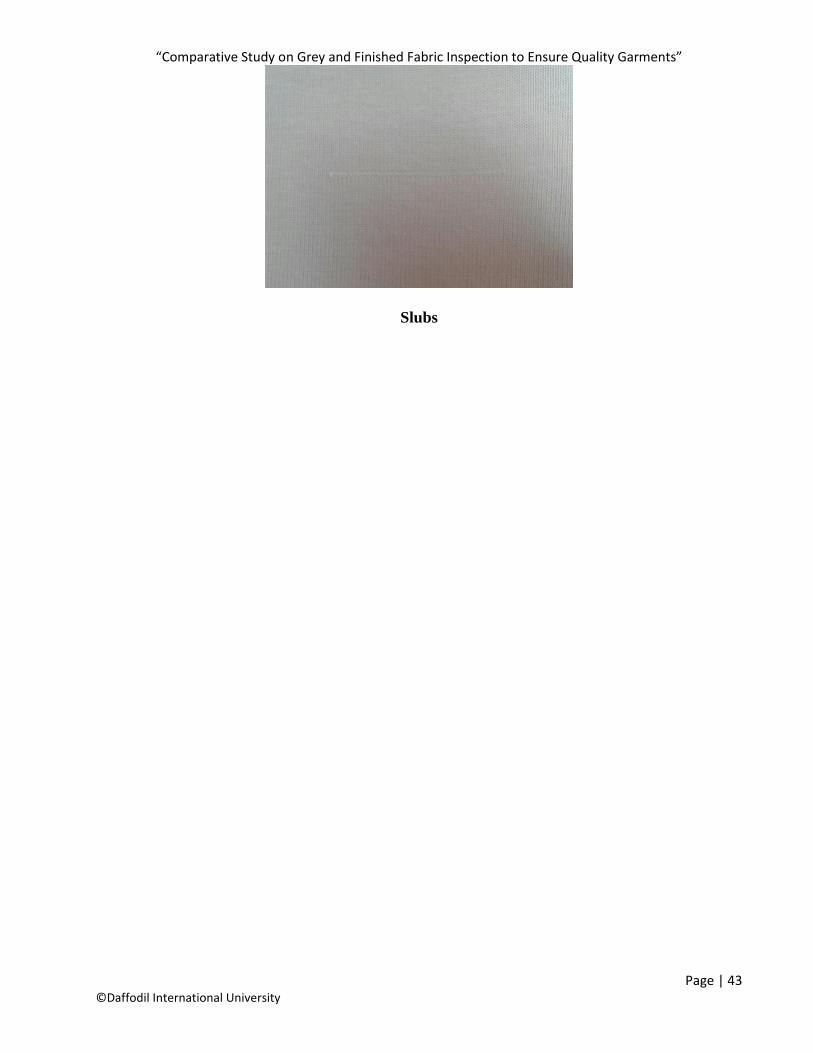
f) Causes for Slubs:
Here the table of causes of slubs in finished fabric. Here we have shown total slub and causes of slub.
Individually identify how much faults are any causes and there percentage is given bellow
Table 3.8.6: Causes of faults of slubs
Report No
Problem ( Total Slubs = 16 )
Causes by thick or heavy place in yarn or by line getting onto yarn
feeds
1 7
2 3
3 5
4 0
5 1
Total 16
Faults (%) 100%
Table 3.8.6 shows that reasons for slubs. Here the causes of slubs are thick or heavy place in yarn or
by line getting onto yarn feeds and the total number of thick or heavy place in yarn or by line getting
onto yarn feeds is 16 pcs and it’s percentage is 100%. If the total fault is 16 pcs and percentage is
100% so, that means all slubs are comes from thick or heavy place in yarn or by line getting onto yarn
feeds.
“Comparative Study on Grey and Finished Fabric Inspection to Ensure Quality Garments”
Page | 43 ©Daffodil International University
Slubs
“Comparative Study on Grey and Finished Fabric Inspection to Ensure Quality Garments”
Page | 44 ©Daffodil International University
Chapter – 4
Result and discussion
“Comparative Study on Grey and Finished Fabric Inspection to Ensure Quality Garments”
Page | 45 ©Daffodil International University
4.1 Comparison of grey fabric fault
4.1.1 Comparison factory 1 and factory 2
This is the faults comparison table of grey fabric in factory-1 and factory-2. We have taking five
inspection reports and then identify the faults of grey fabric. Here we have taking both factory
inspection report and then make this table. This table we have shows that different types of faults in
both factory and doing there comparison is given bellow.
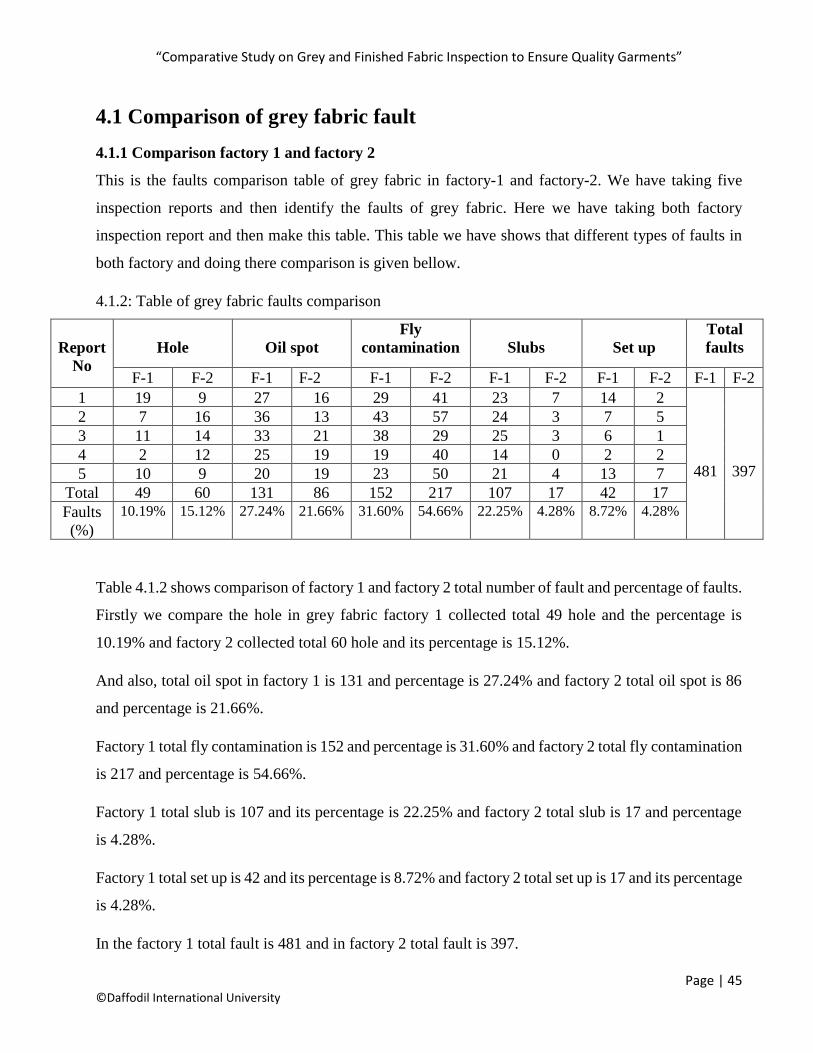
4.1.2: Table of grey fabric faults comparison
Report
No
Hole
Oil spot
Fly
contamination
Slubs
Set up
Total
faults
F-1 F-2 F-1 F-2 F-1 F-2 F-1 F-2 F-1 F-2 F-1 F-2
1 19 9 27 16 29 41 23 7 14 2
481
397
2 7 16 36 13 43 57 24 3 7 5
3 11 14 33 21 38 29 25 3 6 1
4 2 12 25 19 19 40 14 0 2 2
5 10 9 20 19 23 50 21 4 13 7
Total 49 60 131 86 152 217 107 17 42 17
Faults
(%)
10.19% 15.12% 27.24% 21.66% 31.60% 54.66% 22.25% 4.28% 8.72% 4.28%
Table 4.1.2 shows comparison of factory 1 and factory 2 total number of fault and percentage of faults.
Firstly we compare the hole in grey fabric factory 1 collected total 49 hole and the percentage is
10.19% and factory 2 collected total 60 hole and its percentage is 15.12%.
And also, total oil spot in factory 1 is 131 and percentage is 27.24% and factory 2 total oil spot is 86
and percentage is 21.66%.
Factory 1 total fly contamination is 152 and percentage is 31.60% and factory 2 total fly contamination
is 217 and percentage is 54.66%.
Factory 1 total slub is 107 and its percentage is 22.25% and factory 2 total slub is 17 and percentage
is 4.28%.
Factory 1 total set up is 42 and its percentage is 8.72% and factory 2 total set up is 17 and its percentage
is 4.28%.
In the factory 1 total fault is 481 and in factory 2 total fault is 397.
“Comparative Study on Grey and Finished Fabric Inspection to Ensure Quality Garments”
Page | 46 ©Daffodil International University
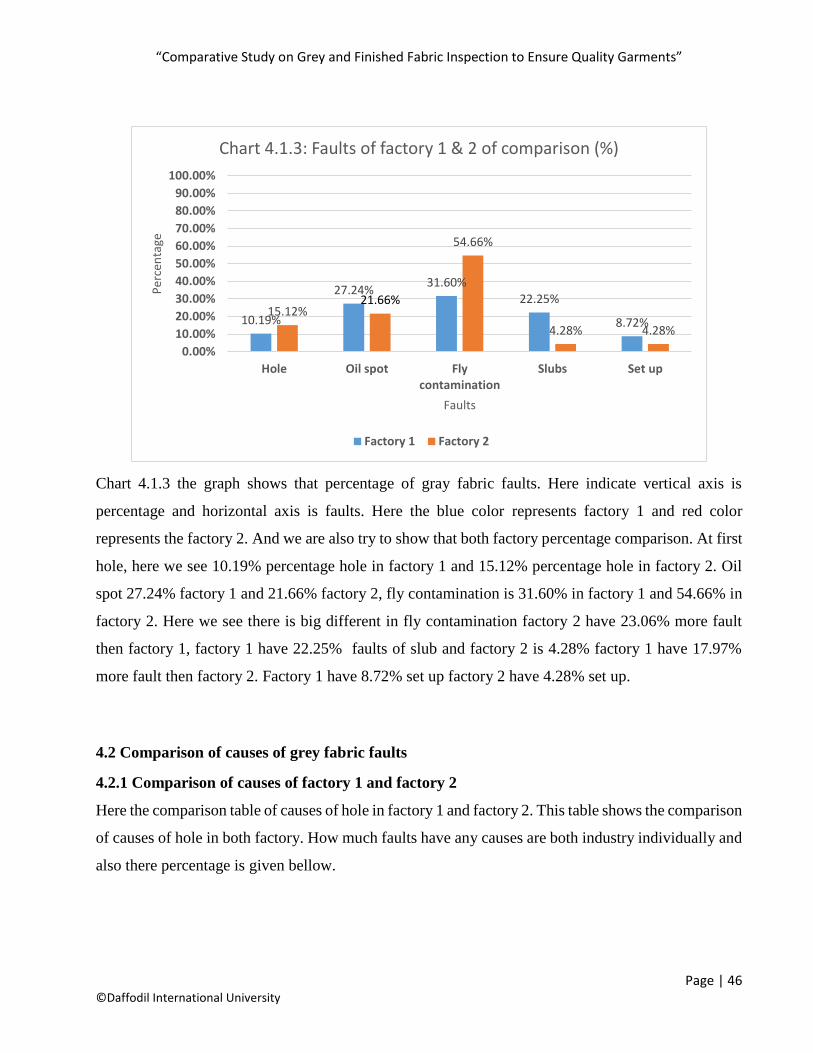
Chart 4.1.3 the graph shows that percentage of gray fabric faults. Here indicate vertical axis is
percentage and horizontal axis is faults. Here the blue color represents factory 1 and red color
represents the factory 2. And we are also try to show that both factory percentage comparison. At first
hole, here we see 10.19% percentage hole in factory 1 and 15.12% percentage hole in factory 2. Oil
spot 27.24% factory 1 and 21.66% factory 2, fly contamination is 31.60% in factory 1 and 54.66% in
factory 2. Here we see there is big different in fly contamination factory 2 have 23.06% more fault
then factory 1, factory 1 have 22.25% faults of slub and factory 2 is 4.28% factory 1 have 17.97%
more fault then factory 2. Factory 1 have 8.72% set up factory 2 have 4.28% set up.
4.2 Comparison of causes of grey fabric faults
4.2.1 Comparison of causes of factory 1 and factory 2
Here the comparison table of causes of hole in factory 1 and factory 2. This table shows the comparison
of causes of hole in both factory. How much faults have any causes are both industry individually and
also there percentage is given bellow.
10.19%
27.24%31.60%
22.25%
8.72%15.12%
21.66%
54.66%
4.28% 4.28%
0.00%
10.00%
20.00%
30.00%
40.00%
50.00%
60.00%
70.00%
80.00%
90.00%
100.00%
Hole Oil spot Flycontamination
Slubs Set up
Per
cen
tage
Faults
Chart 4.1.3: Faults of factory 1 & 2 of comparison (%)
Factory 1 Factory 2
“Comparative Study on Grey and Finished Fabric Inspection to Ensure Quality Garments”
Page | 47 ©Daffodil International University
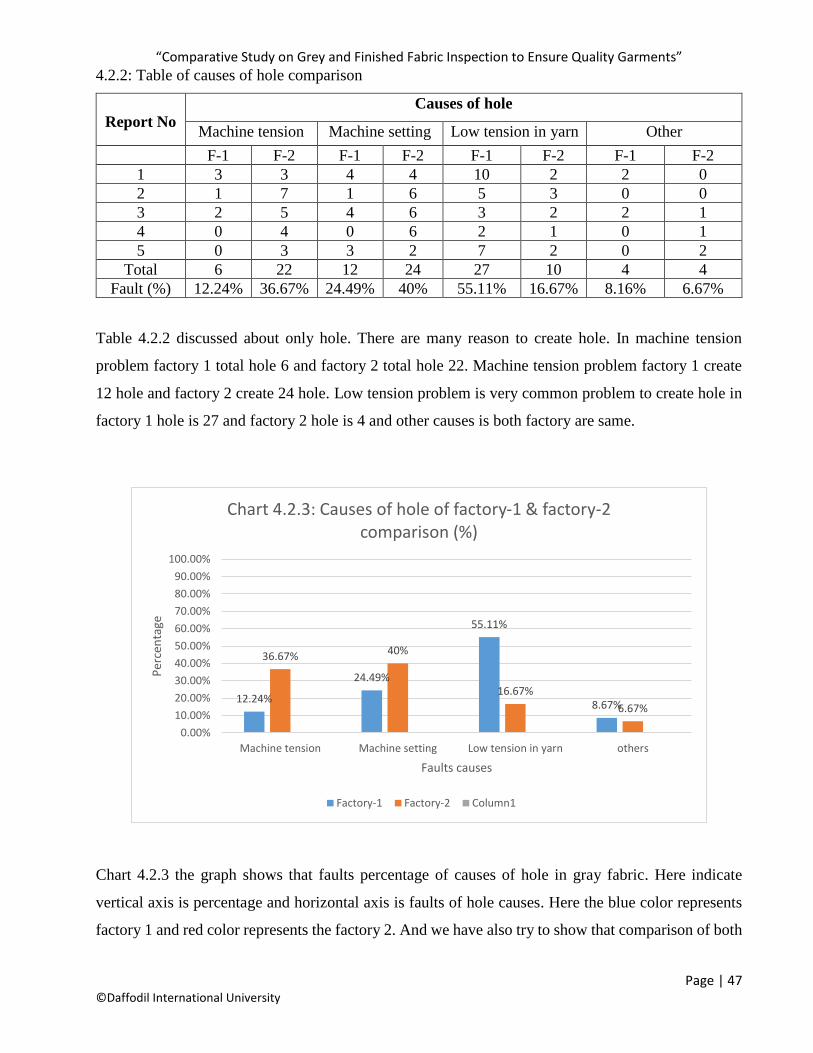
4.2.2: Table of causes of hole comparison
Report No
Causes of hole
Machine tension Machine setting Low tension in yarn Other
F-1 F-2 F-1 F-2 F-1 F-2 F-1 F-2
1 3 3 4 4 10 2 2 0
2 1 7 1 6 5 3 0 0
3 2 5 4 6 3 2 2 1
4 0 4 0 6 2 1 0 1
5 0 3 3 2 7 2 0 2
Total 6 22 12 24 27 10 4 4
Fault (%) 12.24% 36.67% 24.49% 40% 55.11% 16.67% 8.16% 6.67%
Table 4.2.2 discussed about only hole. There are many reason to create hole. In machine tension
problem factory 1 total hole 6 and factory 2 total hole 22. Machine tension problem factory 1 create
12 hole and factory 2 create 24 hole. Low tension problem is very common problem to create hole in
factory 1 hole is 27 and factory 2 hole is 4 and other causes is both factory are same.
Chart 4.2.3 the graph shows that faults percentage of causes of hole in gray fabric. Here indicate
vertical axis is percentage and horizontal axis is faults of hole causes. Here the blue color represents
factory 1 and red color represents the factory 2. And we have also try to show that comparison of both
12.24%
24.49%
55.11%
8.67%
36.67% 40%
16.67%
6.67%
0.00%
10.00%
20.00%
30.00%
40.00%
50.00%
60.00%
70.00%
80.00%
90.00%
100.00%
Machine tension Machine setting Low tension in yarn others
Per
cen
tage
Faults causes
Chart 4.2.3: Causes of hole of factory-1 & factory-2 comparison (%)
Factory-1 Factory-2 Column1
“Comparative Study on Grey and Finished Fabric Inspection to Ensure Quality Garments”
Page | 48 ©Daffodil International University
factory hole causes percentage. Firstly machine tension we see there is big different in machine tension
factory 2 have more fault then factory 1. Factory 1 machine tension faults is 12.24% and factory 2 is
36.67%. Then machine setting problem factory 1 is 24.49% and factory 2 have 40%, we are seeing
another big different in low tension in yarn factory 1 is 55.11% and factory 2 is 16.67%.
4.2.4: Table of causes of oil spot comparison
Here the comparison table of causes of oil spot in factory-1 and factory-2. This table shows the
comparison of causes of oil spot in both factory. How much faults of any causes are both industry
individually and also there percentage is given bellow.
Report No
Causes of oil spots
Grease & Oil spot stains from the
unguarded moving machine parts
Fabric touching the floor & other soiled
places, during transportation in the
trolleys
F-1 F-2 F-1 F-2
1 18 9 9 7
2 28 7 8 4
3 25 20 8 1
4 15 17 0 2
5 17 19 3 0
Total 103 72 28 14
Fault (%) 78.63% 83.72% 21.37% 16.28%
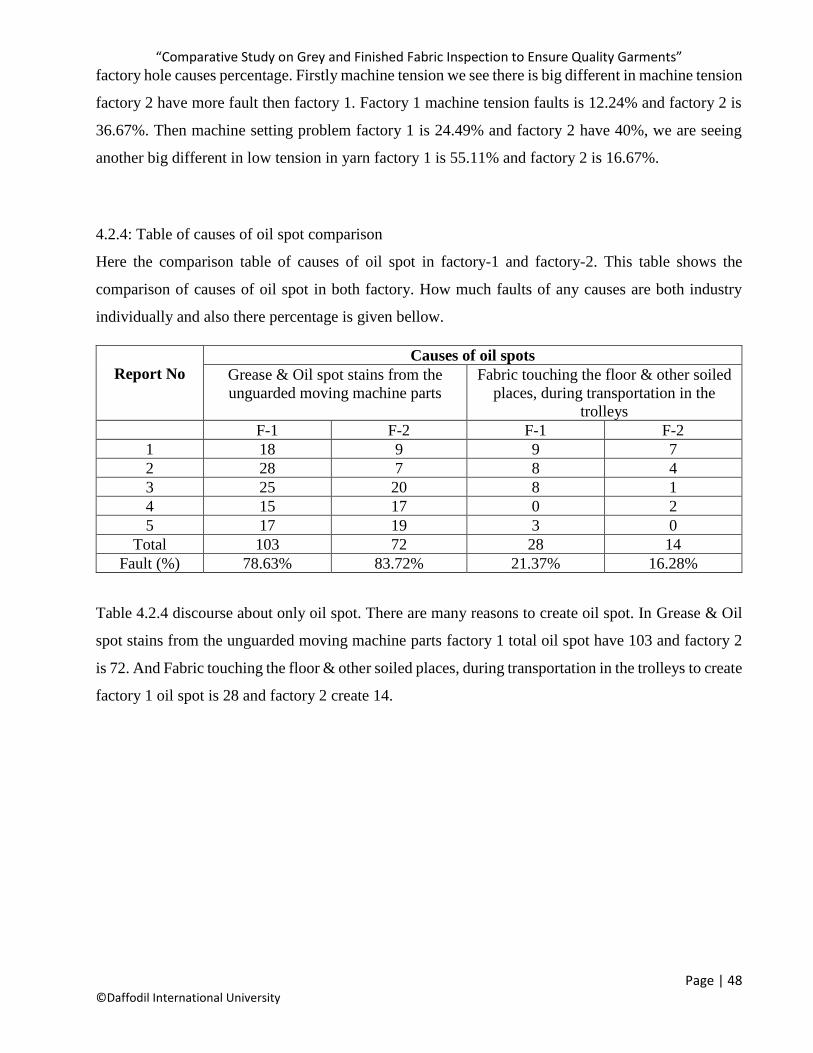
Table 4.2.4 discourse about only oil spot. There are many reasons to create oil spot. In Grease & Oil
spot stains from the unguarded moving machine parts factory 1 total oil spot have 103 and factory 2
is 72. And Fabric touching the floor & other soiled places, during transportation in the trolleys to create
factory 1 oil spot is 28 and factory 2 create 14.
“Comparative Study on Grey and Finished Fabric Inspection to Ensure Quality Garments”
Page | 49 ©Daffodil International University
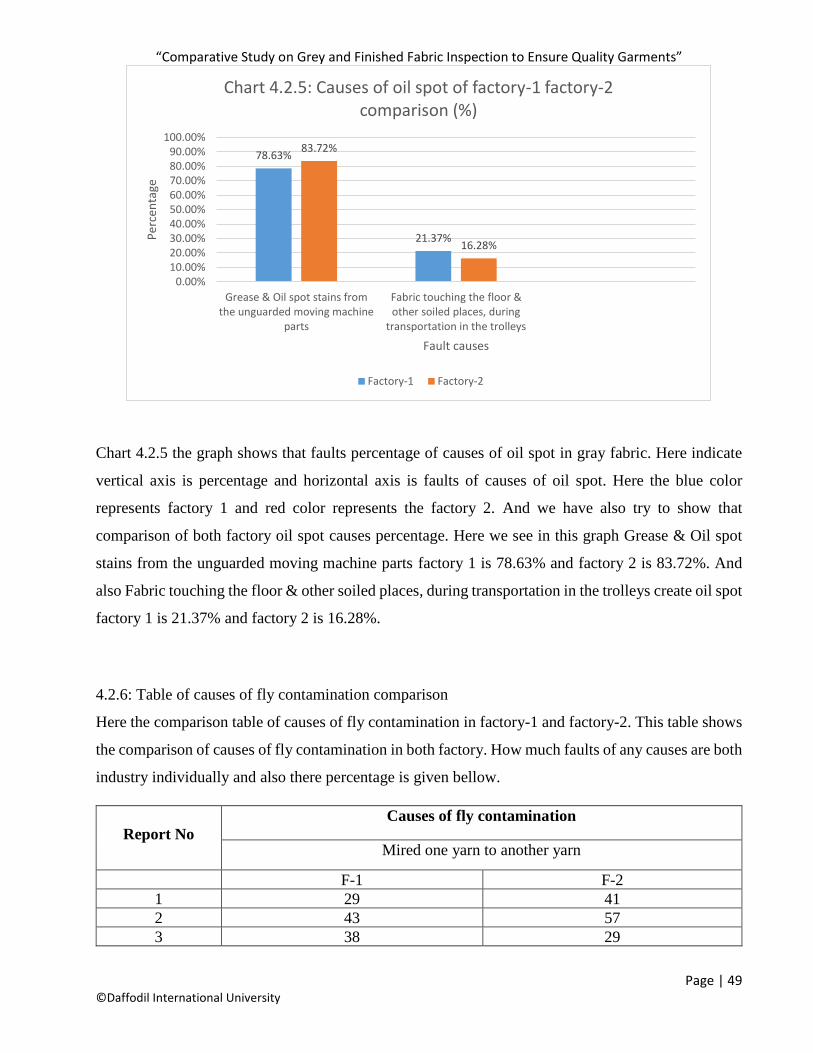
Chart 4.2.5 the graph shows that faults percentage of causes of oil spot in gray fabric. Here indicate
vertical axis is percentage and horizontal axis is faults of causes of oil spot. Here the blue color
represents factory 1 and red color represents the factory 2. And we have also try to show that
comparison of both factory oil spot causes percentage. Here we see in this graph Grease & Oil spot
stains from the unguarded moving machine parts factory 1 is 78.63% and factory 2 is 83.72%. And
also Fabric touching the floor & other soiled places, during transportation in the trolleys create oil spot
factory 1 is 21.37% and factory 2 is 16.28%.
4.2.6: Table of causes of fly contamination comparison
Here the comparison table of causes of fly contamination in factory-1 and factory-2. This table shows
the comparison of causes of fly contamination in both factory. How much faults of any causes are both
industry individually and also there percentage is given bellow.
Report No
Causes of fly contamination
Mired one yarn to another yarn
F-1 F-2
1 29 41
2 43 57
3 38 29
78.63%
21.37%
83.72%
16.28%
0.00%10.00%20.00%30.00%40.00%50.00%60.00%70.00%80.00%90.00%
100.00%
Grease & Oil spot stains fromthe unguarded moving machine
parts
Fabric touching the floor &other soiled places, during
transportation in the trolleys
Per
cen
tage
Fault causes
Chart 4.2.5: Causes of oil spot of factory-1 factory-2 comparison (%)
Factory-1 Factory-2
“Comparative Study on Grey and Finished Fabric Inspection to Ensure Quality Garments”
Page | 50 ©Daffodil International University
4 29 40
5 23 50
Total 152 217
Fault (%) 100% 100%
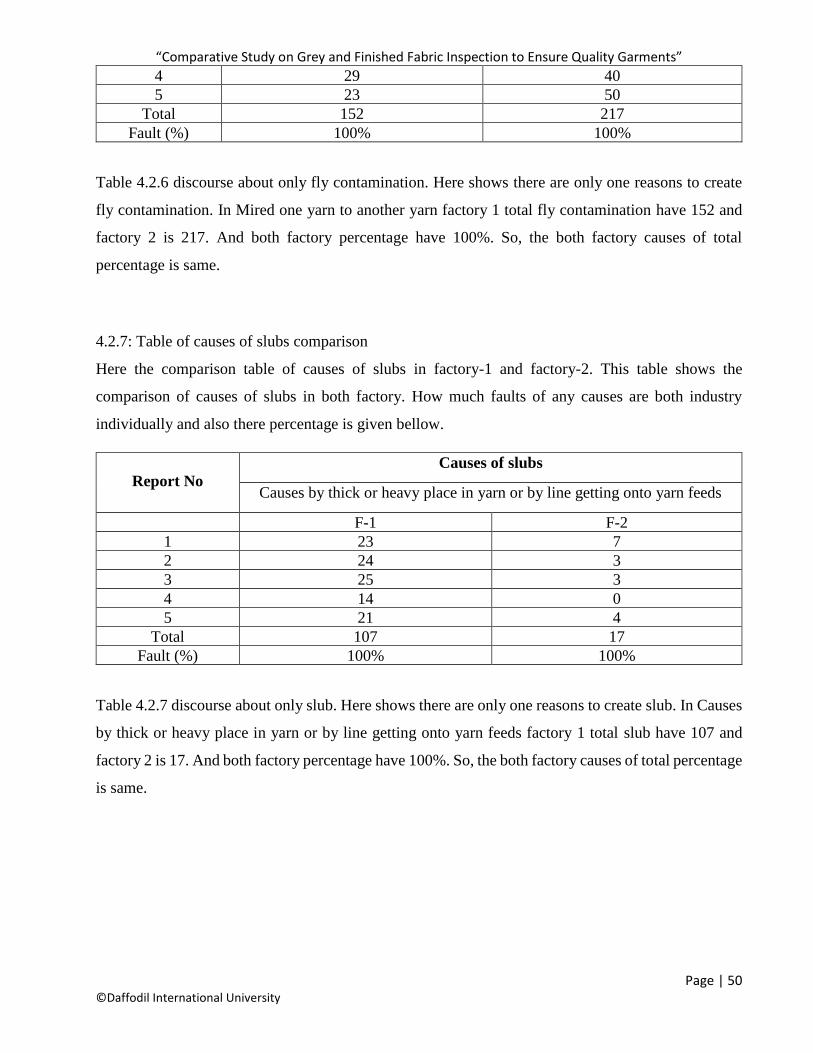
Table 4.2.6 discourse about only fly contamination. Here shows there are only one reasons to create
fly contamination. In Mired one yarn to another yarn factory 1 total fly contamination have 152 and
factory 2 is 217. And both factory percentage have 100%. So, the both factory causes of total
percentage is same.
4.2.7: Table of causes of slubs comparison
Here the comparison table of causes of slubs in factory-1 and factory-2. This table shows the
comparison of causes of slubs in both factory. How much faults of any causes are both industry
individually and also there percentage is given bellow.
Report No
Causes of slubs
Causes by thick or heavy place in yarn or by line getting onto yarn feeds
F-1 F-2
1 23 7
2 24 3
3 25 3
4 14 0
5 21 4
Total 107 17
Fault (%) 100% 100%
Table 4.2.7 discourse about only slub. Here shows there are only one reasons to create slub. In Causes
by thick or heavy place in yarn or by line getting onto yarn feeds factory 1 total slub have 107 and
factory 2 is 17. And both factory percentage have 100%. So, the both factory causes of total percentage
is same.
“Comparative Study on Grey and Finished Fabric Inspection to Ensure Quality Garments”
Page | 51 ©Daffodil International University
4.2.8: Table of causes of set up comparison
Here the comparison table of causes of set up in factory-1 and factory-2. This table shows the
comparison of causes of set up in both factory. How much faults of any causes are both industry
individually and also there percentage is given bellow.
Report No Causes of set up
Yarn tension problem Machine setting problem
F-1 F-2 F-1 F-2
1 10 2 4 0
2 7 5 0 0
3 6 1 0 0
4 2 1 0 1
5 11 5 2 2
Total 36 14 6 3
Faults (%) 85.71% 82.35% 14.29% 17.65%
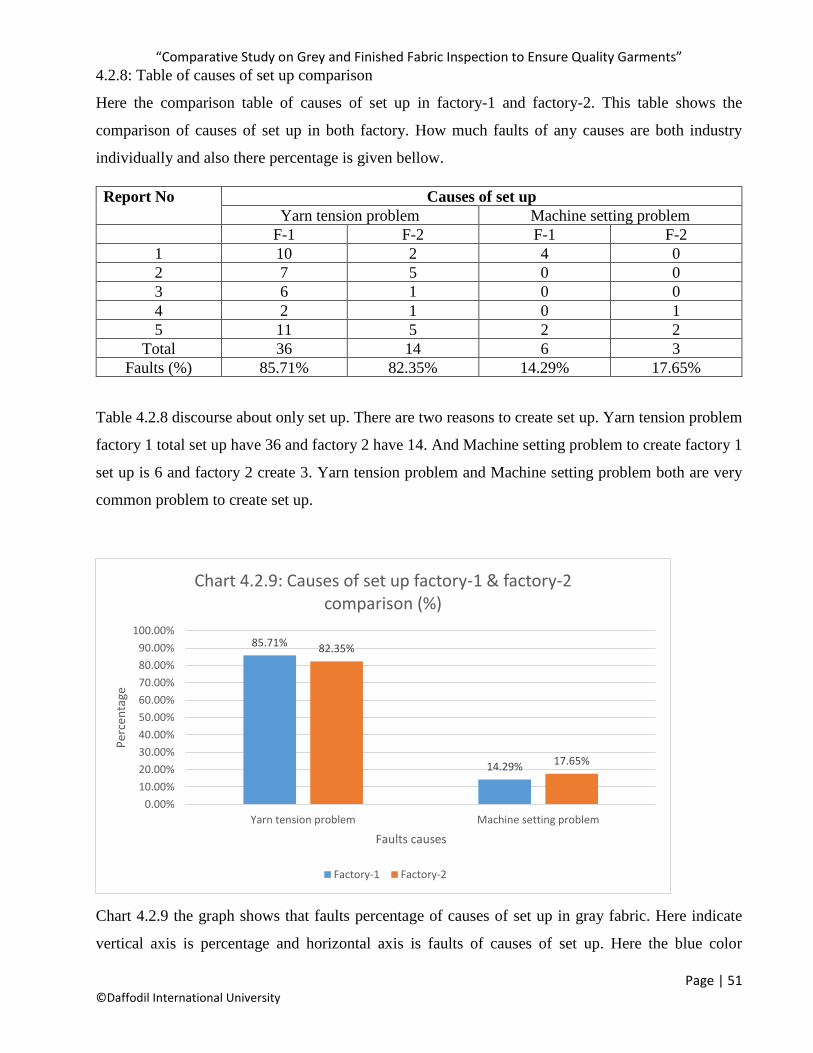
Table 4.2.8 discourse about only set up. There are two reasons to create set up. Yarn tension problem
factory 1 total set up have 36 and factory 2 have 14. And Machine setting problem to create factory 1
set up is 6 and factory 2 create 3. Yarn tension problem and Machine setting problem both are very
common problem to create set up.
Chart 4.2.9 the graph shows that faults percentage of causes of set up in gray fabric. Here indicate
vertical axis is percentage and horizontal axis is faults of causes of set up. Here the blue color
85.71%
14.29%
82.35%
17.65%
0.00%
10.00%
20.00%
30.00%
40.00%
50.00%
60.00%
70.00%
80.00%
90.00%
100.00%
Yarn tension problem Machine setting problem
Per
cen
tage
Faults causes
Chart 4.2.9: Causes of set up factory-1 & factory-2 comparison (%)
Factory-1 Factory-2
“Comparative Study on Grey and Finished Fabric Inspection to Ensure Quality Garments”
Page | 52 ©Daffodil International University
represents factory 1 and red color represents the factory 2. And we have also try to show that
comparison of both factory set up causes percentage. Here we see in this graph Yarn tension problem
factory 1 is 85.71% and factory 2 is 82.35%. And also Machine setting problem for create set up
factory 1 is 14.29% and factory 2 is 17.65%.
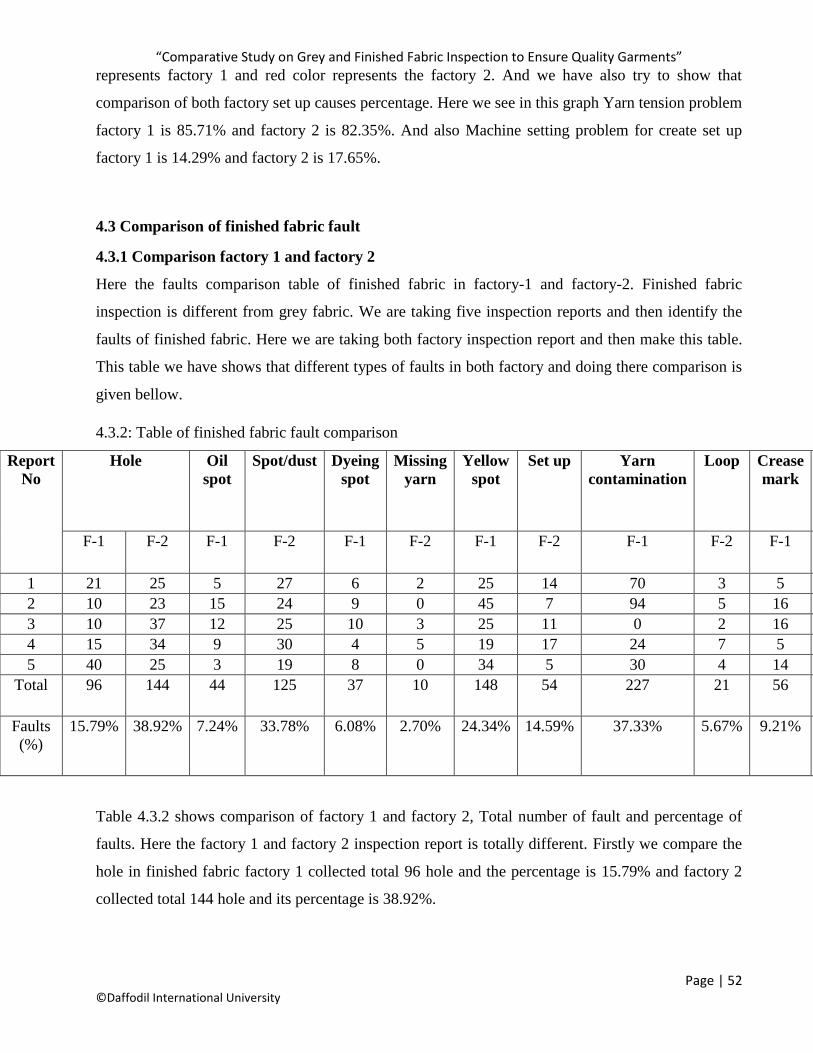
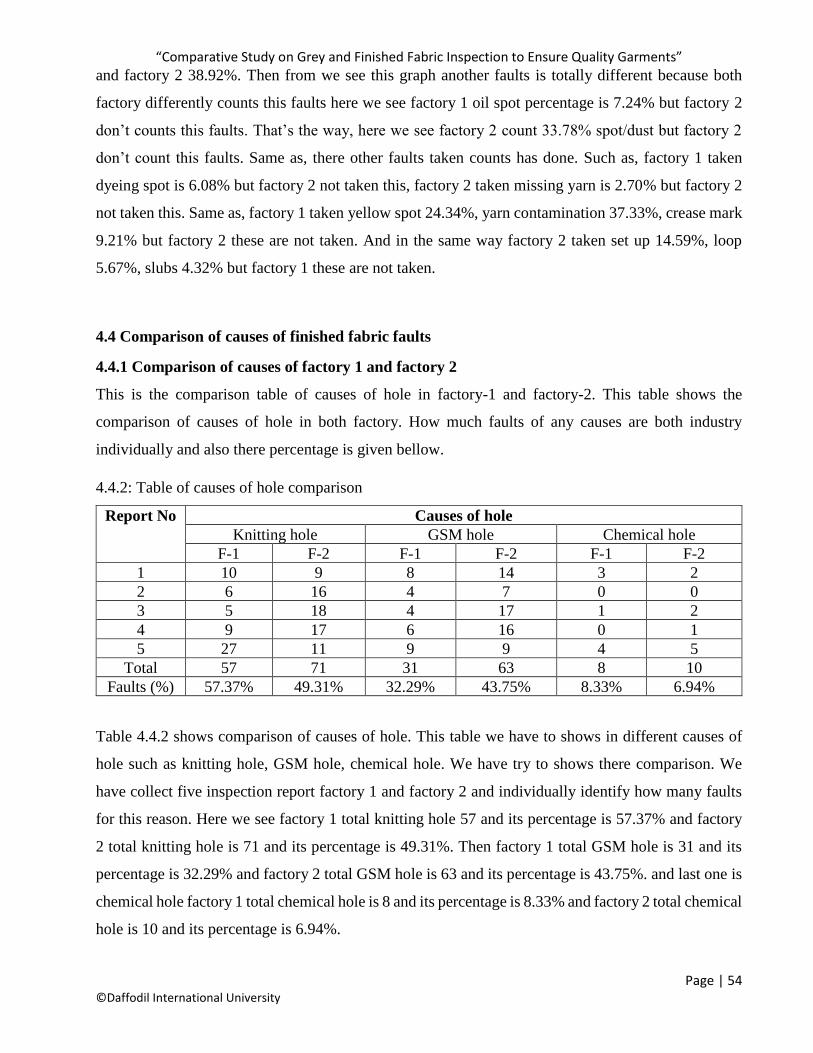
4.3 Comparison of finished fabric fault
4.3.1 Comparison factory 1 and factory 2
Here the faults comparison table of finished fabric in factory-1 and factory-2. Finished fabric
inspection is different from grey fabric. We are taking five inspection reports and then identify the
faults of finished fabric. Here we are taking both factory inspection report and then make this table.
This table we have shows that different types of faults in both factory and doing there comparison is
given bellow.
4.3.2: Table of finished fabric fault comparison
Report
No
Hole Oil
spot
Spot/dust Dyeing
spot
Missing
yarn
Yellow
spot
Set up Yarn
contamination
Loop Crease
mark
Slubs
F-1 F-2 F-1 F-2 F-1 F-2 F-1 F-2 F-1 F-2 F-1 F-2
1 21 25 5 27 6 2 25 14 70 3 5 7
2 10 23 15 24 9 0 45 7 94 5 16 3
3 10 37 12 25 10 3 25 11 0 2 16 5
4 15 34 9 30 4 5 19 17 24 7 5 0
5 40 25 3 19 8 0 34 5 30 4 14 1
Total 96 144 44 125 37 10 148 54 227 21 56 16
Faults
(%)
15.79% 38.92% 7.24% 33.78% 6.08% 2.70% 24.34% 14.59% 37.33% 5.67% 9.21% 4.32%
Table 4.3.2 shows comparison of factory 1 and factory 2, Total number of fault and percentage of
faults. Here the factory 1 and factory 2 inspection report is totally different. Firstly we compare the
hole in finished fabric factory 1 collected total 96 hole and the percentage is 15.79% and factory 2
collected total 144 hole and its percentage is 38.92%.
“Comparative Study on Grey and Finished Fabric Inspection to Ensure Quality Garments”
Page | 53 ©Daffodil International University
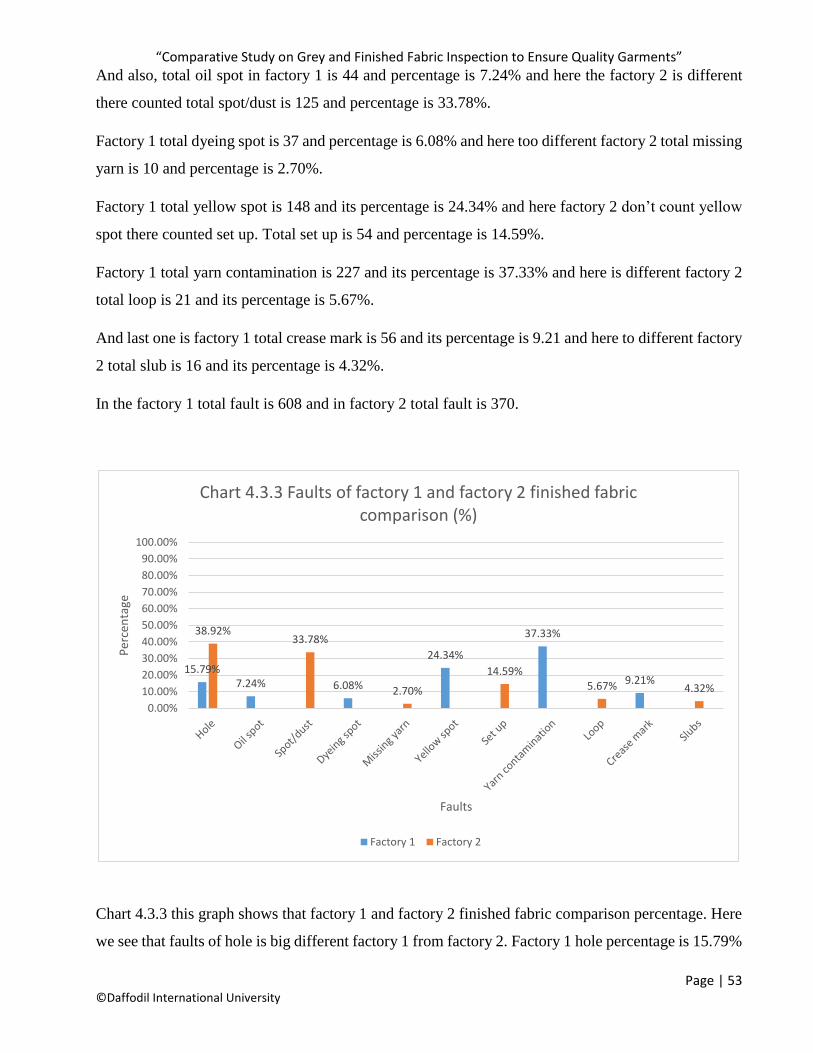
And also, total oil spot in factory 1 is 44 and percentage is 7.24% and here the factory 2 is different
there counted total spot/dust is 125 and percentage is 33.78%.
Factory 1 total dyeing spot is 37 and percentage is 6.08% and here too different factory 2 total missing
yarn is 10 and percentage is 2.70%.
Factory 1 total yellow spot is 148 and its percentage is 24.34% and here factory 2 don’t count yellow
spot there counted set up. Total set up is 54 and percentage is 14.59%.
Factory 1 total yarn contamination is 227 and its percentage is 37.33% and here is different factory 2
total loop is 21 and its percentage is 5.67%.
And last one is factory 1 total crease mark is 56 and its percentage is 9.21 and here to different factory
2 total slub is 16 and its percentage is 4.32%.
In the factory 1 total fault is 608 and in factory 2 total fault is 370.
Chart 4.3.3 this graph shows that factory 1 and factory 2 finished fabric comparison percentage. Here
we see that faults of hole is big different factory 1 from factory 2. Factory 1 hole percentage is 15.79%
15.79%7.24% 6.08%
24.34%
37.33%
9.21%
38.92%33.78%
2.70%
14.59%5.67% 4.32%
0.00%
10.00%
20.00%
30.00%
40.00%
50.00%
60.00%
70.00%
80.00%
90.00%
100.00%
Per
cen
tage
Faults
Chart 4.3.3 Faults of factory 1 and factory 2 finished fabric comparison (%)
Factory 1 Factory 2
“Comparative Study on Grey and Finished Fabric Inspection to Ensure Quality Garments”
Page | 54 ©Daffodil International University
and factory 2 38.92%. Then from we see this graph another faults is totally different because both
factory differently counts this faults here we see factory 1 oil spot percentage is 7.24% but factory 2
don’t counts this faults. That’s the way, here we see factory 2 count 33.78% spot/dust but factory 2
don’t count this faults. Same as, there other faults taken counts has done. Such as, factory 1 taken
dyeing spot is 6.08% but factory 2 not taken this, factory 2 taken missing yarn is 2.70% but factory 2
not taken this. Same as, factory 1 taken yellow spot 24.34%, yarn contamination 37.33%, crease mark
9.21% but factory 2 these are not taken. And in the same way factory 2 taken set up 14.59%, loop
5.67%, slubs 4.32% but factory 1 these are not taken.
4.4 Comparison of causes of finished fabric faults
4.4.1 Comparison of causes of factory 1 and factory 2
This is the comparison table of causes of hole in factory-1 and factory-2. This table shows the
comparison of causes of hole in both factory. How much faults of any causes are both industry
individually and also there percentage is given bellow.
4.4.2: Table of causes of hole comparison
Report No Causes of hole
Knitting hole GSM hole Chemical hole
F-1 F-2 F-1 F-2 F-1 F-2
1 10 9 8 14 3 2
2 6 16 4 7 0 0
3 5 18 4 17 1 2
4 9 17 6 16 0 1
5 27 11 9 9 4 5
Total 57 71 31 63 8 10
Faults (%) 57.37% 49.31% 32.29% 43.75% 8.33% 6.94%
Table 4.4.2 shows comparison of causes of hole. This table we have to shows in different causes of
hole such as knitting hole, GSM hole, chemical hole. We have try to shows there comparison. We
have collect five inspection report factory 1 and factory 2 and individually identify how many faults
for this reason. Here we see factory 1 total knitting hole 57 and its percentage is 57.37% and factory
2 total knitting hole is 71 and its percentage is 49.31%. Then factory 1 total GSM hole is 31 and its
percentage is 32.29% and factory 2 total GSM hole is 63 and its percentage is 43.75%. and last one is
chemical hole factory 1 total chemical hole is 8 and its percentage is 8.33% and factory 2 total chemical
hole is 10 and its percentage is 6.94%.
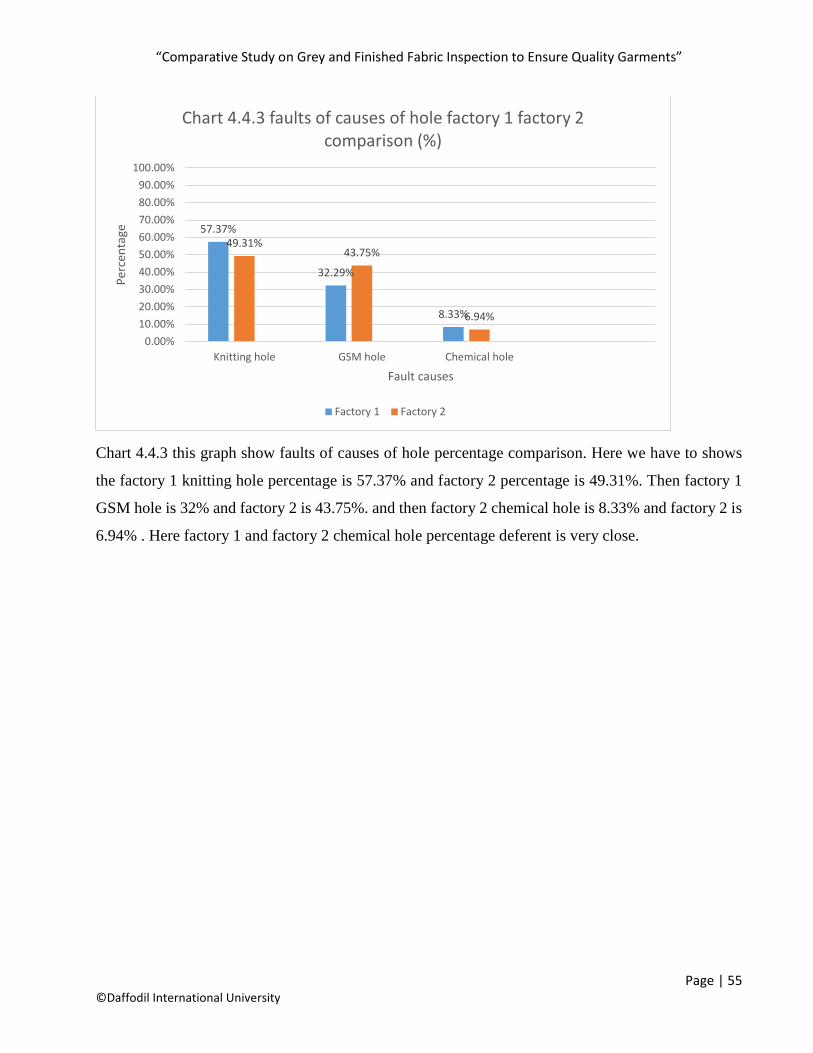
“Comparative Study on Grey and Finished Fabric Inspection to Ensure Quality Garments”
Page | 55 ©Daffodil International University
Chart 4.4.3 this graph show faults of causes of hole percentage comparison. Here we have to shows
the factory 1 knitting hole percentage is 57.37% and factory 2 percentage is 49.31%. Then factory 1
GSM hole is 32% and factory 2 is 43.75%. and then factory 2 chemical hole is 8.33% and factory 2 is
6.94% . Here factory 1 and factory 2 chemical hole percentage deferent is very close.
57.37%
32.29%
8.33%
49.31%43.75%
6.94%
0.00%
10.00%
20.00%
30.00%
40.00%
50.00%
60.00%
70.00%
80.00%
90.00%
100.00%
Knitting hole GSM hole Chemical hole
Per
cen
tage
Fault causes
Chart 4.4.3 faults of causes of hole factory 1 factory 2 comparison (%)
Factory 1 Factory 2
“Comparative Study on Grey and Finished Fabric Inspection to Ensure Quality Garments”
Page | 56 ©Daffodil International University
Chapter – 5
Conclusion
“Comparative Study on Grey and Finished Fabric Inspection to Ensure Quality Garments”
Page | 57 ©Daffodil International University
Conclusion:
In this thesis we discus about the grey fabric and finished fabric inspection and also we discus about
the comparison between grey fabric and finished fabric inspection. And the paper is concluded as –
• Here we see that the factory 2 hole (60) is more then factory 1 (49). The reason is, 2nd factory
have huge machine setting problem more then factory 1. For this reasons factory 2 hole is
more.
• Oil spot is a common problem for all of garments. Factory 1 have more oil spot then factory
2. In Factory 1 the oil spot is create from machine parts. This problem is more in factory 2.
• In factory 2 have more fly contamination problem then factory 2. Because in factory 2 they
have yarn mixing problem. Of one yarn is mixed to another yarn then create fly contamination.
• Slub is a problem of spinning. In factory 1 this problem is more then factory 2. In factory 1
yarn quality is not so good. For this reason they facing large amount of this problem.
• Setup problem is so rare problem. In factory 1 have more setup then factory 2. Factory 1 have
many yarn tension problem. For this reason is fault is huge in factory 1.
Further study about fabric inspection faults and remedies can facilitate the factory a lot.
“Comparative Study on Grey and Finished Fabric Inspection to Ensure Quality Garments”
Page | 58 ©Daffodil International University
References
1. http://www.apparel-merchandising.com/2012/03/fabric-inspection-4-point-%20system.html
2. http://texhelpline.blogspot.com/search/label/Fabric%20inspection%20Faults%20and
%20their%20causes.
3. http://www.slideshare.net/sheshir/knitted-fabric-faults-and-their-?related=1
4. http://textilelearner.blogspot.com/2013/11/inspection-of-fabric-major.html
5. https://www.onlineclothingstudy.com/2012/08/how-to-use-4-point-system-in-fabric.html
“Comparative Study on Grey and Finished Fabric Inspection to Ensure Quality Garments”
Page | 59 ©Daffodil International University
“Comparative Study on Grey and Finished Fabric Inspection to Ensure Quality Garments”
Page | 60 ©Daffodil International University
Related Documents


