1 Comparative Studies of the Role of Hormone Sensitive Lipase and Adipose Triglyceride Lipase in Human Fat Cell Lipolysis Mikael Rydén 1 §, Johan Jocken 2 , Vanessa van Harmelen 1 , Andrea Dicker 1 , Johan Hoffstedt 1 , Mikael Wirén 6 , Lennart Blomqvist 1 , Aline Mairal 3,4 , Dominique Langin 3,4,5 , Ellen Blaak 2 , Peter Arner 1 § 1 Department of Medicine, Karolinska Institutet, Karolinska University Hospital, 141 86 Stockholm, Sweden 2 Department of Human Biology, Nutrition and Toxicology Research Institute Maastricht (NUTRIM), University of Maastricht, Maastricht,The Netherlands 3 Inserm, U586, Unité de Recherches sur les Obésités, Toulouse, F-31432 France; 4 Université Paul Sabatier, Institut Louis Bugnard IFR31, Toulouse, F-31432 France; 5 Centre Hospitalier Universitaire de Toulouse, Biochimie, Institut Fédératif de Biologie de Purpan, Toulouse, F-31059 France; 6 Department of Surgery, Karolinska Institutet, Karolinska University Hospital, 141 86 Stockholm, Sweden Short title: Human Fat Cell Lipases Key words: Glycerol, RNAi, Lipase, Protein, Obesity § Correspondence should be addressed to Mikael Rydén: M61 Department of Medicine (H7) Karolinska Institutet Karolinska University Hospital 141 86 Stockholm Tel: +46-8-585 827 75 Fax: +46-8-585 838 50 e-mail: [email protected] Page 1 of 29 Articles in PresS. Am J Physiol Endocrinol Metab (February 27, 2007). doi:10.1152/ajpendo.00040.2007 Copyright © 2007 by the American Physiological Society.

Welcome message from author
This document is posted to help you gain knowledge. Please leave a comment to let me know what you think about it! Share it to your friends and learn new things together.
Transcript
1
Comparative Studies of the Role of Hormone Sensitive Lipase and Adipose Triglyceride Lipase in Human Fat Cell Lipolysis
Mikael Rydén1§, Johan Jocken2, Vanessa van Harmelen1, Andrea Dicker1, Johan Hoffstedt1,
Mikael Wirén6, Lennart Blomqvist1, Aline Mairal3,4, Dominique Langin3,4,5, Ellen Blaak2,
Peter Arner1§
1Department of Medicine, Karolinska Institutet, Karolinska University Hospital, 141 86 Stockholm, Sweden2Department of Human Biology, Nutrition and Toxicology Research Institute Maastricht (NUTRIM), University of Maastricht, Maastricht,The Netherlands3 Inserm, U586, Unité de Recherches sur les Obésités, Toulouse, F-31432 France; 4 Université Paul Sabatier, Institut Louis Bugnard IFR31, Toulouse, F-31432 France;5 Centre Hospitalier Universitaire de Toulouse, Biochimie, Institut Fédératif de Biologie de Purpan, Toulouse, F-31059 France;6 Department of Surgery, Karolinska Institutet, Karolinska University Hospital, 141 86 Stockholm, Sweden
Short title: Human Fat Cell Lipases
Key words: Glycerol, RNAi, Lipase, Protein, Obesity
§ Correspondence should be addressed to Mikael Rydén:M61Department of Medicine (H7)Karolinska InstitutetKarolinska University Hospital141 86 StockholmTel: +46-8-585 827 75Fax: +46-8-585 838 50e-mail: [email protected]
Page 1 of 29Articles in PresS. Am J Physiol Endocrinol Metab (February 27, 2007). doi:10.1152/ajpendo.00040.2007
Copyright © 2007 by the American Physiological Society.
2
Abstract
Hormone sensitive lipase (HSL) and adipose triglyceride lipase (ATGL) regulate adipocyte
lipolysis in rodents. Objective: To compare the roles of these lipases for lipolysis in human
adipocytes. Design: Subcutaneous adipose tissue was investigated. HSL and ATGL protein
expression were related to lipolysis in isolated mature fat cells. ATGL or HSL were knocked
down by RNA interference or selectively inhibited and effects on lipolysis studied in
differentiated preadipocytes or adipocytes derived from human mesenchymal stem cells
(hMSC). Setting and subjects: Outpatient investigation. Subjects were all women, 12 lean
controls, 8 lean with polycystic ovary syndrome and 27 otherwise healthy obese. Results:
Noradrenaline-induced lipolysis was positively correlated with HSL protein levels (P<0.0001)
but not with ATGL protein. Women with PCOS or obesity had significantly decreased
noradrenaline-induced lipolysis and HSL protein expression but no change in ATGL protein
expression. HSL knock-down by RNAi reduced basal and catecholamine-induced lipolysis.
Knock-down of ATGL decreased basal lipolysis but did not change catecholamine-stimulated
lipolysis. Treatment of hMSC with a selective HSL inhibitor during and/or after
differentiation into adipocytes reduced basal lipolysis by 50% while stimulated lipolysis was
inhibited completely. Conclusions: In contrast to findings in rodents, ATGL is of less
importance than HSL in regulating catecholamine-induced lipolysis and cannot replace HSL
when this enzyme is continuously inhibited. However both lipases regulate basal lipolysis in
human adipocytes. ATGL expression, unlike HSL, is not influenced by obesity or PCOS.
Word count: 230
Page 2 of 29
3
Introduction
Mobilization of lipids through lipolysis in fat cells is a key event in energy homeostasis.
Lipolysis is disturbed in many insulin resistant disorders such as obesity and polycystic ovary
syndrome (PCOS), which in turn are important risk factors for type 2 diabetes mellitus (1).
Lipolysis in fat cells is under intense hormonal control. Hormone sensitive lipase (HSL) has
for decades been regarded as the main regulatory step in mammal lipolysis (14). It is
stimulated by catecholamines and other prolipolytic hormones and inhibited by insulin.
Lipids are mainly stored in fat cells as triglycerides (TG). When lipolysis is stimulated, TG
are usually completely hydrolyzed into glycerol and free fatty acids (FFA). In rodents and
humans there is also some partial lipolysis leading to the formation of diglycerides (DG) and
FFA but not glycerol (2, 29). HSL hydrolyzes both TG and DG, although the affinity for the
latter is ten-fold higher (9). Therefore, incomplete hydrolysis of TG to DG during lipolysis
may be due to the lower substrate affinity of HSL to TG, rather than the existence of a
specific TG lipase with a different regulation than HSL. The pivotal role of HSL in adipocyte
lipolysis was first questioned when data from HSL -/- mice were reported. The animals
showed normal weight, had markedly blunted stimulated fat cell lipolysis but retained residual
basal lipolysis (26, 32). Subsequent analysis demonstrated that knockout animals displayed an
accumulation of DG in several tissues (12), suggesting that although HSL may catalyze the
rate-limiting step in TG hydrolysis, the major physiological substrates are DG and not TG.
Recently, a novel triglyceride-specific lipase has been isolated and termed adipose
triglyceride lipase (ATGL-the term used in this work) (34), desnutrin (33) and iPLA2ζ (15).
The murine ATGL gene codes for a 486 amino acid long protein while the human homologue,
displaying 86% identity, codes for a 506 amino acid protein. Studies in rodents have shown
that ATGL is predominantly expressed in white and brown adipose tissue although significant
levels are also expressed in cardiac and skeletal muscle. The enzyme displays substrate
specificity for TG but unlike HSL, activation of ATGL is not dependent on phosphorylation
events. Further studies have shown that ATGL expression is increased by fasting (33) and
decreased by insulin (16). Recently, the phenotype of mice homozygous for a null mutation in
the ATGL gene was described (11). In these animals both basal and catecholamine-stimulated
lipolysis were markedly decreased and this was true for both glycerol and FFA release (11).
ATGL -/- mice display a slightly larger white adipose tissue (WAT) mass but more
importantly, a massive TG accumulation in non-adipose tissue, in particular heart muscle.
This results in a rapidly developing heart failure and reduced life span. Furthermore, the
Page 3 of 29
4
animals display a defective cold adaptation indicating that ATGL is essential to provide FFAs
to fuel thermogenesis. A reduction in FFA availability results in an increase in glucose
utilization which could explain the increase in glucose tolerance and insulin sensitivity
observed in these animals. Finally, it was recently demonstrated in immortalized non-human
cell lines that the lipid droplet associated protein CGI-58 was essential for ATGL activity
although the molecular mechanisms remain to be elucidated (20). In summary, data from
animal studies suggest that ATGL is essential for basal and stimulated lipolysis and of major
importance for energy homeostasis. Accordingly, in a mouse fat cell line, over expression of
ATGL resulted in increased basal and stimulated lipolysis, while inhibition by RNA
interference (RNAi) had the opposite effect (16). Gene knock-down of HSL only decreased
catecholamine-stimulated lipolysis. Similar results were obtained with FFA and glycerol
measurements. These results suggest a critical role for ATGL as a regulator of both basal (i.e.
spontaneous) and stimulated lipolysis while HSL only determines stimulated lipolysis.
In contrast to these findings primarily obtained in rodents, the role of ATGL in humans is
much less clear. An association between single nucleotide polymorphisms in the ATGL gene
and circulating levels of FFA, TG and risk for type 2 diabetes mellitus was recently
demonstrated (27). Moreover, mutations in the CGI-58 gene are associated with Chanarin-
Dorfman Syndrome, a rare genetic disease characterized by excessive TG accumulation in
non-adipose tissues. Recently, the importance of ATGL in human lipolysis was indirectly
determined using a selective inhibitor of HSL in adipocytes from healthy donors (17). It was
found that catecholamine or natriuretic peptide-stimulated lipolysis was completely inhibited
whereas basal lipolysis was only partially abrogated. This suggests that HSL is the major rate
limiting lipase in human lipolysis and that ATGL may above all play a role in the regulation
of basal lipolysis. Other human studies demonstrated that ATGL mRNA, as opposed to HSL
mRNA expression, is not regulated by obesity and that the in vitro TG hydrolase activity of
ATGL, in the absence of CGI-58, is substantially lower than that of HSL (22). Thus, the
enzymatic contributions of HSL and ATGL to TG hydrolysis and thereby lipolysis may differ
between humans and rodents. However, the comparison between HSL and ATGL is
incomplete so far in man since there is no information on ATGL protein levels or effects of
genetic manipulation of lipase expression in relation to lipolysis in human fat cells.
In the present study, we have compared the physiological roles of HSL and ATGL in human
fat cell lipolysis. This was done through parallel determinations of protein level, adipocyte
Page 4 of 29
5
lipolytic activity, and modulation of HSL and ATGL levels using RNAi technology. We also
compared their expression in conditions with altered lipolysis namely obesity and polycystic
ovary syndrome, which are two conditions with decreased expression and function of HSL
(1).
Page 5 of 29
6
Material and Methods
Subjects
One cohort consisted of obese women who underwent bariatric surgery or gall stone
operations (n=19) or were investigated as healthy volunteers (n=8). Obesity was defined as a
body mass index (BMI) >30 kg/m2. The second cohort consisted of 12 healthy lean women
with BMI<25 kg/m2. The third cohort was composed of 8 young lean women diagnosed with
polycystic ovary syndrome (PCOS). The latter diagnosis was defined as infertility in
combination with ovarian cysts detected by ultrasound investigation. The PCOS women were
otherwise healthy. We chose to study young and lean PCOS women because we have
previously shown that they have blunted catecholamine-induced lipolysis without being
insulin resistant (8). These cohorts were investigated for lipolysis regulation and comparison
of HSL and ATGL protein expression. Except for the 19 operated women, abdominal
subcutaneous adipose tissue was obtained by biopsy under local anesthesia. For the operated
women, abdominal subcutaneous adipose tissue was obtained from the surgical incision at the
beginning of surgery which was performed under general anesthesia. We have previously
shown that lipolysis regulation in isolated adipocytes is identical whether the tissue is
obtained during general surgery or by local biopsy (19). Clinical data for the subjects in
cohort 1-3 are summarized in Table 1. All subjects were examined at 8 AM after an overnight
fast. Their height and weight were measured. Venous plasma samples were drawn for the
analysis of insulin, glucose, S-testosterone and sex hormone binding globuline (SHBG) by the
hospital’s accredited clinical chemistry laboratory. From these measures, the
testosterone/SHBG ratio and HOMA index [plasma glucose (mmol/l) times plasma insulin
(mU/l)] divided by 22.5 (7) were calculated. HOMA is an indirect measure of in vivo insulin
sensitivity. A fourth cohort consisted of six otherwise healthy women (age 43±2.8 years and
BMI 25±2.8 kg/m2) who underwent cosmetic abdominal subcutaneous liposuction. These
subjects did not have clinical signs of diabetes or other diseases which may influence
adipocyte function. The adipose tissue from these individuals was used to isolate
preadipocytes and human mesenchymal stem cells (hMSC) for subsequent RNA interference
studies and investigations of HSL inhibition. Subjects from all four cohorts included in this
study were healthy and free of medication. The studies were approved by the ethical
committee at Karolinska Institutet and explained in detail to each of the subjects, from whom
informed consent was obtained.
Lipolysis assessment in mature fat cells and predipocyte cultures
Page 6 of 29
7
Lipolysis experiments in mature fat cells were performed as described in detail previously
(22). In brief, cells were incubated in an albumin–containing buffer (pH 7.4) for 2 hrs at 37oC
with air as a gas phase without (basal) or with increasing concentrations of the natural
catecholamine 10-4 M noradrenaline or 10-5 M isoprenaline (a non-selective β-adrenoceptor
agonist). Following incubation, medium was removed and kept at –20oC for subsequent
measurement of glycerol concentration (an index of lipolysis) using a bioluminescence
method (13). Lipolysis was then expressed as noradrenaline- or isoprenaline-induced glycerol
release at maximum effective concentration divided by basal. When stated, lipolysis was also
expressed as absolute values (µmol of glycerol/2h/107 cells or µmol of glycerol/2h/g lipids).
We preferred to use the relative expression of lipolysis because it correlates strongly with the
protein expression of HSL in human fat cells (18). Lipolysis in human preadipocyte cultures
was performed as described previously (4) with or without 10-5 M isoprenaline. Glycerol
release was expressed per gram protein. Protein content was assayed spectrophotometrically
using BCA Protein Assay Reagent Kit (PIERCE, Rockford, IL,USA) on 96-well microtiter
plates with BSA as a standard. Glycerol was measured by bioluminescence (13) and fatty acid
release by chemiluminescence (24).
Studies of hMSCs
Human MSCs were obtained from adult adipose tissue and differentiated into the adipogenic
lineage as described in detail elsewhere (3). We have previously shown that these cells
display lipolytic activity comparable with differentiated human preadipocytes. hMSC derived
from two different donors were used. Functional assessment of adipocyte differentiation was
performed by determining glycerol-3-phosphate dehydrogenase (GPDH) activity as described
previously (31). Cells from two wells were washed with phosphate buffered saline (PBS) (pH
7.4) and harvested in pre-chilled 25 mmol/l Tris-HCl buffer containing 1 mmol/l EDTA (pH
7.4) and 1 mmol/l 2-mercapto-ethanol. After sonication, aliquots of the cell extracts were
added to an assay mixture containing 100 mmol/l triethanolamine-HCl buffer (pH 7.5), 2.5
mmol/l EDTA, 0.12 mmol/l NADH and 0.1 mmol/l β-mercapto-ethanol and GPDH activity
was measured spectrophotometrically, at 340 nm. The reactions were started by adding 0.2
mmol/l dihydroxyaceton phosphate. The GPDH activity was related to the total protein
content in each well and expressed as mU/µg of total protein. Total protein lysates were
obtained from cells in two wells using a lysis buffer that contained 1% Triton X-100, 50
mmol/l Tris-HCl (pH 7.6), 150 mmol/l NaCl and phenylmethylsulfonyl fluoride (PMSF, 1
Page 7 of 29
8
mmol/l), supplemented with protease inhibitors. Lipolysis experiments were performed on
differentiated cells as described previously (31). In brief, cells were washed with
DMEM/NUT.MIX.F-12 medium and then incubated in duplicates for 3 h at 37ºC with
DMEM/NUT.MIX.F-12 medium containing 20 g/l BSA. The following concentrations were
used for each agent; 10-8 M isoprenaline, 10-5 M noradrenaline, 10-4 M yohimbine, 10-3 M
dibutyryl cAMP (dcAMP) and 10-4 M atrial natriuretic peptide (ANP). Incubation without
drugs was made to determine basal lipolysis. The selective HSL inhibitor 4-isopropyl-3-
methyl-2-[1-(3-(S)-methyl-piperidin-1-yl)-methanoyl]-2H-isoxazol-5–1 BAY (21) has
previously been described in detail (17) and was used at the concentration of 1 µM. Following
incubation, medium was removed and kept at –20oC for subsequent measurement of glycerol
concentration (an index of lipolysis) using a bioluminescence method (13).
Protein expression of HSL and ATGL
Approximately 300 mg of WAT was crushed and lysed in protein lysis buffer (1% Triton-X
100, Tris-HCL pH 7.6 and 150 mmol/L NaCl, 4ºC), supplemented with protease inhibitors (1
mmol/L PMSF and Complete® (Boehringer Mannheim, Mannheim, Germany), and
homogenized using a microtome. The homogenate was centrifuged at 14,000 rpm for 30 min,
and the infranatant was collected and saved. Protein content was assayed using BCA Protein
Assay Reagent Kit (PIERCE, Rockford, IL, USA) as described above. In order to test if
proteins remained in the fat cake following our protein extraction procedure we performed the
following control procedure. The fat cake was removed and subjected to methanol-CHCl3
extraction (23) which effectively collects all proteins. These extracted proteins were dissolved
in the same lysis buffer as above. Protein levels in fat cake extracts were below the detection
limit of our assay. Thus, there are insignificant amounts of lipases left in the fat cake. One
hundred micrograms of total cellular protein was loaded on polyacrylamide gels and separated
by standard 12% SDS-PAGE (sodium dodecyl sulphate-polyacrylamide gel electrophoresis).
Gels were transferred to PVDF (polyvinylidine fluoride) membranes (Amersham Pharmacia
Biotech, Little Chaffore, U.K.). For HSL and β-actin detection, blots were blocked for 1 h at
room temperature in Tris-buffered saline with 0.1% Tween-20 and 5% non-fat dried milk.
This was followed by an overnight incubation at 4°C in the presence of antibodies directed
against HSL or protein β-actin (SIGMA, St Louis, USA). The human-specific HSL antibody
was a generous gift from C Holm (Lund University, Sweden) and has been characterized
elsewhere (8). For the detection of ATGL, an affinity purified polyclonal antibody was raised
Page 8 of 29
9
in rabbit against a 15 amino-acid peptide (amino-acids 386-400, GRHLPSRLPEQVERL) of
human ATGL. To test antibody specificity we expressed ATGL protein in COS cells by
transfection with cDNA coding for human ATGL. For detection of ATGL the following
conditions were used. Blocking was performed in phosphate buffered saline (PBS)
supplemented with 4% BSA. This solution was used for antibody incubation after addition of
0.1% Tween-20 while PBS+0.1% Tween-20 was used as wash solution. All incubations with
the ATGL antibody were performed at room temperature. Secondary α-rabbit antibodies
conjugated to horseradish peroxidase were from Sigma (St. Louis, MO). Antigen-antibody
complexes were detected by chemiluminescence using a kit of reagents form Pierce
(Supersignal; Rockford, Rockford, IL) and specific bands were detected using a Chemidoc
XRS system (BioRad, Germany). Images were analyzed using the Quantity One Software
supplied by the manufacturer (BioRad). To control for differences in loading etc, β-actin was
used as a control protein and values for HSL and ATGL were expressed as the quotient to β-
actin in relative units (RU). Furthermore, proteins from two subjects were ran on all gels in
order to ensure similar exposure times etc to further improve interexperimental comparison.
RNA interference
RNAi in human preadipocytes was essentially performed as described previously using short
interfering RNA oligonucleotides (siRNA) (25). For each oligonucleotide, optimal
transfection conditions were determined in separate titration experiments using different
amounts of siRNA oligonucleotides (Qiagen GmbH, Hilden, Germany) and transfection
reagent RNAiFect® (Qiagen GmbH, Hilden, Germany). Cells at day 12 of differentiation (a
time-point where the cells are almost fully differentiated) were transfected with or without
ATGL or HSL siRNAs (Qiagen GmbH, Hilden, Germany). The siRNA sequences were
(sense strand): ATGL 5’-CGG CGA GAA UGU CAU UAU, HSL 5’-GCC UGC UUC AAA
CCA AAG A. To control for unspecific RNAi effects, control cells were transfected with
non-silencing siRNA oligos without known similarities to human sequences (Qiagen GmbH,
Hilden, Germany). Cells were incubated for 24 h, a time-point where a significant gene
silencing effect was observed. Conditioned cell media aliquots were then analyzed for
glycerol content while cells were lysed for RNA or protein isolation as indicated above to
confirm gene silencing.
RNA analysis
Page 9 of 29
10
Total RNA from preadipoyte cultures were extracted using the RNeasy mini kit (Qiagen,
Hilden, Germany). RNA concentration and purity was assessed spectrophotometrically. A
bioanalyser (Agilent 2100, Agilent Technologies, Kista, Sweden) was used to confirm RNA
integrity. One microgram of total RNA was reverse transcribed using a kit (Omniscript RT,
Qiagen) and random hexamers (Invitrogen, Tåstrup, Denmark). To minimize methodological
errors due to variation in cDNA-synthesis, cDNA-synthesis was performed simultaneously for
all subjects included in the analysis. PCR conditions and primers for HSL, ATGL and 18S
have previously been described (22). The primer pairs were selected to yield a single
amplicon based on dissociation curves and analysis by agarose gel electrophoresis.
Quantitative real-time PCR was performed in an iCycler IQTM (Bio-Rad Laboratories Inc.,
Hercules, CA, USA). In RNAi experiments, ATGL and HSL mRNA levels were significantly
reduced to less than 20% of that in control cells and each condition was repeated at least three
times with cells from different donors. Experiments where gene silencing was not efficient
were discarded and not used for further analysis.
Statistical Analysis
Values are given as mean±standard error (SE). They were compared with Student’s unpaired
t-test, ANOVA, post-hoc tests and linear regression analysis using standard software
packages. A P-value of 0.05 or less was considered to be statistically significant. It is difficult
to find young, lean and otherwise healthy women with PCOS. Prior to recruitment, we made a
power calculation for the comparison of lean, young women with or without PCOS based on
previous findings with HSL protein expression and lipolysis (8). We can detect a 20%
difference between groups in either result with P<0.05 and with a power of 80% by
investigating, as performed in this study, 12 control and 8 PCOS subjects.
Drugs and chemicals
Bovine serum albumin (BSA) fraction V (lot no. A-9418), glucose, glycerol kinase, and
noradrenaline, were obtained from Sigma Chemical (Sigma, St. Louis, MO, USA). All
chemicals used were of the highest grade of purity that was commercially available.
Page 10 of 29
11
Results
Clinical data
The clinical findings in cohort 1-3 are shown in Table 1. The obese subjects were insulin
resistant and somewhat older than the other groups. Healthy lean and PCOS women had
almost identical BMI, age and insulin sensitivity but the PCOS subjects had a 4-fold higher
testosterone/SHBG ratio.
Methodological experiments
Similar concentrations of protein (3-6 µg/µl) were obtained in the tissue extracts. However,
no protein was detected in the extracts from the fat cake (detection limit is 0.01 µg/µl).From
these findings we calculated that <0.2% of all protein in adipose tissue following extraction
for Western blot remained in the fat cake. In Western blot analysis of tissue extracts a single
band at 56 kD was detected which disappeared after preincubation of the antibody with the
immunizing peptide. This band corresponds to the predicted molecular mass of human ATGL
protein. Specificity of the antibody was further confirmed by Western blot of protein lysates
from COS cells transfected with cDNA coding for human ATGL. We used these cells to
ensure the specificity of the antibody since COS cells lack ATGL. Here, a single 56 kD band
was observed (Figure 1A).
Glycerol release following down regulation of HSL and ATGL by RNA interference
We used RNA interference to determine the effects of selective lipase down-regulation on
basal and catecholamine (i.e. isoprenaline)-stimulated lipolysis in differentiated human
preadipocytes. This system was chosen since we have recently developed efficient RNAi
protocols in these cells (25) and since freshly isolated mature fat cells display a limited
survival in vitro (hours). Lipolysis was determined as glycerol release. We also attempted to
measure FFA release using a sensitive chemiluminescence method as well as gas
chromatography, but the concentrations were below threshold sensitivity for the assays (data
not shown). To control for non-specific effects of siRNA, scrambled non-silencing
oligonucleotides were used to transfect control cells under otherwise identical conditions.
Using either siRNA directed against HSL or ATGL we were able to down regulate HSL and
ATGL mRNA in the same order of magnitude (15±2.5 and 12±4 %, respectively, n=4, Figure
1B). There was no effect of ATGL oligonucleotides on HSL mRNA expression or vice versa
(Figure 1B) nor of control (scrambled) oligonucleotides (data not shown). Moreover, down
regulation of mRNA resulted in a clearly observable reduction of the cognate protein down to
Page 11 of 29
12
about 30 % (35±3.5 and 32±2.5 %, for HSL and ATGL vs control, respectively, P<0.01, n=4,
Figure 1C). Following down-regulation of HSL, a 35% decrease of both basal (P=0.028,
Figure 1D) and isoprenaline-stimulated lipolysis (P=0.017, Figure 1E) was observed. In
contrast, RNAi knock-down with siRNA oligonucleotides specific for ATGL decreased basal
lipolysis by 40% (P=0.018, Figure 1D) but had no effect on isoprenaline-induced lipolysis
(P=0.73, Figure 1E).
Lipolysis in hMSC
The role of HSL for lipolysis in adipocyte precursor cells was examined using the selective
HSL inhibitor BAY at the maximum effective concentration (Figure 2). This inhibitor does
not influence any other lipase apart from HSL, including ATGL. We chose to use a recently
established cell system based on hMSC isolated from human adipose tissue. These cells can
be efficiently differentiated in vitro into adipocytes and display all the morphological and
functional characteristics of human adipocytes (3). Furthermore, these are the only human
cells that can be used to block HSL from the earliest stage of differentiation since
preadipocytes are committed to the adipogenic lineage. hMSC were allowed to proliferate and
then differentiate into fat cells. Thereafter, a 3-hour lipolysis experiment was performed.
Inhibiton of HSL with BAY after adipose differentiation (con-bay) reduced basal lipolysis by
half and almost completely counteracted lipolysis stimulated by isoprenaline, noradrenaline
and the α2 adrenergic receptor inhibitor yohimbine, a cyclic AMP analogue (dcAMP) and
atrial natriuretic peptide (ANP, which stimulates lipolysis via the cyclic GMP pathway)
compared with control cells not exposed to BAY (con-con, Figure 2, P<0.05, n=5). Almost
identical results as with con-bay treated cells were obtained with hMSC-derived adipocytes
continuously exposed to BAY during the entire experiment, i.e. during the differentiation
process as well as the lipolytic experiment (bay-bay). In contrast, cells exposed to BAY
during differentiation but not during the lipolytic assessment (bay-con) displayed a lipolytic
response that was very similar to control cells (con-con). BAY treatment did not influence
adipocyte differentiation of hMSCs according to measurements of GPDH activity (not
shown).
Lipolysis and lipase protein expression in lean controls, obese and lean PCOS subjects
In order to compare lipolysis and HSL or ATGL levels in subjects with different lipolytic
capacity we investigated lean, obese and PCOS-subjects. Catecholamine-induced lipolysis (in
mature adipocytes) and protein expression (in adipose tissue) of ATGL and HSL were
Page 12 of 29
13
determined. The maximal lipolytic capacity expressed as noradrenaline-stimulated lipolysis
over basal, was significantly and markedly blunted in obese and PCOS compared with
adipocytes from lean subjects (9.2±1.7; 2.7±0.2; 3.0±0.7 for lean, obese and PCOS,
respectively, mean±SD, P<0.0001, Figure 3A). Basal rate of glycerol release was similar in
lean controls and PCOS subjects but slightly increased in the obese (P=0.056, graph not
shown). HSL protein levels were 50-65% decreased in PCOS and obese subjects (Figure 3B,
P=0.0022). Post-hoc analysis of HSL data revealed a significant difference between lean
versus obese (P=0.0005) and PCOS versus lean (P=0.046) but there was no significant
difference between obese and PCOS. In contrast there was no difference in ATGL protein
levels between the three groups (P=0.96, Figure 3C). The mean value for obese and PCOS
was identical (1.75 RU). The value for lean controls was 10% lower than that for obese
subjects. β-actin expression was similar in the three groups and used to correct values to
enable comparison between blots.
Since obese women were somewhat older than lean and PCOS women, values for lipolysis
and protein expression were also corrected for age in the ANOVA analysis (i.e ANCOVA).
This did not alter the outcome of the results. We also excluded the obese undergoing general
surgery. The results with the remaining 8 obese investigated as the lean and PCOS women
were the same as for the whole group except that this obese subgroup had almost the same
mean age as the two other groups (30.5 years).
The expression of HSL and ATGL protein from the obese, lean and PCOS subjects was
plotted against maximal lipolytic capacity (expressed as noradrenaline/basal lipolysis). There
was a positive correlation between HSL levels and lipolysis (Figure 3D, P<0.0001, R=0.72).
In contrast, we observed no significant correlation between ATGL protein expression and
lipolysis although a slight negative trend was observed (graph not shown, P=0.15, R=-0.23).
We also expressed noradrenaline-induced glycerol release in absolute values corrected for
either per g lipids or per 107 cells, and correlated this with lipase expression. When expressing
lipolysis per g lipids, results did not differ from those obtained using noradrenaline over basal
lipolysis (graph not shown). However, no correlation between lipolysis and lipase expression
was obtained using glycerol release per number of fat cells (graph not shown). Basal glycerol
release did not correlate with ATGL or HSL expression. Furthermore, insulin or HOMA
levels did not correlate with either ATGL or HSL expression.
Page 13 of 29

14
These data were obtained by combining the results from two separate Western blots corrected
for protein expression by β-actin to allow comparison between blots. However, the same
results were obtained if the gels were analyzed separately (graphs not shown).
Page 14 of 29
15
Discussion
The role of ATGL for human fat cell lipolysis is not clear. Previous comparisons of mRNA
and enzyme activity for HSL and ATGL have demonstrated clear differences in their
regulation and hydrolase activity. In this work we have assessed the relative importance of
ATGL and HSL protein for human fat cell lipolysis. We compared the protein levels and
lipolysis in two independent conditions with altered HSL function and lipolysis, i.e. subjects
with obesity and PCOS. We also determined the effect of gene knock-down of the two
enzymes and inhibition of HSL during and/or after adipogenesis. With regard to ATGL
expression we developed a human-specific ATGL antibody which was very selective since it
recognized only one protein band with the expected molecular size on extracts from adipose
tissue or cells transfected with cDNA coding for human ATGL. The selectivity of the HSL
antibody is well documented. Some protein extraction methods do not sufficiently remove
lipid droplet associated proteins (including lipases) from the fat cake of adipose tissue protein
extracts. Methodological experiments revealed that no or insignificant amounts of protein
remained in the fat cake using our protein extraction protocol. In addition, the HSL inhibitor
has no effect on other lipases at the concentration used in this study.
Due to the difficulties in recruiting lean PCOS subjects the number of these women and their
matched controls was limited. However, our power calculation prior to recruitment showed
that the number of subjects was large enough to significantly detect the observed differences.
Although there was a small difference in age between obese and the other two study groups,
age correction of results and a subgroup analysis showed that there was no significant effect
of age on these results. We found a positive correlation between HSL, but not ATGL, protein
levels and lipolytic capacity in response to catecholamines. This indicates that HSL is more
important in promoting catecholamine-stimulated lipolysis at least when considering complete
hydrolysis of TG into glycerol and FFA. There may also be incomplete lipolysis resulting in
the formation of DG from TG (2) and the DG pool in human adipose tissue, although small
(~1 % of all lipids), is subject to rapid turnover (5). We can therefore not exclude the
possibility that ATGL, with its’ high affinity to TG, is more important than HSL for the
regulation of incomplete lipolysis (TG to DG) resulting in release of FFA but not glycerol that
occurs in human fat cells. In order to answer this question it is necessary to measure DG and
FFA. Unfortunately, although we have developed among the most sensitive assays for the
measurements of glycerol (end product in DG analysis) and FFAs in human fat cells, the
amounts of FFAs released from our primary cultures and the intracellular levels of DG were
Page 15 of 29
16
below the detection limit of our methods. Therefore, at present, such experiments cannot be
performed. However, our results are valid for complete hydrolysis of TG or DG which always
results in the release of glycerol.
Little is known regarding the regulation of ATGL expression in man although adipose tissue
mRNA expression was not altered by obesity. This was in contrast to HSL mRNA which was
significantly down-regulated in this condition (22). We presently compared activation of basal
lipolysis with lipase protein expression in subcutaneous adipose tissue of lean, obese and lean
PCOS women. Noradrenaline-induced lipolysis and HSL expression is decreased in the latter
two states as reviewed (1). Obesity is associated with insulin resistance and some PCOS
women are also insulin resistant. The PCOS subjects included in this study displayed no
insulin resistance, presumably because they were young and lean. This confirms findings in a
similar cohort of PCOS women investigated previously (8). We could also confirm previous
findings from our laboratory, namely that lean, non-insulin resistant PCOS and obese insulin
resistant women have a blunted catecholamine-induced lipolysis and reduced HSL expression
(6, 8). More important is the concomitant observation that ATGL protein expression is not
altered at all in obesity or PCOS. These results give further support to the notion that ATGL
plays a less important role in regulating catecholamine-stimulated lipolysis in human fat cells.
It is possible, though, that there is not a simple one-to-one relationship between HSL
expression and lipolysis activation. Firstly, there was a considerable dispersion in the
relationship between HSL and lipolysis in Figure 3D. Secondly, although lipolysis activation
was almost identical in obese and PCOS (Figure 3A), HSL expression was slightly but not
significantly lower in obese than in PCOS women (Figure 3B).
Although the data discussed so far favour HSL over ATGL in lipolytic regulation by
catecholamines they only provide indirect evidence for this hypothesis. However, direct proof
is obtained from the RNAi experiments. We have recently optimized conditions for RNAi in
primary cultures of human adipocytes (25) and we are currently perfecting a similar approach
in hMSC-derived adipocytes. These studies demonstrate that gene knock-down of HSL results
in decreased basal as well as catecholamine-stimulated lipolysis whereas siRNAs directed
against ATGL only inhibit basal glycerol release. It may appear strange why an 85%
reduction in mRNA for either ATGL or HSL only reduces basal lipolysis by 35-40% and
stimulated lipolysis by 35% (the latter for HSL). It should be noted though, that siRNA only
inhibit protein expression transiently and have no effect on protein degradation. The
Page 16 of 29
17
endogenous half lives of ATGL and HSL proteins are not known. Moreover, although protein
expression for both lipases was clearly reduced using their cognate siRNA oligonucleotide,
protein levels in these primary cultures were still easily detectable. As discussed above, there
is probably a non-linear relationship between the amounts of lipase (HSL and ATGL) present
in the adipocyte and the lipolytic activity. Thus, considerable lipolytic activity is present in
cells where lipase expression has been reduced by approximately 70 %. It would of course be
of interest to assess the effects of double knock down by RNAi. At present, however, this is
not feasible because of off-target effects that are yet be resolved in our cellular system. The
ideal experiments would be to induce long term stable reductions of these lipases.
Unfortunately such experiments are presently impossible to perform due to the lack of
established human fat cell lines. The use of plasmid vectors is also not an option because the
transfection efficiency is too low in human adipocytes. Nevertheless, basal and isoprenaline-
induced lipolysis were simultaneously measured. It is evident that for ATGL the obtained
reduction of this lipase only affects basal lipolysis. Even if data with double knock-down
could be generated, the outcome would in no way change the present interpretation of our
single knock-down experiments.
The RNAi results obtained in these primary human cells contrast findings in a murine
preadipocyte cell line (16). We used the same protocols (decreasing gene expression of ATGL
or HSL with siRNA and measuring basal and isoprenaline-induced glycerol release). The
earlier study (16) also reported data on fatty acids. As mentioned above, we were not able to
measure these lipids although we used an ultra sensitive bioluminescence assay. Nevertheless,
the murine study showed that ATGL is important for basal and stimulated lipolysis while
HSL is mainly required for stimulated lipolysis in adipocytes. This is not the only regulatory
aspect of lipolysis that is subject to major species differences when results of human and
murine fat cells are compared (for reviews see (1)). For example, rodent adipocytes utilize the
β3-adrenoceptor for catecholamine-induced lipolysis whereas human fat cells respond mainly
to the prolipolytic β1-and β2- and the antilipolytic α2A-adrenoceptors. Moreover, human fat
cells display a unique prolipolytic response to natriuretic peptides (30). Overall, this warrants
caution in interpreting data obtained from murine fat cell models and extrapolate them to the
human level.
The strongest evidence for a superior role of HSL among lipases in regulating human fat cell
lipolysis can be obtained from our studies in hMSCs. When these cells were subjected to
Page 17 of 29
18
complete HSL inhibition during proliferation, differentiation and lipolysis experiments, basal
lipolysis was inhibited by 50 % while stimulated lipolysis (using a range of different agonists)
was almost completely blunted. Identical results were obtained if HSL was temporarily
inhibited only during the lipolysis experiment. Conversely, hMSC-derived adipocytes
exposed to the HSL inhibitor during the entire differentiation process but where the HSL
inhibitor was withdrawn immediately before the lipolytic experiment displayed essentially the
same lipolytic activity as control cells. These data suggest that ATGL cannot replace HSL
during chronic inhibition of the latter lipase and that HSL can immediately re-establish its
lipolytic role when it is disinhibited. This is independent of the route of stimulation by either
catecholamines, by direct activation of protein kinase A or through activation of cGMP.
Detailed clinical characteristics were available for cohort 1-3 (partly summarized in table 1)
but not for cohort 4. It could be argued that the results obtained in cells from cohort 4 could
be influenced by specific clinical conditions of the donors. However, we find this less likely
since all donors were requested to be otherwise healthy and free of medication. Moreover,
these immature cells from the stroma-vascular portion of adipose tissue were isolated and
differentiated in vitro for 2-3 weeks thereby avoiding confounding environmental factors
normally present when freshly isolated fat cells are used. In fact, we have previously shown
that this system is efficient in establishing primary and secondary causes to alterations in fat
cell function (17, 31).
On the basis of the present and previous (17, 22) comparisons of ATGL and HSL in man we
propose the following model on their respective roles in lipolytic regulation in human fat
cells. HSL is of greater importance than ATGL in regulating complete hydrolysis of TG (to
glycerol) following catecholamine or natriuretic peptide stimulation in normal conditions and
obesity or PCOS. However, both lipases are important for the regulation of basal complete
hydrolysis of TG to glycerol. We admit that we cannot preclude the possibility that ATGL
may have roles in lipolysis which are not revealed until more is known regarding the details
of this lipase (e.g phosphorylation, intracellular localization and protein-protein interactions).
In fact, recent data suggest that the regulation of enzyme activity of HSL and ATGL is more
complex than previously recognized (10). However, such more advanced studies of lipase
function/activity can, for the moment, only be performed in fat cell lines and not in primary
cells used in the present work. Furthermore, specific ATGL inhibitors which are essential for
a detailed enzymatic analysis are not yet available. In addition, we cannot excluded the
Page 18 of 29
19
possibility that our use of different human fat cell models, which was mandatory to answer all
questions raised in the present work, could obscure some differences regarding ATGL versus
HSL function. Finally, this study has only examined HSL and ATGL. It is possible that
additional lipases are active in human fat cells that may have yet undefined roles in the
regulation of lipolysis. However, the importance of such lipases is doubtful since HSL and
ATGL are responsible for >95% of triglyceride hydrolase activity in mouse fat cells (28).
In summary, this study suggests that in contrast to findings in rodents, HSL is more important
than ATGL in regulating catecholamine-induced lipolysis in human fat cells under normal
and insulin resistant conditions. However both ATGL and HSL regulate basal lipolytic
activity of human fat cells. The role of these lipases in partial hydrolysis of TG to DG remains
to be defined.
Page 19 of 29

20
Acknowledgments
This study was supported with grants from the Swedish Research Council, the Swedish
Medical Association, the Swedish Diabetes Association, the Swedish Heart and Lung
Foundation, the Foundation of Gustav V and Queen Victoria, the Novo Nordisk Foundation,
grants from the Netherlands Organisation for Scientific Research and the EU Sixth
Framework Programme Hepadip, http://www.hepadip.org, contract LSHM-CT-2005-018734.
We would like to thank Gaby Åström and Kerstin Wåhlen for excellent technical assistance.
Page 20 of 29

21
Figure legends
Figure 1. Effect of HSL and ATGL gene knock-down in human differentiated preadipocytes.
A. Western blot analysis of protein extracts from COS cells transfected with an expression
vector coding for human ATGL. Control cells were transfected with empty vector. Blots were
probed with the ATGL antibody described in materials and methods. A single band of 56 kD
was detected. B-E. Differentiated human preadipocytes were transfected with scrambled
control (C), ATGL or HSL siRNA oligonucleotides as indicated. B. Effects on mRNA
expression by siRNA transfection. Cells were transfected with the indicated siRNAs and
expression of HSL and ATGL mRNA was determined by quantitative real time PCR. Levels
were related to those of cells transfected with control oligonucleotides. P values were
calculated with Student’s t-test and asterisks denote P<0.01, n=4 C. Results at the mRNA
level were confirmed at the protein level by Western blot analysis probing the blots with the
indicated antibodies. A representative example from one out of four independent experiments
is shown. D-E. Lipolysis was measured as glycerol release in the basal state and after
incubation with isoprenaline. Glycerol release (µmol/µg protein) in cells transfected with
scrambled siRNA oligonucleotides was (mean±SE) 4±1.5 in the basal state and 16±4.5 in the
isoprenaline–stimulated state. Mean lipolysis in control cells was set at 100% and glycerol
release in cells transfected with specific RNAi was expressed relative to control. D. Effect of
siRNA treatment on basal lipolysis as indicated. E. Effect of siRNA on isoprenaline-induced
lipolysis. Results in graphs are mean±SE of four independent experiments. Asterisks in D-E
denote P<0.05 by post-hoc analysis of HSL or ATGL vs control. ANOVA for all three groups
showed P<0.01.
Figure 2. Effect of HSL inhibition on basal and stimulated lipolysis of adipocytes
differentiated from hMSC. Human MSCs were proliferated and differentiated into the adipose
lineage followed by a three-hour incubation with or without the indicated prolipolytic agents.
One micromolar BAY was added at different time points. Cells were incubated with BAY
during the entire differentiation process and BAY was then either retained (bay-bay) or
omitted (bay-con) during the lipolytic stimulation. In addition cells were acutely incubated
with BAY only during the lipolytic assessment (con-bay). Cells not exposed to BAY at any
step (con-con) served as control cells. Lipolysis was expressed as glycerol release and related
to basal levels of glycerol release in con-con cells. C; basal conditions without exogenous
lipolytic stimulus (basal glycerol release), Iso; Isoprenaline, NA+Y; noradrenaline and the
α2-adrenergic receptor inhibitor yohimbine, dcAMP; dibutyryl cAMP, ANP; atrial natriuretic
Page 21 of 29
22
peptide. Results are based on five independent experiments using hMSC from two different
donors. Error bars are SE. Asterisks denote P<0.05 by t-test analysis vs basal glycerol release
in con-con. ANOVA in each of the five conditions showed P<0.01 for the overall difference.
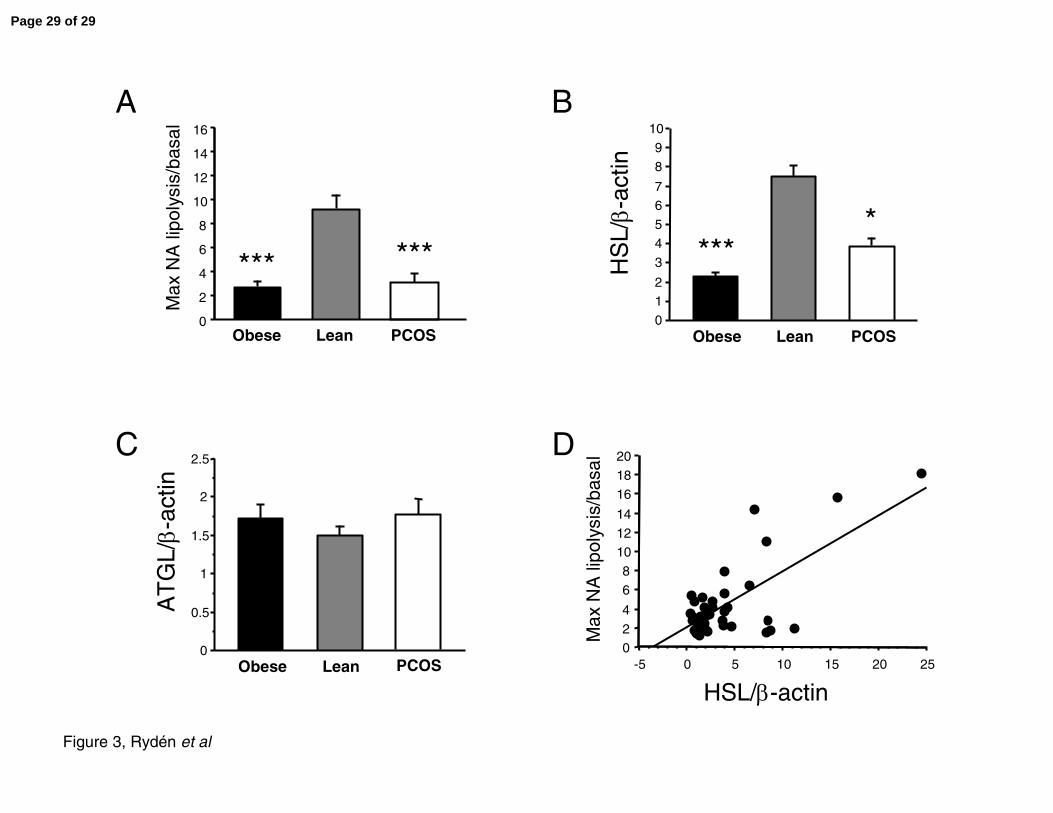
Figure 3. Lipolysis and protein expression in lean (n=12), obese (n=27) and lean PCOS
(n=8) subjects. A. In vitro lipolysis on freshly isolated mature fat cells was performed on
lean, obese and PCOS subjects as indicated using noradrenaline. Lipolysis was measured as
glycerol release and expressed as maximum noradrenaline lipolysis/basal glycerol release
(Max NA/basal). Data are presented as mean±SE. B-C. Western blot analysis was performed
on subcutaneous adipose tissue from the same subjects as in A. The blot was probed with
antibodies directed against B. HSL or C. ATGL and corrected for β-actin in order to enable
comparison between blots. Error bars are SE. Results in A-C were first compared by ANOVA
giving P<0.01 in A and B. Asterisks denote statistically significant difference (***=P<0.001
and *=P<0.05) for post-hoc analysis of obese or PCOS vs lean subjects. D. HSL expression
was plotted against lipolysis (Max NA/basal) for all subjects and examined by linear
regression analysis. Results were analyzed by linear regression (P<0.0001, R=0.72).
Page 22 of 29

23
Table 1 Antropometric data and relevant values on subjects from cohorts 1, 2 and 3.Data is presented as mean±SE. Statistical significance between the three groups was calculated by ANOVA and by Student’s t-test for comparisons between two groups.
Obese (n=27)
Lean(n=12)
PCOS(n=8)
P ANOVA Lean vs Obese
Lean vs PCOS
PCOS vs Obese
Age (years) 38±1.6 31±1 30±1.3 0.01 0.02 0.69 0.01
BMI (kg/m2) 41.8±1.2 22.6±0.5 22.9±1.0 <0.0001 <0.0001 0.89 <0.0001
Testosterone/SHBG(ratio)
0.068±0.009 0.019±0.004 0.076±0.010 0.01 0.008 0.008 0.64
P-Insulin (mU/l) 19.6±2.2 5.0±0.58 8.1±1.1 0.0001 <0.0001 0.50 0.006
P-glucose (mmol/l) 5.9±0.3 4.7±0.11 4.8±0.07 0.004 0.003 0.85 0.022
HOMA index 5.7±1.0 1.1±0.11 1.8±0.3 0.0006 0.0004 0.73 0.04
Page 23 of 29
24
References1. Arner P. Human fat cell lipolysis: biochemistry, regulation and clinical role. Best Pract Res Clin Endocrinol Metab 19: 471-482, 2005.2. Arner P and Ostman J. Mono-acid diacylglycerols in human adipose tissue. Biochim Biophys Acta 369: 209-221, 1974.3. Dicker A, Le Blanc K, Astrom G, van Harmelen V, Gotherstrom C, Blomqvist L, Arner P, and Ryden M. Functional studies of mesenchymal stem cells derived from adult human adipose tissue. Exp Cell Res 308: 283-290, 2005.4. Dicker A, Ryden M, Naslund E, Muehlen IE, Wiren M, Lafontan M, and Arner P. Effect of testosterone on lipolysis in human pre-adipocytes from different fat depots. Diabetologia 47: 420-428, 2004.5. Edens NK, Leibel RL, and Hirsch J. Lipolytic effects on diacylglycerol accumulation in human adipose tissue in vitro. J Lipid Res 31: 1351-1359, 1990.6. Ek I, Arner P, Ryden M, Holm C, Thorne A, Hoffstedt J, and Wahrenberg H. A unique defect in the regulation of visceral fat cell lipolysis in the polycystic ovary syndrome as an early link to insulin resistance. Diabetes 51: 484-492, 2002.7. Emoto M, Nishizawa Y, Maekawa K, Hiura Y, Kanda H, Kawagishi T, Shoji T, Okuno Y, and Morii H. Homeostasis model assessment as a clinical index of insulin resistance in type 2 diabetic patients treated with sulfonylureas. Diabetes Care 22:818-822, 1999.8. Faulds G, Ryden M, Ek I, Wahrenberg H, and Arner P. Mechanisms behind lipolytic catecholamine resistance of subcutaneous fat cells in the polycystic ovarian syndrome. J Clin Endocrinol Metab 88: 2269-2273, 2003.9. Fredrikson G, Stralfors P, Nilsson NO, and Belfrage P. Hormone-sensitive lipase of rat adipose tissue. Purification and some properties. J Biol Chem 256: 6311-6320, 1981.10. Granneman JG, Moore HP, Granneman RL, Greenberg AS, Obin MS, and Zhu Z. Analysis of lipolytic protein trafficking and interactions in adipocytes. J Biol Chem, 2006.11. Haemmerle G, Lass A, Zimmermann R, Gorkiewicz G, Meyer C, Rozman J, Heldmaier G, Maier R, Theussl C, Eder S, Kratky D, Wagner EF, Klingenspor M, Hoefler G, and Zechner R. Defective lipolysis and altered energy metabolism in mice lacking adipose triglyceride lipase. Science 312: 734-737, 2006.12. Haemmerle G, Zimmermann R, Hayn M, Theussl C, Waeg G, Wagner E, Sattler W, Magin TM, Wagner EF, and Zechner R. Hormone-sensitive lipase deficiency in mice causes diglyceride accumulation in adipose tissue, muscle, and testis. J Biol Chem 277: 4806-4815, 2002.13. Hellmer J, Marcus C, Sonnenfeld T, and Arner P. Mechanisms for differences in lipolysis between human subcutaneous and omental fat cells. J Clin Endocrinol Metab 75: 15-20, 1992.14. Holm C. Molecular mechanisms regulating hormone-sensitive lipase and lipolysis. Biochem Soc Trans 31: 1120-1124, 2003.15. Jenkins CM, Mancuso DJ, Yan W, Sims HF, Gibson B, and Gross RW.Identification, cloning, expression, and purification of three novel human calcium-independent phospholipase A2 family members possessing triacylglycerol lipase and acylglycerol transacylase activities. J Biol Chem 279: 48968-48975, 2004.16. Kershaw EE, Hamm JK, Verhagen LA, Peroni O, Katic M, and Flier JS.Adipose triglyceride lipase: function, regulation by insulin, and comparison with adiponutrin. Diabetes 55: 148-157, 2006.
Page 24 of 29
25
17. Langin D, Dicker A, Tavernier G, Hoffstedt J, Mairal A, Ryden M, Arner E, Sicard A, Jenkins CM, Viguerie N, van Harmelen V, Gross RW, Holm C, and Arner P. Adipocyte lipases and defect of lipolysis in human obesity. Diabetes 54: 3190-3197, 2005.18. Large V, Arner P, Reynisdottir S, Grober J, Van Harmelen V, Holm C, and Langin D. Hormone-sensitive lipase expression and activity in relation to lipolysis in human fat cells. J Lipid Res 39: 1688-1695, 1998.19. Large V, Reynisdottir S, Eleborg L, van Harmelen V, Strommer L, and Arner P. Lipolysis in human fat cells obtained under local and general anesthesia. Int J Obes Relat Metab Disord 21: 78-82, 1997.20. Lass A, Zimmermann R, Haemmerle G, Riederer M, Schoiswohl G, Schweiger M, Kienesberger P, Strauss JG, Gorkiewicz G, and Zechner R. Adipose triglyceride lipase-mediated lipolysis of cellular fat stores is activated by CGI-58 and defective in Chanarin-Dorfman Syndrome. Cell Metab 3: 309-319, 2006.21. Lowe DB, Magnuson S, Qi N, Campbell AM, Cook J, Hong Z, Wang M, Rodriguez M, Achebe F, Kluender H, Wong WC, Bullock WH, Salhanick AI, Witman-Jones T, Bowling ME, Keiper C, and Clairmont KB. In vitro SAR of (5-(2H)-isoxazolonyl) ureas, potent inhibitors of hormone-sensitive lipase. Bioorg Med Chem Lett 14: 3155-3159, 2004.22. Mairal A, Langin D, Arner P, and Hoffstedt J. Human adipose triglyceride lipase (PNPLA2) is not regulated by obesity and exhibits low in vitro triglyceride hydrolase activity. Diabetologia 49: 1629-1636, 2006.23. Mottagui-Tabar S, Ryden M, Lofgren P, Faulds G, Hoffstedt J, Brookes AJ, Andersson I, and Arner P. Evidence for an important role of perilipin in the regulation of human adipocyte lipolysis. Diabetologia 46: 789-797, 2003.24. Naslund BM, Bernstrom K, Lundin A, and Arner P. Free fatty acid determination by peroxidase catalysed luminol chemiluminescence. J Biolumin Chemilumin3: 115-124, 1989.25. Nordstrom EA, Ryden M, Backlund EC, Dahlman I, Kaaman M, Blomqvist L, Cannon B, Nedergaard J, and Arner P. A human-specific role of cell death-inducing DFFA (DNA fragmentation factor-alpha)-like effector A (CIDEA) in adipocyte lipolysis and obesity. Diabetes 54: 1726-1734, 2005.26. Osuga J, Ishibashi S, Oka T, Yagyu H, Tozawa R, Fujimoto A, Shionoiri F, Yahagi N, Kraemer FB, Tsutsumi O, and Yamada N. Targeted disruption of hormone-sensitive lipase results in male sterility and adipocyte hypertrophy, but not in obesity. Proc Natl Acad Sci U S A 97: 787-792, 2000.27. Schoenborn V, Heid IM, Vollmert C, Lingenhel A, Adams TD, Hopkins PN, Illig T, Zimmermann R, Zechner R, Hunt SC, and Kronenberg F. The ATGL gene is associated with free fatty acids, triglycerides, and type 2 diabetes. Diabetes 55: 1270-1275, 2006.28. Schweiger M, Schreiber R, Haemmerle G, Lass A, Fledelius C, Jacobsen P, Tornqvist H, Zechner R, and Zimmermann R. Adipose Triglyceride Lipase and Hormone-sensitive Lipase Are the Major Enzymes in Adipose Tissue Triacylglycerol Catabolism. J Biol Chem 281: 40236-40241, 2006.29. Scow RO, Stricker FA, Pick TY, and Clary TR. Effect of ACTH on FFA release and diglyceride content in perfused rat adipose tissue. Ann N Y Acad Sci 131: 288-301, 1965.30. Sengenes C, Bouloumie A, Hauner H, Berlan M, Busse R, Lafontan M, and Galitzky J. Involvement of a cGMP-dependent pathway in the natriuretic peptide-mediated hormone-sensitive lipase phosphorylation in human adipocytes. J Biol Chem 278: 48617-48626, 2003.
Page 25 of 29
26
31. van Harmelen V, Dicker A, Ryden M, Hauner H, Lonnqvist F, Naslund E, and Arner P. Increased lipolysis and decreased leptin production by human omental as compared with subcutaneous preadipocytes. Diabetes 51: 2029-2036, 2002.32. Wang SP, Laurin N, Himms-Hagen J, Rudnicki MA, Levy E, Robert MF, Pan L, Oligny L, and Mitchell GA. The adipose tissue phenotype of hormone-sensitive lipase deficiency in mice. Obes Res 9: 119-128, 2001.33. Villena JA, Roy S, Sarkadi-Nagy E, Kim KH, and Sul HS. Desnutrin, an adipocyte gene encoding a novel patatin domain-containing protein, is induced by fasting and glucocorticoids: ectopic expression of desnutrin increases triglyceride hydrolysis. J Biol Chem279: 47066-47075, 2004.34. Zimmermann R, Strauss JG, Haemmerle G, Schoiswohl G, Birner-Gruenberger R, Riederer M, Lass A, Neuberger G, Eisenhaber F, Hermetter A, and Zechner R. Fat mobilization in adipose tissue is promoted by adipose triglyceride lipase. Science 306: 1383-1386, 2004.
Page 26 of 29

Figure 1, Rydén et al
0
20
40
60
80
100
120
C HSLsiRNA ATGL
Basal lipolysis
Gly
cero
l rel
ease
(%
of
con
tro
lcel
ls)
* *
Gly
cero
l rel
ease
(%
of
con
tro
lcel
ls)
0
20
40
60
80
100
120
C HSLsiRNA ATGL
Isoprenaline-induced lipolysis
*
B
D E
HSLsiRNA ATGLm
RN
Aex
pre
ssio
n (
% o
f co
ntr
olc
ells
)
020406080
100120140160180
200
HSLATGL HSLATGL
C
ATGL
HSL
β-Actin
HSLsiRNA ATGLC C
A
-
COS-cellshATGL cDNA
+56 kD
** **
Page 27 of 29
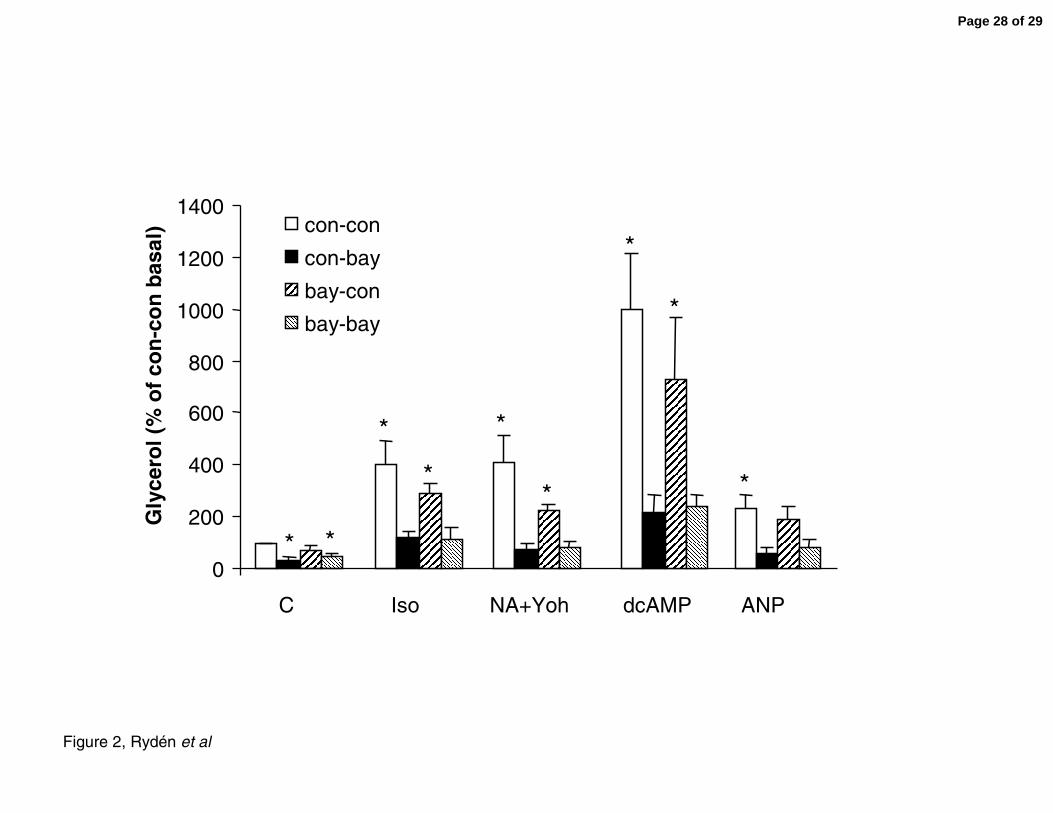
Figure 2, Rydén et al
con-con
con-bay
bay-con
bay-bay
0
200
400
600
800
1000
1200
1400
C Iso ANPNA+Yoh dcAMP
Gly
cero
l (%
of
con
-co
n b
asal
)
* *
*
*
*
*
*
*
*
Page 28 of 29
0
0.5
1
1.5
2
2.5
LeanObese PCOS
012
34567
89
10
LeanObese PCOS
AT
GL/β-a
ctin
HS
L/β-a
ctin
Figure 3, Rydén et al
A
C D
0
2
4
6
8
10
12
14
16
LeanObese PCOS
024
68
101214
161820
Max
NA
lipo
lysi
s/ba
sal
-5 0 5 10 15 20 25
HSL/β-actin
Max
NA
lipo
lysi
s/ba
sal
B
*******
***
Page 29 of 29
Related Documents