Commentary Comparative sequence analysis of Sordaria macrospora and Neurospora crassa as a means to improve genome annotation q Minou Nowrousian, Christian W€ urtz, Stefanie P€ oggeler, and Ulrich K€ uck * Lehrstuhl fu ¨ r Allgemeine und Molekulare Botanik, Ruhr-Universita ¨ t Bochum, 44780, Bochum, Germany Received 15 August 2003; accepted 22 October 2003 Abstract One of the most challenging parts of large scale sequencing projects is the identification of functional elements encoded in a genome. Recently, studies of genomes of up to six different Saccharomyces species have demonstrated that a comparative analysis of genome sequences from closely related species is a powerful approach to identify open reading frames and other functional regions within genomes [Science 301 (2003) 71, Nature 423 (2003) 241]. Here, we present a comparison of selected sequences from Sordaria macrospora to their corresponding Neurospora crassa orthologous regions. Our analysis indicates that due to the high degree of sequence similarity and conservation of overall genomic organization, S. macrospora sequence information can be used to simplify the annotation of the N. crassa genome. Ó 2003 Elsevier Inc. All rights reserved. Keywords: Sordaria macrospora; Neurospora crassa; Filamentous fungi; Genome annotation; Exon–intron boundaries; Synteny; Comparative genomics 1. Introduction Over the last few years, several fungal genomes have been fully sequenced, and even more will be se- quenced in the near future (Galagan et al., 2003; Goffeau et al., 1996, http://www-genome.wi.mit.edu/seq/fgi/ candidates.html, http://www.ncbi.nlm.nih.gov/cgi-bin/ Entrez/map00?taxid ¼ 5085). However, the most chal- lenging part in genome analysis today is usually not generating the sequence but annotating it. Features like open reading frames, exon–intron boundaries and reg- ulatory elements within a genome are often difficult to predict correctly from genomic sequence information alone. Identification of transcribed regions can be im- proved if EST 1 sequences are available, but EST data- bases tend not to contain rarely transcribed genes, so often no cDNA sequence information is available. Comparison with public databases is an additional means of identifying open reading frames, but for many genes, no putative homologs are available in the data- bases; e.g., many fungal EST sequencing projects have found that only less than or 50% of the ESTs generated have already characterized homologs among other or- ganisms (e.g., Nelson et al., 1997; Prade et al., 2001; Zhu et al., 2001). Microarray data or other large scale tran- scriptome data can help to discover genes that are reg- ulated similarly at the transcriptional level and therefore might contain common promoter elements (e.g., Hughes et al., 2000; Ren et al., 2000; Roth et al., 1998), but this approach to identify regulatory elements is labor-inten- sive and requires an EST library or annotation of open reading frames as a prerequisite to generate microarrays. Information from within the genome as well as comparisons to databases and experimental data have been used to annotate the genome of Saccharomyces cerevisiae, the first eukaryote to be sequenced (Goffeau et al., 1996) and the one for which annotation has progressed furthest (http://www.yeastgenome.org/). Nevertheless, the gene count between different methods of analysis has varied considerably (e.g., Malpertuy et al., 2000). Recently, it was shown for several q Supplementary data associated with this article can be found, in the online version, at doi: 10.1016/j.fgb.2003.10.005. * Corrresponding author. Fax +49-234-321-4184. E-mail address: [email protected] (U. K€ uck). 1 Abbreviations used: EST, expressed sequence tag; ORF, open reading frame; indel, site corresponding to an insertion or deletion. 1087-1845/$ - see front matter Ó 2003 Elsevier Inc. All rights reserved. doi:10.1016/j.fgb.2003.10.005 Fungal Genetics and Biology 41 (2004) 285–292 www.elsevier.com/locate/yfgbi Fungal Genetics and Biology 41 (2004) 285–292 Fungal Genetics and Biology 41 (2004) 285–292

Welcome message from author
This document is posted to help you gain knowledge. Please leave a comment to let me know what you think about it! Share it to your friends and learn new things together.
Transcript

Fungal Genetics and Biology 41 (2004) 285–292
www.elsevier.com/locate/yfgbi
Fungal Genetics and Biology 41 (2004) 285–292Fungal Genetics and Biology 41 (2004) 285–292
Commentary
Comparative sequence analysis of Sordaria macrosporaand Neurospora crassa as a means to improve genome annotationq
Minou Nowrousian, Christian W€urtz, Stefanie P€oggeler, and Ulrich K€uck*
Lehrstuhl fur Allgemeine und Molekulare Botanik, Ruhr-Universitat Bochum, 44780, Bochum, Germany
Received 15 August 2003; accepted 22 October 2003
Abstract
One of the most challenging parts of large scale sequencing projects is the identification of functional elements encoded in a
genome. Recently, studies of genomes of up to six different Saccharomyces species have demonstrated that a comparative analysis of
genome sequences from closely related species is a powerful approach to identify open reading frames and other functional regions
within genomes [Science 301 (2003) 71, Nature 423 (2003) 241]. Here, we present a comparison of selected sequences from Sordaria
macrospora to their corresponding Neurospora crassa orthologous regions. Our analysis indicates that due to the high degree of
sequence similarity and conservation of overall genomic organization, S. macrospora sequence information can be used to simplify
the annotation of the N. crassa genome.
� 2003 Elsevier Inc. All rights reserved.
Keywords: Sordaria macrospora; Neurospora crassa; Filamentous fungi; Genome annotation; Exon–intron boundaries; Synteny; Comparative
genomics
1. Introduction
Over the last few years, several fungal genomes
have been fully sequenced, and even more will be se-
quenced in the near future (Galagan et al., 2003; Goffeau
et al., 1996, http://www-genome.wi.mit.edu/seq/fgi/
candidates.html, http://www.ncbi.nlm.nih.gov/cgi-bin/
Entrez/map00?taxid¼ 5085). However, the most chal-lenging part in genome analysis today is usually not
generating the sequence but annotating it. Features like
open reading frames, exon–intron boundaries and reg-
ulatory elements within a genome are often difficult to
predict correctly from genomic sequence information
alone. Identification of transcribed regions can be im-
proved if EST1 sequences are available, but EST data-
bases tend not to contain rarely transcribed genes, sooften no cDNA sequence information is available.
qSupplementary data associated with this article can be found, in
the online version, at doi: 10.1016/j.fgb.2003.10.005.* Corrresponding author. Fax +49-234-321-4184.
E-mail address: [email protected] (U. K€uck).1 Abbreviations used: EST, expressed sequence tag; ORF, open
reading frame; indel, site corresponding to an insertion or deletion.
1087-1845/$ - see front matter � 2003 Elsevier Inc. All rights reserved.
doi:10.1016/j.fgb.2003.10.005
Comparison with public databases is an additional
means of identifying open reading frames, but for many
genes, no putative homologs are available in the data-
bases; e.g., many fungal EST sequencing projects have
found that only less than or�50% of the ESTs generated
have already characterized homologs among other or-
ganisms (e.g., Nelson et al., 1997; Prade et al., 2001; Zhu
et al., 2001). Microarray data or other large scale tran-scriptome data can help to discover genes that are reg-
ulated similarly at the transcriptional level and therefore
might contain common promoter elements (e.g., Hughes
et al., 2000; Ren et al., 2000; Roth et al., 1998), but this
approach to identify regulatory elements is labor-inten-
sive and requires an EST library or annotation of open
reading frames as a prerequisite to generate microarrays.
Information from within the genome as well ascomparisons to databases and experimental data have
been used to annotate the genome of Saccharomyces
cerevisiae, the first eukaryote to be sequenced (Goffeau
et al., 1996) and the one for which annotation has
progressed furthest (http://www.yeastgenome.org/).
Nevertheless, the gene count between different methods
of analysis has varied considerably (e.g., Malpertuy
et al., 2000). Recently, it was shown for several
286 M. Nowrousian et al. / Fungal Genetics and Biology 41 (2004) 285–292
Saccharomyces species that comparison of closely relatedwhole genome sequences can be of immense value for the
annotation, because it greatly increases the signal-to-
noise ratio for the discovery of open reading frames,
introns, and regulatory sequences (Cliften et al., 2003;
Kellis et al., 2003). Sequences that are of functional
significance are usually more conserved between species,
and therefore lack of sequence conservation within pre-
dicted features might indicate that the prediction doesnot necessarily reflect reality. On the other hand, short
open reading frames can be identified more readily be-
cause they are marked by conserved ‘‘islands’’ within less
conserved sequence surroundings. Short ORFs are
sometimes overlooked during the annotation of a single
genome due to the fact that thresholds for defining
the length of open reading frames often exclude them.
The comparison of the S. cerevisiae genome to that ofthree other ascomycetous yeasts indicated that the total
number of genes might be �5500. The authors identified
43 previously undetected small open reading frames,
whereas �500 predicted open reading frames most likely
do not represent functional genes (Kellis et al., 2003).
The comparison of yeast species exemplifies the use-
fulness of sequencing closely related species for im-
proving annotation. The second fungal genome to becompletely sequenced and for which annotation has al-
ready progressed significantly is that of Neurospora
crassa (Galagan et al., 2003). No species closely related
to N. crassa has been fully sequenced and annotated yet.
Here, we demonstrate that, similarly to the recent
analyses of closely related yeast genomes, genomic se-
quence information from the closely related filamentous
ascomycete Sordaria macrospora can be used to improveannotation of the N. crassa genome.
2. Sequence identitiy between S. macrospora and N.crassa ORFs
The ascomycete S. macrospora is a close relative of N.
crassa, both of which belong to the family of Sordaria-ceae (order Sphaeriales). Both are characterized by
black perithecia of similar size which contain eight-
spored asci; but in contrast to N. crassa, S. macrospora
does not produce any conidiospores and is homothallic
(self-fertile) which means that no mating partner is
needed to develop mature fruiting bodies. Therefore,
mutants with defects in the sexual cycle can easily be
isolated and serve as recipient strains for transforma-tions to restore the wild type phenotype. Consequently,
S. macrospora has been used as a model system to study
fruiting body development, and several genes essential
for perithecia formation as well as components of the
mating type, pheromone, and pheromone receptor
pathways have been isolated (Masloff et al., 1999;
Nowrousian et al., 1999; P€oggeler, 2000; P€oggeler and
K€uck, 2000, 2001; P€oggeler et al., 1997). S. macrospora
has also been used to analyze chromosome pairing and
recombination during meiosis. This has involved ex-
tensive cytological studies as well as work on the mo-
lecular basis of meiotic events (Le Chevanton and
Zickler, 1991; Thompson-Coffe et al., 1999; van Heemst
et al., 1999; Zickler et al., 1985, 1992).
Sequence analyses of S. macrospora genes isolated so
far have already indicated that homology between S.
macrospora and N. crassa is not restricted to exons but
extends to intronic and other non-coding sequences.
Here, we present a comparison of 85 genes comprising
186 full or partial exon sequences and 98 intron se-
quences from S. macrospora with their N. crassa ho-
mologs (for a complete list of genes used in for this
comparison, see Table 1 supplementary material).
N. crassa sequence information was taken from theNeurospora genome at http://www-genome.wi.mit.edu/
annotation/fungi/neurospora/ (Galagan et al., 2003).
S. macrospora sequences used for this comparison are
from previously published genes, or were isolated in our
laboratory either by complementation of mutants or by
PCR from S. macrospora genomic DNA using oligo-
nucleotide primers derived from N. crassa sequences.
Sequence comparisons were performed using LALIGN(Huang and Miller, 1991) at http://www.ch.embnet.org/
software/LALIGN_form.html.
As expected, sequence identities were highest within
exons with an average of 89.5% nucleic acid identity; but
even within introns, an average sequence identity of
70.4% was found. As mentioned above, several of the
genes used in this analysis were isolated from S. mac-
rospora based on their sequence homology to N. crassa
or other filamentous fungi. To exclude the possibility
that this has caused a bias for genes with a higher than
average sequence similarity to N. crassa, we performed a
separate comparison with four genes that were isolated
from S. macrospora by mutant complementation. These
genes comprise �11 kb of exon and 0.5 kb of intron se-
quences (acl1, pro1, pro11, and spo76, see Table 1 in the
supplementary material). The results were similar tothose derived from the complete dataset; the average
exon sequence identity was 89.5%, and nucleic acid
identity for introns was 70.2%.
Similarly to the yeasts (Kellis et al., 2003), exon
boundaries for the genes used in this comparison were
usually marked by an increase in sequence identity and
the absence of indels. Intron lengths in both fungi are
similar, ranging from 47 to 545 bp in S. macrospora and45–542 bp in N. crassa for the introns compared in this
study. Average lengths were 106 nt for S. macrospora
and 101 nt for N. crassa introns, which is a bit lower
than the average intron size of 134 nt that was calculated
for the N. crassa genome (Galagan et al., 2003). As was
reported previously (P€oggeler, 1997), consensus se-
quences for intron donor, acceptor, and branch site are

Fig. 1. Comparison of intron 3 and adjacent regions of the S. macrospora (S.m.) and N. crassa (N.c.) pro11 genes. Intron sequences are indicated in
small case and are underlined. A region that is annotated as part of intron 3 in N. crassa, but most likely is part of exon 4 is shaded in gray. For
further information see text.
30.0
40.0
50.0
60.0
70.0
80.0
90.0
75.0 80.0 85.0 90.0 95.0 100.0% identity exons
% id
entit
y in
tron
s
Fig. 2. Conservation of introns is not linked to conservation of exonic
sequences. For 57 genes, sequence identity of exons was calculated
separately from that of the introns for each gene. A table with the
genes used in this comparison can be found in the supplementary
material (Table 2). The graph depicts the nucleic acid identity of in-
tronic sequences (y-axis) versus exonic sequences (x-axis) for the 57
M. Nowrousian et al. / Fungal Genetics and Biology 41 (2004) 285–292 287
almost identical in S. macrospora and N. crassa (data
not shown). Intron positions within open reading frames
in S. macrospora were highly conserved when compared
to N. crassa in all cases investigated. In some cases, therewere slight variations of the exact intron start or end,
but these might indicate annotation errors rather than
true biological differences. An example for this can be
seen at the 30 end of the third intron of the pro11 gene
(Fig. 1, P€oggeler and K€uck, 2003). The flanking exons
are highly similar whereas within the intron, the
homology is significantly lower and several indels
are present (Fig. 1). In the N. crassa homolog(NCU08741.1), the intron 30 end was annotated another
24 nt downstream of the predicted 30 end within S.
macrospora, but these 24 nt are 100% identical to the
corresponding S. macrospora sequence. This indicates
that they might constitute exonic sequence rather than
intron sequence. Sequencing of the S. macrospora pro11
cDNA confirmed the exon/intron boundary at the po-
sition indicated in Fig. 1.
genes. Black triangles indicate genes for which only partial S. mac-
rospora sequence information was available for comparison. Open
squares indicate complete genes used for this comparison.
3. Conservation of introns is not linked to conservation ofexon sequences
As described before, introns and exons of a given
gene are colinear and highly similar in S. macrospora
and N. crassa. An interesting question that can be askedin a case like this is whether intron and exon conserva-
tion are correlated. In other words, would a high degree
of exon similarity between two orthologous genes also
mean a high degree of intron similarity? To answer this
question, average exon and intron similarities were cal-
culated separately for 57 genes that have introns (Table
2 in the supplementary material). Fig. 2 shows a graph
of exon identities and corresponding intron identities. If
there were a simple correlation between exon and intron
identity, one would expect a linear distribution. How-
ever, as indicated in Fig. 2, this is not the case. Nor
could we identify any other statistically significant cor-
relation between intron and exon identities (data not
shown). Thus, within the genes included in our study, it
seems that there is no apparent correlation between in-
tron and exon sequence identity within a given gene.Usually, exons are under strong selective pressure to
preserve their coding capacities, whereas introns simply
have to retain their splicing signal sequences; thus, this
finding might not be unexpected. However, comparing
288 M. Nowrousian et al. / Fungal Genetics and Biology 41 (2004) 285–292
intron sequence identities might be a means of identi-fying regions within a genome that accumulate muta-
tions more readily than others. This might help to
identify regions which are more susceptible to mutagenic
influences or are less efficiently repaired by DNA repair
mechanisms. Analyses like this might even be more re-
vealing in genomes with higher intron content, e.g., the
human genome.
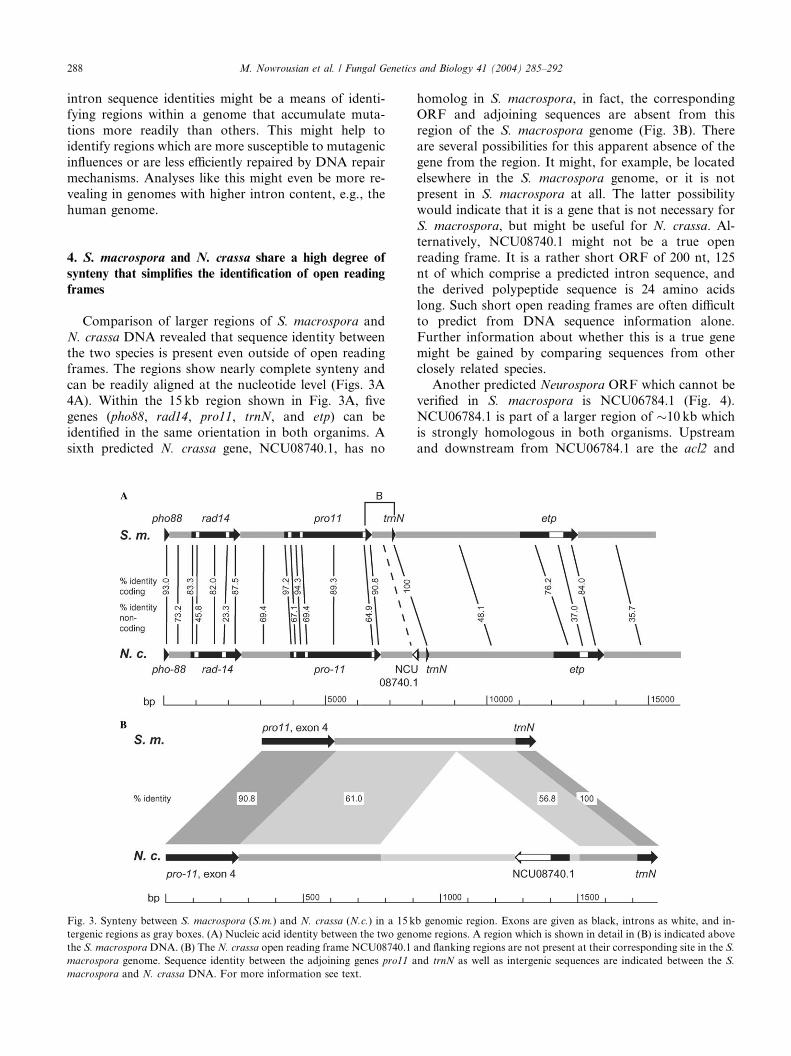
4. S. macrospora and N. crassa share a high degree of
synteny that simplifies the identification of open reading
frames
Comparison of larger regions of S. macrospora and
N. crassa DNA revealed that sequence identity between
the two species is present even outside of open readingframes. The regions show nearly complete synteny and
can be readily aligned at the nucleotide level (Figs. 3A
4A). Within the 15 kb region shown in Fig. 3A, five
genes (pho88, rad14, pro11, trnN, and etp) can be
identified in the same orientation in both organims. A
sixth predicted N. crassa gene, NCU08740.1, has no
Fig. 3. Synteny between S. macrospora (S.m.) and N. crassa (N.c.) in a 15 k
tergenic regions as gray boxes. (A) Nucleic acid identity between the two geno
the S. macrosporaDNA. (B) The N. crassa open reading frame NCU08740.1
macrospora genome. Sequence identity between the adjoining genes pro11 a
macrospora and N. crassa DNA. For more information see text.
homolog in S. macrospora, in fact, the correspondingORF and adjoining sequences are absent from this
region of the S. macrospora genome (Fig. 3B). There
are several possibilities for this apparent absence of the
gene from the region. It might, for example, be located
elsewhere in the S. macrospora genome, or it is not
present in S. macrospora at all. The latter possibility
would indicate that it is a gene that is not necessary for
S. macrospora, but might be useful for N. crassa. Al-ternatively, NCU08740.1 might not be a true open
reading frame. It is a rather short ORF of 200 nt, 125
nt of which comprise a predicted intron sequence, and
the derived polypeptide sequence is 24 amino acids
long. Such short open reading frames are often difficult
to predict from DNA sequence information alone.
Further information about whether this is a true gene
might be gained by comparing sequences from otherclosely related species.
Another predicted Neurospora ORF which cannot be
verified in S. macrospora is NCU06784.1 (Fig. 4).
NCU06784.1 is part of a larger region of �10 kb which
is strongly homologous in both organisms. Upstream
and downstream from NCU06784.1 are the acl2 and
b genomic region. Exons are given as black, introns as white, and in-
me regions. A region which is shown in detail in (B) is indicated above
and flanking regions are not present at their corresponding site in the S.
nd trnN as well as intergenic sequences are indicated between the S.

Fig. 4. Comparison of the acl-gene containing regions from S. macrospora (S.m.) and N. crassa (N.c.). Exons are given as black, introns as white, and
intergenic regions as light gray boxes. Exons of the open reading frame NCU06784.1 for which no S. macrospora homologue can be identified are
given in dark gray. (A) A syntenic region of about 10 kb contains the acl1 and acl2 genes (Nowrousian et al., 2000). Nucleic acid identity is indicated
between the two sequences. A part which is shown in detail in (B) is indicated above the S. macrospora DNA. (B) Intergenic region between acl1 and
acl2. The upper part of (B) shows sequence identities determined separately for putative exons, the intron, and upstream and downstream regions of
N. crassa ORF NCU6784.1 to their S. macrospora counterparts. The lower part of (B) gives sequence identity between S. macrospora and N. crassa in
various parts of the intergenic regions as determined by local alignment using LALIGN (Huang and Miller, 1991). (C) Sequence alignment of N.
crassa ORF NCU06784.1 and 100 nt of upstream and downstream regions to its corresponding S. macrospora counterpart. Putative translation start
and stop codons are given in bold, intronic sequences in small case. Indels within the putative ORF that do not contain a multiple of three nu-
cleotides, and therefore would result in frame-shift mutations, are shaded in gray.
M. Nowrousian et al. / Fungal Genetics and Biology 41 (2004) 285–292 289
acl1 genes, respectively. In this case, a region with high
homology to NCU06784.1 is present in S. macrospora,
but no bona fide open reading frame can be identified.At the position of the ATG in Neurospora is a GTG in
Sordaria. GTG as a start codon has been reported
within filamentous fungi (e.g., Guti�errez et al., 1991),
but several indels that are not multiples of three inter-
rupt the S. macrospora open reading frame (Fig. 4C)
which makes it unlikely that this is a real gene in S.
macrospora. Additional hints that NCU06784.1 is not a
true ORF come from the fact that the presumptivecoding and non-coding regions in this case do not sig-
nificantly differ in their degree of homology, as is the
case for other genes compared. In fact, within the 3 kb
intergenic region between acl1 and acl2, there are several
regions of equally high or higher nucleic acid identity
than the predicted ORF NCU06784.1 (Fig. 4B). As acl1
and acl2 are divergently transcribed, the 3 kb intergenic
region most likely contains promoter sequences whichregulate the expression of both genes. The high degree of
overall conservation of this region might indicate regu-
latory mechanisms common to S. macrospora and
N. crassa instead of marking an open reading frame.
One way to shed light on questions like this would beto include sequence information from further close
relatives of S. macrospora and N. crassa into the
analysis. Especially information about the absence or
presence of indels as well as the degree of conservation
of exons within a less conserved sequence environ-
ment might help to identify the most likely open
reading frames from genomic DNA sequence informa-
tion alone.
5. Which additional fungal genomes might be sequenced
for a comparative genomics approach?
Sequencing and annotation of the N. crassa genome
has already greatly advanced our knowledge of fungal
genome organization (Galagan et al., 2003). Annotationof genome sequences from closely related species will be
much easier with the N. crassa genome present, but also

290 M. Nowrousian et al. / Fungal Genetics and Biology 41 (2004) 285–292
the N. crassa annotation itself will become much morereliable with the possibility of comparing two or more
genomes. A prerequisite for this is that the compared
sequences are similar enough to show a sufficient degree
of synteny. The comparisons presented here indicate
that the S. macrospora genome is eminently suitable for
this purpose, because it is similar enough to be readily
aligned at the nucleotide level even outside of coding
regions, but has aquired a sufficient degree of dissimi-larity especially in non-coding regions to provide an
adequate signal-to-noise enrichment for distinguishing
functional from non-functional sites. Another point of
interest might be the fact that in S. macrospora, no in-
dication of RIP (repeat-induced point mutation) has
been found yet (Le Chevanton et al., 1989). RIP has
originally been discovered in N. crassa where it inacti-
vates duplicated sequences during the sexual phase ofthe life cycle (Selker et al., 1987). It was also shown to
exist in a milder form in Podospora anserina (Graia
et al., 2001; Hamann et al., 2000) and Magnaporthe
grisea (Ikeda et al., 2002). RIP is thought to be re-
sponsible for the surprisingly low number of multigene
families and duplicated sequences observed in N. crassa
(Galagan et al., 2003). Therefore, a comparison of the
N. crassa genome with that of S. macrospora will bemost interesting with respect to the divergent evolution
of two closely related genomes one of which displays a
very active form of RIP while the other does not.
However, as has been demonstrated for several Sac-
charomyces species, comparative genomics gains power
with the number of species investigated (Cliften et al.,
2003; Kellis et al., 2003). Which additional filamentous
fungi might be suitable candidates for such an approach?The genomes of the pyrenomycetes P. anserina and M.
grisea are at present being sequenced and annotated. Both
species aremuchmore distant relatives toN. crassa than is
S. macrospora, and previous analyses have shown that
synteny between N. crassa and P. anserina or M. grisea,
respectively, is limited (Hamer et al., 2001; Silar et al.,
2003). In both P. anserina and M. grisea, intergenic re-
gions are not conserved even within syntenic regions.Thus, the genomes of P. anserina and M. grisea will cer-
tainly advance our knowledge of filamentous fungi�s bi-ology, but they are less suited for a comparative genomics
approach with N. crassa. In a white paper describing the
aims of the fungal genome initiative, one of the organisms
included in a list of fungi for initial sequencing is Neu-
rospora discreta (http://www-genome.wi.mit.edu/seq/fgi/
FGI_whitepaper_Feb8.pdf). Comparisons of matingtype genes as well as the gpd gene, the ITS/5.8S rRNA
region and four anonymous nuclear loci from several
Neurospora and Sordaria species indicate thatN. discreta
belongs to a group of closely related Neurospora species
including N. crassa, but is more distantly related to
N. crassa than are, for example, Neurospora tetrasperma
and Neurospora sitophila (Dettman et al., 2001, 2003;
P€oggeler, 1999; Randall and Metzenberg, 1995).Sequence similarity between the mating type and gpd
genes from N. crassa and N. discreta are between 94 and
98%, whereas between S. macrospora and the two Neu-
rospora species they lie between 78 and 90% (P€oggeler,1999). The N. discreta genome would therefore be an
obvious candidate to be included in a comparative ge-
nomics approach, but it might be advisable to obtain the
sequence from at least one additional fungus from theSordaria/Neurospora group which is less similar to N.
crassa, in order to further increase the signal-to-noise
ratio that enables the distinction between functional and
non-functional sites. Candidates might be Neurospora
pannonica or Neurospora terricola as well as Sordaria
brevicollis or Sordaria sclerogenia, all of which are less
closely related to N. crassa than N. discreta and are well
distanced from S. macrospora also (Dettman et al., 2001;P€oggeler, 1999). Both N. pannonica and N. terricola are
homothallic species, as is S. macrospora; whereas
S. sclerogenia and S. brevicollis are two heterothallic
Sordaria species. Sequencing both homo- as well as het-
erothallic species might give insights into whether the
mode of sexual differentiation shapes genome structure
and evolution outside of the mating type loci. Sequence
information from more genes will undoubtedly be nec-essary to reach a conclusion about which species might be
the most useful to sequence for a comparative genomics
approach.
6. Conclusions
Our comparison demonstrates how closely the ge-nome organization of S. macrospora resembles that of
N. crassa not only within coding but also within non-
coding regions. Obtaining additional sequence infor-
mation of S. macrospora and other closely related
species might therefore facilitate the annotation of all of
their genomes including that of N. crassa, similarly to
what was described for yeasts (Cliften et al., 2003; Kellis
et al., 2003). It will also create the possibility to studyevolution of genomes that have been separated only
recently, and therefore, in turn, might provide insight
into the molecular basis of speciation.
Acknowledgments
The authors thank Swenja Ellßel, Ingeborg Gode-hardt, and Silke Nimtz for excellent technical assistance
and Dr. Giles Duffield for critical reading of the man-
uscript. We also thank our reviewers for helpful sug-
gestions to improve the manuscript. This work was
supported by grants from the Deutsche Forschungs-
gemeinschaft (DFG) to U.K. and S.P. (SFB 480, Pro-
jects A1 and A2), and the Ruhr-Universit€at Bochum to

M. Nowrousian et al. / Fungal Genetics and Biology 41 (2004) 285–292 291
M.N. (Programm zur F€orderung des wissenschaftlichenNachwuchses).
References
Cliften, P., Sudarsanam, P., Desikan, A., Fulton, L., Fulton, B.,
Majors, J., Waterston, R., Cohen, B.A., Johnston, M., 2003.
Finding functional features in Saccharomyces genomes by phylo-
genetic footprinting. Science 301, 71–76.
Dettman, J.R., Harbinski, F.M., Taylor, J.W., 2001. Ascospore
morphology is a poor predictor of the phylogenetic relationships
of Neurospora and Gelasinospora. Fung. Genet. Biol. 34, 49–61.
Dettman, J.R., Jacobson, D.J., Taylor, J.W., 2003. A multilocus
genealogical approach to phylogenetic species recognition in the
model eukaryote Neurospora. Evolution (in press).
Galagan, J., Calvo, S., Borkovich, K., Selker, E., Read, N., Jaffe, D.,
FitzHugh, W., Ma, L., Smirnov, S., Purcell, S., Rehman, B.,
Elkins, T., Engels, R., Wang, S., Nielsen, C., Butler, J., Endrizzi,
M., Qui, D., Ianakiev, P., Bell-Pedersen, D., Nelson, M., Werner-
Washburne, M., Selitrennikoff, C., Kinsey, J., Braun, E., Zelter, A.,
Schulte, U., Kothe, G., Jedd, G., Mewes, W., Staben, C., Marcotte,
E., Greenberg, D., Roy, A., Foley, K., Naylor, J., Stange-
Thomann, N., Barrett, R., Gnerre, S., Kamal, M., Kamvysselis,
M., Mauceli, E., Bielke, C., Rudd, S., Frishman, D., Krystofova,
S., Rasmussen, C., Metzenberg, R., Perkins, D., Kroken, S.,
Cogoni, C., Macino, G., Catcheside, D., Li, W., Pratt, R., Osmani,
S., DeSouza, C., Glass, L., Orbach, M., Berglund, J., Voelker, R.,
Yarden, O., Plamann, M., Seiler, S., Dunlap, J., Radford, A.,
Aramayo, R., Natvig, D., Alex, L., Mannhaupt, G., Ebbole, D.,
Freitag, M., Paulsen, I., Sachs, M., Lander, E., Nusbaum,, C.,
Birren, B., 2003. The genome sequence of the filamentous fungus
Neurospora crassa. Nature 422, 859–868.
Goffeau, A., Barrell, B.G., Bussey, H., Davis, R.W., Dujon, B.,
Feldmann, H., Galibert, F., Hoheisel, J.D., Jacq, C., Johnston, M.,
Louis, E.J., Mewes, H.W., Murakami, Y., Philippsen, P., Tettelin,
H., Oliver, S.G., 1996. Life with 6000 genes. Science 274, 546–567.
Graia, F., Lespinet, O., Rimbault, B., Dequard-Chablat, M., Coppin,
E., Picard, M., 2001. Genome quality control: RIP (repeat-induced
point mutation) comes to Podospora. Mol. Microbiol. 40, 586–595.
Guti�errez, S., D�ıez, B., Montenegro, E., Mart�ın, J.F., 1991. Charac-
terization of the Cephalosporium acremonium pcbAB gene encoding
alpha-aminoadipyl-cysteinyl-valine synthetase, a large multido-
main peptide synthetase: linkage to the pcbC gene and evidence
of multiple functional domains. J. Bacteriol. 173, 2354–2365.
Hamann, A., Feller, F., Osiewacz, H.D., 2000. The degenerate DNA
transposon Pat and repeat-induced point mutation (RIP) in
Podospora anserina. Mol. Gen. Genet. 263, 1061–1069.
Hamer, L., Pan, H., Adachi, K., Orbach, M.J., Page, A., Ramamur-
thy, L., Woessner, J.P., 2001. Regions of microsynteny in Magna-
porthe grisea and Neurospora crassa. Fung. Genet. Biol. 33,
137–143.
Huang, X., Miller, M., 1991. A time-efficient, linear-space local
similarity algorithm. Adv. Appl. Math. 12, 337–357.
Hughes, J.D., Estep, P.W., Tavazoie, S., Church, G.M., 2000.
Computational identification of cis-regulatory elements associated
with groups of functionally related genes in Saccharomyces
cerevisiae. J. Mol. Biol. 296, 1205–1214.
Ikeda, K., Nakayashiki, H., Kataoka, T., Tamba, H., Hashimoto, Y.,
Tosa, Y., Mayama, S., 2002. Repeat-induced point mutation (RIP)
in Magnaporthe grisea: implications for its sexual cycle in the
natural field context. Mol. Microbiol. 45, 1355–1364.
Kellis, M., Patterson, N., Endrizzi, M., Birren, B., Lander, E., 2003.
Sequencing and comparison of yeast species to identify genes and
regulatory elements. Nature 423, 241–254.
Le Chevanton, L., Leblon, G., Lebilcot, S., 1989. Duplications created
by transformation in Sordaria macrospora are not inactivated
during meiosis. Mol. Gen. Genet. 218, 390–396.
Le Chevanton, L., Zickler, D., 1991. Sordaria macrospora: the
transition to the age of gene manipulation. In: Bennett, J.W.,
Lasure, L.L. (Eds.), More gene manipulations in fungi. Academic
Press, San Diego, pp. 291–303.
Malpertuy, A., Tekaia, F., Casar�egola, S., Aigle, M., Artiguenave, F.,
Blandin, G., Bolotin-Fukuhara, M., Bon, E., Brottier, P., de
Montigny, J., Durrens, P., Gaillardin, C., L�epingle, A., Llorente,
B., Neuv�eglise, C., Ozier-Kalogeropoulos, O., Potier, S., Saurin,
W., Toffano-Nioche, C., W�esolowski-Louvel, M., Wincker, P.,
Weissenbach, J., Souciet,, J.L., Dujon, B., 2000. Genomic explo-
ration of the hemiascomycetous yeasts: 19. Ascomycetes-specific
genes.. FEBS Lett. 487, 113–121.
Masloff, S., P€oggeler, S., K€uck, U., 1999. The pro1+ gene from
Sordaria macrospora encodes a C6 zinc finger transcription factor
required for fruiting body development. Genetics 152, 191–199.
Nelson, M.A., Kang, S., Braun, E.L., Crawford, M.E., Dolan, P.L.,
Leonard, P.M., Mitchell, J., Armijo, A.M., Bean, L., Blueyes, E.,
Cushing, T., Errett, A., Fleharty, M., Gorman, M., Judson, K.,
Miller, R., Ortega, J., Pavlova, I., Perea, J., Todisco, S., Trujillo,
R., Valentine, J., Wells, A., Werner-Washburn, M., Yazzie, S.,
Natvig, D.O., 1997. Expressed sequences from conidial, mycelial,
and sexual stages of Neurospora crassa. Fung. Genet. Biol. 21, 348–
363.
Nowrousian, M., K€uck, U., Loser, K., Weltring, K., 2000. The fungal
acl1 and acl2 genes encode two polypeptides with homology to the
N- and C-terminal parts of the animal ATP citrate lyase polypep-
tide. Curr. Genet. 37, 189–193.
Nowrousian, M., Masloff, S., P€oggeler, S., K€uck, U., 1999. Cell
differentiation during sexual development of the fungus Sordaria
macrospora requires ATP citrate lyase activity. Mol. Cell. Biol. 19,
450–460.
P€oggeler, S., 1997. Sequence characteristics within nuclear genes from
Sordaria macrospora. Fung. Genet. Newslett. 44, 41–44.
P€oggeler, S., 1999. Phylogenetic relationships between mating-type
sequences from homothallic and heterothallic ascomycetes. Curr.
Genet. 36, 222–231.
P€oggeler, S., 2000. Two pheromone precursor genes are transcription-
ally expressed in the homothallic ascomycete Sordaria macrospora.
Curr. Genet. 37, 403–411.
P€oggeler, S., K€uck, U., 2000. Comparative analysis of the mating-type
loci from Neurospora crassa and Sordaria macrospora: identifica-
tion of novel transcribed ORFs. Mol. Gen. Genet. 263, 292–301.
P€oggeler, S., K€uck, U., 2001. Identification of transcriptionally
expressed pheromone receptor genes in filamentous ascomycetes.
Gene 280, 9–17.
P€oggeler, S., K€uck, U., 2003. A WD40-repeat protein regulates fungal
cell differentiation and can functionally be substituted by striatin, a
mammalian homologue. Eukaryot. Cell, in press.
P€oggeler, S., Risch, S., K€uck, U., Osiewacz, H.D., 1997. Mating-type
genes from the homothallic fungus Sordaria macrospora are
functionally expressed in a heterothallic ascomycete. Genetics
147, 567–580.
Prade, R.A., Ayoubi, P., Krishnan, S., Macwana, S., Russell, H., 2001.
Accumulation of stress and inducer-dependent plant-cell-wall-
degrading enzymes during asexual development in Aspergillus
nidulans. Genetics 157, 957–967.
Randall, T.A., Metzenberg, R.L., 1995. Species-specific and mating
type-specific DNA regions adjacent to mating type idiomorphs in
the genus Neurospora. Genetics 141, 119–136.
Ren, B., Robert, F., Wyrick, J.J., Aparicio, O., Jennings, E.G., Simon,
I., Zeitlinger, J., Schreiber, J., Hannett, N., Kanin, E., Volkert,
T.L., Wilson, C.J., Bell, S.P., Young, R.A., 2000. Genome-wide
location and function of DNA binding proteins. Science 290, 2306–
2309.

292 M. Nowrousian et al. / Fungal Genetics and Biology 41 (2004) 285–292
Roth, F.P., Hughes, J.D., Estep, P.W., Church, G.M., 1998. Finding
DNA regulatory motifs within unaligned noncoding sequences
clustered by whole-genome mRNA quantitation. Nat. Biotechnol.
16, 939–945.
Selker, E.U., Cambareri, E.B., Jensen, B.C., Haack, K.R., 1987.
Rearrangement of duplicated DNA in specialized cells of Neuros-
pora. Cell 51, 741–752.
Silar, P., Barreau, C., Debuchy, R., Kicka, S., Turcq, B., Sainsard-
Chanet, A., Sellem, C.H., Billault, A., Cattolico, L., Duprat, S.,
Weissenbach, J., 2003. Characterization of the genomic organiza-
tion of the region bordering the centromere of chromosome V of
Podospora anserina by direct sequencing. Fung. Genet. Biol. 39,
250–263.
Thompson-Coffe, C., Borioli, G., Zickler, D., Rosa, A., 1999. Pyruvate
decarboxylase filaments are associated with the cortical cytoskel-
eton of asci and spores over the sexual cycle of filamentous
ascomycetes. Fung. Genet. Biol. 26, 71–80.
van Heemst, D., James, F., P€oggeler, S., Berteaux-Lecellier, V.,
Zickler, D., 1999. Spo76p is a conserved chromosome protein that
links the mitotic and meiotic programs morphogenesis. Cell, 261–
271.
Zhu, H., Nowrousian, M., Kupfer, D., Colot, H.V., Berrocal-Tito, G.,
Lai, H., Bell-Pedersen, D., Roe, B.A., Loros, J.J., Dunlap, J.C.,
2001. Analysis of expressed sequence tags from two starvation,
time of day-specific libraries of Neurospora crassa reveals novel
clock-controlled genes. Genetics 157, 1057–1065.
Zickler, D., de Lares, L., Moreau, P., Leblon, G., 1985. Defective
pairing and synaptonemal complex formation in a Sordaria mutant
(spo44) with a translocated segment of the nucleolar organizer.
Chromosoma 92, 37–47.
Zickler, D., Moreau, P., Huynh, A., Slezec, A., 1992. Correlation
between pairing initiation sites, recombination nodules and
meiotic recombination in Sordaria macrospora. Genetics 132,
135–148.
Related Documents