Comparative proteomics and transcriptomics analyses of livers from two different Bos taurus breeds: “Chianina and Holstein Friesian” Anna Maria Timperio a, ⁎ , Angelo D'Alessandro a , Lorraine Pariset b , Gian Maria D'Amici a , Alessio Valentini b , Lello Zolla a a Dipartimento Scienze Ambientali Università “La Tuscia” Viterbo, Italy b Dipartimento Produzione Animale Università “La Tuscia” Viterbo, Italy ARTICLE INFO ABSTRACT Article history: Received 28 July 2009 Accepted 16 September 2009 The Holstein Friesian and Chianina cattle breeds are representative of extreme selection for milk and meat traits, respectively, with significant changes in metabolism resulting from human selection over the past centuries. In the present study, we wanted to assess whether selection for different purposes has had a measurable effect on liver metabolism through a comparison of the protein and gene expression profiles of the two breeds. We applied 2-DE in order to identify proteins which were differentially expressed in the livers of the two breeds and relate them to different liver functions. We expected to find that only a small number of proteins would be differentially expressed, due to the relatively short phylogenetic distance between these cattle breeds. Nonetheless, thirty nine differentially- expressed proteins were characterized between Chianina and Holstein Friesian, out of a total of 560 ± 57 spots that matched. Microarray analyses evidenced the differential expression of 167 genes (148 for the Holstein Friesian and 19 for the Chianina). Despite being closely related at the genetic level, the disparity of the proteomic and transcriptomic profiles of these two breeds allows us to perform pathway analysis thus to pinpoint proteins whose expression might render the latter capable of greater milk production, or proteins involved in altered thermoregulatory ability or hormone production. On the other hand, we found proteins and gene transcripts in Chianina, not expressed in Holstein, which, upon interaction pathway analysis, were mainly involved in anabolic pathways. In brief, our integrated study provides molecular evidences to support the physiological differences between Holstein and Chianina cattle breeds. © 2009 Elsevier B.V. All rights reserved. Keywords: Holstein Friesian Chianina Proteomics Liver Microarray Pathway analysis 1. Introduction There is a huge amount of work currently underway on the human proteome, but little attention has been given to most animals of importance to humans. However, the importance of Bos taurus for the entire agricultural economy has prompted investigations into the fundamental mechanisms controlling animal health and productivity, including genetic analysis, JOURNAL OF PROTEOMICS 73 (2009) 309 – 322 ⁎ Corresponding author. Tel.: +39 0761357630; fax: +39 0761357179. E-mail address: [email protected] (A.M. Timperio). 1874-3919/$ – see front matter © 2009 Elsevier B.V. All rights reserved. doi:10.1016/j.jprot.2009.09.015 available at www.sciencedirect.com www.elsevier.com/locate/jprot

Welcome message from author
This document is posted to help you gain knowledge. Please leave a comment to let me know what you think about it! Share it to your friends and learn new things together.
Transcript
J O U R N A L O F P R O T E O M I C S 7 3 ( 2 0 0 9 ) 3 0 9 – 3 2 2
ava i l ab l e a t www.sc i enced i r ec t . com
www.e l sev i e r . com/ loca te / j p ro t
Comparative proteomics and transcriptomics analyses oflivers from two different Bos taurus breeds: “Chianina andHolstein Friesian”
Anna Maria Timperioa,⁎, Angelo D'Alessandroa, Lorraine Parisetb, Gian Maria D'Amicia,Alessio Valentinib, Lello Zollaa
aDipartimento Scienze Ambientali Università “La Tuscia” Viterbo, ItalybDipartimento Produzione Animale Università “La Tuscia” Viterbo, Italy
A R T I C L E I N F O
⁎ Corresponding author. Tel.: +39 0761357630;E-mail address: [email protected] (A.M. T
1874-3919/$ – see front matter © 2009 Elsevidoi:10.1016/j.jprot.2009.09.015
A B S T R A C T
Article history:Received 28 July 2009Accepted 16 September 2009
The Holstein Friesian and Chianina cattle breeds are representative of extreme selection formilk and meat traits, respectively, with significant changes in metabolism resulting fromhuman selection over the past centuries. In the present study, we wanted to assess whetherselection for different purposes has had a measurable effect on liver metabolism through acomparison of the protein and gene expression profiles of the two breeds. We applied 2-DEin order to identify proteins which were differentially expressed in the livers of the twobreeds and relate them to different liver functions. We expected to find that only a smallnumber of proteins would be differentially expressed, due to the relatively shortphylogenetic distance between these cattle breeds. Nonetheless, thirty nine differentially-expressed proteins were characterized between Chianina and Holstein Friesian, out of atotal of 560±57 spots that matched.Microarray analyses evidenced the differential expression of 167 genes (148 for the HolsteinFriesian and 19 for the Chianina). Despite being closely related at the genetic level, thedisparity of the proteomic and transcriptomic profiles of these two breeds allows us toperform pathway analysis thus to pinpoint proteins whose expression might render thelatter capable of greater milk production, or proteins involved in altered thermoregulatoryability or hormone production. On the other hand, we found proteins and gene transcripts inChianina, not expressed in Holstein, which, upon interaction pathway analysis, weremainly involved in anabolic pathways. In brief, our integrated study provides molecularevidences to support the physiological differences between Holstein and Chianina cattlebreeds.
© 2009 Elsevier B.V. All rights reserved.
Keywords:Holstein FriesianChianinaProteomicsLiverMicroarrayPathway analysis
1. Introduction
There is a huge amount of work currently underway on thehuman proteome, but little attention has been given to most
fax: +39 0761357179.imperio).
er B.V. All rights reserved
animals of importance to humans. However, the importanceof Bos taurus for the entire agricultural economy has promptedinvestigations into the fundamental mechanisms controllinganimal health and productivity, including genetic analysis,
.
310 J O U R N A L O F P R O T E O M I C S 7 3 ( 2 0 0 9 ) 3 0 9 – 3 2 2
animal physiology and susceptibility to microbial infections[1]. A combined effort of different genomic sequencingresources has now been coordinated to definitively sequenceand annotate the entire bovine genome [2]. An updated bovinegene database is now available on the web at http://www.ncbi.nlm.nih.gov/genome/guide/cow [3]. The bovine genome con-tains about 35,000 type I coding genes arranged as 30 haploidchromosomes [4]. Almost 5000 genes have been sequenced todate, which have shown a high degree of homology withhuman and mouse counterparts. As a consequence, prelim-inary genome projects on this species have already yieldedpowerful tools for the assessment of genes that specifyhereditary disorders, infectious disease resistance, breed-specific quantitative loci and phenotypes of agriculturalrelevance [5,6]. Alongside the genetic investigation, a seriesof structural studies have been performed on isolated bovineproteins, depending on their easy availability or their impor-tance as main constituents of food consumed in the humandiet. In classical veterinary studies, single enzymatic activitiesor genetic anomalies have been associated with specificbovine physiological and pathological conditions. Limitedsystematic studies have been hitherto performed to evaluatethe entire protein repertoire in bovine tissues and fluidsduring certain specific phenomena, or to detect novel markersfor specific pathologies. Meanwhile, a small number ofproteomic studies have been performed on bovine tissuesand biological fluids, mainly focused on chondrocytes, mam-mary glands, cerebrospinal fluid, pulmonary endothelial cells,seminal plasma,milk and the corneal lens [7–10]. The liver hasreceived special attention, containing as it does, enzymesinvolved in energy generation, carbohydrate, lipid, amino acidand xenobiotic metabolism, as well as proteins involved inpolypeptide synthesis, folding and cell structure. Xu andWang [11] carried out a comparative study on proteomicinvestigations of livers from ketotic cows. They found thirty-eight different proteins between groups. Our interest in liverproteins differs, in that we are exploring the potential of thistype of analysis to reveal unique profiles for different cattlebreeds, despite the relatively short phylogenetic distancebetween Holstein Friesian and Chianina [12,13]. In this way,we purported to reveal important protein actors underlyingthose extreme traits that have been selected for in thesebreeds. Hereby we will present data about separation andidentification of the differentially-expressed proteins andgene products through an integrated proteomics and tran-scriptomics (microarray) approach. Discussions will follow onhow those changes in liver metabolism may be associatedwith different biological and productive aptitudes.
2. Materials and methods
2.1. Sample collection
All animals used in this study were treated according toInternational Guiding Principles for Biomedical ResearchInvolving Animals. In a commercial dairy farm located inViterbo (Italy), we selected 12 animals (6 per breed) whichwereof the same breed, age, and body score condition. Cows werefed the same diet.
2.2. Sample preparation and 2-DE analysis
Sample preparation and solubilization was performed byslight modification of the SWISS-2D PAGE sample preparationprocedure. Frozen samples of liver tissue from the 6 Chianinaand 6 Holstein Friesian (approximately 20 mg per sample)were crushed in a mortar containing liquid nitrogen, and toremove lipids, proteins were precipitated from a desiredvolume of each sample with a cold mix of tri-n-butylphosphate/acetone/methanol (1:12:1). After incubation at4 °C for 90 min, the precipitate was pelleted by centrifugationat 2800 g, for 20 min at 4 °C. After washing with the samesolution, the pellet was air-dried and then resuspended in thefocusing solution containing 7 M urea, 2 M thiourea, 4% (w/v)CHAPS, 0.8% (w/v) pH 3–10 carrier ampholyte, 40 mM Tris,5 mM TBP, 10 mM acrylamide, 0.1 mMEDTA (pH 8.5), 2% (v/v)protease inhibitor cocktail (Sigma-Aldrich), and 2 mM PMSF.Before focusing, the sample was incubated in this solution for3 h at room temperature, under strong agitation. To preventover-alkylation, acrylamide was destroyed by adding anequimolar amount of DTE. The protein concentration of eachgroup was determined according to Bradford [14] using BSA asa standard curve. A total of 250 µL of the resulting proteinsolution was then used to rehydrate 13 cm long IPG 3-10 NL(Amersham Biosciences) for 8 h. IEF was carried out on aMultiphor II (Amersham Biosciences) with a maximumcurrent setting of 50 µA/strip at 20 °C [15]. The total producttime voltage applied was 50,000 Vh for each strip. For thesecond dimension, the IPG strips were equilibrated for 30 minin a solution containing 6 M urea, 2% (w/v) SDS, 20% (v/v)glycerol, and 375 mM Tris–HCl (pH 8.8), with gentle agitation.The IPG strips were then laid on a 5–16% T gradient SDS-PAGEgel with 0.5% (w/v) agarose in the cathode buffer (192 mMglycine, 0.1%w/v SDS and Tris to pH 8.3). The anode buffer was375 mM Tris–HCl, pH 8.8. The electrophoretic run wasperformed at a constant current (10 mA for 60 min, followedby 40 mA until the run was completed). During the whole run,the temperature was set at 13 °C. Proteins were visualized by astaining procedure: sensitive Coomassie Brilliant Blue G-250stain [16]. Improved staining of proteins in polyacrylamidegels including isoelectric focusing gels with clear backgroundat nanogram sensitivity can be achieved using CoomassieBrilliant Blue G-250 and R-250. Three technical replicates wereperformed for each of the 12 samples (6 Chianina and 6Holstein Friesian) for a total of 36 2-DE maps. There was goodreproducibility between the technical replicates of eachsample.
2.3. Image analysis
Thirty-six stained gelswere digitalized using an ImageScannerand LabScan software 3.01 (Bio-Rad Hercules, CA). The 2-DEimage analysis was carried out and spots were detected andquantified using the Progenesis SameSpots softwarev.2.0.2733.19819 software package (Nonlinear Dynamics, NewCastle UK). Each gel was analyzed for spot detection andbackground subtraction. Within-group comparison of proteinspot numbers was determined by repeatedmeasures analysis.Among-group comparisons were determined by ANOVA(Analysis of Variance) procedure in order to classify sets of

311J O U R N A L O F P R O T E O M I C S 7 3 ( 2 0 0 9 ) 3 0 9 – 3 2 2
proteins that showed a statistically significant difference witha confidence level of 0.05. Spots which were significantlydifferent between groups (Chianina vs Holstein Friesian) andnot significantly different in the three technical replicate andsix biological replicate samples were identified by qTOF-MS/MS.All statistical analyseswereperformedwith theProgenesisSameSpots software v.2.0.2733.19819 software package [17].After the background subtraction, spot detection and match,one standard gel was obtained for each group (Fig. 1), Chianinaand Holstein Friesian. These standard gels were thenmatchedto yield information about the spots of differentially expressedproteins. Differential protein expression was consideredsignificant at P<0.05 and the change in the photodensity ofprotein spots betweenChianina andHolstein Friesian sampleshad to be more than 2 fold.
2.4. In-gel digestion
Spots from 2-DE maps were carefully excised from the gel andsubjected to in-gel trypsin digestion according to Shevchenkoet al. [18] with minor modifications. The gel pieces wereswollen in a digestion buffer containing 50 mM NH4HCO3 and12.5 ng/mL trypsin (modified porcine trypsin, sequencinggrade, Promega, Madison, WI) in an ice bath. After 30 min,the supernatant was removed and discarded; then 20 mL of50 mM NH4HCO3 was added to the gel pieces, and digestionwas allowed to proceed overnight, at 37 °C. The supernatantcontaining tryptic peptides was dried by vacuum centrifuga-tion. Prior to mass spectrometric analysis, the peptidemixtures were redissolved in 10 µL of 5% FA (formic acid).
2.5. Peptide sequencing by nano-RP-HPLC-ESI-MS/MS
Mass spectrometric procedures were performed as previouslydescribed [19]. Peptide mixtures were separated using a
Fig. 1 – 2-DE of liver extracts from Chianina and Holstein FriesianSameSpots (Nonlinear Dynamics, NewCastle, UK) and representreplicate samples), upon background subtraction.
nano flow-HPLC system (Ultimate; Switchos; Famos; LCPackings, Amsterdam, The Netherlands). A sample volumeof 10 µL was loaded by the autosampler onto a homemade2 cm fused silica precolumn (75 µm I.D.; 375 µmO.D.; ResprosilC18-AQ, 3 µm, Ammerbuch-Entringen, Germany) at a flow rateof 2 µL/min. Sequential elution of peptides was accomplishedusing a flow rate of 200 nL/min and a linear gradient fromsolution A (2% acetonitrile; 0.1% formic acid) to 50% ofsolution B (98% acetonitrile; 0.1% formic acid) in 40 min overthe precolumn in-line with a homemade 10–15 cm resolvingcolumn (75 µm I.D.; 375 µm O.D.; Resprosil C18-AQ, 3 µm,Ammerbuch-Entringen).
Peptides were eluted directly into a high-capacity ion trap(model HCTplus Bruker-Daltonik, Germany). The capillaryvoltage was 1.5–2 kV, and a dry gas flow rate of 10 L/min wasused with a temperature of 200 °C. The scan range used wasfrom 300 to 1800m/z.
Protein identification was performed by searching in theNational Center for Biotechnology Information nonredundant(NCBInr) database using the MASCOT program (http://www.matrixscience.com). The following parameters were adoptedfor database searches: complete carbamidomethylation ofcysteines and partial oxidation of methionines, peptide masstolerance±1.2 Da, fragment mass tolerance±0.9 Da, missedcleavages 2. For positive identification, the score of the resultof [−10×log(P)] had to be over the significance threshold level(P, 0.05). The last update of NCBInr was on July, 2007 whenkeratins and trypsin were added as contaminants and theprogram used for converting instrument files to the mascotgeneric files for the database search was Data AnalysisVersion 3.3 (Built 146) Bruker Daltonics esquire 5.3. Eventhough high MASCOT scores are obtained with valuesbetween 40 and 80, when proteins were identified with a fewpeptides, a combination of an automated database searchand manual interpretation of peptide fragmentation spectra
breeds. Each gel image has been elaborated with Progenesisan average of 18 gels (3 technical replicate for 6 biological

312 J O U R N A L O F P R O T E O M I C S 7 3 ( 2 0 0 9 ) 3 0 9 – 3 2 2
was used to validate protein assignments. In this manualverification, the mass error, the presence of fragment ionseries, and the expected prevalence of the C-terminuscontaining (Y-type ions) in the high mass range were alltaken into account. Moreover, replicate measurements haveconfirmed the identity of these protein hits.
2.6. RNA samples
Liver samples of Frisona and Chianina individuals (see above)were collected immediately after slaughtering. Samples werepreserved in RNA later (Sigma-Aldrich) and stored at −80 °C.Total RNA of was extracted using the RNA easy midi kit(Quiagen).
2.7. Microarray experiments
Inverse transcription was realized by SuperScript IndirectcDNA Labelling System (Invitrogen). cDNAs from liver sampleswere hybridised onto bovine cDNA slides (ARK genomics, UK)containing 14250 genes spotted in replicate, using 3DNA Array900 MPX Cy3/Cy5 Kit (Genisphere), according to manufac-turer's instructions. A dye-swap experiment was performed[20], labelling each sample independently with each fluores-cent dye.
2.8. Microarray data analysis
Images were obtained by a ScanArray Lite (Perkin Elmer) laserscanner and Spotfinder software (TIGR) was used to extractfeature data from microarray fluorescence images. cDNAspots were automatically segmented, total foreground andbackground intensities of the two dyes were calculated foreach spot. We filtered for poor or saturated hybridizationsignals, then removed systematic bias in the data by applyingthe dye-swap normalization [21] that makes use of the reverselabelling in the two microarray replicates and the Lowessnormalization. To establish the significance of observedregulation for each gene, t-test with Welsh's correction wasperformed. Finally, only genes with Fold-Change over |1.5|)were considered.
2.9. Cluster analysis
Quantitative data from image analysis elaboration (ProgenesisSameSpots; Nonlinear Dynamic, New Castle UK) were used toperform a two-way hierarchical cluster analysis of the 39differentially-expressed protein spots, either up or on-regu-lated in Chianina versus Holstein Friesian liver samples(Fig. 2A). In parallel, cluster analysis was performed onmicroarray data involving 167 gene transcripts which dis-played differential expression with Fold-Change over |1.5|between liver samples from Chianina (19) and HolsteinFriesian (148) (Fig. 2B). The clustering analysis was performedwith PermutMatrix graphical interface [22], upon Z-scorenormalization of the averages of relative spot values. Pear-son's distance and Ward's algorithm were used for theanalysis. Each coloured cell represents the average of therelative spot value, according to the colour scale reported inFig. 2.
2.10. Pathway analysis
A preliminary analysis was carried out using the PathwayStudio Enterprise software Edition 5.0 (Ariadne Genomics).Differentially-expressed proteins shown in Table 1 and geneproducts from Supplementary material 1 have been used toperform the pathway analysis. Groups shown in Table 1(Chianina ON, Chianina UP, Holstein Friesian ON, HolsteinFriesianUP) and Supplementarymaterial 1 (Chianina, HolsteinFriesian) have beenmaintained. Protein and gene groups havethen been inserted in the Pathway Genomics Built Pathwayfunction to evaluate their connectivity, finding all the shortestpaths between them and finding all the entities directlyconnected to the inserted proteins. Results are shown in Fig. 3.
The networks (Figs. 4 and 5) were generated through the useof Ingenuity Pathway Analysis (Ingenuity® Systems, www.ingenuity.com) [23]. A data set containing gene identifiers andcorresponding expression values was uploaded into in theapplication, basing on either proteomics or transcriptomicsresults. Each gene identifier was mapped to its correspondinggene object in the Ingenuity Pathways Knowledge Base. Thesignificance of the association between the data set and thecanonical pathway was measured in 2 ways: 1) a ratio of thenumber of proteins from the data set that map to the pathwaydivided by the total number of proteins that map to thecanonical pathway is displayed. 2) Fischer's exact test wasused to calculate a P-value determining the probability that theassociation between the proteins in the dataset and thecanonical pathway is explained by chance alone. Proteins/gene products are represented as nodes, and the biologicalrelationship between twonodes is represented as an edge (line).All edges are supported by at least 1 reference from theliterature, from a textbook, or from canonical informationstored in the Ingenuity Pathways Knowledge Base. Nodes aredisplayed using various shapes that represent the functionalclass of the gene product. Grey nodes represent the proteins/genes from the submitted dataset which have a match in thecanonical pathway from the database, while white nodesrepresent gene products that the software attributed to thesame networks, although they were not present in thesubmitted dataset. Continuous lines (edges) represent directinteractions, while indirect ones are represented by interruptedlines. Circular linesaroundonenodedescribea feed-back loopofactivity of that node on itself (e.g. by self-modulating its activityor expression). Grey edges represent interactionswithin a singlenetwork, while orange edges cross-link nodes from multipleinteracting networks. The program could either graph singlenetworks alone or merged together to stress their interactions.
It is worthwhile to recall that the network analysis onlyrelied on those proteins and gene transcripts which weredifferentially-expressed between Chianina and Holstein Frie-sian breeds. Therefore, some proteins/gene products whichare shown in the networks as “white nodes” could be likelyindividuated during the experimental phase as well, althoughthis was not the goal of this study. Pathway analyses havebeen performed either for independent (Fig. 4B and C, Fig. 5Band C) or merged (Figs. 4A and 5A) datasets from bothtranscriptomics and proteomics approaches.
The Ingenuity PathwayAnalysis software allows performingan unbiased elaboration of the experimental data, in order to
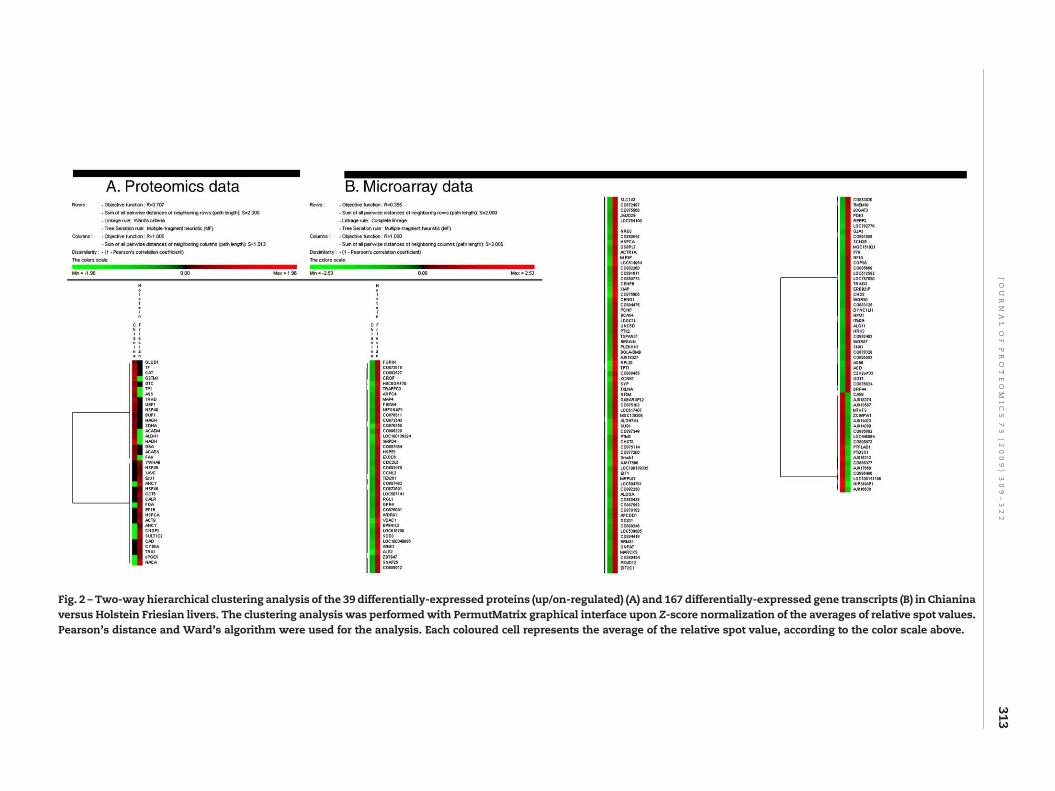
Fig. 2 – Two-way hierarchical clustering analysis of the 39 differentially-expressed proteins (up/on-regulated) (A) and 167 differentially-expressed gene transcripts (B) in Chianinaversus Holstein Friesian livers. The clustering analysis was performedwith PermutMatrix graphical interface upon Z-score normalization of the averages of relative spot values.Pearson's distance and Ward's algorithm were used for the analysis. Each coloured cell represents the average of the relative spot value, according to the color scale above.
313JO
UR
NA
LO
FPR
OT
EO
MIC
S73
(2009)
309–322

Table 1 – Proteins differentially expressed from “Chianina and Holstein Friesian” breeds.
314 J O U R N A L O F P R O T E O M I C S 7 3 ( 2 0 0 9 ) 3 0 9 – 3 2 2
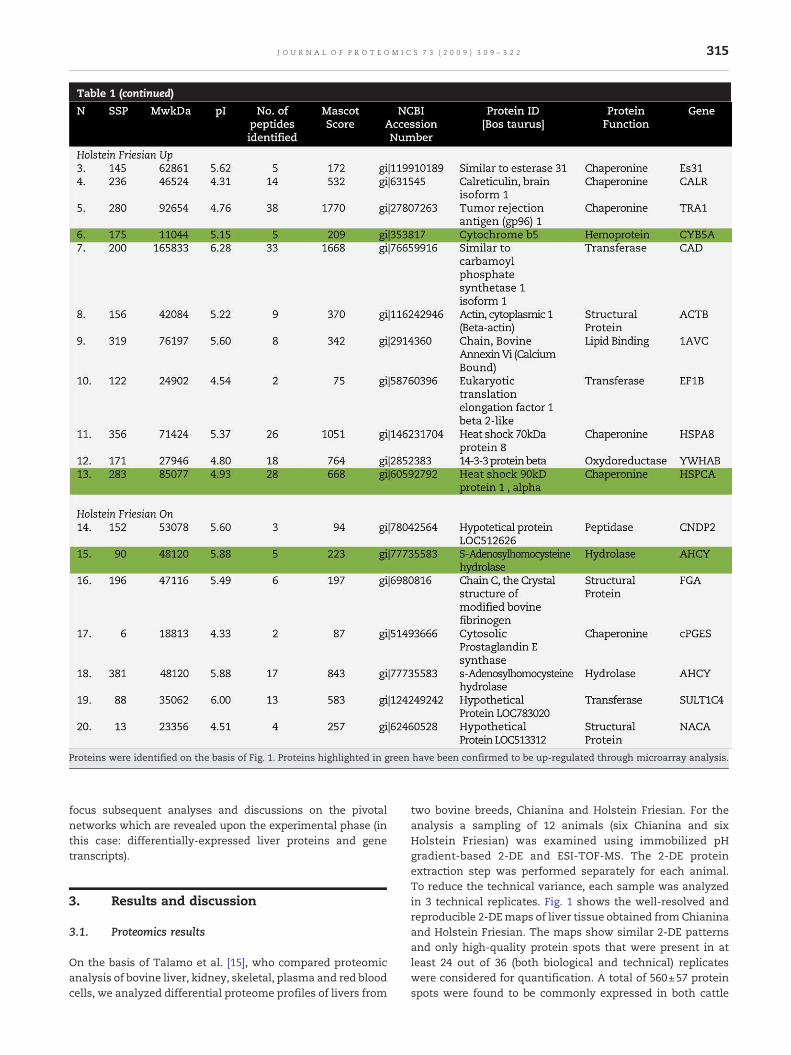
Proteins were identified on the basis of Fig. 1. Proteins highlighted in green have been confirmed to be up-regulated through microarray analysis.
Table 1 (continued)
315J O U R N A L O F P R O T E O M I C S 7 3 ( 2 0 0 9 ) 3 0 9 – 3 2 2
focus subsequent analyses and discussions on the pivotalnetworks which are revealed upon the experimental phase (inthis case: differentially-expressed liver proteins and genetranscripts).
3. Results and discussion
3.1. Proteomics results
On the basis of Talamo et al. [15], who compared proteomicanalysis of bovine liver, kidney, skeletal, plasma and red bloodcells, we analyzed differential proteome profiles of livers from
two bovine breeds, Chianina and Holstein Friesian. For theanalysis a sampling of 12 animals (six Chianina and sixHolstein Friesian) was examined using immobilized pHgradient-based 2-DE and ESI-TOF-MS. The 2-DE proteinextraction step was performed separately for each animal.To reduce the technical variance, each sample was analyzedin 3 technical replicates. Fig. 1 shows the well-resolved andreproducible 2-DEmaps of liver tissue obtained from Chianinaand Holstein Friesian. The maps show similar 2-DE patternsand only high-quality protein spots that were present in atleast 24 out of 36 (both biological and technical) replicateswere considered for quantification. A total of 560±57 proteinspots were found to be commonly expressed in both cattle

Fig. 3 – Elaboration of differentially-expressed proteins between Holstein Friesian and Chianina livers by means of PathwayStudio Enterprise software Edition 5.0 (Ariadne Genomics). The former (left side) cattle breed was characterized by an increasein chaperonines, mainly heat shock proteins, in line with its reduced thermoregulatory capacity. The latter (right side) wascharacterized by an increase in metabolic and anabolic enzymes, such as hydrolases, which are involved in fatty acidmetabolism.
316 J O U R N A L O F P R O T E O M I C S 7 3 ( 2 0 0 9 ) 3 0 9 – 3 2 2
breed liver samples, without any significant quantitativedifference. On the other hand, 39 different spots were foundto be differentially expressed between Chianina and HolsteinFriesian (Table 1).
In detail, 12 spots were found to be up-regulated inChianina (Chianina UP in Table 1), 13 spots were up-regulatedin Holstein Friesian (Friesian UP) (ratio>2), 7 spots were onlyexpressed in Chianina (Chianina ON), while 7 in HolsteinFriesian only (Friesian ON). Data were statistically elaboratedwith cluster analysis, which stressed the up/on-regulationtrend of these 39 proteins (Fig. 2). No problems of reproduc-ibility or calibration of the gels occurred during imageprocessing, thus confirming the suitability of these 2-DE gelsas reference standards. The aim of this study was to providemolecular evidences of the physiological differences in livermetabolism in these two beef (Chianina) and dairy (HolsteinFriesian) cattle breeds. Therefore, differentially-expressedrather than commonly-detected proteins intuitively reflectthe molecular basis of such differences. Hence, only modu-lated spots were cut out of the second dimension gel, digestedwith trypsin and analysed with MS tools, as described in theMaterials and methods section.
In Table 1 the identities are listed of the successfullyidentified proteins, together with the standard spot number(SSP), the identification parameters, and the indication of theirgene ontology (GO) annotation (molecular function).
3.2. Microarray results
In order to complement and validate proteomics results, weperformed a thorough microarray analysis of the same liversamples (see the Materials and methods section). Afterfiltering, 167 genes were found significantly (P<0.05) over/under expressed in the samples with Fold-Change> |1.5|(Supplementary material 1). 85% of the differentiallyexpressed genes were up-regulated in the Frisona breed.Data confirming proteomics analyses are highlighted ingreen in Table 1.
HSP90AA1, HACY and CYB5A were found to be over-expressed in Friesian, thus confirming proteomics observa-
tions. However, proteomics and transcriptomics data seldomoverlapped. This is mainly due to a series of technical caveats.
First of all, the 14 K ARK Genomics slide used did notincludemany of the genes encoding for the proteins identifiedby the proteomic analysis and thus little overlap between theobtained datasets was expected.
However, our aim was to outline a molecular trendparalleling the physiological differences between the analyzeddairy and cattle breeds. Although we could not manage to finda perfect match among proteins and gene products from theproteomics or transcriptomics approach, respectively, wepurported to outline that this integrated approach couldevidence whole pathways, which were turned on in liversfrom Chianina beef and Holstein Friesian dairy cattle breeds.To this end, data were statistically elaborated with clusteranalysis (Fig. 2) and Ingenuity Pathway Analysis was per-formed (Figs. 4C and 5C) to assess whether the differentially-expressed gene transcripts could be included in specificnetworks to be compared (andmerged) with the ones obtainedfrom the elaboration of proteomics data.
3.3. Delving into network complexity
Pathway analyses have been performed on proteomics andmicroarray data, either merged or alone, for Chianina andHolstein Friesian cattle breeds. Top 3 pathways and therelative scores for each pathway analysis are reported inTable 2.
Most of the up/on-regulated proteins (Fig. 4B) and genetranscripts (Fig. 4C) in Chianina (with respect to HolsteinFriesian) were found to be involved in anabolic and catabolicpathways. Pathway analysis of the Chianina-related differen-tially-expressed proteins and gene transcripts revealed theirconnectionwith lipidmetabolism, aminoacidmetabolism andmolecular transport (Fig. 4). Notably, although transcriptomicsand proteomics data did not match, pathway analyses ofeither differentially-expressed gene transcripts or proteins forChianina samples delivered identification of a central net-work, namely the “Lipid Metabolism, Amino acid metabolismand Molecular Transport” network.

Fig. 4 – Ingenuity Pathway Analysis of the on/up-regulated proteins (B) and gene transcripts (C) alone or merged together (A) inChianina livers only. Upon interrogation of the internal database, the software indicated that the “LipidMetabolism, Amino acidmetabolism and Molecular Transport” pathway represented the central core network either when observing elaboration ofproteomics or transcriptomics data alone or together. Grey nodes are the proteins individuated during the experimental phasehaving amatch in the network. It isworthwhile to recall that the utterly identified proteins and gene transcriptswere eligible foridentification and network analysis only if differentially-expressed. Therefore, some proteins/gene products which are shownin the networks as “white nodes” could be likely individuated during the experimental phase aswell, although thiswas not thegoal of this study. Altogether, proteins and gene-products individuated in the networkmay account for the increasedmetabolicand anabolic capacity of beef cattle (in this case, Chianina). Graph elaboration software: Ingenuity PathwayAnalysis (Ingenuity®
Systems, www.ingenuity.com). Grey nodes: proteins from the dataset having a match in the database; White nodes: proteinsfrom the database which were not identified (if present) upon the experimental phase; Continuous edge: direct interaction;Interrupted edge: indirect interaction; Grey edges: interactions within a network; Orange edges: interactions betweennetworks.
317J O U R N A L O F P R O T E O M I C S 7 3 ( 2 0 0 9 ) 3 0 9 – 3 2 2

318 J O U R N A L O F P R O T E O M I C S 7 3 ( 2 0 0 9 ) 3 0 9 – 3 2 2
Indeed, hydroxiacyl-Coenzyme A dehydrogenase (HADH,spot 68), Acyl Co A dehydrogenase straight chain, C-4 to C-12straight chain (ACADM, spot 181) and Acyl-Coenzyme Adehydrogenase C-2 to C-3 short chain (ACADS, spot 229)from the differential proteomics analysis, and protein tyrosinephosphatase-like A domain containing 1 (PTPLAD1), 5,10-methenyltetrahydrofolate synthetase (MTHFS) from themicroarray analysis are all proteins involved in fatty acidcatabolism, in valine, leucine and isoleucine and carbonmetabolism, respectively. In general these enzymes catalyzethe oxidative dehydrogenation of different substrates presentin the mitochondrial matrix and thus exert a key role in thefatty acid beta-oxidation pathway, converting fatty acidreserves to energy, especially during periods without food(fasting). ACADS, for example, is an essential enzyme for fattyacid metabolism (lipid metabolism) because it catalyzes thealpha, beta-dehydrogenation of acyl-CoA. Its inhibition causeslow blood sugar (hypoglycemia), a lack of energy (lethargy),poor feeding, and failure to gain weight and grow at theexpected rate (failure to thrive). HADH and ACADS are alsoinvolved together with in the degradation of isoleucine andvaline, together with ACADM, a homotetramer, which alsocatalyzes the key step in leucine degradation. MTHFS hadalready been observed in human liver as well and it catalyzesthe ATP- and Mg(2+)-dependent conversion of 5-formyltetra-hydrofolate (5-FTHF) to 5,10-methenyltetrahydrofolate (5,10-MTHF), which is subsequently interconverted into otherreduced folates involved in carbon metabolism [24].
Other up-regulated enzymes in Chianina take part in theamino acid metabolism and map on the network (Fig. 4), suchas Glutamate dehydrogenase (GLUD1, spot 210), ArginineSuccinate Synthetase (ASS, spot 187) and Ornithine Carba-moyltransferase (OTC, spot 228). These basic enzymes act inthe arginine and proline biosynthesis. In particular ASS andOTC are involved in the urea cycles. ASS is responsible for thethird step of the urea cycle and one of the reactions of theCitrulline-NO cycle and is a precursor to fumarate in the citricacid cycle via argininosuccinate lyase. OTC is an enzyme thatcatalyzes the reaction between carbamoyl phosphate andornithine to form citrulline and phosphate. GLUD1 (spot 210,Table 1; Fig. 4) represents a key link between catabolic andanabolic pathways: ammonia incorporation in animals occursthrough the actions of glutamate dehydrogenase and gluta-mine synthetase. The product α-Ketoglutarate can beexploited to provide energy through the citric acid cycle, inorder to ultimately produce ATP.
Catalase (CAT, spot 77) and Oxydoreductase (HADH, orHSD17B1 in Fig. 4) are enzymes involved in the final step oftryptophandegradativemetabolism to acetil-CoA. HADH in thiscase catalyzes the dehydrogenationof 3-hydroxy-butanoyl-CoAto acetoacetil-CoA and its over-expression can improve theGlycolitic pathway. Finally ACADAM and Beta-Ureidopropio-nase (UBP1, spot 222) are proteins that link the metabolism ofbeta-alanine to pyrimidine and propanoate metabolism, re-spectively. In fact Beta-ureidopropionase, also known as beta-alanine synthase, catalyzes the last step in pyrimidine degra-dation and its depletion causes muscular hypotonia, dystonicmovements. Degradation of uracil is the only pathway toprovideb-alanine inmammals [25]. Thenet result of thealaninecycle is the transport of nitrogen from muscle to liver.
In conclusion, the metabolic functions of the up/on-regulated proteins in the Chianina breed with respect toHolstein Friesian seem to indicate a mobilisation of non-conventional energy supplies (proteins, fatty acids) regardingthe use of glycogen. In parallel, the increased levels ofPTPLAD1 from microarray observations, which is known totake part in the NRF2-mediated oxidative stress responsepathway, and of transferrin (TF), a pivotal iron transporter, areconsistent with catalase up-regulation in Chianina livers [26],and may account for an increased resistance to oxidativestress [27] also in consequence to fatty acid oxidation [28].
All this information has been retrieved from the: KEGGPATHWAY Database Kanehisa Laboratory, BioinformaticsCenter, Institute for Chemical Research, Kyoto University(http://www.genome.jp/kegg/pathway.html) [29,30] and theIngenuity Pathways Knowledge Base (Ingenuity® Systems,www.ingenuity.com).
In contrast a wider series of proteins and transcripts wereexpressed in Holstein Friesian which were absent in Chianina.These gene and proteins were mainly related to proteinfolding and degradation, hormone homeostasis and abilityto thermoregulate (Fig. 5). Indeed, in a recent paper, Sevi andcolleagues [31] suggested that high ambient temperature maymarkedly modify the lipid composition of ewe's milk and thatprovision of shade, but not feedingmanagement, can improvethemilk fatty acid profile in dairy sheep raised in hot climates.Therefore, it is worthwhile to underline the identification ofthe hypothetical protein LOC78302 in Holstein Friesian(SULT1C4 in Fig. 5), but not in the Chianina. LOC783020 is aprotein belonging to the sulfotransferase (SULT1C4, spot 88)family that plays a key role in the biosynthesis and homeo-stasis of a number of hormones, including estrogens andiodothyronines. The gene structure (number and length ofexons) is similar among family members. This gene encodes aprotein that belongs to the SULT1 subfamily, responsible fortransferring a sulfo moiety from PAPS to phenol-containingcompounds. Two alternatively spliced transcript variants,encoding different isoforms, have been described for thisgene. The final protein enzymes catalyze the sulfate conjuga-tion ofmany neurotransmitters, drugs, xenobiotic compoundsand, above all, hormones. Involvement of the thyroid hor-mones in adapting metabolism postpartum in calves is now agenerally accepted idea: changes in the blood levels of T3 andT4 are detectable in calves suffering from ketosis [11]. Forexample blood levels of thyroid hormones were reduced inmilk from post-partum cows [32]. Furthermore, several papershave reported studies on bovine milk investigating therelationship between the presence of iodine, thyroid metab-olism and fertility problems [33]. For example, Wemheuerfound that TRH increased the production of milk and lactoseslightly (as well as milk enzymes) [33]. However Whitaker andco-workers [34] concluded that, although several texts havereported that iodine deficiency in bovinemilk has an influenceon fertility, more research is required to establish a firm link[35,36].
Over-expression of Calreticulin (HSP90AA1 in Fig. 5), aprotein that binds calcium, has been observed in HolsteinFriesian both with the proteomics and transcriptomics ap-proach. HSP90AA1 is probably in correlation with SULT1C4.HSP90AA1hasa chaperonin-like activity andbinds transcription
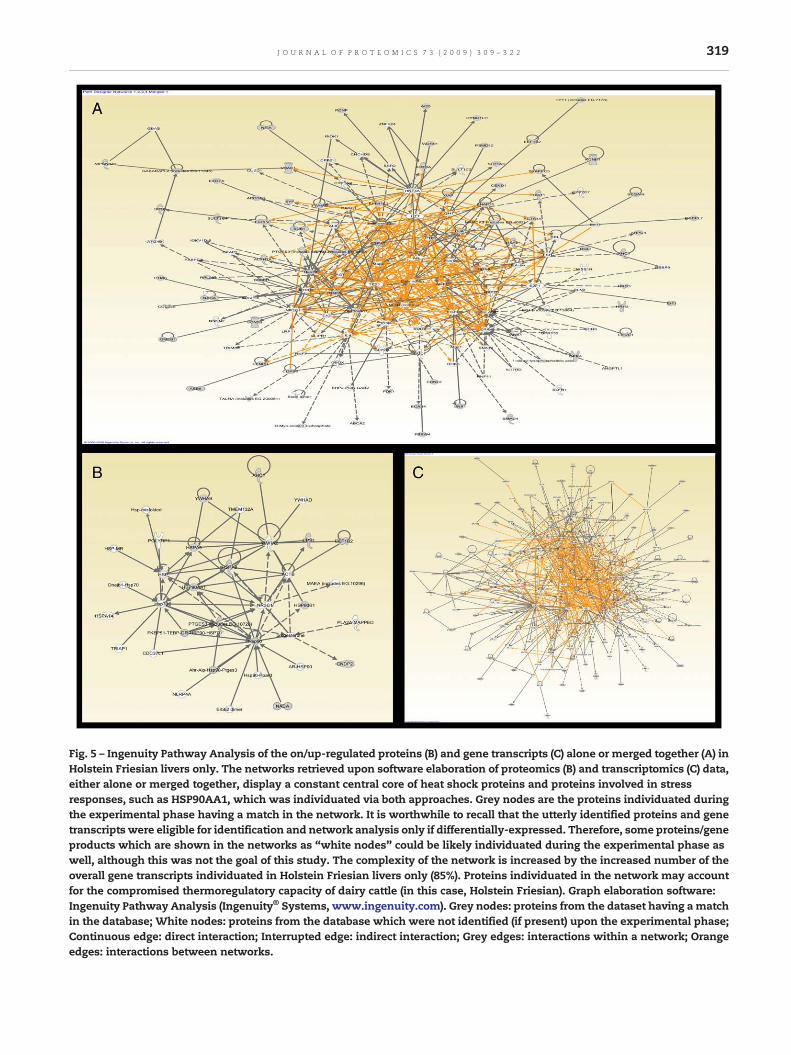
Fig. 5 – Ingenuity Pathway Analysis of the on/up-regulated proteins (B) and gene transcripts (C) alone or merged together (A) inHolstein Friesian livers only. The networks retrieved upon software elaboration of proteomics (B) and transcriptomics (C) data,either alone or merged together, display a constant central core of heat shock proteins and proteins involved in stressresponses, such as HSP90AA1, which was individuated via both approaches. Grey nodes are the proteins individuated duringthe experimental phase having a match in the network. It is worthwhile to recall that the utterly identified proteins and genetranscripts were eligible for identification and network analysis only if differentially-expressed. Therefore, some proteins/geneproducts which are shown in the networks as “white nodes” could be likely individuated during the experimental phase aswell, although this was not the goal of this study. The complexity of the network is increased by the increased number of theoverall gene transcripts individuated in Holstein Friesian livers only (85%). Proteins individuated in the network may accountfor the compromised thermoregulatory capacity of dairy cattle (in this case, Holstein Friesian). Graph elaboration software:Ingenuity Pathway Analysis (Ingenuity® Systems, www.ingenuity.com). Grey nodes: proteins from the dataset having a matchin the database; White nodes: proteins from the database which were not identified (if present) upon the experimental phase;Continuous edge: direct interaction; Interrupted edge: indirect interaction; Grey edges: interactions within a network; Orangeedges: interactions between networks.
319J O U R N A L O F P R O T E O M I C S 7 3 ( 2 0 0 9 ) 3 0 9 – 3 2 2
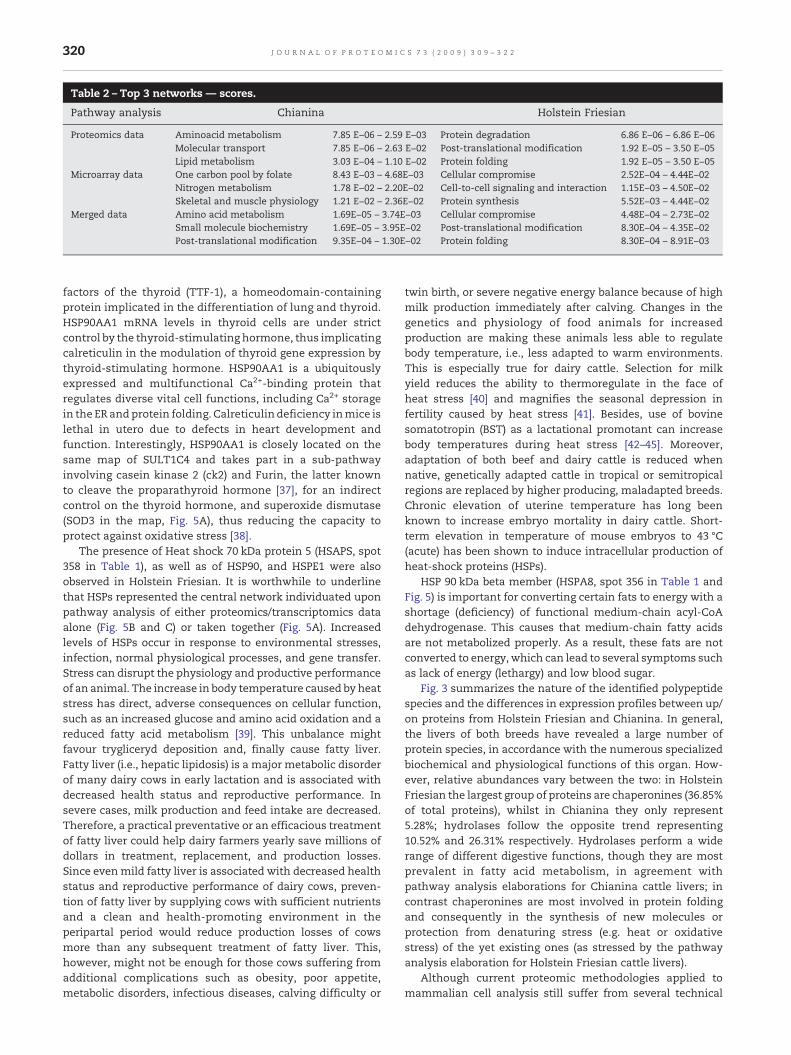
Table 2 – Top 3 networks — scores.
Pathway analysis Chianina Holstein Friesian
Proteomics data Aminoacid metabolism 7.85 E−06 – 2.59 E−03 Protein degradation 6.86 E−06 – 6.86 E−06Molecular transport 7.85 E−06 – 2.63 E−02 Post-translational modification 1.92 E−05 – 3.50 E−05Lipid metabolism 3.03 E−04 – 1.10 E−02 Protein folding 1.92 E−05 – 3.50 E−05
Microarray data One carbon pool by folate 8.43 E−03 – 4.68E−03 Cellular compromise 2.52E−04 – 4.44E−02Nitrogen metabolism 1.78 E−02 – 2.20E−02 Cell-to-cell signaling and interaction 1.15E−03 – 4.50E−02Skeletal and muscle physiology 1.21 E−02 – 2.36E−02 Protein synthesis 5.52E−03 – 4.44E−02
Merged data Amino acid metabolism 1.69E−05 – 3.74E−03 Cellular compromise 4.48E−04 – 2.73E−02Small molecule biochemistry 1.69E−05 – 3.95E−02 Post-translational modification 8.30E−04 – 4.35E−02Post-translational modification 9.35E−04 – 1.30E−02 Protein folding 8.30E−04 – 8.91E−03
320 J O U R N A L O F P R O T E O M I C S 7 3 ( 2 0 0 9 ) 3 0 9 – 3 2 2
factors of the thyroid (TTF-1), a homeodomain-containingprotein implicated in the differentiation of lung and thyroid.HSP90AA1 mRNA levels in thyroid cells are under strictcontrol by the thyroid-stimulating hormone, thus implicatingcalreticulin in the modulation of thyroid gene expression bythyroid-stimulating hormone. HSP90AA1 is a ubiquitouslyexpressed and multifunctional Ca2+-binding protein thatregulates diverse vital cell functions, including Ca2+ storagein the ER andprotein folding. Calreticulin deficiency inmice islethal in utero due to defects in heart development andfunction. Interestingly, HSP90AA1 is closely located on thesame map of SULT1C4 and takes part in a sub-pathwayinvolving casein kinase 2 (ck2) and Furin, the latter knownto cleave the proparathyroid hormone [37], for an indirectcontrol on the thyroid hormone, and superoxide dismutase(SOD3 in the map, Fig. 5A), thus reducing the capacity toprotect against oxidative stress [38].
The presence of Heat shock 70 kDa protein 5 (HSAPS, spot358 in Table 1), as well as of HSP90, and HSPE1 were alsoobserved in Holstein Friesian. It is worthwhile to underlinethat HSPs represented the central network individuated uponpathway analysis of either proteomics/transcriptomics dataalone (Fig. 5B and C) or taken together (Fig. 5A). Increasedlevels of HSPs occur in response to environmental stresses,infection, normal physiological processes, and gene transfer.Stress can disrupt the physiology and productive performanceof an animal. The increase in body temperature caused by heatstress has direct, adverse consequences on cellular function,such as an increased glucose and amino acid oxidation and areduced fatty acid metabolism [39]. This unbalance mightfavour trygliceryd deposition and, finally cause fatty liver.Fatty liver (i.e., hepatic lipidosis) is a major metabolic disorderof many dairy cows in early lactation and is associated withdecreased health status and reproductive performance. Insevere cases, milk production and feed intake are decreased.Therefore, a practical preventative or an efficacious treatmentof fatty liver could help dairy farmers yearly save millions ofdollars in treatment, replacement, and production losses.Since evenmild fatty liver is associated with decreased healthstatus and reproductive performance of dairy cows, preven-tion of fatty liver by supplying cows with sufficient nutrientsand a clean and health-promoting environment in theperipartal period would reduce production losses of cowsmore than any subsequent treatment of fatty liver. This,however, might not be enough for those cows suffering fromadditional complications such as obesity, poor appetite,metabolic disorders, infectious diseases, calving difficulty or
twin birth, or severe negative energy balance because of highmilk production immediately after calving. Changes in thegenetics and physiology of food animals for increasedproduction are making these animals less able to regulatebody temperature, i.e., less adapted to warm environments.This is especially true for dairy cattle. Selection for milkyield reduces the ability to thermoregulate in the face ofheat stress [40] and magnifies the seasonal depression infertility caused by heat stress [41]. Besides, use of bovinesomatotropin (BST) as a lactational promotant can increasebody temperatures during heat stress [42–45]. Moreover,adaptation of both beef and dairy cattle is reduced whennative, genetically adapted cattle in tropical or semitropicalregions are replaced by higher producing, maladapted breeds.Chronic elevation of uterine temperature has long beenknown to increase embryo mortality in dairy cattle. Short-term elevation in temperature of mouse embryos to 43 °C(acute) has been shown to induce intracellular production ofheat-shock proteins (HSPs).
HSP 90 kDa beta member (HSPA8, spot 356 in Table 1 andFig. 5) is important for converting certain fats to energy with ashortage (deficiency) of functional medium-chain acyl-CoAdehydrogenase. This causes that medium-chain fatty acidsare not metabolized properly. As a result, these fats are notconverted to energy, which can lead to several symptoms suchas lack of energy (lethargy) and low blood sugar.
Fig. 3 summarizes the nature of the identified polypeptidespecies and the differences in expression profiles between up/on proteins from Holstein Friesian and Chianina. In general,the livers of both breeds have revealed a large number ofprotein species, in accordance with the numerous specializedbiochemical and physiological functions of this organ. How-ever, relative abundances vary between the two: in HolsteinFriesian the largest group of proteins are chaperonines (36.85%of total proteins), whilst in Chianina they only represent5.28%; hydrolases follow the opposite trend representing10.52% and 26.31% respectively. Hydrolases perform a widerange of different digestive functions, though they are mostprevalent in fatty acid metabolism, in agreement withpathway analysis elaborations for Chianina cattle livers; incontrast chaperonines are most involved in protein foldingand consequently in the synthesis of new molecules orprotection from denaturing stress (e.g. heat or oxidativestress) of the yet existing ones (as stressed by the pathwayanalysis elaboration for Holstein Friesian cattle livers).
Although current proteomic methodologies applied tomammalian cell analysis still suffer from several technical
321J O U R N A L O F P R O T E O M I C S 7 3 ( 2 0 0 9 ) 3 0 9 – 3 2 2
limitations, which prohibit a systematic comprehensivedescription of the entire protein expression profile and resultin non-detection of many important low soluble or lessabundant components, these preliminary tissue analyses byconventional 2-DE procedures are still able to yield useful dataon poorly characterized animals.
Relevant information could be retrieved when performingboth proteomics and transcriptomics analyses simultaneous-ly, even when the experimental datasets display low to absentoverlap, due to a series of intrinsic technical limitations— lastbut not least, the inadequacy of available statistical tools tocompensate for biases in the data collectionmethodologies, asit has already been pointed out before [46]. Even in this case,however, interaction pathway analysis of those datasetsallows the individuation of central networks sharing thesame biological meaning, but not necessarily the samemolecular actors. Hereby, we pinpointed at two main net-works which undergo primary modifications in cattle breedswith different productive aptitudes, such as Chianina andHolstein Friesian. This kind of approach definitely eases dataanalysis and final discussions, other than bridging the gapbetween the arid experimental phase and its biologicalinterpretation (in this case, bovine liver).
This study contributes to a more detailed understanding ofimportant biological processes which have moulded HolsteinFriesian and Chianina into two distinct populations. More-over, this study provides evidence of how direct measures ofgene expression, that is to say, protein- and transcript-oriented analyses, can still provide information on the globaldynamic changes in the protein repertoire associated with thetwo distinct populations, and elucidate the important meta-bolic differences that have arisen upon modification ofrelatively few genes/proteins (or gene/protein networks),over thousand years of human breeding selection.
Acknowledgements
This manuscript was supported by “GENZOOT” project.
Appendix A. Supplementary data
Supplementary data associated with this article can be found,in the online version, at doi:10.1016/j.jprot.2009.09.015.
R E F E R E N C E S
[1] Roy JHB. The calf. Management of Health, 5th (Eds), vol. 1.London, England: Butterworths; 1990. p. 1–117.
[2] Lewin HA. The future of cattle genome research: the beef ishere, cytogen. Genome Res 2003;102:10–5.
[3] D'Ambrosio C, Arena S, Talamo F, Ledda L, Renzone G, FerraraL, et al. Comparative proteomic analysis of mammaliananimal tissues and body fluids: bovine proteome database.J Chrom B 2005;815:157–68.
[4] Zuo X, Speicher DW. Comprehensive analysis of complexproteomes using microscale solution isoelectrofocusing priorto narrow pH range two-dimensional electrophoresis.Proteomics 2002;2:58–68.
[5] Womack J, Kata SR. Bovine genome mapping: evolutionaryinference and the power of comparative genomics. Curr OpinGenet Dev 1995;5:725–33.
[6] Fries R, Ruvinsky A. The Genetics of Cattle, vol. 13.Wallingford: CABI Publishing; 1999. p. 391–410.
[7] Hochstrasser DF, Frutiger S, Wilkins MR, Hughes G, SanchezJC. Elevation of apolipoprotein E in the CSF of cattle affectedby BSE. FEBS Lett 1997;416:161–3.
[8] Jobim MIM, Oberst ER, Salbego CG, Souza DO, Wald VB,Tramontina F, et al. Two-dimensional polyacrylamide gelelectrophoresis of bovine seminal plasma proteins and theirrelation with semen freezability. Theriogenology1998;61:255–66.
[9] Ricken AM, Spanel-Borowski K, Saxer Huber PR. Cytokeratinexpression in bovine corpora lutea. Histochem Cell Biol1995;103:345–54.
[10] Vassallo JC, Kurpakus MA. Nuclear matrix proteins of bovinecorneal and conjunctival epithelium. Curr Eye Res1996;15:899–904.
[11] Xu C, Wang Z. Comparative proteomic analysis of livers fromketotic cows. Vet Res Com 2008;32:263–73.
[12] Havea PH, Creamer LK. Characterization of heat-inducedaggregates of beta-lactoglobulin, alpha-lactalbumin andbovine serum albumin in a whey protein concentrateenvironment. J Dairy Res 2001;68:483–97.
[13] Negrini R, Milanesi E, Bozzi R, PellecchiaM, Ajmone-Marsan P.Tuscany autochtonous cattle breeds: an original geneticresource investigated by AFLP markers. J Anim Breed Genet2006;123:10–6.
[14] Bradford MM. A rapid and sensitive method for thequantitation of microgram quantities of protein utilizingthe principle of protein-dye binding. Anal Chem1976;72:248–54.
[15] Talamo F, D'Ambrosio C, Arena S, Del Vecchio P, Ledda L,Zehender G, et al. Proteins from bovine tissues and biologicalfluids: Defining a reference electrophoresis map for liver,kidney, muscle, plasma and red blood cells. Proteomics2003;3:440–60.
[16] Neuhoff V, Arold N, Taube D, Ehrhardt W. Improved stainingof proteins in polyacrylamide gels including isoelectricfocusing gels with clear background at nanogram sensitivityusing Coomassie Brilliant Blue G-250 and R.250.Electrophoresis 1988;9:255–62.
[17] Beresini MH, Sugarman BJ, Shepard HM, Epstein LB.Synergistic induction of polypeptides by tumor necrosisfactor and interferon-gamma in cells sensitive or resistant totumor necrosis factor: Assessment by computer basedanalysis of two-dimensional gels using the PDQUEST system.Electrophoresis 1990;11:232–41.
[18] Shevchenko A,WilmM, VormO, MannM.Mass spectrometricsequencing of proteins from silver-stained polyacrylamidegels. Anal Chem 1996;68:850–8.
[19] D'Amici GM, Timperio AM, Zolla L. Coupling of native liquidphase isoelectrofocusing and blue native polyacrylamide gelelectrophoresis: a potent tool for native membranemultiprotein complex separation. J Proteome Res 2008;7:1326.
[20] Kerr KM, Churchill GA. Statistical design and the analysisof gene expression microarray data. Genet Res2001;77(02):123–8.
[21] Fang Y, Brass A, Hoyle DC, Hayes A, Bashein A, Oliver SG, et al.Amodel-based analysis of microarray experimental error andnormalisation. Nucl Acids Res 2003;31(16):e96.
[22] Caraux G, Pinloche S. “Permutmatrix: a graphicalenvironment to arrange gene expression profiles inoptimal linear order. Bioinformatics 2005;21:1280–1.
[23] Ingenuity Pathway Analysis (Ingenuity® Systems,www.ingenuity.com).
[24] Dayan A, Bertrand R, Beauchemin M, Chahla D, Mamo A,Filion M, et al. Cloning and characterization of the human 5,

322 J O U R N A L O F P R O T E O M I C S 7 3 ( 2 0 0 9 ) 3 0 9 – 3 2 2
10-methenyltetrahydrofolate synthetase-encoding cDNA.Gene 1995 Nov 20;165(2):307–11.
[25] Waldmann G, Cook PF, Schnackerz D. Purification andproperties of β-alanine synthase from calf liver. Prot Pep Lett2005;12:69–73.
[26] Fita I, Rossmann MG. The active role of catalase. J Mol Biol1985;185(1):21–37.
[27] Rojanasakul Y, Shi X, Deshpande D, Liang WW, Wang LY.Protection against oxidative injury and permeabilityalteration in cultured alveolar epithelium bytransferrin-catalase conjugates. Biochim Biophys Acta1996;1315(1):21–8.
[28] Gao L,Wang J, Sekhar KR, Yin H, Yared NF, Schneider SN, et al.Novel n-3 fatty acid oxidation products activate Nrf2 bydestabilizing the association between Keap1 and Cullin3.J Biol Chem 2007;282(4):2529–37.
[29] Kanehisa M, Goto S. KEGG: kyoto encyclopedia of genes andgenomes. Nucleic Acids Res 2000;28:27–30.
[30] Kanehisa M, Araki M, Goto S, Hattori M, Hirakawa M, Itoh M,et al. KEGG for linking genomes to life and the environment.Nucleic Acids Res 2008;36:D480–4.
[31] Sevi A, Rotunno T, Di Caterina R, Muscio A. Fatty acidcomposition of ewe milk as affected by solar radiation andhigh ambient temperature. J Dairy Res 2002;69:81–194.
[32] Bertoni G, Cappa V. Il profilo metabolico nella vaccaproduzione di latte. Bioch Clin 1984;8:131–3.
[33] Wemheuer W. Relationship between iodine requirements/thyroid metabolism and fertility problems in dairy cows.Reprod Domest Anim 1993;28:385–94.
[34] Whitaker DA, Smith EJ, da Rosa GO, Kelly JM. Some effects ofnutrition and management on the fertility of dairy cattle. VetRec 1993;133:61–4.
[35] Bader N, Moeller U, Leiterer M, Franke K, Jahreis G. Pilot study:tendency of increasing iodine content in human milk andcow 's milk. Exp Clin Endocrinol 2005;113:8–12.
[36] Kaufmann S, Kursa J, Kroupova V, Rambeck WA. Iodine inmilk by supplementing feed: an additional strategy to eraseiodine deficiency. Vet Med (Praha) 1998;43:173–8.
[37] Hendy GN, Bennett HPJ, Gibbs BF, Lazure C, Day R, Seidah NG.Proparathyroid hormone is preferentially cleaved toparathyroid hormone by the prohormone convertase furin.A mass spectrometric study. J Biol Chem 1995;270:9517–25.
[38] Bowler RP, Nicks M, Olsen DA, Thøgersen IB, Valnickova Z,Højrup P, et al. Furin proteolytically processes theheparin-binding region of extracellular superoxidedismutase. J Biol Chem 2002;277(19):16505–11.
[39] Collier RJ, Collier JL, Rhoads RP, Baumgard LH. Invited review:genes involved in the bovine heat stress response. J Dairy Sci2008;91(2):445–54.
[40] Hansen PJ, Aréchiga CF. Strategies for managing reproductionin the heat-stressed dairy cow. J Animal Sci 1999;77:36–50.
[41] Al-Katanani YM, Paula-Lopes FF, Hansen PJ. Effect of seasonand exposure to heat stress on oocyte competence in Holsteincows. J Dairy Sci 2002;85:390–6.
[42] West J, Bondari WK, Johnson JC. Effects of bovinesomatotropin on milk yield and composition, body weight,and condition score of Holstein and Jersey cows. J Dairy Sci1990;73:1062–8.
[43] West JW, Mullinix BG, Johnson JC, Ash Jr KA, Taylor VN.Effects of bovine somatotropin on dry matter intake, milkyield, and body temperature in Holstein and Jersey cowsduring heat stress. J Dairy Sci 1990;73:2896–906.
[44] Elvinger F, Natzke RP, Hansen PJ. Interactions of heat stressand bovine somatotropin affecting physiology andimmunology of lactating cows. J Dairy Sci 1992;75:449–62.
[45] Cole JA, Hansen PJ. Effect of administration of recombinantbovine somatotropin on the responses of lactating andnonlactating cows to heat stress. J Am Vet Med Assoc1993;203:113–7.
[46] Nie L, Wu G, Culley DE, Schotten JCM, Zhang W. Integrativeanalysis of transcriptomic and proteomic data: challenges,solutions and applications. Crit Rev Biotechnol2007;27(2):63–75.
Related Documents