http://cps.sagepub.com/ Comparative Political Studies http://cps.sagepub.com/content/43/11/1327 The online version of this article can be found at: DOI: 10.1177/0010414010376912 August 2010 2010 43: 1327 originally published online 10 Comparative Political Studies M. Steven Fish, Francesca R. Jensenius and Katherine E. Michel Islam and Large-Scale Political Violence: Is There a Connection? Published by: http://www.sagepublications.com can be found at: Comparative Political Studies Additional services and information for http://cps.sagepub.com/cgi/alerts Email Alerts: http://cps.sagepub.com/subscriptions Subscriptions: http://www.sagepub.com/journalsReprints.nav Reprints: http://www.sagepub.com/journalsPermissions.nav Permissions: http://cps.sagepub.com/content/43/11/1327.refs.html Citations: by guest on December 30, 2010 cps.sagepub.com Downloaded from

Welcome message from author
This document is posted to help you gain knowledge. Please leave a comment to let me know what you think about it! Share it to your friends and learn new things together.
Transcript
http://cps.sagepub.com/Comparative Political Studies
http://cps.sagepub.com/content/43/11/1327The online version of this article can be found at:
DOI: 10.1177/0010414010376912
August 2010 2010 43: 1327 originally published online 10Comparative Political Studies
M. Steven Fish, Francesca R. Jensenius and Katherine E. MichelIslam and Large-Scale Political Violence: Is There a Connection?
Published by:
http://www.sagepublications.com
can be found at:Comparative Political StudiesAdditional services and information for
http://cps.sagepub.com/cgi/alertsEmail Alerts:
http://cps.sagepub.com/subscriptionsSubscriptions:
http://www.sagepub.com/journalsReprints.navReprints:
http://www.sagepub.com/journalsPermissions.navPermissions:
http://cps.sagepub.com/content/43/11/1327.refs.htmlCitations:
by guest on December 30, 2010cps.sagepub.comDownloaded from
Comparative Political Studies43(11) 1327 –1362© The Author(s) 2010Reprints and permission: http://www.sagepub.com/journalsPermissions.navDOI: 10.1177/0010414010376912http://cps.sagepub.com
1University of California, Berkeley, Berkeley, CA, USA
Corresponding Author:M. Steven Fish, University of California, Berkeley, 210 Barrows Hall, Department of Political Science, Berkeley, CA 94720 Email: [email protected]
Islam and Large-Scale Political Violence: Is There a Connection?
M. Steven Fish1, Francesca R. Jensenius1,and Katherine E. Michel1
Abstract
Are Muslims especially prone to large-scale political violence? From Montesquieu to Samuel Huntington, prominent modern analysts of politics have regarded Muslims as unusually inclined to strife. Many other observers have portrayed Islam as a peace-loving faith and Muslims as largely pacific. Yet scholars still lack much hard evidence on whether a relationship between Islam and political violence really exists. Precious few studies adduce empirical evidence on whether Islamic societies are actually more or less violent. This article assesses whether Muslims are more prone to large-scale political violence than non-Muslims. The authors focus neither on terrorism nor on interstate war. Instead, they investigate large-scale intrastate violence. The article makes three contributions. First, it offers useful data on Islam and political strife. Second, it investigates whether Muslims are especially violence prone. Relying on cross-national analysis, the authors find no evidence of a correlation between the proportion of a country’s population that is made up of Muslims and deaths in episodes of large-scale political violence in the postwar period. Third, the authors investigate whether Islamism (the ideology), as opposed to Muslims (the people), is responsible for an
Articles
by guest on December 30, 2010cps.sagepub.comDownloaded from

1328 Comparative Political Studies 43(11)
inordinate share of the world’s large-scale political violence. They find that Islamism is implicated in an appreciable but not disproportionate amount of political violence.
Keywords
Islam, Muslims, political violence, Islamism
Few matters in contemporary world politics command more interest than the relationship between Islam and political strife. Are Muslims especially prone to political violence? Office conversation among elites in Jakarta, Washington, Paris, Delhi, Beijing, and Ankara—not to mention kitchen-table talk in Surabaya, Kansas City, Marseille, Bangalore, Wuhan, and Istanbul—swirls around the issue. Yet the task of testing whether a relationship between Islam and political violence exists has hardly been touched. Few studies adduce empirical evidence on whether Islamic societies are actually more or less violent.
This article seeks to assess whether Muslims are more prone to large-scale political violence than non-Muslims. We do not focus on terrorism, which normally takes the form of dramatic, one-off events that may be transnational in character and that usually have a relatively small number of casualties. Nor do we concentrate on interstate war. Instead, we investigate large-scale intra-state violence. We cannot pretend to resolve the weighty question at hand or to make causal inferences. Despite enormous public interest in the issue, scholarly investigation is in its infancy. Empirical treatments are scarce, and the data available to us make a statistical evaluation of hypotheses difficult.
Our article makes three contributions. First, it offers some original data. Building on a major effort initiated by another scholar, Monty Marshall, we provide a database of events of large-scale political violence. We enrich Marshall’s data by drawing out a particular set of cases and adding several coding categories. By doing so, we create a database that may be of interest to students of intrastate political conflict and of political Islam. Second, we use the data to explore whether Muslims are especially violence prone. We find no evidence of a correlation between the proportion of a country’s population that is made up of Muslims and deaths in episodes of large-scale political violence. Third, we investigate whether Islamism (the ideology), as opposed to Muslims (the people), is responsible for an inordinate amount of large-scale political violence. We find that Islamism is implicated in an appreciable, but not neces-sarily disproportionate, amount of political violence.
by guest on December 30, 2010cps.sagepub.comDownloaded from

Fish et al. 1329
Hypotheses on Islam and Large-Scale Political Violence
In Spirit of the Laws, Montesquieu (1995) stated,
The gentleness so recommended in the gospel stands opposed to the despotic fury with which a prince would mete out his own justice and exercise his cruelties. . . . The Mohammedan religion, which speaks only with a sword, continues to act on men with the destructive spirit that founded it. (pp. 461-462)
A quarter of a millennium later, in one of the most globally influential works of social science of the late 20th century, Samuel Huntington (1996) similarly asserted that Islamic societies are especially prone to large-scale political violence. Huntington discussed both “intercivilizational” and “intraciviliza-tional” violence. By the former, he meant conflict between Islamic and non-Islamic countries; by the latter, he meant conflict within countries. Huntington saw both kinds of strife as especially acute among Muslims. He not only asserted that “Islam’s borders are bloody” but added “and so are its innards” (pp. 256-258).
Its innards are what concern us here. Armed conflict between Islamic and non-Islamic countries lies outside our purview. Assessing responsibility for who initiated (or is to blame for) interstate wars is a thorny issue but one that must be addressed if the analyst seeks to assess whether the people of this or that confession or region—or, for that matter, people living under one or another type of political regime—are more or less prone to go to war with other countries. Such matters are best left to specialists in international rela-tions. Here we stick with assessment of whether the internal politics of pre-dominantly Muslim countries are unusually bloody.
The notion that Islam is conducive to mass political violence is based on a claim about the way Muslims understand jihad, or holy struggle. Jihad has multiple meanings and manifestations. Recent scholarly works have pro-vided sophisticated treatments (Bonner, 2008; Bonney, 2004; Cook, 2005; Kelsay, 2007). One meaning of jihad is armed struggle. Some people, Muslims and non-Muslims alike, read passages of the Koran as condoning violence against the enemies of Islam. Many contemporary observers regard the notion of violent jihad as very much alive among contemporary Muslims. The notion of holy war is not foreign to Christianity, whose Crusader armies struggled mightily (if unsuccessfully) to recover the Holy Land during the 11th and 12th centuries. Nor is it alien to other religious traditions. But neither contemporary
by guest on December 30, 2010cps.sagepub.comDownloaded from

1330 Comparative Political Studies 43(11)
Christianity nor any other modern major world religion has a concept of jihad—at least not one that is as central to its doctrine as jihad is to Islam. If some modern Muslims take to heart what they perceive as permission—even a prescription—to commit violence, one might expect large-scale political violence to be especially high among Muslims. The religion’s perceived ene-mies may include non-Muslims, Muslims who collaborate with non-Muslims, Muslims who are viewed as lacking in piety, and Muslims who are seen as enforcing a political order that harms the faith. If the concept of jihad has sharp teeth, we might expect large-scale political violence to be more fre-quent and acute in societies with larger Muslim populations.
The empirical evidence on contemporary terrorism may reinforce an expectation of a positive association between Islam and large-scale political violence. Over the past several decades, a large portion of what are normally defined in the West as terrorist acts have been committed by Muslims in the name of Islam. If patterns of large-scale, sustained political violence mimic those of terrorist acts, one would expect the former to be unusually common and severe in predominantly Muslim societies.
The counterhypothesis is that Islam may help inoculate societies against mass political violence. Some writers claim that the vast majority of Muslims understand jihad in nonviolent terms and that the prevalence of the idea of jihad among Muslims is no spur to violence (Al-Ghannouchi, 2000; Lawrence, 2000; Lukens-Bull, 2005). It may even promote personal discipline and social solidarity in a manner that cuts the risk of bloodshed (Adler, 1983).
The expectation of a negative association between Islam and large-scale political violence may find support in the data on violent crime. Homicide rates tend to be low in predominantly Islamic countries. In fact, the proportion of society that is made up of Muslims provides a good pre-dictor of cross-national variation in murder rates (Helal & Coston, 1995; Neapolitan, 1997; Souryal, 1987). If patterns of bloodshed arising from mass political violence look anything like patterns of criminal violence, one might expect less carnage from mass political strife in lands in which Muslims predominate.
These hypotheses may guide our inquiry, but there is no body of literature that actually tests them. Despite enormous interest in Islam and violence around the world, there have been surprisingly few efforts to assess empiri-cally whether Muslims are especially prone to large-scale political violence. Assertions and commentary abound, but empirical tests are virtually nonex-istent. The findings offered below may provide a starting point for bringing hard evidence to bear on questions that are of great significance and public interest.
by guest on December 30, 2010cps.sagepub.comDownloaded from

Fish et al. 1331
Measuring Large-Scale Political Violence
There are several sources of data on large-scale political violence in the world. The compilation authored and regularly updated by Marshall (2008) stands out for its comprehensiveness and quality. Marshall’s “Major Episodes of Political Violence” data set provides a complete list of events in the post-war period that produced 500 or more deaths. A recently updated version covers the period 1946-2007, and we rely on this version here.
According to Marshall, during the period under consideration there were 326 episodes of large-scale political violence. Some of these events were inter-national (meaning interstate) in character; others were domestic. We are con-cerned with domestic (meaning intrastate) conflict. We exclude international conflicts, which include independence struggles against foreign (often colo-nial) domination. Marshall helpfully includes his own coding of types of con-flict, which facilitates distinguishing between interstate and intrastate violence.
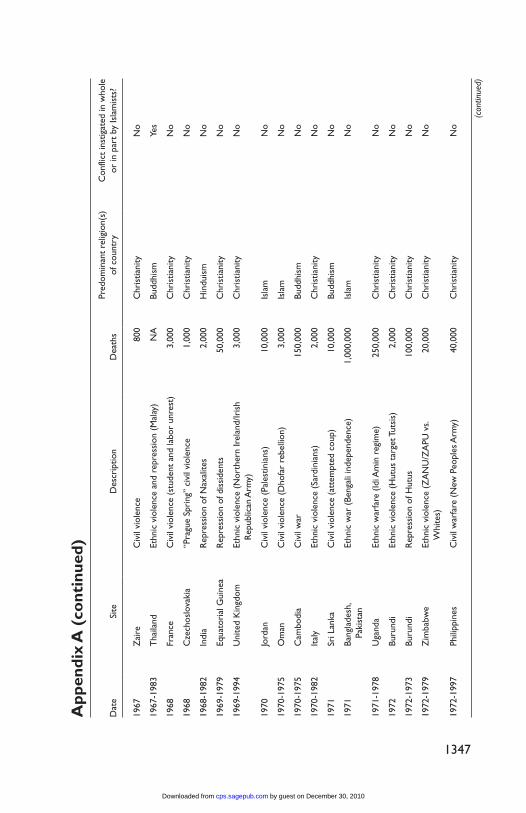
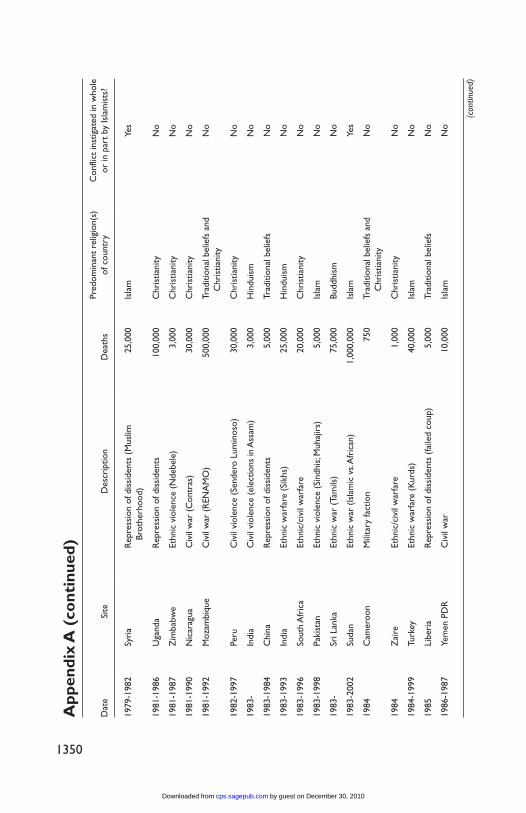
Most episodes—235 to be exact—were domestic (intrastate) in nature. This is the universe of cases we examine here. A complete list of these epi-sodes, including the relevant data about them used in this article, is found in Appendix A.
From this list, we may extract several valuable pieces of data. One is how many episodes occurred in Islamic countries and how many took place else-where. These numbers provide only a starting point, however. The severity of the episodes varies widely, and we need to consider the toll each episode took in terms of human life. Marshall provides estimates on the number of deaths that each episode produced. His figures are necessarily rough and round because we lack precise body counts for many civil conflagrations.
Muslims and Large-Scale Political ViolenceWe aim to assess how much mass political violence has occurred among Muslims compared to among people of other creeds. First, let us have a look at the raw numbers.
We may start with a rudimentary classification of the world’s countries and examination of the distribution of conflicts. Of the 171 countries in the world with populations of 250,000 or more inhabitants, 43 (25%) are pre-dominantly Muslim.1 Now, of the 235 major episodes of intrastate political violence, 76 (32%) happened in Islamic countries. Thus, Islamic countries have experienced a mildly disproportionate share of episodes.
We can cut into the data more deeply by looking at lives lost. If we sum up the body count in all 235 major episodes of political violence, the (sobering
by guest on December 30, 2010cps.sagepub.comDownloaded from
1332 Comparative Political Studies 43(11)
Table 2. Mean Scores on the Indicators of Large-Scale Political Violence
Group of countries Islamic (n = 43) Non-Islamic (n = 128) p value for t test
Average number of events 1946-2007
1.74 1.25 .15
Average number of deaths 1946-2007
129,655 120,643 .9
Percentage of population killed 1946-2007
0.65 0.72 .85
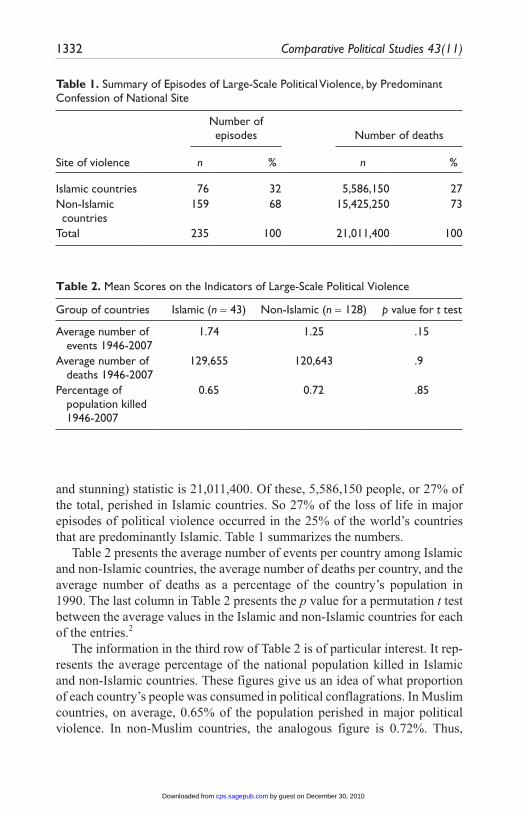
and stunning) statistic is 21,011,400. Of these, 5,586,150 people, or 27% of the total, perished in Islamic countries. So 27% of the loss of life in major episodes of political violence occurred in the 25% of the world’s countries that are predominantly Islamic. Table 1 summarizes the numbers.
Table 2 presents the average number of events per country among Islamic and non-Islamic countries, the average number of deaths per country, and the average number of deaths as a percentage of the country’s population in 1990. The last column in Table 2 presents the p value for a permutation t test between the average values in the Islamic and non-Islamic countries for each of the entries.2
The information in the third row of Table 2 is of particular interest. It rep-resents the average percentage of the national population killed in Islamic and non-Islamic countries. These figures give us an idea of what proportion of each country’s people was consumed in political conflagrations. In Muslim countries, on average, 0.65% of the population perished in major political violence. In non-Muslim countries, the analogous figure is 0.72%. Thus,
Table 1. Summary of Episodes of Large-Scale Political Violence, by Predominant Confession of National Site
Number of episodes Number of deaths
Site of violence n % n %
Islamic countries 76 32 5,586,150 27Non-Islamic countries
159 68 15,425,250 73
Total 235 100 21,011,400 100
by guest on December 30, 2010cps.sagepub.comDownloaded from

Fish et al. 1333
Muslim countries have, on average, suffered slightly less severely from loss of life in major episodes of political violence than have non-Muslim countries.
Examining the data in Table 2 shows that although the number of events per country in Islamic countries is on average slightly higher than in non-Islamic countries, there have been fewer deaths as a proportion of the popula-tion related to political violence in Islamic countries than in non-Islamic countries. Yet none of the differences is statistically significant. In Figure 1, we present a graphical representation of how the number of events, the total number of deaths, and the number of deaths as percentage of the population of the country in 1990 are associated with the proportion of Muslims in a population. As can be seen in the plots, dividing the sample into Islamic and non-Islamic countries is quite arbitrary because there is no clear clustering at high or low levels of percentage Muslims in the population. In the analysis below we therefore choose to use as a variable the proportion of Muslims in a population rather than dividing the world into Islamic and non-Islamic coun-tries as was done in the tables above.
Several other facts are worthy of note. It is apparent from the plots that there are some extreme outliers in the data at both high and low levels of Muslims in the population. An overwhelming amount of the carnage took place in a fairly small set of countries. Roughly three quarters of all deaths occurred in just nine countries. In descending order of the number of deaths, those countries are China, Vietnam, Sudan, Cambodia, the DRC (Democratic Republic of Congo, formerly called Zaire), Korea (North and South, mostly during the war of the early 1950s), Pakistan, Angola, and Afghanistan. Three of those countries are predominantly Muslim (Sudan, Pakistan, and Afghanistan), two are predomi-nantly Christian (the DRC and Angola), and in four neither Christianity nor Islam predominates (China, Vietnam, Cambodia, and Korea).
0 20 40 60 80 100
02
46
810
12
Percent Muslim
Num
ber o
f epi
sode
s 19
46−2
007
Number of events
0 20 40 60 80 1000
1000
000
2500
000
Percent Muslim
Num
ber o
f dea
ths
1946
−200
7
Number of deaths
0 20 40 60 80 100
05
1015
Percent Muslim
Perc
enta
ge o
f pop
ulat
ion
kille
d
Deaths as percentage of population
Figure 1. Correlation between political violence and Islamic population
by guest on December 30, 2010cps.sagepub.comDownloaded from

1334 Comparative Political Studies 43(11)
When we consider total deaths as a percentage of the population, the worst-off countries again represent a mélange of religious traditions. In 12 countries, 3% or more of the national population died in large-scale political violence. In descending order of percentage that perished, those countries are Cambodia, Equatorial Guinea, Angola, Rwanda, Sudan, Afghanistan, Bosnia, the DRC, Burundi, Mozambique, Korea, and Vietnam. These are the coun-tries that, in proportional terms, suffered the most severely. Three are pre-dominantly Islamic (Sudan, Afghanistan, and Bosnia) and five predominantly Christian (Equatorial Guinea, Angola, Rwanda, the DRC, and Burundi). The other four (Cambodia, Mozambique, Korea, and Vietnam) are neither pre-dominately Muslim nor predominantly Christian.
To assess whether there is a link between Islam and mass political vio-lence, we need analyses that control for the other differences between Islamic and non-Islamic countries that might be driving the difference in means that we observe.3 We run statistical models to try to approximate a conditional mean of the number of deaths for different percentages of Muslims in the population.4 We measure Islam as the percentage of the population that is made up of Muslims (Association of Religion Data Archives, 2008). Here we encounter a potential temporal problem in the data. Our data on percentage Muslim are drawn from a survey of conditions in recent decades, and our dependent variable, mass political violence, covers episodes reaching back to 1946. We do not have good cross-national data on religious composition of countries in 1946, however, so we must rely on the data we have for later years. Yet doing so probably causes little distortion because the religious composition of societies changes slowly if at all, and the correlation between conditions in, say, 1950 and 1990 is probably very high. Thus, we use the data for more recent decades as a proxy for conditions throughout the post-war period, while bearing in mind that the data are imperfect.
One of the main possible confounders in the study of political violence is socioeconomic development. We might expect richer countries to be less con-flict prone than poorer countries. Where want is more widespread, mass vio-lence may be more likely. Ethnic fractionalization may also be of importance. Higher fractionalization may be conducive to greater intercommunal tension and more mass political violence. Socioeconomic inequality may threaten civil peace as well. We would hypothesize that higher inequality would be associated with more violence. The level of democracy might also exert influence. Here the effect could cut either way. More open government might furnish channels for the peaceful resolution of differences among groups and thereby reduce the risk of large-scale violence. But a counterhypothesis is also plausible. Authoritarian regimes, by virtue of their greater harshness and commitment to imposed stability, may be better than democracies at staving
by guest on December 30, 2010cps.sagepub.comDownloaded from

Fish et al. 1335
off mass political violence. The robustness of the state apparatus is another potentially important variable. Many analysts hold that weak states are far more vulnerable to mass political violence than stronger ones.
This is by no means a complete set of possible predictors of large-scale intrastate violence. But it does cover many of what have often been considered the main explanatory variables. Finding data even for the variables outlined here is difficult, however. The main problem is that we are examining events that cover a substantial period of time (about 60 years, starting with the first year after the end of World War II). It would be ideal to have data for each country for our control variables for 1946, which we could treat as the starting point of the period, or for each year starting from 1945 or 1946, which might allow for time-series analysis. But we lack such data. We lack good information on level of socioeconomic development, measured as income per capita and life expectancy, for the early postwar years. We have some numbers, but prior to the 1970s data for many countries are missing and what we have are often of dubious reliability. The further we move back in history, the less plentiful the data become. Even the most complete sources lack data for many countries for GDP (or income) per capita, fertility rate, life expectancy, infant mortality, and the proportion of the population engaged in agriculture.5 Our best hope is to rely on data on fertility rates for a midpoint in the interval of time we are con-sidering. Here we measure socioeconomic development as total fertility rate (births per woman) from 1970 to 1975, as reported by the United Nations Development Programme in a recent report.6 Lower fertility rates indicate higher socioeconomic development. Thus, if higher levels of development pro-mote civil peace, we would expect to find a positive relationship between fertil-ity rates and deaths per capita in large-scale political violence.
We lack data on ethnic fractionalization specifically for the immediate post-war period. But because ethnic composition is relatively stable, we may consider the numbers we have to be acceptable estimates of conditions throughout the postwar years (Alesina, Easterly, Devleeschauwer, Kurlat, & Warcziarg, 2002). We would expect greater fractionalization to cause more political violence.
Data on socioeconomic inequality, which is measured using the Gini index, are too sparse and unreliable for decades preceding the 1990s to be used here. This variable we must omit.
We do have some data for the openness of political regime, and we use those scores here. Freedom House ratings began appearing only in the mid-1970s. Here we use data for Freedom House scores in 1975 (Freedom House, 2008).7 Scores range from 1 (most open polity) to 7 (least open polity). We flip the scores, such that 7 represents most open and 1 least open, to provide more intui-tive presentation. For the countries of the former Soviet Union, we use the Soviet Union’s score in 1975; for those of the former Yugoslavia, Yugoslavia’s
by guest on December 30, 2010cps.sagepub.comDownloaded from

1336 Comparative Political Studies 43(11)
score in that same year; for the Czech Republic and Slovakia, Czechoslovakia’s score in that year.8
Including a control for the robustness of the state apparatus, which may affect the risk of large-scale political violence, would be desirable, but it is not practi-cable. We have several good sources of quantitative data based on expert sur-veys, but they apply only to the past decade or so (Kaufmann, Kraay, & Mastruzzi, 2008; Marshall & Cole, 2008). We may, however, use a dichotomous variable for when countries received their independence. Countries that did not enjoy independent statehood as of the beginning of the previous century may be more likely to have weak state structures than those that obtained statehood earlier. Countries that were not independent by the year 1900 include those that were constituents of empires and that were under colonial rule. Here we control for that factor using a dichotomous (dummy) variable, with 1 standing for coun-tries whose history of independent statehood postdates the beginning of the 20th century and 0 for those that did enjoy independent statehood before 1900. If late national independence is associated with weaker state structures and thus with a higher propensity to suffer large-scale political violence over the past six decades, we would expect a positive relationship between the dummy variable for late statehood and deaths because of political violence.
If we were attempting definitively to assess the causes of large-scale polit-ical violence, the data available to us and the methods we use would be inad-equate. But we have no such pretension. We seek only to ascertain the correlation between a single factor, the Muslim proportion of the population, and mass political violence. The other regressors are merely controls. Thus, the short-age of stellar data need not derail our investigation.
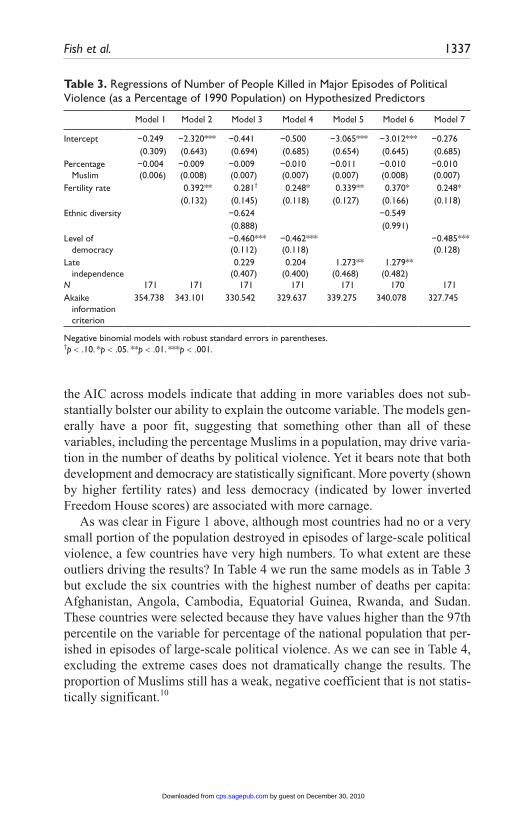
Deaths as a percentage of the population in major episodes of political violence constitutes our outcome variable. If Muslims are more prone to mass political violence, we should see a positive relationship between per-centage of the population made up of Muslims and the outcome variable; if Muslims are less prone to mass political violence, the relationship should be negative. Table 3 shows the results of the statistical analyses.
We rely on negative binomial regression, which is commonly used to estimate count models in which many cases have very low scores on the dependent vari-able.9 In the negative binomial models presented in Tables 3 and 4, the coeffi-cients are log odds ratios. The variable of interest is the percentage Muslims in the country. As Table 3 shows, the coefficient for this variable is weakly negative, indicating that countries with a higher percentage of Muslims have slightly lower levels of large-scale political violence even when we control for other variables. The coefficient is not, however, statistically significant at conventional levels.
The Akaike information criterion (AIC) is a goodness-of-fit measure for which the smallest value suggests the best fit. The diminutive differences in
by guest on December 30, 2010cps.sagepub.comDownloaded from
Fish et al. 1337
the AIC across models indicate that adding in more variables does not sub-stantially bolster our ability to explain the outcome variable. The models gen-erally have a poor fit, suggesting that something other than all of these variables, including the percentage Muslims in a population, may drive varia-tion in the number of deaths by political violence. Yet it bears note that both development and democracy are statistically significant. More poverty (shown by higher fertility rates) and less democracy (indicated by lower inverted Freedom House scores) are associated with more carnage.
As was clear in Figure 1 above, although most countries had no or a very small portion of the population destroyed in episodes of large-scale political violence, a few countries have very high numbers. To what extent are these outliers driving the results? In Table 4 we run the same models as in Table 3 but exclude the six countries with the highest number of deaths per capita: Afghanistan, Angola, Cambodia, Equatorial Guinea, Rwanda, and Sudan. These countries were selected because they have values higher than the 97th percentile on the variable for percentage of the national population that per-ished in episodes of large-scale political violence. As we can see in Table 4, excluding the extreme cases does not dramatically change the results. The proportion of Muslims still has a weak, negative coefficient that is not statis-tically significant.10
Table 3. Regressions of Number of People Killed in Major Episodes of Political Violence (as a Percentage of 1990 Population) on Hypothesized Predictors
Model 1 Model 2 Model 3 Model 4 Model 5 Model 6 Model 7
Intercept −0.249 −2.320*** −0.441 −0.500 −3.065*** −3.012*** −0.276(0.309) (0.643) (0.694) (0.685) (0.654) (0.645) (0.685)
Percentage Muslim
−0.004 (0.006)
−0.009 (0.008)
−0.009 (0.007)
−0.010 (0.007)
−0.011 (0.007)
−0.010 (0.008)
−0.010 (0.007)
Fertility rate 0.392** 0.281† 0.248* 0.339** 0.370* 0.248*(0.132) (0.145) (0.118) (0.127) (0.166) (0.118)
Ethnic diversity −0.624 −0.549(0.888) (0.991)
Level of democracy
−0.460*** (0.112)
−0.462*** (0.118)
−0.485*** (0.128)
Late independence
0.229 (0.407)
0.204 (0.400)
1.273** (0.468)
1.279** (0.482)
N 171 171 171 171 171 170 171Akaike
information criterion
354.738 343.101 330.542 329.637 339.275 340.078 327.745
Negative binomial models with robust standard errors in parentheses.†p < .10. *p < .05. **p < .01. ***p < .001.
by guest on December 30, 2010cps.sagepub.comDownloaded from

1338 Comparative Political Studies 43(11)
We may graphically illustrate the model’s estimate of the relationship between percentage Muslim and predicted percentage of the population killed in major episodes of political violence. Figure 2 shows the estimated relationships. The left-hand plot shows the association between the percent-age Muslims in a country and the predicted percentage of the population that died because of mass political violence from 1946 to 2007. The predic-tion is based on Model 3 presented in Table 3, holding fertility rate and level of democracy to their mean value and late national independence to 1. Moving from being 0% Muslim to 100% Muslim is associated with a 0.32 percentage point reduction in the predicted proportion of the population killed in episodes of large-scale political violence. Yet, as is reported in Table 3, this reduction is not statistically significant. We cannot be confi-dent that there is actually a systematic difference in levels of violence between countries with larger and smaller Muslim populations. The right-hand plot shows the relationship without outliers, as predicted by Model 3 in Table 4. Moving from a country with 0% to 100% Muslims is associated with a 0.18 percentage point reduction in the proportion of the population destroyed in mass political violence, but again this reduction is not statisti-cally distinguishable from 0.
Table 4. Regressions of Number of People Killed in Major Episodes of Political Violence (as a Percentage of 1990 Population) on Hypothesized Predictors, Excluding the Major Outliers in the Data
Model 1 Model 2 Model 3 Model 4 Model 5 Model 6 Model 7
Intercept −1.026*** −2.074** −0.794 −0.809 −2.394*** −2.394*** −0.789(0.227) (0.715) (0.679) (0.726) (0.673) (0.652) (0.763)
Percentage Muslim
−0.002 (0.004)
−0.006 (0.007)
−0.008 (0.007)
−0.008 (0.006)
−0.008 (0.007)
−0.007 (0.007)
−0.008 (0.007)
Fertility rate 0.219 0.153 0.141 0.197 0.200 0.141(0.146) (0.163) (0.137) (0.150) (0.178) (0.135)
Ethnic diversity −0.211 −0.041(0.940) (0.982)
Level of democracy
−0.289** (0.092)
−0.289** (0.096)
−0.291** (0.102)
Late independence
0.039 (0.423)
0.019 (0.416)
0.589 (0.455)
0.590 (0.451)
N 165 165 165 165 165 164 165Akaike
information criterion
255.575 252.227 249.781 248.203 252.513 253.994 246.205
Negative binomial models with robust standard errors in parentheses.**p < .01. ***p < .001.
by guest on December 30, 2010cps.sagepub.comDownloaded from

Fish et al. 1339
To sum up the findings of this section, we find some evidence that Muslims are less inclined to large-scale political violence than non-Muslims, but the difference is small and not statistically distinguishable from zero. The sound-est conclusion we can draw is that we find no evidence that Muslims are more inclined than non-Muslims to large-scale political violence.
Islamism and Large-Scale Political ViolenceSo far we have examined the relationship between Muslims and mass politi-cal violence. But what about the impact of radical Islamism, as opposed to Muslims? Above, we found that countries with larger shares of Muslims in the population do not have higher death rates from mass political violence. But it still is possible that Islamists are responsible for a grossly disproportionate amount of the world’s mass political violence. Radical Islamism is a potent ideology—or, rather, multiplicity of ideologies—whose adherents are some-times inclined to force. Even if most Muslims disapprove of Islamist ideolo-gies and violent methods, and even if, as shown above, Muslim lands are not disproportionately afflicted by large-scale political violence, it is possible that Islamists, as bearers of a distinct cause or ideology, may be responsible for an inordinate amount of mass political violence.
The findings of some writers might lead one to such a conclusion. Monica Duffy Toft (2007) finds that in the 42 religious civil wars that took place between 1940 and 2000, incumbent governments and rebels who identified with Islam
0 20 40 60 80 100
0.0
0.2
0.4
0.6
0.8
Percent Muslim
Pre
dict
ed p
erce
nt d
eath
s
All data
0 20 40 60 80 100
0.0
0.2
0.4
0.6
0.8
Percent MuslimP
redi
cted
per
cent
dea
ths
Without outliers
Figure 2. Predicted percentage of people killed in large-scale episodes of political violence
by guest on December 30, 2010cps.sagepub.comDownloaded from

1340 Comparative Political Studies 43(11)
were involved in a far greater percentage of wars than were governments and rebels who identified with other religions. Toft explains her finding in terms of numerous factors, including the historical absence in the Islamic world of an inter-necine religious war analogous to Europe’s Thirty Years’ War in the 17th century, the spatial proximity of Islam’s holiest sites to Israel and to large oil reserves, and the concept of jihad. Toft’s findings may help explain why Islamists are more frequently involved in religious civil wars than are partisans of other religions. Our main question and our data, however, differ from Toft’s. She focuses specifically on religious wars, whereas we examine all large-scale episodes of political vio-lence and ask when Islamists had a role in making those conflicts.
To answer the question, we have coded all episodes of large-scale political violence in terms of whether or not Islamists were involved in instigating the conflict. In making this judgment, we relied on press reports, secondary sources, and personal communication with country specialists. We identified Islamists in terms of actors’ self-identification as well as the way they are perceived by governments and observers. Assessing whether or not Islamists were culpable is, for the vast majority of cases, unproblematic. Little sleuth-ing is required. Most of the episodes are protracted conflicts whose perpetra-tors operated openly and whose identities are not difficult to establish.
In some cases coding required judgment calls. For example, the war in Chechnya in the 1990s pitted insurgents from a largely Muslim region against the central government in a largely Christian society. But the initiators of the conflict were ethnonationalists who sought separation from Russia; they were not Islamists. The insurgents subsequently attracted funding from the likes of Saudi Arabia, and their struggle became something of a cause célèbre among Islamists abroad. Some of the insurgents themselves, moreover, even-tually took up the banner of Islam. At the time of the war’s initiation, however, the insurgents were almost uniformly nominal Muslims who neither identi-fied themselves nor were identified by the Russian or other governments as Islamists. We therefore code this conflict as not having been instigated by Islamists. The civil war of the 1990s in Tajikistan, by contrast, we code as having Islamist perpetrators. Some observers regard the protagonists in this war largely as rival clans and regional elites, not as militant religionists, and do not regard Islamists as responsible for the war’s initiation. Yet because some forces that clearly identified themselves as Islamists were involved in the onset of the war, we code the conflict as having been instigated by Islamists (Heathershaw, 2009; Hughes, 2008; Lieven, 1999; Jonson, 2006).
To ensure transparency, we present the coding in the table presented in Appendix A. We ask whether or not the conflict was “instigated in whole or in part by Islamists.” The answer (yes or no) is presented in the right-most column of the table.
by guest on December 30, 2010cps.sagepub.comDownloaded from

Fish et al. 1341
Cases are coded yes even if Islamists were only partially responsible. Sometimes Islamists were only one of several instigators, and perhaps not the main one. For example, the genocide against communists and ethnic Chinese that took place as the Suharto regime consolidated power in Indonesia in 1965-1966 is coded as yes even though Islamists were only one of several culprits. In this case, Islamists were arguably more tools of Suharto’s—decidedly secularist—military than prime movers. In another genre of episode, Islamists were partially involved in instigation of violence but did more dying than killing. Thus, Islamists are coded as being “in whole or in part” responsible for the instigation of the civil violence that took 2,000 lives in Egypt from 1992 to 1999, though agents of the secularist government may have killed more of their Islamist foes than the other way around.
Of the 235 major episodes of intrastate political violence, Islamists par-ticipated in instigating 27, or 11% of the total. Of the 21,011,400 deaths causes by all episodes, 3,402,700, or 16%, occurred in the episodes in which Islamists were involved in instigation. Table 5 summarizes the numbers.
We may compare the numbers on Islamist-instigated violence to those on episodes that actors other than Islamists instigated. The brief accounts pro-vided in the “description” column in Appendix A contain the needed informa-tion. Ten episodes (4% of the global total), accounting for 3,069,020 deaths (15% of the global total), occurred in China and Taiwan in revolutionary and postrevolutionary hostilities stemming from the Chinese Communist Party’s coming to and holding of power. These episodes exacted approximately the same number of deaths as all episodes in which Islamists were wholly or partly responsible for the instigation of conflict. A total of 26 episodes (11% of the total), accounting for 3,830,300 deaths (18% of the total), occurred in the six Middle and East African nations of Angola, Burundi, Congo-Brazzaville, the DRC or Zaire, Rwanda, and Uganda. Government forces and partisans of rival ethnic groups bear responsibility for these conflicts, whose frequency and death toll were roughly equivalent to those of the conflicts in which
Table 5. Summary of Episodes of Large-Scale Political Violence, by Instigator
InstigatorNumber of episodes %
Number of deaths %
Islamists at least partially responsible
27 11 3,402,700 16
Islamists not responsible
208 89 17,608,700 84
Total 235 100 21,011,400 100
by guest on December 30, 2010cps.sagepub.comDownloaded from

1342 Comparative Political Studies 43(11)
Islamists bore some responsibility. None of these countries is primarily Islamic, nor were the instigators of any of these conflicts Islamists.
Is Islamist-instigated conflict responsible for a disproportionate amount of violence? Are the 11% of episodes and 16% of deaths for which Islamists bear some responsibility a grossly disproportionate amount or not? Here the reader must make his or her own judgment. We simply have no base rate or objective standard against which to judge. Our assessments are further complicated when we consider that some of the conflicts that Islamists participated in ignit-ing were also instigated by other actors who bear joint responsibility. Indeed, in some of the episodes that we code as Islamist instigated, Islamists were only one of several initiators of the conflict, and in some cases they were not neces-sarily either the leading initiators of the conflict or the main culprits for blood-letting during the course of the episode. All we can say with certainty is that Islamists do bear some responsibility for major episodes of political violence in the postwar world but that some other actors have been responsible for as much large-scale political violence as Islamists have.
ConclusionLarge-scale political violence is not disproportionately common or deadly in Muslim lands. When we control for possible confounding variables in regressions that treat countries as units of analysis, a higher percentage of Muslims is actually associated with a bit less carnage in major episodes of intrastate political violence. But the effect is small and tenuous; the empirical evidence does not allow us to conclude that Muslims are less prone than non-Muslims to political violence. All we can say for sure is that we turn up no evidence that countries with a larger share of Muslims have experienced a disproportionate share of carnage in political strife in the postwar period. Our finding of a nonrelationship contradicts portrayals of Muslim lands as dis-proportionately afflicted by large-scale civil conflict.
Whether Islamists are responsible for an inordinate amount of the world’s large-scale political violence is a separate question. It is difficult to answer. Whether the share of conflicts that Islamists had a hand in initiating is dispro-portionate or not is in the eye of the observer. Islamists bore some responsibility for 11% of major episodes of political violence, which account for 16% of deaths. In the view of the authors, these numbers are not negligible, but neither are they overwhelming. Non-Islamist actors, such as revolutionary forces in China and partisans of interethnic struggles in Middle and East Africa, had a hand in instigating roughly as much strife and loss of life as Islamists did. Islamism has indeed been a wellspring of large-scale political violence in the postwar world, but it has been only one of numerous such sources.
by guest on December 30, 2010cps.sagepub.comDownloaded from

App
endi
x A
Com
preh
ensiv
e Li
st o
f Maj
or E
piso
des
of In
trast
ate
Polit
ical V
iole
nce,
1946
-200
7
Dat
eSi
teD
escr
iptio
nD
eath
sPr
edom
inan
t re
ligio
n(s)
of
cou
ntry
Con
flict
inst
igat
ed in
who
le
or in
par
t by
Isla
mis
ts?
1945
-194
7Ir
anA
zerb
aija
ni a
nd K
urd
rebe
llion
s2,
000
Isla
mN
o
1945
-194
9G
reec
eG
reek
civ
il w
ar15
0,00
0C
hris
tiani
tyN
o
1946
Boliv
iaC
ivil
viol
ence
1,00
0C
hris
tiani
tyN
o
1946
-195
0C
hina
Chi
nese
civ
il w
ar1,
000,
000
Trad
ition
al b
elie
fsN
o
1947
Chi
naR
epre
ssio
n of
Tai
wan
dis
side
nts
20,0
00Tr
aditi
onal
bel
iefs
No
1947
Para
guay
Civ
il vi
olen
ce (
Libe
rals
)1,
000
Chr
istia
nity
No
1947
-194
8Ye
men
AR
Civ
il vi
olen
ce (
Yahy
a cl
an c
oup
atte
mpt
)5,
000
Isla
mN
o
1947
-194
9In
dia
Kas
hmir
reb
ellio
n4,
000
Hin
duis
mYe
s
1948
Col
ombi
aC
ivil
viol
ence
(C
onse
rvat
ives
)1,
000
Chr
istia
nity
No
1948
Cos
ta R
ica
Civ
il vi
olen
ce (
Nat
iona
l Uni
on)
2,00
0C
hris
tiani
tyN
o
1948
Sout
h K
orea
Civ
il vi
olen
ce (
Arm
y)1,
000
Budd
hism
No
1948
Indi
aC
ivil
viol
ence
(H
yder
abad
)20
0H
indu
ism
No
1948
-195
6M
alay
sia
Rep
ress
ion
of C
hine
se b
y M
alay
mili
tia12
,500
Isla
mN
o
1948
-M
yanm
ar (
Burm
a)Et
hnic
war
(K
aren
, Sha
n, a
nd o
ther
s)10
0,00
0Bu
ddhi
smN
o
1948
-196
0C
olom
bia
“La V
iole
ncia
” ci
vil w
ar (
Libe
rals
)25
0,00
0C
hris
tiani
tyN
o
1950
Indo
nesi
aEt
hnic
vio
lenc
e (M
oluc
cans
)5,
000
Isla
mN
o
1950
-195
1C
hina
Rep
ress
ion
of t
he la
ndlo
rds
1,50
0,00
0Tr
aditi
onal
bel
iefs
No
1950
-195
2Ph
ilipp
ines
Civ
il vi
olen
ce (
Huk
s)10
,000
Chr
istia
nity
No
1950
-195
3N
orth
Kor
ea,
Sout
h K
orea
Kor
ean
War
(ci
vil w
ar)
1,50
0,00
0Bu
ddhi
smN
o
(con
tinue
d)
1343
by guest on December 30, 2010cps.sagepub.comDownloaded from

Dat
eSi
teD
escr
iptio
nD
eath
sPr
edom
inan
t re
ligio
n(s)
of
cou
ntry
Con
flict
inst
igat
ed in
who
le
or in
par
t by
Isla
mis
ts?
1950
-196
0M
alay
sia
Inde
pend
ence
and
civ
il vi
olen
ce15
,000
Isla
mN
o
1951
Tha
iland
Civ
il vi
olen
ceN
ABu
ddhi
smN
o
1952
Egyp
tC
ivil
viol
ence
(N
asse
r co
up)
1,00
0Is
lam
No
1952
Boliv
iaC
ivil
viol
ence
2,00
0C
hris
tiani
tyN
o
1952
-In
dia
Ethn
ic w
ar (
nort
heas
t tr
ibal
s; A
ssam
se
para
tists
)25
,000
Hin
duis
mN
o
1953
Indo
nesi
aC
ivil
viol
ence
(D
arul
Isla
m)
1,00
0Is
lam
Yes
1953
-195
4V
ietn
amR
epre
ssio
n of
land
lord
s15
,000
Budd
hism
No
1954
Gua
tem
ala
Civ
il vi
olen
ce (
coup
aga
inst
Arb
enz)
1,00
0C
hris
tiani
tyN
o
1954
-195
5Ta
iwan
Ethn
ic v
iole
nce
(Nat
ive
Taiw
anes
e vs
. K
MT
)5,
000
Trad
ition
al b
elie
fsN
o
1955
Cos
ta R
ica
Civ
il vi
olen
ce1,
000
Chr
istia
nity
No
1955
Taiw
anC
ivil
viol
ence
(Ta
iwan
ese
vs. K
MT
)5,
000
Trad
ition
al b
elie
fsN
o
1955
Arg
entin
aC
ivil
viol
ence
(ar
my
rebe
llion
)3,
000
Chr
istia
nity
No
1956
Nor
th V
ietn
amC
ivil
viol
ence
NA
Budd
hism
No
1956
-195
7H
aiti
Civ
il vi
olen
ceN
AC
hris
tiani
tyN
o
1956
-196
0Ye
men
AR
Ethn
ic v
iole
nce
(Yem
eni-A
dene
se c
lans
)1,
000
Isla
mN
o
1956
-196
7C
hina
Ethn
ic w
ar (
Tib
etan
s)10
0,00
0Tr
aditi
onal
bel
iefs
No
1956
-197
2Su
dan
Ethn
ic w
arfa
re (
Isla
mic
vs.
Afr
ican
)50
0,00
0Is
lam
Yes
1957
Om
anC
ivil
viol
ence
NA
Isla
mN
o
1957
-195
9C
uba
Civ
il w
ar (
Cas
tro
oust
s Ba
tista
)5,
000
Chr
istia
nity
No
App
endi
x A
(co
ntin
ued)
(con
tinue
d)
1344
by guest on December 30, 2010cps.sagepub.comDownloaded from

Dat
eSi
teD
escr
iptio
nD
eath
sPr
edom
inan
t re
ligio
n(s)
of
cou
ntry
Con
flict
inst
igat
ed in
who
le
or in
par
t by
Isla
mis
ts?
1957
-196
1In
done
sia
Civ
il vi
olen
ce (
diss
iden
t m
ilita
ry)
30,0
00Is
lam
No
1958
Leba
non
Civ
il vi
olen
ce2,
000
Isla
mN
o
1958
Iraq
Civ
il vi
olen
ce (
coup
ous
ts m
onar
chy)
2,00
0Is
lam
No
1958
Jord
anC
ivil
viol
ence
NA
Isla
mN
o
1958
-197
5N
orth
Vie
tnam
, So
uth
Vie
tnam
“Vie
tnam
War
” (c
ivil
war
)2,
000,
000
Budd
hism
No
1959
Iraq
Civ
il vi
olen
ce (
Sham
mar
tri
be)
2,00
0Is
lam
No
1959
Chi
naR
epre
ssio
n of
cou
nter
revo
lutio
nari
es50
,000
Trad
ition
al b
elie
fsN
o
1959
-196
6R
wan
daPA
RM
EHU
TU
ove
rthr
ow o
f Tut
si
mon
arch
y; re
pres
sion
of T
utsi
s75
,000
Chr
istia
nity
No
1960
-196
1Pa
kist
anEt
hnic
vio
lenc
e (P
usht
un)
1,00
0Is
lam
No
1960
-196
5Z
aire
Kat
anga
civ
il w
ar10
0,00
0C
hris
tiani
tyN
o
1960
-197
3La
osC
ivil
war
25,0
00Bu
ddhi
smN
o
1961
-199
3Ir
aqEt
hnic
war
fare
(K
urds
)15
0,00
0Is
lam
No
1962
-196
3A
lger
iaC
ivil
viol
ence
(re
bel f
actio
ns)
2,00
0Is
lam
No
1962
-197
0Ye
men
AR
Civ
il w
ar (
follo
win
g co
up)
40,0
00Is
lam
No
1962
-197
3 [1
993?
]Et
hiop
iaEr
itrea
n se
para
tists
2,00
0Is
lam
and
Chr
istia
nity
Yes
1963
Iraq
Civ
il vi
olen
ceN
AIs
lam
No
1963
Iran
Civ
il vi
olen
ce (
land
ref
orm
)1,
000
Isla
mYe
s
1963
-196
8C
ypru
sC
ivil
viol
ence
(M
akar
ios
cris
is)
2,00
0Is
lam
and
Chr
istia
nity
No
App
endi
x A
(co
ntin
ued)
(con
tinue
d)
1345
by guest on December 30, 2010cps.sagepub.comDownloaded from

Dat
eSi
teD
escr
iptio
nD
eath
sPr
edom
inan
t re
ligio
n(s)
of
cou
ntry
Con
flict
inst
igat
ed in
who
le
or in
par
t by
Isla
mis
ts?
1963
-199
3In
done
sia
Ethn
ic w
arfa
re (
Papu
an-W
est
Iria
n)15
,000
Isla
mN
o
1964
Gua
tem
ala
Civ
il vi
olen
ceN
AC
hris
tiani
tyN
o
1964
Zam
bia
Civ
il vi
olen
ce1,
000
Chr
istia
nity
No
1964
Tanz
ania
Civ
il vi
olen
ceN
AIs
lam
and
Chr
istia
nity
No
1964
Braz
ilC
ivil
viol
ence
NA
Chr
istia
nity
No
1964
-196
6K
enya
Shift
a; So
mal
i sep
arat
ism
1,00
0C
hris
tiani
tyN
o
1965
Buru
ndi
Ethn
ic v
iole
nce
(faile
d co
up; H
utu/
Tuts
i)5,
000
Chr
istia
nity
No
1965
Dom
inic
an
Rep
ublic
Civ
il vi
olen
ce3,
000
Chr
istia
nity
No
1965
Peru
Civ
il vi
olen
ceN
AC
hris
tiani
tyN
o
1965
-196
6In
done
sia
Rep
ress
ion
of C
hine
se/C
omm
unis
ts50
0,00
0Is
lam
Yes
1965
-196
8U
nite
d St
ates
Civ
il vi
olen
ce (
urba
n A
fro-
Am
eric
an
unre
st)
1,00
0C
hris
tiani
tyN
o
1965
-199
4C
had
Civ
il w
ar75
,000
Isla
mN
o
1965
-Is
rael
Ethn
ic w
ar (
Ara
b Pa
lest
inia
ns/P
ales
tine
Libe
ratio
n O
rgan
izat
ion)
20,0
00Ju
dais
mN
o
1966
Nig
eria
Rep
ress
ion
of Ib
o20
,000
Isla
m a
nd C
hris
tiani
tyN
o
1966
Uga
nda
Ethn
ic v
iole
nce
(Bug
anda
)2,
000
Chr
istia
nity
No
1966
-197
0N
iger
iaEt
hnic
war
fare
(Bi
afra
sep
arat
ism
)20
0,00
0Is
lam
and
Chr
istia
nity
No
1966
-197
5C
hina
“Cul
tura
l Rev
olut
ion”
500,
000
Trad
ition
al b
elie
fsN
o
1966
-199
6G
uate
mal
aR
epre
ssio
n of
indi
geno
us p
eopl
es15
0,00
0C
hris
tiani
tyN
o
App
endi
x A
(co
ntin
ued)
(con
tinue
d)
1346
by guest on December 30, 2010cps.sagepub.comDownloaded from
Dat
eSi
teD
escr
iptio
nD
eath
sPr
edom
inan
t re
ligio
n(s)
of
cou
ntry
Con
flict
inst
igat
ed in
who
le
or in
par
t by
Isla
mis
ts?
1967
Zai
reC
ivil
viol
ence
800
Chr
istia
nity
No
1967
-198
3T
haila
ndEt
hnic
vio
lenc
e an
d re
pres
sion
(M
alay
)N
ABu
ddhi
smYe
s
1968
Fran
ceC
ivil
viol
ence
(st
uden
t an
d la
bor
unre
st)
3,00
0C
hris
tiani
tyN
o
1968
Cze
chos
lova
kia
“Pra
gue
Spri
ng”
civi
l vio
lenc
e1,
000
Chr
istia
nity
No
1968
-198
2In
dia
Rep
ress
ion
of N
axal
ites
2,00
0H
indu
ism
No
1969
-197
9Eq
uato
rial
Gui
nea
Rep
ress
ion
of d
issi
dent
s50
,000
Chr
istia
nity
No
1969
-199
4U
nite
d K
ingd
omEt
hnic
vio
lenc
e (N
orth
ern
Irel
and/
Iris
h R
epub
lican
Arm
y)3,
000
Chr
istia
nity
No
1970
Jord
anC
ivil
viol
ence
(Pa
lest
inia
ns)
10,0
00Is
lam
No
1970
-197
5O
man
Civ
il vi
olen
ce (
Dho
far
rebe
llion
)3,
000
Isla
mN
o
1970
-197
5C
ambo
dia
Civ
il w
ar15
0,00
0Bu
ddhi
smN
o
1970
-198
2It
aly
Ethn
ic v
iole
nce
(Sar
dini
ans)
2,00
0C
hris
tiani
tyN
o
1971
Sri L
anka
Civ
il vi
olen
ce (
atte
mpt
ed c
oup)
10,0
00Bu
ddhi
smN
o
1971
Bang
lade
sh,
Paki
stan
Ethn
ic w
ar (
Beng
ali i
ndep
ende
nce)
1,00
0,00
0Is
lam
No
1971
-197
8U
gand
aEt
hnic
war
fare
(Id
i Am
in r
egim
e)25
0,00
0C
hris
tiani
tyN
o
1972
Buru
ndi
Ethn
ic v
iole
nce
(Hut
us t
arge
t Tut
sis)
2,00
0C
hris
tiani
tyN
o
1972
-197
3Bu
rund
iR
epre
ssio
n of
Hut
us10
0,00
0C
hris
tiani
tyN
o
1972
-197
9Z
imba
bwe
Ethn
ic v
iole
nce
(ZA
NU
/ZA
PU v
s. W
hite
s)20
,000
Chr
istia
nity
No
1972
-199
7Ph
ilipp
ines
Civ
il w
arfa
re (
New
Peo
ples
Arm
y)40
,000
Chr
istia
nity
No
App
endi
x A
(co
ntin
ued)
(con
tinue
d)
1347
by guest on December 30, 2010cps.sagepub.comDownloaded from

Dat
eSi
teD
escr
iptio
nD
eath
sPr
edom
inan
t re
ligio
n(s)
of
cou
ntry
Con
flict
inst
igat
ed in
who
le
or in
par
t by
Isla
mis
ts?
1972
-Ph
ilipp
ines
Ethn
ic w
arfa
re (
Mor
os)
50,0
00C
hris
tiani
tyYe
s
1973
Chi
leC
ivil
viol
ence
(ar
my
oust
er o
f Alle
nde)
5,00
0C
hris
tiani
tyN
o
1973
-197
7Pa
kist
anEt
hnic
war
fare
(Ba
luch
sep
arat
ism
)12
,000
Isla
mN
o
1974
Cyp
rus
Civ
il vi
olen
ce5,
000
Isla
m a
nd C
hris
tiani
tyN
o
1974
-197
6C
hile
Rep
ress
ion
of d
issi
dent
s (“
disa
ppea
red”
)20
,000
Chr
istia
nity
No
1974
-198
5Tu
rkey
Civ
il vi
olen
ce8,
000
Isla
mN
o
1974
-199
1Et
hiop
iaEt
hnic
war
fare
(Er
itrea
ns a
nd o
ther
s)75
0,00
0Is
lam
and
Chr
istia
nity
No
1975
Port
ugal
Civ
il vi
olen
ceN
AC
hris
tiani
tyN
o
1975
-197
8C
ambo
dia
Khm
er R
ouge
rep
ress
ion
of d
issi
dent
s1,
500,
000
Budd
hism
No
1975
-199
0La
osC
ivil
viol
ence
(re
bel L
ao a
nd H
mon
g)10
,000
Budd
hism
No
1975
-199
1In
done
sia
Ethn
ic v
iole
nce
(Ace
h)15
,000
Isla
mYe
s
1975
-199
1Le
bano
nEt
hnic
war
(va
riou
s se
cts)
100,
000
Isla
mYe
s
1975
-199
2Ba
ngla
desh
Ethn
ic w
ar (
Chi
ttag
ong
Hill
s)25
,000
Isla
mN
o
1975
-200
2A
ngol
aC
ivil
war
(U
NIT
A)
1,00
0,00
0C
hris
tiani
tyN
o
1975
-200
5A
ngol
aC
ivil
viol
ence
(C
abin
da s
epar
atis
ts;
FLEC
)3,
500
Chr
istia
nity
No
1975
-C
olom
bia
Civ
il vi
olen
ce, l
and
refo
rm, a
nd d
rug
traf
ficki
ng (
Left
: ELN
, FA
RC
, ELP
, MA
O,
M-1
9; R
ight
: MA
S, A
UC
)
55,0
00C
hris
tiani
tyN
o
1976
Sout
h A
fric
aEt
hnic
vio
lenc
e1,
000
Chr
istia
nity
No
1976
Suda
nIs
lam
ic C
hart
er F
ront
1,00
0Is
lam
Yes
App
endi
x A
(co
ntin
ued)
(con
tinue
d)
1348
by guest on December 30, 2010cps.sagepub.comDownloaded from

Dat
eSi
teD
escr
iptio
nD
eath
sPr
edom
inan
t re
ligio
n(s)
of
cou
ntry
Con
flict
inst
igat
ed in
who
le
or in
par
t by
Isla
mis
ts?
1976
-198
0A
rgen
tina
“The
Dir
ty W
ar”
repr
essi
on o
f di
ssid
ents
20,0
00C
hris
tiani
tyN
o
1976
-199
2In
done
sia
Col
onia
l war
(Ea
st T
imor
)18
0,00
0Is
lam
No
1977
-197
9Et
hiop
ia“O
gade
n W
ar”
ethn
ic v
iole
nce
(Som
alis
)10
,000
Isla
m a
nd C
hris
tiani
tyN
o
1977
-198
0Tu
rkey
Ethn
ic v
iole
nce
(Arm
enia
ns)
5,00
0Is
lam
No
1977
-198
3Z
aire
Rep
ress
ion
of d
issi
dent
s10
,000
Chr
istia
nity
No
1978
Som
alia
Mili
tary
fact
ion
500
Isla
mN
o
1978
-197
9N
icar
agua
Civ
il w
ar (
Sand
inis
tas)
40,0
00C
hris
tiani
tyN
o
1978
-199
3Ir
anC
ivil
war
(Is
lam
ic s
tate
)50
,000
Isla
mYe
s
1978
-200
2A
fgha
nist
anC
ivil
war
1,00
0,00
0Is
lam
Yes
1979
-198
0So
uth
Kor
eaU
nres
t, ri
ots,
and
gove
rnm
ent
repr
essi
on1,
000
Budd
hism
No
1979
-198
5Ir
anEt
hnic
war
(K
urds
)40
,000
Isla
mN
o
1979
-199
2El
Sal
vado
rC
ivil
war
(FM
LN)
75,0
00C
hris
tiani
tyN
o
1979
-199
8Ir
aqEt
hnic
vio
lenc
e (S
hias
)25
,000
Isla
mN
o
1980
Braz
ilR
epre
ssio
n of
dis
side
nts
(dea
th s
quad
s)1,
000
Chr
istia
nity
No
1980
Jam
aica
Civ
il vi
olen
ce (
elec
tions
)1,
000
Chr
istia
nity
No
1980
-198
5N
iger
iaEt
hnic
vio
lenc
e (Is
lam
ic g
roup
s)9,
000
Isla
m a
nd C
hris
tiani
tyYe
s
1980
-199
8C
hina
Ethn
ic v
iole
nce
(Uig
hurs
, Kaz
akhs
)10
,000
Trad
ition
al b
elie
fsN
o
1981
Gha
naC
ivil
viol
ence
(K
onko
mba
vs.
Nan
umba
)1,
000
Chr
istia
nity
No
1981
Gam
bia
SRLP
reb
ellio
n65
0Is
lam
No
App
endi
x A
(co
ntin
ued)
(con
tinue
d)
1349
by guest on December 30, 2010cps.sagepub.comDownloaded from
Dat
eSi
teD
escr
iptio
nD
eath
sPr
edom
inan
t re
ligio
n(s)
of
cou
ntry
Con
flict
inst
igat
ed in
who
le
or in
par
t by
Isla
mis
ts?
1979
-198
2Sy
ria
Rep
ress
ion
of d
issi
dent
s (M
uslim
Br
othe
rhoo
d)25
,000
Isla
mYe
s
1981
-198
6U
gand
aR
epre
ssio
n of
dis
side
nts
100,
000
Chr
istia
nity
No
1981
-198
7Z
imba
bwe
Ethn
ic v
iole
nce
(Nde
bele
)3,
000
Chr
istia
nity
No
1981
-199
0N
icar
agua
Civ
il w
ar (
Con
tras
)30
,000
Chr
istia
nity
No
1981
-199
2M
ozam
biqu
eC
ivil
war
(R
ENA
MO
)50
0,00
0Tr
aditi
onal
bel
iefs
and
C
hris
tiani
tyN
o
1982
-199
7Pe
ruC
ivil
viol
ence
(Se
nder
o Lu
min
oso)
30,0
00C
hris
tiani
tyN
o
1983
-In
dia
Civ
il vi
olen
ce (
elec
tions
in A
ssam
)3,
000
Hin
duis
mN
o
1983
-198
4C
hina
Rep
ress
ion
of d
issi
dent
s5,
000
Trad
ition
al b
elie
fsN
o
1983
-199
3In
dia
Ethn
ic w
arfa
re (
Sikh
s)25
,000
Hin
duis
mN
o
1983
-199
6So
uth
Afr
ica
Ethn
ic/c
ivil
war
fare
20,0
00C
hris
tiani
tyN
o
1983
-199
8Pa
kist
anEt
hnic
vio
lenc
e (S
indh
is; M
uhaj
irs)
5,00
0Is
lam
No
1983
-Sr
i Lan
kaEt
hnic
war
(Ta
mils
)75
,000
Budd
hism
No
1983
-200
2Su
dan
Ethn
ic w
ar (
Isla
mic
vs.
Afr
ican
)1,
000,
000
Isla
mYe
s
1984
Cam
eroo
nM
ilita
ry fa
ctio
n75
0Tr
aditi
onal
bel
iefs
and
C
hris
tiani
tyN
o
1984
Zai
reEt
hnic
/civ
il w
arfa
re1,
000
Chr
istia
nity
No
1984
-199
9Tu
rkey
Ethn
ic w
arfa
re (
Kur
ds)
40,0
00Is
lam
No
1985
Libe
ria
Rep
ress
ion
of d
issi
dent
s (fa
iled
coup
)5,
000
Trad
ition
al b
elie
fsN
o
1986
-198
7Ye
men
PD
RC
ivil
war
10,0
00Is
lam
No
App
endi
x A
(co
ntin
ued)
(con
tinue
d)
1350
by guest on December 30, 2010cps.sagepub.comDownloaded from

Dat
eSi
teD
escr
iptio
nD
eath
sPr
edom
inan
t re
ligio
n(s)
of
cou
ntry
Con
flict
inst
igat
ed in
who
le
or in
par
t by
Isla
mis
ts?
1986
-199
3N
iger
iaEt
hnic
vio
lenc
e (M
uslim
-Chr
istia
n)10
,000
Isla
m a
nd C
hris
tiani
tyYe
s
1986
-200
6U
gand
aEt
hnic
vio
lenc
e (L
ord’
s R
esis
tanc
e A
rmy:
Lang
i and
Ach
oli)
15,0
00C
hris
tiani
tyN
o
1987
Chi
leC
ivil
viol
ence
3,00
0C
hris
tiani
tyN
o
1987
-199
0Sr
i Lan
kaC
ivil
war
(Ja
nath
a Vim
ukth
i Per
amun
a-Si
nhal
ese
extr
emis
ts)
25,0
00Bu
ddhi
smN
o
1988
Mya
nmar
Civ
il vi
olen
ce (
stud
ent
prot
ests
)2,
000
Budd
hism
No
1988
Buru
ndi
Ethn
ic v
iole
nce
(Tut
sis
agai
nst
Hut
us)
10,0
00C
hris
tiani
tyN
o
1988
-199
7A
zerb
aija
nEt
hnic
war
(N
agor
no-K
arab
akh)
15,0
00Is
lam
No
1988
-199
7Pa
pua
New
G
uine
aEt
hnic
war
fare
(Bo
ugai
nvill
e)1,
000
Chr
istia
nity
No
1988
-So
mal
iaC
ivil
war
100,
000
Isla
mN
o
1989
Chi
naC
ivil
viol
ence
(T
iana
nman
pro
test
s)2,
000
Trad
ition
al b
elie
fsN
o
1989
Rom
ania
Civ
il vi
olen
ce1,
000
Chr
istia
nity
No
1990
Chi
naR
epre
ssio
n of
dis
side
nts
2,00
0Tr
aditi
onal
bel
iefs
No
1990
-199
1So
viet
Uni
onSp
orad
ic e
thni
c/co
mm
unal
vio
lenc
e5,
000
Chr
istia
nity
No
1990
-199
4R
wan
daEt
hnic
war
fare
(Tu
tsis
vs.
Hut
u re
gim
e)15
,000
Chr
istia
nity
No
1990
-199
5M
ali
Ethn
ic w
arfa
re (
Tuar
eg)
1,00
0Is
lam
No
1990
-199
7Li
beri
aC
ivil
war
40,0
00Tr
aditi
onal
bel
iefs
No
1990
-199
7N
iger
Civ
il w
ar (
Aza
wad
and
Tou
bou)
1,00
0Is
lam
No
1990
-199
7C
ambo
dia
Civ
il w
arfa
re (
Khm
er R
ouge
)5,
000
Budd
hism
No
(con
tinue
d)
App
endi
x A
(co
ntin
ued)
1351
by guest on December 30, 2010cps.sagepub.comDownloaded from

Dat
eSi
teD
escr
iptio
nD
eath
sPr
edom
inan
t re
ligio
n(s)
of
cou
ntry
Con
flict
inst
igat
ed in
who
le
or in
par
t by
Isla
mis
ts?
1990
Indi
aEt
hnic
war
(K
ashm
iris
)35
,000
Hin
duis
mYe
s
1991
Cro
atia
Civ
il w
ar (
Cro
atia
n in
depe
nden
ce)
10,0
00C
hris
tiani
tyN
o
1991
Buru
ndi
Civ
il vi
olen
ce1,
000
Chr
istia
nity
No
1991
Hai
tiC
ivil
viol
ence
(A
rist
ide
pres
iden
cy)
NA
Chr
istia
nity
No
1991
-199
3G
eorg
iaC
ivil
war
1,00
0C
hris
tiani
tyN
o
1991
-199
3K
enya
Ethn
ic v
iole
nce
(Kal
enjin
, Mas
ai, K
ikuy
u,
Luo)
2,00
0C
hris
tiani
tyN
o
1991
-199
3G
eorg
iaEt
hnic
war
(A
bkha
zian
s-O
sset
ians
)3,
000
Chr
istia
nity
No
1991
-199
3Bh
utan
Ethn
ic v
iole
nce
(Dru
kpas
vs.
Nep
ales
e)N
ABu
ddhi
smN
o
1991
-199
4D
jibou
tiFr
ont
for
the
Res
tora
tion
of U
nity
and
D
emoc
racy
(FR
UD
) re
belli
on1,
000
Isla
mN
o
1991
-199
4C
roat
iaEt
hnic
war
(Se
rbs)
40,0
00C
hris
tiani
tyN
o
1991
-199
7M
oldo
vaEt
hnic
vio
lenc
e (T
rans
dnie
ster
Rus
sian
s)2,
000
Chr
istia
nity
No
1991
-200
1Si
erra
Leo
neC
ivil/
ethn
ic w
arfa
re (
Rev
olut
iona
ry
Uni
ted
Fron
t [R
UF]
/Men
de)
25,0
00Is
lam
No
1991
-200
4A
lger
iaC
ivil
war
fare
(Is
lam
ic m
ilita
nts)
60,0
00Is
lam
Yes
1991
-200
2In
dia
Ethn
ic v
iole
nce
(Hin
du v
s. M
uslim
)3,
500
Hin
duis
mN
o
1992
-199
5Bo
snia
Ethn
ic w
ar (
Serb
s, C
roat
s, M
uslim
s)20
0,00
0Is
lam
No
1992
-199
6Z
aire
Ethn
ic v
iole
nce
10,0
00C
hris
tiani
tyN
o
1992
-199
8Ta
jikis
tan
Civ
il w
arfa
re25
,000
Isla
mYe
s
1992
-199
9Eg
ypt
Civ
il vi
olen
ce (
Isla
mic
mili
tant
s)2,
000
Isla
mYe
s
App
endi
x A
(co
ntin
ued)
(con
tinue
d)
1352
by guest on December 30, 2010cps.sagepub.comDownloaded from
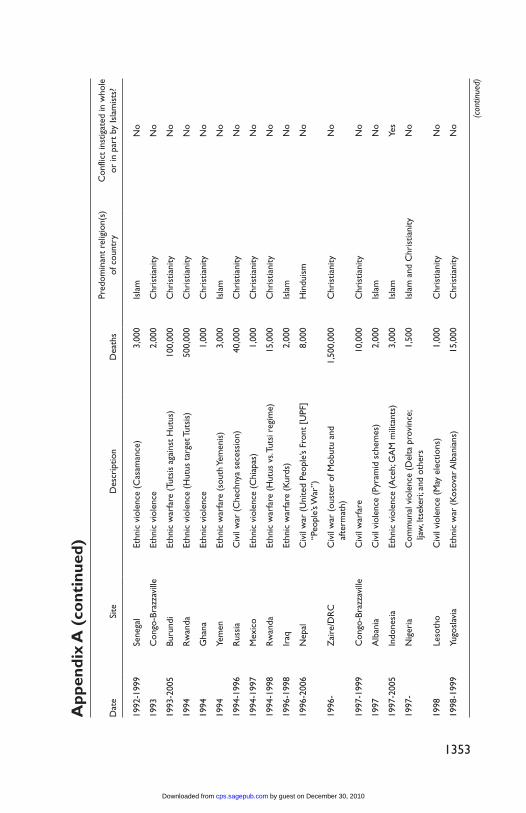
Dat
eSi
teD
escr
iptio
nD
eath
sPr
edom
inan
t re
ligio
n(s)
of
cou
ntry
Con
flict
inst
igat
ed in
who
le
or in
par
t by
Isla
mis
ts?
1992
-199
9Se
nega
lEt
hnic
vio
lenc
e (C
asam
ance
)3,
000
Isla
mN
o
1993
Con
go-B
razz
avill
eEt
hnic
vio
lenc
e2,
000
Chr
istia
nity
No
1993
-200
5Bu
rund
iEt
hnic
war
fare
(Tu
tsis
aga
inst
Hut
us)
100,
000
Chr
istia
nity
No
1994
Rw
anda
Ethn
ic v
iole
nce
(Hut
us t
arge
t Tut
sis)
500,
000
Chr
istia
nity
No
1994
Gha
naEt
hnic
vio
lenc
e1,
000
Chr
istia
nity
No
1994
Yem
enEt
hnic
war
fare
(so
uth
Yem
enis
)3,
000
Isla
mN
o
1994
-199
6R
ussi
aC
ivil
war
(C
hech
nya
sece
ssio
n)40
,000
Chr
istia
nity
No
1994
-199
7M
exic
oEt
hnic
vio
lenc
e (C
hiap
as)
1,00
0C
hris
tiani
tyN
o
1994
-199
8R
wan
daEt
hnic
war
fare
(H
utus
vs.
Tuts
i reg
ime)
15,0
00C
hris
tiani
tyN
o
1996
-199
8Ir
aqEt
hnic
war
fare
(K
urds
)2,
000
Isla
mN
o
1996
-200
6N
epal
Civ
il w
ar (
Uni
ted
Peop
le’s
Fron
t [U
PF]
“Peo
ple’
s War
”)8,
000
Hin
duis
mN
o
1996
-Z
aire
/DR
CC
ivil
war
(ou
ster
of M
obut
u an
d af
term
ath)
1,50
0,00
0C
hris
tiani
tyN
o
1997
-199
9C
ongo
-Bra
zzav
ille
Civ
il w
arfa
re10
,000
Chr
istia
nity
No
1997
Alb
ania
Civ
il vi
olen
ce (
Pyra
mid
sch
emes
)2,
000
Isla
mN
o
1997
-200
5In
done
sia
Ethn
ic v
iole
nce
(Ace
h; G
AM
mili
tant
s)3,
000
Isla
mYe
s
1997
-N
iger
iaC
omm
unal
vio
lenc
e (D
elta
pro
vinc
e;
Ijaw
, Its
eker
i; an
d ot
hers
1,50
0Is
lam
and
Chr
istia
nity
No
1998
Leso
tho
Civ
il vi
olen
ce (
May
ele
ctio
ns)
1,00
0C
hris
tiani
tyN
o
1998
-199
9Yu
gosl
avia
Ethn
ic w
ar (
Kos
ovar
Alb
ania
ns)
15,0
00C
hris
tiani
tyN
o
(con
tinue
d)
App
endi
x A
(co
ntin
ued)
1353
by guest on December 30, 2010cps.sagepub.comDownloaded from

Dat
eSi
teD
escr
iptio
nD
eath
sPr
edom
inan
t re
ligio
n(s)
of
cou
ntry
Con
flict
inst
igat
ed in
who
le
or in
par
t by
Isla
mis
ts?
1998
Indo
nesi
aC
ivil
viol
ence
(ou
ster
of S
uhar
to)
2,00
0Is
lam
No
1998
Geo
rgia
Ethn
ic w
arfa
re (
Abk
hazi
a)1,
000
Chr
istia
nity
No
1998
-199
9G
uine
a-Bi
ssau
Civ
il w
ar (
coup
att
empt
)6,
000
Trad
ition
al b
elie
fs a
nd
Isla
mN
o
1998
-200
3So
lom
on Is
land
sC
omm
unal
vio
lenc
e (M
alai
ta/Is
atab
u is
land
ers)
500
Chr
istia
nity
No
1999
Indo
nesi
aEt
hnic
vio
lenc
e (E
ast T
imor
in
depe
nden
ce)
3,00
0Is
lam
No
1999
-200
2In
done
sia
Ethn
ic v
iole
nce
(Mol
ucca
s; M
uslim
/C
hris
tian)
3,50
0Is
lam
Yes
1999
-200
0Et
hiop
iaEt
hnic
war
(O
rom
o se
para
tists
)2,
000
Isla
m a
nd C
hris
tiani
tyN
o
1999
-200
6R
ussi
aEt
hnic
war
(C
hech
en s
epar
atis
ts)
30,0
00C
hris
tiani
tyN
o
2000
-200
1G
uine
aPa
rrot
’s Be
ak c
lash
es1,
000
Isla
mN
o
2000
-200
3Li
beri
aC
ivil
viol
ence
(at
tack
s by
LU
RD
gu
erill
as)
1,00
0Tr
aditi
onal
bel
iefs
No
2000
-200
5C
ôte
d’Iv
oire
Civ
il w
ar (
nort
h, s
outh
, wes
t di
visi
ons)
3,00
0Tr
aditi
onal
bel
iefs
, Is
lam
, and
C
hris
tiani
ty
No
2001
Indo
nesi
aC
omm
unal
(D
ayak
s vs
. Mad
ures
e im
mig
rant
s)1,
000
Isla
mN
o
2001
Rw
anda
Ethn
ic w
ar (
atta
cks
by H
utu
guer
illas
)2,
500
Chr
istia
nity
No
2001
Cen
tral
Afr
ican
R
epub
licC
ivil
viol
ence
(at
tack
s by
Boz
ize
loya
lists
; co
up)
1,00
0C
hris
tiani
tyN
o
App
endi
x A
(co
ntin
ued)
(con
tinue
d)
1354
by guest on December 30, 2010cps.sagepub.comDownloaded from
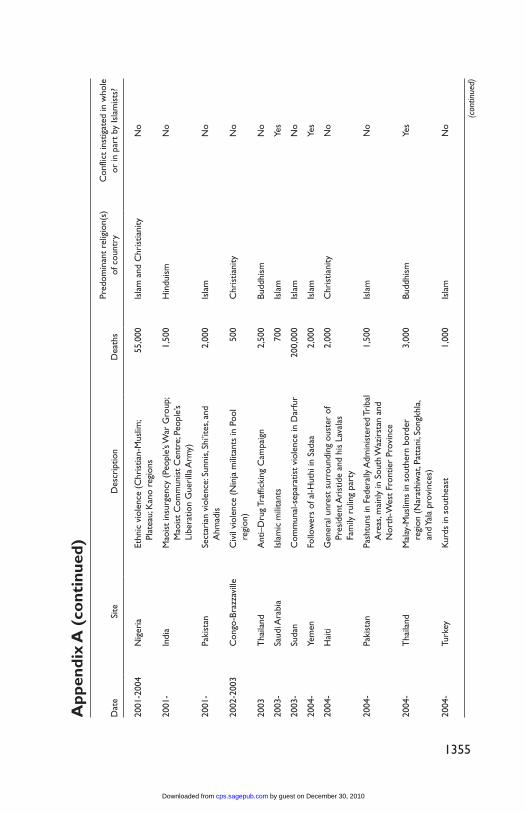
Dat
eSi
teD
escr
iptio
nD
eath
sPr
edom
inan
t re
ligio
n(s)
of
cou
ntry
Con
flict
inst
igat
ed in
who
le
or in
par
t by
Isla
mis
ts?
2001
-200
4N
iger
iaEt
hnic
vio
lenc
e (C
hris
tian-
Mus
lim;
Plat
eau;
Kan
o re
gion
s55
,000
Isla
m a
nd C
hris
tiani
tyN
o
2001
-In
dia
Mao
ist
insu
rgen
cy (
Peop
le’s
War
Gro
up;
Mao
ist
Com
mun
ist
Cen
tre;
Peo
ple’
s Li
bera
tion
Gue
rilla
Arm
y)
1,50
0H
indu
ism
No
2001
-Pa
kist
anSe
ctar
ian
viol
ence
: Sun
nis,
Shi’i
tes,
and
Ahm
adis
2,00
0Is
lam
No
2002
-200
3C
ongo
-Bra
zzav
ille
Civ
il vi
olen
ce (
Nin
ja m
ilita
nts
in P
ool
regi
on)
500
Chr
istia
nity
No
2003
Tha
iland
Ant
i–D
rug T
raffi
ckin
g C
ampa
ign
2,50
0Bu
ddhi
smN
o
2003
-Sa
udi A
rabi
aIs
lam
ic m
ilita
nts
700
Isla
mYe
s
2003
-Su
dan
Com
mun
al-s
epar
atis
t vi
olen
ce in
Dar
fur
200,
000
Isla
mN
o
2004
-Ye
men
Follo
wer
s of
al-H
uthi
in S
adaa
2,00
0Is
lam
Yes
2004
-H
aiti
Gen
eral
unr
est
surr
ound
ing
oust
er o
f Pr
esid
ent A
rist
ide
and
his
Lava
las
Fam
ily r
ulin
g pa
rty
2,00
0C
hris
tiani
tyN
o
2004
-Pa
kist
anPa
shtu
ns in
Fed
eral
ly A
dmin
iste
red
Trib
al
Are
as, m
ainl
y in
Sou
th W
azir
stan
and
N
orth
-Wes
t Fr
ontie
r Pr
ovin
ce
1,50
0Is
lam
No
2004
-T
haila
ndM
alay
-Mus
lims
in s
outh
ern
bord
er
regi
on (
Nar
athi
wat
, Pat
tani
, Son
gkhl
a, an
d Ya
la p
rovi
nces
)
3,00
0Bu
ddhi
smYe
s
2004
-Tu
rkey
Kur
ds in
sou
thea
st1,
000
Isla
mN
o
(con
tinue
d)
App
endi
x A
(co
ntin
ued)
1355
by guest on December 30, 2010cps.sagepub.comDownloaded from
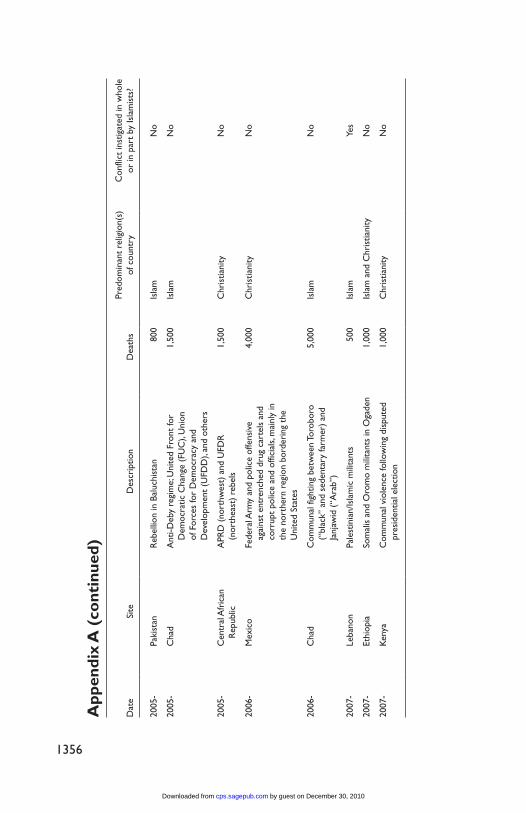
Dat
eSi
teD
escr
iptio
nD
eath
sPr
edom
inan
t re
ligio
n(s)
of
cou
ntry
Con
flict
inst
igat
ed in
who
le
or in
par
t by
Isla
mis
ts?
2005
-Pa
kist
anR
ebel
lion
in B
aluc
hist
an80
0Is
lam
No
2005
-C
had
Ant
i-Deb
y re
gim
e; U
nite
d Fr
ont
for
Dem
ocra
tic C
hang
e (F
UC
), U
nion
of
For
ces
for
Dem
ocra
cy a
nd
Dev
elop
men
t (U
FDD
), an
d ot
hers
1,50
0Is
lam
No
2005
-C
entr
al A
fric
an
Rep
ublic
APR
D (
nort
hwes
t) a
nd U
FDR
(n
orth
east
) re
bels
1,50
0C
hris
tiani
tyN
o
2006
-M
exic
oFe
dera
l Arm
y an
d po
lice
offe
nsiv
e ag
ains
t en
tren
ched
dru
g ca
rtel
s an
d co
rrup
t po
lice
and
offic
ials
, mai
nly
in
the
nort
hern
reg
ion
bord
erin
g th
e U
nite
d St
ates
4,00
0C
hris
tiani
tyN
o
2006
-C
had
Com
mun
al fi
ghtin
g be
twee
n To
robo
ro
(“bl
ack”
and
sed
enta
ry fa
rmer
) an
d Ja
njaw
id (
“Ara
b”)
5,00
0Is
lam
No
2007
-Le
bano
nPa
lest
inia
n/Is
lam
ic m
ilita
nts
500
Isla
mYe
s
2007
-Et
hiop
iaSo
mal
is a
nd O
rom
o m
ilita
nts
in O
gade
n1,
000
Isla
m a
nd C
hris
tiani
tyN
o
2007
-K
enya
Com
mun
al v
iole
nce
follo
win
g di
sput
ed
pres
iden
tial e
lect
ion
1,00
0C
hris
tiani
tyN
o
App
endi
x A
(co
ntin
ued)
1356
by guest on December 30, 2010cps.sagepub.comDownloaded from
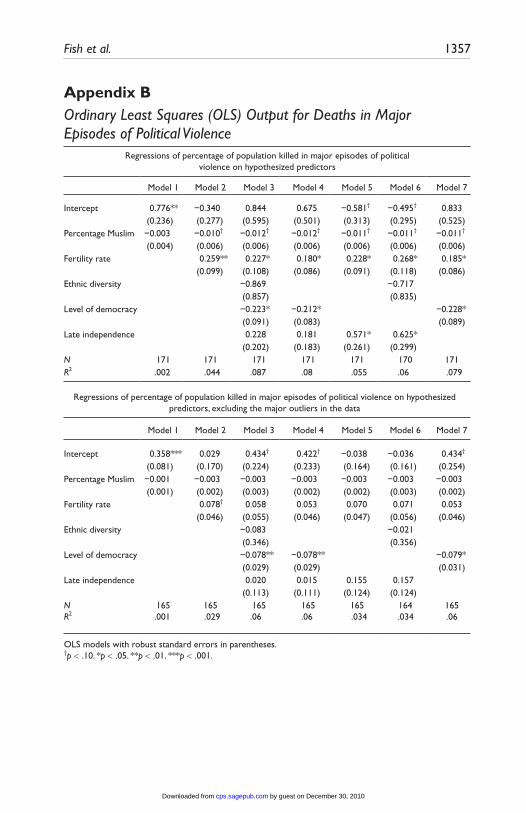
Fish et al. 1357
Regressions of percentage of population killed in major episodes of political violence on hypothesized predictors
Model 1 Model 2 Model 3 Model 4 Model 5 Model 6 Model 7
Intercept 0.776** −0.340 0.844 0.675 −0.581† −0.495† 0.833(0.236) (0.277) (0.595) (0.501) (0.313) (0.295) (0.525)
Percentage Muslim −0.003 −0.010† −0.012† −0.012† −0.011† −0.011† −0.011†
(0.004) (0.006) (0.006) (0.006) (0.006) (0.006) (0.006)Fertility rate 0.259** 0.227* 0.180* 0.228* 0.268* 0.185*
(0.099) (0.108) (0.086) (0.091) (0.118) (0.086)Ethnic diversity −0.869 −0.717
(0.857) (0.835)Level of democracy −0.223* −0.212* −0.228*
(0.091) (0.083) (0.089)Late independence 0.228 0.181 0.571* 0.625*
(0.202) (0.183) (0.261) (0.299)N 171 171 171 171 171 170 171R2 .002 .044 .087 .08 .055 .06 .079
Regressions of percentage of population killed in major episodes of political violence on hypothesized predictors, excluding the major outliers in the data
Model 1 Model 2 Model 3 Model 4 Model 5 Model 6 Model 7
Intercept 0.358*** 0.029 0.434† 0.422† −0.038 −0.036 0.434†
(0.081) (0.170) (0.224) (0.233) (0.164) (0.161) (0.254)Percentage Muslim −0.001 −0.003 −0.003 −0.003 −0.003 −0.003 −0.003
(0.001) (0.002) (0.003) (0.002) (0.002) (0.003) (0.002)Fertility rate 0.078† 0.058 0.053 0.070 0.071 0.053
(0.046) (0.055) (0.046) (0.047) (0.056) (0.046)Ethnic diversity −0.083 −0.021
(0.346) (0.356)Level of democracy −0.078** −0.078** −0.079*
(0.029) (0.029) (0.031)Late independence 0.020 0.015 0.155 0.157
(0.113) (0.111) (0.124) (0.124)N 165 165 165 165 165 164 165R2 .001 .029 .06 .06 .034 .034 .06
OLS models with robust standard errors in parentheses.†p < .10. *p < .05. **p < .01. ***p < .001.
Appendix BOrdinary Least Squares (OLS) Output for Deaths in Major Episodes of Political Violence
by guest on December 30, 2010cps.sagepub.comDownloaded from

1358 Comparative Political Studies 43(11)
Declaration of Conflicting Interests
The authors declared no potential conflicts of interests with respect to the authorship and/or publication of this article.
Financial Disclosure/Funding
The authors received no financial support for the research and/or authorship of this article.
Notes
1. We include all countries that enjoyed national independence and had populations of 250,000 or more as of 2005. To qualify as an “Islamic country,” Muslims must constitute an absolute majority among the population according to the Associ-ation of Religion Data Archives (ARDA, 2008) and the CIA World Factbook 2008 (Central Intelligence Agency, 2008). The only countries of relevance to this article in which there is divergence among these sources are Sierra Leone, which the CIA World Factbook lists as majority Muslim but the ARDA does not, and Bosnia, which the ARDA lists as majority Muslim but the CIA World Factbook does not. After consultation with other sources and country experts, we classify each country as majority Muslim.
2. The nonparametric permutation t test was chosen to avoid having to assume that the data are normally distributed. The more commonly used Welch t tests of the difference of means, which do rest on this distributional assumption, yield very similar p values to those reported here for the nonparametric per-mutation t test.
3. On possible causes of large-scale intrastate political violence, see Midlarsky (2009), Powell (1982), Rabushka and Shepsle (1972), Hegre (2001), Fearon and Laitin (2003), Montalvo and Reynal-Querol (2005), and Collier, Hoeffler, and Rohner (2009).
4. This way of thinking about regression analysis has been explicated by Freedman (2009).
5. For example, Mitchell (1993) contains a rich body of data, but for national income figures are given only in local currencies, which makes cross-national standardization (at least for the time until the 1970s or so) impossible. The only other good indicator of socioeconomic development for which this source pro-vides data is infant mortality. Here it furnishes useful data stretching back to the 19th century but for Africa prior to the 1980s provides data for only four coun-tries. Such shortages are found in other sources as well.
6. See United Nations Development Programme (2007, pp. 243-246). Numbers are unavailable in that source for Afghanistan, Iraq, Liberia, North Korea, Somalia,
by guest on December 30, 2010cps.sagepub.comDownloaded from

Fish et al. 1359
Taiwan, and Yugoslavia. For those countries data for fertility rates are for 1989 and are drawn from the CIA World Factbook 1989 (Central Intelligence Agency, 1989).
7. As an alternative source, we used the Polity scores provided by the Polity IV Project (2008). As an alternative to the Freedom House ratings for 1975, we used Polity scores for 1946 for all countries for which numbers are available, which is most countries that were independent at that time. For all others, we used the Pol-ity score for the first year of national independence. For many African countries, which were generally the last to gain independence, that time is usually 1960 or thereabout. The Polity data are less plentiful than the Freedom House data, however, and using them requires the loss of a substantial number of cases. We therefore present the results of the analyses using Freedom House ratings here. Using the Polity scores did not appreciably change the results.
8. For other countries that lack scores for 1975, data for the closest available year are used. Data for Belize are for 1981; for Djibouti, 1977; for Namibia, 1974; for Palestine Territories, 1977; and for the Solomon Islands, 1978. Data for Germany are for the Federal Republic in 1975; for Yemen, data are an average of scores for North and South Yemen in 1975.
9. Poisson models, binomial models, and negative binomial models are the most commonly used models for studying count data. These models generally, and in this case specifically, give a much better model fit than the ordinary least squares (OLS) models because the normality assumption underlying an OLS model usually is violated when using count data. Count data have a lower bound of zero and no upper bound and are seldom normally distributed. Poisson models make an assumption that the mean and the variance in the distribution are the same, whereas negative binomial models are often recommended for overdis-persed data. Overdispersion in the data can arise when the occurrence of one event increases the probability of further events, as is the case in the political vio-lence data. See Hilbe (2008). We nevertheless also conducted the analyses using standard OLS models, specified as they are here in Tables 3 and 4. The output is presented in Appendix B. In the OLS models we see a negative and significant coefficient for percentage Muslims in the population. The model fit is very poor, however, and it is hard to draw conclusions from these findings.
10. Because the standard errors of the coefficients remain almost the same across the different specifications, we have no reason to believe that there is a multicol-linearity problem driving the results in these models. We also tested for multicol-linearity by examining the variance inflation factors (VIFs) of the variables in the models presented in Tables 3 and 4. Because all VIFs are less than 2, we have no reason to believe that we have a major problem with multicollinearity. See Belsley, Kuh, and Welsch (1980).
by guest on December 30, 2010cps.sagepub.comDownloaded from

1360 Comparative Political Studies 43(11)
References
Adler, F. (1983). States not obsessed with crime. Littleton, CO: Fred B. Rothman.Alesina, A. F., Easterly, W., Devleeschauwer, A., Kurlat, S., & Warcziarg, R. T.
(2002). Fractionalization (Harvard Institute Research Working Paper No. 1959). Cambridge, MA: Harvard University.
Al-Ghannouchi, R. (2000). Secularism in the Arab Maghreb. In A. Tamimi & J. L. Esposito (Eds.), Islam and secularism in the Middle East (pp. 97-123). New York, NY: New York University Press.
Association of Religion Data Archives. (2008, September). National profiles. Retrieved from http://www.thearda.com
Belsley, D. A., Kuh, E., & Welsch, R. E. (1980). Regression diagnostics. New York, NY: John Wiley.
Bonner, M. (2008). Jihad in history: Doctrines and practice. Princeton, NJ: Princeton University Press.
Bonney, R. (2004). Jihad from Qur’an to bin Laden. New York, NY: Palgrave Macmillan.Central Intelligence Agency. (1989). CIA world factbook 1989. Washington, DC: Author.Central Intelligence Agency. (2008). CIA world factbook 2008. Washington, DC:
Skyhorse.Collier, P., Hoeffler, A., & Rohner, D. (2009). Beyond greed and grievance: Feasibil-
ity and civil war. Oxford Economic Papers, 61, 1-27.Cook, D. (2005). Understanding jihad. Berkeley: University of California Press.Fearon, J. D., & Laitin, D. D. (2003). Ethnicity, insurgency, and civil war. American
Political Science Review, 97, 75-90.Freedman, D. A. (2009). Statistical models: Theory and practice. New York, NY:
Cambridge University Press.Freedom House. (2008, December). Freedom in the world. Retrieved from http://
freedomhouse.orgHeathershaw, J. (2009). Post-conflict Tajikistan: The politics of peacebuilding and the
emergence of legitimate order. New York, NY: Routledge.Hegre, H. (2001). Toward a democratic civil peace? Democracy, political change, and
civil war, 1816–1992. American Political Science Review, 95, 33-48.Helal, A. A., & Coston, C. T. M. (1995). Low crime rates in Bahrain: Islamic social
control testing the theory of synnomie. In C. B. Fields & R. H. Moore (Eds.), Comparative criminal justice: Traditional and nontraditional systems of law and control (pp. 30-47). Long Grove, IL: Waveland.
Hilbe, J. M. (2008). Negative binomial regression. Cambridge, UK: Cambridge Uni-versity Press.
Hughes, J. (2008). Chechnya: From nationalism to jihad. Philadelphia: University of Pennsylvania Press.
by guest on December 30, 2010cps.sagepub.comDownloaded from
Fish et al. 1361
Huntington, S. P. (1996). The clash of civilizations and the remaking of the modern world. New York, NY: Simon & Schuster.
Jonson, L. (2006). Tajikistan in the new Central Asia: Geopolitics, great power rivalry and radical Islam. New York, NY: I. B. Tauris.
Kaufmann, D., Kraay, A., & Mastruzzi, M. (2008, August). Governance matters 2008: Worldwide governance indicators 1996-2007. Retrieved from http://info .worldbank.org/governance/wgi/mc_countries.asp
Kelsay, J. (2007). Arguing the just war in Islam. Cambridge, MA: Harvard University Press.
Lawrence, B. B. (2000). Shattering the myth: Islam beyond violence. Princeton, NJ: Princeton University Press.
Lieven, A. (1999). Chechnya: Tombstone of Russian power. New Haven, CT: Yale University Press.
Lukens-Bull, R. (2005). A peaceful jihad: Negotiating identity and modernity in Mus-lim Java. New York, NY: Palgrave Macmillan.
Marshall, M. G. (2008, October). Major episodes of political violence 1946-2008. Retrieved from http://systemicpeace.org/warlist.htm
Marshall, M. G., & Cole, B. R. (2008, September). Global report on conflict, gover-nance, and state fragility, 2008. Foreign Policy Bulletin. Retrieved from http://www.systemicpeace.org/Global%20Report%202008.pdf
Midlarsky, M. I. (2009). Handbook of war studies III: The intrastate dimension. Ann Arbor: University of Michigan Press.
Mitchell, B. R. (1993). International historical statistics (2nd rev. ed., 3 vols.). New York, NY: Stockton.
Montalvo, J. G., & Reynal-Querol, M. (2005). Ethnic polarization, potential conflict, and civil wars. American Economic Review, 95, 796-816.
Montesquieu, C. L. D. S. (1995). The spirit of the laws (A. M. Cohler, B. C. Miller, & H. S. Stone, Eds.). Cambridge, UK: Cambridge University Press.
Neapolitan, J. L. (1997). Homicides in developing nations: Results of research using a large and representative sample. International Journal of Offender Therapy and Comparative Criminology, 41, 358-374.
Polity IV Project. (2008, July). Political regime characteristics and transitions. Retrieved from http://www.systemicpeace.org/polity/polity4.htm
Powell, G. B. (1982). Contemporary democracies: Participation, stability, and vio-lence. Cambridge, MA: Harvard University Press.
Rabushka, A., & Shepsle, K. A. (1972). Politics in plural societies. Columbia, OH: Merrill.
Souryal, S. S. (1987). The religionization of society: The continuing application of Sharia law in Saudi Arabia. Journal for the Scientific Study of Religion, 26, 429-449.
by guest on December 30, 2010cps.sagepub.comDownloaded from

1362 Comparative Political Studies 43(11)
Toft, M. D. (2007). Getting religion? The puzzling case of Islam and civil war. Inter-national Security, 31(4), 97-131.
United Nations Development Programme. (2007). Human development report 2007-2008. New York, NY: Palgrave Macmillan.
Bios
M. Steven Fish is a professor of political science at the University of California, Berkeley. His most recent book is The Handbook of National Legislatures: A Global Survey, coauthored with Matthew Kroenig (2009).
Francesca R. Jensenius is a graduate student in the Department of Political Science at the University of California, Berkeley. Her dissertation focuses on how the use of political quotas in India has influenced various forms of societal inequality.
Katherine E. Michel is a graduate student in the Department of Political Science at the University of California, Berkeley. Her research investigates the “democratic paradox,” wherein antidemocratic forces may come to power through free elections, and whether the paradox is more acute in primarily Muslim nations than elsewhere.
by guest on December 30, 2010cps.sagepub.comDownloaded from
Related Documents