Comparative Overview of Dashboard Indicators for Counties in the Austin-Round Rock-San Marcos MSA Intergovernmental Public Policy Committee June 15, 2012

Comparative Overview of Dashboard Indicators for Counties in the Austin-Round Rock-San Marcos MSA Intergovernmental Public Policy Committee June 15, 2012.
Dec 18, 2015
Welcome message from author
This document is posted to help you gain knowledge. Please leave a comment to let me know what you think about it! Share it to your friends and learn new things together.
Transcript

Comparative Overview of Dashboard Indicators for Counties in
the Austin-Round Rock-San Marcos MSA
Intergovernmental Public Policy Committee June 15, 2012

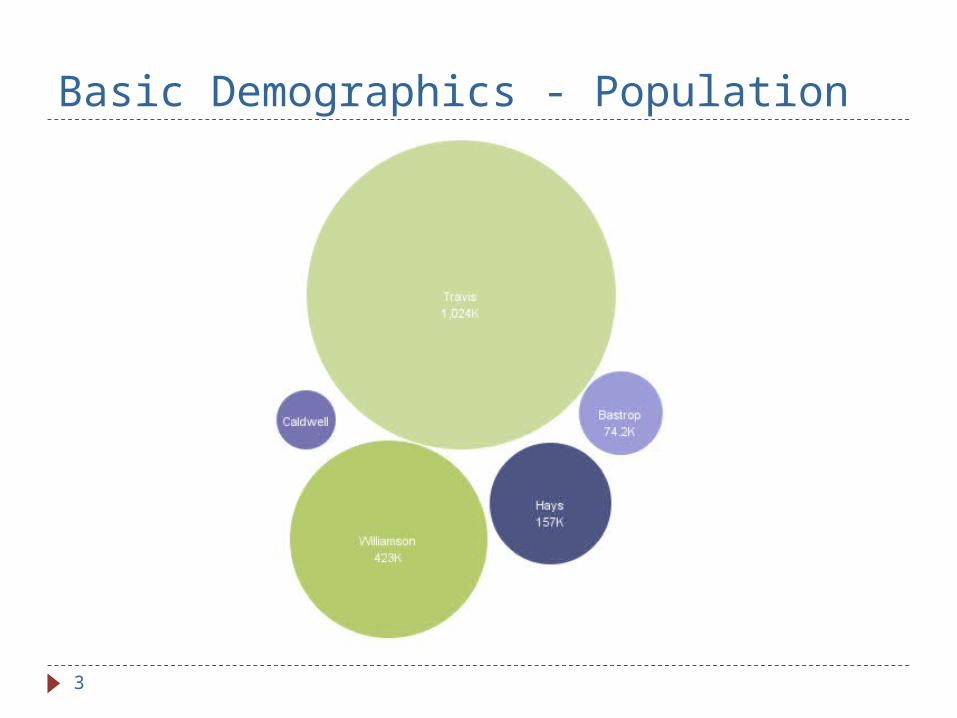
Basic Demographics - Population Bastrop County 74,171
Caldwell County 38,066
Hays County 157,107
Travis County 1,024,266
Williamson County 422,679
2
Basic Demographics - Population
3

Austin-Round Rock MSA 2000 - 2010
4
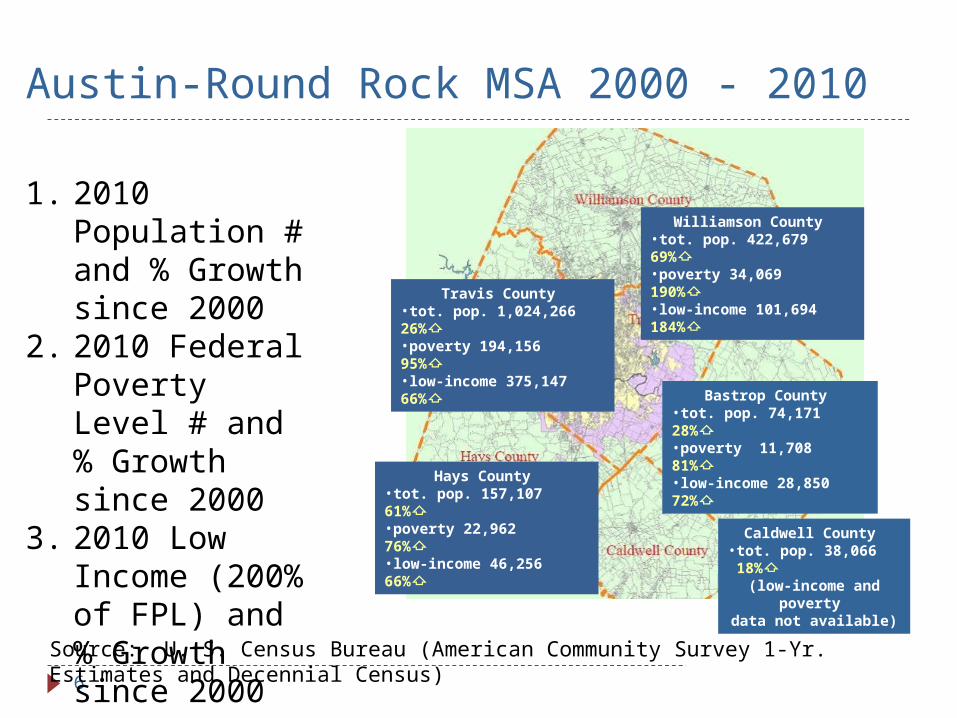
1. 2010 Population # and % Growth since 2000
Travis County •tot. pop. 1,024,266 26%⇧
Williamson County •tot. pop. 422,679 69%⇧
Hays County •tot. pop. 157,107 61%⇧
Bastrop County •tot. pop. 74,171 28%⇧
Caldwell County •tot. pop. 38,066 18%⇧
From 2000 – 2010, the five-county
Austin metro area was the fastest
growing metro in Texas and the 8th fastest growing in
the nation.
From 2000 – 2010, the five-county
Austin metro area was the fastest
growing metro in Texas and the 8th fastest growing in
the nation.
Source: U. S. Census Bureau (American Community Survey 1-Yr. Estimates and Decennial Census)

Austin-Round Rock MSA 2000 - 2010
5
1. 2010 Population # and % Growth since 2000
2. 2010 Federal Poverty Level # and % Growth since 2000
Travis County •tot. pop. 1,024,266 26%⇧•poverty 194,156 95%⇧
Williamson County •tot. pop. 422,679 69%⇧•poverty 34,069 190%⇧
Hays County •tot. pop. 157,107 61%⇧•poverty 22,962 76%⇧
Bastrop County •tot. pop. 74,171 28%⇧•poverty 11,708 81%⇧
Caldwell County •tot. pop. 38,066 18%⇧
(low-income and poverty data not available)
Source: U. S. Census Bureau (American Community Survey 1-Yr. Estimates and Decennial Census)
Austin-Round Rock MSA 2000 - 2010
6
1. 2010 Population # and % Growth since 2000
2. 2010 Federal Poverty Level # and % Growth since 2000
3. 2010 Low Income (200% of FPL) and % Growth since 2000
Travis County •tot. pop. 1,024,266 26%⇧•poverty 194,156 95%⇧•low-income 375,147 66%⇧
Williamson County •tot. pop. 422,679 69%⇧•poverty 34,069 190%⇧•low-income 101,694 184%⇧
Hays County •tot. pop. 157,107 61%⇧•poverty 22,962 76%⇧•low-income 46,256 66%⇧
Bastrop County •tot. pop. 74,171 28%⇧•poverty 11,708 81%⇧•low-income 28,850 72%⇧
Caldwell County •tot. pop. 38,066 18%⇧
(low-income and poverty data not available)
Source: U. S. Census Bureau (American Community Survey 1-Yr. Estimates and Decennial Census)
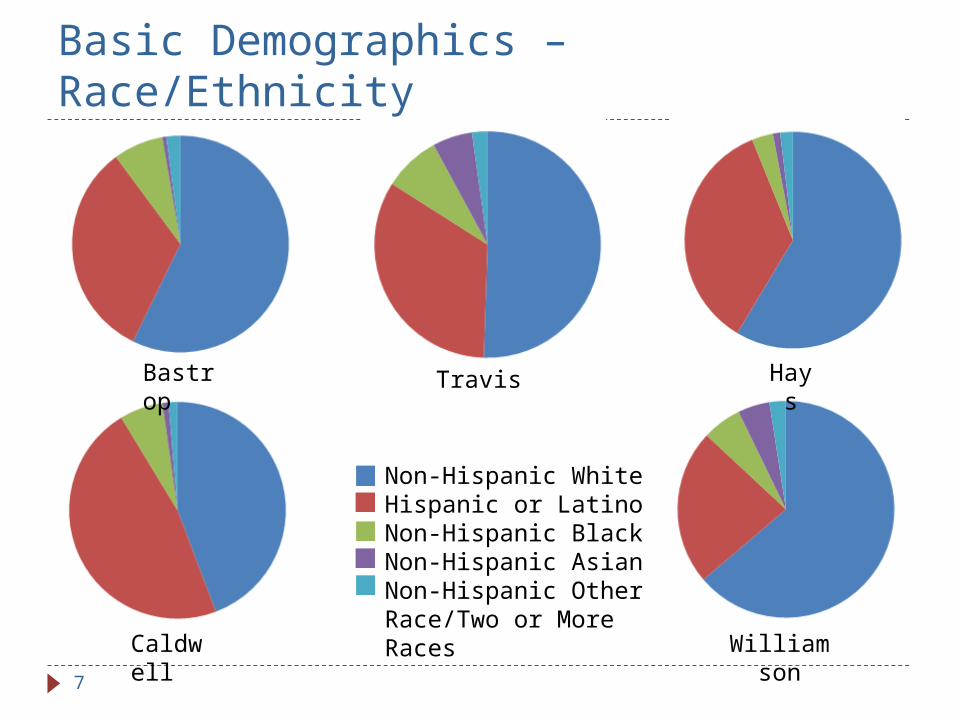
Basic Demographics – Race/Ethnicity
7
Bastrop
Caldwell
Hays
Williamson
Travis
Non-Hispanic WhiteHispanic or LatinoNon-Hispanic BlackNon-Hispanic AsianNon-Hispanic Other Race/Two or More Races
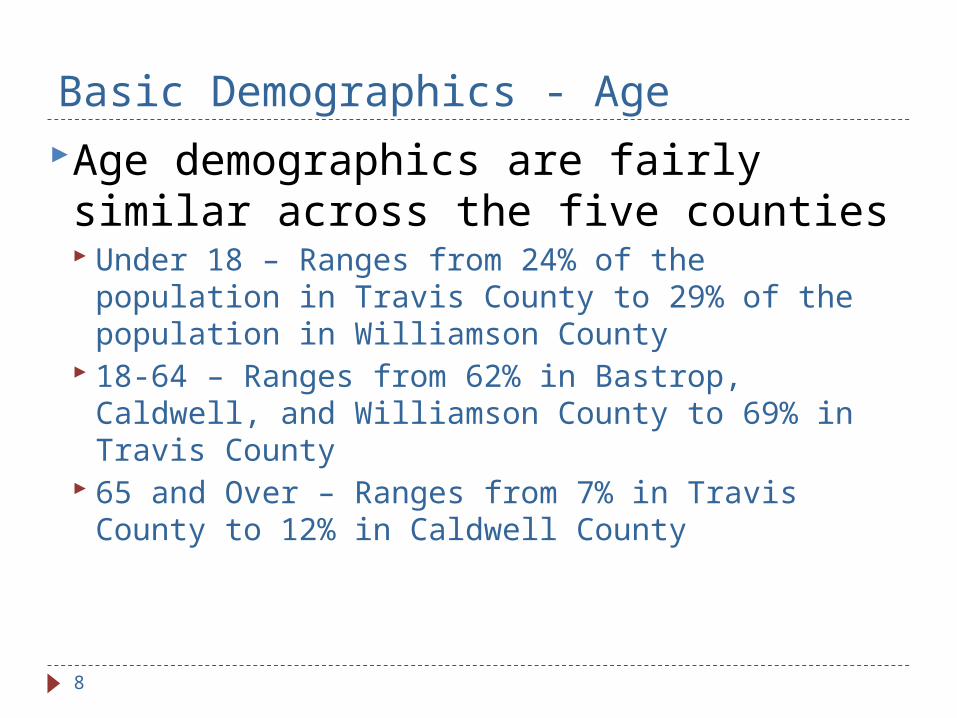
Basic Demographics - Age
Age demographics are fairly similar across the five counties Under 18 – Ranges from 24% of the
population in Travis County to 29% of the population in Williamson County
18-64 – Ranges from 62% in Bastrop, Caldwell, and Williamson County to 69% in Travis County
65 and Over – Ranges from 7% in Travis County to 12% in Caldwell County
8

We are safe, just & engaged
9

Violent Crime
10

Arrest Disproportionality by Race
African Americans are disproportionately booked into the Travis County jail African Americans make up 8% of the
total adult population, but represent 23% of all those booked into the Travis County jail.
Data collection is in progress for other counties in the region
11

Voter Turnout Disproportionality by Age
Young people are much less likely to participate in elections than people 35 and older in Travis County
Data collection is in progress for other counties in the region
12
Our basic needs are met
13
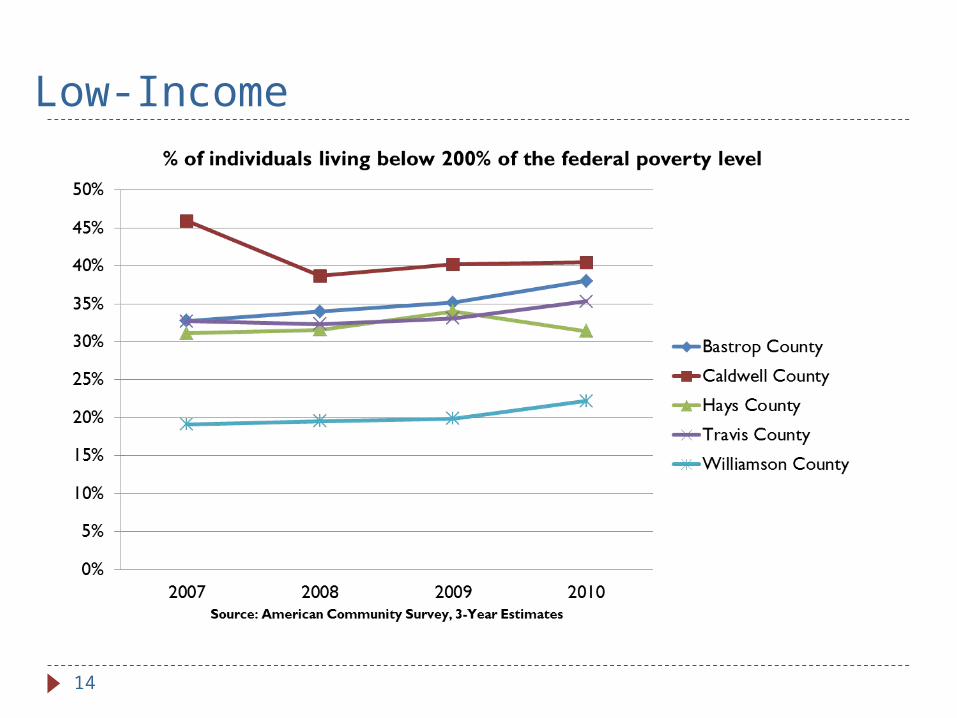
Low-Income
14
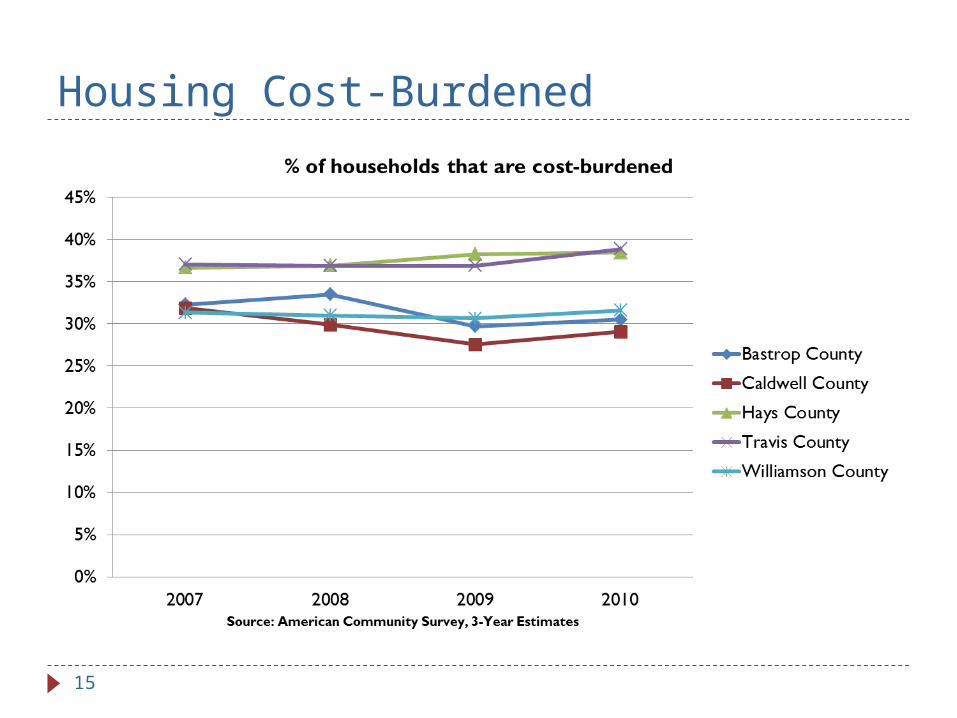
Housing Cost-Burdened
15

Daily Vehicle Miles Traveled per Capita
16

Homelessness
17
None 1-20 21-40 41-60
61-80 81-100 More than 100

We are healthy
18

Uninsured
19

Mental Health
20

Obesity
21
0%
5%
10%
15%
20%
25%
30%
35%
2006 2007 2008 2009 2010Source: Behavioral Risk Factor Surveillance System
% of Adults who are Obese
Austin-Round Rock MSA
Texas
USA
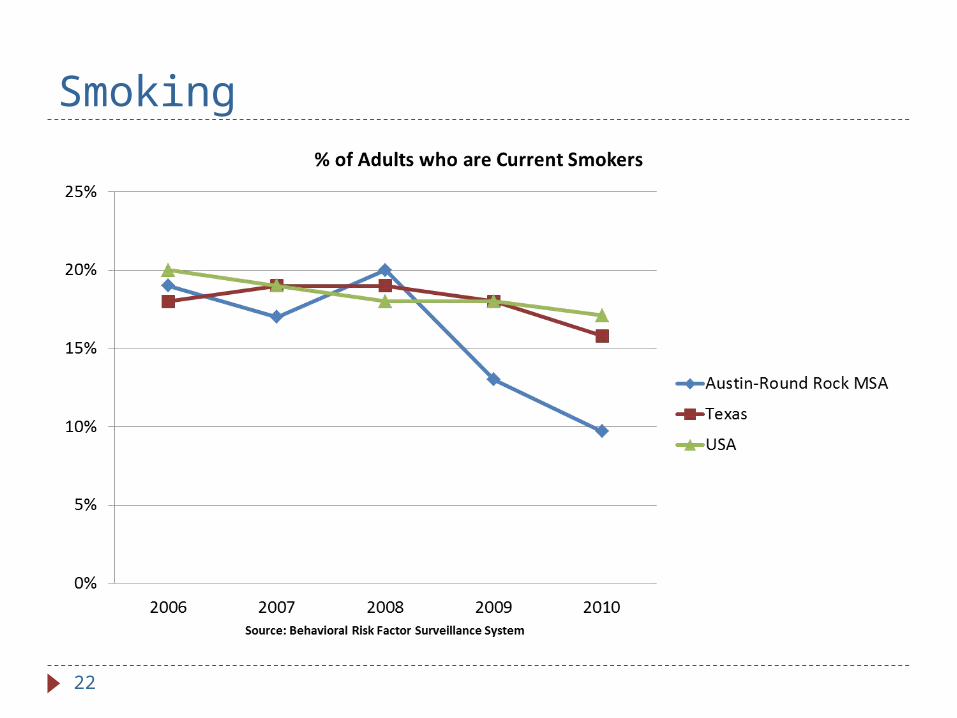
Smoking
22

Attainment of EPA air ozone standards
23

We achieve our full potential
24
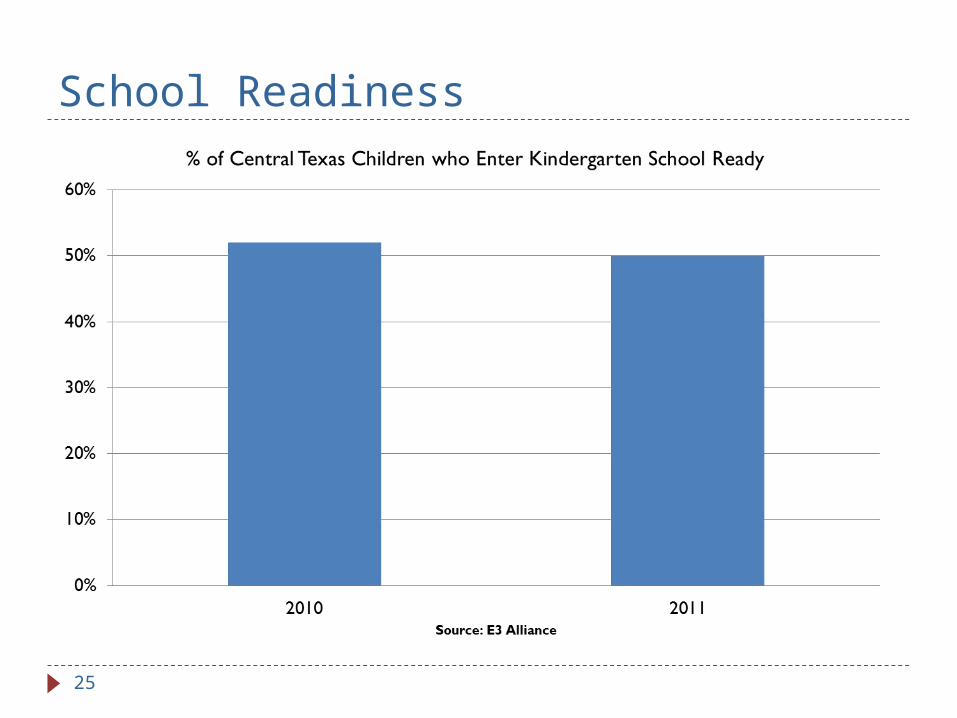
School Readiness
25
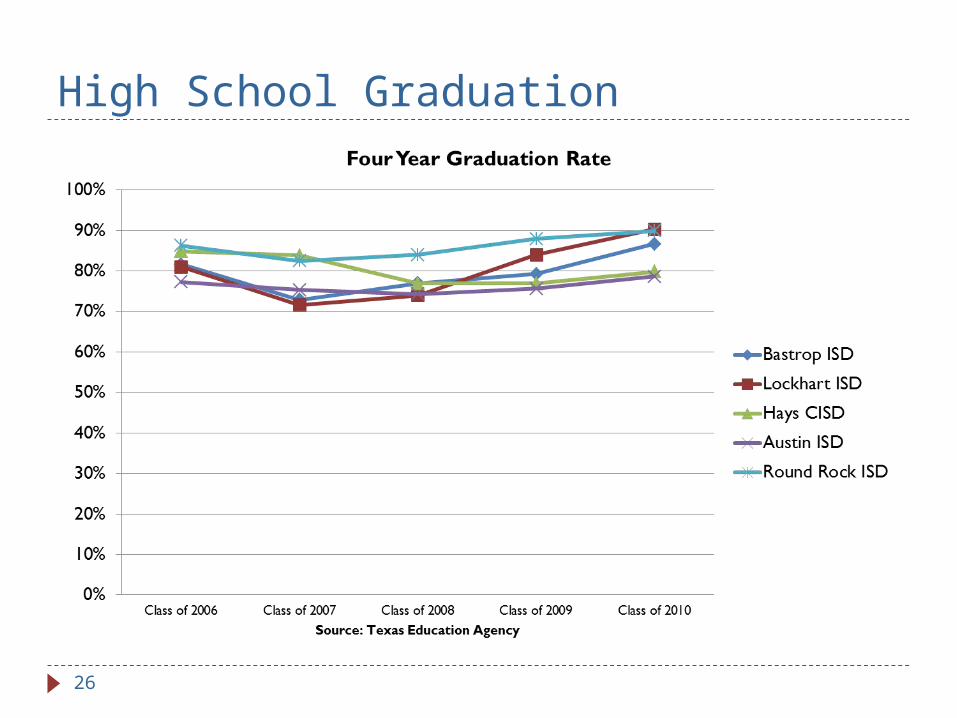
High School Graduation
26

College Readiness
27

Unemployment
28
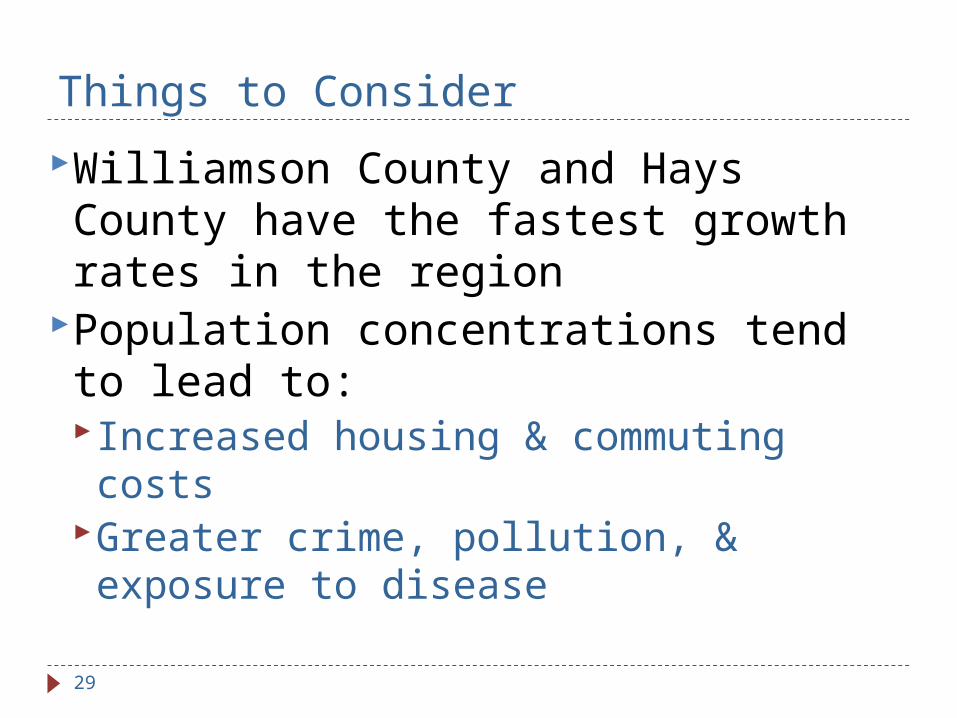
Things to Consider
Williamson County and Hays County have the fastest growth rates in the region
Population concentrations tend to lead to:Increased housing & commuting costs
Greater crime, pollution, & exposure to disease
29

Things to ConsiderWilliamson County, the 2nd most populous county in the region, fares the best on many of the dashboard indicators
A relatively small low-income population is a contributing factor
What is Williamson County doing right?
30

Contact Information
Questions should be directed to:Chantel Bottoms
CAN Senior Research Analyst(512)414-0327
31
Related Documents