Molecular Ecology (2005) 14, 689–701 doi: 10.1111/j.1365-294X.2004.02410.x © 2005 Blackwell Publishing Ltd Blackwell Publishing, Ltd. INVITED REVIEW ORGANIZATION OF GENETIC DIVERSITY IN PLANTS Comparative organization of chloroplast, mitochondrial and nuclear diversity in plant populations RÉMY J. PETIT,* JÉRÔME DUMINIL,* SILVIA FINESCHI,† ARNDT HAMPE,‡ DANIELA SALVINI † , § and GIOVANNI G. VENDRAMIN ¶ *INRA, UMR Biodiversity, Genes and Ecosystems, 69 Route d’Arcachon, F-33612 Cestas Cedex, France, †Institute for Plant Protection, Consiglio Nazionale delle Ricerche, via Madonna del Piano, Edificio E, I-50019 Sesto Fiorentino, Italy, ‡Integrative Ecology Group, Estación Biológica de Doñana (CSIC), Apartado 1056, E-41080 Sevilla, Spain, §Present address: Danish Centre for Forest, Landscape and Planning, Royal Veterinary and Agricultural University, Hørsholm Kongevej 11, 2970 Hørsholm, Denmark, ¶ Plant Genetics Institute, Florence division, Consiglio Nazionale delle Ricerche, via Madonna del Piano, Edificio D, I-50019 Sesto Fiorentino, Italy Abstract Plants offer excellent models to investigate how gene flow shapes the organization of genetic diversity. Their three genomes can have different modes of transmission and will hence experience varying levels of gene flow. We have compiled studies of genetic structure based on chloroplast DNA (cpDNA), mitochondrial DNA (mtDNA) and nuclear markers in seed plants. Based on a data set of 183 species belonging to 103 genera and 52 families, we show that the precision of estimates of genetic differentiation (G ST ) used to infer gene flow is mostly constrained by the sampling of populations. Mode of inheritance appears to have a major effect on G ST . Maternally inherited genomes experience consider- ably more subdivision (median value of 0.67) than paternally or biparentally inherited genomes (∼0.10). G ST at cpDNA and mtDNA markers covary narrowly when both genomes are maternally inherited, whereas G ST at paternally and biparentally inherited markers also covary positively but more loosely and G ST at maternally inherited markers are largely independent of values based on nuclear markers. A model-based gross estimate suggests that, at the rangewide scale, historical levels of pollen flow are generally at least an order of magnitude larger than levels of seed flow (median of the pollen-to-seed migration ratio: 17) and that pollen and seed gene flow vary independently across species. Finally, we show that measures of subdivision that take into account the degree of similarity between haplo- types (N ST or R ST ) make better use of the information inherent in haplotype data than standard measures based on allele frequencies only. Keywords: cpDNA, geographical structure, microsatellites, mtDNA, phylogeography, variation Received 30 August 2004; revision received 15 October 2004; accepted 15 October 2004 Introduction Gene flow shapes the organization of genetic diversity within and among populations (e.g., Wright 1931). In contrast to many vertebrates, seed plants have intrinsically complex and asymmetrical dispersal behaviours. Because adults are fixed, the dispersal function is mediated by two very distinct vehicles that operate in sequence, the male gametophyte (pollen) and the young sporophyte (seed). Another peculiarity of plants is that two organelle genomes coexist in the cytoplasm of their cells: the mitochondrial genome, nearly ubiquitous in eukaryotes, and the plastid genome, specific to plants. The mode of inheritance of these two genomes is varied and not always coincident, ranging from strictly maternal to strictly paternal (Harris & Ingram 1991; Reboud & Zeyl 1994; Mogensen 1996; Röhr et al . 1998). The contrasted patterns of inheritance of organelle and nuclear genes can be used to unravel the complexity of gene flow in plants, as they are predicted to result in very different distribution of genetic diversity within and among populations (Birky et al . 1989; Petit et al . 1993). Therefore, inferences can be made as to the relative importance of the two main components of Correspondence: Rémy J. Petit, Fax: + 33557122881; E-mail: [email protected]

Welcome message from author
This document is posted to help you gain knowledge. Please leave a comment to let me know what you think about it! Share it to your friends and learn new things together.
Transcript
Molecular Ecology (2005)
14
, 689–701 doi: 10.1111/j.1365-294X.2004.02410.x
© 2005 Blackwell Publishing Ltd
Blackwell Publishing, Ltd.
INVITED REVIEW
ORGANIZATION OF GENETIC DIVERSITY IN PLANTS
Comparative organization of chloroplast, mitochondrial and nuclear diversity in plant populations
RÉMY J . PETIT ,
*
JÉRÔME DUMINIL,
*
S ILVIA FINESCHI ,
†
ARNDT HAMPE,
‡
DANIELA SALVINI
†
,
§
and GIOVANNI G. VENDRAMIN
¶
*
INRA, UMR Biodiversity, Genes and Ecosystems, 69 Route d’Arcachon, F-33612 Cestas Cedex, France,
†
Institute for Plant Protection, Consiglio Nazionale delle Ricerche, via Madonna del Piano, Edificio E, I-50019 Sesto Fiorentino, Italy,
‡
Integrative Ecology Group, Estación Biológica de Doñana (CSIC), Apartado 1056, E-41080 Sevilla, Spain,
§
Present address: Danish Centre for Forest, Landscape and Planning, Royal Veterinary and Agricultural University, Hørsholm Kongevej 11, 2970 Hørsholm, Denmark,
¶
Plant Genetics Institute, Florence division, Consiglio Nazionale delle Ricerche, via Madonna del Piano, Edificio D, I-50019 Sesto Fiorentino, Italy
Abstract
Plants offer excellent models to investigate how gene flow shapes the organization ofgenetic diversity. Their three genomes can have different modes of transmission andwill hence experience varying levels of gene flow. We have compiled studies of geneticstructure based on chloroplast DNA (cpDNA), mitochondrial DNA (mtDNA) and nuclearmarkers in seed plants. Based on a data set of 183 species belonging to 103 genera and 52families, we show that the precision of estimates of genetic differentiation (
G
ST
) used toinfer gene flow is mostly constrained by the sampling of populations. Mode of inheritanceappears to have a major effect on
G
ST
. Maternally inherited genomes experience consider-ably more subdivision (median value of 0.67) than paternally or biparentally inheritedgenomes (
∼∼∼∼
0.10).
G
ST
at cpDNA and mtDNA markers covary narrowly when both genomesare maternally inherited, whereas
G
ST
at paternally and biparentally inherited markers alsocovary positively but more loosely and
G
ST
at maternally inherited markers are largelyindependent of values based on nuclear markers. A model-based gross estimate suggeststhat, at the rangewide scale, historical levels of pollen flow are generally at least an orderof magnitude larger than levels of seed flow (median of the pollen-to-seed migration ratio:17) and that pollen and seed gene flow vary independently across species. Finally, we showthat measures of subdivision that take into account the degree of similarity between haplo-types (
N
ST
or
R
ST
) make better use of the information inherent in haplotype data thanstandard measures based on allele frequencies only.
Keywords
: cpDNA, geographical structure, microsatellites, mtDNA, phylogeography, variation
Received 30 August 2004; revision received 15 October 2004; accepted 15 October 2004
Introduction
Gene flow shapes the organization of genetic diversitywithin and among populations (e.g., Wright 1931). Incontrast to many vertebrates, seed plants have intrinsicallycomplex and asymmetrical dispersal behaviours. Becauseadults are fixed, the dispersal function is mediated by twovery distinct vehicles that operate in sequence, the malegametophyte (pollen) and the young sporophyte (seed).Another peculiarity of plants is that two organelle genomes
coexist in the cytoplasm of their cells: the mitochondrialgenome, nearly ubiquitous in eukaryotes, and the plastidgenome, specific to plants. The mode of inheritance ofthese two genomes is varied and not always coincident,ranging from strictly maternal to strictly paternal (Harris &Ingram 1991; Reboud & Zeyl 1994; Mogensen 1996; Röhr
et al
. 1998). The contrasted patterns of inheritance oforganelle and nuclear genes can be used to unravel thecomplexity of gene flow in plants, as they are predicted toresult in very different distribution of genetic diversitywithin and among populations (Birky
et al
. 1989; Petit
et al
. 1993). Therefore, inferences can be made as to therelative importance of the two main components of
Correspondence: Rémy J. Petit, Fax: + 33557122881; E-mail:[email protected]
690
R . J . P E T I T
E T A L .
© 2005 Blackwell Publishing Ltd,
Molecular Ecology
, 14, 689–701
dispersal, seed and pollen, thanks to the development oftheoretical models that relate level of gene flow andpopulation genetic structure (e.g. Petit 1992; Ennos 1994;Hu & Ennos 1997; Oddou-Muratorio
et al
. 2001; Hamilton& Miller 2002). However, these models are based onassumptions that are unlikely to be met in natural systems;hence interpretations have to be made carefully.
Relying on a large body of case studies should help eval-uate to which extent these models are useful. Over morethan two decades, research on plant organelle DNA(oDNA) diversity has been lagging behind that on animalmtDNA (Soltis
et al
. 1997; Schaal
et al
. 1998; Brunsfeld
et al
.2001; Petit & Vendramin 2005). The situation has changedduring the last 10 years, as a result of the emergence of effi-cient molecular techniques to identify and screen oDNAdiversity. There is now sufficient data available to examinethe realism of several predictions made by theoreticalmodels and to provide some reference values for compar-ative purposes. A general introduction on oDNA variationin plants has been published recently (Petit & Vendramin2005) but there has been no comprehensive review so far ofthe primary data generated during population surveysof oDNA variation in plants, despite some early orlimited attempts (e.g. Ennos 1994; McCauley 1995; ElMousadik & Petit 1996; Ouborg
et al
. 1999; Morjan &Rieseberg 2004).
Here we compile studies that report the partitioningof genetic diversity within and among populations fororganelle genes in seed plants and, whenever possible,identify estimates from the same species based on nuclearmarkers. We first examine the precision of estimates ofpopulation subdivision and test if it is more limited by thesampling of populations than by the sampling of indi-viduals within populations, as suggested earlier (Pons & Petit1995). The findings should be useful for planning futurestudies of organelle diversity. Furthermore, we ask whetherbiases are introduced into
G
ST
estimates by the genotypingmethod or by the examination of only a restricted part ofthe range. We then estimate mean levels of differentiationat markers having different modes of inheritance (maternal,paternal or biparental) and examine how these measuresof subdivision covary across species. By relying on pre-viously developed (neutral) equilibrium expectations,one should indeed obtain rough indirect measures of therelative importance of gene flow through pollen vs. seedand hence obtain some insight on how gene flow is gener-ally achieved in plants. For instance, does gene flow takeplace predominantly through pollen, as often assumed(e.g. Levin & Kerster 1974; Ellstrand 1992)? Does some typeof compensation exist between the two components ofgene flow, with plants relying little on seed gene flow sub-jected to correspondingly higher level of pollen gene flowand vice versa? Because a minimum rate of gene flow islikely to be necessary for species cohesion and survival,
some compensation might exist, particularly in specieswith very low dispersal rates. On the other hand, pollenand seed flow do not play an equivalent ecological roleand other processes could overwhelm any compensatoryeffects between these two components of dispersal. There-fore, empirical data is needed to answer this quite funda-mental question, which has received little if any attentionso far. Finally, we test if the presence of a phylogeograph-ical structure at organelle genes is a general feature inseed plants, comparing systematically the partitioning oforganelle DNA diversity among populations when simi-larities between haplotypes are taken into account (
N
ST
or
R
ST
) or when they are not (
G
ST
). No clear consensus existsregarding the usefulness of taking allele similarity intoaccount when empirically measuring population geneticstructure (e.g. Gaggiotti
et al
. 1999; Balloux & Lugon-Moulin2002), so this question seems relevant.
Materials and methods
Data set
The primary literature was searched until April 2004 forpopulation studies of seed plant oDNA diversity, usingbibliographical databases, checking references in publishedpapers and contacting colleagues. Only studies with
≥
5populations and having
≥
2 individuals per populationanalysed were considered. We sought to obtain the rawfrequencies of haplotypes in populations and their fullmolecular characterization by examining published in-formation or directly soliciting it from the authors. Whenseveral surveys were available for a single species, weincluded only those based on the highest number of popu-lations and covering the largest fraction of the range, toavoid attributing too much weight to a few well-studiedtaxa. When a suitable oDNA entry was detected, we furtherattempted to identify a corresponding survey based onnuclear markers, by screening the literature for resultsfrom that particular species. Here as well, priority wasgiven to range-wide studies.
The following information was recorded for eachspecies: taxonomic group (gymnosperm or angiosperm),family, genome investigated (cpDNA, mtDNA or nuclear),its known or presumed predominant mode of inheritance(paternal, maternal or biparental), molecular techniqueused [the most frequent were: Probe-RFLP (restrictionfragment length polymorphism, where the fragmentsare identified using a marked DNA fragment, the probe),Purif-RFLP (RFLP on DNA purified after isolation oforganelles), PCR-RFLP (PCR amplification with specificprimers followed by RFLP), SSR (single sequence repeats,also called microsatellites), sequencing, AFLP (amplifiedfragment length polymorphism), RAPD (random amplifiedpolymorphic DNA) and isozymes], proportion of the range
O R G A N I Z A T I O N O F G E N E T I C D I V E R S I T Y I N P L A N T S
691
© 2005 Blackwell Publishing Ltd,
Molecular Ecology
, 14, 689–701
sampled (local, regional — that is, less than half of therange covered, or species-wide), number of populationsinvestigated, total number of individuals sampled, arith-metic and harmonic mean number of individuals perpopulation, number of haplotypes detected (for oDNAstudies), number of ‘characters’ studied (number ofpolymorphic bands, variable nucleotide sites or SSRs foroDNA, number of loci for nuclear markers), and diversitystatistics. For nuclear data, these included mean expectedheterozygosity
H
E
,
F
IS
and
F
ST
,
G
ST
or
Φ
ST
, as provided inthe papers. Although it would be preferable to use identicalmeasures of genetic subdivision,
F
ST
,
G
ST
or
Φ
ST
estimate thesame quantity and the differences between them is generallyquite low (Morjan & Rieseberg 2004). For oDNA data, thediversity statistics were computed by us on the basis of theraw data as described below. In the few cases where thisproved impossible, the estimates provided in the paperwere used instead.
Data analyses
For oDNA, the following parameters were included in thedatabase: total diversity
H
T
,
G
ST
and its standard error,
N
ST
and
R
ST
and their standard errors (whenever appropriate:for
N
ST
, when there were
≥
3 studied characters andwhen the description of haplotypes was available; for
R
ST
,when details on length variation at microsatellite lociwere available). The program
permut
(by RJP, available athttp://www.pierroton.inra.fr/genetics/labo/Software/)was used to estimate the parameters of population sub-division
G
ST
and
N
ST
and their standard errors. The differencebetween these two parameters is that
N
ST
takes similaritiesbetween haplotypes into account, contrary to
G
ST
(Pons &Petit 1996). These similarities were measured by countingthe number of characters that differ between all pairs ofhaplotypes. The difference between
N
ST
and
G
ST
was testedthrough 1000 random permutations of haplotype identity(Burban
et al
. 1999). In the case of chloroplast microsatellites(cpSSRs), we used the program
cpssr
(available at http://www.pierroton.inra.fr/genetics/labo/Software/) to derive
R
ST
. This program is essentially identical to
permut
exceptthat the distance between haplotypes is adapted to themode of evolution of SSRs (it is the sum across loci of thesquared differences in number of repeats). Note thatthe estimators of these parameters, proposed by Pons &Petit (1995, 1996), are based on a random model of popu-lation variation, instead of the fixed model procedureassumed by Nei & Chesser (1983). Hence, the variationresulting from the sampling of populations is taken intoconsideration, allowing comparisons across species. Onthe other hand, all populations are given the same weight,regardless of their sample sizes, as in Nei & Chesser (1983),but contrary to Weir & Cockerham (1984), where populationswith higher sample sizes are given more weight. When
sample sizes are identical in all populations, the estimate of
G
ST
proposed by Pons & Petit (1995) becomes identical tothe parameter
θ
of Weir & Cockerham (1984).The pollen-to-seed migration ratio (
r =
m
p
/
m
s
) was esti-mated following Petit (1992) and Ennos (1994):
(1)
where
G
STm
and
G
STb
correspond to the estimate of sub-division at maternally inherited markers and at nuclear(biparentally inherited) markers, and
F
IS
is the heterozygotedeficit estimated with nuclear codominant markers. Wheninformation from paternally and biparentally inheritedmarkers is available (e.g. in conifers), this ratio can also beestimated as follows:
(2)
assuming strict allogamy, with
G
STp
corresponding to theestimate of subdivision at paternally inherited markers.Interpretation of
m
p
/
m
s
values requires particular cautionbecause of a number of unrealistic assumptions underlyingthe island model used to derive Equations 1 and 2. Theseassumptions include (1) no mutation and no selection; (2)equal number of migrants among all populations, implyinga lack of spatial genetic structure; (3) identical male andfemale effective population sizes; and (4) equilibrium betweengenetic drift and gene flow (e.g. Whitlock & McCauley1999; Oddou-Muratorio
et al
. 2001).Most statistical analyses were performed with
systat
version 10.2. Parametric standard tests were used aftertransforming data to meet normality assumptions. Inparticular,
G
ST
data were arcsin square root transformedbefore proceeding with further analyses. Because original
G
ST
and
m
p
/
m
s
values were not normally distributed, weprovide medians plus their quartiles instead of arithmeticmeans, as this permits a more straightforward comparisonof categories (see also Morjan & Rieseberg 2004).
Results
Database
Data were obtained for 183 species belonging to 103 generaand 52 families (Table 1). The raw data and list of sourcereferences is provided in Table S1. Most studies have beenpublished recently (30% since 2003) in a variety of journals
rm
m
GF
G
G
p
s
( )
= =
−
+ − −
−
11 1 2
11
11
STbIS
STm
STm
rm
m
G G
G
p
s
= =
−
− −
−
11
11
11
STp STm
STm
692
R . J . P E T I T
E T A L .
© 2005 Blackwell Publishing Ltd,
Molecular Ecology
, 14, 689–701
(29), with a maximum of 27% of all entries in a singlejournal (
Molecular Ecology
). Population studies based onorganelle markers in plants have relied more on cpDNAmarkers (175 species) than on mtDNA markers (34 species),as stressed elsewhere (Petit & Vendramin 2005). Twenty-six species have been investigated at both cpDNA andmtDNA markers. Gymnosperms have been relatively wellstudied (42 of the
c
. 600 existing species investigated). Theyare particularly interesting models for studies on gene flowas many species have paternally inherited cpDNA andmaternally inherited mtDNA (whereas both genomes arematernally inherited in most angiosperms). Raw data onhaplotype frequencies were obtained in a large fraction ofentries (92%). The most frequent technique used to studyoDNA variation has been PCR-RFLP (46%), followed byProbe-RFLP (28%), microsatellites (11%), direct sequencing(9%) and cpDNA purification followed by RFLP (4%). Interms of sampling, the median values across studies were157 individuals screened in total, distributed in 14 popu-lations with an average of 10 individuals per population,allowing the identification of approximately seven haplotypeson the basis of around seven polymorphic ‘characters’.However, sampling strategies were very heterogeneousacross species and each of these parameters varied by atleast one order of magnitude. Studies of genetic structurebased on nuclear markers were identified for 119 of the183 species (65%), most of them (72%) based on isozymemarkers (Table S2).
Relationships between parameters
As expected, the total number of individuals analysed perspecies is positively related with the number of populationssampled (Pearson
r
= 0.62,
n
= 207,
P
<< 0.001) and, to alesser extent, with the mean sample size within population(
r =
0.44,
P
<< 0.001). There is a negative correlation betweenthe number of populations investigated and the number ofindividuals per population (
r =
−
0.42,
P
<< 0.001), a resultof the trade-off between sampling many individuals per
population or many populations. On the other hand,sampling did not affect
G
ST
(all correlations between samplesizes and
G
ST
vary between
−
0.1 and 0.1), as expected for anunbiased estimate. However, there was a significant negativecorrelation between
G
ST
and the number of haplotypes(
r =
−
0.44, n = 171, P << 0.001). Two other variables affectGST at maternally inherited markers: the molecular tech-nique used and the coverage of the range. The effect ofthe technique (one-way anova: F = 3.03, d.f. = 5, n = 171,P = 0.01) mostly resulted from the fact that the eightstudies based on purification of cpDNA followed byrestriction enzyme digestion had higher GST. Similarly,the effect of range coverage (F = 3.93, d.f. = 2, P = 0.02)resulted from the fact that the species studied in arestricted area (i.e. locally) had lower GST compared tothose studied across a larger fraction of the species’ range.For nuclear data, an effect of the technique was also noted(F = 5.11, d.f. = 6, n = 110, P < 0.001). It was the result of ahigher mean subdivision in studies based on RAPD (11cases), whereas estimates of genetic subdivision based onthe other techniques were smaller and of similar magnitude(results not shown). On the other hand, no effect of rangecoverage was noted with these markers (F = 1.98, d.f. = 2,n = 109, P = 0.14).
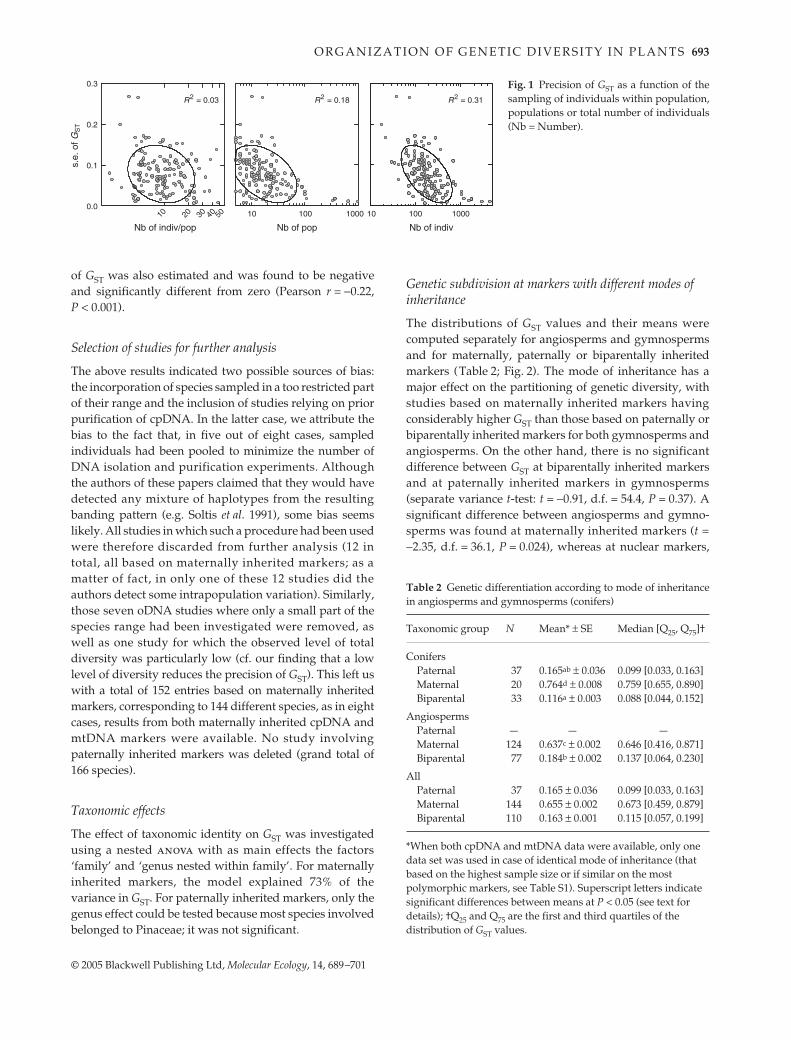
Precision of GST estimates
The precision (standard error) of the estimates of populationsubdivision (GST) at organelle genes was also investigated.The 162 available estimates of GST standard error (at bothmaternally and paternally inherited markers) were plottedas a function of the number of populations, the total numberof individuals analysed per species and the harmonicmean sample size per population (Fig. 1). The best predictorof the GST standard error (as assessed by the coefficient ofdetermination R2) was the total number of individualsanalysed, followed by the number of populations and themean sample size per population (all after log transformation).The relation between total diversity hT and standard error
Table 1 Number of entries in the database, classified according to taxonomy, genome and mode of inheritance
Number of species
Number of genera
Number of families
CpMtmaternal
NuclearbiparentalMaternal Paternal All Total*
Angiosperms 138 0 138 13 86 141 95 49Gymnosperms 0 37 37 21 33 42 8 3All 138 37 175 34 119 183 103 52
*Total number of species represented, which is lower than the total of the values situated on the left, because a given species might have been studied with markers from more than one genome.
O R G A N I Z A T I O N O F G E N E T I C D I V E R S I T Y I N P L A N T S 693
© 2005 Blackwell Publishing Ltd, Molecular Ecology, 14, 689–701
of GST was also estimated and was found to be negativeand significantly different from zero (Pearson r = −0.22,P < 0.001).
Selection of studies for further analysis
The above results indicated two possible sources of bias:the incorporation of species sampled in a too restricted partof their range and the inclusion of studies relying on priorpurification of cpDNA. In the latter case, we attribute thebias to the fact that, in five out of eight cases, sampledindividuals had been pooled to minimize the number ofDNA isolation and purification experiments. Althoughthe authors of these papers claimed that they would havedetected any mixture of haplotypes from the resultingbanding pattern (e.g. Soltis et al. 1991), some bias seemslikely. All studies in which such a procedure had been usedwere therefore discarded from further analysis (12 intotal, all based on maternally inherited markers; as amatter of fact, in only one of these 12 studies did theauthors detect some intrapopulation variation). Similarly,those seven oDNA studies where only a small part of thespecies range had been investigated were removed, aswell as one study for which the observed level of totaldiversity was particularly low (cf. our finding that a lowlevel of diversity reduces the precision of GST). This left uswith a total of 152 entries based on maternally inheritedmarkers, corresponding to 144 different species, as in eightcases, results from both maternally inherited cpDNA andmtDNA markers were available. No study involvingpaternally inherited markers was deleted (grand total of166 species).
Taxonomic effects
The effect of taxonomic identity on GST was investigatedusing a nested anova with as main effects the factors‘family’ and ‘genus nested within family’. For maternallyinherited markers, the model explained 73% of thevariance in GST. For paternally inherited markers, only thegenus effect could be tested because most species involvedbelonged to Pinaceae; it was not significant.
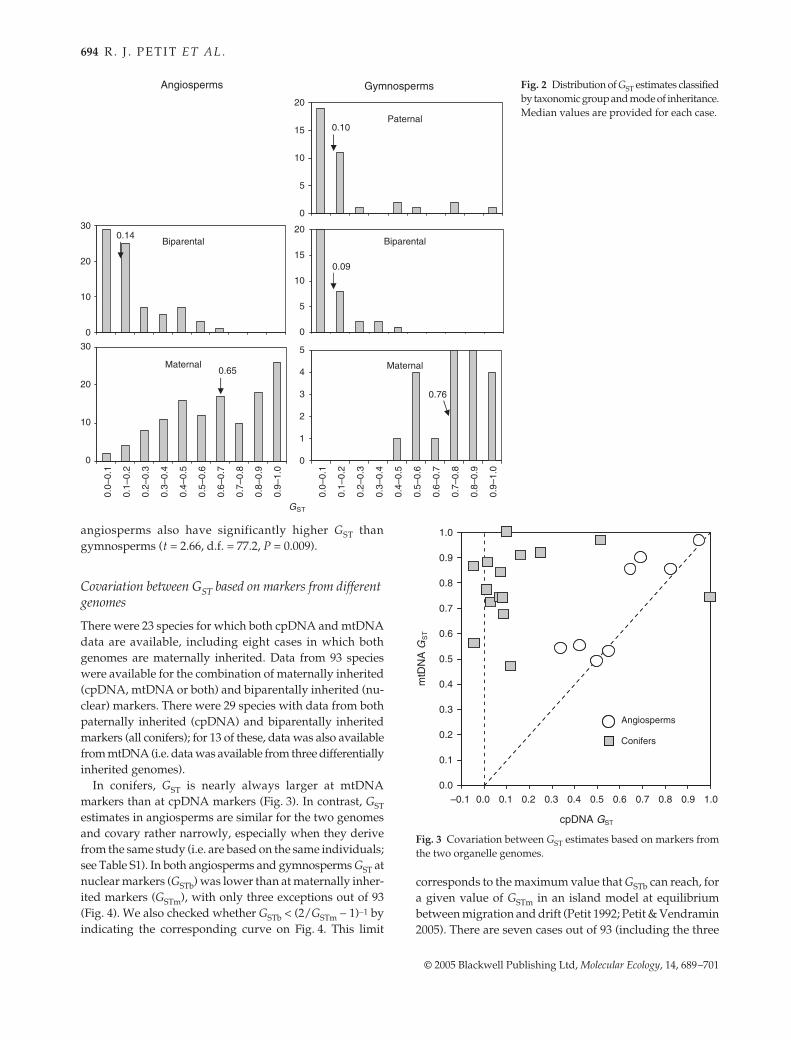
Genetic subdivision at markers with different modes of inheritance
The distributions of GST values and their means werecomputed separately for angiosperms and gymnospermsand for maternally, paternally or biparentally inheritedmarkers (Table 2; Fig. 2). The mode of inheritance has amajor effect on the partitioning of genetic diversity, withstudies based on maternally inherited markers havingconsiderably higher GST than those based on paternally orbiparentally inherited markers for both gymnosperms andangiosperms. On the other hand, there is no significantdifference between GST at biparentally inherited markersand at paternally inherited markers in gymnosperms(separate variance t-test: t = −0.91, d.f. = 54.4, P = 0.37). Asignificant difference between angiosperms and gymno-sperms was found at maternally inherited markers (t =−2.35, d.f. = 36.1, P = 0.024), whereas at nuclear markers,
Fig. 1 Precision of GST as a function of thesampling of individuals within population,populations or total number of individuals(Nb = Number).
Table 2 Genetic differentiation according to mode of inheritancein angiosperms and gymnosperms (conifers)
Taxonomic group N Mean* ± SE Median [Q25, Q75]†
ConifersPaternal 37 0.165ab ± 0.036 0.099 [0.033, 0.163]Maternal 20 0.764d ± 0.008 0.759 [0.655, 0.890]Biparental 33 0.116a ± 0.003 0.088 [0.044, 0.152]
AngiospermsPaternal — — —Maternal 124 0.637c ± 0.002 0.646 [0.416, 0.871]Biparental 77 0.184b ± 0.002 0.137 [0.064, 0.230]
AllPaternal 37 0.165 ± 0.036 0.099 [0.033, 0.163]Maternal 144 0.655 ± 0.002 0.673 [0.459, 0.879]Biparental 110 0.163 ± 0.001 0.115 [0.057, 0.199]
*When both cpDNA and mtDNA data were available, only one data set was used in case of identical mode of inheritance (that based on the highest sample size or if similar on the most polymorphic markers, see Table S1). Superscript letters indicate significant differences between means at P < 0.05 (see text for details); †Q25 and Q75 are the first and third quartiles of the distribution of GST values.
694 R . J . P E T I T E T A L .
© 2005 Blackwell Publishing Ltd, Molecular Ecology, 14, 689–701
angiosperms also have significantly higher GST thangymnosperms (t = 2.66, d.f. = 77.2, P = 0.009).
Covariation between GST based on markers from different genomes
There were 23 species for which both cpDNA and mtDNAdata are available, including eight cases in which bothgenomes are maternally inherited. Data from 93 specieswere available for the combination of maternally inherited(cpDNA, mtDNA or both) and biparentally inherited (nu-clear) markers. There were 29 species with data from bothpaternally inherited (cpDNA) and biparentally inheritedmarkers (all conifers); for 13 of these, data was also availablefrom mtDNA (i.e. data was available from three differentiallyinherited genomes).
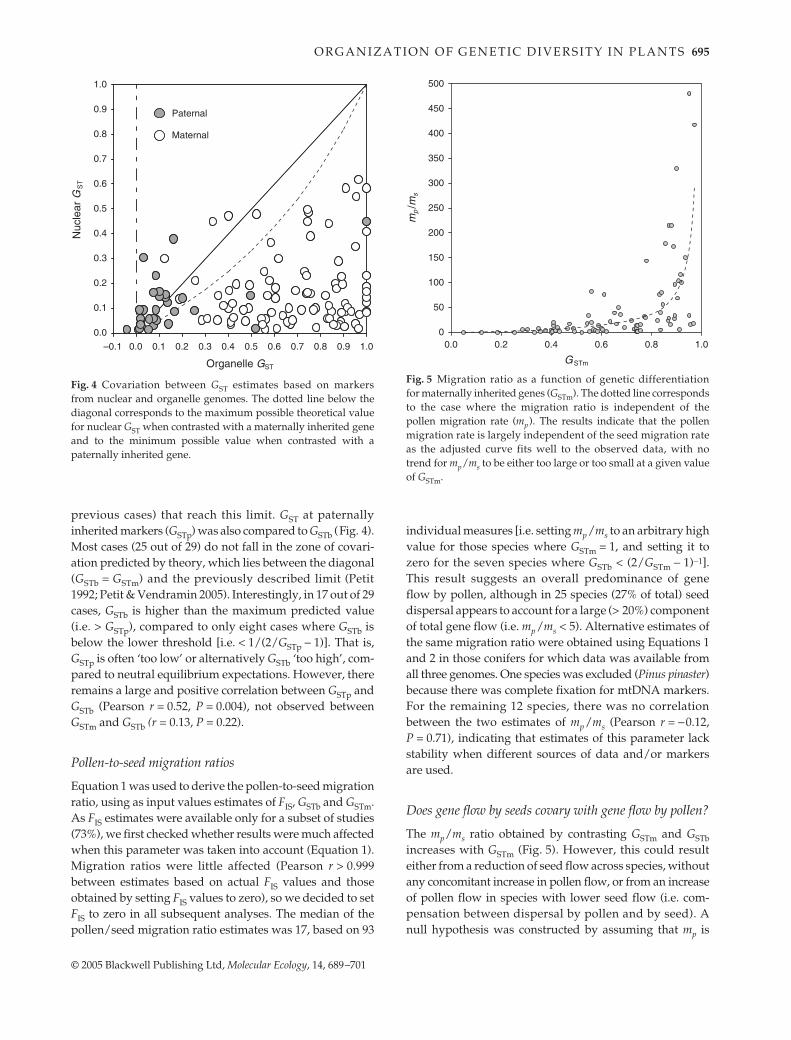
In conifers, GST is nearly always larger at mtDNAmarkers than at cpDNA markers (Fig. 3). In contrast, GSTestimates in angiosperms are similar for the two genomesand covary rather narrowly, especially when they derivefrom the same study (i.e. are based on the same individuals;see Table S1). In both angiosperms and gymnosperms GST atnuclear markers (GSTb) was lower than at maternally inher-ited markers (GSTm), with only three exceptions out of 93(Fig. 4). We also checked whether GSTb < (2/GSTm − 1)−1 byindicating the corresponding curve on Fig. 4. This limit
corresponds to the maximum value that GSTb can reach, fora given value of GSTm in an island model at equilibriumbetween migration and drift (Petit 1992; Petit & Vendramin2005). There are seven cases out of 93 (including the three
Fig. 2 Distribution of GST estimates classifiedby taxonomic group and mode of inheritance.Median values are provided for each case.
Fig. 3 Covariation between GST estimates based on markers fromthe two organelle genomes.
O R G A N I Z A T I O N O F G E N E T I C D I V E R S I T Y I N P L A N T S 695
© 2005 Blackwell Publishing Ltd, Molecular Ecology, 14, 689–701
previous cases) that reach this limit. GST at paternallyinherited markers (GSTp) was also compared to GSTb (Fig. 4).Most cases (25 out of 29) do not fall in the zone of covari-ation predicted by theory, which lies between the diagonal(GSTb = GSTm) and the previously described limit (Petit1992; Petit & Vendramin 2005). Interestingly, in 17 out of 29cases, GSTb is higher than the maximum predicted value(i.e. > GSTp), compared to only eight cases where GSTb isbelow the lower threshold [i.e. < 1/(2/GSTp − 1)]. That is,GSTp is often ‘too low’ or alternatively GSTb ‘too high’, com-pared to neutral equilibrium expectations. However, thereremains a large and positive correlation between GSTp andGSTb (Pearson r = 0.52, P = 0.004), not observed betweenGSTm and GSTb (r = 0.13, P = 0.22).
Pollen-to-seed migration ratios
Equation 1 was used to derive the pollen-to-seed migrationratio, using as input values estimates of FIS, GSTb and GSTm.As FIS estimates were available only for a subset of studies(73%), we first checked whether results were much affectedwhen this parameter was taken into account (Equation 1).Migration ratios were little affected (Pearson r > 0.999between estimates based on actual FIS values and thoseobtained by setting FIS values to zero), so we decided to setFIS to zero in all subsequent analyses. The median of thepollen/seed migration ratio estimates was 17, based on 93
individual measures [i.e. setting mp/ms to an arbitrary highvalue for those species where GSTm = 1, and setting it tozero for the seven species where GSTb < (2/GSTm − 1)−1].This result suggests an overall predominance of geneflow by pollen, although in 25 species (27% of total) seeddispersal appears to account for a large (> 20%) componentof total gene flow (i.e. mp/ms < 5). Alternative estimates ofthe same migration ratio were obtained using Equations 1and 2 in those conifers for which data was available fromall three genomes. One species was excluded (Pinus pinaster)because there was complete fixation for mtDNA markers.For the remaining 12 species, there was no correlationbetween the two estimates of mp/ms (Pearson r = −0.12,P = 0.71), indicating that estimates of this parameter lackstability when different sources of data and/or markersare used.
Does gene flow by seeds covary with gene flow by pollen?
The mp/ms ratio obtained by contrasting GSTm and GSTbincreases with GSTm (Fig. 5). However, this could resulteither from a reduction of seed flow across species, withoutany concomitant increase in pollen flow, or from an increaseof pollen flow in species with lower seed flow (i.e. com-pensation between dispersal by pollen and by seed). Anull hypothesis was constructed by assuming that mp is
Fig. 4 Covariation between GST estimates based on markersfrom nuclear and organelle genomes. The dotted line below thediagonal corresponds to the maximum possible theoretical valuefor nuclear GST when contrasted with a maternally inherited geneand to the minimum possible value when contrasted with apaternally inherited gene.
Fig. 5 Migration ratio as a function of genetic differentiationfor maternally inherited genes (GSTm). The dotted line correspondsto the case where the migration ratio is independent of thepollen migration rate (mp ). The results indicate that the pollenmigration rate is largely independent of the seed migration rateas the adjusted curve fits well to the observed data, with notrend for mp/ms to be either too large or too small at a given valueof GSTm.
696 R . J . P E T I T E T A L .
© 2005 Blackwell Publishing Ltd, Molecular Ecology, 14, 689–701
independent of ms. This implies that mp/ms = K/(1/GSTm − 1),where K is a numerical constant (i.e. the migration ratiomp/ms is a function only of the denominator ms). Wefitted this function with the data presented in Fig. 5 byminimizing the sum of squares of the deviations, yieldingK = 8.9. Observed values fall on both sides of the curve(Fig. 5), regardless of the value of the abscissa (GSTm). Thismeans that mp/ms values are neither too large nor too lowfor a given value of GSTm, suggesting the independence ofpollen flow from levels of seed flow and hence no tendencyfor pollen flow to compensate low levels of seed flow.
Alternative ways to measure differentiation: GST vs. NST vs. RST
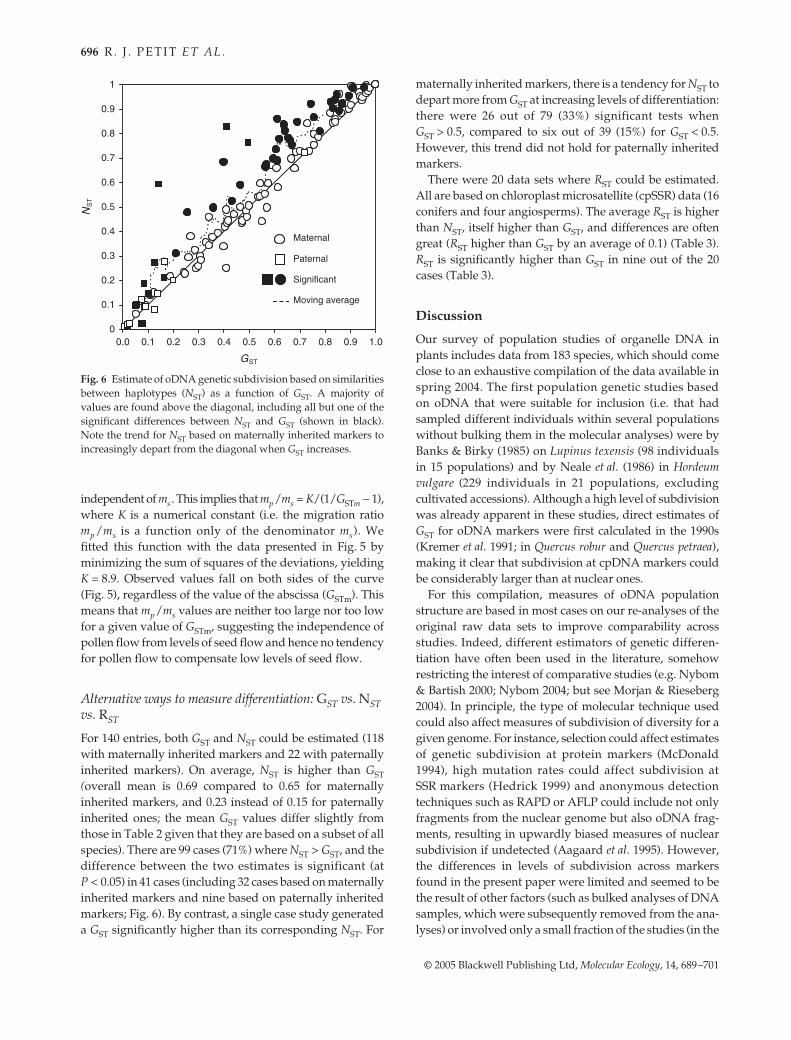
For 140 entries, both GST and NST could be estimated (118with maternally inherited markers and 22 with paternallyinherited markers). On average, NST is higher than GST(overall mean is 0.69 compared to 0.65 for maternallyinherited markers, and 0.23 instead of 0.15 for paternallyinherited ones; the mean GST values differ slightly fromthose in Table 2 given that they are based on a subset of allspecies). There are 99 cases (71%) where NST > GST, and thedifference between the two estimates is significant (atP < 0.05) in 41 cases (including 32 cases based on maternallyinherited markers and nine based on paternally inheritedmarkers; Fig. 6). By contrast, a single case study generateda GST significantly higher than its corresponding NST. For
maternally inherited markers, there is a tendency for NST todepart more from GST at increasing levels of differentiation:there were 26 out of 79 (33%) significant tests whenGST > 0.5, compared to six out of 39 (15%) for GST < 0.5.However, this trend did not hold for paternally inheritedmarkers.
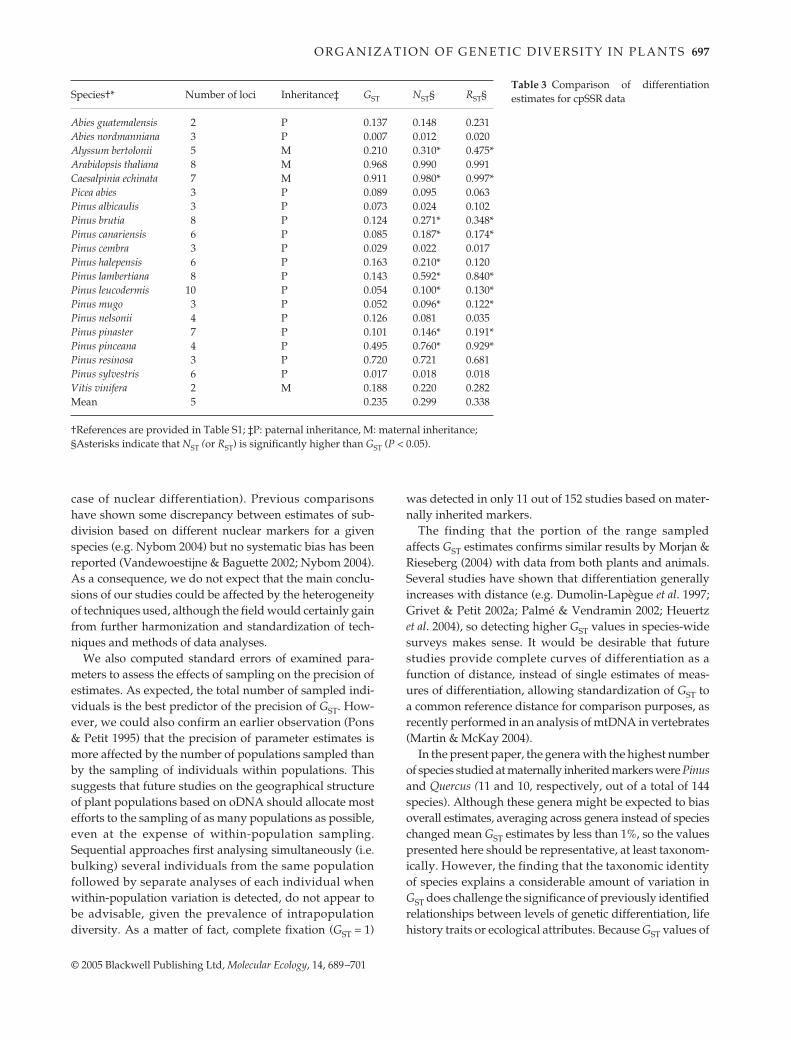
There were 20 data sets where RST could be estimated.All are based on chloroplast microsatellite (cpSSR) data (16conifers and four angiosperms). The average RST is higherthan NST, itself higher than GST, and differences are oftengreat (RST higher than GST by an average of 0.1) (Table 3).RST is significantly higher than GST in nine out of the 20cases (Table 3).
Discussion
Our survey of population studies of organelle DNA inplants includes data from 183 species, which should comeclose to an exhaustive compilation of the data available inspring 2004. The first population genetic studies basedon oDNA that were suitable for inclusion (i.e. that hadsampled different individuals within several populationswithout bulking them in the molecular analyses) were byBanks & Birky (1985) on Lupinus texensis (98 individualsin 15 populations) and by Neale et al. (1986) in Hordeumvulgare (229 individuals in 21 populations, excludingcultivated accessions). Although a high level of subdivisionwas already apparent in these studies, direct estimates ofGST for oDNA markers were first calculated in the 1990s(Kremer et al. 1991; in Quercus robur and Quercus petraea),making it clear that subdivision at cpDNA markers couldbe considerably larger than at nuclear ones.
For this compilation, measures of oDNA populationstructure are based in most cases on our re-analyses of theoriginal raw data sets to improve comparability acrossstudies. Indeed, different estimators of genetic differen-tiation have often been used in the literature, somehowrestricting the interest of comparative studies (e.g. Nybom& Bartish 2000; Nybom 2004; but see Morjan & Rieseberg2004). In principle, the type of molecular technique usedcould also affect measures of subdivision of diversity for agiven genome. For instance, selection could affect estimatesof genetic subdivision at protein markers (McDonald1994), high mutation rates could affect subdivision atSSR markers (Hedrick 1999) and anonymous detectiontechniques such as RAPD or AFLP could include not onlyfragments from the nuclear genome but also oDNA frag-ments, resulting in upwardly biased measures of nuclearsubdivision if undetected (Aagaard et al. 1995). However,the differences in levels of subdivision across markersfound in the present paper were limited and seemed to bethe result of other factors (such as bulked analyses of DNAsamples, which were subsequently removed from the ana-lyses) or involved only a small fraction of the studies (in the
Fig. 6 Estimate of oDNA genetic subdivision based on similaritiesbetween haplotypes (NST) as a function of GST. A majority ofvalues are found above the diagonal, including all but one of thesignificant differences between NST and GST (shown in black).Note the trend for NST based on maternally inherited markers toincreasingly depart from the diagonal when GST increases.
O R G A N I Z A T I O N O F G E N E T I C D I V E R S I T Y I N P L A N T S 697
© 2005 Blackwell Publishing Ltd, Molecular Ecology, 14, 689–701
case of nuclear differentiation). Previous comparisonshave shown some discrepancy between estimates of sub-division based on different nuclear markers for a givenspecies (e.g. Nybom 2004) but no systematic bias has beenreported (Vandewoestijne & Baguette 2002; Nybom 2004).As a consequence, we do not expect that the main conclu-sions of our studies could be affected by the heterogeneityof techniques used, although the field would certainly gainfrom further harmonization and standardization of tech-niques and methods of data analyses.
We also computed standard errors of examined para-meters to assess the effects of sampling on the precision ofestimates. As expected, the total number of sampled indi-viduals is the best predictor of the precision of GST. How-ever, we could also confirm an earlier observation (Pons& Petit 1995) that the precision of parameter estimates ismore affected by the number of populations sampled thanby the sampling of individuals within populations. Thissuggests that future studies on the geographical structureof plant populations based on oDNA should allocate mostefforts to the sampling of as many populations as possible,even at the expense of within-population sampling.Sequential approaches first analysing simultaneously (i.e.bulking) several individuals from the same populationfollowed by separate analyses of each individual whenwithin-population variation is detected, do not appear tobe advisable, given the prevalence of intrapopulationdiversity. As a matter of fact, complete fixation (GST = 1)
was detected in only 11 out of 152 studies based on mater-nally inherited markers.
The finding that the portion of the range sampledaffects GST estimates confirms similar results by Morjan &Rieseberg (2004) with data from both plants and animals.Several studies have shown that differentiation generallyincreases with distance (e.g. Dumolin-Lapègue et al. 1997;Grivet & Petit 2002a; Palmé & Vendramin 2002; Heuertzet al. 2004), so detecting higher GST values in species-widesurveys makes sense. It would be desirable that futurestudies provide complete curves of differentiation as afunction of distance, instead of single estimates of meas-ures of differentiation, allowing standardization of GST toa common reference distance for comparison purposes, asrecently performed in an analysis of mtDNA in vertebrates(Martin & McKay 2004).
In the present paper, the genera with the highest numberof species studied at maternally inherited markers were Pinusand Quercus (11 and 10, respectively, out of a total of 144species). Although these genera might be expected to biasoverall estimates, averaging across genera instead of specieschanged mean GST estimates by less than 1%, so the valuespresented here should be representative, at least taxonom-ically. However, the finding that the taxonomic identityof species explains a considerable amount of variation inGST does challenge the significance of previously identifiedrelationships between levels of genetic differentiation, lifehistory traits or ecological attributes. Because GST values of
Species†* Number of loci Inheritance‡ GST NST§ RST§
Abies guatemalensis 2 P 0.137 0.148 0.231Abies nordmanniana 3 P 0.007 0.012 0.020Alyssum bertolonii 5 M 0.210 0.310* 0.475*Arabidopsis thaliana 8 M 0.968 0.990 0.991Caesalpinia echinata 7 M 0.911 0.980* 0.997*Picea abies 3 P 0.089 0.095 0.063Pinus albicaulis 3 P 0.073 0.024 0.102Pinus brutia 8 P 0.124 0.271* 0.348*Pinus canariensis 6 P 0.085 0.187* 0.174*Pinus cembra 3 P 0.029 0.022 0.017Pinus halepensis 6 P 0.163 0.210* 0.120Pinus lambertiana 8 P 0.143 0.592* 0.840*Pinus leucodermis 10 P 0.054 0.100* 0.130*Pinus mugo 3 P 0.052 0.096* 0.122*Pinus nelsonii 4 P 0.126 0.081 0.035Pinus pinaster 7 P 0.101 0.146* 0.191*Pinus pinceana 4 P 0.495 0.760* 0.929*Pinus resinosa 3 P 0.720 0.721 0.681Pinus sylvestris 6 P 0.017 0.018 0.018Vitis vinifera 2 M 0.188 0.220 0.282Mean 5 0.235 0.299 0.338
†References are provided in Table S1; ‡P: paternal inheritance, M: maternal inheritance; §Asterisks indicate that NST (or RST) is significantly higher than GST (P < 0.05).
Table 3 Comparison of differentiationestimates for cpSSR data
698 R . J . P E T I T E T A L .
© 2005 Blackwell Publishing Ltd, Molecular Ecology, 14, 689–701
species belonging to the same genus or family tend to besimilar, analysing them independently increases the risk ofstatistical pseudoreplication. In fact, a recent study relyingon phylogenetically informed analytical methods hasdemonstrated that the use of direct species comparisonswithout consideration of their phylogenetic relationshipsmight result in many false positives when seeking to identifyrelations between GST and life history traits or ecologicalattributes of species (Aguinagalde et al. 2005).
The most striking contrast between GST estimates basedon markers from different plant genomes is that betweenmaternally inherited markers and markers having othermodes of inheritance (biparental or paternal). Comparedto biparentally inherited nuclear markers, maternallyinherited oDNA markers display not only larger values ofGST but also more heterogeneous values, occupying thefull spectrum between little population structure (althoughcases below 0.1 are unusual: only two examples werefound in this review) and near complete fixation (which isnot rare, even in species that have been well-sampled andwhich display sufficient levels of total diversity, see, e.g.Grivet & Petit 2002b or Burban & Petit 2003). There is moreheterogeneity in GST estimates based on paternally inher-ited markers than for those based on biparentally inheritedones, which might be attributed to the greater action ofdrift on effectively haploid genomes.
The lower levels of differentiation observed at nucleargenes in conifers compared to angiosperms merely con-firm earlier studies (e.g. Hamrick et al. 1992), but the factthat this is matched by greater (and not lower) levelsof differentiation at maternally inherited markers is a firstindication that measures of genetic differentiation at differ-ent markers need not covary positively. In fact, no correla-tion was found between GST at nuclear loci and maternallyinherited oDNA genes. On the other hand, a strong covari-ation of GST across genomes was observed between cpDNAand mtDNA in angiosperms, where both are generallymaternally inherited. Strictly co-transmitted uniparentallyinherited genomes represent a single ‘locus’ and should becharacterized by similar levels of differentiation (Dumolin-Lapègue et al. 1998; Desplanque et al. 2000; Olson & McCauley2000; Belahbib et al. 2001; Huang et al. 2001). In conifers,paternally and biparentally inherited markers also havevery similar levels of genetic structure, as shown by therelatively tight positive correlation between the two sets ofGST estimates. This makes sense as both the cpDNA andnuclear genomes are moved by pollen and by seeds, i.e.they use the same vehicles to achieve gene flow (note thatpaternal mode of transmission does not imply transmis-sion by pollen only, as sometimes stated in the literature,e.g. Morjan & Rieseberg 2004). The only difference is thatpaternally inherited genes will experience dispersal bypollen at each reproductive cycle, whereas only 50% of thenuclear genes will experience gene flow by pollen in a
given cycle (all genes experience gene flow by seeds).However, GSTb is often ‘too large’ (or GSTp ‘too low’), com-pared to equilibrium conditions that predict that GSTb ≤GSTp (e.g. Petit et al. 1993). One possible interpretation forthis observation has been proposed by Petit et al. (1993; seetheir Fig. 2): as cpDNA is effectively haploid, its effectivepopulation size is lower than that of a nuclear gene (Birkyet al. 1983, 1989). Hence, GST values at cpDNA markers willreach equilibrium faster than GST values at nuclear genes,resulting in transient situations where GSTp < GSTb (assumingthat for both genomes the initial situation is characterizedby larger-than equilibrium GST values).
The median mp/ms value across all species was c. 17,suggesting that gene flow through pollen is quantitativelymuch more important than through seeds. From theseresults, one might conclude that gene flow is generallyasymmetrical in seed plants, with most species relying pre-dominantly on pollen for gene exchanges. However, thereare 27% of plants with mp/ms estimates below five, indicat-ing that seeds can also play a significant role in overallgene flow (i.e. > 20% of total; typical examples from thiscategory would include insect-pollinated and fleshy-fruited species, for which pollen dispersal is limited whilefrugivorous vertebrates render long-distance seed dis-persal relatively common, e.g. Oddou-Muratorio et al. 2001).
Comparisons between various GST estimates indicatedeparture from migration-drift equilibrium, from neutral-ity or from an island model of population structure, sothese conclusions are at best very rough indications andcould even be misleading. Furthermore, the absence of cor-relation between migration ratios derived by contrastingeither GSTp or GSTb with GSTm indicates that these estimatesdo suffer from low stability. Nevertheless, given the largevariation in GST values observed across species, the mp/msratio should provide an approximate idea of the relativeimportance of the two components of historical (ratherthan current) gene flow. Morjan & Rieseberg (2004), whileacknowledging the unrealistic assumptions made in suchstudies, have similarly concluded that estimates of numberof migrants (Nm) do not appear to be so biased as to maskexpected interspecific trends in patterns of gene flow. More-over, an earlier study based on two different methods toestimate this ratio yielded similar estimates, thus providingsome support for this approach (Oddou-Muratorio et al.2001).
In principle, it could be of interest to check if species hav-ing high (or low) pollen dispersal ability simultaneouslytend to have high (or low) seed dispersal ability. We are notaware of the question having ever been raised so far. Inthe near future, direct estimates of dispersal distancesobtained by parentage analysis might provide an answerto this question. In the meantime, we have used an indirectapproach, susceptible to the same criticisms made previously,to check for the existence of some kind of compensation
O R G A N I Z A T I O N O F G E N E T I C D I V E R S I T Y I N P L A N T S 699
© 2005 Blackwell Publishing Ltd, Molecular Ecology, 14, 689–701
between both forms of gene flow. For this purpose, webuilt a null hypothesis that mp is independent of ms, i.e.that it does not increase when GSTm increases (i.e. when msdecreases). This scenario was fitted on the data of Fig. 5,indicating no visible trend besides the logical increase ofmp/ms with decreasing ms (i.e. increasing GSTm). In otherwords, no sign exists that would indicate either compensa-tion or positive covariation between gene flow throughpollen and through seeds.
Our last analysis consisted in testing whether the pres-ence of a phylogeographical component of populationstructure is a common phenomenon in plants. By this wemean an additional component of geographical structurenot seen when considering only differences in allelic fre-quencies between populations. It is obtained by subtract-ing standard GST (or FST) estimates from measures such asNST (e.g. Pons & Petit 1996) or RST (Slatkin 1995) that takeinto account similarities between haplotypes. In the frameof an island model, the finding of a significant phylogeo-graphical component would provide support for historical(non equilibrium) population genetic structure, as RST andFST (= GST) are expected to converge to the same valuesunder equilibrium conditions (Slatkin 1995) but it couldequally point to an equilibrium situation in an isolation-by-distance model, as RST is predicted to be higher than FSTin this case (Rousset 1996; see his Fig. 1).
Regardless of the cause for the difference between esti-mators, it appears that measuring genetic differentiationwithout including information on similarities betweenhaplotypes results in the loss of useful information. In fact,in many cases NST > GST, and the trend is even stronger forRST. The same result was found on the basis of a smallerdata set analysed by Petit et al. (2003) and Aguinagaldeet al. (2005). In contrast, earlier studies by other authors hadoften questioned the relevance of RST estimates, in view ofits higher variance compared to other estimators of FST (e.g.Streiff et al. 1998; Gaggiotti et al. 1999; Balloux et al. 2000;Balloux & Goudet 2002; Balloux & Lugon-Moulin 2002;Kalinowski 2002; Neigel 2002). Our findings clearlysupport the use of NST or RST for estimating organelle popu-lation genetic structure, especially at broad geographicalscales. This fits with theoretical findings that have shownthat ‘the relative efficiency of allele size-based vs. alleleidentity-based statistics depends on the relative contribu-tions of mutations vs. drift to population differentiation’(Hardy et al. 2003), and hence on the spatio-temporal scaleconsidered.
In any case, the use of these estimators further empha-sizes the high level of geographical structure found in mostplant species when using maternally inherited markers, instark contrast with biparentally inherited nuclear markers.This finding has attracted much interest for about 15 years,giving birth to a new discipline, plant phylogeography,and leading to the development of many important practical
applications, such as traceability and ecocertification of forestproducts and the identification of plant populations forconservation.
Acknowledgements
The research was supported be the EC research program FAIR5-CT97-3795 (CYTOFOR) to RJP, SF and GGV and by a grant fromthe Bureau des Ressources Génétiques to RJP. AH received finan-cial support from the FPI grant PB98-1144 of the Spanish Ministryof Science and Technology. We thank the following colleagueswho have contributed unpublished data or complementary in-formation for inclusion in the database: Richard Abbott, ItziarAguinagalde, Erika Aguirre Planter, François Balfourier, GuillaumeBesnard, Christiane Bittkau, Isabelle Bonnin, Jean Bousquet, LindaBroadhurst, Steven Brunsfeld, Margaret Byrne, Henri Caron,Stephen Cavers, Catherine Clark, Els Coart, Rosane Collevatti,Salvatore Cozzolino, Dan Crawford, Mitch Cruzan, Nicolas Devos,Alexis Ducousso, Cyril Dutech, Richard Ennos, Colin Ferris,Isabelle Gamache, Leonardo Gallo, Pauline Garnier-Géré, FelixGugerli, Myriam Heuertz, Juan Pablo Jaramillo, Andy King,Marcus Koch, Monika Konnert, Antoine Kremer, Martin Lascoux,Sascha Liepelt, Catarina Lira, Andy Lowe, Roselyne Lumaret,Carlos Magni, Alessio Mengoni, Jose Gabriel Segarra Moragues,Nicole Muloko-Ntoutoume, Gerhard Müller-Starck, Brigitte Musch,Sylvie Oddou-Muratorio, Matt Olson, Anna Palmé, Daniel Piñero,Daniel Prat, Jim Provan, Olivier Raspé, Sarah Rendell, BryceRichardson, Joëlle Ronfort, Stéphanie Roux, Luis Gil Sanchez, PierreSaumitou-Laprade, Vladimir Semerikov, Tim Sharbel, Marco Soliva,Christoph Sperisen, Ivana Stehlik, Naoki Tani, Michèle Tarayre,Yoshihiko Tsumura, Lisa Wallace and Birgit Ziegenhagen.
Supplementary material
The following material is available from http://www.blackwellpublishing.com/products/journals/suppmat/mec/mec2410/mec2410sm.htm
Table S1. Measures of population subdivision at cpDNA andmtDNA markers in seed plants
Table S2. Measures of population subdivision at nuclear markersfor plants from Table S1
References
Aagaard JE, Vollmer SS, Sorensen FC, Strauss SH (1995) Mito-chondrial DNA products among RAPD profiles are frequentand strongly differentiated between races of Douglas-fir. Mole-cular Ecology, 4, 441–446.
Aguinagalde I, Hampe A, Mohanty A et al. (2005) Effects of lifehistory traits and species distribution on genetic structure atmaternally inherited markers in European trees and shrubs.Journal of Biogeography, in press.
Balloux F, Brunner H, Lugon-Moulin N, Hausser J, Goudet J (2000)Microsatellites can be misleading: an empirical and simulationstudy. Evolution, 54, 1414–1422.
Balloux F, Goudet J (2002) Statistical properties of populationdifferentiation estimators under stepwise mutation in a finiteisland model. Molecular Ecology, 11, 771–783.
700 R . J . P E T I T E T A L .
© 2005 Blackwell Publishing Ltd, Molecular Ecology, 14, 689–701
Balloux F, Lugon-Moulin N (2002) The estimation of populationdifferentiation with microsatellite markers. Molecular Ecology,11, 155–165.
Banks JA, Birky CW Jr (1985) Chloroplast DNA diversity is low ina wild plant, Lupinus texensis. Proceedings of the National Academyof Sciences of the USA, 82, 6950–6954.
Belahbib N, Pemonge M-H, Ouassou A, Sbay H, Kremer A, Petit RJ(2001) Frequent cytoplasmic exchanges between oak speciesthat are not closely related: Quercus suber and Q. ilex in Morocco.Molecular Ecology, 10, 2003–2012.
Birky Jr CW, Fuerst P, Maruyama T (1989) Organelle genediversity under migration, mutation, and drift: equilibriumexpectations, approach to equilibrium, effects of heteroplasmiccells, and comparison to nuclear genes. Genetics, 103, 513–527.
Birky Jr CW, Maruyama T, Fuerst P (1983) An approach to popu-lation and evolutionary genetic theory for gene in mitochondriaand chloroplasts, and some results. Genetics, 103, 513–513.
Brunsfeld SJ, Sullivan J, Soltis DE, Soltis PS (2001) Comparativephylogeography of northwestern North America: A synthesis.In: Integrating Ecological and Evolutionary Processes in a SpatialContext (eds Silvertown J, Antonovics J), pp. 319–339. BlackwellScience, Oxford.
Burban C, Petit RJ (2003) Phylogeography of maritime pineinferred with organelle markers having contrasted inheritance.Molecular Ecology, 12, 1487–1495.
Burban C, Petit RJ, Carcreff E, Jactel H (1999) Rangewide varia-tion of the maritime pine bast scale Matsucoccus feytaudi Duc.(Homoptera: Matsucoccidae) in relation to the genetic structureof its host. Molecular Ecology, 8, 1593–1602.
Desplanque B, Viard F, Bernard J, et al. (2000) The linkage disequi-librium between chloroplast DNA and mitochondrial DNAhaplotypes in Beta vulgaris ssp. maritima (L.): the usefulness ofboth genomes for population genetic studies. Molecular Ecology,9, 141–154.
Dumolin-Lapègue S, Demesure B, Le Corre V, Fineschi S, Petit RJ(1997) Phylogeographic structure of white oaks throughout theEuropean continent. Genetics, 146, 1475–1487.
Dumolin-Lapègue S, Pemonge M-H, Petit RJ (1998) Associationbetween chloroplast and mitochondrial lineages in oaks. Mole-cular Biology and Evolution, 15, 1321–1331.
El Mousadik A, Petit RJ (1996) Chloroplast DNA phylogeographyof the argan tree of Morocco. Molecular Ecology, 5, 547–555.
Ellstrand NC (1992) Gene flow by pollen: implications for plantconservation genetics. Oikos, 63, 77–86.
Ennos RA (1994) Estimating the relative rates of pollen and seedmigration among plant populations. Heredity, 72, 250–259.
Gaggiotti OE, Lange O, Rassmann K, Gliddon C (1999) A com-parison of two indirect methods for estimating average levelsof gene flow using microsatellite data. Molecular Ecology, 8, 1513–1520.
Grivet D, Petit RJ (2002a) Phylogeography of the common ivy(Hedera sp.) in Europe: genetic differentiation through spaceand time. Molecular Ecology, 11, 1351–1362.
Grivet D, Petit RJ (2002b) Chloroplast DNA phylogeography ofthe hornbeam in Europe: evidence for a bottleneck at the outsetof postglacial colonization. Conservation Genetics, 4, 47–56.
Hamilton MB, Miller JR (2002) Comparing relative rates of pollen andseed gene flow in the island model using nuclear and organellemeasures of population structure. Genetics, 162, 1897–1909.
Hamrick JL, Godt MJW, Sherman-Broyles SL (1992) Factorsinfluencing levels of genetic diversity in woody plant species.New Forests, 6, 95–124.
Hardy OJ, Charbonnel N, Fréville H, Heuertz M (2003) Micro-satellite allele sizes: a simple test to assess their significanceon genetic differentiation. Genetics, 163, 1467–1482.
Harris SA, Ingram R (1991) Chloroplast DNA and biosystematics:The effects of intraspecific diversity and plastid transmission.Taxon, 40, 393–412.
Hedrick PW (1999) Highly variable loci and their interpretation inevolution and conservation. Evolution, 53, 313–318.
Heuertz M, Fineschi S, Anzidei M et al. (2004) Chloroplast DNAvariation and postglacial recolonisation of common ash (Fraxinusexcelsior L.) in Europe. Molecular Ecology, 13, 3423–3438.
Hu X-S, Ennos RA (1997) On estimation of the ratio of pollen toseed flow among plant populations. Heredity, 79, 541–552.
Huang S, Chiang YC, Schaal BA, Chou CH, Chiang TY (2001)Organelle DNA phylogeography of Cycas taitungensis, a relictspecies in Taiwan. Molecular Ecology, 10, 2669–2681.
Kalinowski ST (2002) Evolutionary and statistical properties ofthree genetic distances. Molecular Ecology, 11, 1263–1273.
Kremer A, Petit RJ, Zanetto A, et al. (1991) Nuclear and organellediversity in Quercus robur and Q. petraea. In: Genetic Variation inEuropean Populations of Forest Trees (eds Müller-Starck G, ZieheM), pp. 141–166. Sauerländer’s-Verlag, Frankfurt am Main.
Levin DA, Kerster HW (1974) Gene flow in seed plants. Evolution-ary Biology, 7, 139–220.
Martin PR, McKay JK (2004) Latitudinal variation in genetic diver-gence of populations and the potential for future speciation.Evolution, 58, 938–945.
McCauley DE (1995) The use of chloroplast DNA polymorphismin studies of gene flow in plants. Trends in Ecology and Evolution,10, 198–202.
McDonald JH (1994) Detecting natural selection by comparinggeographic variation in protein and DNA polymorphisms. In:Non-Neutral Evolution. Theories and Molecular Data (ed Golding B),pp. 88–100. Chapman & Hall, New York, NY.
Mogensen HL (1996) The hows and whys of cytoplasmic inherit-ance in seed plants. American Journal of Botany, 83, 383–404.
Morjan CL, Rieseberg LH (2004) How species evolve collectively:implications of gene flow and selection for the spread of advant-ageous alleles. Molecular Ecology, 13, 1341–1356.
Neale DB, Saghai-Maroof MA, Allard RW, Zhang Q, JorgensenRA (1986) Chloroplast DNA diversity in populations of wildand cultivated barley. Genetics, 130, 1105–1110.
Nei M, Chesser RK (1983) Estimation of fixation indices and genediversities. Annals of Human Genetics, 47, 253–259.
Neigel JE (2002) Is FST obsolete ? Conservation Genetics, 3, 167–173.Nybom H (2004) Comparison of different nuclear DNA markers
for estimating intraspecific genetic diversity in plants. MolecularEcology, 13, 1143–1155.
Nybom H, Bartish IV (2000) Effects of life history traits andsampling strategies on genetic diversity estimates obtained withRAPD markers in plants. Perspectives in Plant Ecology, Evolutionand Systematics, 3, 93–114.
Oddou-Muratorio S, Petit RJ, Le Guerroué B, Guesnet D,Demesure B (2001) Pollen- vs. seed-mediated gene flow in ascattered forest tree species. Evolution, 55, 1123–1135.
Olson MS, McCauley DE (2000) Linkage disequilibrium andphylogenetic congruence between chloroplast and mitochondrialhaplotypes in Silene vulgaris. Proceedings of the Royal Society ofLondon, B, 267, 1801–1808.
Ouborg NJ, Piquot Y, Van Groenendael JM (1999) Populationgenetics, molecular markers and the study of dispersal in plants.Journal of Ecology, 87, 551–568.
O R G A N I Z A T I O N O F G E N E T I C D I V E R S I T Y I N P L A N T S 701
© 2005 Blackwell Publishing Ltd, Molecular Ecology, 14, 689–701
Palmé A, Vendramin GG (2002) Chloroplast DNA variation,postglacial recolonization and hybridization in hazel, Corylusavellana. Molecular Ecology, 11, 1769–1779.
Petit RJ (1992) Polymorphisme de l’ADN chloroplastique dans uncomplexe d’espèces: les chênes blancs européens. DoctorateThesis, Paris XI-Orsay.
Petit RJ, Aguinagalde I, de Beaulieu J-L et al. (2003) Glacial refugia:hotspots but not melting pots of genetic diversity. Science, 300,1563–1565.
Petit RJ, Kremer A, Wagner DB (1993) Finite island model fororganelle and nuclear genes in plants. Heredity, 71, 630–641.
Petit RJ, Vendramin GG (2005) Phylogeography of organelle DNAin plants: an introduction. In: Phylogeography of Southern EuropeanRefugia (eds Weiss S, Ferrand N). in press. Kluwer, Amsterdam.
Pons O, Petit RJ (1995) Estimation, variance and optimal samplingof gene diversity. I. Haploid locus. Theoretical and Applied Genetics,90, 462–470.
Pons O, Petit RJ (1996) Measuring and testing genetic differenti-ation with ordered vs. unordered alleles. Genetics, 144, 1237–1245.
Reboud X, Zeyl C (1994) Organelle inheritance in plants. Heredity,72, 132–140.
Röhr H, Kües U, Stahl U (1998) Organelle DNA of plants andfungi: Inheritance and recombination. Progress in Botany, 60, 39–87.
Rousset F (1996) Equilibrium values of measures of populationsubdivision for stepwise mutation processes. Genetics, 142,1357–1362.
Schaal BA, Hayworth DA, Olsen KM, Rauscher JT, Smith WA(1998) Phylogeographic studies in plants: problems andprospects. Molecular Ecology, 7, 465–474.
Slatkin M (1995) A measure of population subdivision based onmicrosatellite allele frequencies. Genetics, 139, 457–462.
Soltis DE, Gitzendanner MA, Strenge DD, Soltis PS (1997) Chloro-plast DNA intraspecific phylogeography of plants from thePacific Northwest. Plant Systematics and Evolution, 206, 353–373.
Soltis DE, Mayer MS, Soltis PS, Edgerton M (1991) Chloroplast-DNA variation in Tellima grandiflora (Saxifragaceae). AmericanJournal of Botany, 78, 1379–1390.
Streiff R, Labbé T, Bacilieri R et al. (1998) Within-populationgenetic structure in Quercus robur L. & Quercus petraea (Matt.)
Liebl. assessed with isozymes and microsatellites. MolecularEcology, 7, 317–328.
Vandewoestijne S, Baguette M (2002) The genetic structure ofendangered populations in the Cranberry Fritillary, Boloria aqui-lonaris (Lepidoptera, Nymphalidae): RAPDs vs allozymes.Heredity, 89, 439–445.
Weir BS, Cockerham CC (1984) Estimating F-statistics for theanalysis of population structure. Evolution, 38, 1358–1370.
Whitlock MC, McCauley DE (1999) Indirect measures of gene flowand migration: FST ≠ 1/(4Nm + 1). Heredity, 82, 117–125.
Wright S (1931) Evolution in Mendelian populations. Genetics, 16,97–159.
Rémy J. Petit is studying population genetics and evolution oftrees, with a special focus on phylogeography, organelle geneticsand evolution, genetic diversity, palaeogenetics, and conservationgenetics of trees. Jérôme Duminil is a PhD student at INRA,working on comparative studies of genetic diversity in plants.He is particularly interested in ecological, life historical andchorological features of species that can explain the distributionof genetic diversity. He is also using comparative methods tostudy organelle genome and sequence evolution. Silvia Fineschiis interested in the phylogeography and ecological genetics ofangiosperm tree species. Daniela Salvini is a PhD student workingon ecological and spatial genetics of white oaks, with particularinterest on the study of gene flow and environmental features asfactors shaping the natural genetic diversity of plant populations.Giovanni G. Vendramin’s studies focus on conservation andpopulation genetics, with particular emphasis on range-widephylogeography and fine-scale population gene dynamics. ArndtHampe has recently completed his PhD on the phylogeographyand reproductive ecology of a climatic relict tree. He is nowworking on plant–animal interactions using both ecological andgenetic approaches. The collaboration between the authors onthis topic has started in 1998, during a stay of SF in Bordeaux,when the database was initiated. Since then, numerous exchanges,especially during the EU CYTOFOR project and then during staysof DS and AH in Bordeaux and of JD in Sevilla, have given furtherimpetus to this work.
Related Documents


