University of Cape Town Comparative Molecular Genetics of the German Shepherd Dog Natalie June Coutts A dissertation submitted in fulfilment of the requirements for the degree Magister Scientiae Supervised by Professor E.H. Harley Department of Clinical Laboratory Sciences Faculty of Health Sciences University of Cape Town December 2004

Welcome message from author
This document is posted to help you gain knowledge. Please leave a comment to let me know what you think about it! Share it to your friends and learn new things together.
Transcript
Univers
ity of
Cap
e Tow
n
Comparative Molecular Genetics of the
German Shepherd Dog
Natalie June Coutts
A dissertation submitted in fulfilment
of the requirements for the degree
Magister Scientiae
Supervised by Professor E.H. Harley
Department of Clinical Laboratory Sciences
Faculty of Health Sciences
University of Cape Town
December 2004
The copyright of this thesis vests in the author. No quotation from it or information derived from it is to be published without full acknowledgement of the source. The thesis is to be used for private study or non-commercial research purposes only.
Published by the University of Cape Town (UCT) in terms of the non-exclusive license granted to UCT by the author.
Univers
ity of
Cap
e Tow
n
Univers
ity of
Cap
e Tow
n
were measure
was
.... .., ....... were
measures
iii

Univers
ity of
Cap
e Tow
n1:
1 .. 1.
1
1
1
1
1
1
1
1.
iii
1
1
4
5
6
9
10
12
15
11
iv
Univers
ity of
Cap
e Tow
n
1.
41
1.
v
Univers
ity of
Cap
e Tow
n
APlpenldlX I:
1
1
1
1
vi
Univers
ity of
Cap
e Tow
n
\lOirOrln'!:ll!'V nurses
von
or

Univers
ity of
Cap
e Tow
n
on
Univers
ity of
Cap
e Tow
n
aa
F
ix
Univers
ity of
Cap
e Tow
n
nm
x
Univers
ity of
Cap
e Tow
n
-1.1.
is
mean
a
16
1 ).
2
was 3
8
8
15
16
an
xi
Univers
ity of
Cap
e Tow
n
von
1
reverse
von
as
31
a
or one
were adc::led
Univers
ity of
Cap
e Tow
n
some
com
own source
Univers
ity of
Cap
e Tow
n
own source as
some 61
are
Univers
ity of
Cap
e Tow
nown source
a
are
xv
Univers
ity of
Cap
e Tow
n
some
were
are
81

Univers
ity of
Cap
e Tow
n
mean
own source

Univers
ity of
Cap
e Tow
n
1
1.1.
a common
1
raccoon
1 ).
1
1.1.)
1.1.)
1
is
is
1 ).
1
Univers
ity of
Cap
e Tow
n
1 ).
1 :
Univers
ity of
Cap
e Tow
n
4
11
3 9
2
17
16
15
14 21
13 22
12 23
1 was
one
1
3
Univers
ity of
Cap
e Tow
n
1
man
over l"fo,..,or,:.l"u'I
more
1
1
1
it
is
4
Univers
ity of
Cap
e Tow
n
was
as
man was a
was
1 ).
1
numerous
an
1 1
5
Univers
ity of
Cap
e Tow
n
were
as
(10
were
1
were occurrences.
nen,,,,,,,,,,.,, 7
in a cave in
1
as
1
in
in
, was
common
an
an
6
Univers
ity of
Cap
e Tow
n
an
were
1
no more
was common
7

Univers
ity of
Cap
e Tow
n
on 1
W22
a
1
1
is
10
III
in
a common
I is
an uneven
a
8
Univers
ity of
Cap
e Tow
n
1
across
or
were or
19
one common
were
was
11
9
Univers
ity of
Cap
e Tow
nacross
1
or()O()se~a an
one
1
d'~f'lnnC~T'
no
across
are
man across
were
10

Univers
ity of
Cap
e Tow
n
common
common
common
If an
a
a
as a
a
a
a
It
were common
11
Univers
ity of
Cap
e Tow
n
more InT\/n.c.~ were eteiCtE!C in
41
Cwas
are
a common a
1
so
14
12
Univers
ity of
Cap
e Tow
n
( was as
as
1). It was
was
a
a
13
Univers
ity of
Cap
e Tow
n
1
1. as a
are
1
1.
a
14

Univers
ity of
Cap
e Tow
n
Chapter 2
Population Genetics
2.1. Microsatellite Markers
Microsatellite markers are polymorphic DNA loci, randomly distributed throughout the
mammalian genome, constituting neutral markers under no selective pressure, and
exhibiting classic Mendelian inheritance with co-dominant nature of allelic variants (Bruford
and Wayne 1993, Zajc and Sampson 1996, Ruzzante 1998). Microsatellites consist of
between four to 30 tandem repeats of between two and six nucleotide bases (Figure 2.1.).
The number of repeats within individuals of a population is variable as a result of the
dynamic rate of mutation, reportedly between 10-4 and 5x10⁻⁶ mutations per chromosome
per generation (Bruford and Wayne 1993, Zajc et al. 1997). This rapid mutation rate is
considered the result of intra-allelic polymerase slippage during DNA replication; although
mechanisms may exist that restrict the number of repeat units (Bruford and Wayne 1993).
Figure 2.1. An electropherogram representing a nucleotide sequence incorporating a
microsatellite marker consisting of 16 GT repeats.
Microsatellite markers are ubiquitously dispersed across all eukaryotic genomes, the most
common motif, (CA)n, distributed in mammalian species approximately every 30kb
(Stallings et al. 1991, Jouquand et al. 2000). These repetitive sequences occur in
organisms from yeast to mammals and retain the potential for Z-DNA formation, possibly
indicating some functional role. It has been proposed that they participate in chromosomal
packaging, genetic recombination and promote gene transcription in plasmid constructs
(Stallings et al. 1991). Microsatellite sequences are found more frequently in euchromatin
than heterochromatin and may differentiate between constitutive heterochromatin and
euchromatin or facultative heterochromatin (Stallings et al. 1991).
Chapter 2: Population Genetics - Microsatellite Markers Page 15
Univers
ity of
Cap
e Tow
n
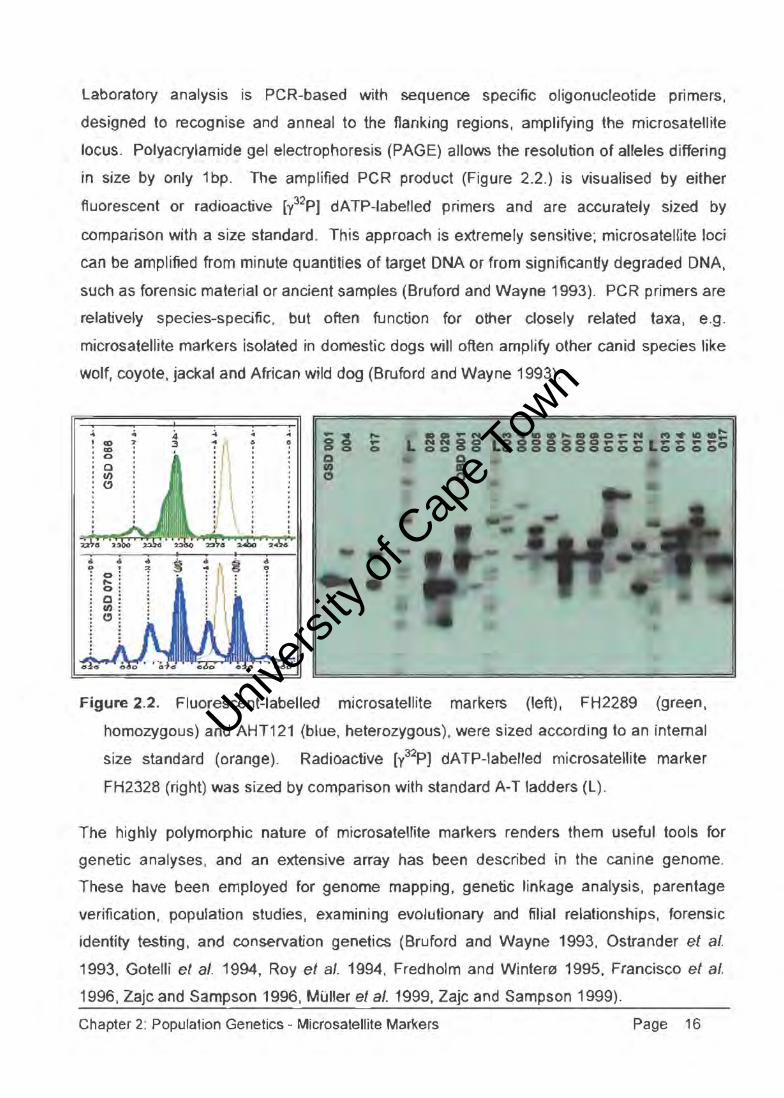
Laboratory analysis is peR-based with sequence specific oligonucleotide primers,
designed to recognise and anneal to the flanking regions, amplifying the microsatellite
locus. Polyacrylamide gel electrophoresis (PAGE) allows the resolution of alleles differing
in size by only 1 bp. The amplified PCR product (Figure 2.2.) is visualised by either
fluorescent or radioactive [l2pJ dATP-labelled primers and are accurately sized by
comparison with a size standard. This approach is extremely sensitive; microsatei!ite loci
can be amplified from minute quantities of target DNA or from significantly degraded DNA,
such as forensic material or ancient samples (Bruford and Wayne 1993). PCR primers are
relatively species-specific, but often function for other closely related taxa, e.g.
microsatellite markers isolated in domestic dogs will often amplify other canid species like
wolf, coyote, jackal and African wild dog (Bruford and Wayne 1993) .
..; ! co
<0 0
0 In (!)
CJ .... CJ Q IIJ (!)
.4 :3
I~ ! I
I \
88 .... •• "'N fJJ)glO .... !!O_N ... SSgg 8 gog ......... ° ° 00000
a a to ID 0 0
Figure 2.2. Fluorescent-labelled microsatellite markers (left), FH2289 (green,
homozygous) and AHT121 (blue, heterozygous), were sized according to an internal
size standard (orange). Radioactive [y32p) dATP-labelied microsatellite marker
FH2328 (right) was sized by comparison with standard A-T ladders (L).
The highly polymorphic nature of microsatellite markers renders them useful tools for
genetic analyses, and an extensive array has been described in the canine genome.
These have been employed for genome mapping, genetic linkage analysis, parentage
verification, population studies, examining evolutionary and filial relationships, forensic
identity testing, and conservation genetics (Bruford and Wayne 1993, Ostrander et a/.
1993, Gotelli et al. 1994, Roy et al. 1994, Fredholm and Wintem 1995, Francisco et a/.
1996, Zajc and Sampson 1996, Muller et a/. 1999, Zajc and Sampson 1999).
Chapter 2: Population Genetics - Microsatellite Markers Page 16

Univers
ity of
Cap
e Tow
n
a a
a
a can
one
pr<)CE!SS occurs
as
can
new
or a "".nn ....
- 1
If
Univers
ity of
Cap
e Tow
n
are or
one
more common
were more
1 "'n£.~nlt"lo."T measures are
a common
F :::::
a it
a
H = 1 - ).
18
Univers
ity of
Cap
e Tow
na
nearer one or zero
it
one or more I"I"\nl't,'h
can
is
measure
in
=
1 ).
a more
excess
measure
19
no
as

Univers
ity of
Cap
e Tow
n
more
. 1 -
as
1
across
exr)fe~SSE!S more
a measure
......... ' ................ 1
an or
nO, ....... '·'!:lInhl .... areas on'1"'n"'l"In,:u:~~
, as
or
on
no
excess or ... 1IoI::U' .... IT
1
Univers
ity of
Cap
e Tow
n
measure was
an
mean mean
if
=rx -1)/ r
are t'teolteon'l'u
can
or
Univers
ity of
Cap
e Tow
n
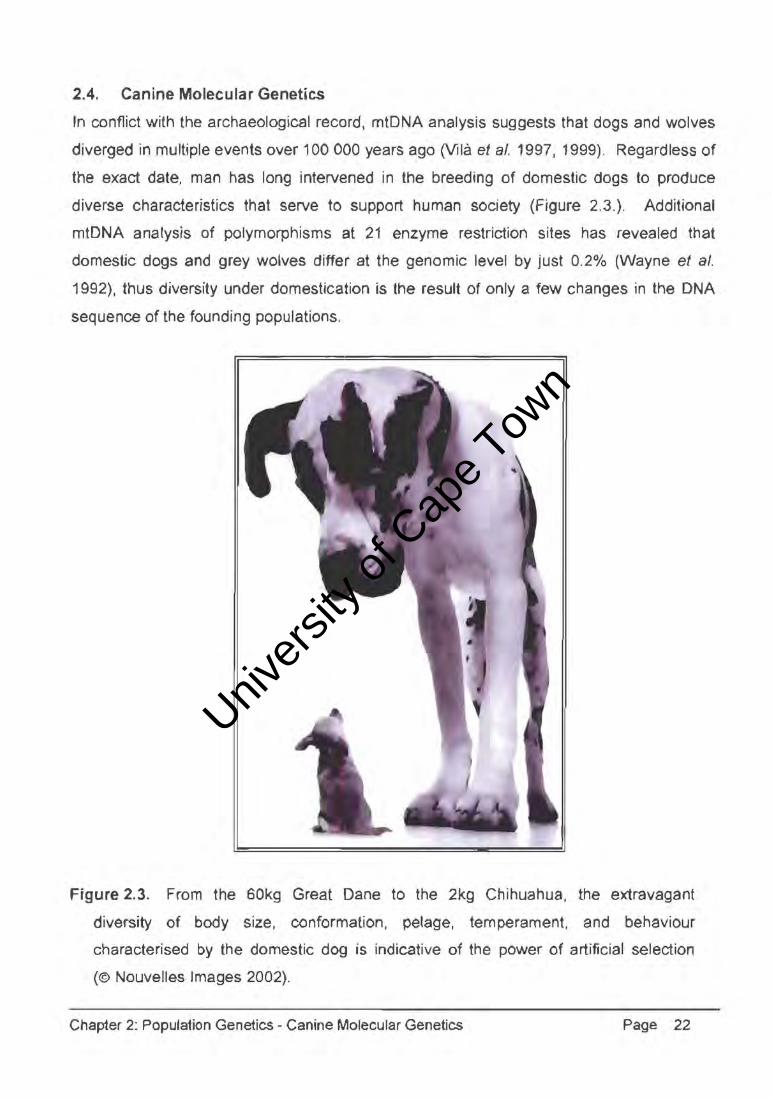
2.4. Canine Molecular Genetics
In conflict with the archaeological record, mtDNA analysis suggests that dogs and wolves
diverged in multiple events over 100 000 years ago (Vila et al. 1997, 1999). Regardless of
the exact date, man has long intervened in the breeding of domestic dogs to produce
diverse characteristics that serve to support human society (Figure 2.3.). Additional
mtDNA analysis of polymorphisms at 21 enzyme restriction sites has revealed that
domestic dogs and grey wolves differ at the genomic level by just 0.2% (Wayne et al.
1992), thus diversity under domestication is the result of only a few changes in the DNA
sequence of the founding populations.
Figure 2.3. From the 60kg Great Dane to the 2kg Chihuahua, the extravagant
diversity of body size, conformation, pelage, temperament, and behaviour
characterised by the domestic dog is indicative of the power of artificial selection
(© Nouvelles Images 2002).
Chapter 2: Population Genetics - Canine Molecular Genetics Page 22
Univers
ity of
Cap
e Tow
n
,..h." ...... ·.,. occurrence
a .... ".::.".:0. ... ., co-
).
more are deltected
}.
Univers
ity of
Cap
e Tow
n
).
one

Univers
ity of
Cap
e Tow
n
were on
measures
measures
mean
were
was es1:abllisl1led
as
.... ,.,.,."" ... ....a was ..... :'''''.,''''''''"
Univers
ity of
Cap
e Tow
n
±
was
was a
a
).
use
Univers
ity of
Cap
e Tow
n
) an
1
it
It was sU(lQe:ste!(j
was a more
an

Univers
ity of
Cap
e Tow
n
were was
were
consensus

Univers
ity of
Cap
e Tow
n-
m ..-
..-
/
Univers
ity of
Cap
e Tow
n
o o ..- ..-
-
c m Q)
E
Univers
ity of
Cap
e Tow
n
2.5. Population History of the Breeds
2.5.1. The German Shepherd Dog
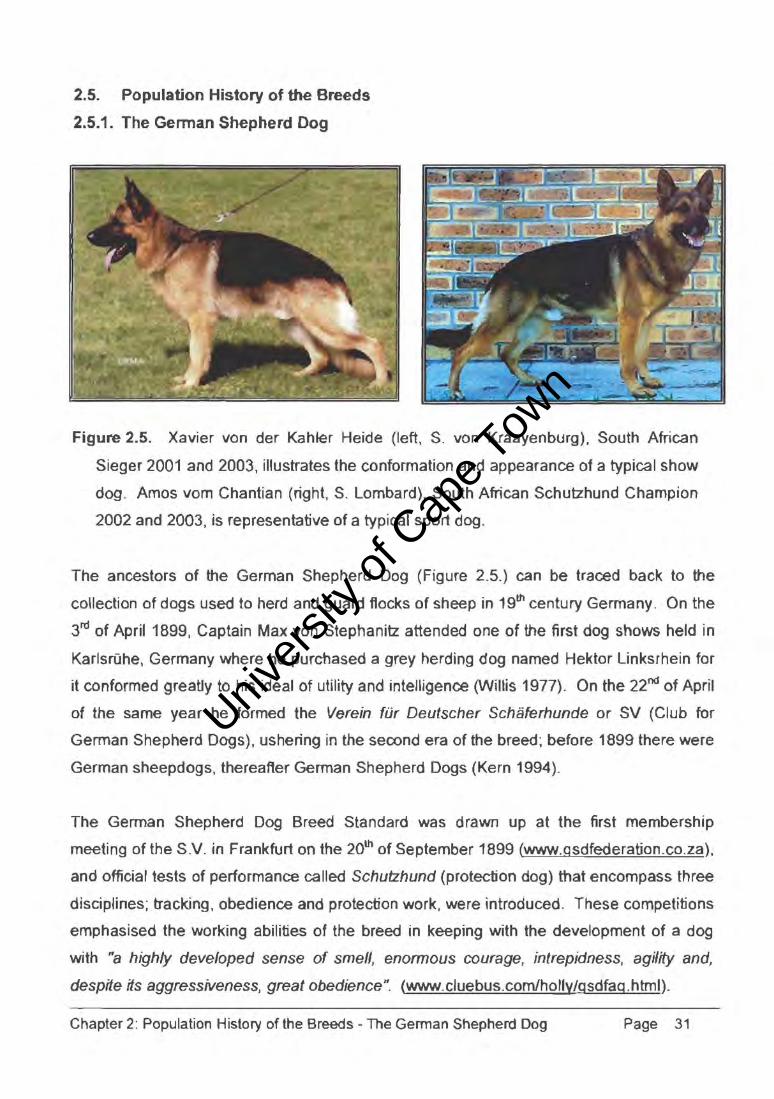
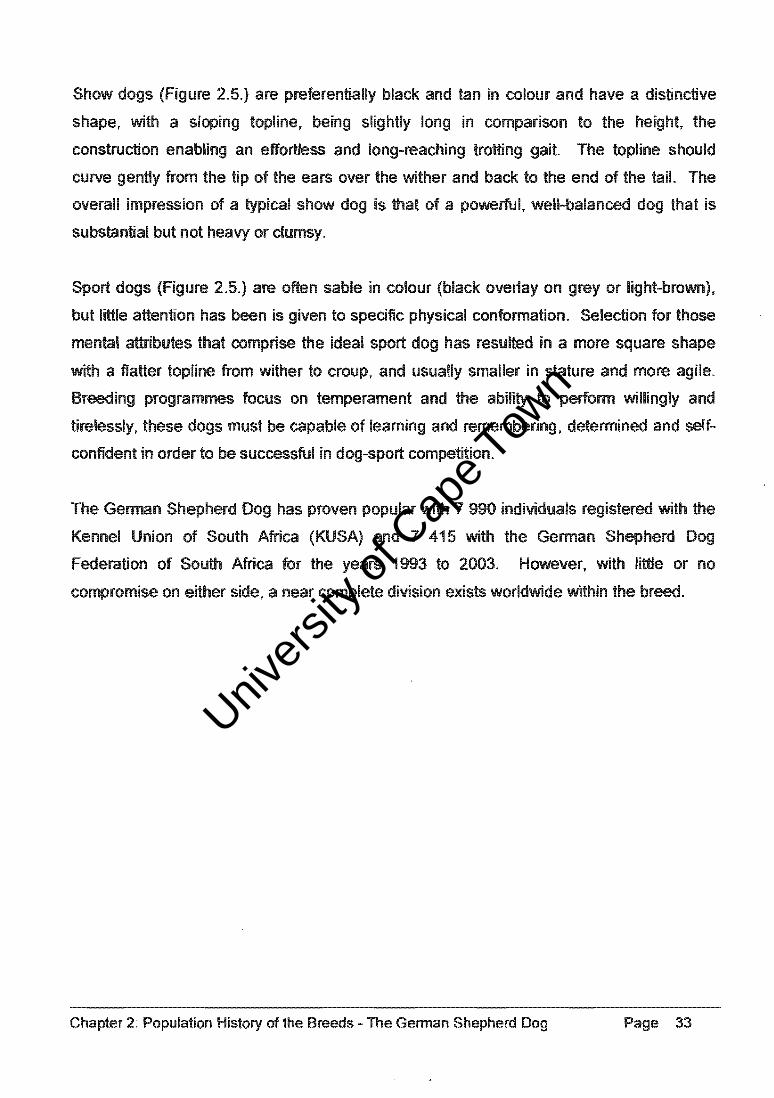
Figure 2.5. Xavier von der Kahler Heide (left, S. von Kraayenburg), South African
Sieger 2001 and 2003, illustrates the conformation and appearance of a typical show
dog. Amos vorn Chantian (right, S. Lombard), South African Schutzhund Champion
2002 and 2003, is representative of a typical sport dog.
The ancestors of the German Shepherd Dog (Figure 2.5.) can be traced back to the
collection of dogs used to herd and guard flocks of sheep in 19th century Germany. On the
3rd of April 1899, Captain Max von Stephanitz attended one of the first dog shows held in
Karlsruhe, Germany where he purchased a grey herding dog named Hektor Linksrhein for
it conformed greatly to his ideal of utility and intelligence (Willis 1977). On the 2200 of April
of the same year he formed the Verein tilr Deutscher Schaferhunde or SV (Club for
German Shepherd Dogs), ushering in the second era of the breed; before 1899 there were
German sheepdogs, thereafter German Shepherd Dogs (Kern 1994).
The German Shepherd Dog Breed Standard was drawn up at the first membership
meeting of the S.V. in Frankfurt on the 20th of September 1899 (www.gsdfederation.co.za).
and official tests of performance called Schutzhund (protection dog) that encompass three
disciplines; tracking, obedience and protection work, were introduced. These competitions
emphasised the working abilities of the breed in keeping with the development of a dog
with "a highly developed sense of smell, enormous courage, intrepidness, agility and,
despae as aggressiveness, great obedience". (www.cluebus.comlholly/gsdfaq.html).
Chapter 2: Population History of the Breeds - The German Shepherd Dog Page 31

Univers
ity of
Cap
e Tow
n
over
on
name
numerous
Univers
ity of
Cap
e Tow
n
are
curve
a
, ........... " ....... "'.,,, .. , on or IInIMoT_lno .. nu .....
or no
rnl"nl~lCIo on lCIortl"llClor a near t"n'Tlnl
Univers
ity of
Cap
e Tow
n
2.5.2. The Dachshund
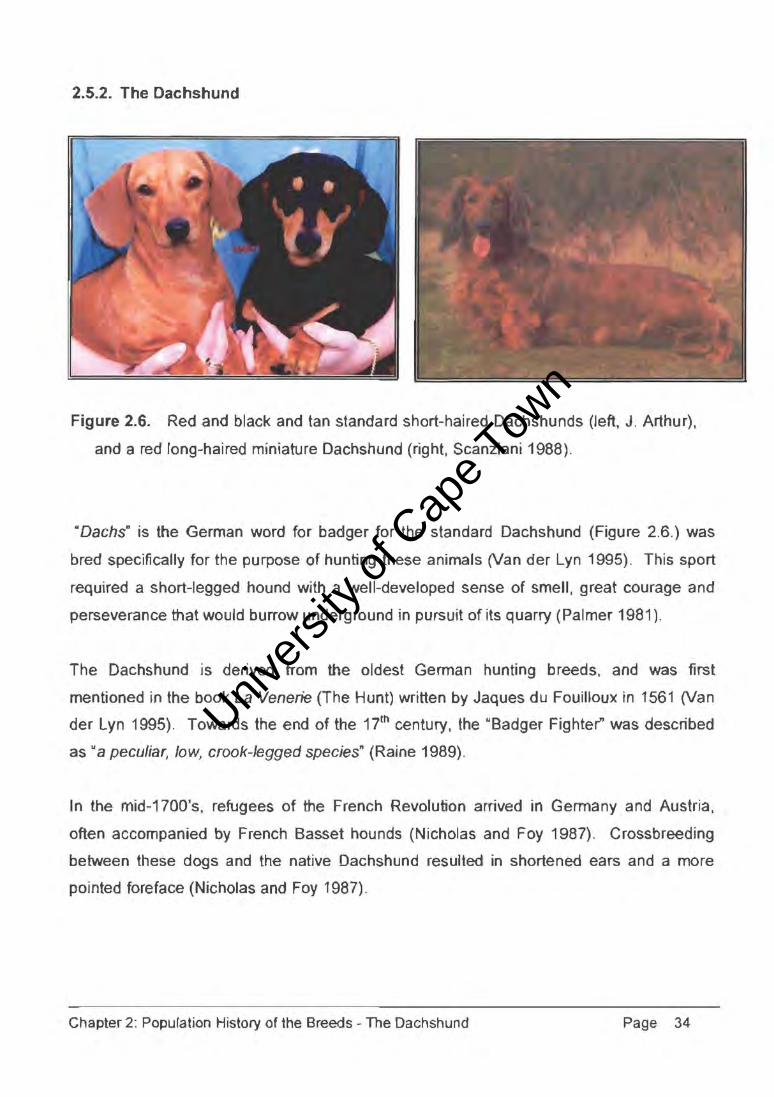
Figure 2.6. Red and black and tan standard short-haired Dachshunds (left, J. Arthur),
and a red long-haired miniature Dachshund (right, Scanziani 1988).
"Dachsn is the German word for badger for the standard Dachshund (Figure 2.6.) was
bred specifically for the purpose of hunting these animals (Van der Lyn 1995). This sport
required a short-legged hound with a well-developed sense of smell, great courage and
perseverance that would burrow underg round in pursuit of its quarry (Pal mer 1981).
The Dachshund is derived from the oldest German hunting breeds, and was first
mentioned in the book La VeneTie (The Hunt) written by Jaques du Fouilloux in 1561 (Van
der Lyn 1995). Towards the end of the 17th century, the "Badger Fighter" was described
as U a peculiar, low, crook-legged species" (Raine 1989).
In the mid-1700's, refugees of the French Revolution arrived in Germany and Austria,
often accompanied by French Basset hounds (Nicholas and Foy 1987). Crossbreeding
between these dogs and the native Dachshund resulted in shortened ears and a more
pointed fcreface (Nicholas and Fay 1987).
Chapter 2: Population History of the Breeds - The Dachshund Page 34
Univers
ity of
Cap
e Tow
n
was
1 ).
1
were even Cl:Tnlrl.clln
1
are mn'c::tlv as ................ ., ....... , ...
).
1
Univers
ity of
Cap
e Tow
n
2.5.3. The Staffordshire Bull Terrier
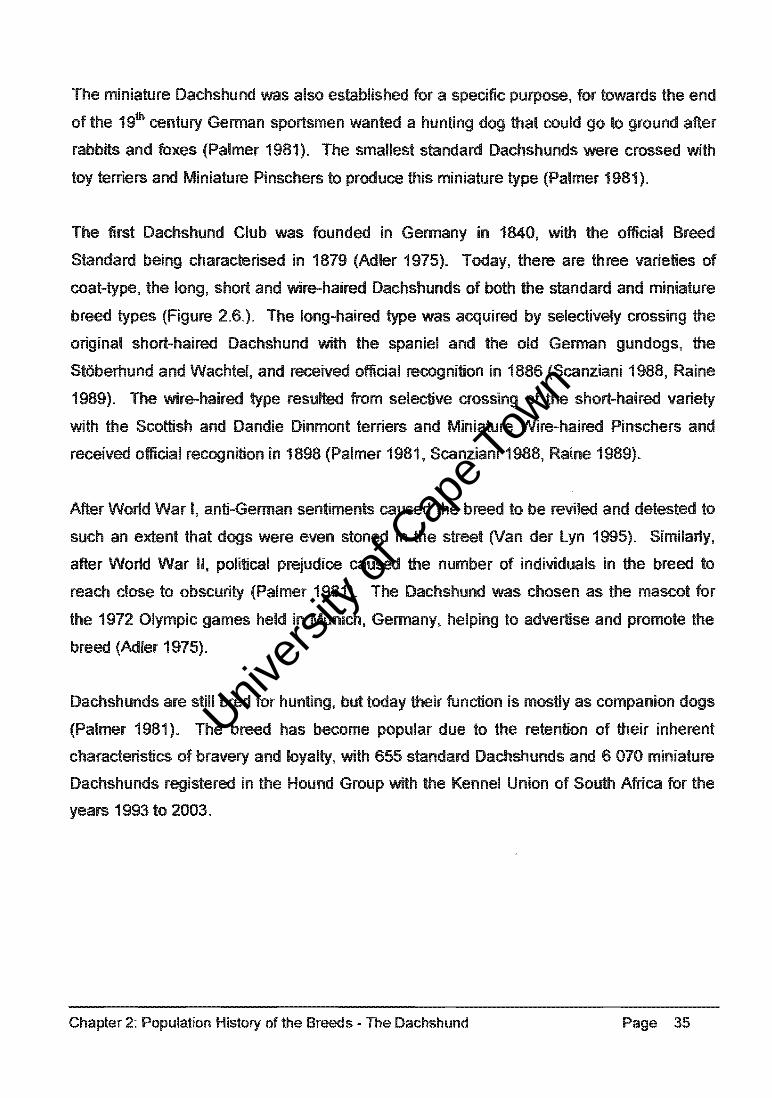
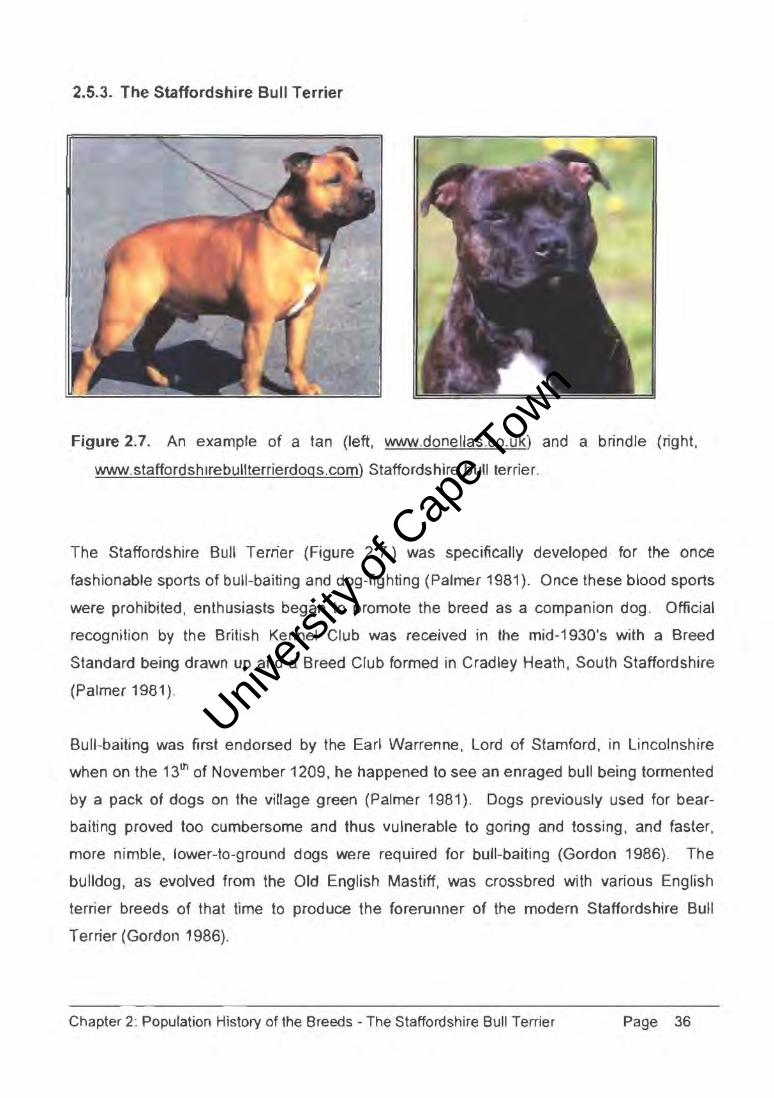
Figure 2.7. An example of a tan (left, www.donellas.co.uk) and a brindle (right,
www.staffordshlrebullterrierdoqs.com) Staffordshire bull terrier.
The Staffordshire Bull Terrier (Figure 2.7.) was specifically developed for the once
fashionable sports of bull-baiting and dog-fighting (Palmer 1981). Once these blood sports
were prohibited, enthusiasts began to promote the breed as a companion dog. Official
recognition by the British Kennel Club was received in the mid-1930's with a Breed
Standard being drawn up and a Breed Club formed in Cradley Heath, South Staffordshire
(Palmer 1981).
Bull-baiting was first endorsed by the Earl Warrenne, Lord of Stamford, in Lincolnshire
when on the 13th of November 1209, he happened to see an enraged bull being tormented
by a pack of dogs on the village green (Palmer 1981). Dogs previously used for bear
baiting proved too cumbersome and thus vulnerable to goring and tossing, and faster,
more nimble, lower-to-ground dogs were required for bull-baiting (Gordon 1986). The
bulldog, as evolved from the Old English Mastiff, was crossbred with various English
terrier breeds of that time to produce the forerunner of the modern Staffordshire Bull
Terrier (Gordon 1986).
Chapter 2: Population History of the Breeds - The Staffordshire Bull Terrier Page 36
Univers
ity of
Cap
e Tow
n
was 1
torl"IOr crosses were
were more
';:I'I,"rll"'I.n 1
it was in 1
was
scene
Univers
ity of
Cap
e Tow
n
more
were
were
owners.
1 were
a "''''''"'1',''''
Univers
ity of
Cap
e Tow
n
was ISOllat€!CI or UU\..-I."CiI1
were
were
or
were ~tnr.cot1
was adcled
rooess was
1
DelllelS were 1
on
a
was collected
1x
Univers
ity of
Cap
e Tow
n
were ~tnrQrI
were Dlalcea
room
K
was
II
was
was
were
1
were
Univers
ity of
Cap
e Tow
n
1 - 1.
were syrnnE3SI~)ea
a
III) was run on
were
Univers
ity of
Cap
e Tow
n
Univers
ity of
Cap
e Tow
n
some
1 1 17 - 1 13
2 1 - 1 11
3 1 - 1 11
4 1 11
5 - 113 15
6 1 - 1 9
7 1 - 1 11
8 10
9 113 - 11
10 1 - 1 11
11 16
12 1 11
13 1
14
15 17 5- 9
on
or
Univers
ity of
Cap
e Tow
n
a
= X
:::
::: X
::: X
was
were
Univers
ity of
Cap
e Tow
n
1
1
1
a
1x
1
1
1
1
Univers
ity of
Cap
e Tow
n
1 1x
1
1
on
were
were
1
1
1
III)
Univers
ity of
Cap
e Tow
n
were
reverse
were ad(jed
was ad(led
1
a vacuum TreeZl9-d
1
a
a

Univers
ity of
Cap
e Tow
n
were a
were
1 1x 1
1 1
were ac(lea
was
Univers
ity of
Cap
e Tow
n
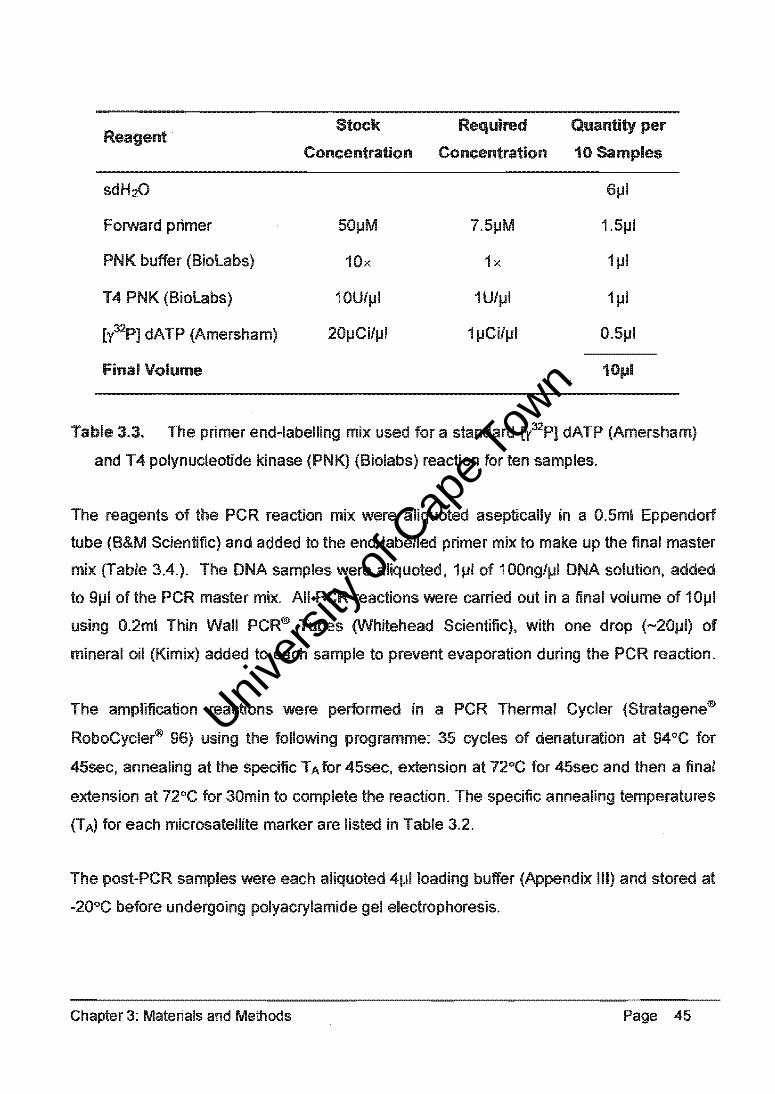
After aliquoting 1J-11 of PCR product, 10J-lI of formamide (Applied Biosystems) and 0.25J-11
internal size standard (Prism Genescan-500™ LlZTM) were added to each sample. AU
DNA samples were denatured at 95°C for 2min on a Gene Amp® PCR System 9700 (PE
Applied Biosystems) before being processed through the Genetic Analyser for 26min per
sample. Capillary electrophoresis was performed in a 36cm microcapiilary tube filled with
POP-4 Performance Optimising Polymer (Applied Biosystems).
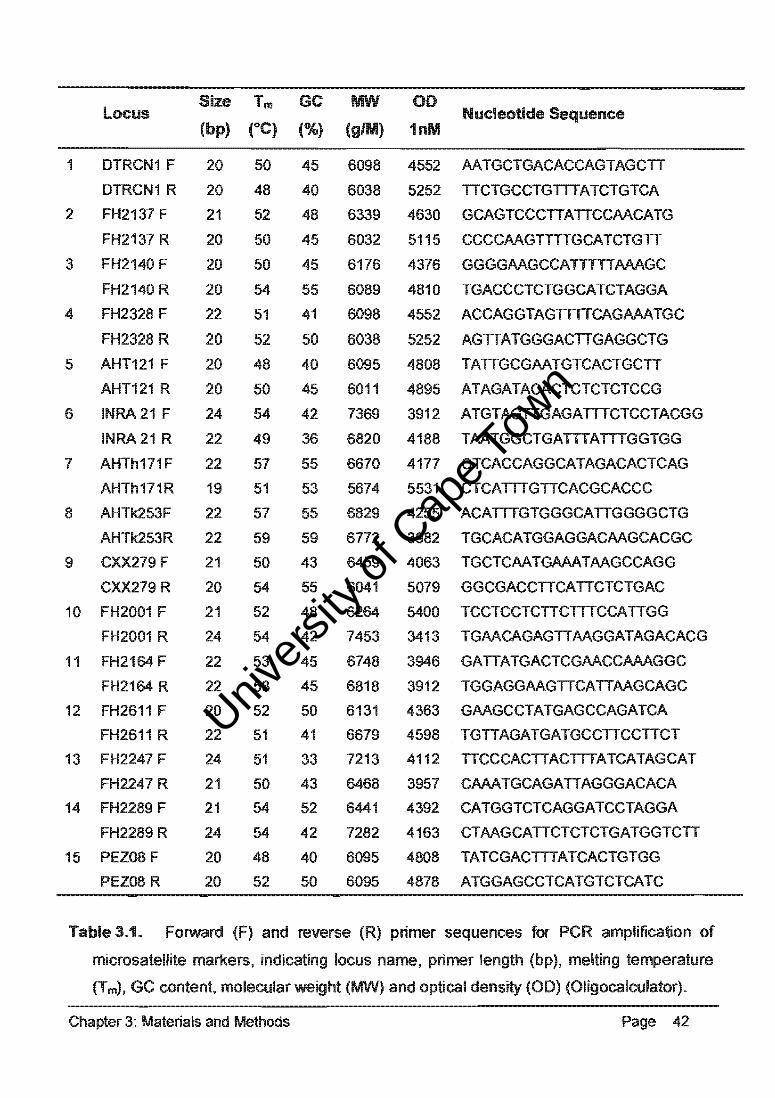
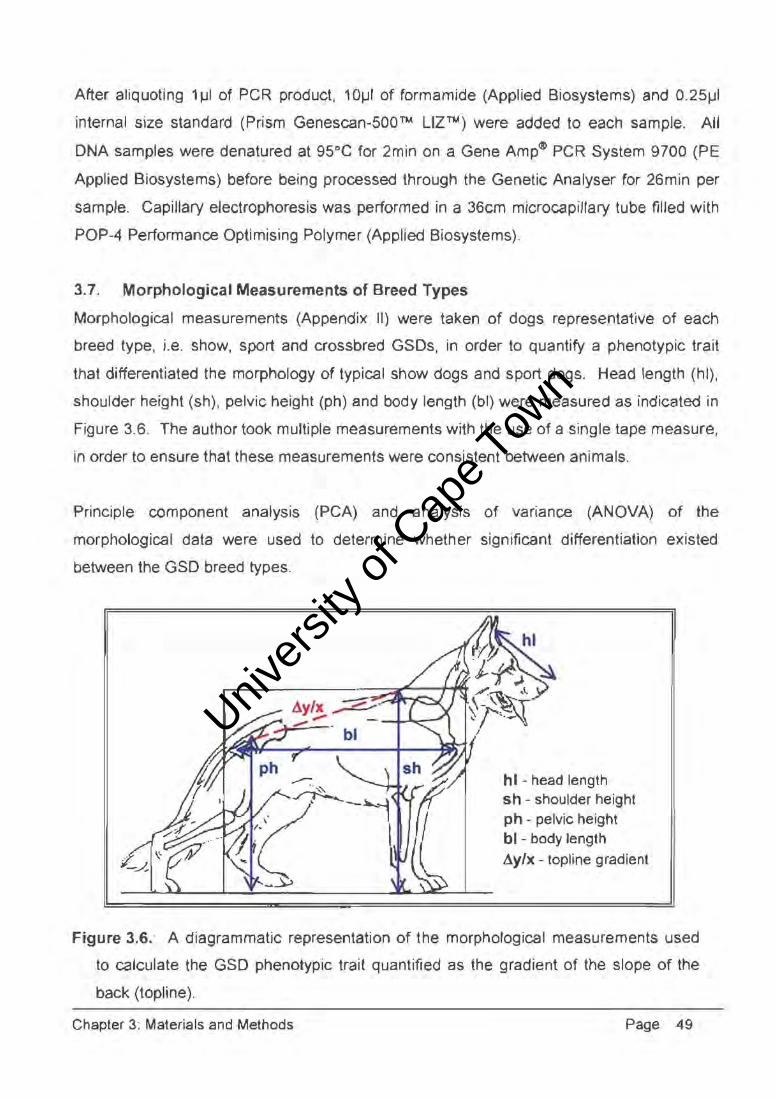
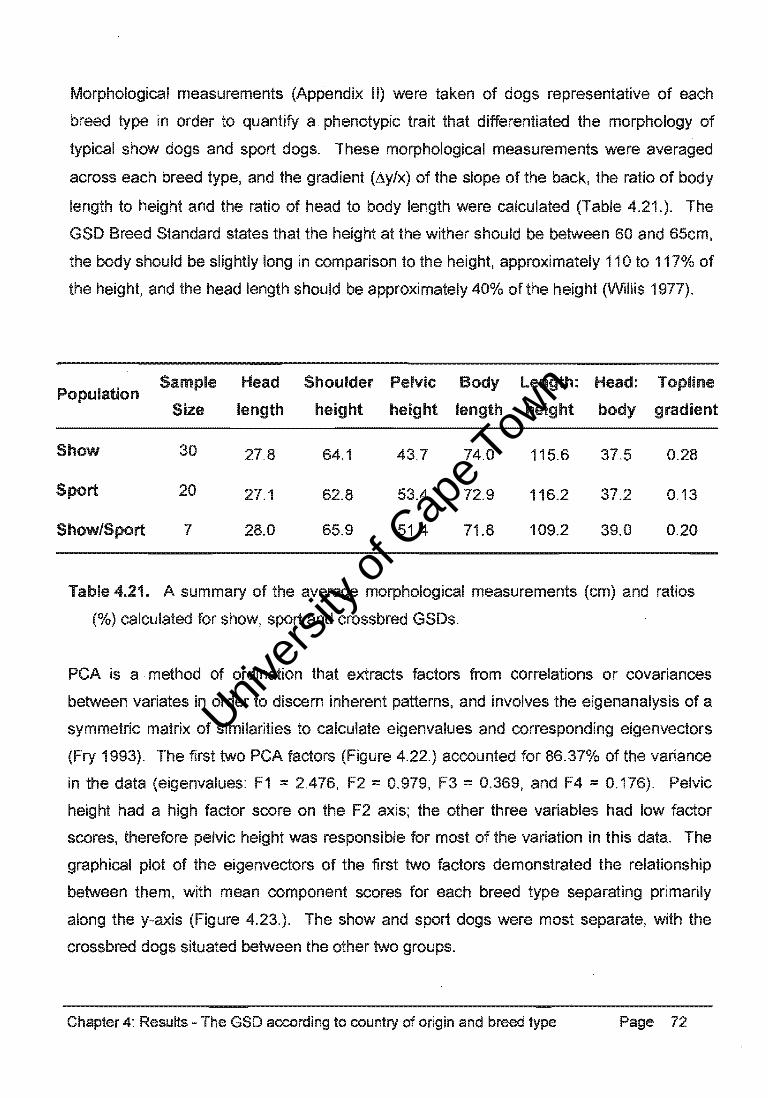
3.7. Morphological Measurements of Breed Types
Morphological measurements (Appendix II) were taken of dogs representative of each
breed type, i.e. show, sport and crossbred GSDs, in order to quantify a phenotypic trait
that differentiated the morphology of typical show dogs and sport dogs. Head length (hi),
shoulder height (sh), pelviC height (ph) and body length (bl) were measured as indicated in
Figure 3.6. The author took multiple measurements with the use of a single tape measure,
in order to ensure that these measurements were consistent between animals.
Principle component analysis (PCA) and analysis of variance (AN OVA) of the
morphological data were used to determine whether significant differentiation existed
between the GSD breed types.
hi - head length sh - shoulder height ph - pelvic height bl - body length !1ylx - topline gradient
Figure 3.6,' A diagrammatic representation of the morphological measurements used
to calculate the GSD phenotypic trait quantified as the gradient of the slope of the
back (topline).
Chapter 3: Materials and Methods Page 49
Univers
ity of
Cap
e Tow
n
were
were
), an
1
a We!D-I)a~;ea
1.).
310
an
, was
as as
were
1
were
was
Univers
ity of
Cap
e Tow
n
1.
was

Univers
ity of
Cap
e Tow
n
Chapter 4
Results
8.1. The OutbMl Dog K cotd lng 10 "'1I lon of origin
It 11*1 ~ 156 outbo"lMl dog. (08Ot). 46 lrom Cape Town. 42 from Port Eiabe\fl. 30 "-
JohIInr E!burg end ~ from prewn. (Appeodix I). _I _....- .... 15 ...... " ... »'0: Clr.". ITIICfONt<Olote m~.... Of _ ft .......... Icci, lour __ .... -. ......... , ...
[l'PJ dATP (Fit;luno ( 1)"'" 11.....n1l ~ (Fq.n. 2.) ltd daLl f1MIll,:I",
hIrIeroz~ NIIUfI 01 !he IocuI ...., _ ..... lor ..,;h ondMclJal III the popu11111C111
•
-• •• • •
•
--~ •• -+1" - - . .
• , - • • • 0 • 0 •
1IIIIIIlcWllilillli IIi II,
-"'s..- .'. _1 _ .I
• 7 ~ ... -C --
o • -,m ,. '"
FIv ....... l . PoIytoerylamlde ~ eIK!tOIlIIeroIIr • ..,. 01 ..,.,... fI!l'l..,IM ... oso. It f8dioecI .... I-?,"PJ d.l\TP-IebIDed MlCtout""'locI, OTRCNI (of<)"'" f H21l7 (BI.
visIJ.tOMd Il.II(n(IiogrepIllcJIIy .... 1eIes _. IilIMl . eno:::.ny tIy _...,.. ...... .....nIl 8
~ A,. T IIc;IdII fll . ...., ~ • ntgIlIMI Q)OIII'" (NC)
,.-

Univers
ity of
Cap
e Tow
n
A - AHT121, OB0122 (103,91) B -INRA21, OB0105 (94,90) C - AHTh171, OB0109 (134,124)
, i I I , . . ,
44A4 555~5 ~7BIIO 23
, , 4
, , , 5 • • ;, 4 ~ ~ 6 ~ ~ ~ 0 ,
8 9
. : : : : : · · · : : :
0- AHTk253, OB0121 (291,283) E - CXX279, OB0136 (123,115) F - FH2001, OB0135 (140,136)
• 5
G - FH2164, OB0002 (346,314) H - FH2611, OB0088 (217,197) 1- FH2247, OB0137 (219,191)
I I
• • • • ; ~ 4
, • 4 • • - • , I , ,
4 ,
J - FH2289. OBOl17 (299,287) K - PEZ08, OBooOl (235,219)
Figure 4.2. Electropherograms representing fluorescent-labelled microsatellite alleles
(shaded peaks) in some representative OBDs, sized from left to right according to an
internal size standard (STRand). Microsatellite marker name, individual sample
number. and allele sizes (bp) are indicated.
Chapter 4: Results - The Outbred Dog according to region of origin Page 53
Univers
ity of
Cap
e Tow
n
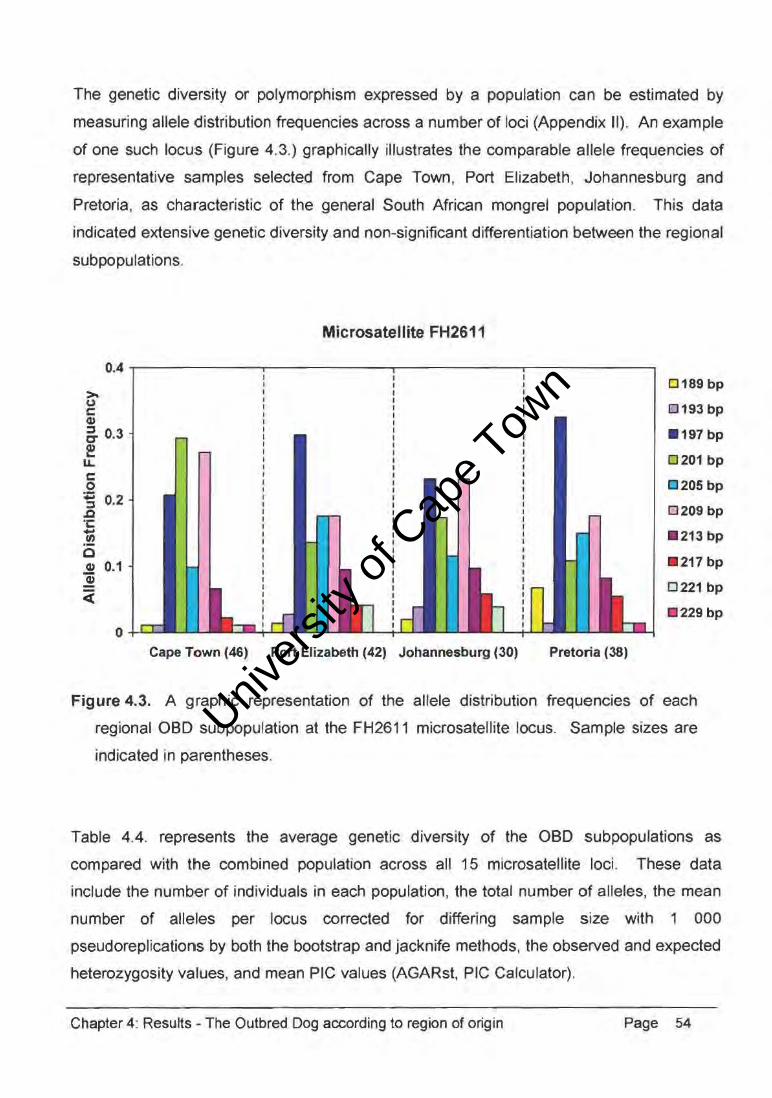
The genetic diversity or polymorphism expressed by a population can be estimated by
measuring allele distribution freeuencies across a number of loci (Appendix II). An example
of one such locus (Figure 4.3.) graphically illustrates the comparable allele frequencies of
representative samples selected from Cape Town, Port Elizabeth, Johannesburg and
Pretoria, as characteristic of the general South African mongrel population. This data
indicated extensive genetic diversity and non-significant differentiation between the regional
sub populations.
Microsatellite FH2611
0.4 .-------~-----.------_-----___,
~ " " g. 0.3 I!! u.
is :s 0.2 ~ ·c ~ o .S! 0.1 .S! ;;:
o Cape Town (46) Port Elizabeth (42) Johannesburg (30) Pretoria (38)
0189 bp
0193 bp
_ 197 bp
0201 bp
El 205 bp
0209 bp
_ 213 bp
_ 217 bp
0221 bp
_ 229 bp
Figure 4.3. A graphic representation of the allele distribution frequencies of each
regional OBD subpopulation at the FH2611 microsatellite locus. Sample sizes are
indicated in parentheses.
Table 4.4. represents the average genetic diversity of the OBD subpopulations as
compared with the combined population across all 15 microsatellite loci. These data
include the number of individuals in each population, the total number of alleles, the mean
number of alleles per locus corrected for differing sample size with 1 000
pseudoreplications by both the bootstrap and jacknife methods, the observed and expected
heterozygosity values, and mean PIC values (AGARst, PIC Calculator).
Chapter 4: ResuHs - The Outbred Dog according to region of origin Page 54

Univers
ity of
Cap
e Tow
n
were
1
1
1
1
1
1
was
was testee
excess was
no
18
9
1
as
excess
Univers
ity of
Cap
e Tow
n
was no
is mean a
9
191
Univers
ity of
Cap
e Tow
n&
were measure
=
across
o
o
o
o
o
are
a
was non-
=
Univers
ity of
Cap
e Tow
n
o
mean
across 15
~s
~s
8
m
Univers
ity of
Cap
e Tow
n
was
1 is a
a
1 1
1
x1
1 1
1.11x1
1.1
1
own source
own source ..,VI-IUICI
1
1
Univers
ity of
Cap
e Tow
n
A
c: 0 ·z IU
::::J a. 0 a. '-41
,£;
0 "C 0 0 ~
Qi ~
:::i CI 0
...J . 0
C
c: 0
:.::; IU
::::l a. 0 c. ... eI)
,£; -0 --0 0 0 ~
"i" Jit. :J CI 0 -t
0
Cape Town OBOs B Port Elizabeth OBOs
;V c: e 8 0
o '" ·z Q 0/ "0 2° . ./ .!!! 1- 0
I'~V ::::J ~ !l'u j a. oo~ 0 og c. ocO' co"
n , ... B~ "PQ ~7Q I» ,£; ... 0 /
././ --0 Q/ /' 0 Cape Town / 0
/ /" Port Elizabeth ~ Qi ~
./ Johannesburg :J Johannesburg /
Pretoria ~ Pretoria /' ~ ./
-Log Likelihood own population 0 -Log Likelihood own population
Johannesburg OBDs 0 Pretoria OBDs
a c: 0 0
:.::; ll o oB .!!!
::::J c. 0
o t o /' C. u 0 ... Q
Q,) 0 .r:. Q ...
II 1/ 0 "0
,~ CapeTown 0
",/ Cape Town 0
/' Port Elizabeth ,£;
Port Elizabeth
/ OJ
/ .lI:: Johannesburg :J
CI Pretoria 0
...J . -Log Likelihood own population 0 -Log Likelihood own population
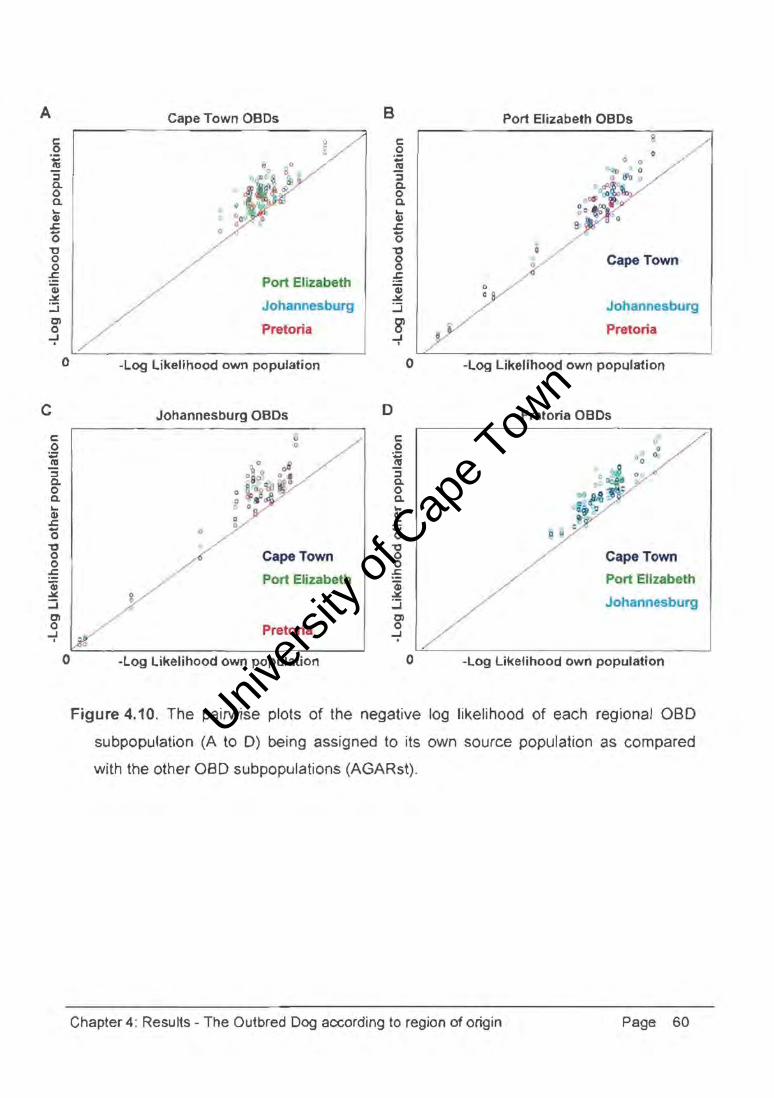
Figure 4.10. The pairwise plots of the negative log likelihood of each regional OBD
subpopulation (A to D) being assigned to its own source population as compared
with the other OBD subpopulations (AGARst) .
Chapter 4: Results - The Outbred Dog according to region of origin Page 60
./
Univers
ity of
Cap
e Tow
n
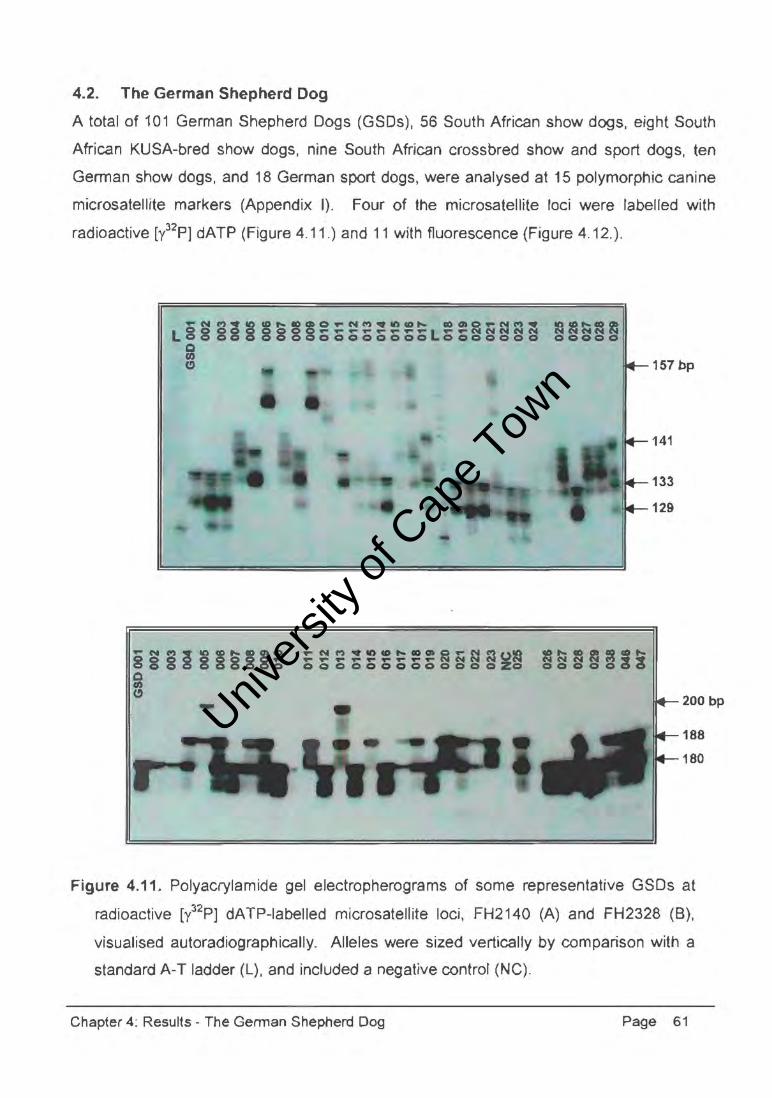
4.2. The German Shepherd Dog
A total of 101 German Shepherd Dogs (GSDs), 56 South African show dogs, eight South
African KUSA-bred show dogs, nine South African crossbred show and sport dogs, ten
German show dogs, and 18 German sport dogs, were analysed at 15 polymorphic canine
microsatellite markers (Appendix I). Four of the microsatellite loci were labelled with
radioactive [l2p] dATP (Figure 4.11.) and 11 with fluorescence (Figure 4.12.).
tEUU~~ ~ 00000
157 bp
141
133
129
200 bp
188
180
Figure 4.11. Polyacrylamide gel electropherograms of some representative GSDs at
radioactive [l2p] dATP-labelied microsatellite loci, FH2140 (A) and FH2328 (8),
visualised autoradiographically. Alleles were sized vertically by comparison with a
standard A-T ladder (L), and included a negative control (NC).
Chapter 4: Results - The German Shepherd Dog Page 61
Univers
ity of
Cap
e Tow
n
5 1
A - AHT121, GSD001 (101,93) B - INRA21 GSD025 (94/86) c - AHTh171, GSD034 (138,130)
I I , , I .. .. 4 5 " 05 .. .. -4 ... ... .; ~ ... G
,. eo .. '"
.. : a '? 0 :1 ~ .. 6 6 e · : : , · ·
: : , . .
0- AHTk253, GSDO.28 (287,.287) E - CXX279, GSD049 (115,115) F - FH2001, GSD092 (128,128)
I I . 4 4 .. ~
~ .4 7 ~ Q 5
, 9
: I
: : : :
.
G - FH2164, GSD073 (326,314) H - FH2611, GSD087 (209,185) 1- FH2247, GSD011 (207,207)
.. .4 4 .. ..; ..- 4 .. '? 1 '3 4
'" 7 e " . .
,
:
:
J - FH2289, GSD088 (295,287) K - PEZ08, GSD002 (223,223)
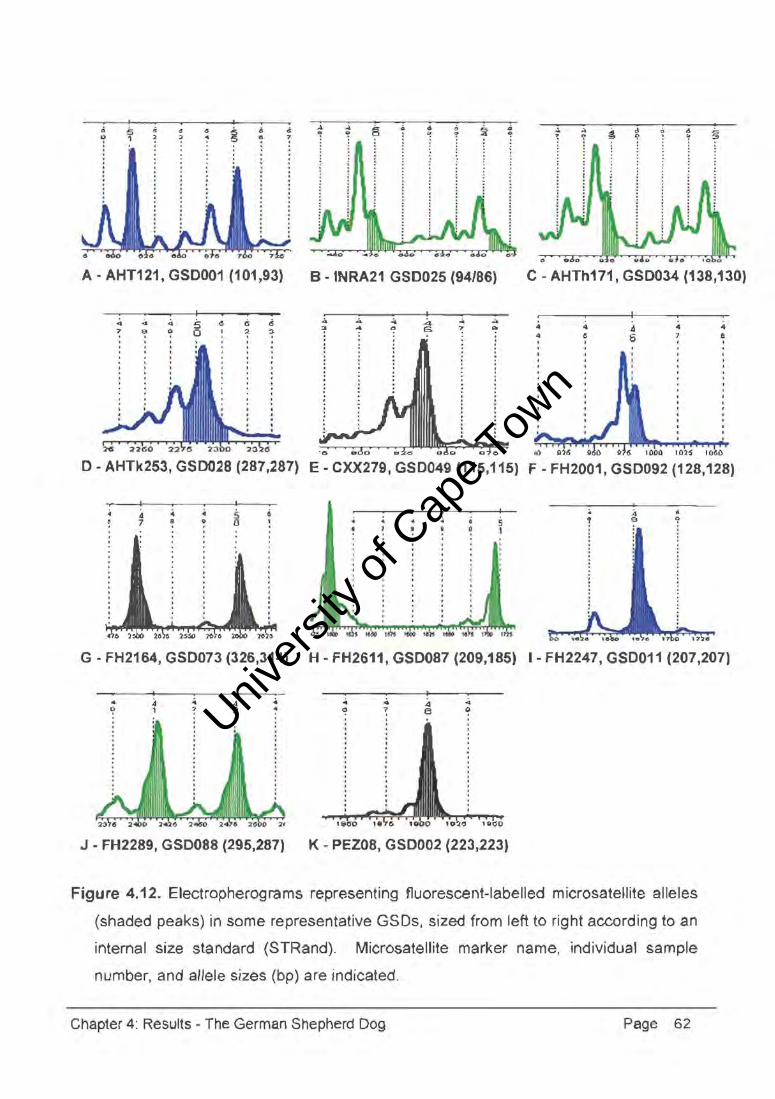
Figure 4.12. Electropherograms representing fluorescent-labelled microsatellite alleles
(shaded peaks) in some representative GSDs, sized from left to right according to an
internal size standard (STRand). Microsatellite marker name, individual sample
number, and allele sizes (bp) are indicated.
Chapter 4: Results - The German Shepherd Dog Page 62
Univers
ity of
Cap
e Tow
n
1. AClcor'(J
were
were
a can
common
was
was
as
mean
Univers
ity of
Cap
e Tow
n
A
0.8 >-0 c: 0.7 Q) ::J D" 0.6 41 ....
LL. c: 0.5 0 .. 0.4 :::J .D -c: 0.3 ..... III
0 0.2 Q)
Q)
« 0.1
0
B
0.8
~ 0.7 c: CI)
5- 0.6
e LL. 0.5 c: 0 ;:; OA :::J
.D 1:: 0.3 -III £)
~ 0.2
~ 0.1 ;;: 0
Microsatellite AHT121
SA Show (56) SA KUSA (8) SA Shw/Sprt German Show German Sport OBO (156) (9) (10) (18)
Microsatellite AHTh171
I I I I
I I I I I I I I t I I I I I· I
II LI « .' I
SA Show (56) SA KUSA (8) SA Shw/Sprt (9)
-
German Show (10)
I I I I I (
( (
I \
• German
Sport (18)
I
I I ... l ~ aBO (156)
. 79bp
C85 bp
.87 bp
091 bp
. 93bp
095 bp
. 97bp
099bp
. 101 bp
0103 bp
. 105 bp
0107 bp
111 bp
. 113 bp
. 122 bp
0124 bp
.126 bp
0128 bp
. 130 bp
0132 bp
. 134 bp
0136 bp
. 138 bp
0140 bp
. 142 bp
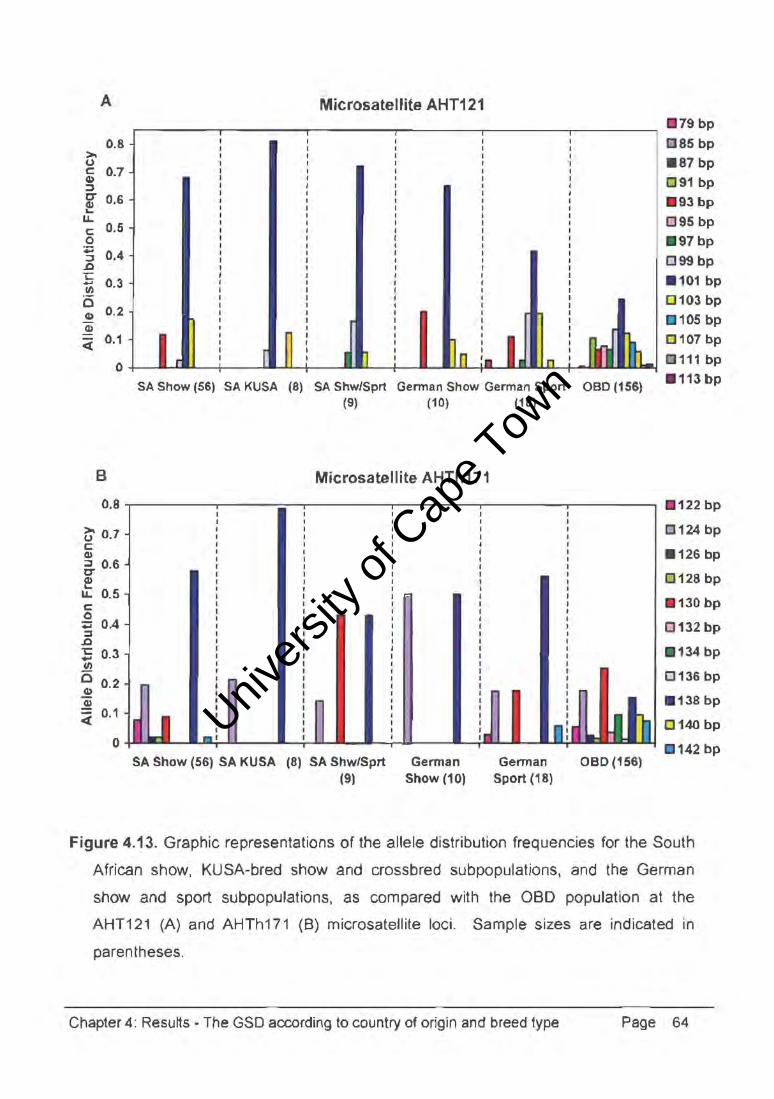
Figure 4.13. Graphic representations of the allele distribution frequencies for the South
African show, KUSA-bred show and crossbred subpopulations, and the German
show and sport subpopulations, as compared with the OBO population at the
AHT121 (A) and AHTh171 (B) microsatellite loci. Sample sizes are indicated in
parentheses.
Chapter 4: Results - The GSD according to country of origin and breed type Page 64
Univers
ity of
Cap
e Tow
n
8
9
10
18
1 1
in
were more
was
no
11 1
1
Univers
ity of
Cap
e Tow
n
1
excess over a
was
p
9
o

Univers
ity of
Cap
e Tow
n&
=
o
o
1
o
o
are
= 1
was non-
=
Univers
ity of
Cap
e Tow
n
17.
15
1 across 15
< 1)
was non-
1
1
110

Univers
ity of
Cap
e Tow
n
1
1
1
own source
a
1
4

Univers
ity of
Cap
e Tow
n
1.1 1
1
own source ..... Vlo' ..... ' ...
1.1 1
1 1
1 1
1
1
a
E
1
a
was
Univers
ity of
Cap
e Tow
n
A
c o
:J c.. o c.. .... G) ..c -o "C o o ..c Gi ~ -.J
c c o ~ :::::I co c.. .... CII
..c -o "C o o ..c Gi ~
-.J C) o
-.J •
E
c o ... 11:1 :::s c.. o c.. 'CI) ..c -o "C o o E Gi ~
:.J CI o -t
o
o
o
Combined Gennan Shepherd Dog Population
o
;em;1..I.."ft IP "
u
/ / -
,/,,-
0)/
//
.. / 080s
-Log Likelihood own population
South African Show Subpopulation
;/ ./ 0.'/ ·'
/
'" uo
~ 0-0:-, ,
/ German Show
-Log Likelihood own population
German Show Subpopulatlon
/ ~ \'
o 0
German Sport
-Log Likelihood own population
B
c .Q iii :::::I c.. o c.. .... G) ..c -o "C o o ..c Gi ~
:.J C) o
-.J I
D
c o ... 11:1
:::::I co c.. .... CI)
..c -o "C o o ..c CI) ~
:.J CI o -t
F
o
o o
Combined Outbred Dog Population
o o 0
o a
° rf'
00 0 CI
,:~OO 00
o 00
o o 0 ~o ,01 rf 0
00
o t9
o
GSDs
-Log Likelihood own population
German Show Subpopulation
00
South African Show
-Log Likelihood own population
German Sport Subpopulation
-Log Likelihood own population
Figure 4.20. The pairwise plots of the negative log likelihood of the GSD population (A and B)
being assigned to its own source population as compared with the aBD population, the
South African show subpopulation (C and D) compared with German show dogs, and the
German show sub population (E and F) compared with German sport dogs (AGARst).
Chapter 4: Results - The GSD according to country of origin and breed type Page 71
Univers
ity of
Cap
e Tow
n
II) were
across
1
1
7
1'''' .... 01''''' .. score on
11 6
11
1
were
or
1
13
o
a
Univers
ity of
Cap
e Tow
n
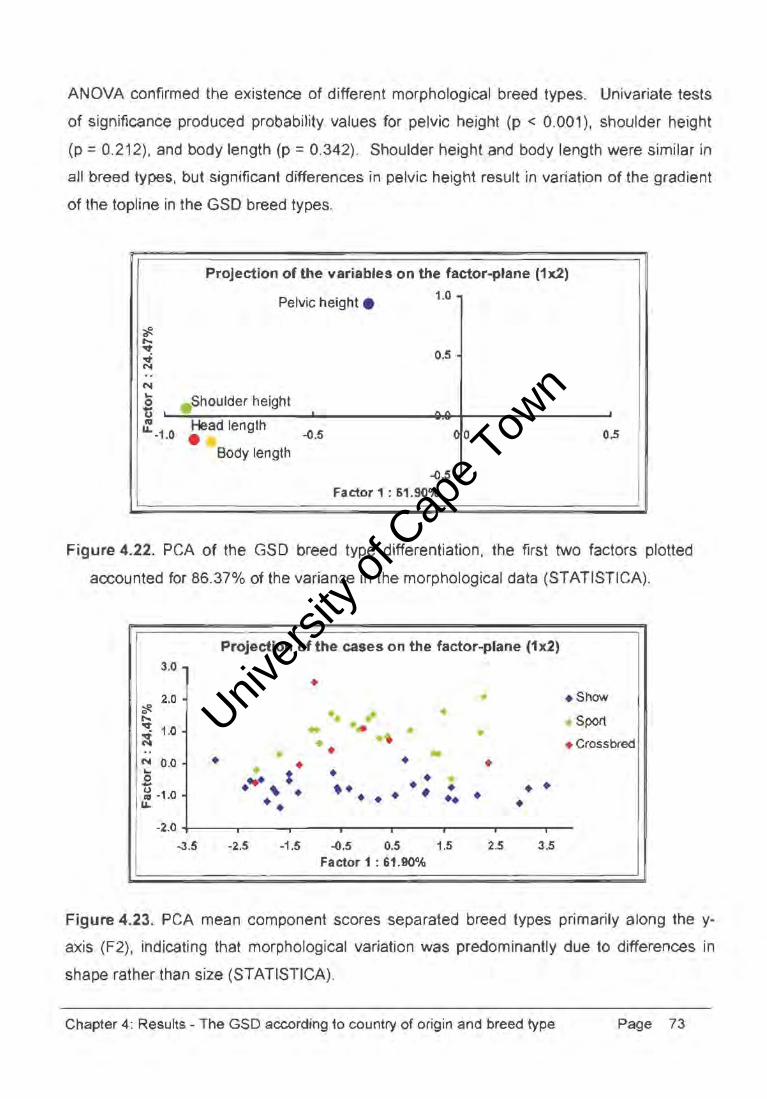
ANOVA confirmed the existence of different morphological breed types. Univariate tests
of significance produced probability values for pelvic height (p < 0.001), shoulder height
(p = 0.212), and body length (p = 0.342). Shoulder height and body length were similar in
all breed types, but significant differences in pelvic height result in variation of the gradient
of the topline in the GSD breed types.
Projection of the variables on the factor-plane (1x2)
Pelvic height . 1.0
~ :>ShOUlder height
:. Head length -1.0 • -<l.5
Body length
0.5 .
,.. ..
-<l.5
Factor 1 : 61.90%
00 0.5
Figure 4.22. PCA of the GSD breed type differentiation, the first two factors plotted
accounted for 86.37% of the varian:e in the morphological data (STATISTICA).
3.0
2.0
N 0.0 ... .2 ~ -1.0
u..
•
Projection of the cases on the factor-plane (1x2)
• • ... : . ~ . ••
• •• .. •
• • • ••
•• •
• • •
• •
• • .. • • .; • • • • • • •
• Show
Sport
• Crossbred
-2.0 +--___ .-----r,---.r-----r-----r----r---r----3.5 -2.5 -1.5 -<l.S 0.5 1.5 2.5 3.5
Factor 1 : 61.90%
Figure 4.23. PCA mean component scores separated breed types primarily along the y
axis (F2), indicating that morphological variation was predominantly due to differences in
shape rather than size (STATISTICA).
Chapter 4: Results - The GSD according 10 country of origin and breed type Page 73
Univers
ity of
Cap
e Tow
n
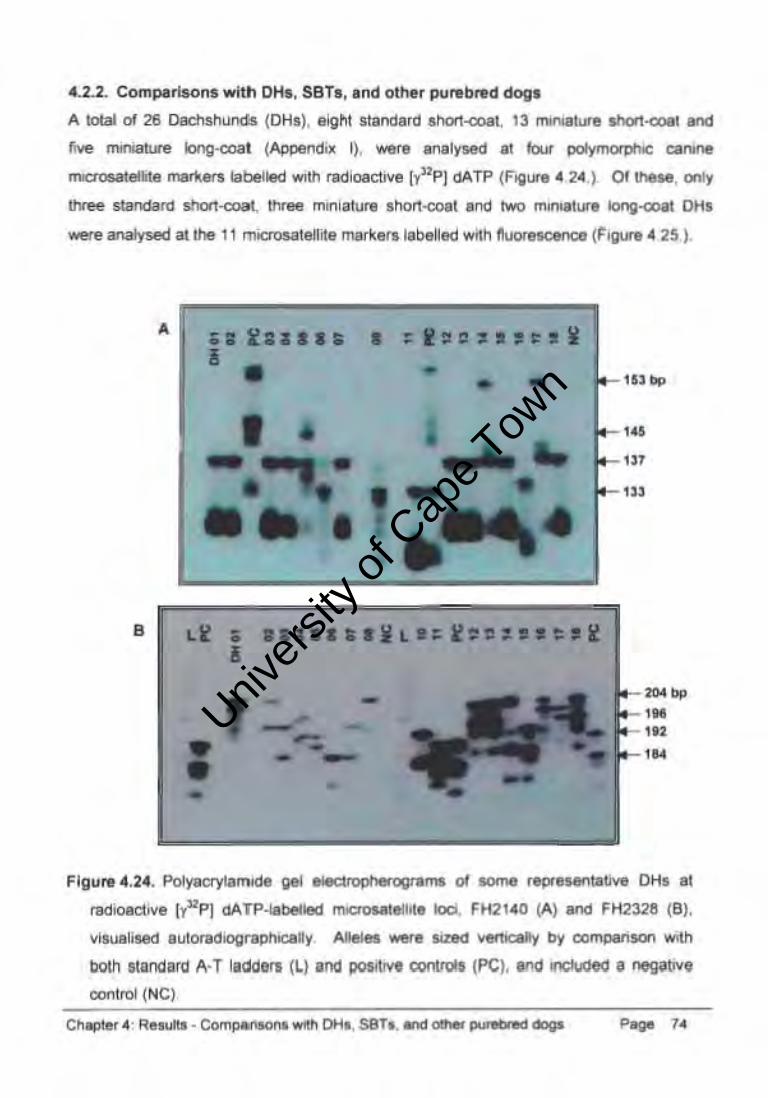
4.2..2. Com""rb<> ... with D~, SBTs.lnd oU-r pu .. .,..d dogs
A _ of 26 Dad1s/IUnds (OHS). ligPII Sl8nda,d a.hort-. 13 _lin 1IIart<:Ooll ItId
five _ Iong-coat (Al>!>endilc I). ....... ."Iysed ., W ""'.fI\OI ~ aonine
" ........ reIite merI<ets I8PJe1Ied WIt/I t8CIioactIV8 (y"P) <!ATP (Fig ..... 2' ) or _ . only
three sIMIdII«I sI!crI-Q>!OI. _ """I.,U ... hort-<:Oat and two ............ 1onII_ 00,
w.e anal.,., Ed. the 1 t mooC>S.lI ... ite rTIIWkert 18~.eG WIt/I ~ (1'i9<n • 25 ).
A .' 2 ...... ~ •••••••••
B &.1 ......... LII:I •••••••• I
Flgu,,4.24. ~)'Kt)'IIImide ~ " . hO!l" .. og._ 01 _ , ....... ,Iot ..... 0liI 81
ntdioec:t .... (y"PI <!ATP .. beIIed ......... leIbIe b:i. Fta140 t-') ItId FH2128 (8).
"""-liled .",OfadoogratlraI1 M,'. __ tI.aId ~M' ' i by oomp.-;"", IMth
bOth IUIOIiIfll A·T iIIIOert (Lllna potjtJW Will .... (PC). In<! ~. ~
"""lrOI (NC)
Univers
ity of
Cap
e Tow
n
J I
~ .:. .:. oS .:. <i ~ ~ 4 .. '\'
A - AHT121, DH01 (113,93) B -INRA21, DH02 (94,94) C - AHTh171 DH06 (124,124)
, , , I , , , 4 4 .. 4 ~ oS 5 0 7 9 0 2 ,
, I .. .:. a .. s 0> .. ? , A .; 4 S 7 9 ,
:
0- AHTk253, DH03 (285,285) E -CXX279, DH08 (123,115) F - FH2001, DH05 (14n,12S)
4 .. ,; 5 8 " ~ 1
G - FH2164. DH01 1314.314\ H - FH2611, DH07 (209,197) 1- FH2247, DH04 (219,191)
, , I .- .- 4 .. .. 6 6 ?
.; ,;, ~
.; .; ~ ..
~
: ; :
:
J - FH2289, DH02 (307,307) K - PEZOS, DH07 (239,239)
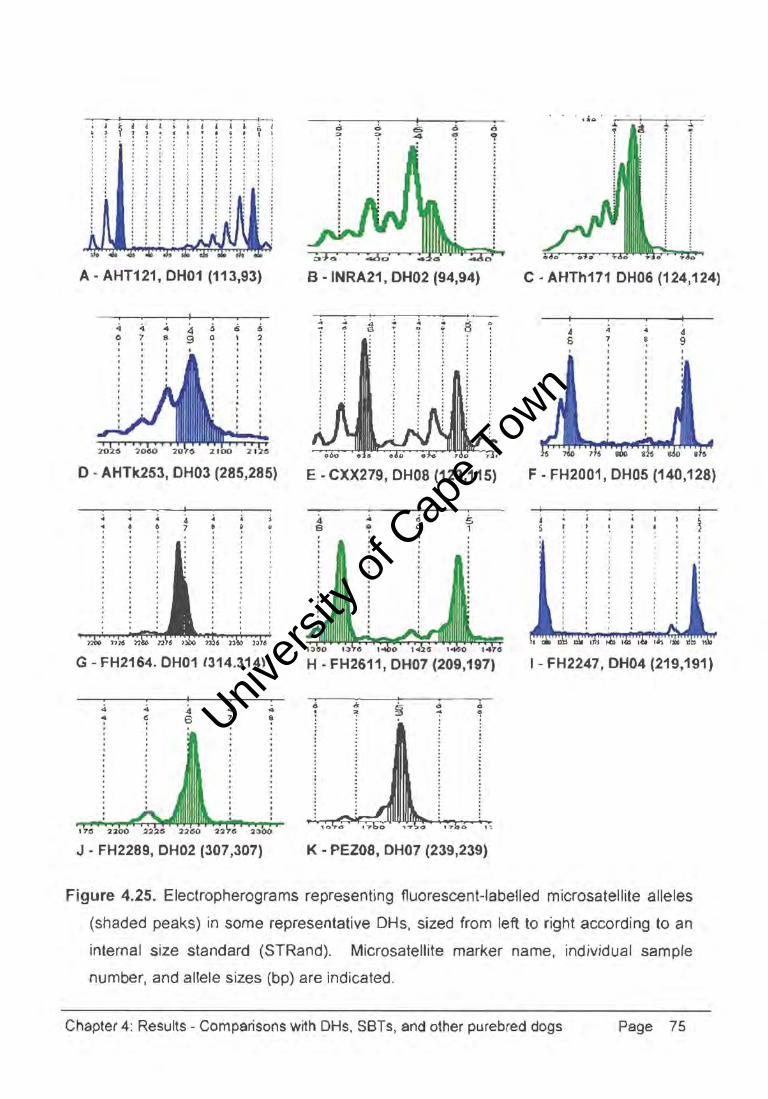
Figure 4.25. Electropherograms representing fluorescent-labelled microsateliite alleles
(shaded peaks) in some representative DHs, sized from left to right according to an
intemal size standard (STRand). Microsatellite marker name, individual sample
number, and allele sizes (bp) are indicated.
Chapter 4: Results - Comparisons with DHs. SBTs, and other purebred dogs Page 75
Univers
ity of
Cap
e Tow
n
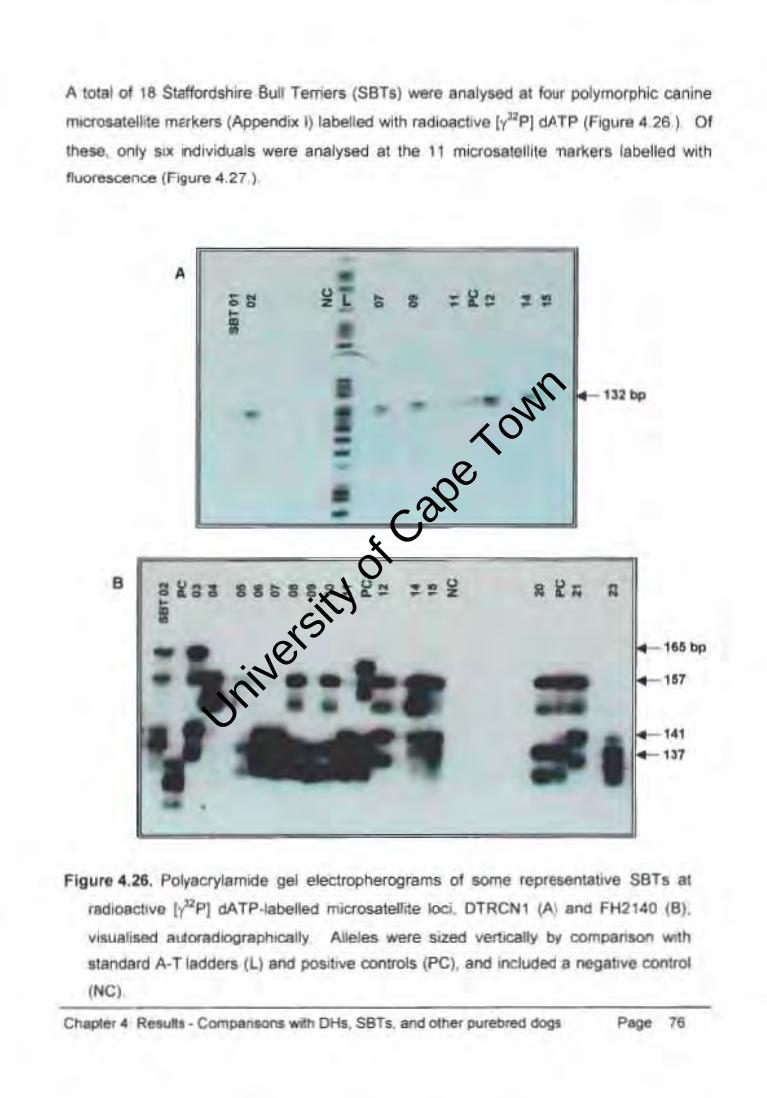
A IOIaI of 1& SlaIionIoIwe Ek.t Temer. (S8Ts) -a .... i';M<I., b.- po/ymofpMic: conine
iFOC....t .. 1ite mttI<ers (Ap,'E'''<I'' I) 1._ "'lh ra<'iov. ..... IT"'P) dATI' (Figu'. ~ 261 or tt.M. orty "" nd~l. _ e 8ne/yMd .t the " rniCfoulflflite "."'8<1 ~~ted "'lh 1Iuor~ (Fig"", ~ 27) .
• • " Or i • --• - • --
• -•
•
•
• .,. • •
• •
." 0 • •
.. • _ 1:12""
. " •
Flg u" • . 21. ~,acryt • ....o. gel ~"""s of ..,.". ,._twe SBTI ..
'-"ioK\IYe (,,"'1'] dA TP II: ;', 1 ,""",,",,!elite loci. OTRCN I (A) .,.., FH21'0 (81.
vSud_ eLioradlogt...-ty .aWn -.. sa...a ¥E'fIICIII\I III' """'_ WIth
.-.:I 11-1 '-""-'I (ll ...-.d ~ _'bob (PC). em ..... _ e~ ..... _",01
"'" CIitrPtr . ~·CcIrn".. .. _Otto. SBl-. __ "", .. ,,,",,*,,," _ n
Univers
ity of
Cap
e Tow
n
, , , I
t§ g c- o ~ ~ 6 '? ! ~
:
. .
A ~ AHT121, SBT01 (97,91) B ~ INRA21, SBT03 (92,90) C ~ AHTh171 SBT04 (140,126)
I , I . , , , • , , ... -1 5 .5 6 5 6 e I) 0 3 4
.<I 4 .; .4 5 6 1 S 9 0 , , ,
0- AHTk253, SBTOS (287,287) E - CXX279, SBT02 (117,117) F ~ FH2001, SBT02 (140,128)
, ci 5 ci • • '"
1 ~ 3 9 4 5
: '460
G ~ FH2164. SBT04 t306.274l H - FH2611, SBTOS (209,209) I ~ FH2247. SBT06 (207.1831
, ;, 4 ~ ,s ~ 7 .. g
: : :
:
: : :
J ~ FH2289, SBT05 (311,311)
J, I
4 5 9 0
K - PEZ08, SBT01 (231,227)
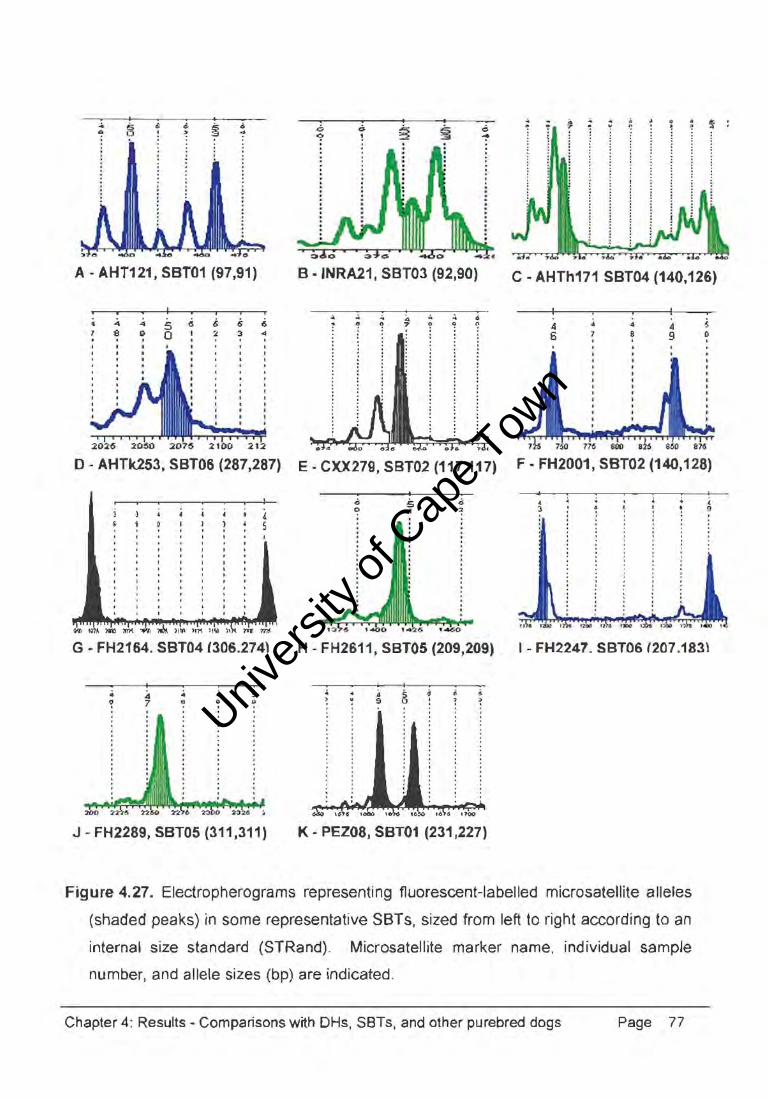
Figure 4.27. Electropherograms representing fluorescent-labelled microsatellite alleles
(shaded peaks) in some representative SBTs, sized from left to right according to an
internal size standard (STRand)_ Microsatellite marker name, individual sample
number, and allele sizes (bp) are indicated.
Chapter 4: Results ~ Comparisons with DHs, SBTs, and other purebred dogs Page 77
Univers
ity of
Cap
e Tow
n
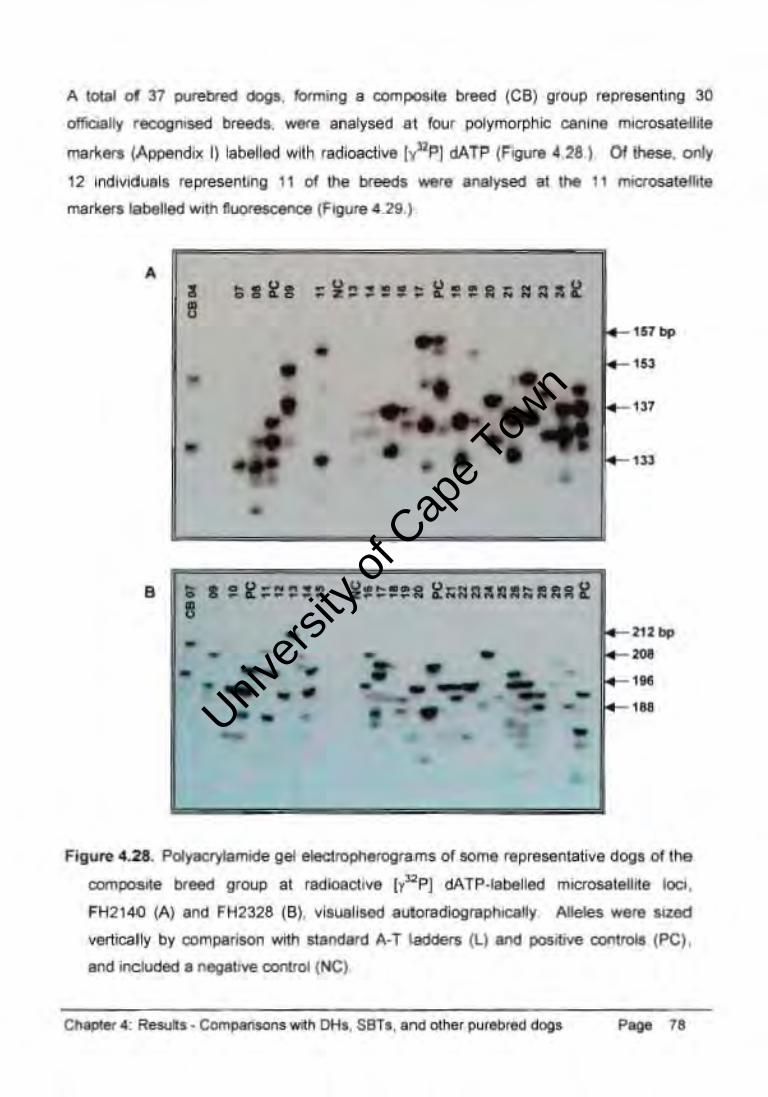
A IOIaI of 31 cn1!bed dogI. I<>rInIrIg • compoOl.lCl breed (C8) g'ou~ rePAl-,bng 30
oIrIaIIly recogtliaed breed.. __ analysed 11 lout POIymorp/l;c CMI.,. fTIOO'OS3\<l-liile
""'~ .. (Appendilc I) IoobliJed with ,~ [Y»PI dATI' (FI\IU"I ~ 2&.) Of~. ad,
'2 indMduels re»w.nllng 11 oIlhe breeds __ anIIIysed 11 !hi " " ...... te-liut
ma~ .... let 1 .. :1 with l10.00< 7' :1I1Ce (figure 1.211.)
•
• o • • •
•
o o
• o _ ... -- .• • • -• • oW- •
~-- ,N
• • •
Figure 1..21. PoIy .... !II1EIi(\e gel ~ms 01_ rePAlsen",,"'" dogs oIllie
comllO'_ tlreed group 11 flldioedi ... [?'Pj dATp· .. ,*1ed mocrosalelile loci .
f H2'.w (A) Irld FH2328 (8). vfluellsed ~pI\o(:IIIy ,n :'a ...... IIUd
vertically by coml*ison with ltIo_d A·T I.OW. (l) _ pcart;...e c:ronIOOlI (PC) •
.,.., included 1 tIeplrY8 a>nI/'Ol (NC)
a...-- I ; _ .. . ~ iKt. PH., S8T" Irld _1"'_ q '
Univers
ity of
Cap
e Tow
n
5 3
A - AHT121, CB12 (97,97)
t I i
4455 665 ,,"°01 2 :)4
D - AHTk253, CB10 (289,287)
~ 4 ~ ~
? 5 ~ 7
:
G - FH2164, CB09 (306,306)
, I I , 4 4 4 4
3 4 5 0 .
J - FH2289. CB04 (303.299)
B -INRA21, CB03 (96,90)
.. .. .:. A ~ 5 ~ .. ~ 6 ~ 0
E - CXX279, CB02 (123,115)
, I J .. 5 5 ~
" 0 1 2
H - FH2611, CB01 (209,205)
I
4 4
5 s . 5 3
1500 1575 I~ 151\ It;OO I~ I~ l~l~ 17\11 17
K - PEZ08, CB06 (239,215)
C - AHTh171, CB07 (124,124)
F - FH2001, CB11 (144,144)
.4 4 6 9
I - FH2247, CB08 (207,195)
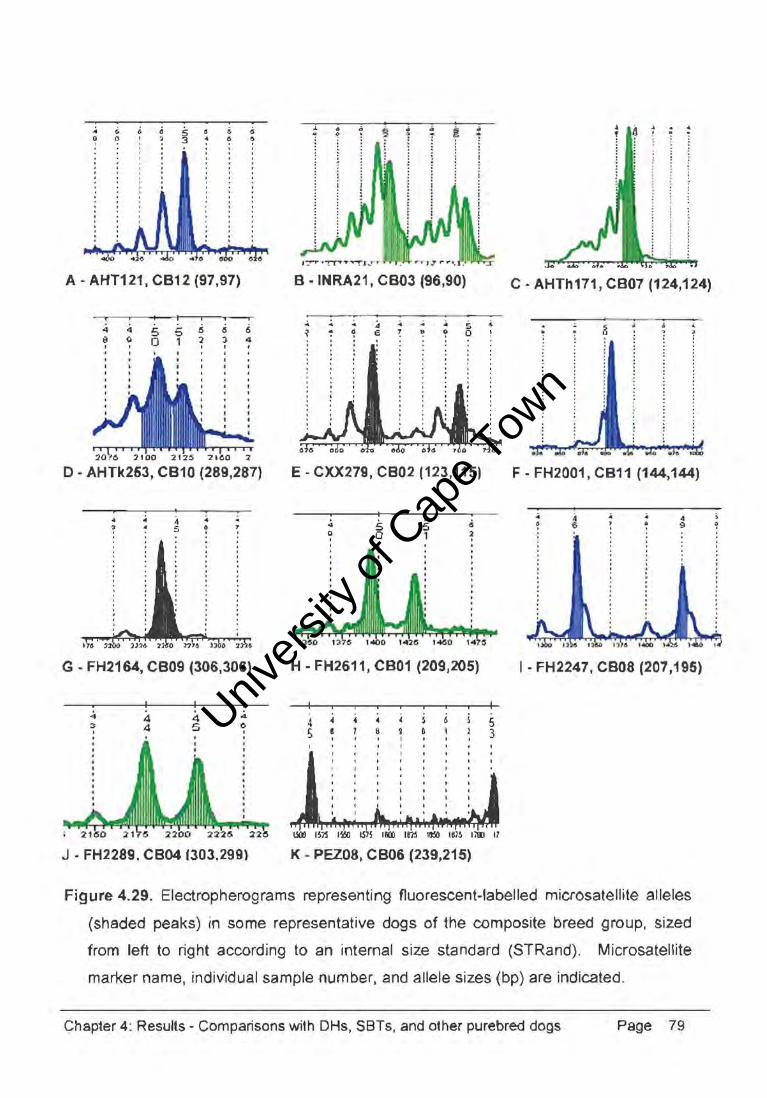
Figure 4.29. Electropherograms representing fluorescent-labelled microsatellite alleles
(shaded peaks) in some representative dogs of the composite breed group, sized
from lett to right according to an internal size standard (STRand). Microsatellite
marker name, individual sample number, and allele sizes (bp) are indicated.
Chapter 4: Results - Comparisons with DHs, SBTs, and other purebred dogs Page 79

Univers
ity of
Cap
e Tow
n
The genetic diversity or polymorphism expressed by a population can be estimated by
measuring allele frequency and distribution across a number of loci (Appendix II). An
example of one such a locus (Figure 4.30.) graphically illustrated the allele distribution
frequencies of GSDs relative to DHs, SBTs, and the CB group, as compared with the OBD
population. At the FH2328 microsatelJite locus, the GSD population had two common
alleles (180bp and 188bp) with frequencies of 46.05 and 50.50, and the DH population
expressed a private allele (184bp). Whereas the allele size range was similar for the DH,
SBT, and CB populations, the heterozygosity and allele frequency distributions within the
15 microsatellite loci varied considerably, indicative of diverse genetic variation.
I
0.5 >-
, I I
U £: CD ::s 0.4 C"
! I.L £: 0.3 0 :;; ::3 ..c :s 0.2 II) , C I
I
Cb I I
Cb 0.1 I I
«
0
I
1 11 I hn..., . GSD(101) OH (26)
Microsatellite FH2328
I
f I I I I I I I I I
~ I
I I'
n I,
:. . SBT (18) CB (37)
I r I I
I • aBO (156)
180 bp
0184 bp
.188 bp
0192 bp
. 196 bp
0200 bp
. 204 bp
Cl20S bp
. 212 bp
0216 bp
220 bp
Figure 4.30. A graphic representation of the allele distribution frequencies for each
purebred dog population, as compared with a population of OBDs, at the FH2328
microsateliite locus. Sample sizes are indicated in parentheses.
Chapter 4: Results - Comparisons with DHs, SBTs. and other purebred dogs Page 80
Univers
ity of
Cap
e Tow
n
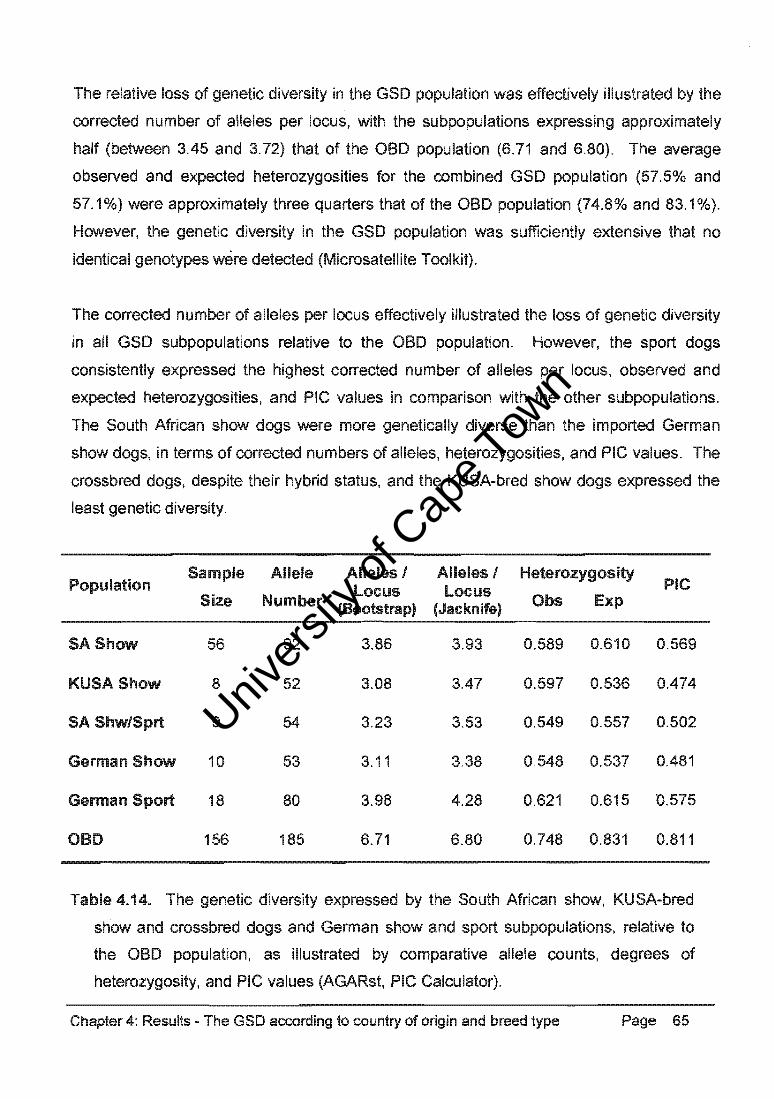
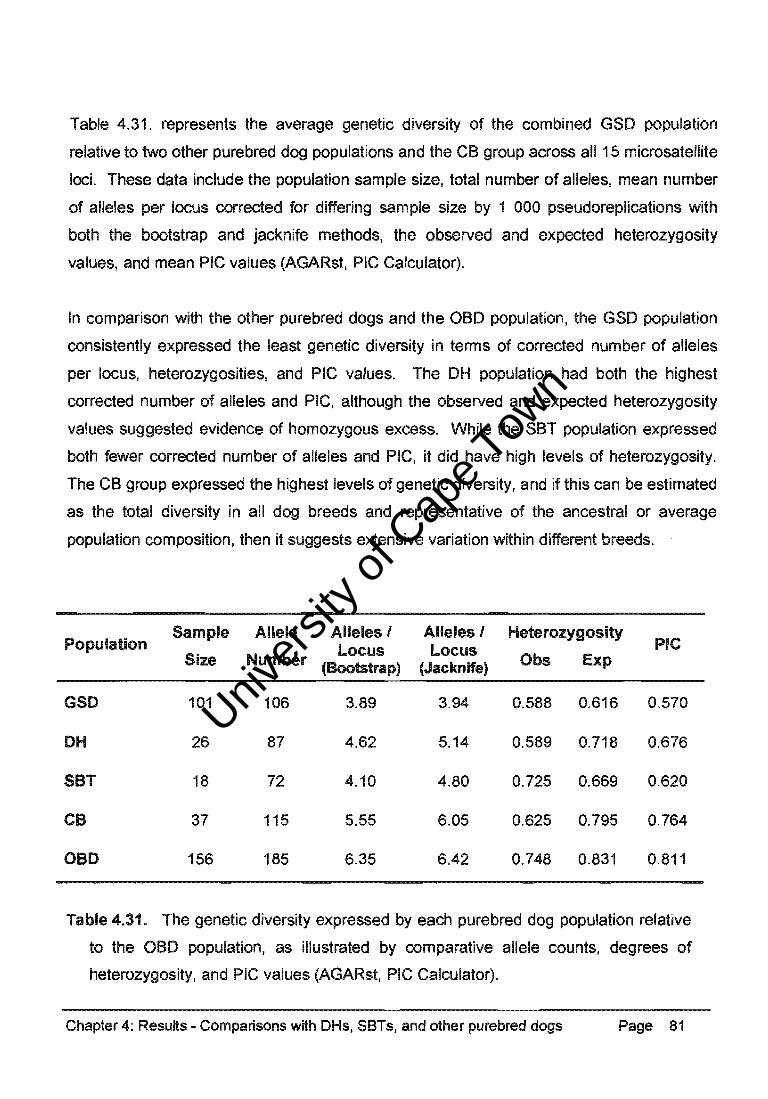
Table 4.31. represents the average genetic diversity of the combined GSO population
relative to two other purebred dog populations and the CB group across all 15 microsatellite
loci. These data include the population sample size, total number of alleles, mean number
of alleles per locus corrected for differing sample size by 1 000 pseudoreplications with
both the bootstrap and jacknife methods, the observed and expected heterozygosity
values, and mean PIC values (AGARst, PIC Calculator).
In comparison with the other purebred dogs and the aBO population, the GSO population
consistently expressed the least genetic diversity in terms of corrected number of alleles
per locus, heterozygosities, and PIC values. The OH population had both the highest
corrected number of alleles and PIC, although the observed and expected heterozygosity
values suggested evidence of homozygous excess. While the SBT population expressed
both fewer corrected number of alleles and PIC, it did have high levels of heterozygosity.
The CB group expressed the highest levels of genetic diversity, and if this can be estimated
as the total diversity in all dog breeds and representative of the ancestral or average
population composition, then it suggests extensive variation within different breeds.
Population Sample Allele Alleles I Alleles I Heterozygosity
PIC Locus Locus Size Number (Bootstrap) (Jacknife) Obs Exp
GSO 101 106 3.89 3.94 0.588 0.616 0.570
OH 26 87 4.62 5.14 0.589 0.718 0.676
SBT 18 72 4.10 4.80 0.725 0.669 0.620
CB 37 115 5.55 6.05 0.625 0.795 0.764
aBO 156 185 6.35 6.42 0.748 0.831 0.811
Table 4.31. The genetic diversity expressed by each purebred dog population relative
to the aBO population, as illustrated by comparative allele counts, degrees of
heterozygosity, and PIC values (AGARst, PIC Calculator).
Chapter 4: Results - Comparisons with DHs, SBTs, and other purebred dogs Page 81

Univers
ity of
Cap
e Tow
n
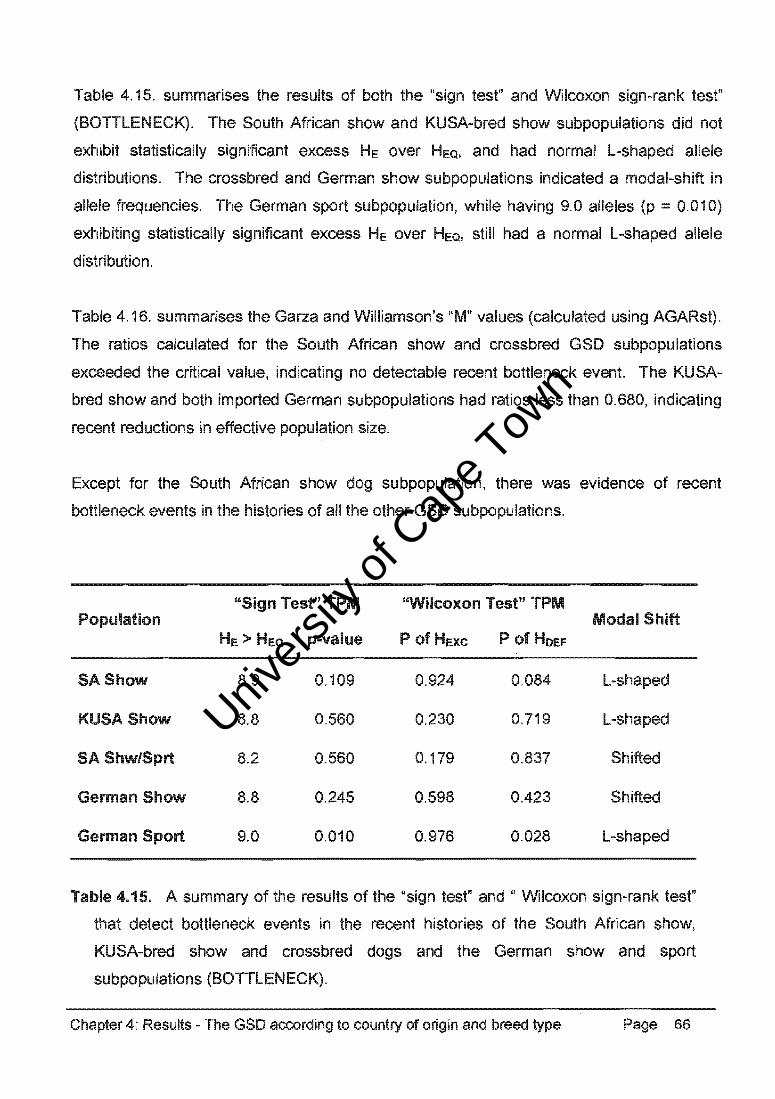
Table 4.32. summarises the results of both the "sign test" and Wilcoxon sign-rank test"
(BOTTLENECK). The GSD, DH, and CB populations exhibited statistically significant
excess He over HeQI and there was no indication of a modal-shift in allele 'frequencies with
a normal L-shaped allele distribution. The SBT population had a modal-shift in allele
frequencies indicating a recent bottleneck event.
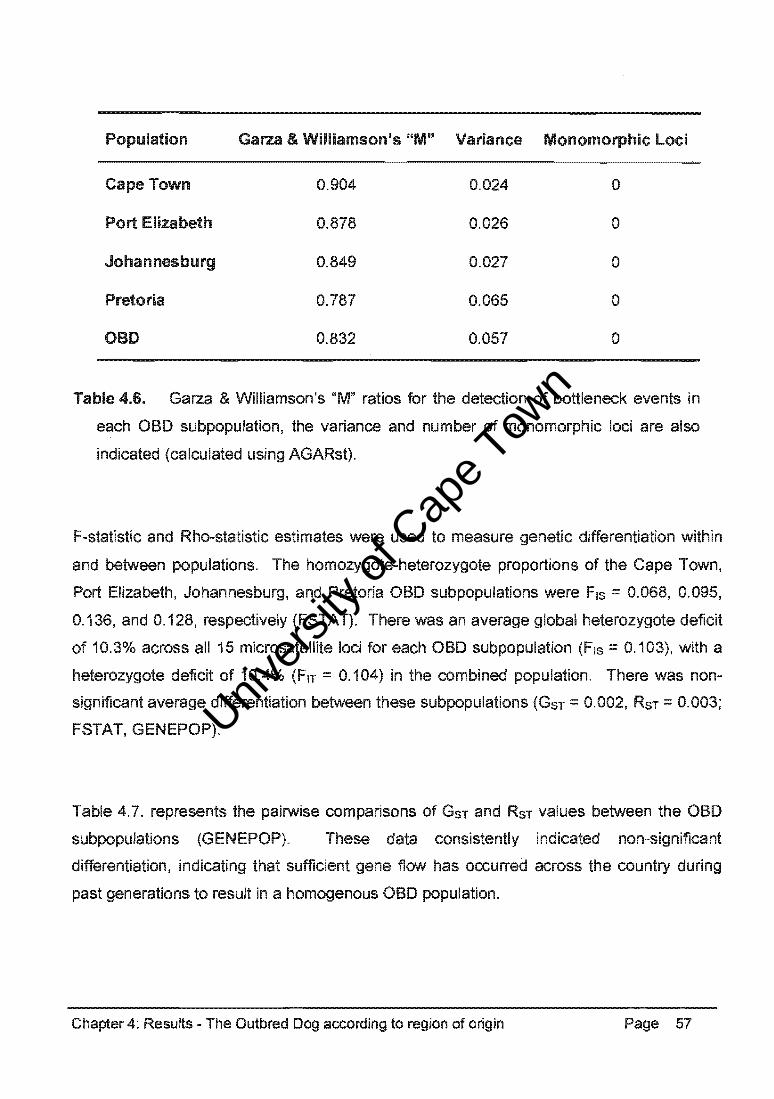
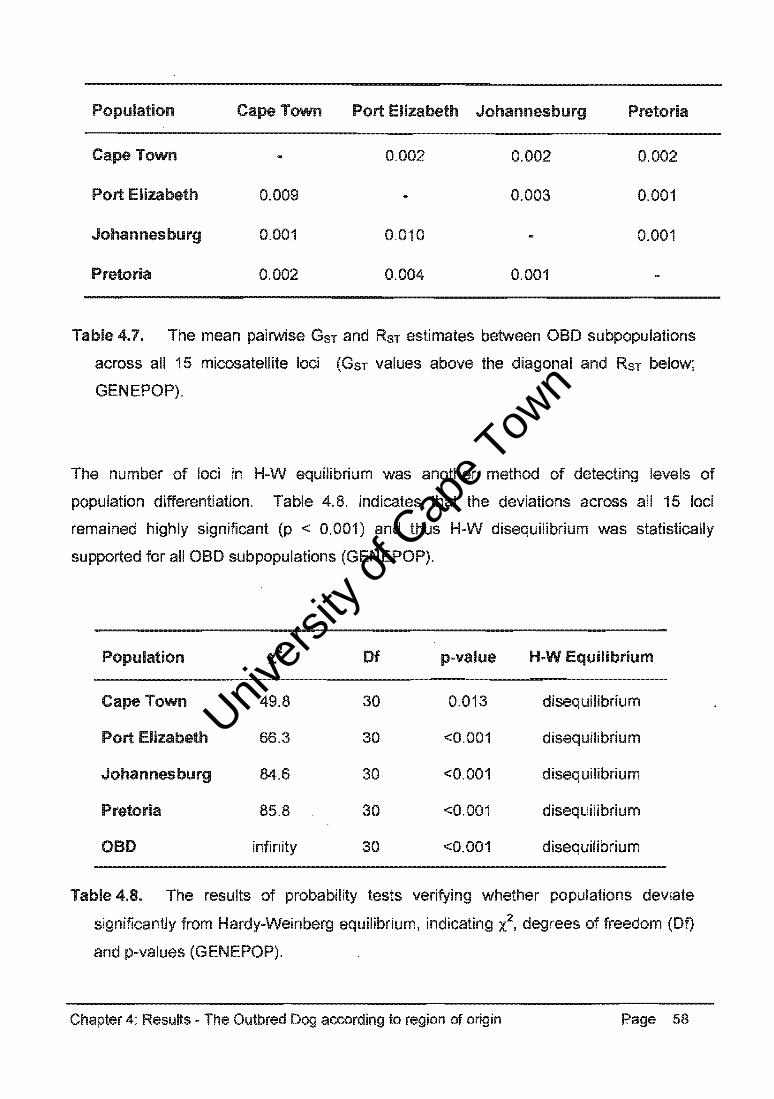
Table 4.33. summarises the Garza and Williamson's "M" values (calculated using AGARst).
The ratios calculated for the GSD, DH, and CB populations exceeded the critical value,
indicating no detectable recent bottleneck event. However, the SBT population had a ratio
less than 0.680, indicating recent reductions in effective population size.
Bottlenecks in the recent histories of the GSD, DH and CB populations were not statistically
supported, but there was evidence of reduced effective population size in the SBT
population.
"Sign Test" TPM "Wilcoxon Test" TPM Population Modal Shift
HE> HEQ p-value P of HEXC P of HDEF
GSD 8.85 0.012 0.011 0.991 L-shaped
DH 9.07 0.375 0.681 0.339 L-shaped
SeT 8.57 0.315 0.906 0.104 shifted
ce 8.94 0.390 0.906 0.104 L-shaped
Table 4.32. A summary of the results of the "sign test" and" Wilcoxon sign-rank test"
that detect bottleneck events in the recent history of each purebred dog population
(BOTTLENECK).
Chapter 4: Results - Comparisons with DHs, SBTs, and other purebred dogs Page 82

Univers
ity of
Cap
e Tow
n
Population Garza & Williamson's "Mil Variance Monomorphic Loci
GSD 0.756 0.051 0
DH 0.750 0.066 0
SBT 0.668 0.062 0
CB 0.796 0.042 0
Table 4.33. Garza & Williamson's "M" ratios for the detection of bottleneck events in
each purebred dog population, the variance and number of monomorphic loci are
also indicated (calculated using AGARst).
The homozygote-heterozygote proportions of the GSO, OH, SBT, and CB populations were
Fis ::: 0.054, 0.248, 0.053, and 0.252, respectively (FSTAT). There was a global average
heterozygote deficit of 9.5% (F1s ::: 0.095) across all 15 microsatellite loci for each
population, and a heterozygote deficit of 23.8% (FIT::: 0.238) in the combined purebred dog
population. There was a significant differentiation between the populations (GST ::: 0.158,
RST::: 0.160), however these estimates were less when the purebred dog populations were
compared with the OBO population (GST::: 0.092, RST::: 0.069; FSTAT, GENEPOP).
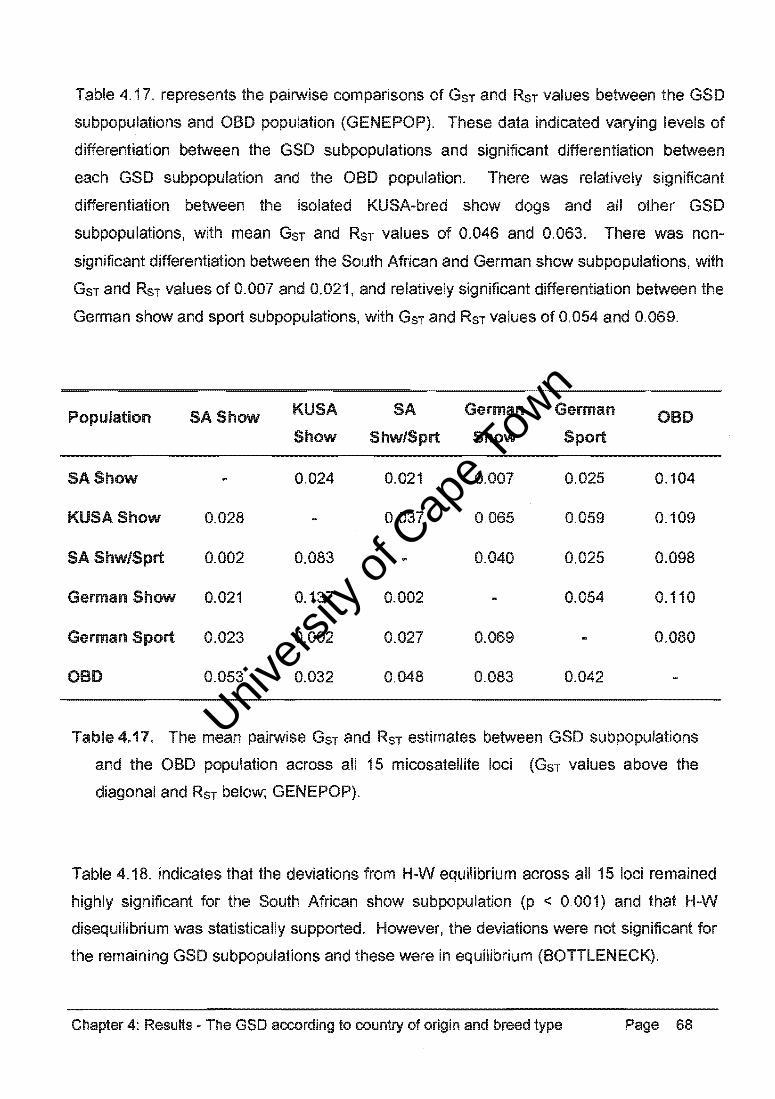
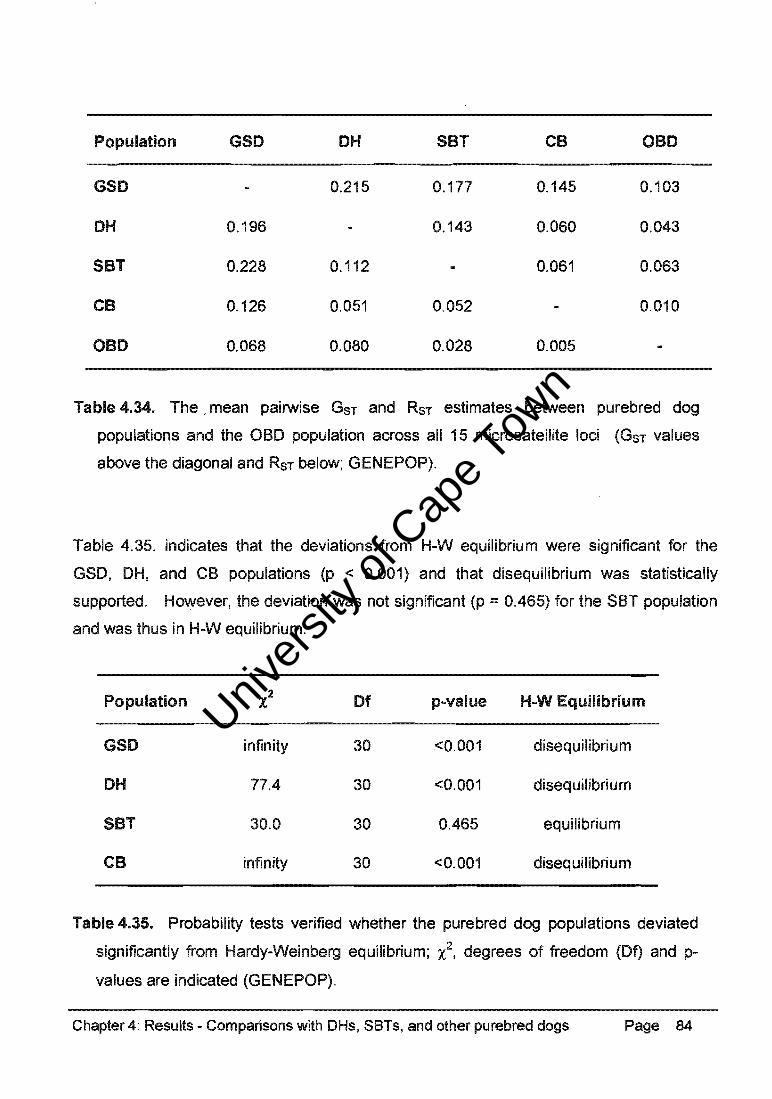
Table 4.34. represents the pairwise comparisons of GST and RST values between the GSO,
OH, SBT, CB, and OBO populations (GENEPOP). These data consistently indicated
significant differentiation between the purebred dog populations and between these
populations and the CB group and the OBO population. There was non-significant
differentiation between the CB group and the OBO population (GST ::: 0.010, RST::: 0.005).
Chapter 4: Results - Comparisons with DHs, 88Ts, and other purebred dogs Page 83
Univers
ity of
Cap
e Tow
n
Population GSO OH SBT CB OBO
GSO 0.215 0.177 0.145 0.103
OH 0.196 0.143 0.060 0.043
SBT 0.228 0.112 0.061 0.063
CB 0.126 0.051 0.052 0.010
OBO 0.068 0.080 0.028 0.005
Table 4.34. The, mean pairwise GST and RST estimates between purebred dog
populations and the OBO population across all 15 microsatellite loci (GST values
above the diagonal and RST below; GENEPOP).
Table 4.35. indicates that the deviations from H-W equilibrium were significant for the
GSO, OH, and CB populations (p < 0.001) and that disequilibrium was statistically
supported. However, the deviation was not significant (p :::: 0.465) for the SBT population
and was thus in H-W equilibrium.
Population 'l Of p-value H-W Equilibrium
GSO infinity 30 <0.001 disequilibrium
OH 77.4 30 <0.001 disequilibrium
SBT 30.0 30 0.465 equilibrium
CB infinity 30 <0.001 disequilibrium
Table 4.35. Probability tests verified whether the purebred dog populations deviated
significantly from Hardy-Weinberg equilibrium; x2, degrees of freedom (Of) and p
values are indicated (GENEPOP).
Chapter 4: Results - Comparisons with DHs, SBTs, and other purebred dogs Page 84
Univers
ity of
Cap
e Tow
n
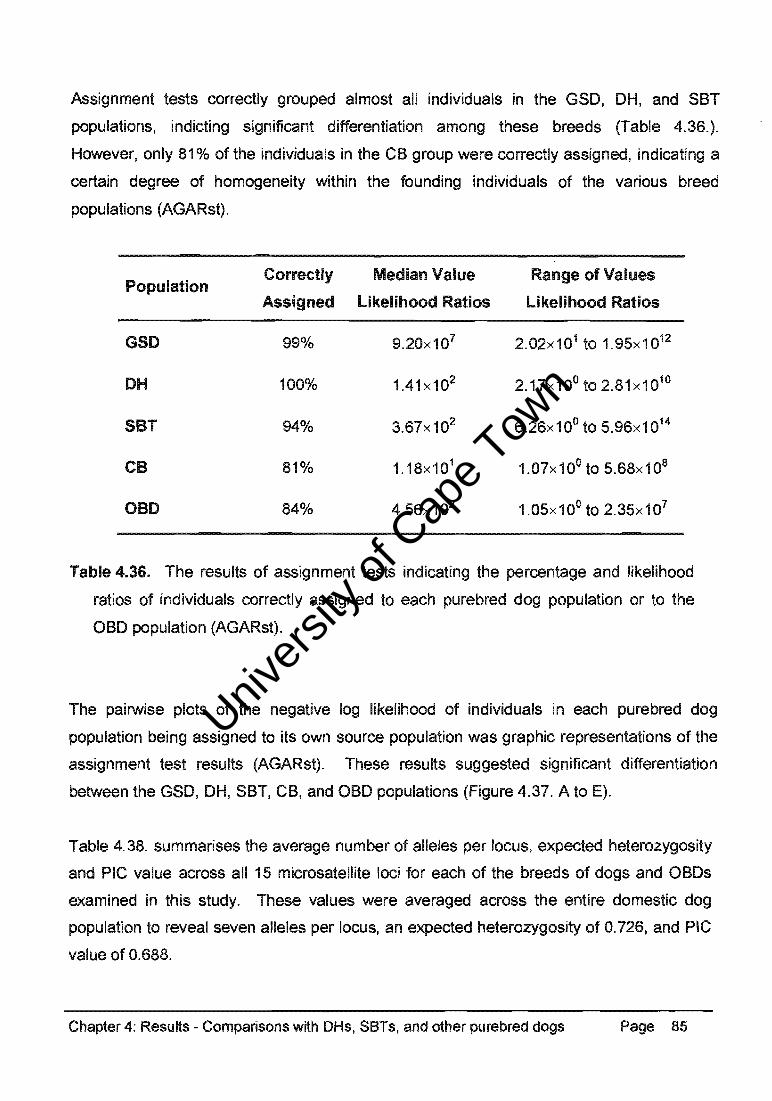
Assignment tests correctly grouped almost all individuals in the GSO, OH, and SBT
populations, indicting significant differentiation among these breeds (Table 4.36.).
However, only 81 % of the individuals in the CB group were correctly assigned, indicating a
certain degree of homogeneity within the founding individuals of the various breed
populations (AGARst).
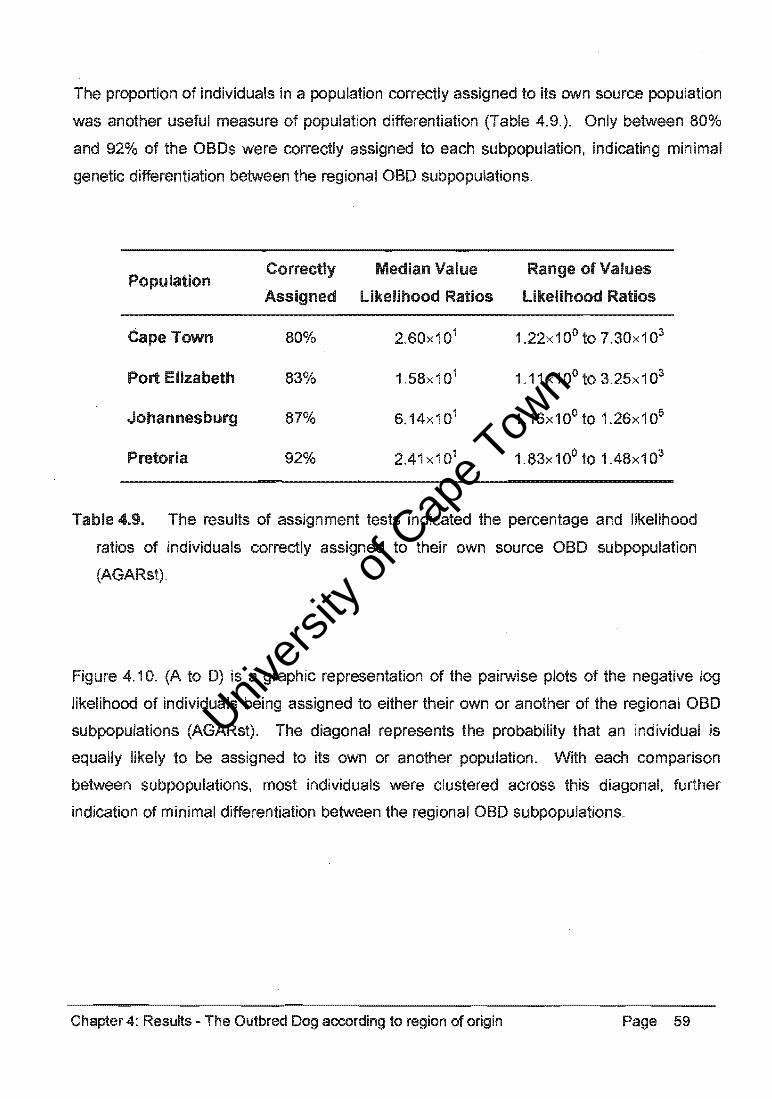
Population Correctly Median Value Range of Values
Assigned likelihood Ratios likelihood Ratios
GSD 99% 9.20x10⁷ 2.02x101 to 1.95x10¹²
DH 100% 1.41 x10² 2.17x10o to 2.81x10¹⁰
SeT 94% 3.67x10² 6.26x10o to 5.96x10¹⁴
ce 81% 1. 18x 1 01 1.07x100to 5.68x10B
oeD 84% 4.56x10² 1.05x100to 2.35x10⁷
Table 4.36. The results of assignment tests indicating the percentage and likelihood
ratios of individuals correctly assigned to each purebred dog population or to the
aBO population (AGARst).
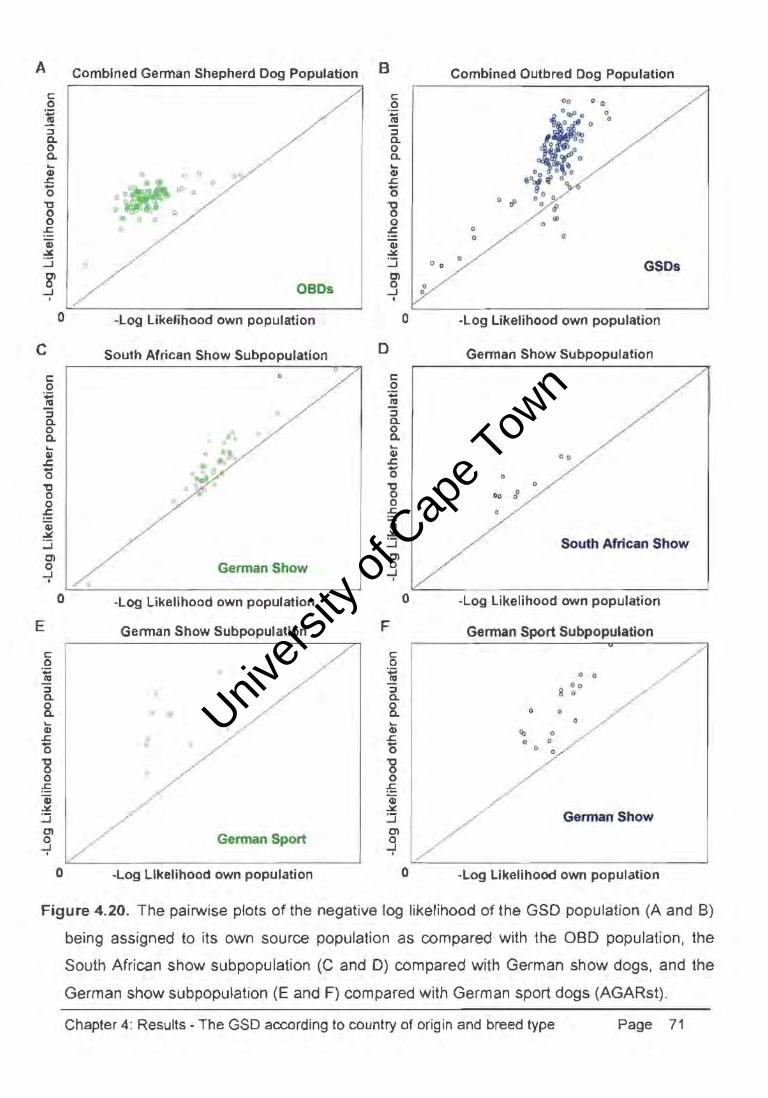
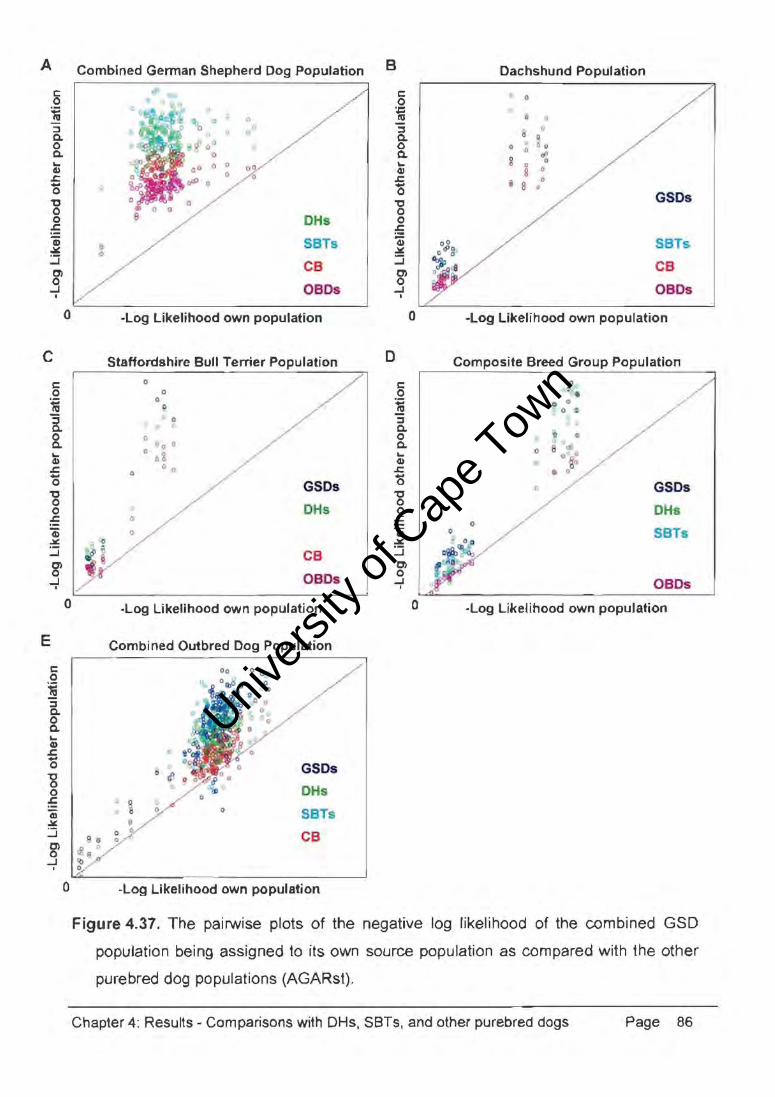
The pairwise plots of the negative log likelihood of individuals in each purebred dog
population being assigned to its own source population was graphic representations of the
assignment test results (AGARst). These results suggested significant differentiation
between the GSO, OH, SBT, CB, and aBO populations (Figure 4.37. A to E).
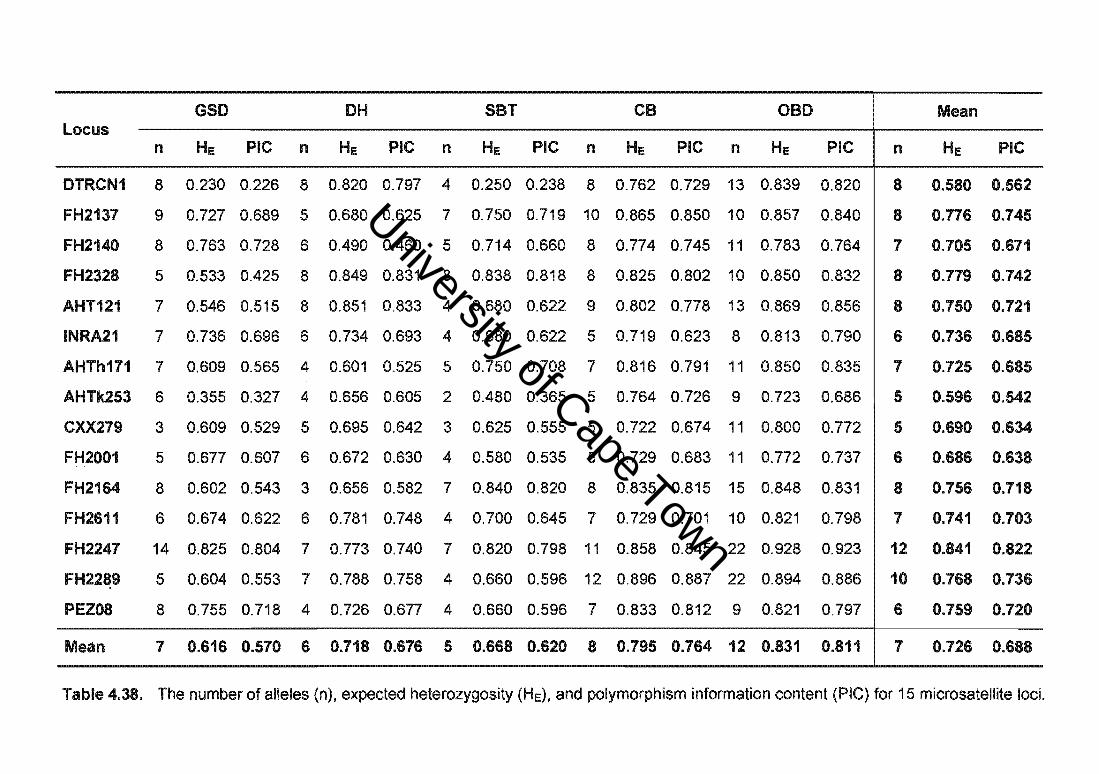
Table 4.38. summarises the average number of alleles per locus, expected heterozygosity
and PIC value across all 15 microsatellite loci for each of the breeds of dogs and aBOs
examined in this study. These values were averaged across the entire domestic dog
population to reveal seven alleles per locus, an expected heterozygosity of 0.726, and PIC
value of 0.688.
Chapter 4: Results - Comparisons with DHs, SBTs, and other purebred dogs Page 85
Univers
ity of
Cap
e Tow
n
A
c: 0
i ::J Q. 0 Q. ... 41
.r::. .... 0 '0 0 0
.r::. CD ...:: :J OJ 0
...J . 0
C
c: 0
i ~ 0 Q. ... 41
.r::. .... 0 '0 0 0
.r::. CD ~
:J OJ 0 -t
0
E
c: 0
~ :::J Q. 0 Q. ... G)
.r::. -0
"8 0
.r::. Gi ~
:J OJ 0
...J . 0
Combined German Shepherd Dog Population
/ c
:J 0 0
"
0 0
0 0
0 0
DHs
i! // SBTs
/ CB
OBDs
-log likelihood own population
Staffordshire Bull Terrier Population 0 /./ 0
D ./ 0
/ ~ 0
0 00 0
o 08 " 0
GSDs
" DHs 0
~ CB
OBDs ./ -Log Likelihood own population
Combined Outbred Dog Population
o 0
0 Co
GSDs
DHs " 0 il 0 SBTs
e 0 CB 9 ~
-Log likelihood own population
B
c: 0 ',C III ::J Q. 0 Q. ... 41
.r::. '0 "C 0 0 :5 4) ...:: ::J OJ 0
...J • 0
D
c: 0 ..
.!!:! :::J Q. 0 Q. ... 41
.r::. 0 '0 0 0
.r::. 41
...:: :J OJ 0 -t
0
Dachshund Population
Q
II ~o 6 0
cI' o
8 0
8 B "
./ GSDs
SBTs
CB
OBDs
-log Likelihood own population
Composite Breed Group Population o
:- ,. o 0
o ~
'l 0
o GSDs
DHs
SBTs
OBDs
-log Likelihood own population
Figure 4.37. The pairwise plots of the negative log likelihood of the combined GSD
population being assigned to its own source population as compared with the other
purebred dog populations (AGARst).
Chapter 4: Results - Comparisons with DHs, SBTs, and other purebred dogs Page 86
University of Cape Town
Locus
OTRCN1
FH2137
FH2140
FH2328
AHT121
INRA21
AHTh171
AHTk253
CXX279
FH2001
FH2164
FH2611
FH2247
FH2289
PEZ08
Mean
n
8
9
8
5
7
7
7
6
3
5
8
GSO OH SBT CB OBO
HE PIC n HE PIC n He PIC n He PIC n HE PIC
0.230 0.226 8 0.820 0.797 4 0.250 0.238 8 0.762 0.729 13 0.839 0.820
0.727 0.689 5 0.680 0.625 7 0.750 0.719 10 0.865 0.850 10 0.857 0.840
0.763 0.728 6 0.490 0.460 5 0.714 0.660 8 0.774 0.745 11 0.783 0.764
0.533 0.425 8 0.849 0.831 8 0.838 0.818 8 0.825 0.802 10 0.850 0.832
0.546 0.515 8 0.851 0.833 4 0.680 0.622 9 0.802 0.778 13 0.869 0.856
0.736 0.696 6 0.734 0.693 4 0.680 0.622 5 0.719 0.623 8 0.813 0.790
0.609 0.565 4 0.601 0.525 5 0.750 0.708 7 0.816 0.791 11 0.850 0.835
0.355 0.327 4 0.656 0.605 2 0.480 0.365 5 0.764 0.726 9 0.723 0.686
0.609 0.529 5 0.695 0.642 3 0.625 0.555 5 0.722 0.674 11 0.800 0.772
0.677 0.607 6 0.672 0.630 4 0.580 0.535 5 0.729 0.683 11 0.772 0.737
0.602 0.543 3 0.656 0.582 7 0.840 0.820 8 0.835 0.815 15 0.848 0.831
6 0.674 0.622 6 0.781 0.748 4 0.700 0.645 7 0.729 0.701 10 0.821 0.798
14 0.825 0.804 7 0.773 0.740 7 0.820 0.798 11 0.858 0.845 22 0.928 0.923
5 0.604 0.553 7 0.788 0.758 4 0.660 0.596 12 0.896 0.887 22 0.894 0.886
8 0.755 0.718 4 0.726 0.677 4 0.660 0.596 7 0.833 0.812 9 0.821 0.797
7 0.616 0.570 6 0.718 0.676 5 0.668 0.620 8 0.795 0.764 12 0.831 0.811
n
8
8
7
8
8
6
7
5
5
6
8
Mean
HE PIC
0.580 0.562
0.776 0.745
0.705 0.671
0.779 0.742
0.750 0.721
0.736 0.685
0.725 0.685
0.596 0.542
0.690 0.634
0.686 0.638
0.756 0.718
7 0.741 0.703
12 0.841 0.822
10 0.768 0.736
6 0.759 0.720
7 0.726 0.688
Table 4.38. The number of alleles (n), expected heterozygosity (HE), and polymorphism information content (PIC) for 15 microsatellite loci.
Univers
ity of
Cap
e Tow
n
Chapter 5
Discussion
5.1. Introduction
"The breeding of fine dogs has not advanced as rapidly as it should have, due to a
lack of knowledge of many breeders of the hidden faults in the available breeding
stock. Perhaps we breeders will soon outgrow our adolescence - perhaps the time is
near when we will be able to discuss the faults of our dogs and the reasons for them.
We acknowledge that all dogs have faults, but it is 'bad form' to speak openly about
them. Let us hope that the near future will bring an end to such a childish attitude so
that we may progress towards the ideal in sureness and light, whereas now we creep
in semi-darkness". Goldbecker and Hart "This is the German Shepherd" (Elliott 1968).
A breed is defined as an intraspecies group of individuals with uniformly similar physical
characteristics developed and directed by human control (Irion et al. 2003). Artificial
selection has generated an array of phenotypically distinct breeds of dogs; this diversity
cannot be equalled by any other animal species (Richman et al. 2001). The breeding
strategies used to develop these breeds is associated with the inherent risk of losing
genetic diversity, although certain breeds would have potentially lost more than others.
The mtDNA genomes of the domestic dog and grey wolf differ by just 0.2%, and a limited
number of generations have elapsed since the origin of many breeds, implying that
uniformity is probably limited to only a small number of genes affecting breed-specific
physiological or behavioural characteristics (Aguirre et al. 1999, Irion et al. 2003).
The explosion in breed variety began in the mid-19th century as a result of public demand
for unique and unusual dogs, whereby breeds became fashionable for their novelty value
rather than the ability to fulfil a particular function. Even traditionally functional breeds are
now bred primarily for exhibition. Such breeding programmes are controlled by the
demands of the show ring with specific physical traits tending to be most important, rather
than sound behaviour and temperament. Breed registries and kennel clubs became
commonplace towards the end of the 19th century for the regulation of breeding and
exhibition., Breed integrity was ensured by the practice of only including progeny in breed
databases if both parents had been registered and conformed to certain minimum criteria.
Chapter 5: Discussion - Introduction Page 88

Univers
ity of
Cap
e Tow
n
levels of inbreeding were previously calculated according to pedigree analysis, but these
estimations were frequently incorrect. Only a few generations are represented and earlier
matings between related individuals are not included, and before the use of molecular
genetic techniques to verify parentage, pedigrees were frequently incorrect (Koskinen and
Bredbacka 2000).
Molecular genetic techniques have been used to investigate numerous breeds of dogs,
with most reportedly expressing moderate to high levels of genetic diversity, with the
degree of population differentiation indicated being primarily the result of differing allele
distribution frequencies (Fredholm and Winter0 1995, Pihkanen 1996, lajc et al. 1997,
Morera et al. 1999, Koskinen and Bredbacka 2000, Altet et al. 2001, Irion et al. 2003 and
Parker et al. 2004). These data were indicative of diverse founding populations with much
interbreeding prior to the relatively recent origin of many modern breeds of dogs.
Dogs registered with the German Shepherd Dog Federation of South Africa are only
eligible for breeding if certain minimum criteria are met. Every dog and bitch must conform
to the Breed Standard and receive a grading of at least "good" at a breed show under an
accredited judge, they must be x-rayed and passed free of hip dysplasia, they must have
had their parentage verified, and all parents must have been registered with the
Federation. As of February 2003, preliminary pedigree analysis revealed that only about
200 of the 1 130 parentage verified dogs were not first-degree relatives. This breeding
stock included large numbers of individuals either sired or grand-sired by one of three
dogs; the German-bred imported show dogs, lasso von Descharo, Quando vom
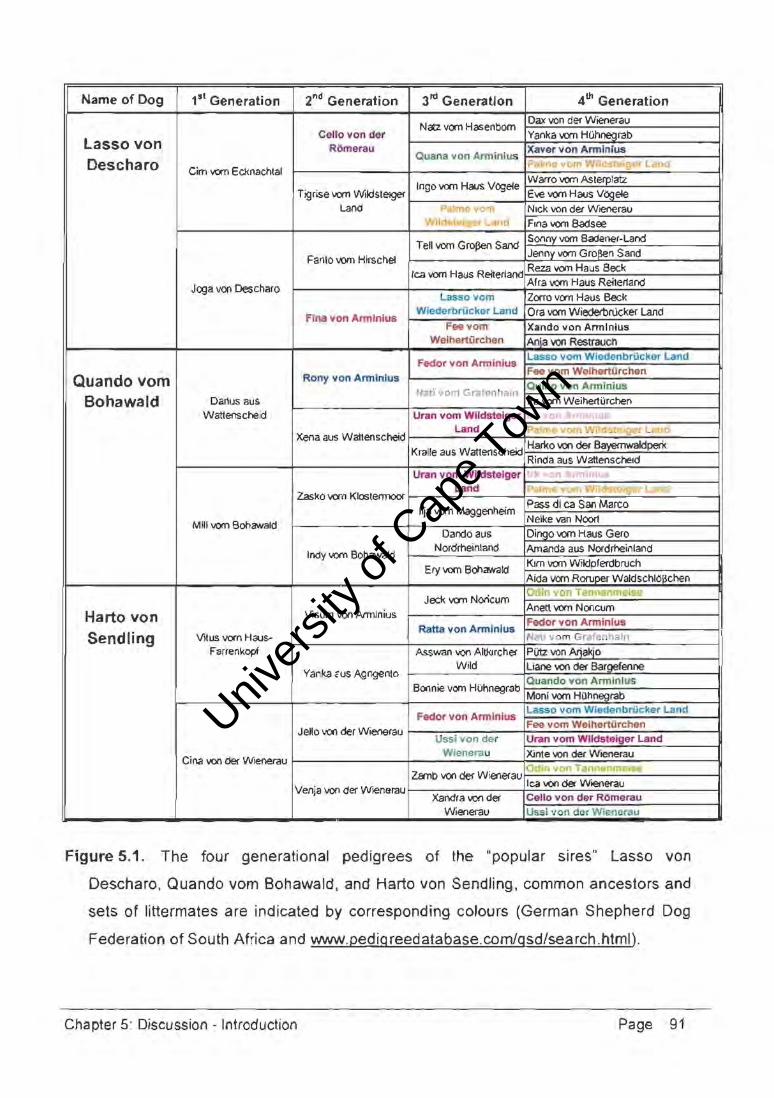
Bohawald, and Harto von Sendling. According to their pedigrees (Figure 5.1.), these dogs
shared seven common ancestors and four sets of littermates in the four generations
examined. Any recessive genetic disorder carried by one of these dogs could have been
passed to their progeny to result in future widespread disease conditions. These three
dogs have been retired from stud but a large proportion of the population now carries their
bloodlines. This cycle is perpetuated; breed politics and slJccess at the annual national
breed show will result in a couple of dogs assuming the role of "popular sire". Further
analysis of 250 dogs that were not first-degree relatives revealed only eight individuals that
did not share any common ancestors for the four generations examined, this being
representative of the levels of inbreeding and relatedness in the GSD breeding stock.
Chapter 5: Discussion - Introduction Page 89
Univers
ity of
Cap
e Tow
n
Breeders of show dogs tend to focus on the importance of bloodlines, with high levels of
inbreeding existing in these lineages (Figure 5.1.). These breeders often maintain their
own bitch-lines for breeding with the best available stud dogs, usually imported dogs.
Current breed regulations allow for progeny to have multiple common ancestors, although
the closest inbreeding allowed is for any particular individual to be the parent of the
potential stud dog and grandparent of the bitch, or vice versa. However, it is possible to
obtain special permission for mating combinations of father/daughter, mother/son or full
siblings. This permission is usually only granted when the dogs concerned have been
graded VA (excellent select) at the national breed show, for it is a commonly held belief
that close inbreeding, the ultimate mating of "like to like", will produce an exceptional dog.
Pedigree analysis of sport dogs revealed much lower levels of inbreeding, with three of the
most popular stud dogs, the German imports, Ari vom Eckgrund and Canto von Neumis
Flucht, and the Belgian import, Vasco van Salenshof, sharing no common ancestors in the
four generations examined. Bloodlines are still important, but breeders tend to focus on
the performances of the potential stud dog and bitch, and that of the bitch sire. Both
bitches and stud dogs are usually imported; possibly because this breed type has only
been in South Africa for about ten years and no local bloodlines have been established.
Kennel Union of South Africa registered show dogs have been bred in almost complete
isolation for nearly twenty years, with little regulation regarding levels of inbreeding and
minimum breeding criteria. Crossbred show and sport dogs would have no ancestors
common to both sides of their pedigrees, although it is generally inexperienced amateur
breeders that experiment with mating such "unlike" dogs. Only a small number of these
crossbred dogs are produced because they 'usually do not inherit the best of each parent,
but are rather a mixture of the characteristic physical and mental traits, and are not
typically suited to either breed type.
With the advent of more specialised requirements, it would appear as though two distinct
types of dogs are required to completely fuml the demands of the breed standard. It would
be the ultimate aspiration of any breed enthusiast to produce the "perfect" GSD, having the
physical conformation of a show dog and mental abilities of a sport dog, unfortunately this
seems unlikely to be achieved with the existing politics and breeding strategies.
Chapter 5: Discussion - Introduction Page 90
Univers
ity of
Cap
e Tow
n
Name of Dog 1st Generation 2nd Generation 3rd Generation 4th Generation
Natz vom Hasenbom Dax von der Wienerau
Cello yon der Yanka vom HOhnegrab Lasso von RCSmerau Xaver von Anninius
Quana yon Arminius Descharo Cim vom Ecknachtal
I P~hra"("Tl oIilCJ elQ r L. ,nd
I n go IJOO1 HallS V «>3e1e Warro vorn Aslerplatz
Tigrise vom WildSle!geI' Eve vom Haus V6gele Land P lme " Nick von der Wrenerau
Wlldst_ -v; Land Flna vom Badsee
Tell vom Gro(3en Sand SQ(lny vern 8adener-Land
Fanto vom Hirschel Jenny YOm GroBen Sand
lea vom HallS Re1tenalld Reza vom Haus Beck
Jega von Descharo Alra vom Haus Reiter1and
Lasso vom Zarro vom Haus Beck
Fina von Annlnius WiederbrOckof Land Ora vom Wiederbnicker Land
Feevom Xando von Annlnius Weihertilrchen Mja von Restrauch
Fedor von Annlnius Lasso vom Wledcnbrtickor Land
Quando vom Rony von Arminius Fee vom WelhertOrchen
Nali vom Grafon lam Qulno yon Anninius
Bohawald Darius aus Ira vom WeihertOrchen Wattenscheid Uran yom Wildstelger •
Land p In ' 0 ' 11 \'Yllr< _, 1i~r L':c Vi Xena aus Watlenscheid
Harko IlOl'\ deJ 80)":'1 r r .. aldperi{ Kralle aus Wattenscheid
Rinda aus Wattenscheld Uran vom Wildstelger I
Zasko vorn Kloslermoor Land 1-',,1, ~
• ,," 1 " . ' '.and
IIja vom Maggenheim Pass di ca Soo Marco
Mill vom Bohawald Nelke van Noort
Dando aus Dingo vom Haus Gero
Indy vom Bohawald Nordrheinland Amanda aus Nordrheinland
Klm vom Wildplerdbruch Ery IJOO1 Bohawald Aida vern Roruper Waldschl6~chen
Jeck van Noricum Odin ~ on Tam :)nmsise
Harto von Visum von Annlnius Anett van NQflcum
Ratta von Anninius Fedor von Anninlus
Sendling Vitus YOm Hau&- Nati vom Grafonhaln
Farrenkopf Asswan von Altklrcher P (liz von Atiakio
Yanka C'us Agngenlo Wild Liane von der Bargefenne
Quando von Armlnlus
I Boonie vom HOhnegrab
Moni vern HOhnegrab
Fedor von Armlnlus Lasso vom Wledenbriicker Land
Jello von der Wienerau Fee vom Welherturchen
Ussi von dar Uran vom Wlldsteigar Land Wianerau Xinte von der Wlenerau
Cina von der Wienerau IOdl'l yon Tann ,nmSI'":i!
Zsmb von del' Wienerau lea von der Wrenerau
Venja von der Wlenerau Xandra von der Cello von dar Rl:lmerau
Wienerau Ussl von dGr Wienerau
Figure 5.1. The four generational pedigrees of the "popular sires" Lasso von
Oescharo, Quando vom Bohawald, and Harto von Sendling. common ancestors and
sets of littermates are indicated by corresponding colours (German Shepherd Dog
Federation of South Africa and www.pedigreedatabase.com/gsd/search.html).
Chapter 5: Discussion - Introduction Page 91
I
Univers
ity of
Cap
e Tow
n
5.2. "rhe Outbred Dog according to region of origin
The comparison of outbred mongrel dogs from Cape Town in the Western Cape, Port
Elizabeth in the Eastern Cape, Johannesburg in southwestern Gauteng and Pretoria in
northeastern Gauteng, indicated comparable levels of extensive genetic diversity as well
as non-significant population differentiation. This was clearly illustrated by the allele
frequency distribution at locus FH2611, two subpopulations expressed the same ten
alleles and the other two expressed nine of these alleles. All subpopulations had the same
four most common alleles, with the highest individual allele frequency of 0.324. The
corrected numbers of alleles per locus (between 8.66 and 9.80), the observed
heterozygosity values (between 72% and 77.6%), expected heterozygosity values
(between 81.8% and 82.5%), and PIC values (between 0.796 and 0.802) further
demonstrated the comparable levels of genetic diversity. The discrepancy in the values of
the observed and expected heterozygosities was indicative of slight homozygous excess.
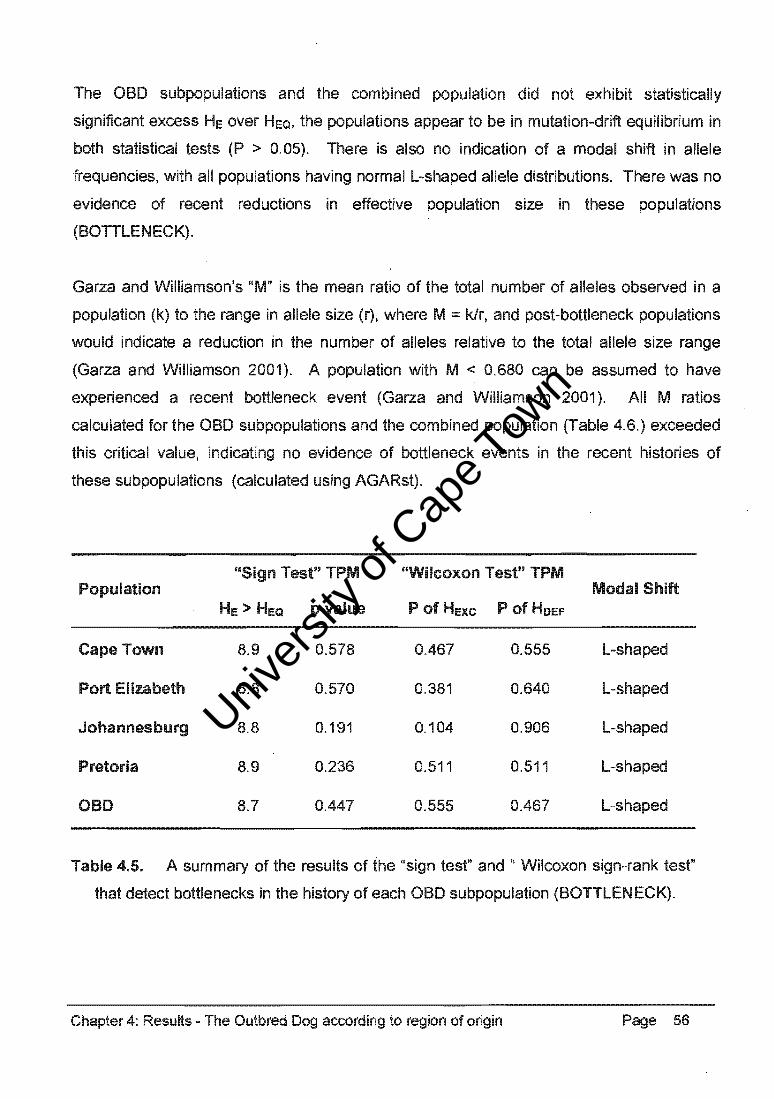
Microsatellite marker data have been successfully tested for heterozygosity excess, modal
shifts in allele size distributions, and ratios of allele number to range in allele size, for the
detection of recent bottleneck events in an array of natural populations (Luikart and Cornuet
1998, Luikart et al. 1998a, Garza and Williamson 2001). These tests indicated that there
was no statistical support for significant bottleneck events in the history of any of the OBO
subpopulations, indicating that no recent reductions in effective population size have
occurred.
F-statistic and Rho-statistic estimates were used to measure genetiC differentiation within
and between the OBO subpopulations. The homozygote-heterozygote proportions of the
Cape Town, Port Elizabeth, Johannesburg, and Pretoria OBD subpopulations were all
positive (Fls :;:: 0.068, 0.095, 0.136, and 0.128, respectively), with an average global
heterozygote deficit for each subpopulation of 10.3%, indicating the existence of significant
levels of homozygous excess. There was no indication of non-amplifying or silent alleles
in the parentage verification analyses and is unlikely to be affecting these statistical
estimates, thus the homozygous excess indicated in all four OBD subpopulations could be
the result of internal substructuring due to local inbreeding.
Chapter 5: Discussion - The Outbred Dog according to region of origin Page 92
Univers
ity of
Cap
e Tow
n
The pairwise GST and RST estimates of between 0.001 and 0.011 and an average global
differentiation of 0.2% among the aBO subpopulations was indicative of non-significant
levels of population differentiation. Substantial migration and gene flow across the country
during past generations has resulted in genetic homogeneity within the sub populations.
The combined aBO population was not congruent with H-W proportions, most likely due to
the substructuring caused by the geographic isolation of the subpopulations. H-W
disequilibrium was also statistically supported for each of the subpopulations; these
deviations could have resulted from any infringement of the assumptions made for
populations in equilibrium. As there was no evidence of allele non-amplification, and the
mongrel population is extremely large, these deviations are most probably due to the
occurrence of non-random mating and extensive gene flow. In addition, these deviations
from H-W equilibrium occurred consistently with positive F,s values, indicating that
homozygous excess influenced this state of disequilibrium.
The proportion of individuals in a population correctly assigned to its own source
population was another useful measure of differentiation. Assignment tests determined
the ratio of the likelihood of the genotype of each dog in a population being actually drawn
from that population. Between 8% and 20% of the individuals in each aBO subpopulation
could be statistically assigned to another of the subpopulations, indicating the occurrence
of substantial gene flow resulting in minimal differentiation in the mongrel populations.
The pairwise plots of the negative log likelihood of individuals being assigned to either their
own or another of the aBO subpopulations were graphic representations of the
assignment test results. Each pairwise comparison revealed that many individuals were
clustered across the diagonal; suggesting an equal likelihood of being assigned to another
subpopulation, further indication of the minimal differentiation between the aBO
subpopulations.
There was a Significant degree of genetic homogeneity between the aBO regional
subpopulations, such that the combined South African population was representative of a
genetically diverse control population, used in this study for comparative analyses with
purebred dog populations.
Chapter 5: Discussion - The Outbred Dog according to region of origin Page 93
Univers
ity of
Cap
e Tow
n
5.3. The German Shepherd Dog
5.3.1. According to country of origin and breed type
Comparative analyses between the GSO subpopulations indicated a moderate loss of
genetic diversity relative to the aBO population, comparable levels of genetic diversity in
the various breed types, non-signi'ficant differentiation between the South African and
German-bred show dog subpopulations, and moderate differentiation between the German
show and sport dog subpopulations.
At the AHT121 microsatellite marker, the South African show, KUSA show, crossbred,
German show and sport subpopulations expressed different combinations of four, three,
four, four, and seven alleles, respectively, in comparison with the 13 alleles of the aBO
population. The German sport dogs had a private allele (79bp) at this locus, with the
101bp allele being most common in all subpopulations and reaching a highest frequency
of 0.813 in the KUSA show subpopulation. At the AHTh171 microsatellite marker, the
South African show, KUSA show, crossbred I German show and sport subpopulations
expressed seven, two, three, two, and five alleles, respectively, in comparison with the 11
alleles of the aBO population. The 138bp allele was most common in all GSO
subpopulations, reaching a highest frequency of 0.786 in the KUSA show subpopulation.
Interestingly, the most common allele (130bp) in the crossbred dog subpopulation was
fairly infrequent in both the show and sport subpopulations.
The combined GSO population showed a moderate loss of genetic diversity relative to the
aBO population. The average number of alleles per locus is a more sensitive measure of
genetic diversity, with the GSO population expressing almost half that of the OBOs (6.48
and 7.07 compared with 11.48 and 11.90 according to the bootstrap and jacknife methods,
respectively). The average observed and expected heterozygosities and PIC values were
both approximately three quarters that of the OBOs (58.8% and 60.6% compared with
74.8% and 83.1%, respectively, and 0.570 compared with 0.811).
The German sport dog subpopulation conSistently expressed the highest levels of genetic
diversity, with the most corrected alleles per locus (3.96 and 4.02 according to the
bootstrap and jacknife methods). observed and expected heterozygosities (62.1 % and
61.5%), and PIC value (0.575). All but one of the private alleles detected in the GSO
Chapter 5: Discussion - The GSD according to country of origin and breed type Page 94

Univers
ity of
Cap
e Tow
n
sub populations were restricted to these German-bred sport dogs (alleles 79bp at AHT121 ,
88bp at INRA21 and 354bp at FH2164). The South African show dog subpopulation
expressed the second highest levels of genetic diversity, with respect to the corrected
alleles per locus (3.86 and 3.93 according to the bootstrap and jacknife methods),
observed and expected heterozygosities (61.0% and 56.9%), and PIC value (0.569). This
subpopulation had a single private allele (185bp) at locus FH2611. The German-bred
show, crossbred and KUSA show subpopulations expressed the least genetic diversity
with the lowest numbers of corrected alleles per locus, observed and expected
heterozygosities, and PIC values. The crossbred show and sport dog sub population was
monomorphic at a single microsatellite marker, the DTRCN1 locus.
Greater genetic diversity would have been expected in the ancestral (German) population
in comparison with a derived (South African) population. However, even those show dogs
classified as locally bred have imported ancestors only one or two generations back in
their pedigrees, especially on the sire-line. Importation (migration and gene flow) over a
number of decades has resulted in the continuous accumulation of genetic diversity in the
South African show dog subpopulation. However, the effective population size of the
breeding stock is much smaller than that of the household pet population and includes
many closely related individuals. As a result, the show dogs expressed less genetic
diversity than that of the much smaller sport dog subpopulation, representative of the large
and diverse population of sport dogs in Germany. The first sport dogs arrived in South
Africa approximately ten years ago and the sub population size has remained much smaller
in comparison with the show dog subpopulation as this breed type is usually only sold to a
small community of dog-sport enthusiasts and not generally as household pets. It was
surprising that despite a "hybrid" status, the crossbred show and sport dog subpopulation,
along with the KUSA show dogs, expressed the least genetic diversity. The crossbred
subpopulation had a small sample size, but is also a very sp1all population, resulting in
limited genetic diversity. KUSA-bred show dogs have been bred in near isolation for many
generations and inbreeding and restricted levels of migration and gene flow have resulted
in depleted genetic diversity.
Chapter 5: Discussion - The GSD according to country of origin and breed type Page 95

Univers
ity of
Cap
e Tow
n
There was no evidence of a bottleneck event in the recent history of the South African
show dog subpopulation, however there was some statistical support for reductions in
effective population size in the other GSO subpopulations. Heterozygosity excess in post
bottleneck populations is temporary and lasts only a few generations, whereas the ratio of
allele number to range in allele size range (M) usually remains for many generations
(Luikart and Cornuet 1998, Garza and Williamson 2001).
The GSO breed has remained popular both as show stock and household pets since first
arriving in this country many decades ago, with the large population size frequently further
expanded by the importation of additional breeding stock. This immigration from Germany
could have expanded the number of rare alleles in the South African show dog
subpopulation without ini~uencing the levels of heterozygosity, thereby concealing any
heterozygosity excess that may have existed in the population (Comuet and Luikart 1996).
The KUSA-bred show dog subpopulation would have experienced a reduction in
population size when the German Shepherd Oog Federation of South Africa was
established in 1984. Prior to that date, all GSOs were registered and bred under the
auspices of KUSA, but nearly all breed enthusiasts transferred their membership to the
Federation. The crossbred show and sport dogs have had a constantly small effective
population size, for only a small number of this type is produced. The bottleneck events
detected in the two German-bred subpopulations would be reflecting founder effects
resulting from the migration of a limited number of individuals from a ml.ich larger
population, due to the continuous importation of both breed types for exhibition and
breeding purposes.
The homozygote-heterozygote proportions of the combined GSO population and the aBO
population (Fls == 0.054 and 0.104, respectively) revealed that homozygous excess in the
aBO population was nearly twice that of the GSOs. The significant level of homozygous
excess in the aBO population was purportedly due to internal substructuring, as there was
no indication of non-amplifying or silent alleles in the parentage verification analyses. It
could therefore be reasoned that this factor had less effect on the GSOs as a result of the
greater degree of movement of dogs across the country. There was significant average
differentiation between these two populations (GST == 0.103, RST == 0.058).
Chapter 5: Discussion - The GSD according to country of origin and breed type Page 96
Univers
ity of
Cap
e Tow
n
Statistical pairwise GST and RST comparisons between each GSD subpopulation and the
OBD population (mean GST and RST values of 0.060 and 0.084) reflected significant levels
of population differentiation. These data illustrated the effects of genetic drift since the
GSD breed was established just over 100 years ago.
F-statistic and Rho-statistic estimates were used to measure genetic differentiation within
and between the GSD subpopulations. The homozygote-heterozygote proportions of the
South African show, KUSA-bred show, crossbred, and German show and sport
subpopulations (Fls ::: 0.046, -0.040, 0.081, 0.046, and 0.020, respectively) revealed that
only the KUSA show dogs had no evidence of homozygous excess. There was non
significant average differentiation between the subpopulations (GST ::: 0.026, RST ::: 0.026),
although pairwise GST and RST comparisons between the subpopulations revealed varying
levels of differentiation. There was non-significant differentiation between the South African
and German show dogs (GST :: 0.007, RST :: 0.021), as sufficient migration has occurred
during past generations to provide gene flow resulting in genetic homogeneity. There was
significant differentiation between the KUSA-bred show dogs and the two German imported
subpopulations (mean GST :: 0.062, RST ::: 0.070), as the relatively small population has
been bred in near isolation for 20 years, accelerating the effects of random genetic drift.
There was significant differentiation between the German-bred imported show and sport
dogs (GST :: 0.054, RST :: 0.069), as distinct show and sport dogs have evolved from
separate breeding programmes since the 1960s, although both subpopulations have
experienced extensive levels of migration and gene flow.
The number of loci in H-W equilibrium was another method of detecting population
differentiation. H-W disequilibrium was statistically supported for the combined GSD
population, indicating intrabreed substructuring. Deviations from H-W equilibrium across
all 15 loci were significant for the South African show subpopulation (p < 0.001),
statistically supporting disequilibrium. Deviations from H-W equilibrium were not
significant for the other subpopulations and were thus in equilibrium. There was no
evidence of allele non-amplification and the GSD population is relatively large in size,
therefore these deviations were probably due to non-random mating, inbreeding and
extensive gene flow.
Chapter 5: Discussion - The GSD according to country of origin and breed type Page 97
Univers
ity of
Cap
e Tow
n
Assignment tests correctly grouped 100% of the individuals in the combined GSD
population, whereas only 96% of the OBDs were correctly assigned. This indicated that
gene flow was unidirectional, from the purebred dog population to the mongrel population.
The "breed barrier" rule prevents the inclusion of dogs in the breed database unless both
parents were registered members, although a proportion of the individuals in the OBD
population would have GSD ancestry. Only 70% of the South African show subpopulation
was correctly assigned, indicating minimal levels of differentiation due to substantial
migration and gene now from Germany to South Africa. The German sport subpopulation
had 94% of its individuals correctly assigned, indicating a moderate degree of differentiation
during the 40 years since the breed types separated.
The pairwise plots of the negative log likelihood of individuals in a subpopulation correctly
assigned to its own source population were graphic representations of the assignment test
results. The diagonal represented the probability that an individual was equally likely to be
assigned to its own or another population. Significant differentiation was indicated between
the GSD and OBD populations, although a number of OBDs had a greater likelihood of
being assigned to the GSD population, suggestive of GSD ancestry. These data also
suggested minimal differentiation between the South African and German-bred show dogs,
and moderate levels of differentiation between the show and sport dog subpopulations.
Morphological measurements where taken of 30 representative GSD show dogs, 20 sport
dogs and seven crossbred dogs, from which the average gradient of the slope of the back
of each breed type was calculated. These data indicated that show dogs conformed best
to the Breed Standard in all respects, with sport dogs tending to be smaller at the shoulder
but with 11atter topline gradients due to higher pelvic height measurements. Crossbred
dogs were tallest at the shoulder coupled with the shortest body length and an average
topline gradient halfway between the show and sport dog types. Principie component
analysis (PCA) and analysis of variance (ANOVA) of the morphological data were used to
determine the significance of the differentiation between the GSD breed types.
The total variance in the data set was effectively summarised by the first two PCA
components (86.37%). The pelvic height measurements had a high factor score on the y
axis (F2); with the other three variables having low factor scores on this axis. This
Chapter 5: Discussion - The GSD according to country of origin and breed type Page 98
Univers
ity of
Cap
e Tow
n
indicated that pelvic height was responsible for most of the variation between the breed
types. The graphical plot of the mean component scores for each type separated primarily
along the y-axis (F2), indicating that morphological variation was predominantly due to
differences in shape rather than size. The show and sport dogs were most separate, with
the crossbred dogs situated between the other breed types.
ANOVA tested the significance of differences between means in the data set of each
breed type, with probability values calculated for shoulder height (p = 0.212), body length
(p = 0.342), and pelvic height (p < 0.001) measurements. These results indicated that
shoulder height and body length were similar in all breed types, but significant variation
existed in pelvic height measurements.
The gradient of the topline (ll.y/x) of each GSD breed type was calculated according to the
average change in y-axis (difference between shoulder height and pelvic height) in relation
to the average change in x-axis (body length). Thus, significant differences in pelvic
height resulted in significantly different topline gradients. Show dogs had the lowest
average pelvic height resulting in the steepest topline gradient (0.28) and sport dogs had
the highest average pelvic height resulting in the flattest topline gradient (0.13). The
crossbred dogs had an average pelvic height between the show and sport dogs resulting
in a topline gradient (0.20) halfway between that of the two main breed types.
peA and ANOVA confirmed the existence of GSD breed types, thus morphological
analYSis revealed significant differentiation between show dogs and sport dogs with
regards to the phenotypic trait characterised as the gradient of the slope of the back.
However, molecular genetic techniques indicated only moderate levels of differentiation
between these breed types. This discrepancy could be influenced by the microsatellite
markers used not being linked to the genes responsible for the morphology and/or
temperament characteristic of each breed type. In addition, it is possible that the 40 years
since the demand for specialised dogs initiated the division in the breed has not been
sufficient for significant divergence in allele frequency distributions or for the accumulation
of private alleles in these neutral markers. Alternatively, the observed morphological
differences could be merely the result of founder effects and random genetic drift
influencing these phenotypic determinants.
Chapter 5: Discussion - The GSD according to country of origin and breed type Page 99
Univers
ity of
Cap
e Tow
n
5.3.2. Comparisons with DHs, SBTs, and other purebred dogs
Comparative analyses indicated a moderate loss of genetic diversity in the GSO
population relative to other purebred dog populations. Significant differentiation between
these breeds of dogs was indicative of genetic isolation and resultant random drift since
the establishment of each breed.
At the FH2328 microsatellite marker, lower number of alleles indicated loss of diversity in
the GSO population, with five alleles compared with eight alleles in the OH, SBT, and CB
populations, and ten in the aBO population. Two of the GSO alleles were very common,
with frequencies of 0.460 and 0.505, and the remaining three alleles were quite rare.
In comparison with other purebred dog populations, the GSO population consistently
expressed the least genetic diversity in terms of corrected number of alleles per locus,
heterozygosities, and PIC values. The OH population had both the highest corrected
number of alleles and PIC value, although the large discrepancy in observed and expected
heterozygosity suggested homozygous excess. This population consisted of three distinct
breed types, the standard short-coat, miniature short-coat and miniature long-coat OHs.
The miniature OH and other coat types were derived from the original standard short-coat
OH by outcrosses with other breeds in the last 100 years to obtain the desired phenotypic
traits, introducing much genetic diversity into the OH population. In addition, Koskinen and
Bredbacka (2000) reported that wire-haired OHs had the highest level of genetic diversity
compared with four other breeds of dogs examined. While the SBT population had both
fewer corrected number of alleles and PIC value, it did express high levels of
heterozygosity .
The alleles expressed by the purebred dog populations across all 15 microsatellite loci
were effectively a subset of those in the aBO population, with 36 alleles unique to the
aBOs. All the private alleles detected in purebred dog populations were found in those
breeds that originated in Germany_ Two of the GSO subpopulations, the German sport
dogs (alleles 88bp at INRA21 and 354bp at FH2164) and South African show dogs (alleles
297bp at AHTk253 and 185bp at FH2611), and the OH population (alleles 150bp at
FH2137, 184bp at FH2328, and 109bp at AHT121) expressed unique alleles that would
probably be more common in the German aBO population.
Chapter 5: Discussion - Comparisons with DHs, SBTs, and other purebred dogs Page 100
Univers
ity of
Cap
e Tow
n
These results indicated no significant correlation between levels of genetic diversity and
either population size or length of time since official breed recognition. This contradicted
the data reported by Irion et al. (2003), whereby the oldest and smallest breeds of dogs
tended to express the least amount of genetic diversity. The GSD breed received official
recognition with the establishment of the S.V. in 1899, with a population size of 7 990
individuals registered with KUSA and 7 415 registered with the GSD Federation of South
Africa for the period 1993 to 2003 (the German population would be much larger). The
standard short-coat DH was recognised in 1840, and the other breed types between 1886
and 1898, with a population size of 655 standard and 6 070 miniature DHs registered with
KUSA for the same period. The SBT breed was recognised in the mid 1930's, and has a
population size of 20472 individuals registered with KUSA for the same period. In terms
of corrected numbers of alleles and PIC values, the DH population expressed the highest
levels of genetic diversity despite being both the oldest and smallest breed. The SBT
population expressed the second highest levels of genetic diversity, even though it was
both the youngest and largest breed. The GSD population, intermediate in terms of
population size and time since breed recognition, consistently expressed the least genetic
diversity.
With the exception of the OBD population, the CB group expressed the highest levels of
genetic diversity. If this can be estimated as the total diversity in all purebred dog breeds
and representative of the ancestral or average population composition, then it suggested
extensive variation within different breeds. Despite relatively high levels of inbreeding and
intense selection for phenotypic uniformity, genetic diversity within the GSD, DH, SBT, and
CB populations was not considerably less than that of the OBD population, indicating only
moderate loss of genetic diversity in purebred dogs.
A mean PIC value of 0.69 (Table 5.39.), across all 15 microsatellite markers for the 'five
domestic dog populations, was revealed by this study. This value was greater than the
0.52 reported by Ostrander et al. (1993) or the 0.50 reported by Zajc et al. (1997). It was
possible that the microsatellite markers used for this research were unusually polymorphic
in nature, as 11 were chosen specifically for parentage verification. It must be taken into
consideration that microsatellite marker data can be confounded by high mutation rates
(Irion et al. 2003).
Chapter 5: Discussion - Comparisons with DHs, SBTs, and other purebred dogs Page 101
Univers
ity of
Cap
e Tow
n
There was statistical support for a bottleneck event in the recent history of the SBT
population, however there was no evidence of reductions in effective population size in the
other purebred dog populations. The GSO breed has remained widespread throughout
the world since gaining popularity after World War I, and it could be deduced that the
breed has had little or no reduction in population size. The OH breed was presumed to
experience bottleneck events after each World War, allthough these may not have been
detected because a new equilibrium would be attained after a number of generations. In
addition, if the population numbers increased rapidly after the event, then surprisingly little
diversity can have been lost. The modern SBT only developed as a companion dog after
receiving official recognition in the 1930's, and becoming extremely popular in the latter
half of the 20th century. This popularity has ensured a consistently large effective
population size to date.
The homozygote-heterozygote proportions in the GSO, OH, SBT, and CB populations
(Fls ::: 0.054, 0.248, 0.053, and 0.252, respectively) indicated homozygous excess in all
purebred dogs, most especially the OHs and CB group. There was a significant average
differentiation between these populations (GST ::: 0.158, RST ::: 0.160); however, the
estimates were less when the purebred dogs were compared with the aBO population
(GST::: 0.092, RST::: 0.069). This would be indicative of the outbred heterogeneous nature
of the founding individuals of many breeds of dogs. The pairwise GST and RST values
consistently indicated significant differentiation (mean GST ::: 0.178, RST ::: 0.179) between
the GSO, OH, and SBT populations, and between these populations and the aBOs (mean
GST ::: 0.070, RST::: 0.059). However, non-signi'f!cant differentiation between the CB group
and the aBO population (GST ::: 0.010, RST ::: 0.005) was indicative of the diverse nature of
the founding populations with much interbreeding prior to the relatively recent origin of
many modern breeds of dogs. The degree of population differentiation (GST ::: 0.092)
among the purebred and mongrel dog populations reported in this study was similar to that
detected (GST ::: 0.088) among the three main races of man, the Negroid, Mongoloid, and
Caucasoid (Jordana et a/. 1992). These high values of GST and RST are indicative of the
occurrence of rapid genetic drift due to small population sizes.
Chapter 5: Discussion - Comparisons with DHs, SBTs, and other purebred dogs Page 102
Univers
ity of
Cap
e Tow
n
The number of loci in H-W equilibrium was another method of detecting population
differentiation. Deviations from H-W equilibrium were statistically supported (p < 0.001) for
the GSD, DH, and CB populations. This disequilibrium was indicative of intrabreed
substructuring possibly due to the effects of inbreeding, the genetic isolation of individual
breed types in the GSD and DH populations, and non-random mating associated with the
breeding strategies used by dog breeders, and limited sample sizes. The deviations from
equilibrium were not significant for the SBT population, and the breed was thus in H-W
equilibrium. Therefore, despite moderately low levels of genetic diversity, there has been
negligible inbreeding over recent generations and the breeding strategy used has been
optimal. The SBT breed has a very large population size in South Africa, and originated
relatively recently from diverse founding individuals bred primarily for performance.
Assignment tests correctly grouped almost all individuals in the GSD, DH, and SBT
populations, indicting significant differentiation among these breeds. However, only 81% of
the individuals in the CB group were correctly assigned, indicating a certain degree of
homogeneity within the founding individuals of the various breed populations. The "breed
barrier" rule ensures that gene flow is unidirectional, 'from the purebred dog populations to
the mongrel population, with a proportion of aBD individuals having GSD, DH, or SBT
ancestry, as indicated by the fact that only 84% of the aBD population was correctly
assigned to its own source population.
The pairwise plots of the negative log likelihood of individuals in each purebred dog
population being assigned to its own source population were graphic representations of the
these assignment test results, and indicated moderate to signi'flcant levels of differentiation
between the GSD, DH, SBT, CB, and aBD populations.
Chapter 5: Discussion - Comparisons with DHs, SBTs, and other purebred dogs Page 103
Univers
ity of
Cap
e Tow
n
5.4. Conclusions
The GSD breed could not be described as highly inbred, and does not appear to be in
imminent danger of inbreeding depression or drastic loss of variation. Although, care must
be taken in the future not to further decrease the current levels of genetic diversity.
Dog breeders would obviously intend mating their bitches with the best available stud
dogs, however it must be taken into consideration that overusing a single dog could be
detrimental to the breed as a whole. More effective levels of communication would
perhaps result in the imported dogs being as unrelated as possible, many different
bloodlines being brought into the country would provide a broader base from which
breeders could choose a stud dog. It is a considerable ·financial investment to import good
quality breeding stock and, considering the exchange rate, the purchase of a single dog
could run to several hundred thousand rands. To receive a return on this investment, stud
dog owners tend to accept as many matings as possible and are not likely to turn down
enquiries for the use of their dog.
It must therefore be the responsibility of the breeder to take levels of genetic diversity into
consideration when choosing a stud dog. One possible approach for the management of
the genetic health of the breed would be to make use of the already available molecular
data, with 12 microsatellite markers being routinely analysed for parentage verification.
That is to say, if the breeder were to choose a selection of potential stud dogs according to
the mental and phYSical traits that would best complement their bitch, but then permitted
the final deciding factor to be the dog that contributed the most genetic diversity to the
offspring as determined by these neutral markers. This would facilitate the preservation of
genetic diversity in the breed.
The results of this study demonstrated that purebred dog populations are complex in
nature. Many factors contribute to the observed genetic diversity, for although breeds of
dogs are strictly selected for phenotypic traits, the breeds investigated were more
heterogeneous than would have been expected from the analysis of their pedigrees.
Chapter 5: Discussion - Conclusions Page 104

Univers
ity of
Cap
e Tow
n
Chapter 6
References
Adler, lolo (1975) This is the Dachshund. T.F.H. Publications Inc Ltd., pp. 22 - 35.
Aguirre, G.O., Ray, K. and Acland, G.M. (1999) Overview of the International Workshop
on Canine Genetics. Journal of Heredity 90: 1 - 2.
Altet, lo, Francino, O. and Sanchez, A. (2001) Microsatellite Polymorphism in Closely
Related Dogs. Journal of Heredity 92: 276 - 279.
Belyaev, O.K. (1969) Domestication of animals. Science JournalS: 47 - 52.
Belyaev, O.K. (1978) Destabilizing selection as a factor in domestication. Journal of
Heredity 10: 301 - 308.
Balloux, F. and Goudet, J. (2002) Statistical properties of population differentiation
estimators under stepwise mutation in a finite island model. Molecular Ecology 11: 771
-783.
Bininda-Emonds, O.R.P, Gittleman, J.lo and Purvis, A. (1999) Building large trees by
combining phylogenetic information: a complete phylogeny of the extant Carnivora
(Mammalia). Biology Review 14: 143 - 175.
Brewer, G.J. and Sing, C.F. (1983) Genetics. Addison-Wesley Publishing, pp. 594 - 631.
Brooks, M. and Sargan, O.R. (2001) Genetic Aspects of Disease in Dogs. In: The
Genetics of the Dog (ed. Ruvinski, A. and Sampson, J.) CABI Publishing International,
pp. 191 - 266.
Brouillette, J.A. and Venia, P.J. (2002) Within-breed heterozygosity of canine single
nucleotide polymorph isms identified by across-breed comparison. Animal Genetics 33:
464 - 467.
Bruford, M.W. and Wayne, R.K. (1993) Microsatellites and their application to population
genetic studies. Current Opinion in Genetics and Development 3: 939 - 943.
Chakraborty, R. and Nei, M. (1982) Genetic differentiation of quantitative characters
between populations of species. Genetical Research Cambridge 39: 303 - 314.
Cloete, M. (2001) The wolf in every dog. In: Southern Africa's Dog Directory. Animaltalk
Panorama Publications (Pty) Ltd., pp. 14 - 18.
Chapter 6: References Page 105
Univers
ity of
Cap
e Tow
n
Clutton-Brock, J. (1977) Man-made dogs. Science 197: 1340 - 1342.
Coppinger, R.P., Glendinning, J., Torop, E., Matthay, C., Sutherland, M. and Smith, C.
(1987) Degree of behavioural neoteny differentiates canid polymorphs. Ethology 75: 89
- 108.
Comuet, J.-M. and Luikart G. (1996) Description and power analysis of two tests for
detecting recent population bottlenecks from allele frequency data. Genetics 144: 2001
- 2014. Available at http://www.montpellier.inra.fr/URLB/bottlenecklbottleneck.html.
Darwin, C.R. (1859) The Origin of Species. Bantam Books. pp. 16 - 19.
Elliott, N. (1968) The Complete Alsatian (German Shepherd Dog). Kaye & Ward Ltd. pp.
3 -25.
Francisco, l.V., langston, A.A., Mellersh, C.S., Neal, C.l. and Ostrander, E.A. (1996)
A class of polymorphic tetranucleotide repeats for canine genetic mapping.
Mammalian Genome 7: 395 - 362.
Fredholm, M. and Winter", A.K. (1995) Variation of short tandem repeats within and
between species belonging to the Canidae family. Mammalian Genome 6: 11 - 18.
Fry, J.C. (1993) Biological Data Analysis: A Practical Approach. Oxford University Press.
pp.1 - 30,102,184 - 202.
GaUbert, F., Wilton, A. and Chuat, J-C. (2001) Canine Model in Medical Genetics. In:
The Genetics of the Dog (ed. Ruvinski, A. and Sampson, J.) CABI Publishing
International, pp. 505 - 520.
Garza, J.C. and Williamson, E.G. (2001) Detection of reduction in population size using
data from microsatellite loci. Molecular Ecology 10: 305 - 318.
Gordon, J.f. (1986) The Staffordshire Bull Terrier. Popular Dogs Publishing Co. Ltd., pp.
13 - 36.
Goudet, J. (1995) FSTAT Version 1.2. A computer program to calculate F-statistics.
Journal of Heredity 86: 485 - 486. Available at http://www.unil.ch/izea/softwares/
fstat. html.
Harley, E.H. (2001) AGARst. A program for calculating allele frequencies, GST and RST
from microsatellite data, Version 2.0. University of Cape Town, Cape Town.
Hughes, S. (1998) STR and nucleic acid analysis software. Davis: University of
California. Available at http://www.vgLucdavis.edu/STRand.
Chapter 6: References Page 106
Univers
ity of
Cap
e Tow
n
Hunter, J., Clanbrassil, Herbert, Mears, Wm. (1787) Observations tending to show that
the wolf, jackal, and dog are all of the same species. Philosophical Transactions of the
Royal Society of London 11: 253 - 266.
Irion, D.N., Schaffer, A.l., Famula, T .R., Eggleston, M.l., Hughes, S.S. and Pedersen,
N.C. (2003) Analysis of Genetic Variation in 28 Dog Breed Populations With 100
Microsatellite Markers. Journal of Heredity 94: 81 - 87.
Jordana, J., Piedrafita, J., Sanchez, A. and Puig, P. (1992) Comparative F Statistics of
the Genetic Structure of Ten Spanish Dog Breeds. Journal of Heredity 83: 367 - 374.
Jouquand, S., Priat, C., Hitte, C., Lachaume, P., Andre, C. and GaUbert, F. (2000)
Identification and characterisation of a set of 100 tri- and dinucleotide microsatellites in
the canine genome. Animal Genetics 31: 266 - 272 .
. Kern, F. G. (1994) German Shepherd Dogs. T.F.H. Publications, Inc., pp. 8 - 22.
Klug, W.S. and Cummings, M.R. (1994) Concepts of Genetics, Fourth Edition. Prentice
Hall. Englewood Cliffs, pp 731 - 775.
Koskinen, M.T. (2003) Individual assignment using microsatellite DNA reveals
unambiguous breed identification in the domestic dog. Animal Genetics 34: 297 - 301.
Koskinen, M.T. and Bredbacka, P. (2000) Assessment of the Population Structure of
Five Finnish Dog Breeds with Microsatellites. Animal Genetics 31: 310 - 317.
Leonard, J.A., Wayne, R.K., Wheeler, J., Valadez, R., Guillen, S. and Vila, C. (2002)
Ancient DNA evidence for Old World origin of New World dogs. Science 298: 1613 - 16.
Luikart, G., Allendorf, F.W., Comuet, J.M. and Sherwin, W.B. (1998a) Distortion of
allele frequency distributions provides a test for recent population bottlenecks. Journal
of Heredity 89: 238 - 247.
Luikart, G. and Cornuet, J.M. (1998) Empirical evaluation of a test for identifying recently
bottlenecked populations from allele frequency data. Conservation Biology 12: 228 -
237.
Luikart, G., Sherwin, W.B., Steele, B.M. and Allendorf, F.W. (1998b) Usefulness of
molecular markers for detecting population bottlenecks via monitoring genetic change.
Molecular Ecology 7: 963 - 974.
Miller, S.A., Dykes, D.O., Polesky, H.F. (1988) A simple salting out procedure for
extracting DNA from human nucleated cells. Nucleic Acids Research 16: 1215 - 1215.
Chapter 6: References Page 107
Univers
ity of
Cap
e Tow
n
II
Montagu, M.F. (1942) On the origin of the domestication of the dog. Science 96: 111-112.
Morera, L., Barba, C.J., Garrido, J.J., Barbancho, M. and de Andres, D.F. (1999)
Genetic Variation Detected by Microsatellites in Five Spanish Dog Breeds. Journal of
Heredity 90: 654 - 656.
Morey, D.F. and Wiant, M.D. (1992) Early Holocene domestic dog burials from the North
American Midwest. Current Anthropology 33: 224 - 229.
Muller, S., Flekna, G., Muller, M. and Brem, G. (1999) Use of Canine Microstatellite
Polymorph isms in Forensic Examinations. Journal of Heredity 90: 55 - 56.
Nei, M. (1977) F-statistics and the analysis of gene diversity in subdivided populations.
Annals of Human Genetics 41: 225 - 233.
Nei, M. and Chesser, R.K. (1983) Estimation of fixation indices and gene diversities.
Annals of Human Genetics 47: 253 - 259.
Nicholas, A.K. and Foy, M.A. (1987) The Dachshund. T.F.H. Publications Inc., pp. 9 - 10.
Olsen, S.J. and Olsen, J.W. (1977) The Chinese Wolf, ancestor of New World dogs.
Science 197: 533 - 535.
Ostrander, E.A., GaUbert, F. and Mellersh, C.S. (2001) Linkage and Radiation Hybrid
Mapping in the Canine Genome. In: The Genetics of the Dog (ed. Ruvinski, A. and
Sampson, J.) CABI Publishing International, pp. 15 - 39.
Ostrander, E.A., Galibert, F. and Patterson, D.F. (2000) Canine genetics comes of age.
Trends in Genetics 16: 117 - 124.
Ostrander, E.A. and Kruglyak, L. (2000) Unleashing the canine genome. Genome
Research 10: 1271 - 1274.
Ostrander, E.A., Sprague, G.F. and Rine, J. (1993) Identification and characterisation of
dinucleotide repeat (CA)n markers for genetic mapping in dogs. Genomics 16: 207-213
Palmer, J. (1981) An Illustrated Guide to Dogs. Salamander Books Ltd., pp. 32,40 - 41.
Park, S.D.E. (2001) Trypanotolerance in West African Cattle and the Population Genetic
Effects of Selection [Ph. D. theSis] University of Dublin. Available at
http://acer. gen. tcd. ie/ .... sdeparklms-tool kit!.
Parker, H.G., Kim, L.V., Sutter, N.B., Carlson, S., lorentzen, T.D., Malek, T.B.,
Johnson, G.S., DeFrance, H.B., Ostrander, E.A. and Kruglyak, L. (2004) Genetic
structure of the purebred domestic dog. Science 304: 1160 - 1164.
Chapter 6: References Page 108
Univers
ity of
Cap
e Tow
n
Pihkanen, S. Vainola, R. and Varvio, S. (1996) Characterising dog breed differentiation
with microsatellite markers. Animal Genetics 27: 343 - 346.
Piry, S., Luikart, G. and Cornuet, J.M. (1999) BOTTLENECK: a computer program for
detecting recent reductions in the effective population size using allele frequency data.
Journal of Heredity 90: 502 - 503.
Price, E.O. (1984) Behavioural aspects of animal domestication. Quarterly Review of
Biology 59: 1 - 32.
Raine, K. (1989) All About the Dachshund. Stephen Greene Press, pp. 9 - 47.
Raymond, M. and Rousset, F. (1995a) An exact test for population differentiation.
Evolution 49: 1280 - 1283.
Raymond, M. and Rousset, F. (1995b) GENEPOP (version 1.2): Population genetics
software for exact tests and ecumenicism. Journal of Heredity 86: 248 - 249.
Available by anonymous FTP at ftp.cefe.cnrs-mop.fr.
Rice, W.R. (1989) Analysing tables of statistical tests. Evolution 43: 223 - 225.
Richman, M., MeUersh, C.S., Andre, C., GaUbert, F. and Ostrander, E.A. (2001)
Characterisation of a minimal screening set of 172 microsatelfite markers for genome
wide screens of the canine genome. Journal of Biochemical and Biophysical Methods
47: 137 - 149.
Rousset, F. and Raymond, M. (1995) Testing heterozygote excess and deficiency.
Genetics 140: 1413 -1419.
Roy, M.S., Geffin, E., Smith, D., Ostrander, E.A. and Wayne, R.K. (1994) Patterns of
differentiation and hybridisation in North American wolf-like canids, revealed by
analysis of microsatellite loci. Molecular Biology and Evolution 11: 553 - 570.
Ruzzante, D.E. (1998) A comparison of several measures of genetic distance and
population structure with microsatellite data: bias and sampling variance. Canadian
Journal of Fishery and Aquatic Science 55: 1 - 9.
Samadi, S., Erard, F., Estoup, A. and Jame, P. (1998) The influence of mutation,
selection and reproductive systems on microsatellite variability: a simulated approach.
Genetic Research 71: 213 - 222.
Savoiainen, P., Zhang, Y., Luo, J., Lundeberg, J. and Leitner, T. (2002) Genetic
evidence for an East Asian origin of domestic dogs. Science 298: 1610 -1613.
Chapter 6: References Page 109
Univers
ity of
Cap
e Tow
n
Scanziani, P. (1988) The World Encyclopaedia of Dogs. MacDonald & Co. Ltd., pp. 32 -
33,80,96.
Slatkin, M. (1995) A measure of population subdivision based on microsatellite allele
frequencies. Genetics 139: 457 - 462.
Stallings, R.l., Ford, A.F., Nelson, D., Torney, D.C., Hildebrand, C.E. and Moyzis,
R.K. (1991) Evolution and distribution of (GT)n repetitive sequences in mammalian
genomes. Genomics 10: 807 - 815.
Trut, l.N. (2001) Experimental Studies of Early Canid Domestication. In: The Genetics of
the Dog (ed. Ruvinski, A. and Sampson, J.) CABI Publishing International, pp. 15 - 39.
Tsuda, K., Kikkawa, Y., Yonekawa, H. and Tanabe, Y. (1997) Extensive interbreeding
occurred between multiple matriarchal ancestors during the domestication of dogs:
evidence from inter- and intraspecies polymorph isms in the D-Ioop region of
mitochondrial DNA between dogs and wolves. Genes and Genetic Systems 72: 229 -
238.
Van der lyn, E. (1995) Dachshunds. T.F.H. Publications Inc., pp. 8 - 20.
Vila, C., Maldonado, J.E. and Wayne, R.K. (1999) Phylogenetic relationships, evolution
and genetic diversity of the domestic dog. Journal of Heredity 90: 71 - 77.
Vila, C., Savolainen, P., Maldonado, J.E., Amorim, I.R., Rice, J.E., Honeycutt, R.l.,
Crandall, K.A., lundeberg, J. and Wayne, R.K. (1997) Multiple and ancient origins of
the domestic dog. Science 276: 1687 - 1689.
Vucetich, J.A. and Waite, T.A. (2000) Is one migrant per generation sufficient for the
genetic management of fluctuating populations? Animal Conservation 3: 261 - 266.
Wayne, R.K. (1993) Molecular evolution of the dog family. Trends in Genetics 9:218-224.
Wayne, R.K., Geffen, E., Girman, D.J., Koepfli, K.P., lau, l.M. and Marshall, C.R.
(1997) Molecular Systematics of the Can idae. Systematic Biology 4: 622 - 653.
Wayne, R.K., lehman, N., Allard, M.W. and Honeycutt, R.l. (1992) Mitochondrial DNA
variability of the gray wolf: Genetic consequences of population decline and habitat
'fragmentation. Conservation Biology 6: 559 - 569.
Wayne, R.K. and O'Brien, S.J. (1987) Allozyme divergence within the Canidae.
Systematic Zoology 36: 339 - 355.
Chapter 6: References Page 110
Univers
ity of
Cap
e Tow
n
Wayne, R.K. and Ostrander, E.A. (1999) Origin, genetic diversity, and genome structure
of the domestic dog. BioEssays 21: 247 - 257.
Wayne, R.K. and Vila, C. (2001) Phylogeny and origin of the domestic dog. In: The
genetics of the dog (ed. Ruvinski, A. and Sampson, J.) CABI Publishing Int., pp. 1 - 13.
Weir, B.S. and Cockerham, C.C. (1984) Estimating F-statistics for the analysis of
population structure. Evolution 38: 1358 - 1370.
Willis, M.B. (1977) The German Shepherd Dog its history, development and genetiCS.
Arco Publishing Company, Inc., pp. 19 - 32.
Wilton, A.N., Steward, D.J. and Zafiris, K. (1999) Microsatellite variation in the Australian
dingo. Journal of Heredity 90: 108 - 111.
Wright, S. (1965) The interpretation of population structure by F-statistics with special
regard to systems of mating. Evolution 19: 395 - 420.
Wurster-Hill, D.H. and CenterwaII, W.R. (1982) The interrelationships of chromosome
banding patterns in canids, mustelids, hyena, and felids. Cytogenetics and Cell
Genetics 34: 178 - 192.
Zajc, I., Mellersh, C.S. and Sampson, J. (1997) Variability of canine microsatellites
within and between different dog breeds. Mammalian Genome 8: 182 - 185.
Zajc, I. and Sampson, J. (1996) DNA microsatellites in domesticated dogs: application in
paternity disputes. Pflugers Archives - European Journal of Physiology 431: 201 - 202.
Zajc, I. and Sampson, J. (1999) Utility of canine microsatellites in revealing the
relationships of purebred dogs. Journal of Heredity 90: 104 - 107.
Chapter 6: References Page 111
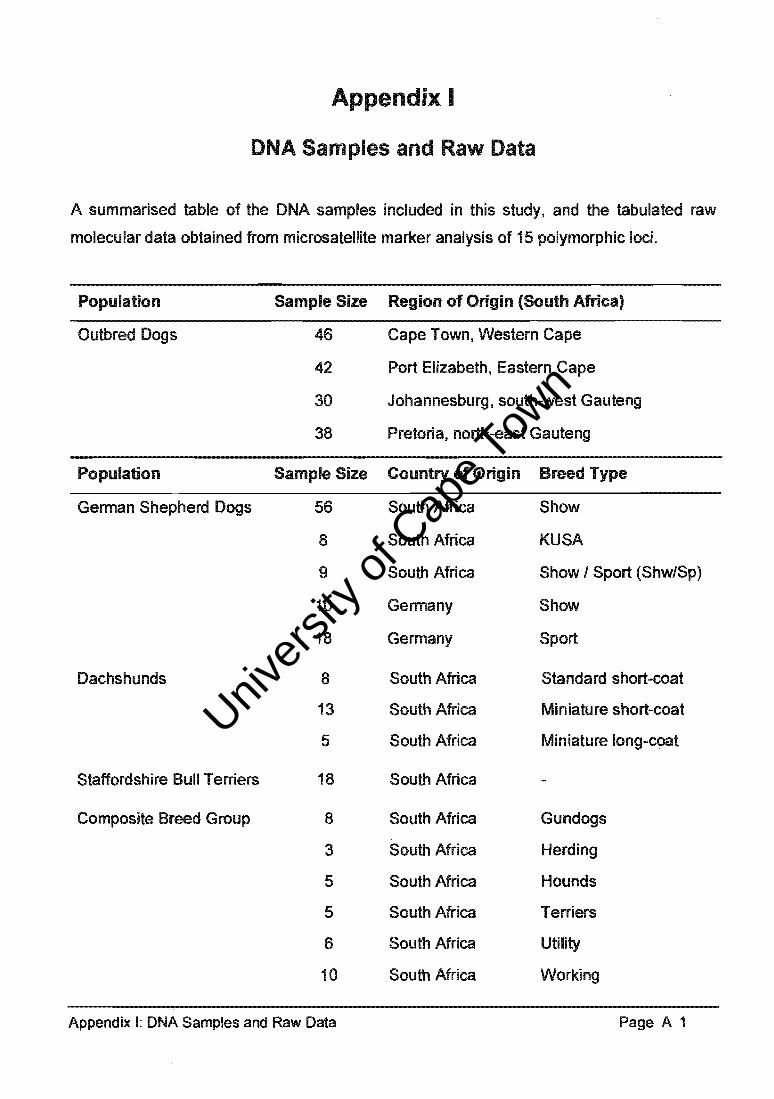
Univers
ity of
Cap
e Tow
n
Appendix I
DNA Samples and Raw Data
A summarised table of the DNA samples included in this study, and the tabulated raw
molecular data obtained from microsatellite marker analysis of 15 polymorphic loci.
Population Sample Size Region of Origin (South Africa)
Outbred Dogs 46 Cape Town, Western Cape
42 Port Elizabeth, Eastern Cape
30 Johannesburg, south-west Gauteng
38 Pretoria, north-east Gauteng
Population Sample Size Country of Origin Breed Type
German Shepherd Dogs 56 South Africa Show
8 South Africa KUSA
9 South Africa Show I Sport (Shw/Sp)
10 Germany Show
18 Germany Sport
Dachshunds 8 South Africa Standard short-coat
13 South Africa Miniature short-coat
5 South Africa Miniature long-coat
Staffordshire Bull Terriers 18 South Africa
CompOSite Breed Group 8 South Africa Gundogs
3 South Africa Herding
5 South Africa Hounds
5 South Africa Terriers
6 South Africa Utility
10 South Africa Working
Appendix I: DNA Samples and Raw Data Page A 1

University of Cape Town
Sample Origin DTRCN1 fH2131 fH2140 fH2328 AHT121 INRA21 AHTh111 AHTk253 CXX219 fH2001 fH2164 fH2611 fH2241 fH2289 PEZOS
OB0001 Cape Town 140 106 174 162 131 131 196 188 99 99 102 98 138 138 293 287 127 115 136 128 322 318 201 201 203 203 295 283 235 219
OBOOO2 Cape Town 144 94 188 174 141 131 188 180 101 93 98 98 138 130 287 287 125 117 144 128 346 314 209 209 207 187 295 287 231 223
060003 Cape Town 144 98 182 182 149 145 200 196 103 101 100 94 130 124 291 285 123 117 144 128 322 298 209 205 243 207 347 215 235 231
OBOOO4 Cape Town 140 136 178 170 145 141 204 188 107 95 98 98 138 130 289 287 119 117 128 128 326 314 213 209 251 243 303 295 235 231
o B0005 Cape Town 140 110 178 174 137 137 196 192 103 103 100 96 130 124 291 287 123 117 144 140 322 314 217 191 227 203 295 271 227 227
060006 Cape Town 140 132 162 158 145 131 200 188 101 93 90 90 136 130 291 291 125 115 158 140 326 322 209 209 243 207 319 295 231 227
060007 Cape Town 136 102 182 174 I'll 137 192 188 101 95 92 90 138 130 289 287 125 115 144 128 322 306 209 201 231 203 331 295 227 223
06000B Cape Town 144 102 182 170 131 133 188 188 101 97 98 98 132 122 291 287 117 115 148 128 322 322 205 201 207 207 299 283 235 227
060009 Cape Town 140 132 162 162 137 137 192 188 105 97 90 90 126 124 287 283 117 115 144 128 328 314 229 201 223 191 295 275 239 223
060010 Cape Town 136 132 188 162 165 137 208 196 101 99 94 94 130 124 287 287 125 113 144 128 322 322 201 201 223 223 291 287 231 231
060011 Cape Town 144 144 182 182 137 137 208 188 103 91 96 90 140 128 289 287 129 117 140 136 322 314 209 209 243 207 295 291 231 231
OBOO12 Cape Town 136 98 178 162 137 137 192 180 107 91 96 96 138 124 291 287 129 115 152 144 314 274 205 201 243 199 331 295 231 231
OBOO13 Cape Town 144 110 182 166 137 137 196 192 107 95 92 90 142 132 287 287 117 117 144 136 334 314 205 201 207 203 303 291 239 231
OBOO14 Cape Town 144 136 174 166 I'll 137 196 188 105 101 92 90 132 130 287 285 125 125 144 128 318 318 213 191 243 211 291 291 235 227 I
OB0015 Cape Town 132 106 170 166 157 129 204 200 107 103 96 92 134 134 289 287 127 121 144 144 322 318 201 197 203 199 295 283 239 235 i
OBOO16 Cape Town 144 94 182 162 157 137 196 188 101 101 96 96 140 130 291 283 123 123 144 144 318 310 221 197 235 203 295 281 227 223
OBOO17 Cape Town 140 98 188 182 137 137 188 188 105 101 96 90 142 142 291 291 117 117 136 128 322 314 201 191 243 231 291 281 223 223
OBOO18 Cape Town 106 106 182 166 165 133 204 196 105 91 94 92 136 134 289 287 117 117 144 140 322 314 209 197 231 183 343 283 235 227 I 060019 Cape Town 98 98 166 166 137 137 208 206 107 91 96 94 134 134 289 287 123 117 140 140 322 314 209 201 239 227 299 295 235 219
060020 Cape Town 132 106 170 110 137 133 212 180 101 97 90 66 134 132 287 287 117 115 144 128 322 318 209 209 251 215 295 283 235 223
060021 Cape Town 140 140 178 170 141 137 208 192 105 101 94 66 124 124 291 287 117 115 148 128 330 314 209 201 203 199 295 295 223 223
060022 Cape Town 144 106 186 178 165 137 192 188 103 101 92 92 0 0 0 0 117 115 0 0 318 318 197 197 215 215 291 283 239 239
060023 Cape Town 136 132 110 162 133 133 196 196 101 91 102 96 134 130 289 289 117 115 144 144 318 310 209 197 203 203 343 291 243 235
060024 Cape Town 132 132 178 166 161 129 208 188 99 97 96 90 140 124 287 287 125 115 140 128 322 322 213 213 251 227 307 299 227 223
060025 Cape Town 132 132 186 166 137 137 208 196 105 105 100 92 140 130 291 287 123 117 144 128 348 322 205 201 207 203 335 283 235 231
OBOO26 Cape Town 140 132 166 170 149 141 204 200 99 97 94 90 134 130 287 287 123 123 140 140 318 298 213 201 235 203 303 291 231 227
OB0027 Cape Town 108 108 166 166 165 137 208 196 103 95 96 92 142 130 291 291 123 119 140 140 342 314 209 197 231 227 335 299 243 235
060028 Cape Town 138 132 166 166 157 133 196 192 103 97 102 66 122 122 291 287 123 115 144 128 314 302 201 193 231 187 347 283 227 223
06D029 Cape Town 136 102 194 188 137 137 208 200 99 99 90 90 130 124 291 289 123 117 144 140 318 274 209 205 247 195 279 279 235 227
060030 Cape Town 136 106 166 166 141 137 200 186 107 99 100 90 130 124 289 289 131 117 152 144 314 314 209 201 207 203 351 295 235 223
060031 Cape Town 144 144 170 158 157 133 208 200 101 95 90 86 140 132 291 287 123 123 140 128 316 318 201 201 239 231 299 299 235 223
060032 Cape Town 144 136 178 162 145 137 208 166 97 93 100 94 136 124 291 283 111 113 140 132 326 318 213 197 247 215 291 279 235 235
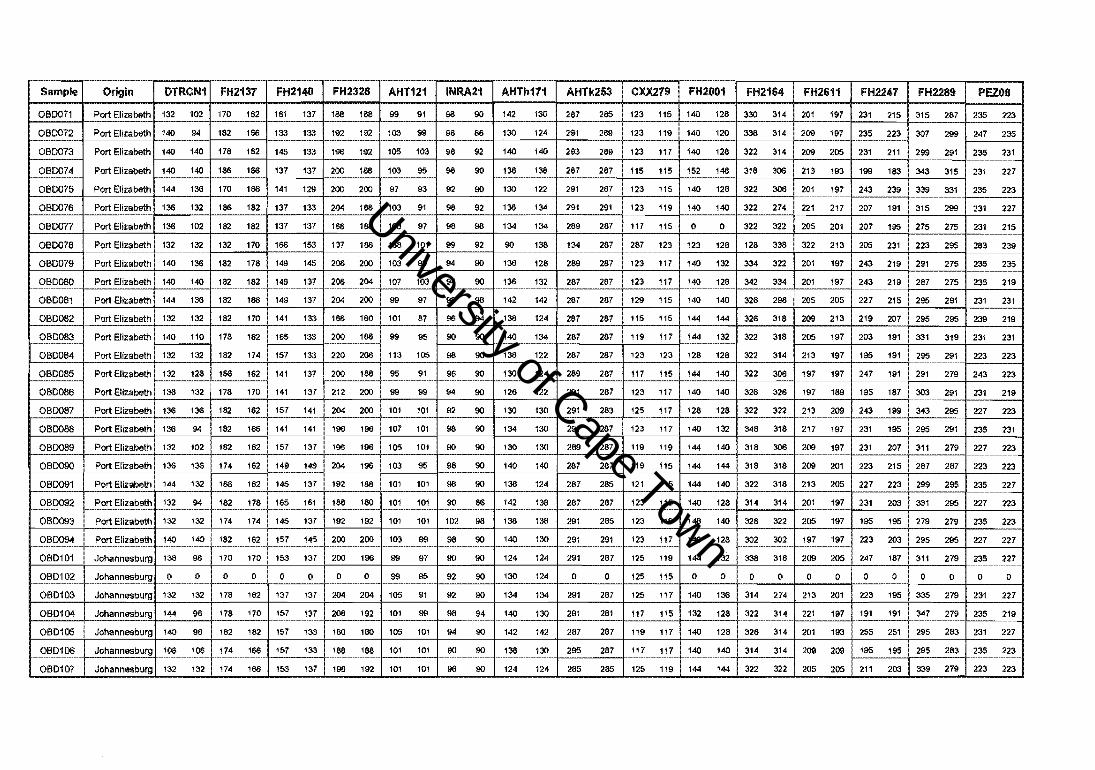
University of Cape Town
Sample Origin DTRCN1 FH2137 FH2140 FH2328 AHT121 INRA21 AHTh111 AHTk253 CXX219 FH2001 FH2164 FH2611 FH2241 FH2289 PEZ08
OB0071 Port Elizabeth 132 102 170 162 161 137 168 168 99 91 98 90 142 130 287 285 123 115 140 128 330 314 201 197 231 215 315 287 235 223
OBOO72 Port Elizabeth 140 94 182 168 133 133 192 192 103 99 98 68 130 124 291 289 123 119 140 120 338 314 209 197 235 223 307 299 247 235
OB0073 Port Elizabeth 140 140 178 162 145 133 196 192 105 103 98 92 140 140 293 289 123 117 140 128 322 314 209 205 231 211 299 291 235 231
OB0074 Port Elizabeth 140 140 168 168 137 137 200 168 103 95 98 90 138 138 287 287 115 115 152 148 318 306 213 193 199 183 343 315 231 227
080075 Port Elizabeth 144 138 110 168 141 129 200 200 97 93 92 90 130 122 291 287 123 115 140 128 322 306 201 197 243 239 339 331 235 223
060076 Port Elizabeth 138 132 168 182 137 133 204 168 103 91 98 92 138 134 291 291 123 119 140 140 322 274 221 217 207 191 315 299 231 227
OBOOn Port Elizabeth 138 102 182 182 137 137 168 168 103 97 98 98 134 134 289 287 117 115 0 0 322 322 205 201 207 195 275 275 231 215
OB0078 Port Elizabeth 132 132 132 170 168 153 137 168 168 101 99 92 90 138 134 287 287 123 123 128 128 338 322 213 205 231 223 295 283 239
OB0079 Port Elizabeth 140 138 182 178 149 145 208 200 103 95 94 90 138 128 289 287 123 117 140 132 334 322 201 197 243 219 291 275 235 235
060080 Port Elizabeth 140 140 182 182 149 137 208 204 107 103 94 90 136 132 287 287 123 117 140 128 342 334 201 197 243 219 287 275 235 219
OB0081 Port Elizabeth 144 136 182 166 149 131 204 200 99 97 98 98 142 142 287 281 129 115 140 140 326 298 205 205 227 215 295 291 231 231
060082 Port Elizabeth 132 132 182 170 141 133 188 180 101 87 98 94 138 124 287 287 115 115 144 144 326 318 209 213 219 201 295 295 239 219
08D083 Port Elizabeth 140 110 178 162 185 133 200 168 99 95 90 90 140 134 287 287 119 117 144 132 322 318 205 197 203 191 331 319 231 231
OB0084 Port Elizabeth 132 132 182 174 151 133 220 208 113 105 98 90 138 122 287 287 123 123 128 128 322 314 213 197 195 191 295 291 223 223
OBD085 Port Elizabeth 132 128 166 162 141 131 200 188 95 91 96 90 130 124 289 287 117 115 144 140 322 300 197 197 247 191 291 279 243 223
OBOO86 Port Elizabeth 136 132 178 170 141 131 212 200 99 99 94 90 126 122 291 287 123 117 140 140 326 326 197 189 195 187 303 291 231 219
OBD087 Port Elizabeth 138 136 182 162 157 141 204 200 101 101 92 90 130 130 291 283 125 117 128 128 322 322 213 209 243 199 343 295 227 223
OBOO88 Port Elizabeth 138 94 182 166 141 141 198 198 107 101 98 90 134 130 291 287 123 117 140 132 346 318 217 197 231 195 295 291 235 231
OBD089 Port Elizabeth 132 102 162 162 157 137 198 198 105 101 90 90 130 130 289 287 119 119 144 140 318 306 209 197 231 207 311 279 227 223
08D090 Port Elizabeth 136 138 174 162 149 149 204 198 103 95 98 90 140 140 287 287 119 115 144 144 318 318 209 201 223 215 287 287 223 223
08D091 Port Elizabeth 144 132 166 162 145 137 192 188 101 101 98 90 138 124 287 285 121 115 144 140 322 318 213 205 227 223 299 295 235 227
OBOO92 Port Elizabeth 132 94 182 178 185 161 188 180 101 101 90 86 142 138 287 287 123 115 140 128 314 314 201 197 231 200 331 295 227 223
OBD093 Port Elizabeth 132 132 174 174 145 137 192 192 101 101 102 98 138 138 291 285 123 119 148 140 326 322 205 197 195 195 279 279 235 223
OBD094 Port Elizabeth 140 140 182 162 157 145 200 200 103 99 98 90 140 130 291 291 123 117 140 128 302 302 197 197 223 203 295 295 227 227
080101 Johannesburg 138 98 170 170 153 137 200 196 99 97 90 90 124 124 291 287 125 119 144 132 338 318 209 205 241 187 311 279 235 227
080102 Johannesburg 0 0 0 0 0 0 0 0 99 95 92 90 130 124 0 0 125 115 0 0 0 0 0 0 0 0 0 0 0 0
OB0103 Johannesburg 132 132 178 162 137 137 204 204 105 91 92 90 134 134 291 287 125 117 140 138 314 274 213 201 223 195 335 279 231 227
OBD104 Johannesburg 144 98 178 170 157 137 208 192 101 99 98 94 140 130 291 281 117 115 132 128 322 314 221 197 191 191 347 279 235 219
OB0105 Johannesburg 140 98 182 182 157 133 180 180 105 101 94 90 142 142 287 287 119 117 140 128 326 314 201 193 255 251 295 283 231 227
080106 Johannesburg 100 106 174 166 157 133 168 188 101 101 90 90 138 130 295 287 117 117 140 140 314 314 209 209 195 195 295 283 235 223
OB0107 Johannesburg 132 132 174 166 153 137 196 192 101 101 98 90 124 124 285 285 125 119 144 144 322 322 205 205 211 203 339 279 223 223

University of Cape Town
Sample Origin DTRCN1 fH2131 fH2140 fH2328 AHT121 INRA21 AHTh111 AHTk253 CXX219 fH2001 fH2164 fH2611 fH2241 fH2289 PEZ08
06D108 Johannesburg 140 128 170 162 157 137 204 180 97 93 96 92 130 124 291 287 127 123 144 144 314 302 201 197 231 207 299 271 235 223
06D109 Johannesburg 136 106 182 162 153 137 212 200 101 97 96 90 134 124 289 287 123 119 140 136 322 302 209 201 255 203 295 291 231 223
OBD110 Johannesburg 140 136 166 162 137 133 204 168 101 101 94 90 136 136 0 0 119 117 0 0 0 0 0 0 0 0 0 0 0 0
OBD111 Johannesburg 140 102 102 162 158 169 161 196 196 103 103 94 90 130 124 269 287 119 117 140 140 326 318 209 205 199 195 311 291 235
OBD112 Johannesburg 140 140 162 162 133 129 196 192 107 93 96 90 136 124 291 289 123 119 152 144 314 314 201 197 207 195 291 279 235 231
OBD113 Johannesburg 144 144 182 166 153 153 212 192 91 91 96 90 130 130 291 291 117 117 136 136 326 318 217 217 227 187 319 299 227 227
06D114 Johannesburg 136 132 182 182 153 141 188 188 107 101 96 96 130 124 287 287 117 115 140 128 318 318 213 209 239 239 295 283 235 223
06Dl15 Johannesburg 132 102 166 158 137 137 196 196 101 99 96 90 124 124 289 287 129 117 140 128 330 318 197 193 231 199 295 287 239 223
OBDl16 Johannesburg 132 132 166 166 153 137 196 196 101 101 96 90 124 124 287 285 125 119 144 144 322 322 221 209 227 203 299 275 227 223
OBD117 Johannesburg 108 106 166 162 137 133 192 192 97 97 96 96 124 124 289 287 117 117 140 140 346 322 209 197 191 191 299 287 231 223
06Dl18 Johannesburg 140 140 182 170 137 129 212 192 101 95 100 90 134 130 287 285 125 115 140 128 322 302 213 201 235 227 327 311 239 219
OBD119 Johannesburg 140 140 186 186 145 137 206 196 105 101 98 98 130 130 287 283 123 117 140 128 318 314 213 197 227 223 315 307 231 231
OBD120 Johannesburg 136 98 178 178 137 137 192 192 103 93 96 90 130 122 285 285 123 123 148 128 318 310 209 197 243 199 307 287 235 223
06D121 Johannesburg 132 132 166 162 137 137 200 200 95 91 96 96 124 122 291 283 123 123 140 128 322 322 217 201 203 203 279 279 227 227
06D122 Johannesburg 140 110 166 166 137 133 206 196 103 91 94 92 140 138 291 287 123 117 136 128 346 318 205 197 223 203 295 279 239 231
OBDl23 Johannesburg 136 110 166 162 153 133 212 188 101 97 96 90 134 124 291 289 123 119 140 132 322 322 201 189 255 227 315 291 227 223 --06D124 Johannesburg 144 140 182 166 145 141 196 188 105 103 92 92 124 124 289 285 125 123 128 128 334 330 209 197 243 243 295 279 235 219
OBD125 Johannesburg 98 98 178 170 157 137 196 196 111 99 96 92 0 0 291 291 125 117 144 144 326 318 209 197 239 191 335 311 231 231
OBD126 Johannesburg 110 96 186 188 137 137 206 168 99 93 102 92 138 138 291 287 123 123 144 128 0 0 213 209 199 191 0 0 227 227
OBD127 Johannesburg 136 110 188 162 153 137 208 196 99 91 96 90 138 138 287 285 123 123 136 128 346 334 205 197 227 203 295 279 239 231
OBD128 Johannesburg 0 0 0 0 0 0 0 0 99 91 92 90 142 130 0 0 125 115 0 0 0 0 0 0 0 0 0 0 0 0
06D129 Johannesburg 136 136 188 162 137 137 204 200 105 99 96 92 130 130 291 285 125 117 140 140 322 322 201 197 239 179 339 307 243 239
OBD13O Johannesburg 148 136 166 182 149 137 192 192 107 93 92 88 132 132 0 0 131 117 0 0 0 0 0 0 0 0 0 0 0 0
06D131 Pretoria 144 140 178 174 149 137 188 180 103 93 96 90 140 138 287 287 123 117 144 144 322 302 209 189 227 191 319 283 227 227
06D132 Pretoria 140 98 178 170 137 133 196 196 95 93 94 90 124 124 287 287 123 117 148 128 326 318 209 197 203 195 335 295 235 223
OBDl33 Pretoria 140 140 170 170 157 137 204 196 99 95 94 90 142 142 0 0 123 117 152 152 0 0 0 0 0 0 0 0 215 215
OBDl34 Pretoria 132 132 166 162 157 145 204 200 99 95 100 96 134 130 285 285 123 117 144 132 314 314 205 197 231 183 343 275 239 223
06Dl35 Pretoria 136 102 182 162 157 141 206 208 99 99 96 96 140 140 291 291 119 119 140 136 302 274 213 197 203 199 307 307 235 223
06Dl36 Pretoria 132 132 182 158 153 137 208 166 105 93 92 90 140 130 287 287 123 115 144 128 0 0 201 197 199 199 0 0 219 219
06D137 Pretoria 136 136 190 186 137 133 192 166 111 91 100 96 142 130 291 289 127 123 144 140 322 314 205 201 219 191 347 291 235 227
OBDl38 Pretoria 136 136 190 162 137 137 200 192 91 91 96 96 136 130 287 285 125 115 132 128 322 310 201 197 239 187 319 299 231 223

University of Cape Town
OB0143 136 I 162
OB0144 Pretoria 132 132 170
OB0145 Pretoria 132 132 186 186 I'll 137 204 196 105
OB0146 Pretoria 136 136 178 162 157 141 200 196 103
OB0147 Pretoria 140 140 178 162 169 145 204 196 101
OB0148 Pretoria 132 132 186 182 133 133 188 180 103
OBOI4S I Pretoria I 140 136 I 186 166 I 145 141 1 196 180 1 103 97 I 100
OBOI50 Pretoria 136 136 178 178 157 133 212 192 103 101 92
OB0151 Pretoria 114 102 182 162 149 145 188 188 105 99 90
OB0152 Pretoria 136 98 174 166 I'll 137 196 166 103 91 98
OBOI53 Pretoria 98 98 178 162 137 137 204 204 93 93 100
OB0154 Pretoria 140 102 190 162 137 133 192 192 105 91 96
OB0155 Pretoria 132 132 186 162 137 137 200 188 99 91 100
OB0156 Pretoria 132 102 162 162 137 133 188 180 105 101 90
OB0157 Pretoria 132 102 182 162 137 133 192 180 99 91 96
OBOI58 Pretoria 132 102 182 162 137 133 204 180 101 101 90
OB0159 Pretoria 140 136 170 166 137 137 216 212 103 101 92
OBOI60 Pretoria 136 102 178 176 145 137 198 196 101 97 94
OBD161 Pretoria 140 136 186 170 141 137 200 200 99 95 96
OB0162 Pretoria 144 144 186 162 137 133 200 196 103 101 92
98
92
90
90
98
90
OBOI63 Pretoria 136 132 162 162 157 153 208 208 101 99 98 __
137 200 196 107 91 92
101 90
101 I 90
85190
95196
134
136
130
142
136
130
130
134
130
130
130
130
136
287
289
289
289
291
289
287
285
287
287
287
285
285
287
285
267
125
123
125
129
121
123
117
129
125
123
125
125
117 I 144
123 I 144
123 I 148
125 I 190
123 I 144
119 I 140
322 314 I 217 205 I 231
322
246
322
326
318
128 I 334
128 I 326
144 I 322 316
144 I 316 316
128 I 314 314
140 I 336 29S
298
318
274
306
205 191
209 209
201 197
197
217
217
217
209
247
235
223
207
247
283 I 239 227
283 I 231 231
223 307 :1 203 239 291 I 239 231
215 327 275 I 235 215
195 295 295 I 223 223
203 295 283 I 231 227
291 I 231 231
291 I 239 235
291 I 235 231
283 I 231 231
283 I 235 231
287 I 223 223
295 I 235 235
307 I 243 231
283 I 239 227
283 I 223 223
291 I 231 231
295 I 239 231
291 I 235 231
299 I 235 231
235 227
227 227
235 223
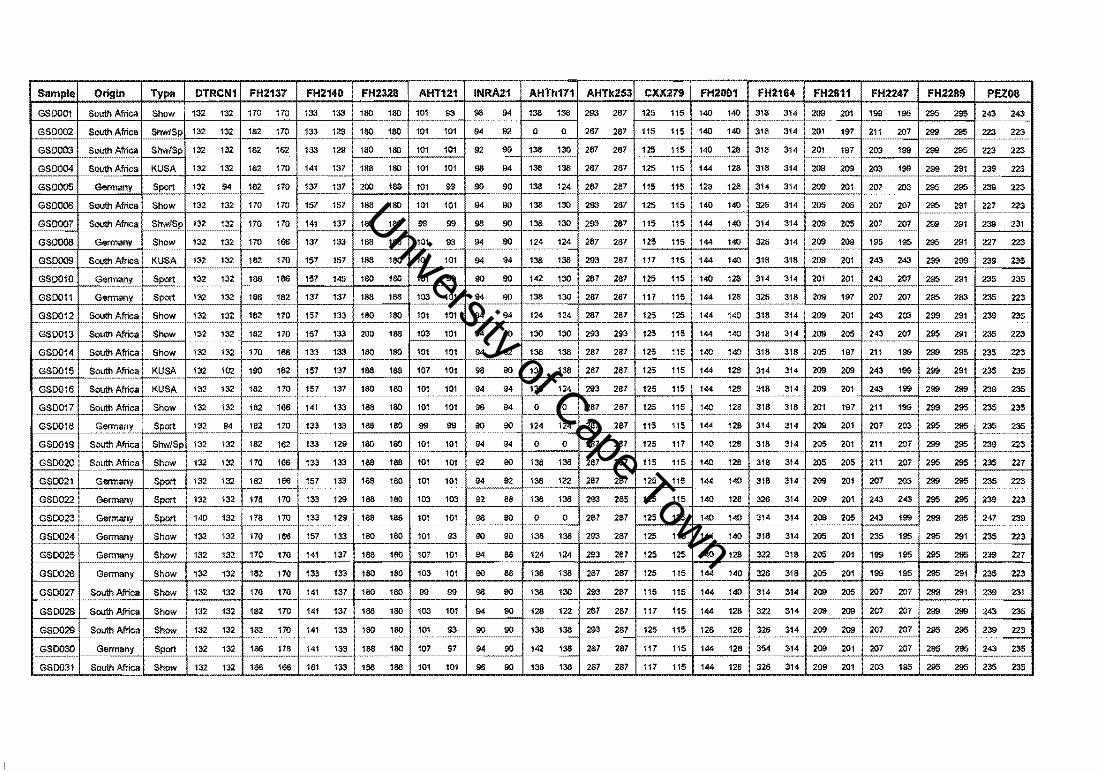
University of Cape TownGSD017
GSD01B
GSD019
GSOO20
GSOO21
GSD022
GSD023
GSD024
GSD025
GSD026
GSD027
GSOO28
GSD029
GSD030
GSD031
FH2137 FH2140 I FH2328
132 I 170 170 I 133 133 I 100 100
132 182 170 133 129 100 100
132 182 162 133 129 180 100
132 162 1m 1~ 1~ 1~ 100
94 I 162 170 I 131 131 I 200 188
132 188 100
100 100
1m 166 I 137 133 I 188 100
132 162 1 m I 151 157 I 188 100
132 188 166 I 151 145 I 100 100
182 I 137 137 I 188 188
110 180 100
170 200 188
188 I 133 133 I 180 180
102 180 182 I 157 137 I 188 188
132 182 170 I 157 131 I 180 180
132 182 166 I 141 133 I 166 180
94 182 170 I 133 133 I 1~ 180
182 162 I 133 129 I 180 180
170 166 I 133 133 I 188 188
166 I 157 133 I 188 180
170 I 133 129 I 188 100
101
103
101
103
101
101
101
101
99
101
101
101
103
1m I 133 129 I 188 166 I 101 101
1m I 141
133
141
I'll
I'll
I'll
166 I 161
137 I 188 100 107 101
133 I 100
137 I 180
137 I 188
133 I 100
133 I 188 100 107 97
133 I 188 188 101 101
94 90
96 90
142
139
CXX279
281 I 125 115
o I 281 287 I 115 115
130 I 287 287 I 125 115
138 I 281 287 I 125 115
124 I 287 281 I 115 115 I 128 128
130 I 293 281 I 125 115 I 140 140
130 I 2~ ~2~81 +~~~~+-~ __ ~-+ ____ _ 124 281 287
139 I 293 287 I 117 115 I 144 140 I 318
130 I 287 287 I 125 115 I 140 129 I 314
130 I 287 287 I 117 115 I 144 128 I 326
124 140 I--=-~_~
130 140
138 I 287 2117 I 125 115 I 140 140 I 318
287 287 I 125 115 I 144 128 I 314
293 287 I 125 115 I 144 128 I 318
287 287 I 125 115 I 140 126 I 318
287 267 I 115 115 I 144 128 I 314
287 I 125 117 I 140 128 I 318
287 I 115 115 I 140 128 I 318 314
287 I 125 115 I 144 140 I 318 314
285 115 1'40 128 I 326 314
281
287
125 314 314
115 318
287 125 125 I 140 128
281 125 115 I 144 140
287 115 115 I 144 140
287 111 115 I 144 128 I 322 314 I 209
287 125 115 I 128 128 I 326 314 I 209
287 117 115 I 144 128 I 354 314 I 209 201
287 111 115 I 144 128 I 326 314 I 209 201
199
203
207
207
195
207
203
207
295 I 223 223
295 I 223 223
299 291 I 239 223
295 295 I 239 223
295 291 I 221 223
299 291 I 239 231
295 291 I 221 223
299 299 I 239 235
295 291 I 235 235
295 283 I 235 223
299 291 I 239 235
299 291 I 235 235
299 I 239 235
295 I 235 235 1
295 235 235
295 I 239 223
285 I 235 221
299 I 235 223
239 223 1-----+---+ 295 241 239
291 235 223
239 227
235 223
239 231
243 235
239 223
235
235
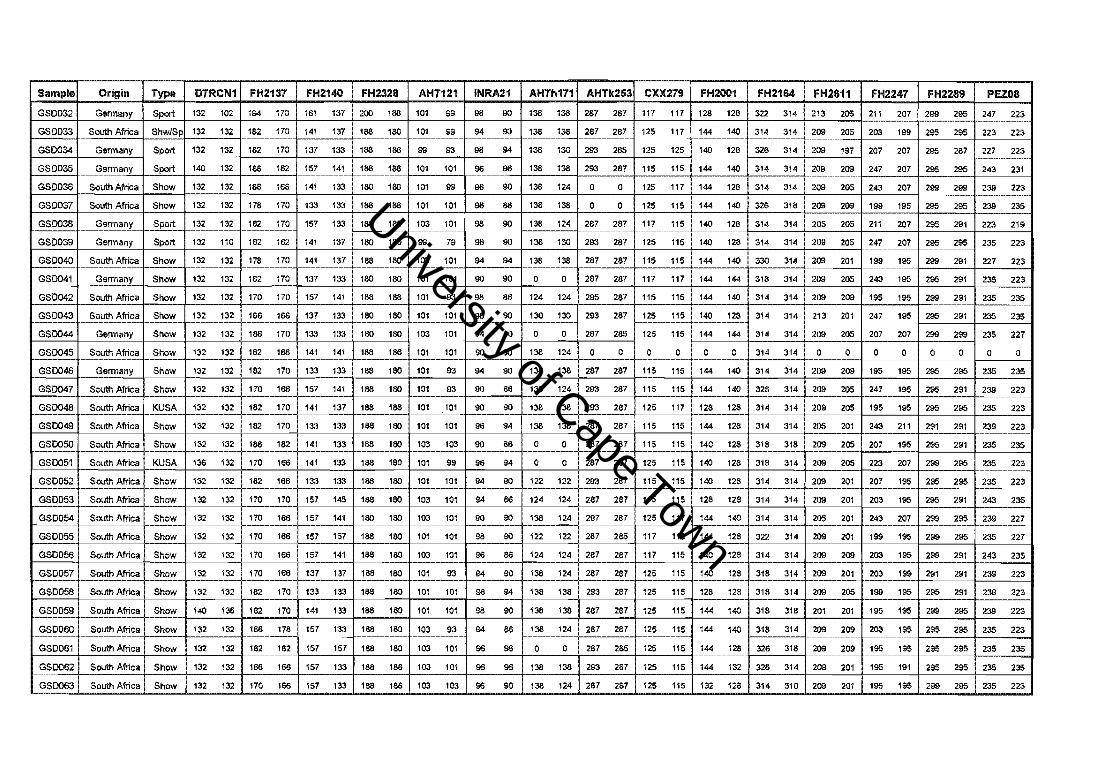
University of Cape Town
Sample Origin Type DTRCN1 FH2137 FH2140 FH2328 AHT121 INRA21 AHTh171 AHTk253 CXX219 FH2001 FH2164 FH2611 FH2241 FH2289 PEZ08
GSD032 Germany Sport 132 102 194 170 161 137 200 188 101 99 96 90 138 138 287 287 117 117 128 128 322 314 213 205 211 207 299 295 247 223
GSD033 South Africa Shw/Sp 132 132 182 170 141 137 188 180 101 99 94 90 138 138 287 287 125 117 144 140 314 314 209 205 203 199 295 295 223 223
GSD034 Germany Sport 132 132 182 170 137 133 188 188 99 93 96 94 138 130 293 285 125 125 140 128 326 314 209 197 207 207 295 287 227 223
GSD035 Germany Sport 140 132 188 182 157 141 188 188 101 101 96 96 138 138 293 287 115 115 144 140 314 314 209 209 247 207 295 295 243 231 --
GSD036 South Africa Show 132 132 188 166 141 133 180 180 101 99 96 90 138 124 0 0 125 117 144 128 314 314 209 205 243 207 299 299 239 223
GSD037 South Africa Show 132 132 178 170 133 133 188 188 101 101 96 88 138 138 0 0 125 115 144 140 326 318 209 209 199 195 295 295 239 235
GSD036 Germany Sport 132 132 182 170 157 133 188 180 103 101 98 90 138 124 287 287 117 115 140 128 314 314 205 205 211 207 295 291 223 219
GSD039 Germany Sport 132 110 182 162 141 137 180 180 99 79 98 90 138 130 293 287 125 115 140 128 314 314 209 205 247 207 295 295 235 223
GSD040 South Africa Show 132 132 178 170 141 137 166 180 103 101 94 94 138 138 287 287 115 115 144 140 330 314 209 201 199 195 299 291 227 223
GSD041 Germany Show 132 132 182 170 137 133 180 180 101 101 90 90 0 0 287 287 117 117 144 144 318 314 209 205 243 195 295 291 235 223
GSD042 South Africa Show 132 132 170 170 157 141 188 188 101 93 98 86 124 124 295 287 115 115 144 140 314 314 209 209 195 195 299 291 235 235
GSD043 South Africa Show 132 132 166 166 137 133 180 180 101 101 98 90 130 130 293 287 125 115 140 128 314 314 213 201 247 195 295 291 235 235
GSD044 Germany Show 132 132 186 170 133 133 180 180 103 101 94 90 0 0 287 285 125 115 144 144 314 314 209 205 207 207 299 299 235 227
GSD045 South Africa Show 132 132 182 166 141 141 186 186 101 101 90 90 138 124 0 0 0 0 0 0 314 314 0 0 0 0 0 0 0 0 --GSD04S Germany Show 132 132 182 170 133 133 186 180 101 93 94 90 138 138 287 287 115 115 144 140 314 314 209 209 195 195 295 295 235 235
GSD047 South Africa Show 132 132 170 166 157 141 188 180 101 93 90 86 138 124 293 287 115 115 144 140 326 314 209 205 247 195 295 291 239 223
GSD04S South Africa KUSA 132 132 182 170 141 137 186 188 101 101 90 90 138 138 293 287 125 117 128 128 314 314 209 205 195 195 295 295 235 223
GSD049 South Africa Show 132 132 182 170 133 133 188 180 101 101 96 94 138 138 287 287 115 115 144 128 314 314 205 201 243 211 291 291 239 223
GSDOSO South Africa Show 132 132 186 182 141 133 186 180 103 103 90 86 0 0 287 287 115 115 140 128 318 318 209 205 207 195 295 291 235 235
GSD051 South Africa KUSA 138 132 170 186 141 133 188 180 101 99 96 94 0 0 287 287 125 115 140 128 318 314 209 205 223 207 299 295 235 223
GSD052 South Africa Show 132 132 182 166 133 133 186 180 101 101 94 90 122 122 293 287 115 115 140 128 314 314 209 201 207 195 295 295 235 223
GSD053 South Africa Show 132 132 170 170 157 145 188 180 103 101 94 86 124 124 287 287 115 115 128 128 314 314 209 201 203 195 295 291 243 235
GSD054 South Africa Show 132 132 170 166 157 141 180 180 103 101 90 90 138 124 297 287 125 117 144 140 314 314 205 201 243 207 299 295 239 227
GSD055 South Africa Show 132 132 170 166 157 157 186 180 101 101 98 90 122 122 287 285 117 115 144 128 322 314 209 201 199 195 299 295 235 227
GSD056 South Africa Show 132 132 170 166 157 141 188 laO 103 101 96 88 124 124 287 287 117 115 140 128 314 314 209 209 203 195 299 291 243 235
GSD057 South Africa Show 132 132 170 166 137 137 188 180 101 93 94 90 138 124 287 287 125 115 140 128 318 314 209 201 203 199 291 291 239 223
GSD058 South Africa Show 132 132 182 170 133 133 188 180 101 101 98 94 138 138 293 287 125 115 128 128 318 314 209 205 199 195 295 291 239 223
GSD059 South Africa Show 140 138 182 170 141 133 188 180 101 101 98 90 138 138 287 287 125 115 144 140 318 318 201 201 195 195 299 295 239 223
GSD060 South Africa Show 132 132 186 178 157 133 188 180 103 93 94 86 138 124 287 287 125 115 144 140 318 314 209 209 203 195 295 295 235 223
GSD061 South Africa Show 132 132 182 182 157 157 188 180 103 101 96 96 0 0 287 285 125 115 144 128 326 318 209 209 195 195 295 295 235 235
GSD062 South Africa Show 132 132 166 166 157 133 186 186 103 101 96 96 138 138 293 287 125 115 144 132 326 314 209 201 195 191 295 295 235 235
GSD063 South Africa Show 132 132 170 166 157 133 188 186 103 103 96 90 138 124 287 287 125 115 132 128 314 310 209 201 195 195 299 295 235 223
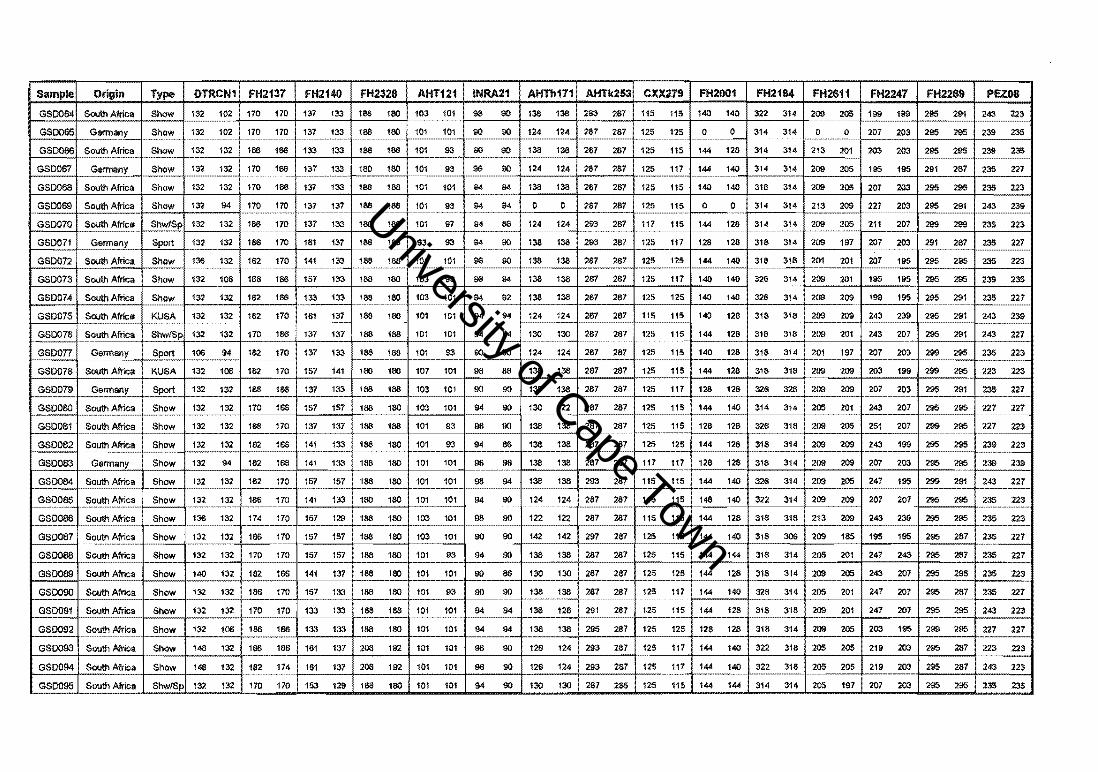
University of Cape Town
DTRC FH2137 FH2140 I FH2326 CXX279 I FH2001 FH2164 I FH2611
132 102 170 170 137 133 188 180 103 101 98 90 138 138 293 287 115 115 140 140 322 314 209 205
1"" _ 102 170 170 131 133 1118 180 101 101 90 90 124 124 287 281 125 125 0 0 314 314 0 0 201 ,-----
132 166 166 133 133 188 166 101 93 90 90 138 138 287 287 125 115 144 128 314 314 213 201 203
132 170 166 137 133 180 180 101 93 96 90 124 124 287 281 125 117 144 140 314 314 209 205 195
132 170 166 131 133 188 188 101 101 94 94 138 138 287 287 125 115 140 140 318 314 209 205 201 223
94 170 170 137 137 188 188 101 93 94 94 0 0 281 281 125 115 0 0 314 314 213 209 227 203 239
132 166 170 137 133 180 180 101 97 94 88 124 124 293 287 117 115 144 128 314 314 209 205 211 201 223 -132 188 170 181 137 188 188 93 93 94 90 138 138 293 287 125 111 128 128 318 314 209 197 207 203
I - I 132 162 170 141 133 188 188 101 101 96 90 138 138 287 287 125 125 144 140 318 318 201 201 207 HIS
lOS 166 166 157 133 188 180 103 93 96 94 138 138 287 287 125 117 140 140 326 314 209 201 195 195
_ .. _" 132 162 166 133 133 188 180 103 101 94 92 138 138 287 287 125 125 140 140 326 314 209 209 199 195
I KUSA 1132 132 182 170 161 131 188 180 101 101 94 94 124 124 287 287 115 115 140 128 318 318 209 209 243 --------1------
132 170 166 137 131 188 188 101 101 94 94 130 130 287 281 125 115 144 128 318 318 209 201 243
__ ._. __ .. , -r-" .~ 94 162 110 137 133 188 188 101 93 00 90 124 124 287 287 125 115 140 128 318 314 201 197 207
lOS 182 170 157 141 180 180 107 101 96 88 138 138 287 287 125 115 144 128 3111 318 209 209 203 199 299
GSD079 132 188 166 137 133 188 188 103 101 90 90 138 138 281 287 125 117 128 128 326 326 209 209 207 203 296
GSDOBO 132 170 166 157 157 166 180 103 101 94 00 130 122 287 287 125 115 144 140 314 314 205 201 243 207 296
GSD081 132 188 170 137 137 188 188 101 93 96 90 138 138 287 287 125 115 1211 128 326 3111 209 205 251 207 299
132 182 166 141 133 188 180 101 93 94 88 138 138 281 2111 125 125 144 128 318 314 209 209 243 199 296
94 182 166 141 133 188 180 101 101 96 98 138 138 281 287 117 111 128 128 318 314 209 209 201 203 295
132 182 170 157 157 188 180 101 101 96 94 138 138 293 287 115 115 144 140 326 314 209 205 247 199 299
132 186 170 141 133 180 180 101 101 94 00 124 124 287 287 115 115 148 140 322 314 209 209 201 207 296 296
132 174 110 157 129 188 180 103 101 98 00 122 122 287 287 115 115 144 128 318 318 213 209 243 239 296
132 166 170 157 157 188 180 103 101 00 00 142 142 291 287 125 115 144 140 318 30S 209 185 195 199 295
170 157 157 188 180 101 93 94 00 138 138 287 287 125 115 144 144 318 314 205 201 247 243 296
82 166 141 137 188 180 101 101 00 88 130 130 287 287 1:25 125 144 1211 318 314 209 20S 243 207 296
86 170 157 133 188 180 101 93 00 00 138 138 287 287 125 117 144 140 326 314 205 201 241 207 295
170 133 133 188 188 1~ ~ 94 94 128 318 3111 I 209 201 I 247 207 I 296
188 I 133 133 I 188 180 I 101 101 I 94 94 128 I 318 314 I 209 20S I 203 195 I 299 295
1116 101 101 I 98 140 I 322 318 I 205 205 I 219 203 I 296 2111 223
114 101 140 I 322 318 I 20S 205 I 219 203 I 296 2117 243
170 I 153 129 I 188 180 I 101 144 I 314 314 I 205 197 I 207 203 I 296 295 I 235
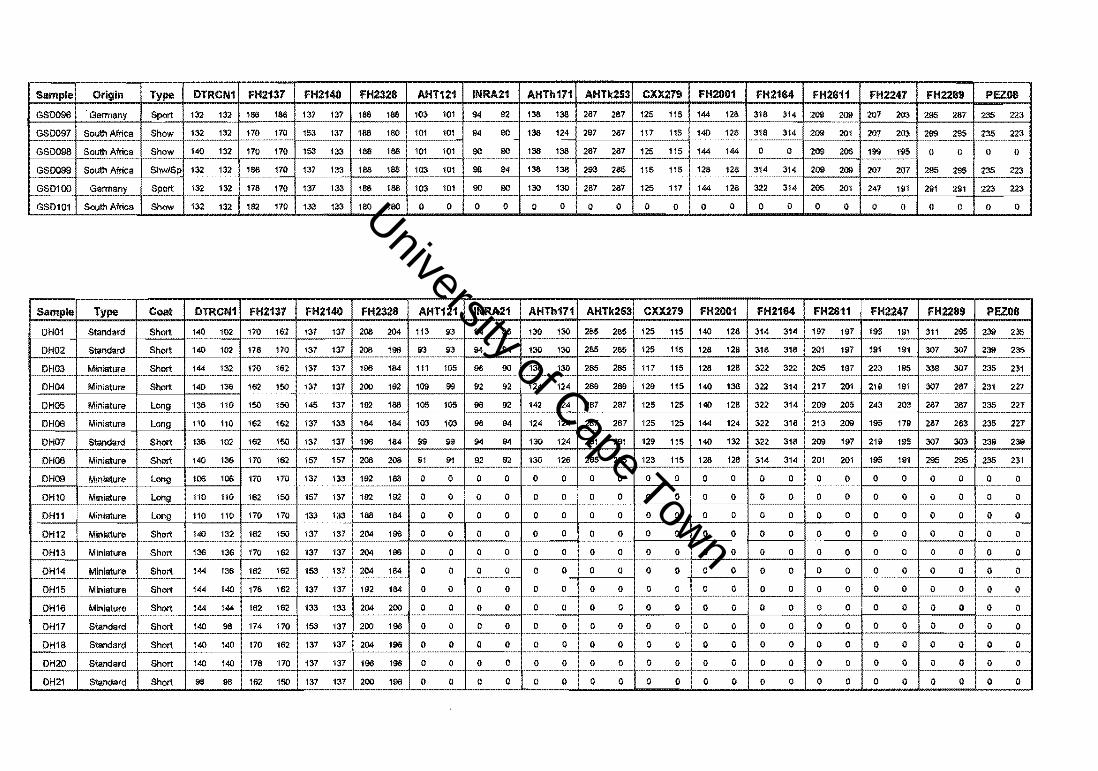
University of Cape Town
Sample Origin DTRCN1
GSD096 I . Germany I Sport I 132 132
GSD097 I South Africa I Show I 132 132
GSD098 I South Africa I Show I 140 132
GSD0991 South Africa I Shw/Spl 132 132 l----~
GSD100 I Germany
GSD10l I Soulll Africa
Standard
Sport
Show
132 132
132 132
Miniature Short 144 132
DH04 I Miniature Short 140 138
DH05 I Miniature long 138 110 150
101 I 94 92 I 138 138 I 287 267 I 125 115
~ ,~ 101 94 90_ 138 124 297 267 117 115 140
I 101 101 90 90 138 138 287 287 125 115 144
101 98 94 138 138 293 285 115 115 126
101 90 90 130 130 I 287 287 I 125 117 I 144
o o o 001 0 0 I 0 0 I 0
AHTk2531 CXX279 I FH2001
285 285 I 125 115 I 140 128
285 285 I 125 115 I 128 128
285 285 I 117 115 I 128 128
124 I 289 289 I 129 115 I 140 138
124 I 287 287 I 125 125 I 140 128 I 322
DH06 Miniature long 110 110 162 162 137 133 184 184 103 103 98 94 124 124 287 287 125 125 144 124 322
DH07 Standard Short 138 102 162 150 137 137 196 184 99 99 94 94 130 124 291 291 129 115 140 132 322
DH06 Miniature Short 140 138 170 162 157 157 208 208 91 91 92 92 130 126 285 285 123 115 126 126 314
I DH09 Miniature Long 106 106 170 170 137 133 192 168 0 a 0 0 0 0 0 0 0 0 0 a
I OH1O Miniature long 110 110 162 150 157 137 192 192 a a I 0 0 0 0 0 0 0 0 a a -OHll Miniature long 110 110 170 170 133 133 168 184 a 0 a a a 0 a a 0 a a 0
OH12 Miniature Short 140 132 162 150 137 137 204 198 a 0 a a a 0 a 0 0 a 0 0
OH13 Miniature Short 138 138 170 162 137 137 204 196 0 a 0 0 a 0 0 0 0 0 0 0
OH14 Miniature Short 144 136 162 162 153 137 204 184 a a 0 0 a 0 0 0 0 0 a 0
DH15 Miniature Short 144 140 178 162 137 137 192 184 0 0 a 0 0 0_ 0 0 0 a a ° a Q
DH16 Miniature Short 144 144 162 162 133 133 204 200 a a 0 0 Q 0 0 0 0 0 0 0 0 0
DH17 Slandard Short 140 98 174 170 153 137 200 196 0 0 0 0 0 0 a 0 0 0 a a 0 0 0 0 0
DH18 Standard Short 140 140 170 162 137 137 204 196 0 0 0 0 0 0 0 0 0 a 0 0 0 0 0 0 0
DH20 Standard Short 140 140 176 170 137 137 196 196 0 0 0 0 0 0 0 0 0 0 0 0 0 0 0 0 0
Standard Short 98 98 162 150 137 137 200 196 0 a 0 0 0 0 0 0 0 0 0 0 0 0 0 0 0
235 223
o 0
207 I 235 223
191 I 291 291 I 223 223
010 010 0
PEZ08
235
307 I 239 235
307 I 235 231
287 I 231 227
287 I 235 227
227
239
231
o o
o o
a o o o

University of Cape Town
Sample Type Coat DTRCN1 fH2137 fH2140 fH2328 AHT121 INRA21 AHTh171 AHTk253 CXX279 fH2001 fH2164 fH2611 fH2247 fH2289 PEZ08
DHZ2 Standard Short 140 140 178 170 137 133 204 196 0 0 0 0 0 0 0 0 0 0 0 0 0 0 0 0 0 0 0 0 0 0
DH23 Miniature Short 144 136 170 162 137 137 180 180 0 0 0 0 0 0 0 0 0 0 0 0 0 0 0 0 0 0 0 0 0 0
DH24 Miniature Short 136 132 170 162 137 137 192 192 0 0 0 0 0 0 0 0 0 0 0 0 0 0 0 0 0 0 0 0 0 0
DH25 Miniature Short 136 136 162 150 137 133 200 160 0 0 0 0 0 0 0 0 0 0 0 0 0 0 0 0 0 0 0 0 0 0
DH26 Miniature Short 140 132 170 162 153 137 192 184 0 0 0 0 0 0 0 0 0 0 0 0 0 0 0 0 0 0 0 0 0 0
DH27 Miniature Short 136 136 162 162 141 137 204 192 0 0 0 0 0 0 0 0 0 0 0 0 0 0 0 0 0 0 0 0 0 0
Sample DTRCN1 fH2137 fH2140 fH2328 AHT121 INRA21 AHTh171 AHTk253 CXX279 fH2001 fH2164 fH2611 fH2247 fH2289 PEZOO
58T01 132 132 174 170 141 137 200 192 97 91 96 92 126 126 291 267 119 117 140 136 318 314 217 205 203 199 319 279 231 227
58T02 132 132 162 162 165 141 196 188 101 99 98 92 124 124 291 287 117 117 140 126 322 310 217 213 251 199 291 279 235 227
58T03 140 98 162 162 165 141 204 200 101 91 92 90 134 124 0 0 123 117 0 0 0 0 0 0 0 0 0 0 0 0
58T04 132 132 176 162 157 157 196 192 97 91 96 90 140 126 291 287 119 117 140 140 306 274 209 209 247 191 311 279 239 227
58T05 132 132 182 162 157 137 200 160 97 91 96 92 134 126 291 267 123 119 144 140 318 310 209 209 251 251 311 311 231 227
5BT06 132 132 170 166 141 137 208 208 97 91 96 96 134 130 287 287 123 117 144 140 326 322 213 213 207 183 311 279 231 231 c------
SBT07 132 132 182 166 141 137 200 196 0 0 0 0 0 0 0 0 0 0 0 0 0 0 0 0 0 0 0 0 0 0
5BT08 132 132 174 166 157 137 200 192 0 0 0 0 0 0 0 0 0 0 0 0 0 0 0 0 0 0 0 0 0 0
58T09 132 132 162 162 137 137 192 166 0 0 0 0 0 0 0 0 0 0 0 0 0 0 0 0 0 0 0 0 0 0
56Tl0 132 132 170 166 157 137 196 192 0 0 0 0 0 0 0 0 0 0 0 0 0 0 0 0 0 0 0 0 0 0
58T11 132 132 182 166 141 133 200 166 0 0 0 0 0 0 0 0 0 0 0 0 0 0 0 0 0 0 0 0 0 o ' 56T12 132 132 162 162 157 141 206 166 0 0 0 0 0 0 0 0 0 0 0 0 0 0 0 0 0 0 0 0 0 o I
56T13 132 132 174 166 141 137 208 206 0 0 0 0 0 0 0 0 0 0 0 0 0 0 0 0 0 0 0 0 0 0
56T14 132 132 166 162 157 141 204 200 0 0 0 0 0 0 0 0 0 0 0 0 0 0 0 0 0 0 0 0 0 o !
56T15 140 132 166 162 157 141 216 208 0 ·0 0 0 0 0 0 0 0 0 0 0 0 0 0 0 0 0 0 0 0 0
56T2O 140 132 162 162 157 137 192 160 0 0 0 0 0 0 0 0 0 0 0 0 0 0 0 0 0 0 0 0 0 0
56T21 144 132 178 174 157 141 204 192 0 0 0 0 0 0 0 0 0 0 0 0 0 0 0 0 0 0 0 0 0 o I
SBT23 132 132 174 170 141 137 200 192 0 0 0 0 0 0 0 0 0 0 0 0 0 0 0 0 0 0 0 0 0 0 i
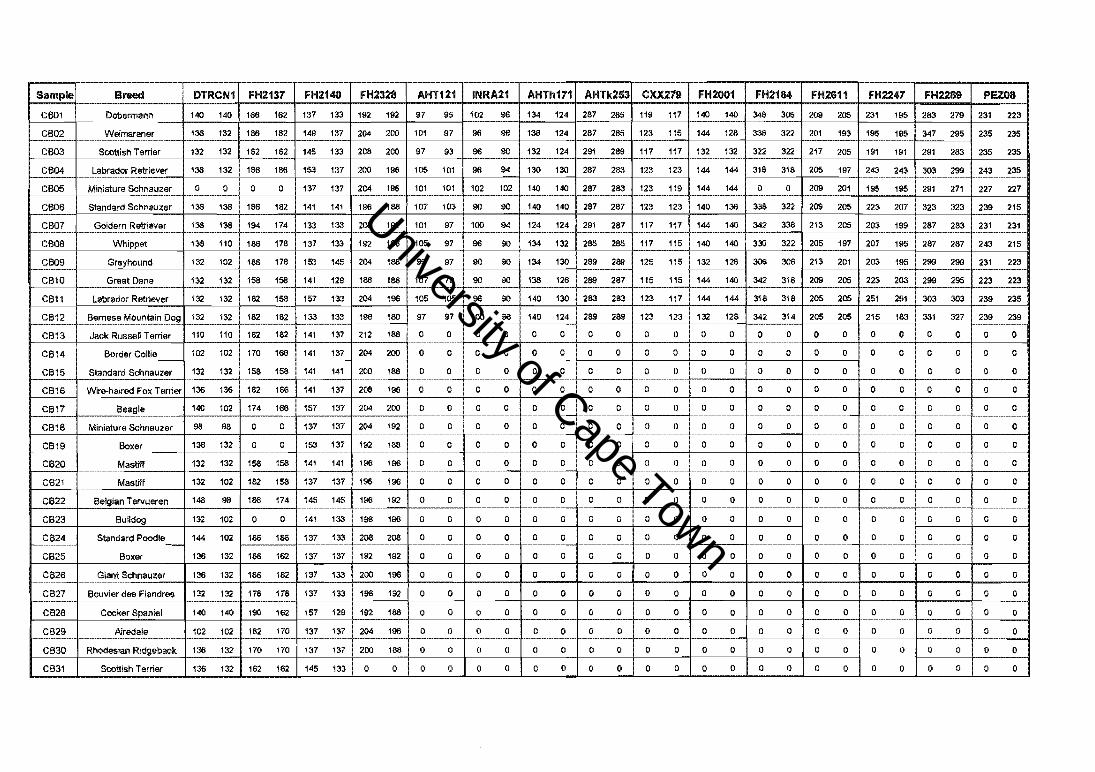
University of Cape Town
Sample Breed DTRCN1 fH2137 fH2140 fH2328 AHT121 INRA21 AHTI1171 AHTk253 CXX279 fH2001 fH2164 fH2611 fH2247 fH2289 PEZ08
CBOl Dobermann 140 140 166 162 137 133 192 192 97 95 102 96 134 124 287 285 119 117 140 140 346 306 209 205 231 195 283 279 231 223
CB02 Weimaraner 138 132 166 182 149 137 204 200 101 97 96 96 138 124 287 285 123 115 144 128 338 322 201 193 195 195 347 295 235 235
CB03 Scottish Terrier 132 132 162 162 145 133 208 200 97 93 96 90 132 124 291 289 117 117 132 132 322 322 217 205 191 191 291 283 235 235
CB04 Labrador Retriever 138 132 186 186 153 137 200 196 105 101 96 94 130 130 287 283 123 123 144 144 318 318 205 197 243 243 303 299 243 235
CB05 Miniature Schnauzer 0 0 0 0 137 137 204 196 101 101 102 102 140 140 287 283 123 119 144 144 0 0 209 201 195 195 291 271 227 227
CBOS Standard Schnauzer 138 138 186 182 141 141 196 188 107 103 90 90 140 140 287 287 123 123 140 138 338 322 209 205 223 207 323 323 239 215
CB07 Goldern Retriever 138 138 194 174 133 133 208 192 101 97 100 94 124 124 291 287 117 117 144 140 342 338 213 205 203 199 287 283 231 231
CBOa Whippet 136 110 186 178 137 133 192 188 105 97 96 90 134 132 285 285 117 115 140 140 330 322 205 197 207 195 287 287 243 215 I
CB09 Greyhound 132 102 186 178 153 145 204 188 99 97 90 90 134 130 289 289 125 115 132 128 308 308 213 201 203 195 299 299 231 223
CB10 Great Dane 132 132 158 158 141 129 188 188 107 79 90 90 138 126 289 287 115 115 144 140 342 318 209 205 223 203 299 295 223 223 !
CBll Labrador Retriever 132 132 182 158 157 133 204 196 105 105 96 90 140 130 283 283 123 117 144 144 318 318 205 205 251 251 303 303 239 235 i
CB12 Bernese Mountain Dog 132 132 182 182 133 133 196 180 97 97 100 96 140 124 289 289 123 123 132 128 342 314 205 205 215 1113 331 327 239 239
CB13 Jack Russell Terrier 110 110 182 182 141 137 212 188 0 0 0 0 0 0 0 0 0 0 0 0 0 0 0 0 0 0 0 0 0 0
CB14 Border Collie 102 102 170 166 141 137 204 200 0 0 0 0 0 0 0 0 0 0 0 0 0 0 0 0 0 0 0 0 0 0 --------------------
CB15 Standard Schnauzer 132 132 158 158 141 141 200 188 0 0 0 0 0 0 0 0 0 0 0 0 0 0 0 0 0 0 0 0 0 0 --
CB1S Wire-haired Fox Terrier 138 138 182 166 141 137 208 196 0 0 0 0 0 0 0 0 0 0 0 0 0 0 0 0 0 0 0 0 0 0
CBl? Beagle 140 102 174 166 157 137 204 200 0 0 0 0 0 0 0 0 0 0 0 0 0 0 0 0 0 0 0 0 0 0 ------------------
CB1S Miniature Schnauzer 98 98 0 0 137 137 204 192 0 0 0 0 0 0 0 0 0 0 0 0 0 0 0 0 0 0 0 0 0 0 --------------------- -------------------- ----------------- -------------------
CB19 Boxer 138 132 0 0 153 137 192 188 a 0 0 0 0 0 0 0 0 0 0 0 0 0 0 0 0 0 0 0 0 0 --- --------------------- ------------------
CB20 Mastiff 132 132 158 158 141 141 196 196 0 0 0 0 0 0 0 0 0 0 0 0 0 0 0 0 0 0 0 0 0 0
CB21 Mastiff 132 102 182 158 137 137 196 196 a 0 a 0 0 0 0 0 0 0 0 0 0 0 0 0 0 0 0 0 0 0
CB22 Belgian Tervueren 148 98 188 174 145 145 196 192 0 0 0 0 0 0 0 0 0 0 0 0 0 0 0 0 0 0 0 0 0 0
CB23 Bulldog 132 102 0 0 141 133 196 196 0 0 0 0 0 0 0 0 0 0 0 0 0 0 0 0 0 0 0 0 0 0
CB24 Standard Poodle 144 102 186 188 137 133 208 208 0 a 0 0 0 0 0 0 0 0 0 0 0 0 0 0 0 0 0 a a 0 -------------------
CB25 Boxer 138 132 186 162 137 137 192 192 0 0 0 0 0 0 0 0 0 0 0 0 0 0 0 0 0 0 0 0 0 0
CB26 Giant Schnauzer 136 132 186 182 137 133 200 196 0 0 0 0 0 0 0 0 0 0 0 0 0 0 0 0 0 a 0 0 a 0
CB27 Bouvier des Flandres 132 132 178 118 137 133 196 192 0 0 0 0 0 0 0 0 0 0 0 0 0 0 0 0 0 0 0 0 0 0
CB2S Cocker Spaniel 140 140 190 162 157 129 192 188 0 0 0 0 0 0 0 0 0 0 0 0 0 0 0 0 0 0 0 0 0 0
CB29 Airedale 102 102 182 170 137 137 204 196 0 0 0 0 0 0 0 0 0 0 0 0 0 0 0 0 0 0 a 0 0 0 -- -----------------
CB30 Rhodesian Ridgeback 138 132 170 170 137 137 200 188 0 0 0 0 0 0 0 0 0 0 0 0 0 0 0 0 0 0 0 a 0 0
CB31 Scottish Terrier 138 132 162 162 145 133 0 0 0 0 0 0 0 0 0 0 0 0 0 0 0 0 0 0 0 0 0 0 0 0
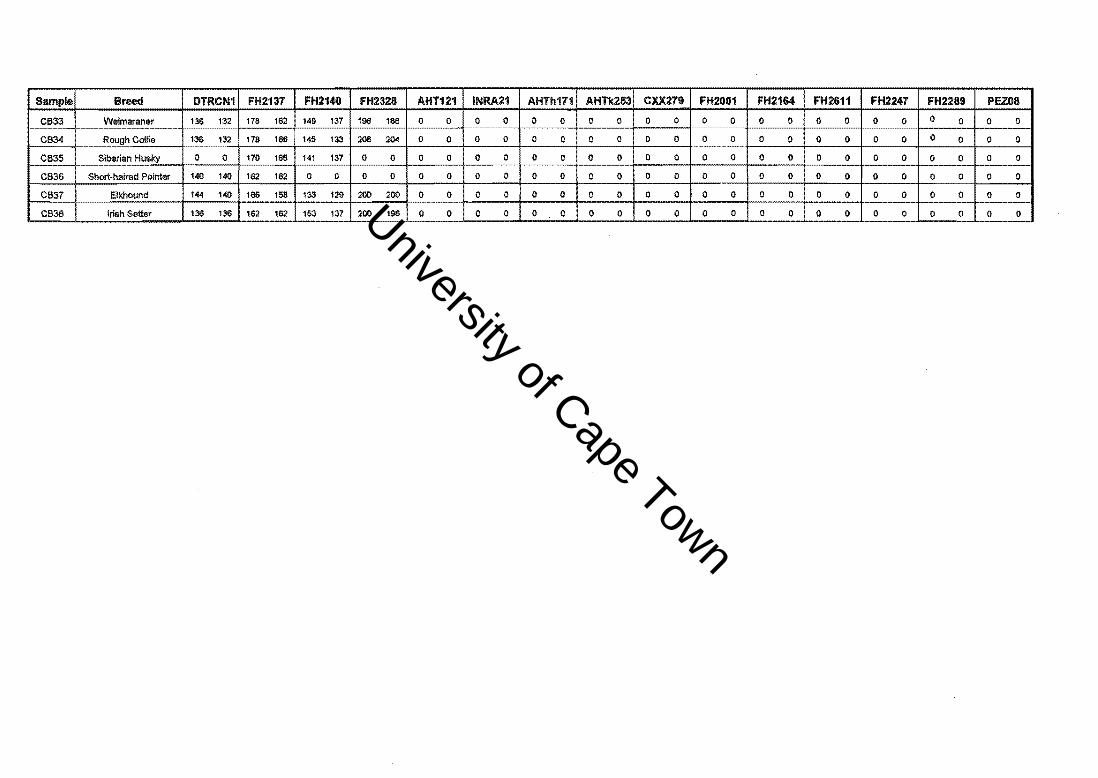
University of Cape Town
INRA21 I AHTh1 PEZGS
o o o o o o
o o o o o o o o o o o o
o o o o o o
o o o o o o
o o o o o o
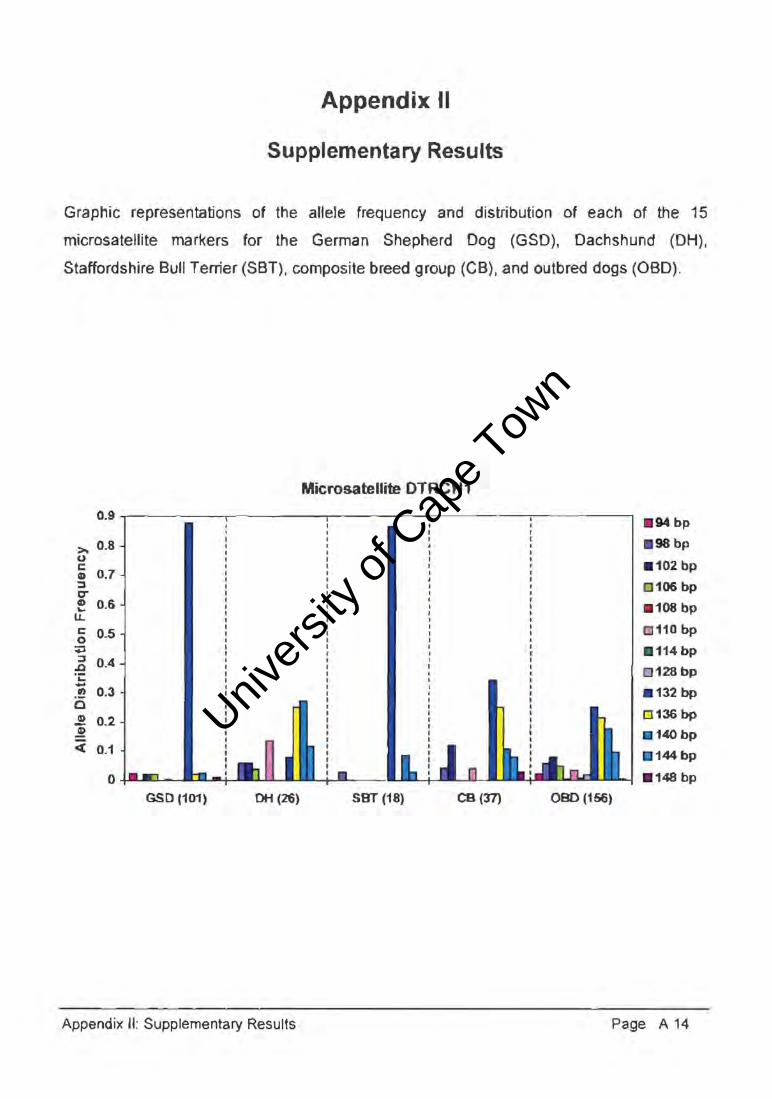
Univers
ity of
Cap
e Tow
n
Appendix II
Supplementary Results
Graphic representations of the allele frequency and distribution of each of the 15
microsatellite markers for the German Shepherd Dog (GSO), Oachshund (OH),
Staffordshire Bull Terrier (SBT), composite breed group (CB). and outbred dogs (OBO) .
0.9
>. 0.8 u I:
0.7 ~ ~ c-o 0.6 ... lL I: 0_5 0 +l ~ 0.4 .0 .;: -If) 0.3 a ~ 0.2 ~ ct 0.1
0
GSD (101) DH (26)
Appendix II : Supplementary Results
Microsatellife DTRCN1
SBT (18) CB(37) 080 (156)
. 94bp
98 bp
.102 bp
0106 bp
. 108 bp
0110 bp
. 114bp
0 128bp
. 132 bp
0136 bp
. 140bp
. 144bp
. 148 bp
Page A 14
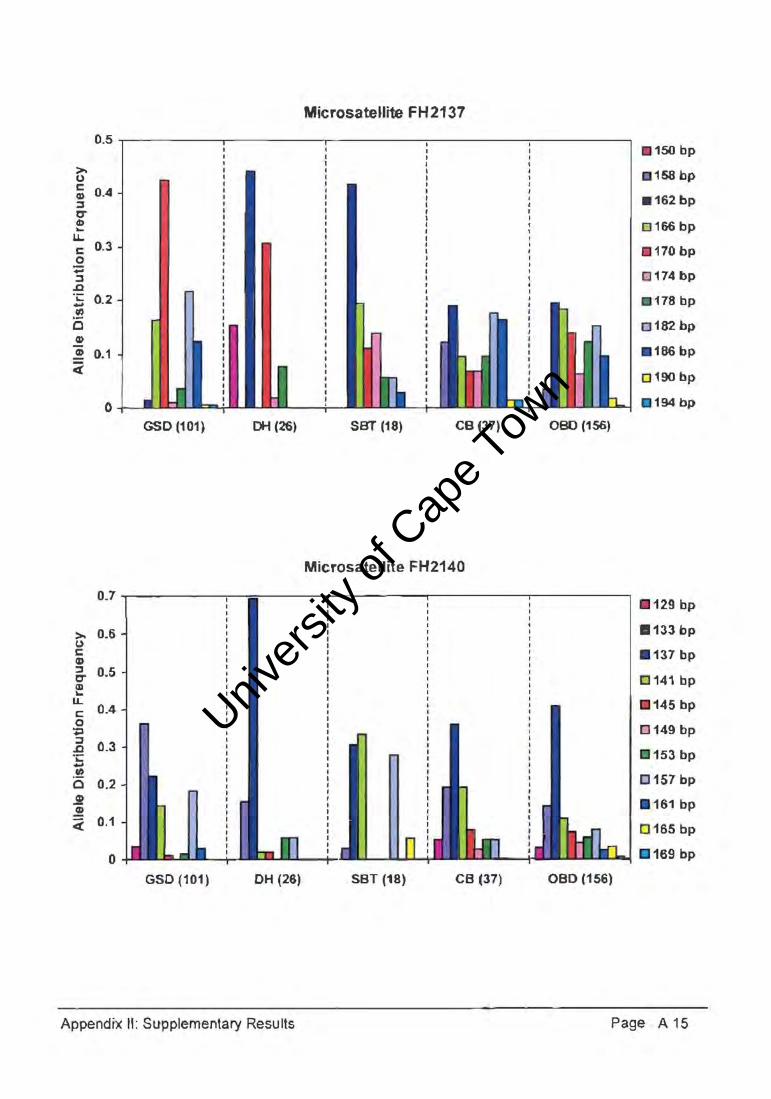
Univers
ity of
Cap
e Tow
n
Microsatemte FH2137
O.5~----------~----------~----------~----------------------~
>U I: Q) 0.4 ::s 0-eD ...
u.. I: 0.3 o
;:::; ::s .c :s 0.2 .! C Q)
CD 0.1
0-1---.........
GSO (101)
0.7
>- 0.6 u I: II) :::::I 0.5 0-Q) ...
U. I: 0.4 0 +:I ::s
0.3 .D ';:: ... . ~ a 0.2 ~ .!! <i 0.1
0
GSD (101)
DH (26)
DH (26)
Appendix II: Supplementary Results
SBT (18) CB (37)
Microsatellite FH2140
SST (18) CB (37)
080 (156)
oeD (156)
_ 150 bp
11 158 bp
.162 bp
0166 bp
_ 170 bp
0174 bp
. 178 bp
0182 bp
_ 166 bp
0190 bp
194 bp
. 129 bp
a133 bp
137 bp
0141 bp
. 145 bp
0149 bp
. 153 bp
0157 bp
. 161 bp
0165 bp
169 bp
Page A 15

Univers
ity of
Cap
e Tow
n
0.5
0.4
0.3
0.2
..! 0.1
GSO (101) DH (26)
0.6
0.5
0.4
0.3
0.2
0.1
GSD (101) OH (26)
Appendix II: Supplementary Results
Microsatellite FH2328
SST (18) CB (37)
Microsatellite AHT121
SBT (18) CB (37)
OBO (156)
OBO (156)
. 180 bp
.184 bp
.188 bp
0192 bp
. 196 bp
0200 bp
. 204 bp
0208 bp
. 212 bp
0216 bp
220 bp
79 bp
.85 bp
.87 bp
091 bp _ 93 bp
(;)95bp
[]97 bp
099 bp
. 101 bp 0103 bp
105 bp
107 bp
. 109 bp
. 111 bp
. 113 bp
Page A 16
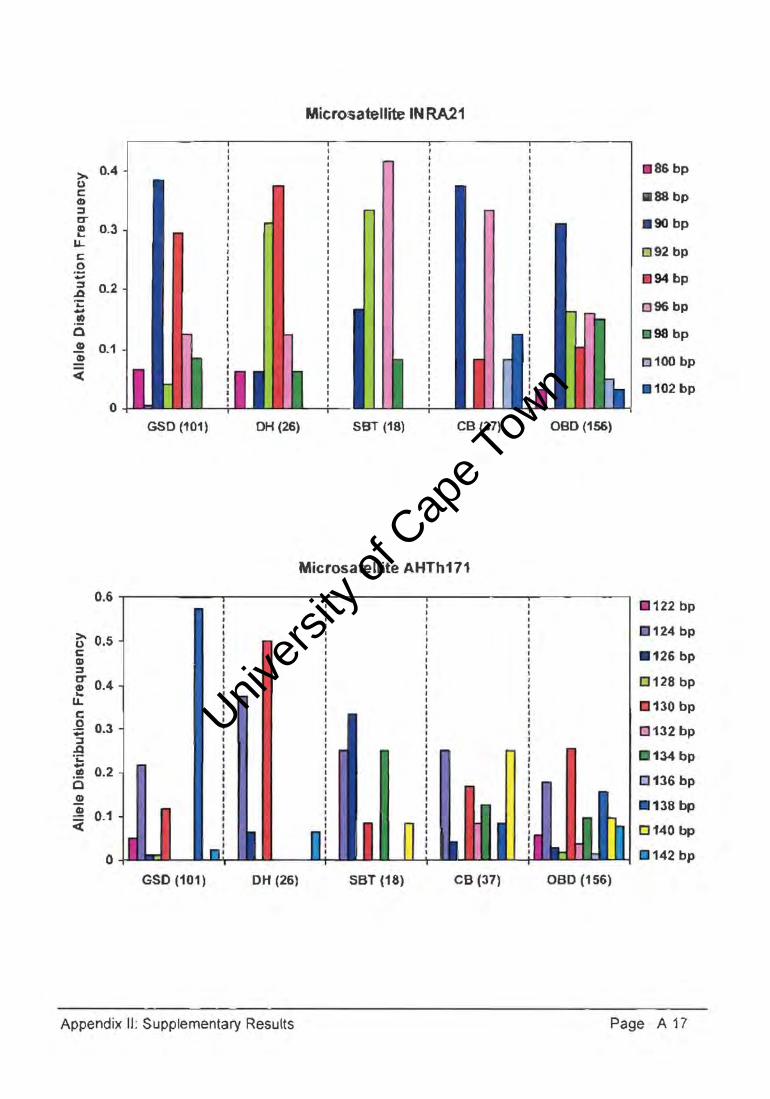
Univers
ity of
Cap
e Tow
n
>- 0.4 u r::: CD ::::I IT E 0.3
LL. r::: o -..; 0.2 L: ... . ! o .!! 0.1
o
0.6
>. 0.5 u c CD ::::I C" 0.4 (!) .. tL. C 0 0.3 ;:; ::::I .Q 'i: -0.2 .~ C ~ ~ 0.1 <
0
J t
Microsatellite IN RA21
UU I--+--GSO (101) OH (26) SBT (18) CB (37)
Microsatellite AHTh171
GSD (101) OH (26) SBT (18) CB (37)
Appendix II: Supplementary Results
t I I I I I
86 bp
11188 bp
. 90 bp
092 bp
94 bp
096bp
. 98 bp
0100 bp
UI l . 102bp
aBO (156)
122 bp
134 bp
142 bp
aBO (156)
Page A 17
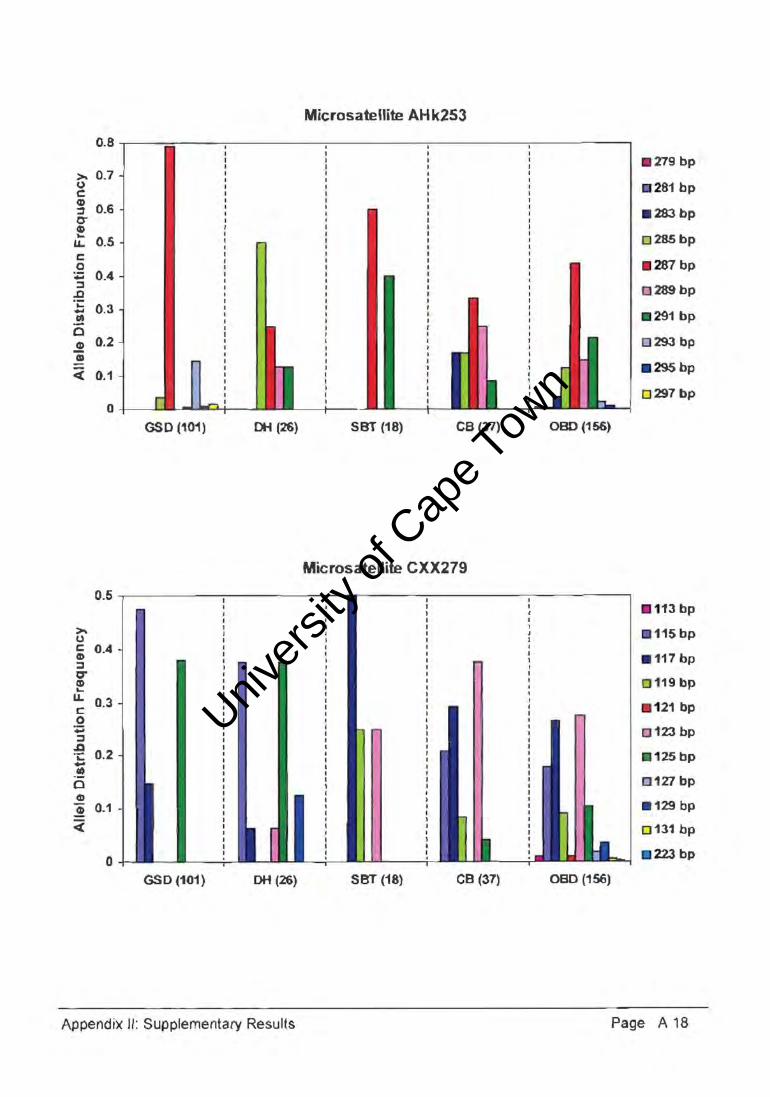
Univers
ity of
Cap
e Tow
n
0.8 , , I ,
>- 0.7 u
, I I
c: I Q)
0.6 ~
I , I
0- I
Q) I
"- 0.5 IJ.. c: 0 .. 0.4 ::::I .c .;:
0.3 ... .! 0 ..! 0.2 Q)
0( 0.1 , I I
0 r I
..."., I
GSD (101) DH (26)
Microsatellite AHk253
, I I I , I , ,
I , I I I I I I I I
I I I I I I I I I
SBT (18) CB (37)
Microsatemte CXX279
I I I I I I , I I I • ~
OBO (156)
. 279 bp
. 281 bp
. 283bp
0285bp
. 287 bp
0289bp
.291 bp
0293 bp
. 295bp
0297 bp
O.5~--------~~--------~--~------~--------------------~
>u :; 0.4 ::::I 0-eD .....
IJ.. 0.3 c: o .. ::::I .c .;: 0.2 -.! o CD CD 0.1 0(
o GSD (101) DH (26)
Appendix II: Supplementary Results
SBT (18) CB (37) OBO (156)
. 113 bp
. 115 bp
. 117 bp
01'19 bp
. 121 bp
a123 bp
.125bp
a127 bp
. 129 bp
0131 bp
223 bp
Page A 18

Univers
ity of
Cap
e Tow
n
0.6 . , >-CJ
0.5 c::
, I )
I G) :::
I J ,
C" , G) • ... 0.4 LL. c 0 ;:;
0.3 ::: ~ .;: .... ctl
C 0.2 Q)
G)
« 0.1
0 .., II I
GSO (101) OH (26)
0.5 >-CJ c::: G) ::: 0.4 C" e
LL. I:. 0.3 0 ;:; ::: .c .;:
0.2 -.!! 0 ~ ~ 0.1 «
0
GSD (101) DH (26)
Appendix II : Supplementary Results
Mic rosatellite F H 200 1
, , , , I , , , I , I , ,
SBT (18) CB (37)
MicrosatelJite FH2164
) . I , • I I I I , , I I I , I I I I I I , , I I I I I I I I I , I I I I I I I I I I , , , I I J I I • I , I I I , J I I , I I I , I , , I I , I ,
I II I I
) I
SBT (18) CB (37)
..I!!I II -. OBD (156)
· , · I
• I I I I I ,
I I I
I Lill ~ 080 (156)
. 120 bp
124bp
. 128 bp
0132 bp
. 136 bp
0140 bp
144 bp
0148 bp
. 152 bp
0156 bp
. 160 bp
. 246 bp 274 bp
. 298 bp
0302 bp
306bp
0310 bp
. 314 bp
0318 bp
. 322 bp 0326 bp
. 330 bp
0334 bp . 338 bp 0342 bp
. 346 bp
. 354 bp
Page A 19

Univers
ity of
Cap
e Tow
n
o.s
>-U I: 0.4 Q) :J C'" Q) ~
u... 0.3 I: 0 .. :J
.t:l 0.2 .~ -Cj)
c .!!
0.1 Q)
c(
0
~ 0.3 c: Q)
:J C'" Q) .... u.. I: 0.2 o +' :J .c .;: -.!! o 0.1 Q)
II)
<i
o
Microsatellite F H 2611
, I I I I I I I I I I , I I
r I < I \
I , I I I I I I I I I I I I \ I I I I \ I I I I I < I , I , , I I I , I < I I , I I I I I I
~ , I
I I I
r I , I
I I I < I
1 I I I I , I
GSD (101) OH (26) SST (18) CB (37)
Microsatellite FH2247
I I
h I
II I I
OBO (156)
. 185 bp
189 bp
.193 bp
0197 bp
. 201 bp
0205 bp
209 bp
0213 bp
. 217 bp
0221 bp
. 229 bp
. 171 bp
. 179bp .---------~----------~----------._--------~----------, . 1B3bp
GSD (101) DH (26) SST (18) CB (37) OBO (156)
0187 bp . 191 bp 0195 bp
199 bp 0203 bp . 207 bp 0211 bp . 215 bp . 219 bp . 223 bp
2Zl bp . 231 bp . 2:35 bp . 239 bp 0243 bp 0247 bp 0251 bp . 255 bp 0263 bp
Appendi)( II: Supplementary Results Page A 20
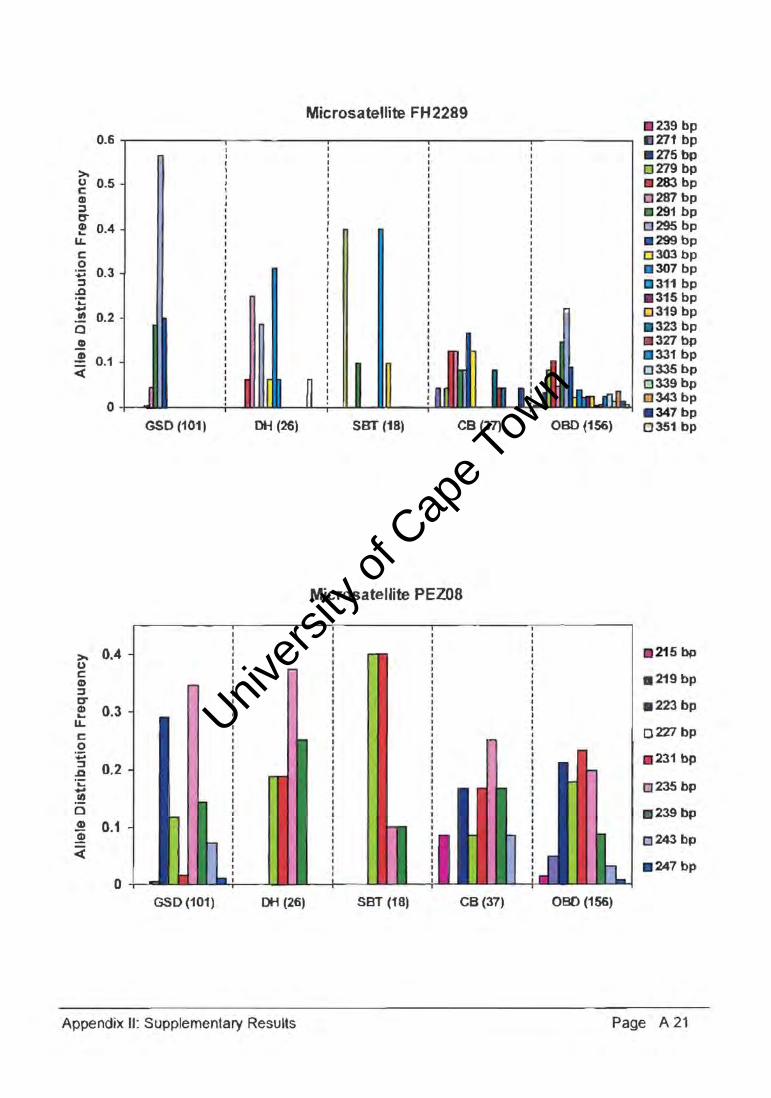
Univers
ity of
Cap
e Tow
n
0.6
>-u 0.5 c III j ~ III 0.4 L.
LL C 0 :;:; 0.3 j .0 ... .... In 0.2 a ~ ~ 0.1 c:(
0
GSD (101) DH (26)
>- 0.4 u c Q) j
D" Q) 0.3 ...
LL C 0 :;;; :::l 0.2 .0
.L: -.! Q Q) 0.1 ]! ;;:
0 .. .. GSD (101) DH (26)
Appendix II: Supplementary Results
Microsatellite FH2289
SBT (18) CB (37)
Microsatellite PEZ08
I I I I I I
, I""
SBT (18) CB (37)
I I I I I I , I I I I I I I I , , I I I I I I I I I I I , I I , I
080 (156)
l-
239 bp .271 bp . 275 bp 0279 bp . 283 bp 0287 bp
291 bp 0295 bp . 299 bp 0303 bp
307 bp . 311 bp .315 bp 0319 bp . 323 bp . 327 bp . 331 bp 0335 bp 0339 bp 0343 bp . 347 bp 0351 bp
L1I f1.
21 5bp
.219 bp
.223 bp
om bp
. 231 bp
0235 bp
. 239 bp
0243 bp
. 247 bp
080 (156)
Page A 21
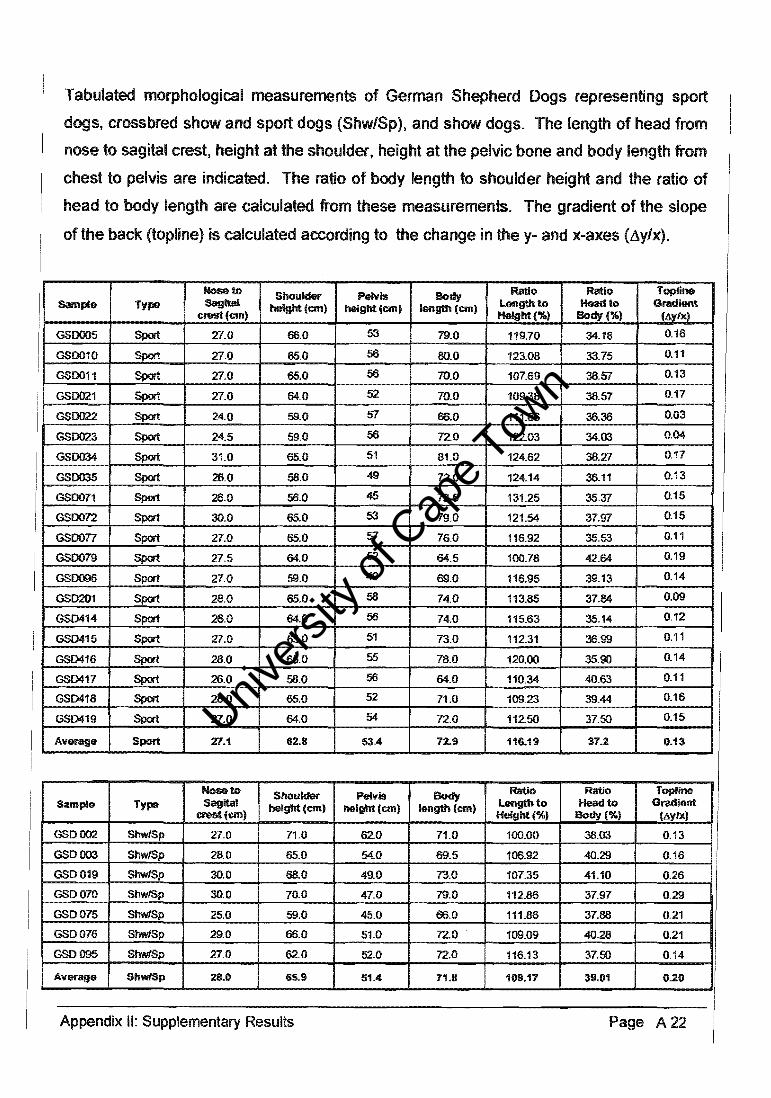
Univers
ity of
Cap
e Tow
n
Tabulated morphological measurements of German Shepherd Dogs representing sport
dogs, crossbred show and sport dogs (Shw/Sp), and show dogs. The length of head from
nose to sagital crest, height at the shoulder, height at the pelvic bone and body length from
chest to pelvis are indicated. The ratio of body length to shoulder height and the ratio of
head to body length are calculated from these measurements. The gradient of the slope
of the back (topline) is calculated according to the change in the y- and x-axes (fly/x).
No_to Shoulder Pelvis Body Ratio Ratio Toplioo
Sample Type Sagbl height(cm) height «em) length (em) length to Head to Gradient crest (em) Height(%) Body (%) (/l.ylx)
GSDOO5 Sport 27.0 66.0 53 79.0 119.70 34.18 0.16
GS0010 Sport 27.0 65.0 56 80.0 123.08 33.75 0.11
GS0011 Sport 27.0 65.0 56 70.0 107.69 38.57 0.13
GS0021 Sport 27.0 64.0 52 70.0 109.38 38.57 0.17
GSOO22 Sport 24.0 59.0 57 66.0 111.86 36.36 0.03
GS0023 Sport 24.5 59.0 56 72.0 122.03 34.03 0.04
GSD034 Sport 31.0 65.0 51 81.0 124.62 38.27 0.17
GSD035 Sport 26.0 58.0 49 72.0 124.14 36.11 0.13
GS0071 Sport 26.0 56.0 45 73.5 131.25 35.37 0.15
GS0072 Sport 30.0 65.0 53 79.0 121.54 37.97 0.15
GSoon Sport 27.0 65.0 57 76.0 116.92 35.53 0.11
GS0079 Sport 27.5 64.0 52 64.5 100.78 42.64 0.19
GSoog6 Sport 27.0 59.0 49 69.0 116.95 39.13 0.14
GSD201 Sport 28.0 65.0 58 74.0 0.09
GS0414 Sport 26.0 64.0 56 74.0 115.63 35.14 0.12
GS0415 Sport 27.0 65.0 51 73.0 112.31 36.99 0.11
GS0416 Sport 28.0 65.0 55 78.0 120.00 35.90 0.14
GS0417 Sport 26.0 58.0 56 64.0 110.34 40.63 0.11
GS0418 Sport 28.0 65.0 52 71.0 109.23 39.44 0.16
GS0419 Sport 27.0 64.0 54 72.0 112.50 37.50 0.15
Average Sport 27.1 62.8 53.4 72.9 116.19 37.2 0.13
No_to Shoulder Pelvis Body ~~~ Sample Type Sagital height (cm) height (em) length (em) length to Head to Gradient
aest(cm) • lAy/x)
GSOOO2 ShwfSp 27.0 no 62.0 71.0 0.13
GSOOO3 ShwJSp 28.0 65.0 54.0 69.5 106.92 40.29 0.16
GSOO19 ShwfSp 30.0 68.0 49.0 73.0 107.35 41.10 0.26
GS0070 ShwlSp 30.0 70.0 47.0 79.0 112.86 37.97 0.29
GS0075 ShwlSp 25.0 59.0 45.0 66.0 111.86 37.88 0.21
GS0076 Shw/Sp 29.0 66.0 51.0 n.o· 109.09 40.28 0.21
GS0095 ShwJSp 27.0 62.0 52.0 n.o 116.13 37.50 0.14
Average ShllWiSp 28.0 65.9 51.4 71.8 109.17 39.01 0.20
Appendix II: Supplementary Results Page A22

Univers
ity of
Cap
e Tow
n
Nose to Shoulder Pelvis . Body Ratio Ratio Sample Type Sagital (em) height (em) length (em) length to Head to
erest (em) Hei ht (%) Body(%)
GSD001 Show 30.0 52.0 82.0 113.89
GSD008 68.0 48.0 80.0 117.65
GSD020 68.0 44.0 75.0 110.29
GSD040 58.0 37.0 35.82 0.31
GSD042 47.0 0.24
GSD043 .0 45.0 0.30
GSD044 47.0 0.32
GSD048 Show 58.0 40.0 0.26
GSD049 Show 30.5 70.0 46.5 0.30
GSD050 Show 29.5 67.0 47.0 0.26
GSD051 Show 28.0 65.0 44.0 75.0 115.38 37.33 0.28
GSD052 Show 28.0 77.0 124.19 36.36 0.25
GSD053 Show 27.0 69.0 118.97
GSD055 Show 29.5 80.0 117.65
GSD056 Show 27.0 71.0 118.33
GSD057 Show 27.0 62.0 42.0 74.0 119.35
GSD058 Show 27.0 62.0 42.0 77.0 124.19 35.06 0.26
62.0 41.0 39.13 0.30
65.0 44.0 36.36 0.27
67.0 42.0 36.25 0.31
62.0 41.0 35.71 0.30
56.0 40.0 35.82 0.24
GSD064 Show 24.0 55.0 40.0 36.92 0.23
GSD065 Show 29.0 68.0 44.0 34.94 0.29
GSD066 Show 29.0 70.0 46.0 37.18 0.31
GSD067 Show 25.5 60.0 40.0 35.42 0.28
GSD069 Show 28.0 64.0 45.0 78.0 121.88 35.90 0.24
GSD080 Show 29.0 00.0 47.0 73.0 110.61 39.73 0.26
GSD098 Show 27.0 62.0 43.0 70.5 113.71 38.30 0.27
Show 27.0 61.0 44.0 69.0 113.11 39.13 0.25
Show 27.8 64.1 43.7 74.0 115.59 37.45 O.~
Appendix II: Supplementary ..... "":,.,. ....
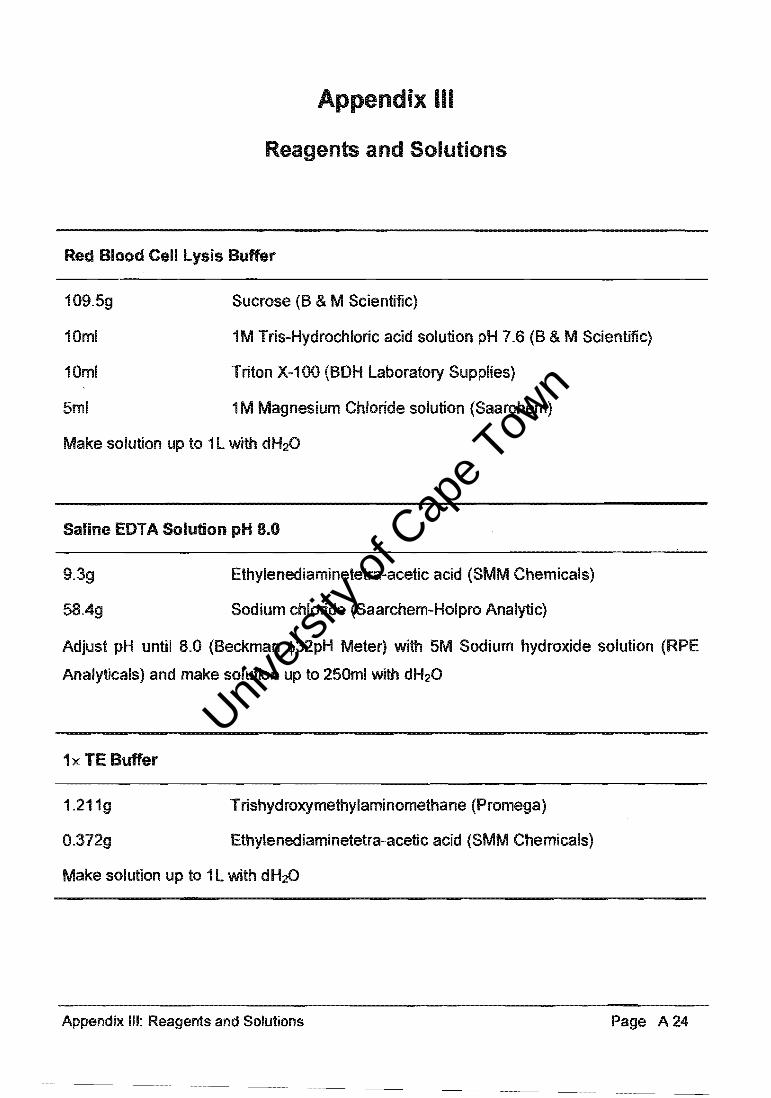
Univers
ity of
Cap
e Tow
n
Appendix III
Reagents and Solutions
Red Blood Cell Lysis Buffer
Sucrose (B & M Scientific) 109.5g
10ml
10ml
5ml
1 M Tris-Hydrochloric acid solution pH 7.6 (B & M Scientific)
Triton X-100 (BOH laboratory Supplies)
1 M Magnesium Chloride solution (Saarchem)
Make solution up to 1l with dH20
Saline EDT A Solution pH 8.0
9.3g
58.4g
Ethylenediaminetetra-acetic acid (SMM Chemicals)
Sodium chloride (Saarchem-Holpro Analytic)
Adjust pH until 8.0 (Beckman c!>32pH Meter) with 5M Sodium hydroxide solution (RPE
Analyticals) and make solution up to 250ml with dH20
1x TE Buffer
1.211g
0.372g
Trishydroxymethylaminomethane (Promega)
Ethylenediaminetetra-acetic acid (SMM Chemicals)
Make solution up to 1l with dH20
Appendix III: Reagents and Solutions Page A 24

Univers
ity of
Cap
e Tow
n
6% Aerylamide Solution
12ml
48g
10ml
-42ml
40% Acrylamide/Bis solution (Bio-Rad laboratories)
Urea (Riedel-deHaen)
1 Ox TBE buffer
dH20
Polymerise with 280IJI 20% Ammonium persulphate (BDH), 601J1 TEMED (Promega)
10x TBE Running Buffer
108g
55g
7.4g
T rishydroxymethylaminomethane (Promega)
Boric acid (B&M Scientific)
Ethylenediaminetetra-acetic acid (SMM Chemicals)
Make solution up to 1l with dH20 and autoclave (lasec)
Loading Buffer
20g (40%wlv)
0.125g
Sucrose (B&M Scientific)
Bromophenyl Blue (Merck)
Make solution up to 50ml with dH20
pH corrected with half a Sodium chloride pellet (Saarchem-Holpro Analytic)
Appendix III: Reagents and Solutions Page A 25

Univers
ity of
Cap
e Tow
n
Molecular Weight Marker (A-T ladder) using the Sequenase Kit (Amersham)
Hot primer
0.61-11 sdH20
6.671-11 -40 (17mer) universal primer
1.01-11 10x PNK buffer (Biolabs)
1.01-11l2p ATP (20J.LCi/J.Ll) (Amersham)
0.671-11 T4 PNK (Biolabs)
37°C for 30min, 90°C for 3min (Hybaid),
centrifuge (Beckman) at store at -20°C.
Add to annealed template
5.21-11 H20
2.01-11 MDTT
1.01-11 Multi-pol sequenase
Annealing Reaction
5.21-11 sdH20
101-11 ssM 13 DNA
41-11 Annealing buffer
4.81-11 End-labelled primer
37°C for 10min and 25°C for 10min
(Hybaid).
Termination Tubes
21-11 x 2 tubes ddATP
21-11 x 2 tubes ddTrp
Mix by pipetting gently and centrifuge (Beckman). Transfer 81-11 to each of the four tubes
of termination mix, pipetting gently and incubate at 37°C for 3min, followed by 70°C for
7min. To each tube add 71-11 stop solution and 31-11 H20, collect all reactions in one tube,
mix by pipetting gently and centrifuge. Store at -20°C, and denature at 90°C for 3min
before use, load 2.5~1 per well.
Appendix III: Reagents and Solutions Page A26
Related Documents