Vol.:(0123456789) 1 3 Conservation Genetics https://doi.org/10.1007/s10592-019-01172-6 RESEARCH ARTICLE Comparative landscape genetics of two endemic torrent salamander species, Rhyacotriton kezeri and R. variegatus: implications for forest management and species conservation Sarah L. Emel 1,2 · Deanna H. Olson 3 · L. Lacey Knowles 4 · Andrew Storfer 1 Received: 3 August 2018 / Accepted: 19 March 2019 © The Author(s) 2019 Abstract Comparative landscape genetic studies provide insights into whether relationships between landscape features and patterns of spatial genetic structure differ among populations, species, habitat types, and regions. For species with fragmented dis- tributions, especially when management practices contribute to fragmentation, tests of the factors structuring population connectivity are particularly important for understanding continued risks. We determined levels of genetic diversity and tested the relationships of landscape-scale vegetative, geographic, and climate variables with genetic distance in two con- generic, endemic salamander species with status of concern. Using microsatellite data for 326 Rhyacotriton kezeri and 557 Rhyacotriton variegatus individuals collected from 17 to 29 localities, respectively, we implemented a model of landscape resistance based on circuit theory. The northernmost portions of each species’ range is more fragmented than areas to the south, leading to the prediction that these areas would have relatively lower genetic diversity in response. Due to reliance of both species upon cold-water habitats, we predicted that landscape variables maintaining cool, moist microhabitats would be correlated with gene flow. Genetic structure was high overall and trended toward increasing with the proportion of the forested landscape. Based on maximum likelihood population effects models across genetic clusters and species, land cover and roads were the best predictors of genetic distance, even though the degree of fragmentation differed across each species’ geographic range. Our results suggest that forest cover is essential for dispersal in these salamanders, indicating negative effects of fragmentation resulting from timber harvest and other forest disturbances. Keywords Amphibian · Land cover · MLPE · Pacific Northwest · Rhyacotriton kezeri · Rhyacotriton variegatus Introduction Landscape genetic studies integrate population genetics, landscape ecology, and spatial statistics to develop and test predictions about the influence of landscape features on spa- tial population genetic structure and gene flow (Manel et al. 2003; Storfer et al. 2007). As an alternative to a null model of isolation by distance (IBD; Wright 1943), these analyses may identify certain landscape-scale variables as suitable macro-habitat conditions and also indicate features that may act as barriers to or facilitators of gene flow. Landscape genetics studies can, in turn, inform more targeted manage- ment approaches to promote species conservation than those that simply use existing information about habitat prefer- ences (Segelbacher et al. 2010). For example, recent studies on a range of taxa, including the hazel dormouse (Muscardi- nus avellanarius; Bani et al. 2017), the alpine newt (Ichthyo- saura alpestris; Luqman 2018), and wild tigers (Panthera Electronic supplementary material The online version of this article (https://doi.org/10.1007/s10592-019-01172-6) contains supplementary material, which is available to authorized users. * Sarah L. Emel [email protected] 1 School of Biological Sciences, Washington State University, PO Box 644236, Pullman, WA 99164-4236, USA 2 Organismic and Evolutionary Biology Graduate Program, University of Massachusetts Amherst, 204C French Hall, 230 Stockbridge Rd., Amherst, MA 01003-9316, USA 3 US Forest Service, Pacific Northwest Research Station, 3200 SW Jefferson Way, Corvallis, OR 97331, USA 4 Department of Ecology and Evolutionary Biology, University of Michigan, 1105 North University, Ann Arbor, MI 48109-1085, USA

Welcome message from author
This document is posted to help you gain knowledge. Please leave a comment to let me know what you think about it! Share it to your friends and learn new things together.
Transcript
Vol.:(0123456789)1 3
Conservation Genetics https://doi.org/10.1007/s10592-019-01172-6
RESEARCH ARTICLE
Comparative landscape genetics of two endemic torrent salamander species, Rhyacotriton kezeri and R. variegatus: implications for forest management and species conservation
Sarah L. Emel1,2 · Deanna H. Olson3 · L. Lacey Knowles4 · Andrew Storfer1
Received: 3 August 2018 / Accepted: 19 March 2019 © The Author(s) 2019
AbstractComparative landscape genetic studies provide insights into whether relationships between landscape features and patterns of spatial genetic structure differ among populations, species, habitat types, and regions. For species with fragmented dis-tributions, especially when management practices contribute to fragmentation, tests of the factors structuring population connectivity are particularly important for understanding continued risks. We determined levels of genetic diversity and tested the relationships of landscape-scale vegetative, geographic, and climate variables with genetic distance in two con-generic, endemic salamander species with status of concern. Using microsatellite data for 326 Rhyacotriton kezeri and 557 Rhyacotriton variegatus individuals collected from 17 to 29 localities, respectively, we implemented a model of landscape resistance based on circuit theory. The northernmost portions of each species’ range is more fragmented than areas to the south, leading to the prediction that these areas would have relatively lower genetic diversity in response. Due to reliance of both species upon cold-water habitats, we predicted that landscape variables maintaining cool, moist microhabitats would be correlated with gene flow. Genetic structure was high overall and trended toward increasing with the proportion of the forested landscape. Based on maximum likelihood population effects models across genetic clusters and species, land cover and roads were the best predictors of genetic distance, even though the degree of fragmentation differed across each species’ geographic range. Our results suggest that forest cover is essential for dispersal in these salamanders, indicating negative effects of fragmentation resulting from timber harvest and other forest disturbances.
Keywords Amphibian · Land cover · MLPE · Pacific Northwest · Rhyacotriton kezeri · Rhyacotriton variegatus
Introduction
Landscape genetic studies integrate population genetics, landscape ecology, and spatial statistics to develop and test predictions about the influence of landscape features on spa-tial population genetic structure and gene flow (Manel et al. 2003; Storfer et al. 2007). As an alternative to a null model of isolation by distance (IBD; Wright 1943), these analyses may identify certain landscape-scale variables as suitable macro-habitat conditions and also indicate features that may act as barriers to or facilitators of gene flow. Landscape genetics studies can, in turn, inform more targeted manage-ment approaches to promote species conservation than those that simply use existing information about habitat prefer-ences (Segelbacher et al. 2010). For example, recent studies on a range of taxa, including the hazel dormouse (Muscardi-nus avellanarius; Bani et al. 2017), the alpine newt (Ichthyo-saura alpestris; Luqman 2018), and wild tigers (Panthera
Electronic supplementary material The online version of this article (https ://doi.org/10.1007/s1059 2-019-01172 -6) contains supplementary material, which is available to authorized users.
* Sarah L. Emel [email protected]
1 School of Biological Sciences, Washington State University, PO Box 644236, Pullman, WA 99164-4236, USA
2 Organismic and Evolutionary Biology Graduate Program, University of Massachusetts Amherst, 204C French Hall, 230 Stockbridge Rd., Amherst, MA 01003-9316, USA
3 US Forest Service, Pacific Northwest Research Station, 3200 SW Jefferson Way, Corvallis, OR 97331, USA
4 Department of Ecology and Evolutionary Biology, University of Michigan, 1105 North University, Ann Arbor, MI 48109-1085, USA
Conservation Genetics
1 3
tigris; Thatte et al. 2018) have leveraged landscape genetic results to prioritize conservation goals for these species. Thus, there is a growing precedent for the incorporation of landscape genetics into conservation planning.
The majority of landscape genetic studies have focused on a single species in one portion of its range (Segelbacher et al. 2010; Storfer et al. 2010; Keller et al. 2014; Richard-son et al. 2016). However, comparative studies can provide insights into whether relationships between landscape fea-tures and genetic distance differ among taxa, habitat types, and geographic areas. Comparative studies examining either ecologically similar or distinct species in the same land-scape have become more common in recent years, providing novel perspectives on different species’ relationships with the landscape (Engler et al. 2014; Whiteley et al. 2014; Mims et al. 2015; Kierepka et al. 2016; Burkhart et al. 2017; Gutiérrez-Rodríguez et al. 2017). In one such study, Engler et al. (2014) determined that among three Hesperid butterfly species in the genus Thymelicus, recent human land conver-sion restricted gene flow in a poorly dispersing habitat spe-cialist, while a generalist with moderate dispersal abilities was restricted by climate, and another generalist that was the strongest disperser exhibited IBD. Similarly, in three amphibian species (Hyla arenicolor, Anaxyrus punctatus, and Spea multiplicata), Mims et al. (2015) determined that more philopatric species with longer larval periods exhibit greater genetic differentiation. Whiteley et al. (2014) found differences in the level of genetic differentiation of two ecologically similar Ambystomatid salamanders (Ambys-toma maculatum and A. opacum), pointing to differential responses to habitat fragmentation between species. Fur-thermore, Burkhart et al. (2017) identified three distinct landscape resistance layers as the top models explaining genetic distance in A. maculatum, and A. opacum, A. annu-latum), yet all unexpectedly indicated movement through dry areas. Thus, it is not always predictable how landscape-scale connectivity will relate to site-specific habitat studies, and closely-related organisms may respond differently to the same landscape. Hypothesis testing based on species’ biol-ogy may lead to the emergence of generalities as these com-parative landscape genetic studies become more common.
In contrast to assessing multiple species in the same study area, other studies have focused on a single species across different portions of its range (Short Bull et al. 2011; Trumbo et al. 2013; Castillo et al. 2016). This approach can be par-ticularly revealing for species with complex life histories, such as those that have distinct habitats for breeding, rear-ing, foraging, and dispersal, especially as conditions for each may vary with landscape-scale factors (Steele et al. 2009). Stream-breeding amphibians, which emerge and disperse across upland terrestrial habitats, may exemplify this type of ecological complexity. In one case, Trumbo et al. (2013) contrasted landscape use by the Cope’s giant salamander,
D. copei, in three distinct regions across its range, discover-ing that gene flow and the relative importance of particular landscape features varied greatly with regional habitat con-ditions. Whereas streams were essential for gene flow in one study region, in another area forest cover and solar radiation took precedence, demonstrating that application of ecologi-cal insights or conservation strategies from a single area to the species’ distribution would be inappropriate (Trumbo et al. 2013). This example demonstrates that comparative studies can provide key insights about ecological heteroge-neity that would not be possible with study designs focusing on a single species or a limited study area.
Herein, we apply a comparative landscape genetic approach to two closely related, geographically proximate, and ecologically similar torrent salamander species (Rhya-cotritonidae) across multiple portions of their heterogeneous geographic ranges. Torrent salamanders are endemic to the U.S. Pacific Northwest (Oregon, Washington, and northern California), occurring in small, cool, shaded stream habitats in moist coniferous forests (Sheridan and Olson 2003; Olson and Weaver 2007). They are highly sensitive to desiccation, warm temperatures, and ground disturbances that result in sedimentation of their instream breeding habitats, stressors which have been coincident with past timber harvest prac-tices in the region (Adams and Bury 2002). Adverse effects of timber harvest on torrent salamanders have been reported in multiple studies (Diller and Wallace 1996; Welsh and Lind 1996; Sheridan and Olson 2003; Olson and Weaver 2007; Olson and Burton 2014).
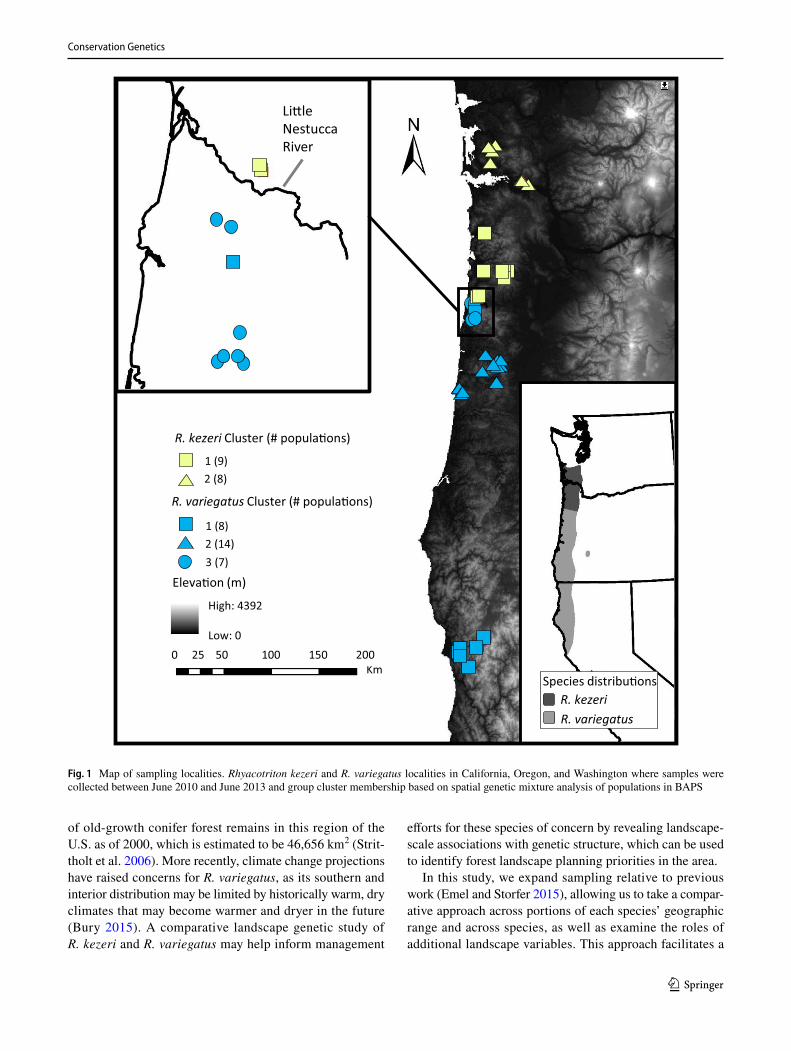
We focus our comparison on the Columbia torrent sala-mander, Rhyacotriton kezeri, which is endemic to coastal southwest Washington and northwest Oregon and has a restricted geographic range compared to other amphibians (Whitton et al. 2012), and its congener the southern torrent salamander, R. variegatus, which has a somewhat larger yet still restricted range extending south to northern Cali-fornia from their shared range boundary in coastal Oregon (Fig. 1). Both species are of conservation concern (ODFW 2008; CDFW BDB 2011), with R. kezeri proposed for list-ing under the U.S. Endangered Species Act (WSDOT 2017). Forest disturbances are key concerns for both species, as their ranges are highly managed for wood production in the Pacific Northwest, where timber harvest and associ-ated roads may degrade and fragment stream breeding and upland dispersal habitats (Bury and Corn 1988; Corn and Bury 1989). Other main land uses in these species’ ranges include paved roads and rural development. Also, fire has periodically affected forest habitat in these species’ ranges. For example, with the 1987 Silver Fire Complex (566 km2) and 2002 Biscuit Fire (2000 km2) in the R. variegatus range in Oregon, and four fires from 1933 to 1951 collectively known as the Tillamook Burn (1400 km2) in the R. kezeri range in Oregon. Approximately 28% of the historical area
Conservation Genetics
1 3
of old-growth conifer forest remains in this region of the U.S. as of 2000, which is estimated to be 46,656 km2 (Strit-tholt et al. 2006). More recently, climate change projections have raised concerns for R. variegatus, as its southern and interior distribution may be limited by historically warm, dry climates that may become warmer and dryer in the future (Bury 2015). A comparative landscape genetic study of R. kezeri and R. variegatus may help inform management
efforts for these species of concern by revealing landscape-scale associations with genetic structure, which can be used to identify forest landscape planning priorities in the area.
In this study, we expand sampling relative to previous work (Emel and Storfer 2015), allowing us to take a compar-ative approach across portions of each species’ geographic range and across species, as well as examine the roles of additional landscape variables. This approach facilitates a
Eleva�on (m)
R. variegatus Cluster (# popula�ons)
R. kezeri Cluster (# popula�ons)
LileNestuccaRiver
1 (8)2 (14)3 (7)
2 (8)1 (9)
High: 4392
Low: 0
Km0 25 50 100 150 200
R. kezeriR. variegatus
Species distribu�ons
Fig. 1 Map of sampling localities. Rhyacotriton kezeri and R. variegatus localities in California, Oregon, and Washington where samples were collected between June 2010 and June 2013 and group cluster membership based on spatial genetic mixture analysis of populations in BAPS
Conservation Genetics
1 3
comparison of the potential effects of relative differences in forest fragmentation on the two species, which is a conserva-tion concern. Specifically, the goals of this study are to: (1) compare levels of genetic diversity in relation to forest cover between the species and among different portions of each species’ distribution; and (2) determine environmental pre-dictors of genetic distance within each species by examining a mix of land cover type, geographic, and climate factors. We hypothesize that genetic diversity would be lower in R. kezeri due to smaller geographic range and restricted gene flow among populations, and that gene flow relies on dis-persal through landscape variables minimizing desiccation due to both species’ associations with cool aquatic habitats.
Materials and methods
Population sampling
Sampling localities (putative populations) were selected based on the habitat specificity of Rhyacotriton and the availability of previous locality information obtained from the California Natural Diversity Database, the Oregon Department of Fish and Wildlife, the Washington Depart-ment of Fish and Wildlife, and Miller et al. (2006). For R. kezeri, sampling occurred in two regions: north and south of the Columbia River in Washington and Oregon. For R. var-iegatus, we also sampled in two regions: the northernmost portion of the species’ range, and an area in the southern portion of its range in northern California, above the phylo-geographic barrier of the Smith River identified by Miller et al. (2006; Fig. 1). We opportunistically sampled 17–20 individuals from each of 17 localities for R. kezeri and 29 localities for R. variegatus between 2010 and 2013 (general locality information available in Online Resource 1; due to conservation concern for these species, detailed informa-tion may be made available upon request). Adult and larval salamanders were captured by hand or net. Tissues were sampled in the form of tail clips (< 1 cm) taken with a sharp razor blade to minimize suffering and preserved in 95% etha-nol. All salamanders were released after tissue collection. This study was carried out under Animal Subjects Protocol #04146-001 of the Washington State University Institutional Animal Care and Use Committee (IACUC) and under the guidance of the US Forest Service prior to its institution of IACUC for amphibians.
Population genetic analysis
DNA was extracted from all samples using Qiagen DNeasy© Blood & Tissue Kits (Qiagen, Inc., Germantown, MD) according to the manufacturer’s protocol. Ten microsatel-lite loci were amplified using fluorescently-labeled primers
in 326 individuals of R. kezeri and 557 individuals of R. variegatus, following a standard protocol (Emel and Storfer 2014). Fragment analysis was performed on an ABI 3730XL automated sequencer (Life Technologies, Inc., Carlsbad, CA, USA) at Washington State University. Genotyping was car-ried out using GeneMapper® Software v4.1 and Peak Scan-ner™ Software v1.0 (Life Technologies, Inc.).
We used the software COLONY v2.0 (Wang 2004; Wang and Santure 2009) to identify full siblings using a maximum likelihood approach. We then removed individu-als such that full sibling families had no greater than two members with a sibship probability greater than 0.9 repre-sented for each sampling locality, as including siblings may artificially inflate inbreeding and pairwise genetic distance estimates (Goldberg and Waits 2010). Consequently, one R. kezeri and four R. variegatus individuals were removed from subsequent analyses, yielding final sample sizes of 325 and 558, respectively. We assessed locus quality using MICROCHECKER v2.2.3 (van Oosterhout et al. 2004) and FREENA (Chapuis and Estoup 2007; Chapuis et al. 2008). We tested for departures from Hardy–Weinberg equilibrium among loci and sites and linkage disequilibrium between pairs of loci, both using a Bonferroni correction for multi-ple comparisons in GENEPOP v4.2 (Raymond and Rousset 1995; Rousset 2008).
We performed a spatial genetic mixture analysis of locali-ties (subsequently referred to as populations, due to their concordance with genetic structure) in BAPS v6.0, which incorporates geographic coordinates as priors in a Bayesian model, improving its ability to assign populations to clusters when the genetic data are not conclusive (Corander et al. 2007). We selected this model specifically due to its abil-ity to incorporate spatial information, which is not possible in programs such as STRU CTU RE. We varied K (number of clusters) between 2 and 17 for R. kezeri, and between 2 and 29 for R. variegatus. Evanno et al. (2005) suggested that the K with the lowest maximum likelihood (logML) found by Bayesian clustering algorithms was rarely the cor-rect number of clusters and proposed an alternative method for selecting K; unfortunately, this method is not possible with the output of BAPS, thus we identified the best sup-ported K by the greatest change in log maximum likelihood (ΔlogML). Based on preliminary results, we performed an individual-based admixture BAPS analysis for R. kezeri pop-ulations 10 and 11. Because results of Bayesian clustering approaches must be considered alongside other genetic and ecological information for a species (Janes et al. 2017), we thus took prior phylogeographic findings (Miller et al. 2006) and extreme barriers (the Columbia river) into account when selecting the genetic clusters for downstream analysis.
We calculated summary genetic diversity statistics per population using GenAlEx v6 (Peakall and Smouse 2006), including sample size (N), average number of alleles per
Conservation Genetics
1 3
locus (AR), average number of expected alleles per locus (Ae), observed heterozygosity (Ho), Nei’s unbiased estimate of expected heterozygosity (He); and the inbreeding coef-ficient, (FIS). To determine differences between the species for these summary measures, we performed one-tailed t-tests to include the direction of the difference in R v3.4.4 (R Core Team 2018).
We used two measures of pairwise genetic distance among all populations: F′ST, which is FST divided by its maximum possible value, calculated with GenoDive v2.0b27 (Meirmans and van Tienderen 2004) and DPS, which is one minus the proportion of shared alleles, calculated in Micro-satellite Analyzer v4.05; (Dieringer and Schlötterer 2003). FST is frequently used in population and landscape genetic studies (Emel and Storfer 2012), and the standardized meas-ure F′ST allows for direct comparison between species by correcting for within-population variation (Meirmans and Hedrick 2011). DPS is less frequently used, but it is not sub-ject to the equilibrium assumptions inherent in using FST and its analogs to estimate gene flow, and it is thus potentially more appropriate for this study due to likely non-equilibrium conditions caused by recent human disturbance throughout the study area.
Forest fragmentation analysis
To compare the habitat fragmentation with genetic diver-sity for each species, we used land cover data based on a 16-category scheme from the National Land Cover Database (Homer et al. 2007). We trimmed this layer to rectangles bounded by the maximum spatial extent of the localities for each genetic cluster identified per species, plus a 10-km buffer, and combined the three forest categories into one. Next, we calculated four class metrics based on all forest patches (contiguous forest areas) within each rectangle (landscape) using FRAGSTATS v4.2 (McGarigal et al. 2012). The first metric is the proportion of the landscape covered by forest, ranging from no forest (0) to entirely for-ested (1). Next, we examined patch density, the number of patches per 100 hectares, which ranges from no forest (0) to a value constrained by the cell size of the landscape data and is informative as a comparative measure because resolution is held constant across landscapes. Additionally, we used two metrics based on the cumulative distribution of patch sizes. The landscape division index, defined as the prob-ability that two randomly selected pixels of the same patch type are in different patches, ranges from entirely forested (0) to almost entirely non-forest with only a single small forest patch as it approaches 1. Finally, we calculated the splitting index, which is the number of patches of equal size that could yield the same landscape division index, ranging from entirely forest (1) to the number of cells in the land-scape squared. Thus, higher values reflect increased forest
fragmentation for all of these metrics. The results were com-pared qualitatively with the genetic diversity measures for each genetic cluster.
Landscape genetic analysis
As in forest fragmentation analysis, we created rectangu-lar resistance surfaces for each genetic cluster bounded by the maximum spatial extent of the localities plus a 10-km buffer for each of ten different landscape and climate vari-ables that were important in previous amphibian landscape genetic studies (see Spear and Storfer 2008, 2010; Trumbo et al. 2013; Zancolli et al. 2014; Emel and Storfer 2015). Three of ten landscape variables analyzed were the dis-crete variables of land cover (described above; Homer et al. 2007), road cover (North American Detailed Streets, ESRI, Redlands, CA), and stream cover (Streamnet GIS Data 2003), which we downloaded as vector data and converted into raster data. The seven remaining variables examined were continuous. These variables included percent canopy cover based on tree canopy density (Homer et al. 2007), annual frost-free period (Rehfeldt 2006), annual growing season precipitation (Rehfeldt 2006), compound topographic index (Moore et al. 1993; Gessler et al. 1995), heat load index (McCune and Keon 2002), roughness (Blaszczynski 1997; Riley et al. 1999), and slope. Canopy cover, frost-free period, and growing season precipitation were down-loaded in the form of raster files. Compound topographic index, heat load index, roughness, and slope were calcu-lated from the National Elevation Dataset digital elevation model (Gesch et al. 2002; Gesch 2007) using the Geomor-phometry and Gradient Metrics toolbox v2.0-0 for ArcGIS (Evans et al. 2014). Compound topographic index is an estimate of soil wetness based on the expected movement of water downhill, heat load index reflects the amount of solar radiation reaching a surface, and roughness quantifies the change in elevation per unit area (Evans et al. 2014). To test for nonlinear relationships between these continuous variables and genetic distance, after rescaling all variables to range from 0 to 1 we created two transformed resistance surfaces for each variable: T1 = 100
(originalcostsurface) , and T2 = 100 − 100
(1−originalcostsurface) . T1 represents a scenario in which the slope of the resistance function is shallow at low resistance and steep at high resistance, whereas T2 has the opposite effect on the resistance function (Trumbo et al. 2013).
All resistance layers created for the landscape variables were at 30-m resolution with the exception of frost-free period and growing season precipitation, which were at 0.008333 decimal degrees, or approximately 825-m resolu-tion. We created resistance surfaces for each variable using ArcGIS 10.0 (ESRI, Redlands, CA). For canopy cover, frost-free period, growing season precipitation, and topographical
Conservation Genetics
1 3
roughness, each raster cell reflected the value measured for that variable. We predicted that high canopy cover, high com-pound topographic index, long frost-free period, and high growing season precipitation would promote gene flow, hence we subtracted the value of each cell from the maximum value across all regions for each variable, so that low values would result in high cost. For heat load index and slope, we used the raw value as the cost, because we predicted high values of these variables to be associated with low gene flow. Because the effect of land cover type on these salamanders beyond simply the degree of canopy cover is unknown, we examined categorical land cover in addition to percent can-opy cover described above by assigning a resistance of 10 or 100 for developed or barren land, 5 or 50 for non-forested vegetated land (e.g. grassland/herbaceous), and 1 for for-ested habitat, with the expectation that genetic distance will increase for paths crossing non-forested or developed land compared to forest. For stream cover, we first converted the vector data, which represents streams as linear elements, to raster data at 30-m, where each cell denotes the presence or absence of a stream. We then developed three alternative cost ratios for the resistance associated with dispersal over land versus dispersal via stream corridors because it was unknown a priori how strongly land restricts movement in Rhyaco-triton over stream, but likely that it would be important for shaping gene flow. In all cases, stream pixels were assigned a resistance value of 1, while land pixels were assigned a value of 2, 10, or 100, because movement on land would presumably be at least twice as costly as movement within streams, but potentially quite a bit more costly (see Spear and Storfer 2008, 2010). We followed a similar procedure for road cover, except that we assigned non-road pixels a resistance of 1, and road pixels a resistance of 2, 10, or 100 because presumably roads are barriers to gene flow for these species. Thus, the best-supported cost ratios for these linear variables were determined via model selection (see below). Finally, for all variables, pixels containing high order rivers (Gary et al. 2010) or ocean were assigned a high cost of 20,000 to prevent the creation of unrealistic paths that would assume movement through these water bodies.
For each landscape variable, we created models of move-ment through the landscape based on circuit theory in Cir-cuitscape v4.0.5 (McRae et al. 2008), in which paths between populations are modeled similarly to parallel resistors in a circuit. This method allows for multiple paths to exist between each pair of populations, in stark contrast to the single ide-alized path identified by least-cost paths, another frequently used approach, or a limited number of paths as in least-cost corridors. Additionally, Circuitscape resistance distances are less sensitive than least-cost paths, to the number of pixels used to represent the landscape and to the Euclidean distance between localities (Marrotte and Bowman 2017). Within each genetic cluster, we determined the pairwise average
Circuitscape resistance using each of the landscape resistance surfaces listed above, based on a network connecting cells to their eight immediate neighbors. We also created a null model of IBD using a surface with all cells set to a value of 1.
To assess the relationship between the landscape variables and genetic distance, we applied linear mixed-effects models with maximum likelihood-population effects (MLPE; Clarke et al. 2002). All statistical analyses were performed in R (R Core Team 2018). MLPE accounts for the dependency of pairwise genetic distances with a specific covariance struc-ture. Following the procedure of van Strien et al. (2012), we centered each variable around zero and fitted MLPE models with restricted maximum likelihood (REML) using the R package lme4 (Bates et al. 2015). We created separate MLPE models using both DPS and F′ST as the response vari-ables and each individual Circuitscape resistance model as a fixed effect. Population was included as a random effect, because differences between the pairs of populations may explain some of the variance in the models. The top models for each genetic distance measure and within each cluster were selected using the lowest Akaike Information Criterion corrected for finite sample size (AICc), implemented in the R package MuMIn (Bartoń 2018) setting sample size equal to the number of localities as opposed to the number of pairwise comparisons, and the Bayesian Information Criterion (BIC), implemented in the R base stats package, both of which are appropriate for REML models (Gurka 2006). We considered all models within ΔAICc < 2 of the model with the lowest AICc to be the top models, because these all have similar support. Although Franckowiak et al. (2017) recently called into question the appropriateness of model selection via AIC and related information criterion approaches due to selection of overly complex models, this concern is not applicable to our univariate Circuitscape analysis. Additionally, we used the method developed by Nakagawa and Shielzeth (2012) implemented in the R package GLMM (Johnson 2014) to approximate R2 as a measure of goodness-of-fit for fixed effects alone (marginal R2) and both fixed and random effects combined (conditional R2) from mixed-effects models.
Results
Population genetic analysis
Analyses of locus quality by population in MICRO-CHECKER indicated no evidence of large allele dropout in either species, and potential scoring error due to stuttering in 1–3 loci for the majority of R. variegatus populations. It also indicated the presence of null alleles in nearly every popu-lation analyzed. However, there were insufficient samples for MICROCHECKER to run in all populations. Thus, we also assessed the presence of null alleles using FreeNA and
Conservation Genetics
1 3
obtained pairwise FST values using the ENA correction. We then determined that the ENA-corrected FST is very highly correlated with uncorrected FST (r > 0.99, p < 0.0001), and thus would have minimal impact on subsequent results.
For R. kezeri, there were 18 departures from Hardy–Wein-berg equilibrium after Bonferroni correction, with no loci consistently in disequilibrium across different pairings of populations and loci. We removed one locus, Rhyvar_56006, from analyses of R. kezeri, due to its high number of popula-tions out of Hardy–Weinberg Equilibrium. Additionally, we removed the locus Rhyvar_36876 from R. kezeri analyses, as it was monomorphic in 13 of 17 populations. Thus, all subse-quent analyses were performed using 8 of 10 loci for R. kezeri. Based on Δlog ML from the BAPS analysis for R. kezeri, we found the most support for K = 3, however, when taking into consideration the biology of the species and the restriction of Δlog ML approach to K ≥ 3, it was determined that K = 2 is most appropriate (Online Resource 2). Two populations north of the Columbia River, 10 and 11, cluster with the popula-tions to the south, despite the substantial barrier between them (Online Resource 3). Our individual-based analysis revealed that these populations are highly admixed, with fewer than 60% of individuals in each assigned to the northern cluster. Thus, landscape genetic analyses were performed among the populations dividing the sampling localities into two spatially distinct clusters separated by the Columbia River (Fig. 1). Pairwise DPS among localities were high overall while F′ST was low on average (mean ± SE; R. kezeri south (Cluster 1): DPS = 0.460 ± 0.023, F′ST = − 0.005 ± 0.056; R. kezeri north (Cluster 2): DPS = 0.378 ± 0.037, F′ST=-0.064 ± 0.072; Online Resource 4).
For R. variegatus, there were no departures from Hardy–Weinberg equilibrium after Bonferroni correction, yet there was evidence of linkage disequilibrium in 8 of 45 pairs of loci. However, no loci were consistently in disequi-librium and thus analyses of R. variegatus were performed with all 10 loci. All further analyses of R. variegatus were performed separately on the three clusters identified pre-viously (Emel and Storfer 2015), which were maintained with the addition of data from new populations examined in this study (Fig. 1; Online Resources 2, 3). Pairwise DPS and F′ST were high overall (R. variegatus south (Cluster 1): DPS = 0.634 ± 0.030, F′ST = 0.535 ± 0.051; R. variegatus north (Cluster 2): DPS = 0.490 ± 0.012, F′ST = 0.310 ± 0.018; northernmost R. variegatus (Cluster 3): DPS = 0.372 ± 0.037, F′ST = 0.309 ± 0.061; Online Resource 5).
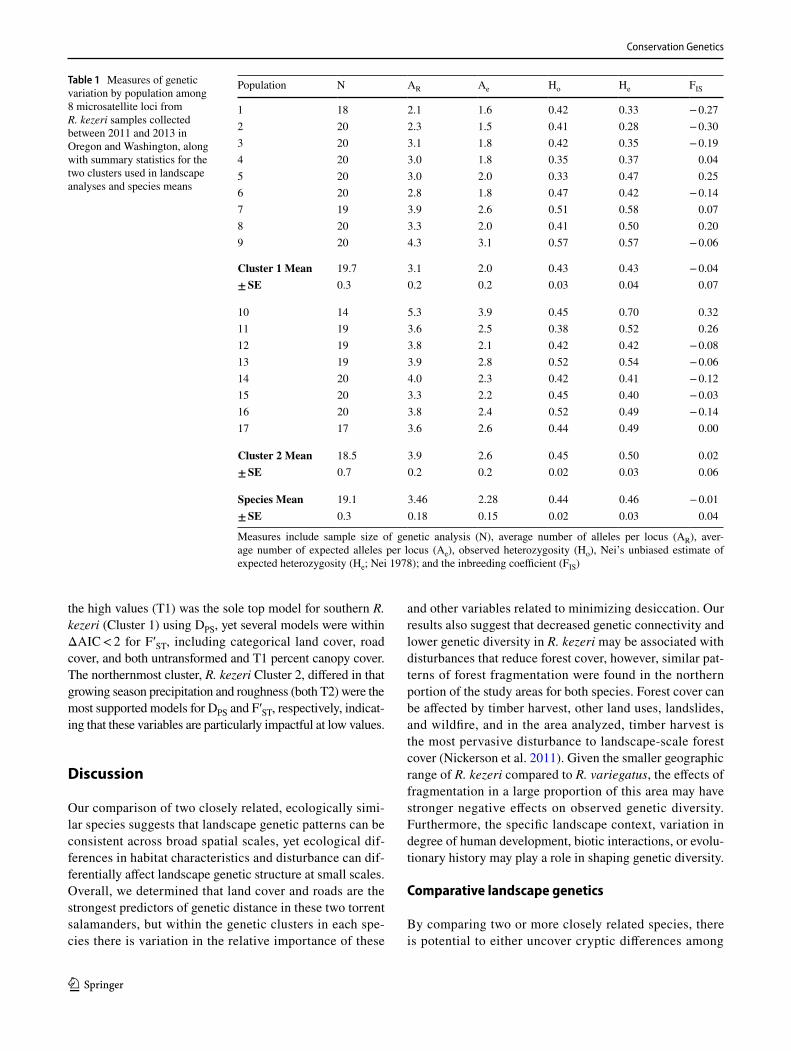
Summary genetic diversity statistics indicated overall lower genetic diversity within the R. kezeri than in the R. variegatus populations sampled (Tables 1, 2). Mean AR for R. kezeri populations was lower than the mean for R. varieg-atus (p = 0.007). Similarly, mean Ho was lower for R. kezeri than for R. variegatus (p = 0.005). Mean FIS was lower for R. kezeri than for R. variegatus (p < 0.001), indicating lower
inbreeding in R. variegatus. In contrast, mean He was higher in R. kezeri than in R. variegatus (p = 0.05). Additionally, mean Ae did not differ significantly between species.
Additionally, genetic diversity varied among the genetic clusters within species. The northern cluster for R. kezeri (Cluster 2) trended toward higher mean AR, Ae, Ho, and He, than the Cluster 1 (Table 1). There was no clear trend for these metrics among the R. variegatus clusters, although AR, Ae, and He were lowest in the northernmost cluster (Cluster 3; Table 2). There was no clear trend in FIS within species.
Forest fragmentation
Analyses of four class metrics of forest cover suggested a higher level of fragmentation in the northernmost portions of both species’ ranges (R. kezeri Cluster 2 and R. variegatus Clus-ter 3) than in the southern portion of their ranges (Table 3). Specifically, the proportion of the landscape covered in forest was lower for these two clusters relative to the others, and con-cordantly, patch density, landscape division index, and splitting index were all higher in these clusters as well. The proportion of forested landscape trended toward increasing with decreas-ing genetic diversity, but there is no clear pattern (Tables 1, 2, 3). Overall, the class metrics do not suggest a trend toward higher degree of fragmentation in the R. kezeri study area over-all, despite the lower average genetic diversity in this species.
Landscape genetic analysis
In all cases except for the northern cluster of R. variega-tus (Cluster 2), Circuitscape models based on landscape variables outperformed the null model of IBD (Table 4). Across clusters and genetic distance measures, categorical land cover was the most frequently supported model, at vari-ous and often multiple cost ratios. Road cover also appeared multiple times among the top models, at 1:10 and 1:100 cost ratios. Additionally, models based on percent canopy cover, heat load index, growing season precipitation, and roughness were all supported. Compound topographic index, length of the frost-free period, and notably stream cover were vari-ables not included in the top models.
There were also consistent differences in the most sup-ported Circuitscape models across clusters as well as species. In southern R. variegatus (Cluster 1), categorical land cover was always the top model, whereas in northern Cluster 2, cat-egorical land cover was equally weighted with the null model, suggesting that distance alone may drive genetic differentia-tion in that cluster. In contrast, road cover was the exclusive variable in the top models for the northernmost Cluster 3, at a cost ratio of 1:10 or 1:100, suggesting a strong effect of roads on gene flow. For R. kezeri, there was much more variation across clusters and genetic distance metrics than in R. var-iegatus. Heat load index with a higher emphasis placed on
Conservation Genetics
1 3
the high values (T1) was the sole top model for southern R. kezeri (Cluster 1) using DPS, yet several models were within ΔAIC < 2 for F′ST, including categorical land cover, road cover, and both untransformed and T1 percent canopy cover. The northernmost cluster, R. kezeri Cluster 2, differed in that growing season precipitation and roughness (both T2) were the most supported models for DPS and F′ST, respectively, indicat-ing that these variables are particularly impactful at low values.
Discussion
Our comparison of two closely related, ecologically simi-lar species suggests that landscape genetic patterns can be consistent across broad spatial scales, yet ecological dif-ferences in habitat characteristics and disturbance can dif-ferentially affect landscape genetic structure at small scales. Overall, we determined that land cover and roads are the strongest predictors of genetic distance in these two torrent salamanders, but within the genetic clusters in each spe-cies there is variation in the relative importance of these
and other variables related to minimizing desiccation. Our results also suggest that decreased genetic connectivity and lower genetic diversity in R. kezeri may be associated with disturbances that reduce forest cover, however, similar pat-terns of forest fragmentation were found in the northern portion of the study areas for both species. Forest cover can be affected by timber harvest, other land uses, landslides, and wildfire, and in the area analyzed, timber harvest is the most pervasive disturbance to landscape-scale forest cover (Nickerson et al. 2011). Given the smaller geographic range of R. kezeri compared to R. variegatus, the effects of fragmentation in a large proportion of this area may have stronger negative effects on observed genetic diversity. Furthermore, the specific landscape context, variation in degree of human development, biotic interactions, or evolu-tionary history may play a role in shaping genetic diversity.
Comparative landscape genetics
By comparing two or more closely related species, there is potential to either uncover cryptic differences among
Table 1 Measures of genetic variation by population among 8 microsatellite loci from R. kezeri samples collected between 2011 and 2013 in Oregon and Washington, along with summary statistics for the two clusters used in landscape analyses and species means
Measures include sample size of genetic analysis (N), average number of alleles per locus (AR), aver-age number of expected alleles per locus (Ae), observed heterozygosity (Ho), Nei’s unbiased estimate of expected heterozygosity (He; Nei 1978); and the inbreeding coefficient (FIS)
Population N AR Ae Ho He FIS
1 18 2.1 1.6 0.42 0.33 − 0.272 20 2.3 1.5 0.41 0.28 − 0.303 20 3.1 1.8 0.42 0.35 − 0.194 20 3.0 1.8 0.35 0.37 0.045 20 3.0 2.0 0.33 0.47 0.256 20 2.8 1.8 0.47 0.42 − 0.147 19 3.9 2.6 0.51 0.58 0.078 20 3.3 2.0 0.41 0.50 0.209 20 4.3 3.1 0.57 0.57 − 0.06
Cluster 1 Mean 19.7 3.1 2.0 0.43 0.43 − 0.04± SE 0.3 0.2 0.2 0.03 0.04 0.07
10 14 5.3 3.9 0.45 0.70 0.3211 19 3.6 2.5 0.38 0.52 0.2612 19 3.8 2.1 0.42 0.42 − 0.0813 19 3.9 2.8 0.52 0.54 − 0.0614 20 4.0 2.3 0.42 0.41 − 0.1215 20 3.3 2.2 0.45 0.40 − 0.0316 20 3.8 2.4 0.52 0.49 − 0.1417 17 3.6 2.6 0.44 0.49 0.00
Cluster 2 Mean 18.5 3.9 2.6 0.45 0.50 0.02± SE 0.7 0.2 0.2 0.02 0.03 0.06
Species Mean 19.1 3.46 2.28 0.44 0.46 − 0.01± SE 0.3 0.18 0.15 0.02 0.03 0.04
Conservation Genetics
1 3
populations or species, or support expected similarities related to shared evolutionary histories among lineages. In this study, Circuitscape models produced largely consist-ent results across two congeneric salamander species with
similar habitat requirements. Of the 10 tested variables, two were frequently among the top models in both species: categorical land cover and road cover. All three resistance ratios tested for categorical land cover appeared among
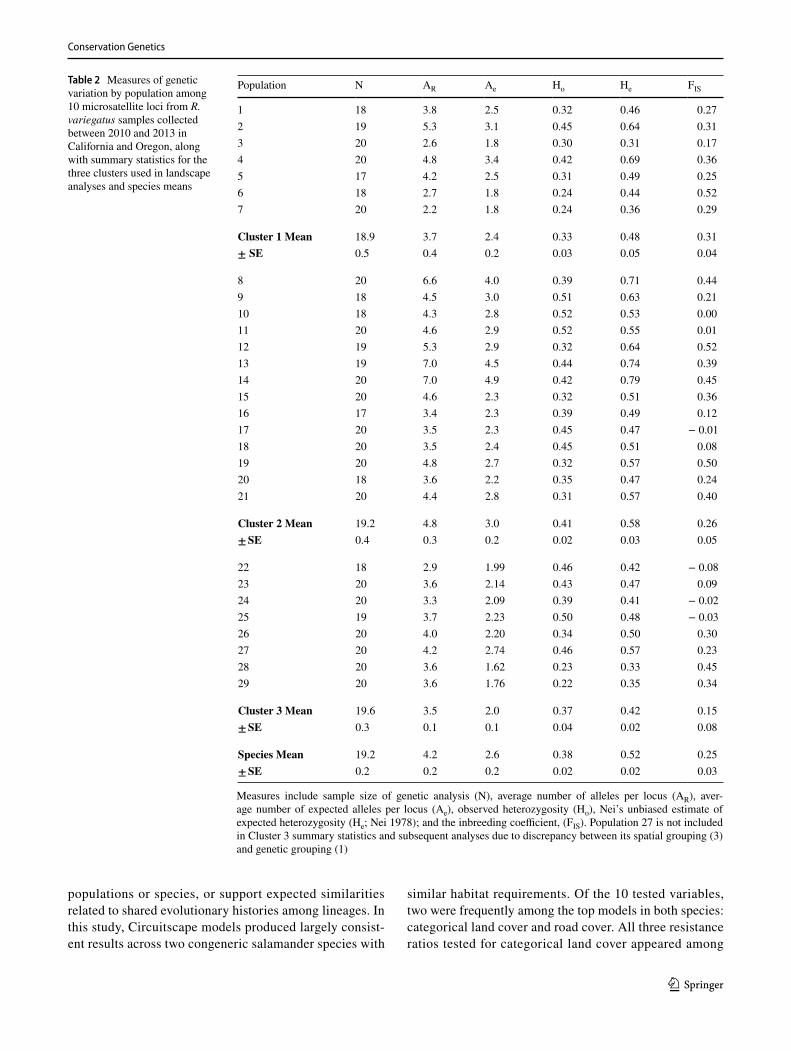
Table 2 Measures of genetic variation by population among 10 microsatellite loci from R. variegatus samples collected between 2010 and 2013 in California and Oregon, along with summary statistics for the three clusters used in landscape analyses and species means
Measures include sample size of genetic analysis (N), average number of alleles per locus (AR), aver-age number of expected alleles per locus (Ae), observed heterozygosity (Ho), Nei’s unbiased estimate of expected heterozygosity (He; Nei 1978); and the inbreeding coefficient, (FIS). Population 27 is not included in Cluster 3 summary statistics and subsequent analyses due to discrepancy between its spatial grouping (3) and genetic grouping (1)
Population N AR Ae Ho He FIS
1 18 3.8 2.5 0.32 0.46 0.272 19 5.3 3.1 0.45 0.64 0.313 20 2.6 1.8 0.30 0.31 0.174 20 4.8 3.4 0.42 0.69 0.365 17 4.2 2.5 0.31 0.49 0.256 18 2.7 1.8 0.24 0.44 0.527 20 2.2 1.8 0.24 0.36 0.29
Cluster 1 Mean 18.9 3.7 2.4 0.33 0.48 0.31± SE 0.5 0.4 0.2 0.03 0.05 0.04
8 20 6.6 4.0 0.39 0.71 0.449 18 4.5 3.0 0.51 0.63 0.2110 18 4.3 2.8 0.52 0.53 0.0011 20 4.6 2.9 0.52 0.55 0.0112 19 5.3 2.9 0.32 0.64 0.5213 19 7.0 4.5 0.44 0.74 0.3914 20 7.0 4.9 0.42 0.79 0.4515 20 4.6 2.3 0.32 0.51 0.3616 17 3.4 2.3 0.39 0.49 0.1217 20 3.5 2.3 0.45 0.47 − 0.0118 20 3.5 2.4 0.45 0.51 0.0819 20 4.8 2.7 0.32 0.57 0.5020 18 3.6 2.2 0.35 0.47 0.2421 20 4.4 2.8 0.31 0.57 0.40
Cluster 2 Mean 19.2 4.8 3.0 0.41 0.58 0.26± SE 0.4 0.3 0.2 0.02 0.03 0.05
22 18 2.9 1.99 0.46 0.42 − 0.0823 20 3.6 2.14 0.43 0.47 0.0924 20 3.3 2.09 0.39 0.41 − 0.0225 19 3.7 2.23 0.50 0.48 − 0.0326 20 4.0 2.20 0.34 0.50 0.3027 20 4.2 2.74 0.46 0.57 0.2328 20 3.6 1.62 0.23 0.33 0.4529 20 3.6 1.76 0.22 0.35 0.34
Cluster 3 Mean 19.6 3.5 2.0 0.37 0.42 0.15± SE 0.3 0.1 0.1 0.04 0.02 0.08
Species Mean 19.2 4.2 2.6 0.38 0.52 0.25± SE 0.2 0.2 0.2 0.02 0.02 0.03
Conservation Genetics
1 3
the top models, and in some cases all three were within ΔAICc < 2, indicating that they are equally supported. Interestingly, where it appears, road cover is always found at both a 1:10 and 1:100 cost ratio, but never 1:2, suggest-ing that the true resistance of roads is likely much higher than twice that of non-road areas. Nonetheless, identifying the exact resistance values of each variable is beyond the scope of this comparative study, and could be achieved within study regions in future work through the applica-tion of methods such as Resistance GA (Peterman 2017).
Overall, our results point to a strong link between land cover, particularly human-altered landscape features, and gene flow in these two torrent salamander species.
However, our findings for variable importance for R. kez-eri varied much more than those for R. variegatus, suggest-ing gene flow was more dramatically affected by variation in landscape and environmental disturbances as well. In addition to categorical land cover and road cover, percent canopy cover appears to drive patterns of genetic structure in the southern R. kezeri cluster. The prevalence of categorical land cover
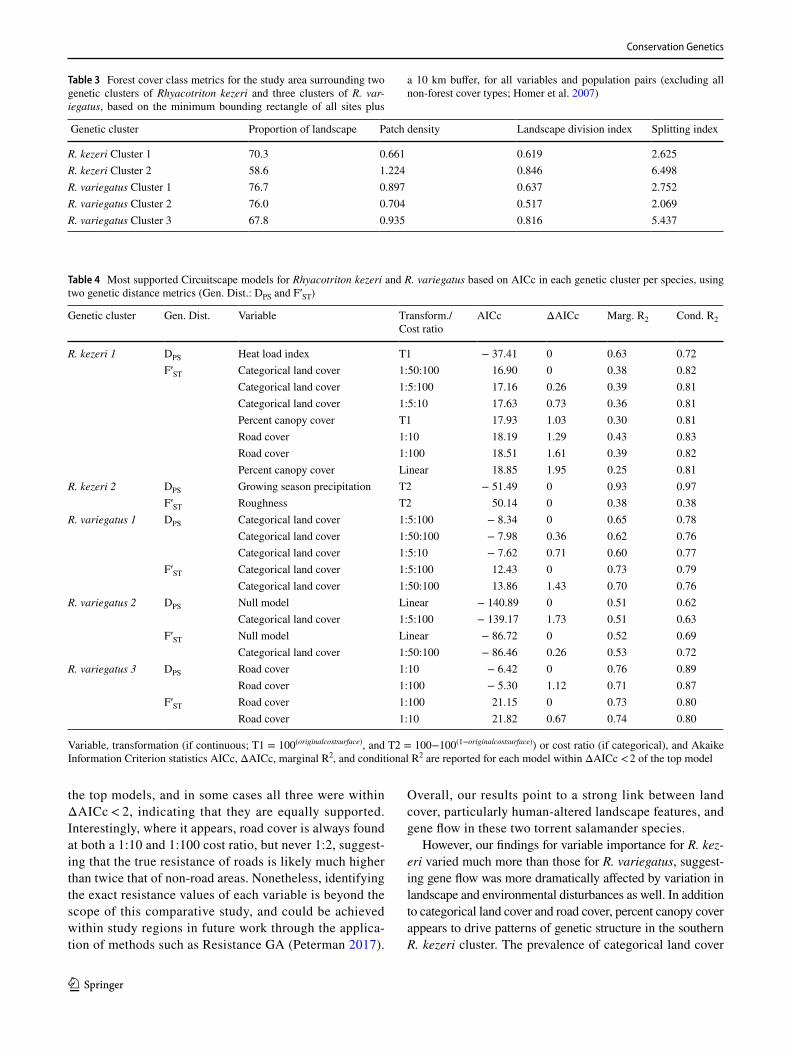
Table 3 Forest cover class metrics for the study area surrounding two genetic clusters of Rhyacotriton kezeri and three clusters of R. var-iegatus, based on the minimum bounding rectangle of all sites plus
a 10 km buffer, for all variables and population pairs (excluding all non-forest cover types; Homer et al. 2007)
Genetic cluster Proportion of landscape Patch density Landscape division index Splitting index
R. kezeri Cluster 1 70.3 0.661 0.619 2.625R. kezeri Cluster 2 58.6 1.224 0.846 6.498R. variegatus Cluster 1 76.7 0.897 0.637 2.752R. variegatus Cluster 2 76.0 0.704 0.517 2.069R. variegatus Cluster 3 67.8 0.935 0.816 5.437
Table 4 Most supported Circuitscape models for Rhyacotriton kezeri and R. variegatus based on AICc in each genetic cluster per species, using two genetic distance metrics (Gen. Dist.: DPS and F′ST)
Variable, transformation (if continuous; T1 = 100(originalcostsurface) , and T2 = 100−100(1−originalcostsurface) ) or cost ratio (if categorical), and Akaike
Information Criterion statistics AICc, ΔAICc, marginal R2, and conditional R2 are reported for each model within ΔAICc < 2 of the top model
Genetic cluster Gen. Dist. Variable Transform./ Cost ratio
AICc ΔAICc Marg. R2 Cond. R2
R. kezeri 1 DPS Heat load index T1 − 37.41 0 0.63 0.72F′ST Categorical land cover 1:50:100 16.90 0 0.38 0.82
Categorical land cover 1:5:100 17.16 0.26 0.39 0.81Categorical land cover 1:5:10 17.63 0.73 0.36 0.81Percent canopy cover T1 17.93 1.03 0.30 0.81Road cover 1:10 18.19 1.29 0.43 0.83Road cover 1:100 18.51 1.61 0.39 0.82Percent canopy cover Linear 18.85 1.95 0.25 0.81
R. kezeri 2 DPS Growing season precipitation T2 − 51.49 0 0.93 0.97F′ST Roughness T2 50.14 0 0.38 0.38
R. variegatus 1 DPS Categorical land cover 1:5:100 − 8.34 0 0.65 0.78Categorical land cover 1:50:100 − 7.98 0.36 0.62 0.76Categorical land cover 1:5:10 − 7.62 0.71 0.60 0.77
F′ST Categorical land cover 1:5:100 12.43 0 0.73 0.79Categorical land cover 1:50:100 13.86 1.43 0.70 0.76
R. variegatus 2 DPS Null model Linear − 140.89 0 0.51 0.62Categorical land cover 1:5:100 − 139.17 1.73 0.51 0.63
F′ST Null model Linear − 86.72 0 0.52 0.69Categorical land cover 1:50:100 − 86.46 0.26 0.53 0.72
R. variegatus 3 DPS Road cover 1:10 − 6.42 0 0.76 0.89Road cover 1:100 − 5.30 1.12 0.71 0.87
F′ST Road cover 1:100 21.15 0 0.73 0.80Road cover 1:10 21.82 0.67 0.74 0.80
Conservation Genetics
1 3
over percent canopy cover may highlight areas where land conversion from forest to rural communities acts as a major barrier to gene flow, because of the difference in how these two resistance layers are constructed. Categorical land cover involves high resistance values for non-forested vegetated land, and even higher resistance for human-developed land, despite both of these categories also having low canopy cover. Our results suggest that any forest cover, regardless of its density, is important for dispersal. Additionally, the topographic vari-ables heat load index and roughness were only significant for R. kezeri, suggesting that either R. kezeri individuals are more vulnerable to solar radiation, dry substrates, and energetically expensive changes in elevation than those of R. variegatus, or that these environmental factors vary more across the R. kezeri distribution. Furthermore, these conditions become increas-ingly important in the absence of forest cover, as desiccation becomes more likely. The importance of growing season pre-cipitation could also reflect a similar pattern. However, IBD was selected in the northern R. variegatus cluster in addition to categorical land cover, suggesting that Euclidean distance alone can be an important driver of genetic structure.
Finally, F′ST and DPS yielded similar results within all R. variegatus clusters with moderate-to-high marginal R2 values for all models (marginal R2 = 0.51–0.76; Table 4). These findings would suggest that genetic distances in this study are robust to departures from the assumptions of FST and its analogs. Still, these two genetic distance measures produced varying results in both R. kezeri clusters, with a sharp contrast in marginal R2 indicating that the landscape data fit DPS (marginal R2 = 0.63–0.93) better than F′ST (mar-ginal R2 = 0.25–0.43). This finding may relate to the lower genetic diversity in R. kezeri.
Importance of landscape variables
The landscape genetic results for R. variegatus presented here differ from previously published work that investigated fewer landscape variables over a smaller geographic area using both Circuitscape and least-cost paths (Emel and Stor-fer 2015). Previously, Emel and Storfer (2015) reported that low percent canopy cover, low stream cover, high heat load index, steep slope, and a long annual frost-free period pre-dict high genetic distance within two R. variegatus genetic clusters including the same southern cluster used here and a subset of the populations in the northern cluster. Interest-ingly, IBD was selected as a top model both in the northern cluster here and in the subset of the populations analyzed in the previous study. However, in the present study with a larger sample size over a greater geographic extent, we also included additional landscape variables, including compound topographic index and roughness, as well as cat-egorical land cover and road cover (each at 3 alternative cost-ratios). Although by limiting our categorical variables
to 3 cost-ratios it is possible that we do not capture the true cost of each cover type, doing so would be beyond the scope of this study. Our goal is to identify the variables that best explain genetic distance within genetic clusters and thus may be of importance to these species’ conservation in the future, using cost-ratios motivated by the species’ biology and pre-vious research (Spear and Storfer 2008, 2010; Trumbo et al. 2013). Furthermore, three of four of these new variables were present in the top landscape genetic models across spe-cies, with categorical land cover being the most supported model overall, and a higher proportion of the variation in genetic distance explained. We find that categorical land cover is nearly always a better model than percent canopy cover, suggesting the overall importance of this variable. Thus, we present a refined set of predictor variables of R. variegatus gene flow compared to Emel and Storfer (2015), and expand to include a species of greater conservation con-cern, R. kezeri. Our results demonstrate the importance of testing multiple variables in landscape genetic studies, so long as they are chosen a priori based on the species’ biol-ogy (Spear et al. 2010). If the variables that are truly driv-ing spatial genetic patterns are omitted, researchers could make spurious conclusions based on the subset of variables that they examine, which may be correlated with the true variables.
We predicted that streams would facilitate gene flow due to their importance in reducing desiccation risk during dis-persal. However, unlike Emel and Storfer (2015), we did not find streams to be an important variable in explaining genetic structure in this study. There are a number of poten-tial explanations for this discrepancy. First, rain may facili-tate overland movement to the point that there is a stronger signal for other variables than for streams. In a study of a similarly desiccation-sensitive salamander (Plethodon albagula), Peterman et al. (2014) found unexpectedly that genetic distance was negatively correlated with increased desiccation risk across the landscape, leading to conclu-sions that rapid nighttime dispersal (associated with higher humidity) through unsuitable habitat may strongly affect gene flow. Moreover, the role of stream influence on gene flow may depend on stream size, with headwater streams facilitating gene flow, but higher order-streams and rivers acting as barriers due to predation by larger salamanders and fish (Rundio and Olson 2001, 2003) and/or lack of suitable sites for egg deposition. The role of stream order in upstream versus downstream dispersal, and the potential compounding effects of road crossings, could be tested by stratifying sam-pling within individual streams and using capture-recapture methods to model unidirectional gene flow. Alternatively, it is possible that Circuitscape resistance does not adequately model linear stream elements in the same way that least-cost paths do, however, stream Circuitscape models were still highly ranked in Emel and Storfer (2015). Therefore, this
Conservation Genetics
1 3
counterintuitive result demonstrates the value of landscape genetic approaches to reveal new insights about species’ biology and inspire topics for further investigation.
Genetic diversity and conservation implications
Torrent salamanders (Rhyacotriton spp.) have specific habi-tat requirements, and are typically associated with forests and the cool, highly oxygenated water of headwater streams (Diller and Wallace 1996; Welsh and Lind 1996; Sheridan and Olson 2003; Olson and Weaver 2007; Olson and Burton 2014). This specificity makes them particularly vulnerable to habitat alteration and the potential effects of climate change. Our results suggest that both R. kezeri and R. variegatus use forested habitat for dispersal, avoiding roads, and exhibit high levels of genetic structure. Thus, fragmentation of these habitats by disturbances such as timber harvest can further isolate populations from one another, as landscape resistance in harvested areas increases beyond current levels.
Rhyacotriton kezeri has a much more restricted geo-graphic range than R. variegatus, and significantly lower average genetic diversity within populations (based on lower AR, He, and FIS; Tables 1, 2). Decreases in gene flow due to habitat fragmentation can promote inbreeding, which may be exacerbated by population declines due to reductions in the quality of habitat present in the remaining habitat patches. Class metrics revealed evidence of greater forest fragmenta-tion within the northernmost study regions in both species’ ranges (Table 3), despite the lower genetic diversity in R. kezeri overall, and at the cluster level, genetic diversity does not closely reflect levels of fragmentation. However, the overall pattern of decreased fragmentation in the other two R. variegatus genetic clusters indicates that fragmentation could pose a greater overall threat to R. kezeri. Still, we can-not discount the potential effect of ascertainment bias due to applying markers developed for one species to another, albeit closely related, species. The reduction of the marker set from 10 to 8 loci due to lack of diversity at one locus and a high proportion of populations out of Hardy–Weinberg equilib-rium in the other indicates that genetic diversity in this spe-cies may be underestimated, especially in AR. Further analy-sis with a larger set of microsatellite or SNP markers could rule out this factor, as well as more clearly define the genetic clusters in this species. Although the presence of null alleles may inflate heterozygosity in most populations, lower Ho in R. kezeri also points to a potential increase in homozygosity due to genetic isolation. Thus, a combination of variation in landscape genetic relationships between the two species and variation in the degree of habitat fragmentation and quality may explain the difference in genetic diversity, and further study is warranted.
Nonetheless, these findings suggest an uncertain future for both species as they occur within a highly managed forest
landscape where timber harvest is the dominant land-use activity (Nickerson et al. 2011), particularly when the spe-cies’ aquatic habitat and upland forest dispersal habitat are not addressed in landscape-scale planning. Importantly, this work can aid designs of connectivity pathways in managed forest landscapes. Olson and Burnett (2009, 2013) provided conceptual designs for landscape-scale dispersal of these for-ested headwater species, extending and connecting protected riparian corridors up and over ridgelines at strategic loca-tions across watersheds. Specific environmental correlates identified here provide empirical support for identification of more efficient dispersal routes for these species. Consider-ing the projected threat of climate change on these species (Bury 2015), and the need to design climate-smart forests in the region (Kim et al. 2017), maintenance of forested stream and streamside habitats and over-ridge dispersal habitats will likely be essential to the conservation of these unique salamanders. Insights from this study may inform the status reviews for these species, especially for R. kezeri, which is under consideration for listing under the U.S. Endangered Species Act (WSDOT 2017).
Acknowledgements This work was supported by the American Museum of Natural History Theodore Roosevelt Memorial Fund, Sigma Xi Grants-in-Aid of Research, the US Forest Service Pacific Northwest Research Station, and the Washington State University Elling Fund. We would like to thank M. Adams, A. Caldwell, E. Dunn, K. Emel, Z. Emel, A Grider, B Hogberg, J. Miller, K. Gibbons, and L. Ellenberg for assistance with tissue collection. P. Frias, R. M. Larios, S. Micheletti, S. Spear, D. Trumbo, and G. Zancolli provided guidance with laboratory and computer analyses. Finally, we thank J. Busch, B. Epstein, S. Micheletti, A. Patton, D. Trumbo, L. Shipley, L. Smith, and L. Waits for providing comments on the manuscript.
Data availability The datasets generated during and/or analysed during the current study and R scripts, are available upon request to S. Emel. Due to the sensitivity of these species, general locality information is provided in Online Resource 1, and detailed information are also avail-able on reasonable request.
Open Access This article is distributed under the terms of the Crea-tive Commons Attribution 4.0 International License (http://creat iveco mmons .org/licen ses/by/4.0/), which permits unrestricted use, distribu-tion, and reproduction in any medium, provided you give appropriate credit to the original author(s) and the source, provide a link to the Creative Commons license, and indicate if changes were made.
References
Adams MJ, Bury RB (2002) The endemic headwater stream amphib-ians of the American Northwest: associations with environmen-tal gradients in a large forested preserve. Glob Ecol Biogeogr 11:169–178
Bani L, Orioli V, Pisa G et al (2017) Landscape determinants of genetic differentiation, inbreeding and genetic drift in the hazel dormouse (Muscardinus avellanarius). Conserv Genet 19:283–296. https ://doi.org/10.1007/s1059 2-017-0999-6
Conservation Genetics
1 3
Bartoń K (2018) MuMIn: multi-model inference. R package version 1.40.4
Bates D, Maechler M, Bolker B, Walker S (2015) Fitting Linear Mixed-Effects Models Using lme4. J Stat Software 67:1–48. https ://doi.org/10.18637 /jss.v067.i01
Blaszczynski JS (1997) Landform characterization with geographic information systems. Photogramm Eng Remote Sensing 63:183–191
Burkhart JJ, Peterman WE, Brocato ER et al (2017) The influence of breeding phenology on the genetic structure of four pond-breeding salamanders. Ecol Evol 7:4670–4681. https ://doi.org/10.1002/ece3.3060
Bury G (2015) An integrated approach to gauge the effects of global climate change on headwater stream ecosystems. Dissertation, Oregon State University
Bury RB, Corn PS (1988) Responses of aquatic and streamside amphibians to timber harvest: a review. In: Raedaeke K (ed) Streamside management riparian wildlife and forestry interac-tions. Seattle Audubon Society, Seattle, pp 165–166
Castillo JA, Epps CW, Jeffries MR et al (2016) Replicated landscape genetic and network analyses reveal wide variation in functional connectivity for American pikas. Ecol Appl 26:1660–1676
CDFW BDB (2011) Special animals (898 taxa). California Depart-ment of Fish and Wildlife Biogeographic Data Branch
Chapuis M-P, Estoup A (2007) Microsatellite null alleles and estima-tion of population differentiation. Mol Biol Evol 24:621–631
Chapuis M-P, Lecoq M, Michalakis Y, Loiseau A, Sword GA, Piry S, Estoup A (2008) Do outbreaks affect genetic population struc-ture? A worldwide survey in Locusta migratoria, a pest plagued by microsatellite null alleles. Mol Ecol 17:3640–3653
Clarke RT, Rothery P, Raybould AF (2002) Confidence limits for regression relationships between distance matrices: estimating gene flow with distance. J Agric Biol Environ Stat 7:361–372. https ://doi.org/10.1198/10857 11023 20
Corander J, Siren J, Arjas E (2007) Bayesian spatial modeling of genetic population structure. Comput Stat 23:111–129. https ://doi.org/10.1007/s0018 0-007-0072-x
Corn PS, Bury RB (1989) Logging in western Oregon: responses of headwater habitats and stream amphibians. For Ecol Manag 29:39–57
Dieringer D, Schlötterer C (2003) Microsatellite analyser (MSA): a platform independent analysis tool for large microsatellite data sets. Mol Ecol Notes 3:167–169
Diller LV, Wallace RL (1996) Distribution and habitat of Rhyaco-triton variegatus in managed, young growth forests in north coastal California. J Herpetol 30:184–191
Emel SL, Storfer A (2012) A decade of amphibian population genetic studies: synthesis and recommendations. Conserv Genet 13:1685–1689. https ://doi.org/10.1007/s1059 2-012-0407-1
Emel SL, Storfer A (2014) Characterization of 10 microsatellite markers for the southern torrent salamander (Rhyacotriton variegatus). Conserv Genet Resour 6:881–882. https ://doi.org/10.1007/s1268 6-014-0230-8
Emel SL, Storfer A (2015) Landscape genetics and genetic structure of the southern torrent salamander, Rhyacotriton variegatus. Conserv Genet 16:209–221. https ://doi.org/10.1007/s1059 2-014-0653-5
Engler JO, Balkenhol N, Filz KJ et al (2014) Comparative landscape genetics of three closely related sympatric hesperid butterflies with diverging ecological traits. PLoS ONE 9:e106526. https ://doi.org/10.1371/journ al.pone.01065 26.s005
Evanno G, Regnaut S, Goudet J (2005) Detecting the number of clusters of individuals using the software structure: a simulation study. Mol Ecol 14:2611–2620. https ://doi.org/10.1111/j.1365-294X.2005.02553 .x
Evans JS, Oakleaf JR, Cushman SA, Theobald DM (2014) An ArcGIS Toolbox for Surface Gradient and Geomorphometric Modeling
Franckowiak RP, Panasci M, Jarvis KJ et al (2017) Model selection with multiple regression on distance matrices leads to incor-rect inferences. PLoS ONE 12:e0175194–e0175113. https ://doi.org/10.1371/journ al.pone.01751 94
Gary RH, Wilson ZD, Archuleta C-AM et al (2010) Production of a national 1:1,000,000-scale hydrography dataset for the United States—feature selection, simplification, and refinement. U.S. Department of the Interior, U.S. Geological Survey
Gesch DB (2007) The national elevation dataset. In: Maune D (ed) Digital elevation model technologies and applications: the DEM users manual, 2nd edn. American Society for Photogrammetry and Remote Sensing, Bethesda, pp 99–118
Gesch D, Oimoen M, Greenlee S et al (2002) The national elevation dataset: photogrammetric engineering and remote sensing. J Amn Soc Photogramm Remote Sensing 68:5–11
Gessler PE, Moore ID, McKenzie NJ, Ryan PJ (1995) Soil-landscape modelling and spatial prediction of soil attributes. Int J Geogr Inform Sys 9:421–432. https ://doi.org/10.1080/02693 79950 89020 47
Goldberg CS, Waits LP (2010) Quantification and reduction of bias from sampling larvae to infer population and landscape genetic structure. Mol Ecol Resources 10:304–313. https ://doi.org/10.1111/j.1755-0998.2009.02755 .x
Gurka MJ (2006) Selecting the best linear mixed model under REML. Am Stat 60:19–26. https ://doi.org/10.1198/00031 3006X 90396
Gutiérrez-Rodríguez J, Gonçalves J, Civantos E, Martínez-Soldano I (2017) Comparative landscape genetics of pond-breeding amphibians in Mediterranean temporal wetlands: the positive role of structural heterogeneity in promoting gene flow. Mol Ecol 26:5407–5420. https ://doi.org/10.1111/mec.14272
Homer C, Dewitz J, Fry J et al (2007) Completion of the 2001 National LandCover Database for the conterminous United States. Photo-gramm Eng Remote Sensing 73:337–341
Janes JK, Miller JM, Dupuis JR, Malenfant RM, Gorrell JC, Culling-ham CI, Andrew RL (2017) The K = 2 conundrum. Mol Ecol 26:3594–3602
Johnson PCD (2014) Extension of Nakagawa & Schielzeth’s R2GLMM to random slopes models. Methods Ecol Evol 5:944–946. https ://doi.org/10.1111/2041-210X.12225
Keller D, Holderegger R, van Strien MJ, Bolliger J (2014) How to make landscape genetics beneficial for conservation manage-ment? Conserv Genet 16:503–512. https ://doi.org/10.1007/s1059 2-014-0684-y
Kierepka EM, Anderson SJ, Swihart RK, Rhodes OE Jr (2016) Evalu-ating the influence of life-history characteristics on genetic struc-ture: a comparison of small mammals inhabiting complex agricul-tural landscapes. Ecol Evol 6:6376–6396. https ://doi.org/10.1002/ece3.2269
Kim JB, Marcot BG, Olson DH et al (2017) Climate-smart approaches to managing forests. In: Olson DH, Van Horne B (eds) People, forests, and change: lessons from the Pacific Northwest. Island Press, Washington, DC, pp 225–242
Luqman H (2018) No distinct barrier effects of highways and a wide river on the genetic structure of the Alpine newt (Ichthyosaura alpestris) in densely settled landscapes. Conserv Genet 19:673–685. https ://doi.org/10.1007/s1059 2-018-1046-y
Manel S, Schwartz MK, Luikart G, Taberlet P (2003) Landscape genet-ics: combining landscape ecology and population genetics. Trends Ecol Evol 18:189–197
Marrotte RR, Bowman J (2017) The relationship between least-cost and resistance distance. PLoS ONE 12:e0174212. https ://doi.org/10.1371/journ al.pone.01742 12
McCune B, Keon D (2002) Equations for potential annual direct inci-dent radiation and heat load. J Veg Sci 13:603–606

Conservation Genetics
1 3
McGarigal K, Cushman SA, Ene E (2012) FRAGSTATS V4: Spatial Pattern Analysis Program for Categorical and Continuous Maps
McRae BH, Schumaker NH, McKane RB et al (2008) A multi-model framework for simulating wildlife population response to land-use and climate change. Ecol Modell 219:77–91. https ://doi.org/10.1016/j.ecolm odel.2008.08.001
Meirmans PG, Hedrick PW (2011) Assessing population structure: FST and related measures. Mol Ecol Resour 11:5–18. https ://doi.org/10.1111/j.1755-0998.2010.02927 .x
Meirmans PG, van Tienderen PH (2004) Genotype and genodive: two programs for the analysis of genetic diversity of asexual organisms. Mol Ecol Notes 4:792–794. https ://doi.org/10.1111/j.1471-8286.2004.00770 .x
Miller MP, Haig SM, Wagner RS (2006) Phylogeography and spatial genetic structure of the southern Torrent salamander: implica-tions for conservation and management. J Hered 97:561–570. https ://doi.org/10.1093/jhere d/esl03 8
Mims MC, Phillipsen IC, Lytle DA, Kirk EE, Olden JD (2015) Ecological strategies predict associations between aquatic and genetic connectivity for dryland amphibians. Ecology 96:1371–1382. https ://doi.org/10.1890/14-0490.1
Moore ID, Gessler PE, Nielsen GA (1993) Terrain attributes: esti-mation methods and scale effects. In: Jakeman AJ, Beck MB, McAleer M (eds) Modeling change in environmental systems. Wiley, London, pp 189–214
Nakagawa S, Schielzeth H (2012) A general and simple method for obtaining R2from generalized linear mixed-effects models. Methods Ecol Evol 4:133–142. https ://doi.org/10.1111/j.2041-210x.2012.00261 .x
Nickerson C, Ebel R, Borchers A, Carriazo F (2011) Major uses of land in the United States, 2007, pp 1–2. USDA, Economic Research Service, Economic Information Bulletin 89
ODFW (2008) Oregon Department of Fish and Wildlife Sensitive Species. Frequently Asked Questions and Sensitive Species List. Salem, OR
Olson DH, Burnett KM (2009) Design and management of linkage areas across headwater drainages to conserve biodiversity in forest ecosystems. For Ecol Manag 258:S117–S126. https ://doi.org/10.1016/j.forec o.2009.04.018
Olson DH, Burnett KM (2013) Geometry of forest landscape con-nectivity: pathways for persistence. In: Anderson, P.D. and K.L. Ronnenberg (eds) Density management in the 21st century: west side story. General Technical Report PNW-GTR-880. Portland, OR. Department of Agriculture, Forest Service, Pacific North-west Research Station, pp 220–238
Olson D, Burton J (2014) Near-term effects of repeated-thinning with riparian buffers on headwater stream vertebrates and habitats in Oregon, USA. Forests 5:2703–2729. https ://doi.org/10.3390/f5112 703
Olson DH, Weaver G (2007) Vertebrate assemblages associated with headwater hydrology in western Oregon managed forests. For Sci 53:343–355
Peakall R, Smouse PE (2006) genalex 6: genetic analysis in Excel. Population genetic software for teaching and research. Mol Ecol Notes 6:288–295. https ://doi.org/10.1111/j.1471-8286.2005.01155 .x
Peterman WE (2017) ResistanceGA: an R package for the optimiza-tion of resistance surfaces using genetic algorithms. Methods Ecol Evol 9:1638–1647. https ://doi.org/10.1111/2041-210X.12984
Peterman WE, Connette GM, Semlitsch RD, Eggert LS (2014) Eco-logical resistance surfaces predict fine-scale genetic differentiation in a terrestrial woodland salamander. Mol Ecol 23:2402–2413. https ://doi.org/10.1111/mec.12747
R Core Team (2018) R: a language and environment for statistical com-puting. R Foundation for Statistical Computing, Vienna, Austria. http://www.R-proje ct.org/. Accessed 10 Mar 2019
Raymond M, Rousset F (1995) GENEPOP (Version 1.2): popula-tion genetics software for exact tests and ecumenicism. J Hered 86:248–249
Rehfeldt GE (2006) A spline model of climate for the western United States. General technical report, Rocky Mountain Research Sta-tion, U.S. Forest Service, Fort Collins, CO
Richardson JL, Brady SP, Wang IJ, Spear SF (2016) Navigating the pitfalls and promise of landscape genetics. Mol Ecol 25:849–863. https ://doi.org/10.1111/mec.13527
Riley SJ, DeGloria SD, Elliot R (1999) A terrain ruggedness index that quantifies topographic heterogeneity. Intermountain J Sci 5:23–27
Rousset F (2008) genepop’007: a complete re-implementation of the genepop software for Windows and Linux. Mol Ecol Resour 8:103–106. https ://doi.org/10.1111/j.1471-8286.2007.01931 .x
Rundio DE, Olson DH (2001) Palatability of Southern Torrent sala-mander (Rhyacotriton variegatus) larvae to Pacific giant salaman-der (Dicamptodon tenebrosus) larvae. J Herpetol 35:133. https ://doi.org/10.2307/15660 36
Rundio DE, Olson DH (2003) Antipredator defenses of larval Pacific giant salamanders (Dicamptodon tenebrosus) against cutthroat trout (Oncorhynchus clarki). Copeia 2003:402–407
Segelbacher G, Cushman SA, Epperson BK et al (2010) Applications of landscape genetics in conservation biology: concepts and chal-lenges. Conserv Genet 11:375–385. https ://doi.org/10.1007/s1059 2-009-0044-5
Sheridan CD, Olson DH (2003) Amphibian assemblages in zero-order basins in the Oregon Coast Range. Can J For Res 33:1452–1477. https ://doi.org/10.1139/x03-038
Short Bull RA, Cushman SA, Mace R et al (2011) Why replica-tion is important in landscape genetics: American black bear in the Rocky Mountains. Mol Ecol 20:1092–1107. https ://doi.org/10.1111/j.1365-294X.2010.04944 .x
Spear SF, Storfer A (2008) Landscape genetic structure of coastal tailed frogs (Ascaphus truei) in protected vs. managed forests. Mol Ecol 17:4642–4656
Spear SF, Storfer A (2010) Anthropogenic and natural disturbance lead to differing patterns of gene flow in the Rocky Mountain tailed frog, Ascaphus montanus. Biol Conserv 143:778–786
Spear SF, Balkenhol N, Fortin M-J et al (2010) Use of resistance sur-faces for landscape genetic studies: considerations for param-eterization and analysis. Mol Ecol 19:3576–3591. https ://doi.org/10.1111/j.1365-294X.2010.04657 .x
Steele CA, Baumsteiger J, Storfer A (2009) Influence of life-history variation on the genetic structure of two sympatric salamander taxa. Mol Ecol 18:1629–1639. https ://doi.org/10.1111/j.1365-294X.2009.04135 .x
Storfer A, Murphy MA, Evans JS et al (2007) Putting the “landscape” in landscape genetics. Heredity 98:128–142
Storfer A, Murphy MA, Spear SF et al (2010) Landscape genetics: where are we now? Mol Ecol 19:3496–3514
StreamNet GIS Data (2003) Metadata for Pacific Northwest coho salmon fish distribution spatial data set. Portland (OR): Stream-Net, May 2003. http://www.strea mnet.org/onlin e-data/GISDa ta.html. Accessed 28 Apr 2016
Strittholt JR, Dellasala DA, Jiang H (2006) Status of mature and old-growth forests in the Pacific Northwest. Conserv Biol 20:363–374. https ://doi.org/10.1111/j.1523-1739.2006.00384 .x
Thatte P, Joshi A, Vaidyanathan S et al (2018) Maintaining tiger connectivity and minimizing extinction into the next century: insights from landscape genetics and spatially-explicit simula-tions. Biol Conserv 218:181–191. https ://doi.org/10.1016/j.bioco n.2017.12.022
Trumbo DR, Spear SF, Baumsteiger J, Storfer A (2013) Rangewide landscape genetics of an endemic Pacific northwestern salaman-der. Mol Ecol 22:1250–1266. https ://doi.org/10.1111/mec.12168
Conservation Genetics
1 3
van Oosterhout C, Hutchinson B, Wills D, Shipley P (2004) MICRO-CHECKER: software for identifying and correcting genotyping errors in microsatellite data. Mol Ecol Notes 4:535–538
van Strien MJ, Keller D, Holderegger R (2012) A new analytical approach to landscape genetic modelling: least-cost transect analy-sis and linear mixed models. Mol Ecol 21:4010–4023. https ://doi.org/10.1111/j.1365-294X.2012.05687 .x
Wang J (2004) Sibship reconstruction from genetic data with typing errors. Genetics 166:1963–1979
Wang J, Santure AW (2009) Parentage and sibship inference from mul-tilocus genotype data under polygamy. Genetics 181:1579–1594. https ://doi.org/10.1534/genet ics.108.10021 4
Welsh HH Jr, Lind AJ (1996) Habitat correlates of the southern torrent salamander, Rhyacotriton variegatus (Caudata: Rhyacotritonidae), in northwestern California. J Herpetol 30:385–398
Whiteley AR, McGarigal K, Schwartz MK (2014) Pronounced dif-ferences in genetic structure despite overall ecological similarity for two Ambystoma salamanders in the same landscape. Conserv Genet 15:573–591. https ://doi.org/10.1007/s1059 2-014-0562-7
Whitton FJS, Purvis A, Orme CDL, Olalla-Tárraga M (2012) Under-standing global patterns in amphibian geographic range size: does
Rapoport rule? Glob Ecol Biogeogr 21:179–190. https ://doi.org/10.1111/j.1466-8238.2011.00660 .x
Wright S (1943) Isolation by distance. Genetics 28:114–138WSDOT (2017) ESA listing updates. Washington State Department of
Transportation. http://www.wsdot .wa.gov/Envir onmen t/Biolo gy/BA/defau lt.htm#Speci esLis t Accessed 3 Aug 2018
Zancolli G, Rödel M-O, Steffan-Dewenter I, Storfer A (2014) Compar-ative landscape genetics of two river frog species occurring at dif-ferent elevations on Mount Kilimanjaro. Mol Ecol 23:4989–5002. https ://doi.org/10.1111/mec.12921
Publisher’s Note Springer Nature remains neutral with regard to jurisdictional claims in published maps and institutional affiliations.
Related Documents