Graham R. Jeffries NEARC 2012 5 | 22 | 12 Comparative Foodshed Analysis of Potential Local-Regional Food Production Across the U.S.

Welcome message from author
This document is posted to help you gain knowledge. Please leave a comment to let me know what you think about it! Share it to your friends and learn new things together.
Transcript
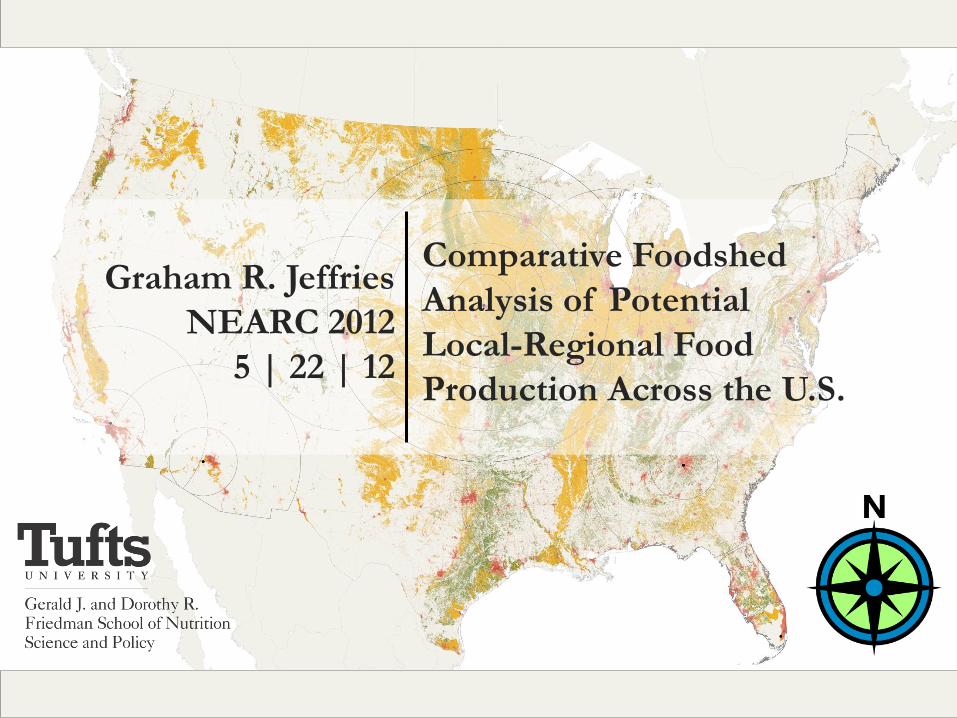
Graham R. Jeffries
NEARC 2012
5 | 22 | 12
Comparative Foodshed
Analysis of Potential
Local-Regional Food
Production Across the U.S.

Sustainability Challenges Foodshed Model Future work
Sources:
Dahburg (1995). http://homepages.wmich.edu/~dahlberg/F14.pdf

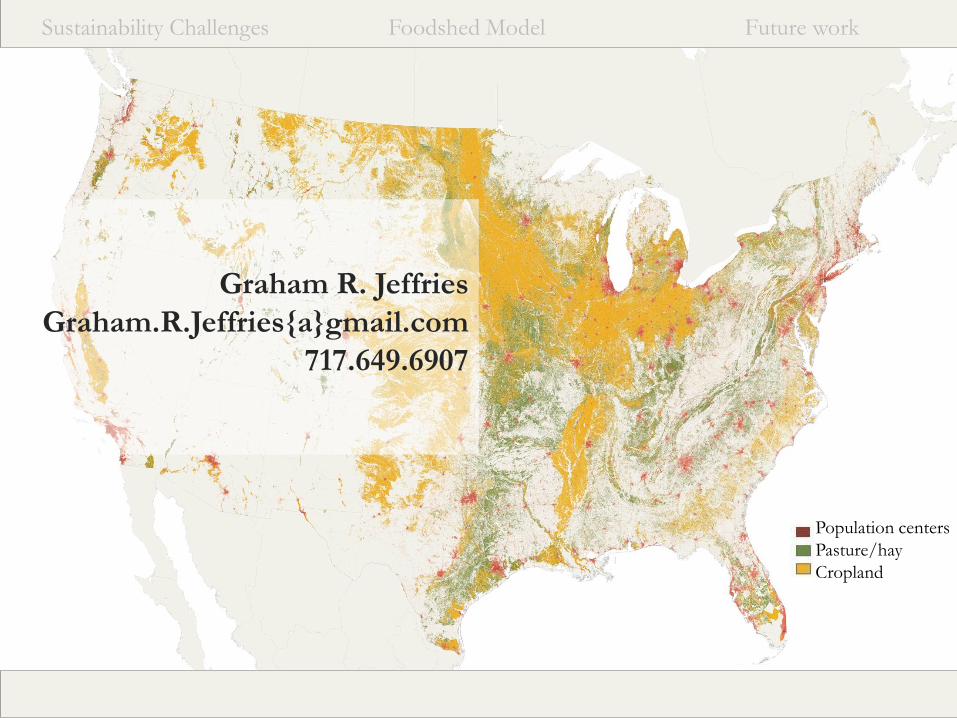
Sustainability Challenges Foodshed Model Future work
Population centers
Pasture/hay
Cropland
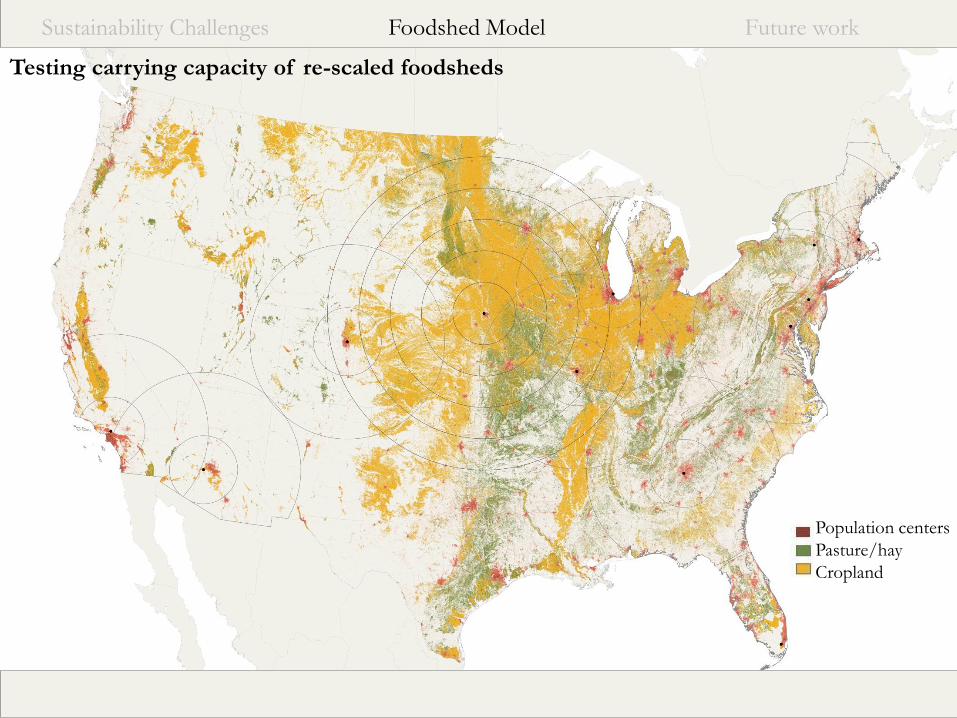
2006 NLCD
Sustainability Challenges Foodshed Model Future work
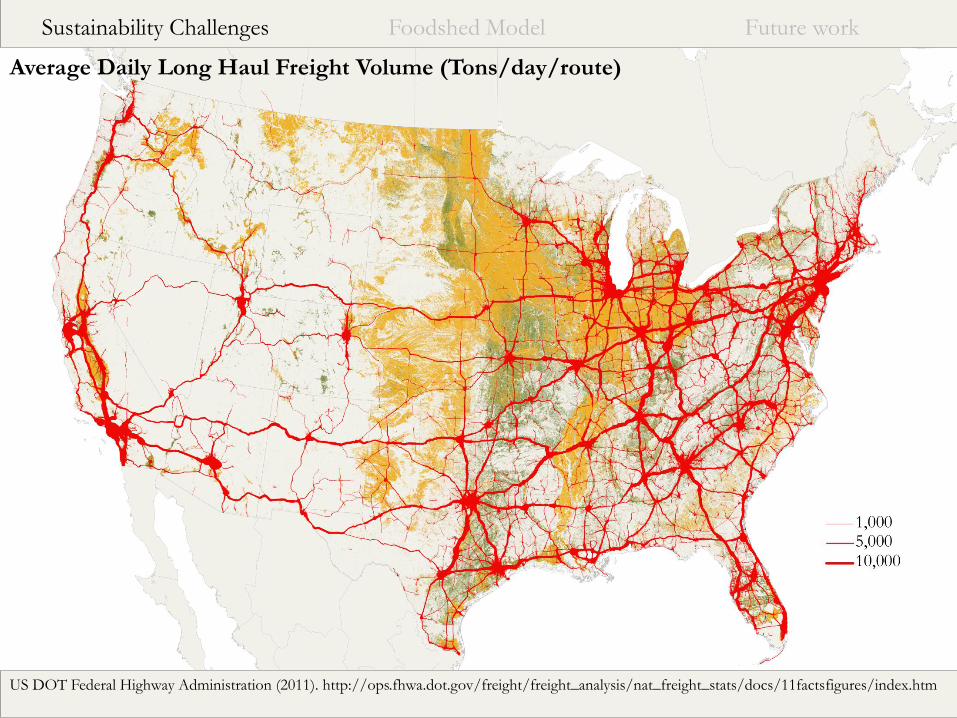
US DOT Federal Highway Administration (2011). http://ops.fhwa.dot.gov/freight/freight_analysis/nat_freight_stats/docs/11factsfigures/index.htm
Average Daily Long Haul Freight Volume (Tons/day/route)

Sustainability Challenges Foodshed Model Future work
Rising temperatures
With more volatility
Diffenbaugh et al. (2012). “Response of corn markets to climate volatility under alternative energy futures.” Nature Climate Change.
Sustainability Challenges Foodshed Model Future work
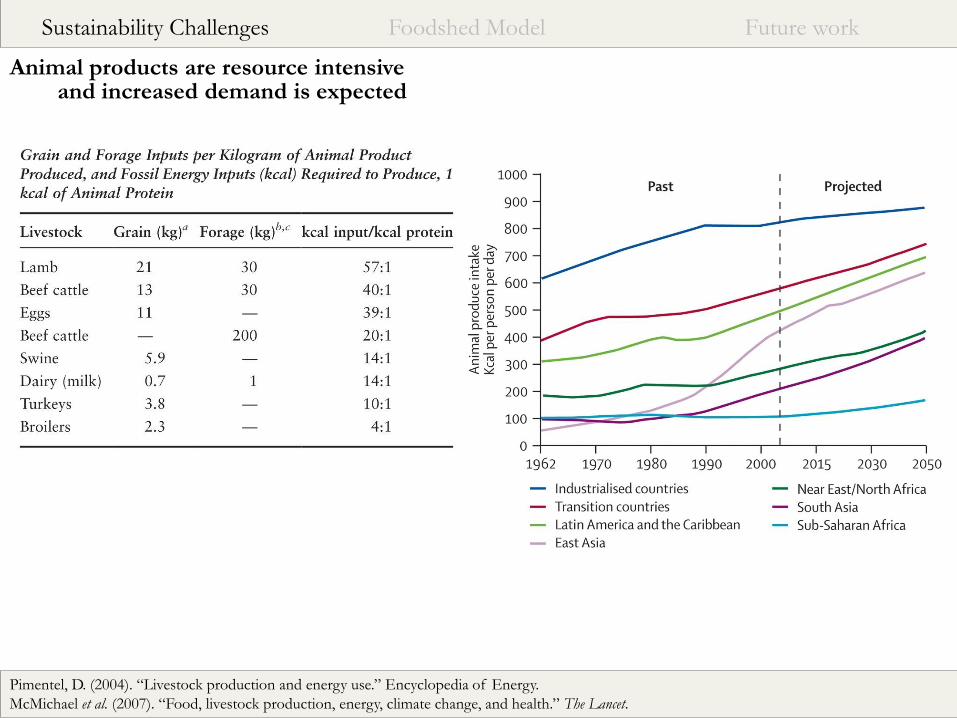
Animal products are resource intensive
Pimentel, D. (2004). “Livestock production and energy use.” Encyclopedia of Energy.
McMichael et al. (2007). “Food, livestock production, energy, climate change, and health.” The Lancet.
and increased demand is expected
Sustainability Challenges Foodshed Model Future work
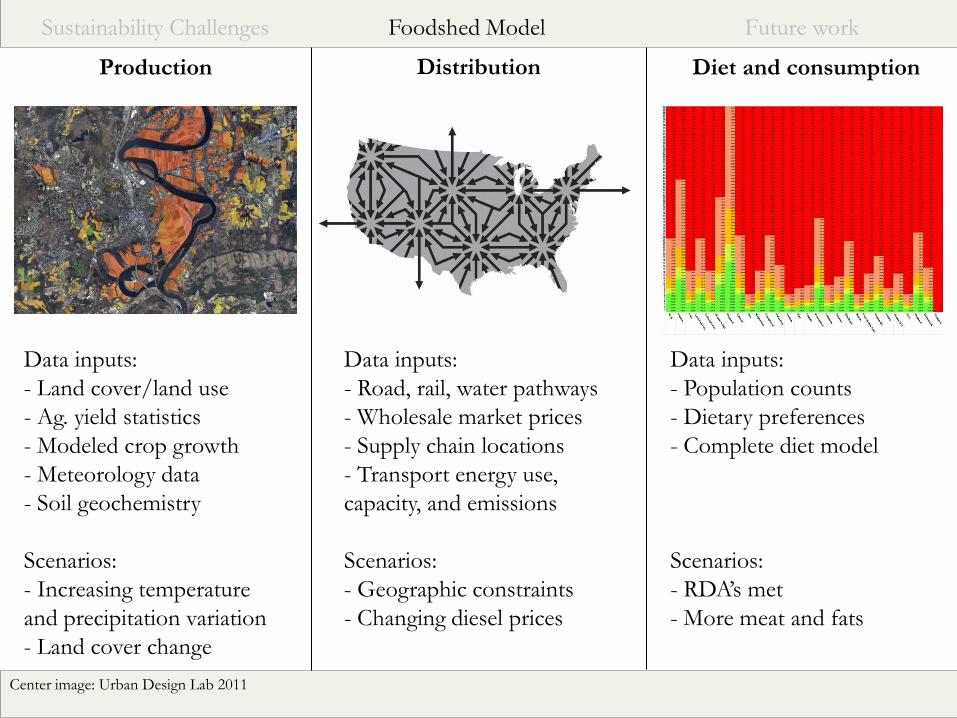
Production Distribution Diet and consumption
Center image: Urban Design Lab 2011
Data inputs:
- Land cover/land use
- Ag. yield statistics
- Modeled crop growth
- Meteorology data
- Soil geochemistry
Scenarios:
- Increasing temperature
and precipitation variation
- Land cover change
Data inputs:
- Road, rail, water pathways
- Wholesale market prices
- Supply chain locations
- Transport energy use,
capacity, and emissions
Scenarios:
- Geographic constraints
- Changing diesel prices
Data inputs:
- Population counts
- Dietary preferences
- Complete diet model
Scenarios:
- RDA’s met
- More meat and fats

Sustainability Challenges Foodshed Model Future work
Production Distribution Diet and consumption
Center image: Urban Design Lab 2011
Data inputs:
- Land cover/land use
- Ag. yield statistics
- Modeled crop growth
- Meteorology data
- Soil geochemistry
Scenarios:
- Increasing temperature
and precipitation variation
- Land cover change
Data inputs:
- Road, rail, water pathways
- Wholesale market prices
- Supply chain locations
- Transport energy use,
capacity, and emissions
Scenarios:
- Geographic constraints
- Changing diesel prices
Data inputs:
- Population counts
- Dietary preferences
- Complete diet model
Scenarios:
- RDA’s met
- More meat and fats
Sustainability Challenges Foodshed Model Future work
Testing carrying capacity of re-scaled foodsheds
Population centers
Pasture/hay
Cropland
Sustainability Challenges Foodshed Model Future work
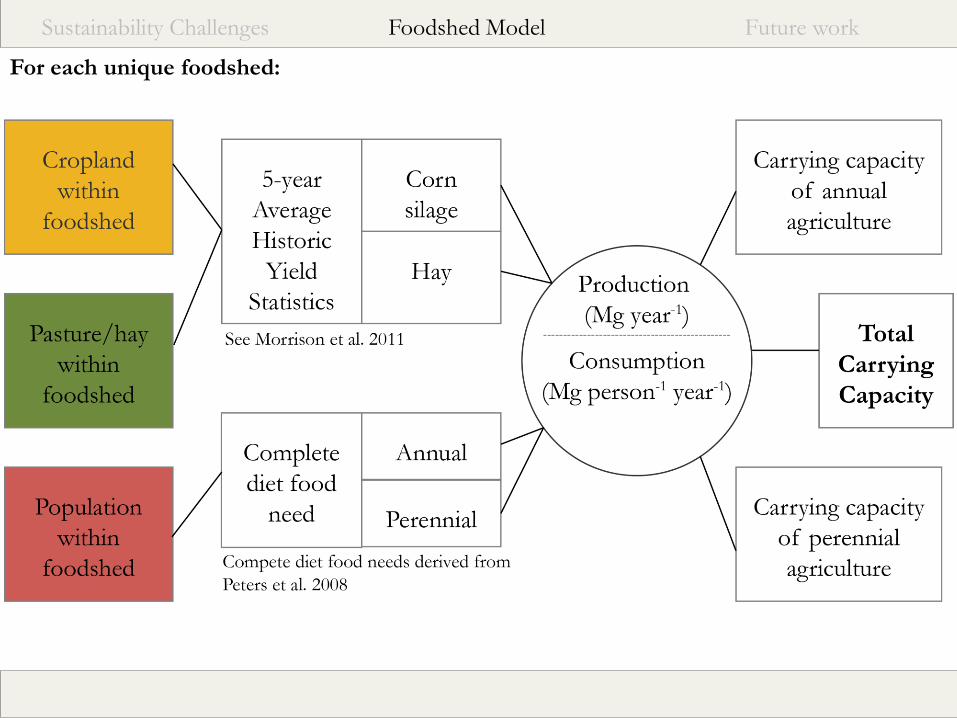
For each unique foodshed:

Sustainability Challenges Foodshed Model Future work
Weighted Average
Perennial Ag. Foods
Annual Ag. Foods
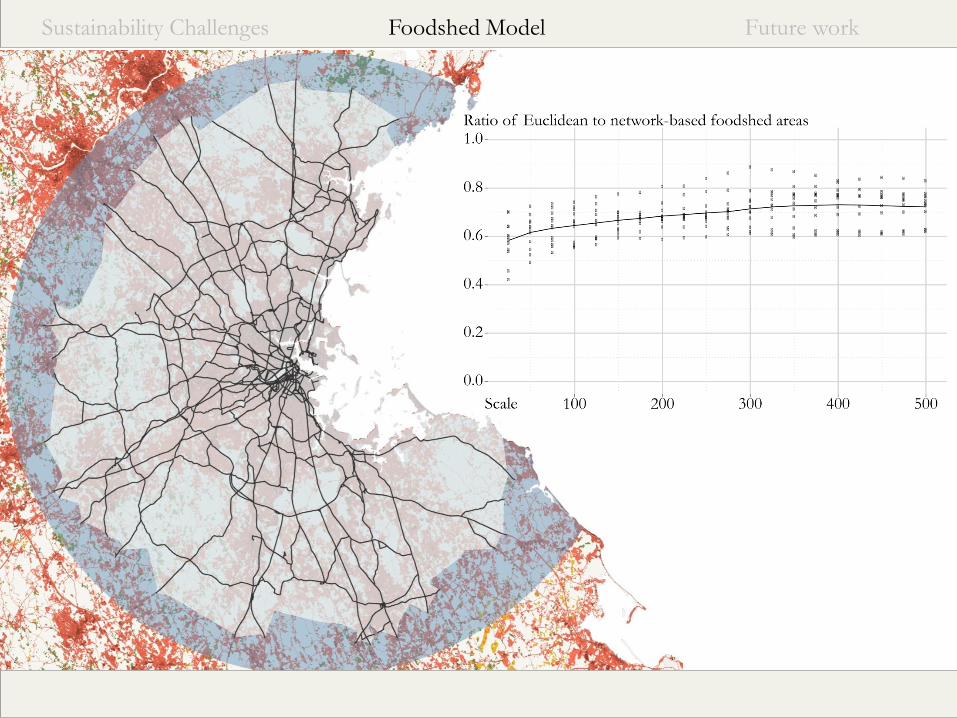
Scale of foodshed (radial mi)
Carrying capacity (% of population food needs met)
Sustainability Challenges Foodshed Model Future work
Sustainability Challenges Foodshed Model Future work
http://info.prosalesstaff.com/Portals/108928/images/supply-chain-analysis.gif
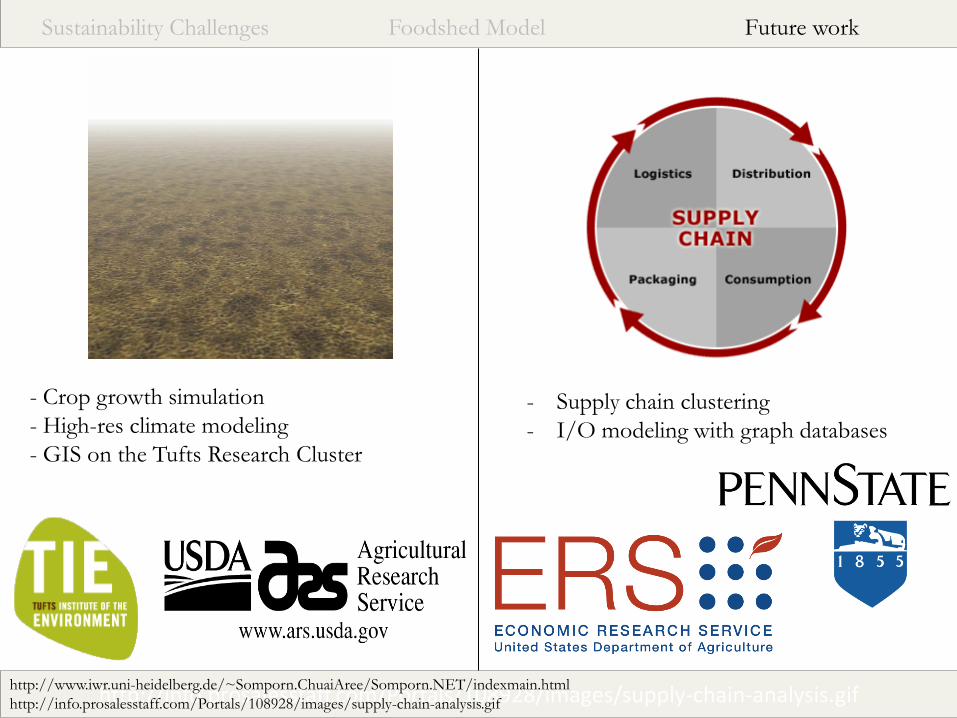
- Crop growth simulation
- High-res climate modeling
- GIS on the Tufts Research Cluster
- Supply chain clustering
- I/O modeling with graph databases
http://www.iwr.uni-heidelberg.de/~Somporn.ChuaiAree/Somporn.NET/indexmain.html
http://info.prosalesstaff.com/Portals/108928/images/supply-chain-analysis.gif
Sustainability Challenges Foodshed Model Future work
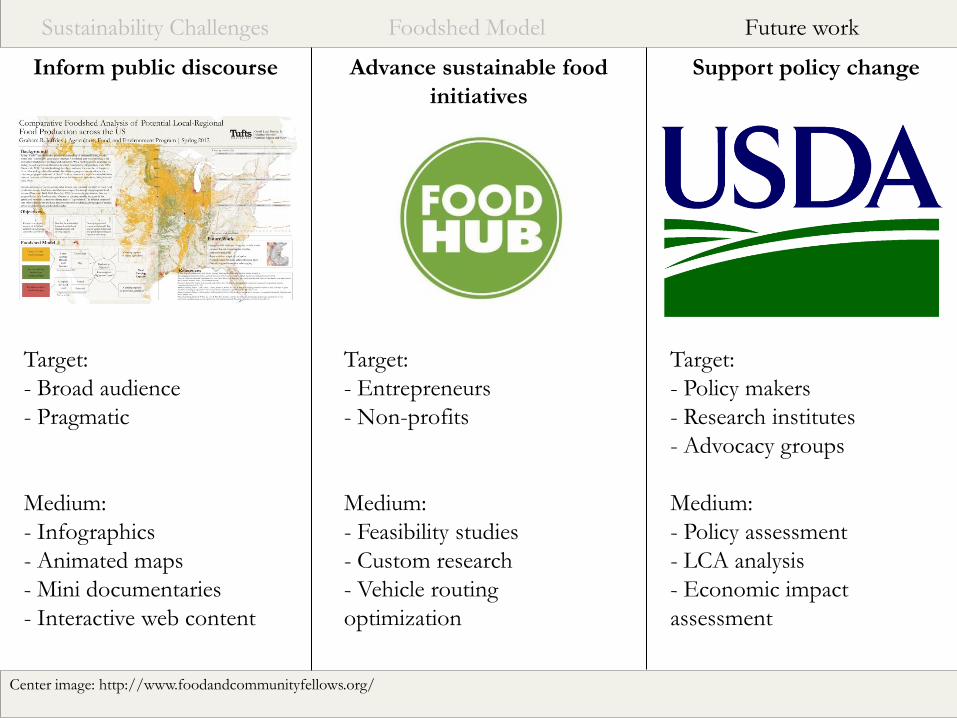
Inform public discourse Support policy change Advance sustainable food
initiatives
Center image: http://www.foodandcommunityfellows.org/
Target:
- Broad audience
- Pragmatic
Medium:
- Infographics
- Animated maps
- Mini documentaries
- Interactive web content
Target:
- Entrepreneurs
- Non-profits
Medium:
- Feasibility studies
- Custom research
- Vehicle routing
optimization
Target:
- Policy makers
- Research institutes
- Advocacy groups
Medium:
- Policy assessment
- LCA analysis
- Economic impact
assessment
Sustainability Challenges Foodshed Model Future work
Population centers
Pasture/hay
Cropland
Graham R. Jeffries
Graham.R.Jeffries{a}gmail.com
717.649.6907
Related Documents