Comparative Evaluation of Practical and Simulation SV Traffic Streaming Latency Results within Process Bus Network Mike Mekkanen, Reino Virrankoski, Mohammed Elmusrati University of Vaasa, Department of Computer Science, Erkki Antila University of Vaasa .Department of Electrical Engineering and Energy Technology Abstract—Substation Automation System (SAS) performance has been gained great improvements by implementing the high data rate process bus based on IEC 61850-9-2LE. However, these improvements need to be fully assessed within different circumstances before the scheme can be implemented to real SAS. This paper illustrates a comparisons between the performance testing of a practical (using commercial physical devices) prototype process bus and the simulated model based on the sample value (SV) traffic stream latency using a novel estimation approach. The practical prototype process bus has been implemented based on the IEC 61850-9-2LE process bus and the simulated model has been initiated within the OPNET simulation tool models complaint with the IEC 61850-9-2LE process bus. By implementing the comparison two benefits have been achieved, from the practical experiments point view it proves the correctness of the design and the implementation of the IEC 61850-9-2LE process bus and the novel time analysis of the SV traffic stream latency. From the OPNET simulation models point view it shows the rightness of IEC 61850-9-2LE process bus modeling and also it shows the powerful of the OPNET simulation tools that can model a high data rate real-time system based on the new standard IEC 61850-9-2LE. Moreover, paper results illustrate that the latencies are almost the same and also explains the reasons for the small differences. Keywords-IEC61850-9-2LE; merging Unit (MU); SAS; SV; opnet I. INTRODUCTION Future power systems implement a wide variety of state of art digital technology and standards within the operation process based on sharing information, communication and automation technology. For instance the wide internationally acceptance of the IEC61850 standard and the growth of IEC61850-9-2 process bus as a high data rate communication network have a great improved the capability of the SAS. These improvements can be summarized in two simple way as follows. Reduction in the SAS constriction cost by eliminating the high cost copper field wiring, as one pair of optic fiber may handle all the communication, control and protection signals for single intelligent electronic device (IED) that may replace 100 or more copper wire connections. Moreover, Improving system performance and safety by keeping the high analog (voltages and current) signals within the SAS primary side, while provide a full digital SAS within the secondary side (bay and station levels). IEC61850-9-2 provides distributed measurements for monitoring, control and protection functions by using so-called Merging Unit (MU). The MU has the ability to connect the analog word to the digital word within the SAS by converting the analog data signals that gathered from the primary instruments currents and voltages transformers (CT,VT) into digitalized standard packets for subsequent transmission through the process bus local area network (LAN). It can transmit over the point-to- point type connection to any IED or broadcast over the LAN in the similar manner as General Object Oriented Substation Events (GOOSE) messages. According to the IEC61850-9-2 that specified how SV measurements can be transmitted over the LAN whereas IEC61850-9-2LE (Light Edition) reduces the complexity and difficulty of implementation associated within the first version [1]. This improvement has been achieved by restricting the data sets that are transmitted and specifying the sampling rates. The assigned dataset comprises four voltages and currents three phases and neutral for each as illustrated in Figure 1 a. Whereas Figure 1 b illustrates the MU IED node model diagram in which that can be used within the process bus network to simulate the SAS. The process bus network analysis is in the focus of research area from both industrial and academia, several network process bus modeling have been under testing, however their hard assumption limit their effectiveness [2]. In [3] modeling and simulation of the distribution substation 69 kV and 220 kV, however the raw data of the SV traffic characteristic that been used is uncompliant with IEC61850-9-2LE. Where as in [4] several works have been done based on test bench that calculate and compare the characteristic of the SV traffic differences between the two baths direct from merging unit and the source of the digital reference signal. David Ingram has been done several works that discussed the proses bus critical issues such as time synchronization, routing and process bus traffic analysis. Most of the work had been done by using the GTNET card with the SV firmware to generate the SV traffic stream and the Endace DAG7.5G4 network card to monitor the traffic. According to generated traffic calculation and performance evaluation of the SAS communication network had been done [5], [6]. 2015 AASRI International Conference on Industrial Electronics and Applications (IEA 2015) © 2015. The authors - Published by Atlantis Press 367

Welcome message from author
This document is posted to help you gain knowledge. Please leave a comment to let me know what you think about it! Share it to your friends and learn new things together.
Transcript
Comparative Evaluation of Practical and Simulation SV Traffic Streaming Latency Results within Process Bus Network
Mike Mekkanen, Reino Virrankoski, Mohammed Elmusrati
University of Vaasa, Department of Computer Science,
Erkki Antila University of Vaasa .Department of Electrical Engineering
and Energy Technology
Abstract—Substation Automation System (SAS) performance has been gained great improvements by implementing the high data rate process bus based on IEC 61850-9-2LE. However, these improvements need to be fully assessed within different circumstances before the scheme can be implemented to real SAS. This paper illustrates a comparisons between the performance testing of a practical (using commercial physical devices) prototype process bus and the simulated model based on the sample value (SV) traffic stream latency using a novel estimation approach. The practical prototype process bus has been implemented based on the IEC 61850-9-2LE process bus and the simulated model has been initiated within the OPNET simulation tool models complaint with the IEC 61850-9-2LE process bus. By implementing the comparison two benefits have been achieved, from the practical experiments point view it proves the correctness of the design and the implementation of the IEC 61850-9-2LE process bus and the novel time analysis of the SV traffic stream latency. From the OPNET simulation models point view it shows the rightness of IEC 61850-9-2LE process bus modeling and also it shows the powerful of the OPNET simulation tools that can model a high data rate real-time system based on the new standard IEC 61850-9-2LE. Moreover, paper results illustrate that the latencies are almost the same and also explains the reasons for the small differences.
Keywords-IEC61850-9-2LE; merging Unit (MU); SAS; SV; opnet
I. INTRODUCTION
Future power systems implement a wide variety of state of art digital technology and standards within the operation process based on sharing information, communication and automation technology. For instance the wide internationally acceptance of the IEC61850 standard and the growth of IEC61850-9-2 process bus as a high data rate communication network have a great improved the capability of the SAS. These improvements can be summarized in two simple way as follows. Reduction in the SAS constriction cost by eliminating the high cost copper field wiring, as one pair of optic fiber may handle all the communication, control and protection signals for single intelligent electronic device (IED) that may replace 100 or more copper wire connections. Moreover, Improving system performance and safety by keeping the high analog (voltages and current) signals within the SAS primary side, while provide a full digital SAS within the secondary side (bay and station levels). IEC61850-9-2 provides distributed
measurements for monitoring, control and protection functions by using so-called Merging Unit (MU). The MU has the ability to connect the analog word to the digital word within the SAS by converting the analog data signals that gathered from the primary instruments currents and voltages transformers (CT,VT) into digitalized standard packets for subsequent transmission through the process bus local area network (LAN). It can transmit over the point-to-point type connection to any IED or broadcast over the LAN in the similar manner as General Object Oriented Substation Events (GOOSE) messages. According to the IEC61850-9-2 that specified how SV measurements can be transmitted over the LAN whereas IEC61850-9-2LE (Light Edition) reduces the complexity and difficulty of implementation associated within the first version [1]. This improvement has been achieved by restricting the data sets that are transmitted and specifying the sampling rates. The assigned dataset comprises four voltages and currents three phases and neutral for each as illustrated in Figure 1 a. Whereas Figure 1 b illustrates the MU IED node model diagram in which that can be used within the process bus network to simulate the SAS. The process bus network analysis is in the focus of research area from both industrial and academia, several network process bus modeling have been under testing, however their hard assumption limit their effectiveness [2]. In [3] modeling and simulation of the distribution substation 69 kV and 220 kV, however the raw data of the SV traffic characteristic that been used is uncompliant with IEC61850-9-2LE. Where as in [4] several works have been done based on test bench that calculate and compare the characteristic of the SV traffic differences between the two baths direct from merging unit and the source of the digital reference signal. David Ingram has been done several works that discussed the proses bus critical issues such as time synchronization, routing and process bus traffic analysis. Most of the work had been done by using the GTNET card with the SV firmware to generate the SV traffic stream and the Endace DAG7.5G4 network card to monitor the traffic. According to generated traffic calculation and performance evaluation of the SAS communication network had been done [5], [6].
2015 AASRI International Conference on Industrial Electronics and Applications (IEA 2015)
© 2015. The authors - Published by Atlantis Press 367
(a) (b)
Figure 1. Merging Unit concept (a), MU IED model (b)
In this work practical testing of the SV traffic streaming latency within the process bus network have been performed using commercial physical devices that reflect a real behavior of the actual SAS. Moreover, comparisons between the IEC 61850-9-2LE process bus practical experiments and the IEC 61850-9-2LE process bus OPNET simulation models [7] results have been made. By implementing the comparison two benefits have been achieved, from the practical experiments point view it proves the correctness of the design and the implementation of the IEC 61850-9-2LE process bus and from the OPNET simulation models point view it shows the rightness of IEC 61850-9-2LE process bus modeling and the time analysis of the SV traffic stream latency. Also it shows the powerful of the OPNET simulation tools that can model a high data rate real-time system based on the new standard IEC 61850-9-2LE.
II. SV TRAFFIC STREAM ESTIMATED NETWORK LATENCY
MU reliability and proper functionality plays major role within the SAS. For instant incorrect measurements, delays and errors may lead to incorrect resolution of a protective and control IEDs that may cause in serious damage. Therefore within this part the SV traffic stream latency have been evaluated. The purpose of these evaluations and testing are to assess the limits and capacity of the process bus network critical components such as the communication links, Ethernet switch number that the SV traffic stream may pass to reach their destination with the associated latency experience when passing these number of Ethernet switches and the number of MU that may composed in a single process bus network are the focus of this study. The overall estimated SV traffic stream latency is composed of three different estimated latencies as illustrated in (1). Thus the estimated SV traffic stream latency (TESV) can be calculated as follows;
ΤΕΣς = ΤΜΥ +ΤΛΑΝ + ΤΠΧ (1) Where, TMU: is the processing time for the MU to
process (sampling, encapsulating) the data and transmit as Ethernet packet. TLAN: the estimated time required for the packet to travel from the source to their distention within the assigned LAN. TPC: the estimated time required for the PC to process and presents the received data.Thus the estimated SV traffic stream latency (TELAN) within the assigned LAN based on two successive received packets can be calculated as follows;
ΤΕΛΑΝ = ΤΕΣς2 ΤΕΣς1 (2) As a result;
ΤΕΛΑΝ = Τ2ΛΑΝ Τ1ΛΑΝ (3) Since T2MU1 and T1MU1 are expected to be constant
based on the processing time for the same length sequence of data and within the same device are expected to be constant. Also T2PC1 and T1PC1 are expected to be constant based on the processing time for packets with the same size and within the same device are expected to be constant reference [5] support this assumption. Nowhere, since the inter-arrival time between SV packets is 250 µs based on 4 kHz sample rate for 50 Hz and 80 sample/c. Therefore, the actual estimated latency (TAELAN) that has been experienced by every SV packet within the LAN can be calculated as;
ΤΑΕΛΑΝ = ΤΕΛΑΝ Τ ιντερ−αρριϖαλ (4) As regard and from the discussion that had been
mentioned above SV traffic stream latencies within the assigned LAN is the focus of this study based on two scenarios as follows in the next section [9].
III. CASE STUDY
According to the first scenario and within the first step MU has been modeled as a SV messages publisher and receiving IED has been modeled to subscribe to the publishing MU SV traffic stream using OPNET as illustrated in Figure 1b. OPNET provides several editors that facilitate and simplifying the modeling task. In this part description for the most commonly used editors has been overviewed. These editors are organized in a hierarchical manner from down to up parameter editor, process editor, node editor and project editor. The parameter (include packet format editor) editor is always considered as a utility editor rather than modeling domains that the user could configure the modeled node parameters and traffic generation parameters such as MAC address, destination address, start time, stop time, inter-arrival time, packet size, etc. While OPNET process model editor is used to describe the logic flow and behavior of processors, protocols, resources, application, algorithms and queues modules using finite state machine (FSM) approach. Process model consists of state and state transition diagram (STD) that expressed in language called Proto-C with an extensive library of kernel procedure, and the standard C programing language. The states and transitions graphically describe the progression of a process in response to events. Within each state, general logic can be specified by implementing the predefined library and even the full flexibility of the C language or linking to an external program. Figure 2a illustrates process model for the traffic generation source module.
368

Figure 2. (A) Opnet process model (B) Opnet project model
In order to illustrate Node editor has been considered as a user interface tool in which that a user can model a physical device and edit the internal structure of the modeled device or node. Node model is consists from several modules that separated by logical functionalities. These modules are interconnected by packet stream or statistic wires. Each particular node function can be represented by a particular module in which that modules can be used to transmit packet, receive packet, process data, store data, route packets. Where the Ethernet MAC node model provided with OPNET nodes model library implements the carrier sense multiple access collision detection CSMA/CD and retransmission mechanisms specified in the IEEE 802.3, IEEE 802.3z standard [8]. Within the Ethernet MAC model the following features provided serialization of bit transfers to and from the physical layer, first input first output (FIFO) processing of transmission request, propagation delay based on the distance between connected nodes, carrier sensing and collision detection within the physical layer and support full-and half-duplex transmission. Ethernet MAC node models have been used within this work process bus network test models. Project editor is used to specify the system topology of communication network that may be considered as the one that may use for every simulation task. Within the project editor user can define the position and the interconnection of the modeled nodes that the system consists from. The network of the modeled system can be complex since the project editor can support different kind of nodes such as fixed, mobile and satellite. However the complexity can be eliminated by implanting the subnetwork approach that can be arraigned in hierarchical manner. In subnetwork lower level that may only consists from nodes
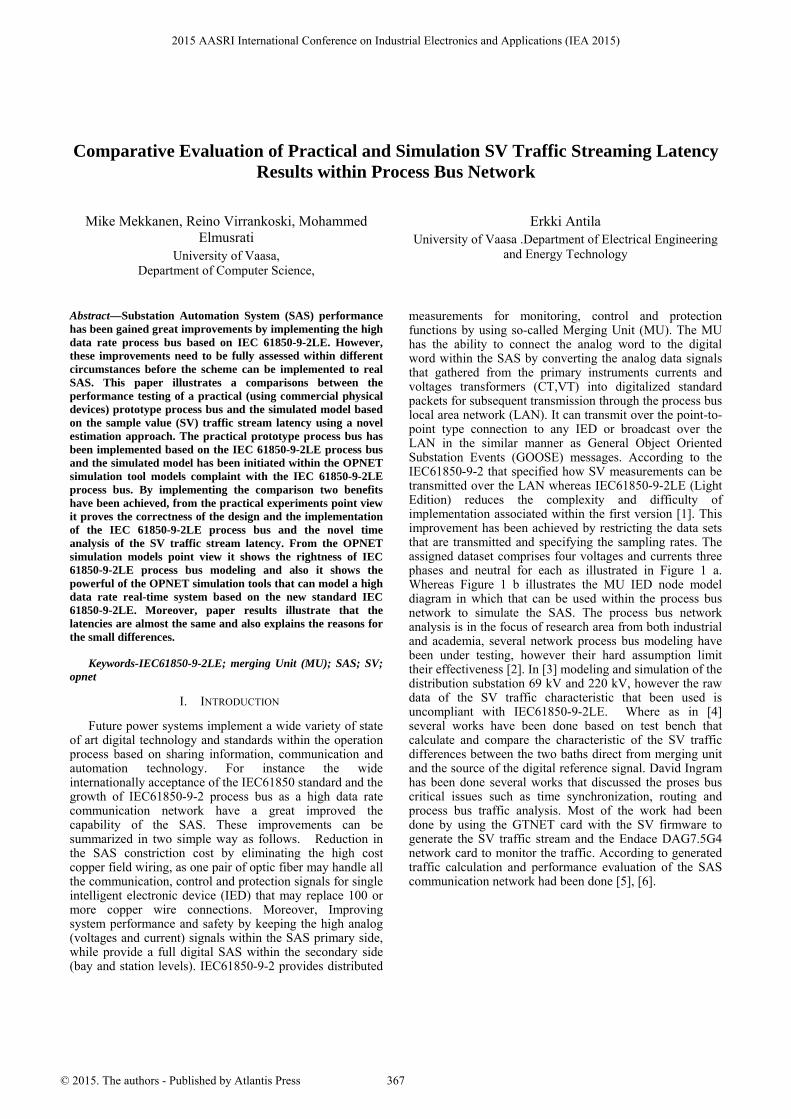
and communication links. Project editor can grouped all those subnetworks where communication links facilitate communication between those subnetworks. Fig. 2b illustrates the MU IED nodes in the SAS [8]. From Fig. 2b where the LAN speed 100Mb/s several modulated MUs have been connected to the process bus network. Each test the number of the MUs within the process bus network increases by one. This test reflects the real behavior of the process bus network when the SV traffic stream increase based on increasing the number of MU within the network. Moreover it shows the capacity of the process bus network based on the speed of the LAN network and also the process bus tolerance based on the limitation of the number of MUs that have to be connected within the SAS. Every MU generates SV traffic stream 4000 packet/s as a result 19 Mu units generate 1140000 packets within 15 seconds. From Figure 3a the first MU latency was 26.6613 µs whereas every MU add almost fixed amount of latency to the SV traffic stream ≈ 6 µs. Also the 19 MU add latency to SV traffic was 144,914583 µs which is within the acceptable latency range 250 µs. However based on adding MUs 20-23 the latency has been increased significantly as illustrated in Figure 3b and Table I where it is not acceptable based on the SV limitation (SV traffic stream without error 250 µs) [1].
TABLE 1. MU LATENCY
MU20 MU21 MU22 MU23
T(s) 0.0958 0.1960 0.2712 0.3629
These latencies have been recognized and defined that
they occur based on reaching of the limits of the LAN speed 100Mb/s, whereas the Ethernet switch still operating in a normal way without packet dropping (23 MUs generate 184004 packets within 2 seconds, station sink destroy 184.002 packets: OPNET statistic) since it can serve packets based on processing rate 100000 packets/s. The Ethernet queue size is 100 packets.
369
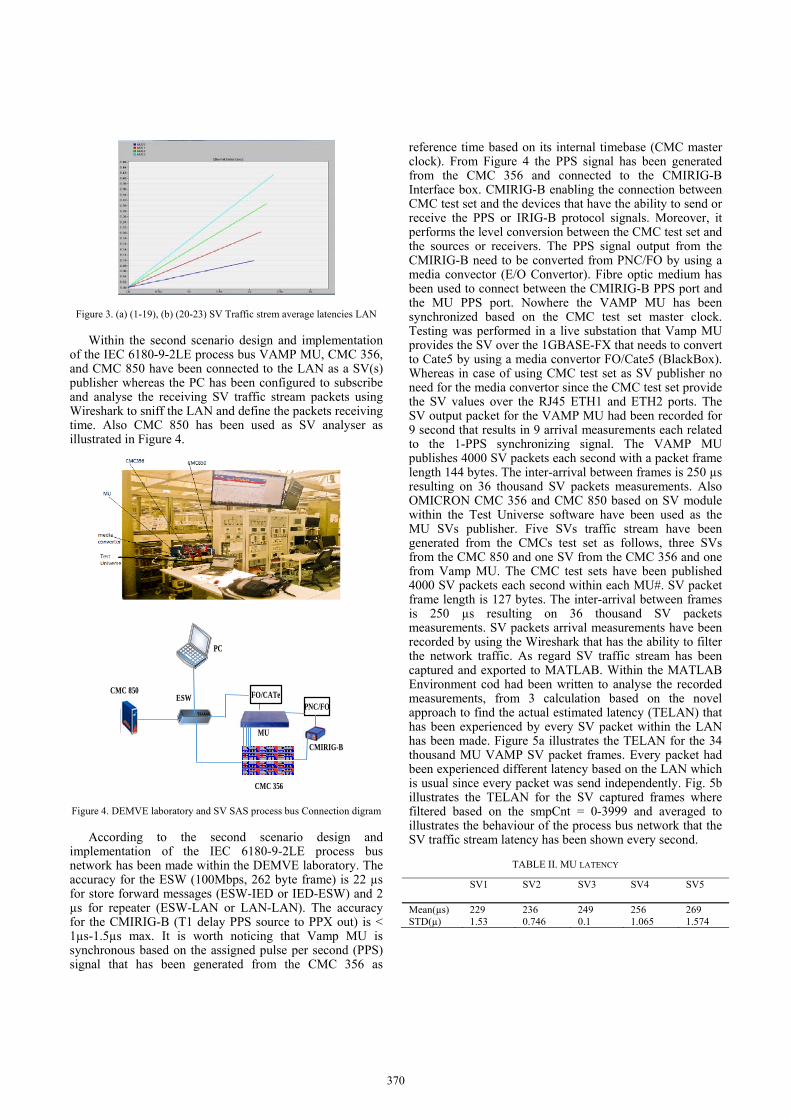
Figure 3. (a) (1-19), (b) (20-23) SV Traffic strem average latencies LAN
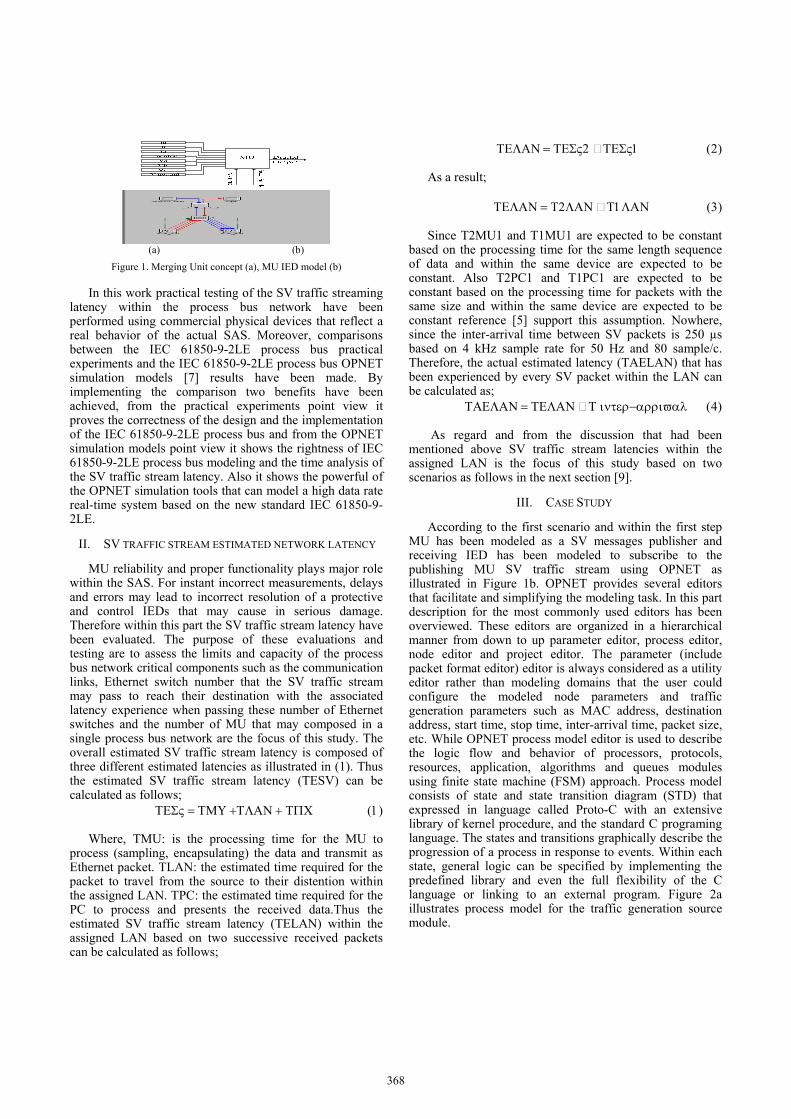
Within the second scenario design and implementation of the IEC 6180-9-2LE process bus VAMP MU, CMC 356, and CMC 850 have been connected to the LAN as a SV(s) publisher whereas the PC has been configured to subscribe and analyse the receiving SV traffic stream packets using Wireshark to sniff the LAN and define the packets receiving time. Also CMC 850 has been used as SV analyser as illustrated in Figure 4.
PC
CMC 850
CMC 356
MUCMIRIG-B
ESWPNC/FO
FO/CATe
Figure 4. DEMVE laboratory and SV SAS process bus Connection digram
According to the second scenario design and implementation of the IEC 6180-9-2LE process bus network has been made within the DEMVE laboratory. The accuracy for the ESW (100Mbps, 262 byte frame) is 22 µs for store forward messages (ESW-IED or IED-ESW) and 2 µs for repeater (ESW-LAN or LAN-LAN). The accuracy for the CMIRIG-B (T1 delay PPS source to PPX out) is < 1µs-1.5µs max. It is worth noticing that Vamp MU is synchronous based on the assigned pulse per second (PPS) signal that has been generated from the CMC 356 as
reference time based on its internal timebase (CMC master clock). From Figure 4 the PPS signal has been generated from the CMC 356 and connected to the CMIRIG-B Interface box. CMIRIG-B enabling the connection between CMC test set and the devices that have the ability to send or receive the PPS or IRIG-B protocol signals. Moreover, it performs the level conversion between the CMC test set and the sources or receivers. The PPS signal output from the CMIRIG-B need to be converted from PNC/FO by using a media convector (E/O Convertor). Fibre optic medium has been used to connect between the CMIRIG-B PPS port and the MU PPS port. Nowhere the VAMP MU has been synchronized based on the CMC test set master clock. Testing was performed in a live substation that Vamp MU provides the SV over the 1GBASE-FX that needs to convert to Cate5 by using a media convertor FO/Cate5 (BlackBox). Whereas in case of using CMC test set as SV publisher no need for the media convertor since the CMC test set provide the SV values over the RJ45 ETH1 and ETH2 ports. The SV output packet for the VAMP MU had been recorded for 9 second that results in 9 arrival measurements each related to the 1-PPS synchronizing signal. The VAMP MU publishes 4000 SV packets each second with a packet frame length 144 bytes. The inter-arrival between frames is 250 µs resulting on 36 thousand SV packets measurements. Also OMICRON CMC 356 and CMC 850 based on SV module within the Test Universe software have been used as the MU SVs publisher. Five SVs traffic stream have been generated from the CMCs test set as follows, three SVs from the CMC 850 and one SV from the CMC 356 and one from Vamp MU. The CMC test sets have been published 4000 SV packets each second within each MU#. SV packet frame length is 127 bytes. The inter-arrival between frames is 250 µs resulting on 36 thousand SV packets measurements. SV packets arrival measurements have been recorded by using the Wireshark that has the ability to filter the network traffic. As regard SV traffic stream has been captured and exported to MATLAB. Within the MATLAB Environment cod had been written to analyse the recorded measurements, from 3 calculation based on the novel approach to find the actual estimated latency (TELAN) that has been experienced by every SV packet within the LAN has been made. Figure 5a illustrates the TELAN for the 34 thousand MU VAMP SV packet frames. Every packet had been experienced different latency based on the LAN which is usual since every packet was send independently. Fig. 5b illustrates the TELAN for the SV captured frames where filtered based on the smpCnt = 0-3999 and averaged to illustrates the behaviour of the process bus network that the SV traffic stream latency has been shown every second.
TABLE II. MU LATENCY
SV1 SV2 SV3 SV4 SV5
Mean(µs) 229 236 249 256 269 STD(µ) 1.53 0.746 0.1 1.065 1.574
370

Figure 5. (a) CMC 356 SV latency for 35000 packets, (b) Filterd average
SV latency
The mean of the SV traffic stream latency that had been
added by every MU is ≈ 9.96 µs which is almost the same as the result from the simulation model (≈ 6 -9 µs). The small difference that may appear between the two results was based on that the simulation had been made within the PC in which that means the SV even they are from different simulated MU however, the processing time to generate the SV traffic was the same for every MU. Whereas, from the practical experiments point view every generated MU SV traffic stream was generated from different source in which that the SV traffic streams was related to the processing time and characteristic of each generated source. Moreover, even the standard has been assigned the SV packet length 126 bytes plus the address, however the SV that has been generated from the CMC instruments is 127 byte, whereas the SV packets length that has been generated from the VAMP MU is 144 byte. These differences in the SV packets length are strongly related to the differences on the SV latency results, since the latency are proportional with the packet length. Within the work some of the technical issues had been faced such as, there is no enough number of SV resources to assess the limitation of the process bus network based on the number of MU that may connected within the subnetwork. Also within the Wireshark network protocol analyzer environment although the recorded traffic can be filtered based on the source address, destination address etc. however the calculation for instance (packet
latency based on previous received packet) has been implemented based on the all received packets and not based on the filtered received packet view. Therefore, MATLAB code had been written to analyze, calculate and draw the SV traffic stream latency.
IV. CONCLUSION
This paper illustrates the comparative evaluation of practical and simulation SV traffic streaming latency results within process bus network IEC 61850-9-2LE where the calculation within the practical experiments have been implemented based on the novel approach to estimate the SV traffic streaming latency.
The obtaining results show that by implementing the comparison two benefits have been achieved, from the practical experiments point view it proves the correctness of the design and the implementation of the IEC 61850-9-2LE process bus and the novel time analysis of the SV traffic stream latency. From the OPNET simulation models point view it shows the rightness of IEC 61850-9-2LE process bus modeling and also it shows the powerful of the OPNET simulation tools that can model a high data rate real-time system based on the new standard IEC 61850-9-2LE. Moreover, the paper illustrates that the latencies are almost the same and also explains the reasons for the small differences that may appear between them.
REFERENCES
[1] EC TC57 Communication Networks and Systems for Power Utility Automation –Part 9-2: Specific Communication Services Mapping (SCSM)-Sampled Values Over ISO/IEC 8802-3, IEC61850-9-2 ed2.0, Sep. 2011.
[2] J. Amelot, Y.-S. Li-Baboud, C. Vasseur, J. Fletcher, D. Anand and J. Moyne “An IEEE 1588 performance testing dashboard for power industry requirements,” in Proc, IEEE Int, Symp, Precis Clock Synchr meas Control Commun., Munich, Germany, Sep, 12-16, 2011
[3] T. S. Sidhu, Y. Yin, K. “Modelling and Simulation for performance Evaluation of IEC61850-Based Substation Communicatiion System,” IEEE Tran, Power Delivery, vol.22, no. Jul. 2007.
[4] M. Gurbiel, P. Komarnick, Z. A. Styczynski, F. W. Gatzen, C. Dzienis, “Merging Unit Accuracy Testing,” IEEE Power & Energy General Meeting, Jul, 26-30, 2009.
[5] D. M. E. Ingram, R. R. Tylor, P. Schub, and D. A. Campbell, “Performance Analysis of IEC 61850 Sampled Value Process Bus Network,” IEEE Transl. Industrial Information, vol. 9, no.3, pp 1445-1454, Aug, 2013.
[6] D. M. E. Ingram, F. Steinhauser, C. Marinescu, R. R. Tylor, P. Schub, and D. A. Campbell, “Direct evaluation of IEC 61850-9-2 process bus network performance,” IEEE Transl. Smart Grid, vol. 3, no.4, pp 1853-1854, Dec, 2012.
[7] M. Mike Mekkanen, Reino Virrankoski, Mohammed Elmusrati & Erkki Antila, “Using OPNET to Model and Evaluate the MU Performance Based on IEC61850-9-2LE,” to appear in proc Conquering Complexity: Challenges and Opportunities conference November 3-5, 2014, Missouri University of Science & Technology Philadelphia, PA, USA.
[8] OPNET Modeler- OPNET Technologies, [Online], Available: http://www.opnet.com
371
Related Documents