Iowa State University Digital Repository @ Iowa State University Agricultural and Biosystems Engineering Conference Proceedings and Presentations Agricultural and Biosystems Engineering 6-2014 Comparative Evaluation of Light-emiing Diode (LED) vs. Fluorescent (FL) Lighting in Commercial Aviary Hen Houses Hongqian Long Iowa State University Yang Zhao Iowa State University, [email protected] Tong Wang Iowa State University, [email protected] Hongwei Xin Iowa State University, [email protected] Zhonghua Ning China Agricultural University Follow this and additional works at: hp://lib.dr.iastate.edu/abe_eng_conf Part of the Agriculture Commons , Bioresource and Agricultural Engineering Commons , and the Food Chemistry Commons e complete bibliographic information for this item can be found at hp://lib.dr.iastate.edu/ abe_eng_conf/383. For information on how to cite this item, please visit hp://lib.dr.iastate.edu/ howtocite.html. is Conference Proceeding is brought to you for free and open access by the Agricultural and Biosystems Engineering at Digital Repository @ Iowa State University. It has been accepted for inclusion in Agricultural and Biosystems Engineering Conference Proceedings and Presentations by an authorized administrator of Digital Repository @ Iowa State University. For more information, please contact [email protected].

Welcome message from author
This document is posted to help you gain knowledge. Please leave a comment to let me know what you think about it! Share it to your friends and learn new things together.
Transcript
Iowa State UniversityDigital Repository @ Iowa State UniversityAgricultural and Biosystems EngineeringConference Proceedings and Presentations Agricultural and Biosystems Engineering
6-2014
Comparative Evaluation of Light-emitting Diode(LED) vs. Fluorescent (FL) Lighting inCommercial Aviary Hen HousesHongqian LongIowa State University
Yang ZhaoIowa State University, [email protected]
Tong WangIowa State University, [email protected]
Hongwei XinIowa State University, [email protected]
Zhonghua NingChina Agricultural UniversityFollow this and additional works at: http://lib.dr.iastate.edu/abe_eng_conf
Part of the Agriculture Commons, Bioresource and Agricultural Engineering Commons, and theFood Chemistry Commons
The complete bibliographic information for this item can be found at http://lib.dr.iastate.edu/abe_eng_conf/383. For information on how to cite this item, please visit http://lib.dr.iastate.edu/howtocite.html.
This Conference Proceeding is brought to you for free and open access by the Agricultural and Biosystems Engineering at Digital Repository @ IowaState University. It has been accepted for inclusion in Agricultural and Biosystems Engineering Conference Proceedings and Presentations by anauthorized administrator of Digital Repository @ Iowa State University. For more information, please contact [email protected].
2014 ASABE – CSBE/SCGAB Annual International Meeting Paper (Long et al.) Page 1
An ASABE – CSBE/ASABE Joint
Meeting Presentation
Paper Number: 141893157
Comparative Evaluation of Light-emitting Diode (LED) vs.
Fluorescent (FL) Lighting in Commercial Aviary Hen Houses
H. Long1,2, Y. Zhao1, T. Wang3, H. Xin1, Z. Ning2
1 Department of Agricultural and Biosystems Engineering, Iowa State University, Ames, IA 50011, USA 2 College of Animal Science and Technology, China Agricultural University, Beijing, 100193, China 3 Department of Food Science and Human Nutrition, Iowa State University, Ames, IA 50010, USA
Written for presentation at the
2014 ASABE and CSBE/SCGAB Annual International Meeting
Sponsored by ASABE
Montreal, Quebec Canada
July 13 – 16, 2014
Abstract. In this ongoing study, indoor environment, production performance, egg quality, and some welfare aspects of laying hens in two commercial aviary houses installed with light-emitting diode (LED) lights are compared with those in two aviary houses of similar hen age with fluorescent (FL) lights. To date the study (covering 18 – 44 weeks of hen age) shows the following preliminary results. The daily mean temperature and relative humidity (RH) in all houses were generally maintained within 20-25°C and 50-80%, respectively. The holders of LED and FL light bulbs had similar temperatures, approximately 40°C. There were no significant differences in hen production performance parameters between the LED and FL houses. Egg weight, yolk weight, yolk percentage and yolk color factor increased as hen age increased. The Haugh unit (HU) values of fresh eggs in all four houses at 27 and 40 weeks of age were 90 or higher, i.e., much greater than the “AA grade” egg threshold of 72. Haugh unit of fresh eggs in FL houses did not change over age, however, HU significantly decreased from 93.5±0.26 at 27 weeks of age to 91.6±0.35 at 40 weeks of age in LED houses (P<0.05). Compared to FL, LED improved egg weight, albumen height, HU, yolk weight and albumen weight at 27 weeks of age, and improved shell strength at 40 weeks of age (P<0.05). Dust accumulation rate (DAR) in LED houses (245±17 mg[hen-day]-1 or 3855±273 mg[m2-day]-1) and FL houses (278±22 mg[hen-day]-1 or 4366±352 mg[m2-day]-1) were similar. Hens in LED houses tended to have worse back/rump feather conditions than hens in FL houses. Median avoidance distance of hens to human approach was 3.55 m and 3.20 m, respectively, in LED and FL houses. More data collection is continuing.
Keywords: Laying hen, LED, fluorescent light, production performance, egg quality, welfare
2014 ASABE – CSBE/SCGAB Annual International Meeting Paper (Long et al.) Page 2
Introduction Lighting is a crucial factor affecting laying hen egg production, behavior, and well-being. Egg production is affected by lighting through a series of physiological processes (Huber-Eicher et al., 2013). Chickens have two light receptors, one is located in the retina and the other in the hypothalamus (Davies et al., 1975). Light can reach the receptor in the hypothalamus by penetrating the skull or transiting through the optic nerves attached to the retina. In response to lighting conditions (e.g. diurnal patterns, intensity, spectrum), the hypothalamus produces gonadotropin-releasing hormone (GnRH), which is transported through the pituitary portal and stimulates follicle-stimulating hormone (FSH) and luteinizing hormone (LH) secretion at anterior pituitary. Follicle-stimulating hormone and LH reach the chicken’s ovaries through blood circulation, promoting follicle development and maturation (Oliver et al., 1982; Kuenzel, 1993). Lighting intensity and spectrum have been shown to influence hen behavior (e.g. pecking, cannibalism, piling) which directly impacts to hen well-being (Hughes et al., 1972; Blokhuis, 1989; Vestergaard, 1994; Savory, 1995). Nowadays, fluorescent (FL) lighting is widely used in poultry houses in the U.S. due to their better energy efficiency and extended lifespan than incandescent lighting. However, FL light bulbs are subject to luminance declines over time (i.e., lamp lumen depreciation, LLD) and are sensitive to power fluctuations. These problems make it difficult to maintain uniform light intensity within poultry houses and throughout production cycles. Furthermore, the environmental hazard of disposed FL light bulbs is a concern. Compact FL light bulbs contain mercury which is an environmental hazard risk and requires special disposal handling. Compared to FL lights, light emitting diode (LED) lights have a better energy efficiency, longer expected operating life (100,000 h of operation), greater moisture resistance, and selectable spectra (Craford, 1985). These advantages stimulate the interest of using LED lighting in commercial poultry housing.
Previous research related to LED lighting focused on the effects of light wavelength, intensity and photoperiod on laying hen and broiler productivity and behaviors. Min et al. (2012) compared egg quality of hens under incandescent light and white, blue, red LED lights; and their results indicated that red LED lights significantly increased the thickness of eggshell compared to incandescent lights. Further research of red LED lighting showed reduced hen aggressiveness and accelerated sexual development (Huber-Eicher et al. 2013); increased ovary stroma, and ovarian follicle numbers (Hassan et al., 2013); reduced egg weight (Er et al., 2007); and increased egg production (Borille et al., 2013). Rozenboim et al. (1998) studied the effects of light intensity on laying hens and reported reduced feed consumption when light intensity was reduced from 0.1 W m-2 (about 68 lux) to 0.01 W m-2 (about 7lux). Most of the previous studies related to LED lights were conducted in lab-scale experiments involving small bird populations. There is little information about LED light and its impact on laying hens as compared to FL light under commercial production settings in terms of hen productivity and well-being. Such information will aid poultry producers in making sound decisions on lighting selection.
The objective of this study was to compare the effects of LED light and FL light on production performance, egg quality, and animal behavior of laying hens over a single laying cycle (18 - 80 weeks of age) in four commercial aviary houses (two with LED lights, and two with FL lights). Each house was populated with approximately 50,000 white laying hens and managed at the same facility. The indoor environment including temperature, relative humidity (RH), and settled dust were also monitored. This paper presents study progress results covering 18 - 44 weeks of hen age (July 2013 – March 2014).
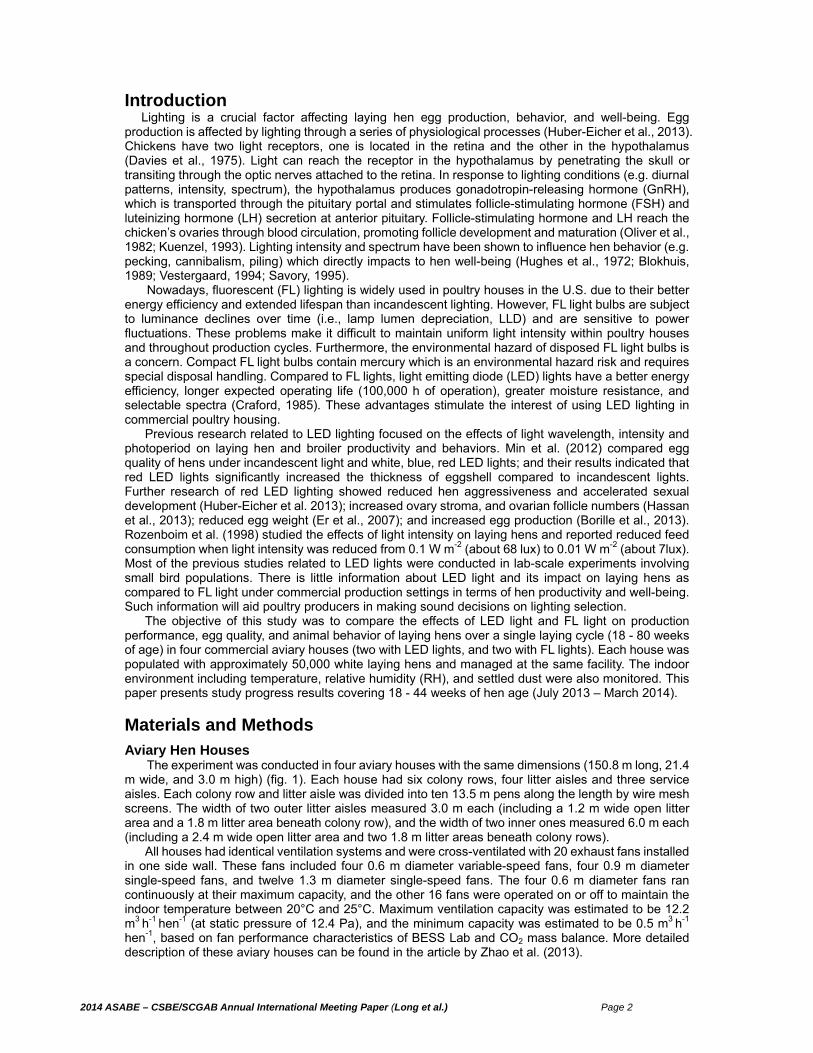
Materials and Methods Aviary Hen Houses The experiment was conducted in four aviary houses with the same dimensions (150.8 m long, 21.4 m wide, and 3.0 m high) (fig. 1). Each house had six colony rows, four litter aisles and three service aisles. Each colony row and litter aisle was divided into ten 13.5 m pens along the length by wire mesh screens. The width of two outer litter aisles measured 3.0 m each (including a 1.2 m wide open litter area and a 1.8 m litter area beneath colony row), and the width of two inner ones measured 6.0 m each (including a 2.4 m wide open litter area and two 1.8 m litter areas beneath colony rows).
All houses had identical ventilation systems and were cross-ventilated with 20 exhaust fans installed in one side wall. These fans included four 0.6 m diameter variable-speed fans, four 0.9 m diameter single-speed fans, and twelve 1.3 m diameter single-speed fans. The four 0.6 m diameter fans ran continuously at their maximum capacity, and the other 16 fans were operated on or off to maintain the indoor temperature between 20°C and 25°C. Maximum ventilation capacity was estimated to be 12.2 m3 h-1 hen-1 (at static pressure of 12.4 Pa), and the minimum capacity was estimated to be 0.5 m3 h-1
hen-1, based on fan performance characteristics of BESS Lab and CO2 mass balance. More detailed description of these aviary houses can be found in the article by Zhao et al. (2013).
2014 ASABE – CSBE/SCGAB Annual International Meeting Paper (Long et al.) Page 3
(a)
(b)
Figure 1. (a) Floor plan and (b) 1-1 cross-section view of an aviary laying hen house.
Hens and Management The four experimental houses were divided into two pairs, namely, house 1 (H1) and house 2 (H2)
as a pair and house 10 (H10) and house 11 (H11) as the other. The experiment started in July 2013 and will conclude in September 2014. Dekalb white laying hens were introduced at 18 weeks of age to the four houses. There were about 52,000 birds placed in H1, H10 and H11, and about 55,000 birds in H2. Due to the production schedule of the commercial facility, bird age had to differ somewhat between the barns. Namely, H1 hens were 3 weeks older than H2 hens, and H10 hens were 2 weeks older than H11 hens. For a production cycle spanning nearly 60 weeks, these 2-3 week age differences were considered non-consequential. For each pair, light arrangement, temperature, RH, light intensity, and management were similar. Photoperiod in each house started at 12 h of light (12 h darkness) and gradually increased to 16 h of light (by 24 weeks of age) which was maintained throughout the rest of the production cycle. In the morning, lights came on gradually starting at 5:45 a.m., and stabilized at 6:00 a.m. In the evening, lights were dimmed down starting at 8:45 p.m., and were completely off at 9:45 p.m. The gradual transition of light intensity was to simulate sunrise and sunset. The hens could get access to litter floor for 9.75 h everyday (from 12:00 p.m. to 9:45 p.m.). The manure belts were run at 6:00 a.m. for 10 min every day, so that one-third of the manure on the belts was removed from the houses. Feed and water were provided ad libitum.
Lighting
Light arrangement House 1 (H1) used cold cathode florescent (CCFL) lights (14 Watt, Overdrive Cleveland, OH) [1]; H11 used compact florescent (CFL) lights (14 Watt, Premium Quality Lighting, Simi Valley, CA). Both H2 and H10 used the same LED light (8 Watt, Nodark Biological Lighting Co. Ltd., Wuxi, China) (Table 1).
2014 ASABE – CSBE/SCGAB Annual International Meeting Paper (Long et al.) Page 4
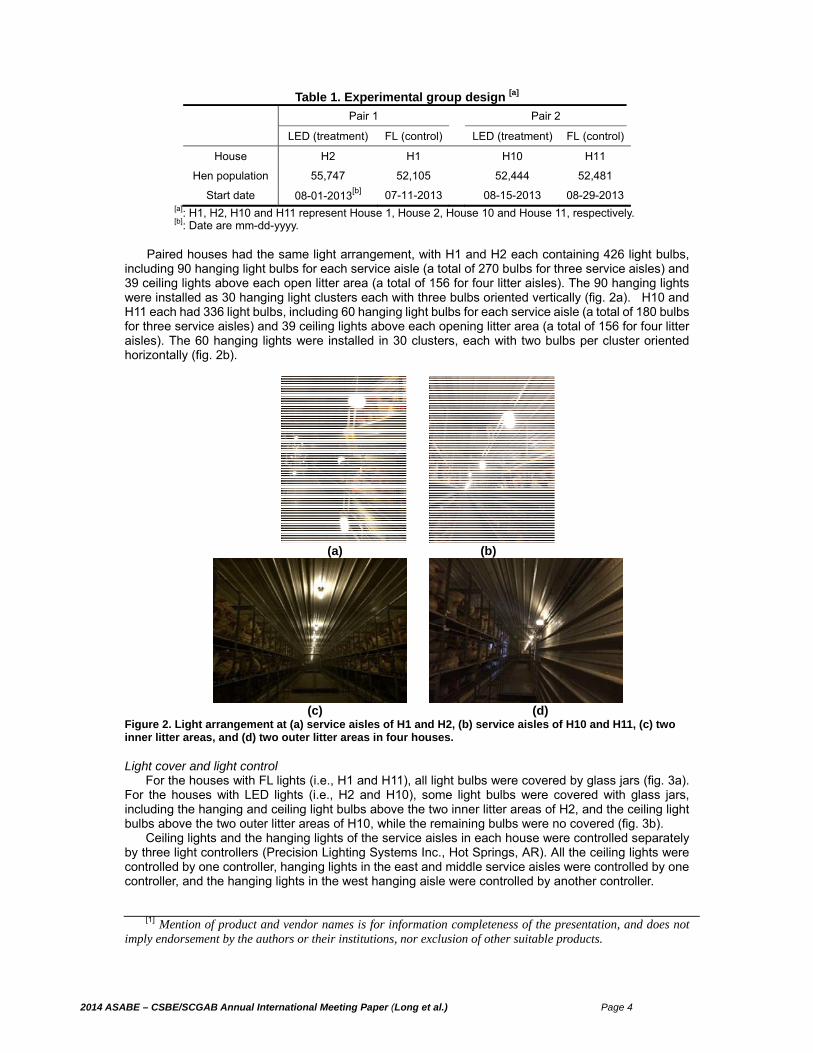
Table 1. Experimental group design [a]
Pair 1 Pair 2
LED (treatment) FL (control) LED (treatment) FL (control)
House H2 H1 H10 H11
Hen population 55,747 52,105 52,444 52,481
Start date 08-01-2013[b]
07-11-2013 08-15-2013 08-29-2013 [a]: H1, H2, H10 and H11 represent House 1, House 2, House 10 and House 11, respectively. [b]: Date are mm-dd-yyyy.
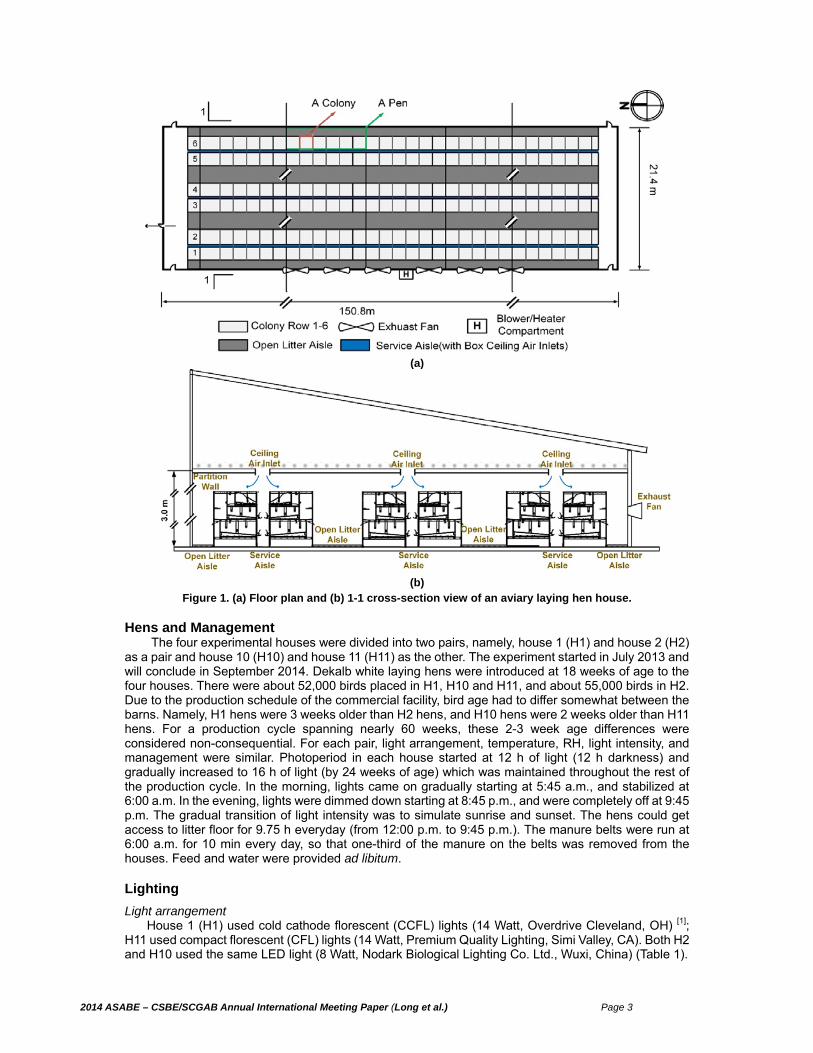
Paired houses had the same light arrangement, with H1 and H2 each containing 426 light bulbs, including 90 hanging light bulbs for each service aisle (a total of 270 bulbs for three service aisles) and 39 ceiling lights above each open litter area (a total of 156 for four litter aisles). The 90 hanging lights were installed as 30 hanging light clusters each with three bulbs oriented vertically (fig. 2a). H10 and H11 each had 336 light bulbs, including 60 hanging light bulbs for each service aisle (a total of 180 bulbs for three service aisles) and 39 ceiling lights above each opening litter area (a total of 156 for four litter aisles). The 60 hanging lights were installed in 30 clusters, each with two bulbs per cluster oriented horizontally (fig. 2b).
(a) (b)
(c) (d)
Figure 2. Light arrangement at (a) service aisles of H1 and H2, (b) service aisles of H10 and H11, (c) two inner litter areas, and (d) two outer litter areas in four houses.
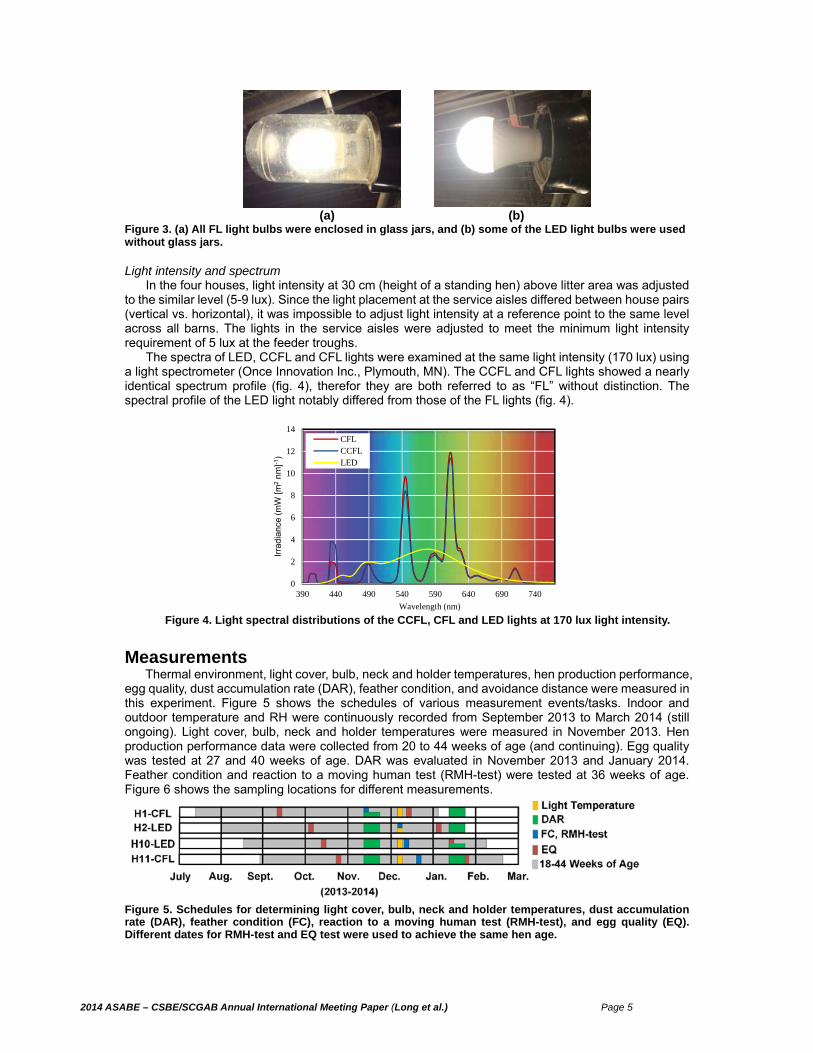
Light cover and light control For the houses with FL lights (i.e., H1 and H11), all light bulbs were covered by glass jars (fig. 3a).
For the houses with LED lights (i.e., H2 and H10), some light bulbs were covered with glass jars, including the hanging and ceiling light bulbs above the two inner litter areas of H2, and the ceiling light bulbs above the two outer litter areas of H10, while the remaining bulbs were no covered (fig. 3b).
Ceiling lights and the hanging lights of the service aisles in each house were controlled separately by three light controllers (Precision Lighting Systems Inc., Hot Springs, AR). All the ceiling lights were controlled by one controller, hanging lights in the east and middle service aisles were controlled by one controller, and the hanging lights in the west hanging aisle were controlled by another controller.
[1] Mention of product and vendor names is for information completeness of the presentation, and does not imply endorsement by the authors or their institutions, nor exclusion of other suitable products.
2014 ASABE – CSBE/SCGAB Annual International Meeting Paper (Long et al.) Page 5
(a) (b)
Figure 3. (a) All FL light bulbs were enclosed in glass jars, and (b) some of the LED light bulbs were used without glass jars.
Light intensity and spectrum In the four houses, light intensity at 30 cm (height of a standing hen) above litter area was adjusted
to the similar level (5-9 lux). Since the light placement at the service aisles differed between house pairs (vertical vs. horizontal), it was impossible to adjust light intensity at a reference point to the same level across all barns. The lights in the service aisles were adjusted to meet the minimum light intensity requirement of 5 lux at the feeder troughs.
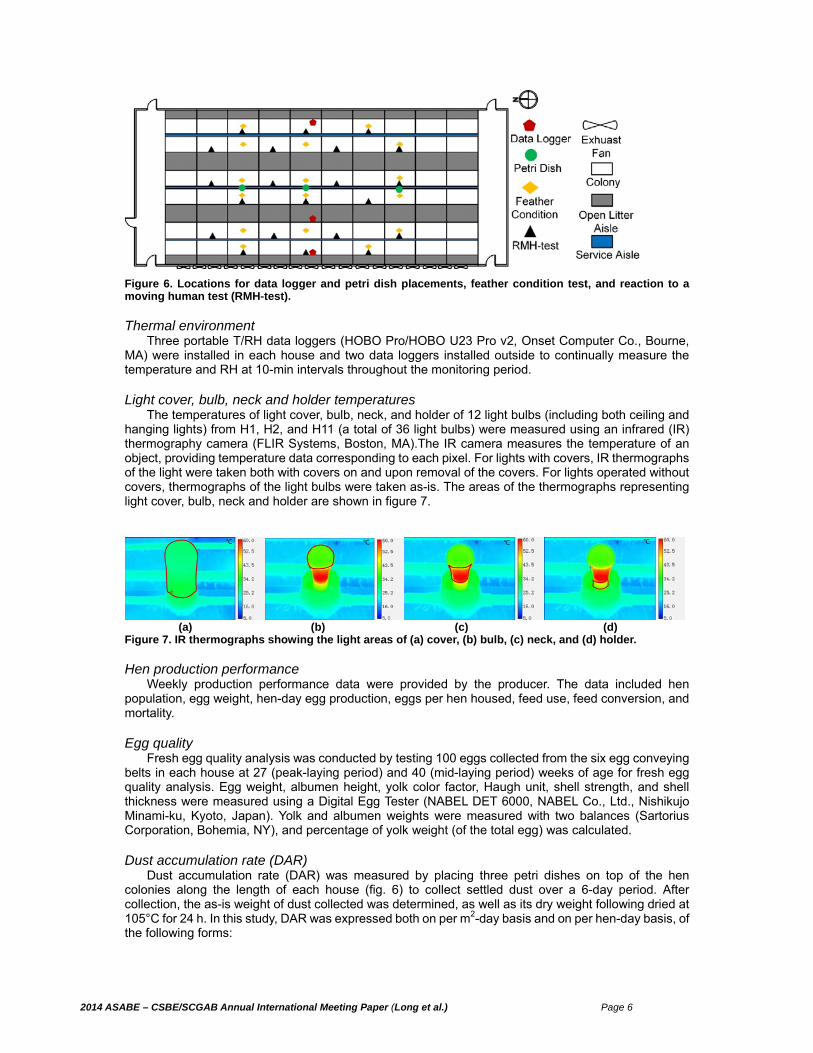
The spectra of LED, CCFL and CFL lights were examined at the same light intensity (170 lux) using a light spectrometer (Once Innovation Inc., Plymouth, MN). The CCFL and CFL lights showed a nearly identical spectrum profile (fig. 4), therefor they are both referred to as “FL” without distinction. The spectral profile of the LED light notably differed from those of the FL lights (fig. 4).
Figure 4. Light spectral distributions of the CCFL, CFL and LED lights at 170 lux light intensity.
Measurements
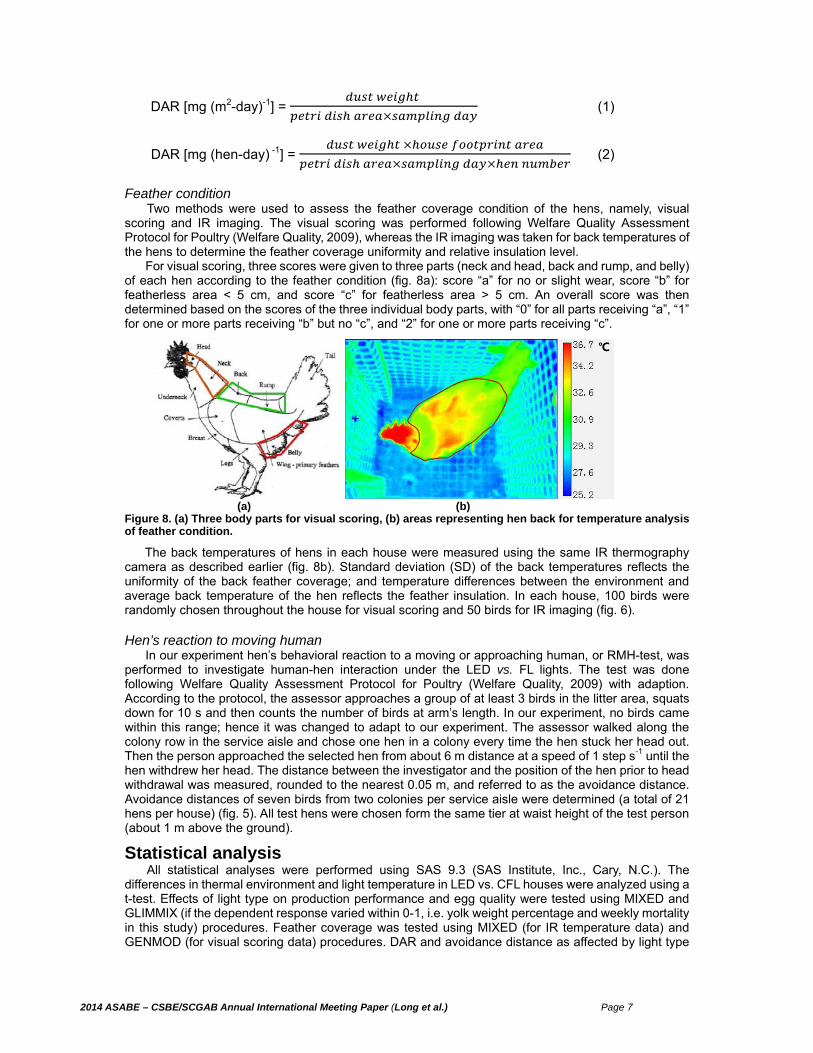
Thermal environment, light cover, bulb, neck and holder temperatures, hen production performance, egg quality, dust accumulation rate (DAR), feather condition, and avoidance distance were measured in this experiment. Figure 5 shows the schedules of various measurement events/tasks. Indoor and outdoor temperature and RH were continuously recorded from September 2013 to March 2014 (still ongoing). Light cover, bulb, neck and holder temperatures were measured in November 2013. Hen production performance data were collected from 20 to 44 weeks of age (and continuing). Egg quality was tested at 27 and 40 weeks of age. DAR was evaluated in November 2013 and January 2014. Feather condition and reaction to a moving human test (RMH-test) were tested at 36 weeks of age. Figure 6 shows the sampling locations for different measurements.
Figure 5. Schedules for determining light cover, bulb, neck and holder temperatures, dust accumulation rate (DAR), feather condition (FC), reaction to a moving human test (RMH-test), and egg quality (EQ). Different dates for RMH-test and EQ test were used to achieve the same hen age.
0
2
4
6
8
10
12
14
390 440 490 540 590 640 690 740
Irra
dian
ce (
mW
[m2
nm
]-1)
Wavelength (nm)
CFLCCFLLED
2014 ASABE – CSBE/SCGAB Annual International Meeting Paper (Long et al.) Page 6
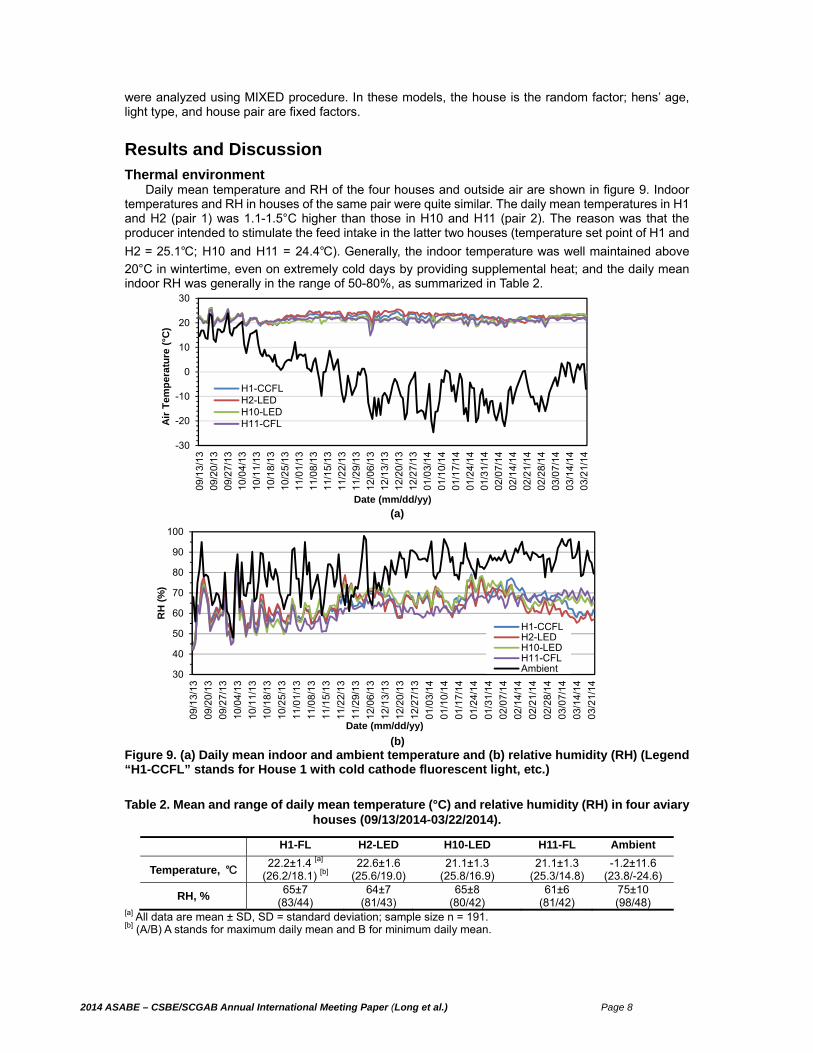
Figure 6. Locations for data logger and petri dish placements, feather condition test, and reaction to a moving human test (RMH-test).
Thermal environment Three portable T/RH data loggers (HOBO Pro/HOBO U23 Pro v2, Onset Computer Co., Bourne, MA) were installed in each house and two data loggers installed outside to continually measure the temperature and RH at 10-min intervals throughout the monitoring period.
Light cover, bulb, neck and holder temperatures The temperatures of light cover, bulb, neck, and holder of 12 light bulbs (including both ceiling and hanging lights) from H1, H2, and H11 (a total of 36 light bulbs) were measured using an infrared (IR) thermography camera (FLIR Systems, Boston, MA).The IR camera measures the temperature of an object, providing temperature data corresponding to each pixel. For lights with covers, IR thermographs of the light were taken both with covers on and upon removal of the covers. For lights operated without covers, thermographs of the light bulbs were taken as-is. The areas of the thermographs representing light cover, bulb, neck and holder are shown in figure 7.
(a) (b) (c) (d) Figure 7. IR thermographs showing the light areas of (a) cover, (b) bulb, (c) neck, and (d) holder.
Hen production performance Weekly production performance data were provided by the producer. The data included hen population, egg weight, hen-day egg production, eggs per hen housed, feed use, feed conversion, and mortality.
Egg quality Fresh egg quality analysis was conducted by testing 100 eggs collected from the six egg conveying belts in each house at 27 (peak-laying period) and 40 (mid-laying period) weeks of age for fresh egg quality analysis. Egg weight, albumen height, yolk color factor, Haugh unit, shell strength, and shell thickness were measured using a Digital Egg Tester (NABEL DET 6000, NABEL Co., Ltd., Nishikujo Minami-ku, Kyoto, Japan). Yolk and albumen weights were measured with two balances (Sartorius Corporation, Bohemia, NY), and percentage of yolk weight (of the total egg) was calculated.
Dust accumulation rate (DAR) Dust accumulation rate (DAR) was measured by placing three petri dishes on top of the hen colonies along the length of each house (fig. 6) to collect settled dust over a 6-day period. After collection, the as-is weight of dust collected was determined, as well as its dry weight following dried at 105°C for 24 h. In this study, DAR was expressed both on per m2-day basis and on per hen-day basis, of the following forms:
℃ ℃ ℃ ℃
2014 ASABE – CSBE/SCGAB Annual International Meeting Paper (Long et al.) Page 7
DAR [mg (m2-day)-1] =
(1)
DAR [mg (hen-day) -1] =
(2)
Feather condition Two methods were used to assess the feather coverage condition of the hens, namely, visual scoring and IR imaging. The visual scoring was performed following Welfare Quality Assessment Protocol for Poultry (Welfare Quality, 2009), whereas the IR imaging was taken for back temperatures of the hens to determine the feather coverage uniformity and relative insulation level.
For visual scoring, three scores were given to three parts (neck and head, back and rump, and belly) of each hen according to the feather condition (fig. 8a): score “a” for no or slight wear, score “b” for featherless area < 5 cm, and score “c” for featherless area > 5 cm. An overall score was then determined based on the scores of the three individual body parts, with “0” for all parts receiving “a”, “1” for one or more parts receiving “b” but no “c”, and “2” for one or more parts receiving “c”.
(a) (b)
Figure 8. (a) Three body parts for visual scoring, (b) areas representing hen back for temperature analysis of feather condition.
The back temperatures of hens in each house were measured using the same IR thermography camera as described earlier (fig. 8b). Standard deviation (SD) of the back temperatures reflects the uniformity of the back feather coverage; and temperature differences between the environment and average back temperature of the hen reflects the feather insulation. In each house, 100 birds were randomly chosen throughout the house for visual scoring and 50 birds for IR imaging (fig. 6).
Hen’s reaction to moving human In our experiment hen’s behavioral reaction to a moving or approaching human, or RMH-test, was
performed to investigate human-hen interaction under the LED vs. FL lights. The test was done following Welfare Quality Assessment Protocol for Poultry (Welfare Quality, 2009) with adaption. According to the protocol, the assessor approaches a group of at least 3 birds in the litter area, squats down for 10 s and then counts the number of birds at arm’s length. In our experiment, no birds came within this range; hence it was changed to adapt to our experiment. The assessor walked along the colony row in the service aisle and chose one hen in a colony every time the hen stuck her head out. Then the person approached the selected hen from about 6 m distance at a speed of 1 step s-1 until the hen withdrew her head. The distance between the investigator and the position of the hen prior to head withdrawal was measured, rounded to the nearest 0.05 m, and referred to as the avoidance distance. Avoidance distances of seven birds from two colonies per service aisle were determined (a total of 21 hens per house) (fig. 5). All test hens were chosen form the same tier at waist height of the test person (about 1 m above the ground).
Statistical analysis All statistical analyses were performed using SAS 9.3 (SAS Institute, Inc., Cary, N.C.). The differences in thermal environment and light temperature in LED vs. CFL houses were analyzed using a t-test. Effects of light type on production performance and egg quality were tested using MIXED and GLIMMIX (if the dependent response varied within 0-1, i.e. yolk weight percentage and weekly mortality in this study) procedures. Feather coverage was tested using MIXED (for IR temperature data) and GENMOD (for visual scoring data) procedures. DAR and avoidance distance as affected by light type
℃
2014 ASABE – CSBE/SCGAB Annual International Meeting Paper (Long et al.) Page 8
were analyzed using MIXED procedure. In these models, the house is the random factor; hens’ age, light type, and house pair are fixed factors.
Results and Discussion Thermal environment
Daily mean temperature and RH of the four houses and outside air are shown in figure 9. Indoor temperatures and RH in houses of the same pair were quite similar. The daily mean temperatures in H1 and H2 (pair 1) was 1.1-1.5°C higher than those in H10 and H11 (pair 2). The reason was that the producer intended to stimulate the feed intake in the latter two houses (temperature set point of H1 and
H2 = 25.1℃; H10 and H11 = 24.4℃). Generally, the indoor temperature was well maintained above
20°C in wintertime, even on extremely cold days by providing supplemental heat; and the daily mean indoor RH was generally in the range of 50-80%, as summarized in Table 2.
(a)
(b)
Figure 9. (a) Daily mean indoor and ambient temperature and (b) relative humidity (RH) (Legend “H1-CCFL” stands for House 1 with cold cathode fluorescent light, etc.)
Table 2. Mean and range of daily mean temperature (°C) and relative humidity (RH) in four aviary houses (09/13/2014-03/22/2014).
[a] All data are mean ± SD, SD = standard deviation; sample size n = 191. [b] (A/B) A stands for maximum daily mean and B for minimum daily mean.
-30
-20
-10
0
10
20
30
09
/13
/13
09
/20
/13
09
/27
/13
10
/04
/13
10
/11
/13
10
/18
/13
10
/25
/13
11
/01
/13
11
/08
/13
11
/15
/13
11
/22
/13
11
/29
/13
12
/06
/13
12
/13
/13
12
/20
/13
12
/27
/13
01
/03
/14
01
/10
/14
01
/17
/14
01
/24
/14
01
/31
/14
02
/07
/14
02
/14
/14
02
/21
/14
02
/28
/14
03
/07
/14
03
/14
/14
03
/21
/14
Air
Tem
per
atu
re (
°C)
Date (mm/dd/yy)
H1-CCFLH2-LEDH10-LEDH11-CFL
30
40
50
60
70
80
90
100
09/
13/
13
09/
20/
13
09/
27/
13
10/
04/
13
10/
11/
13
10/
18/
13
10/
25/
13
11/
01/
13
11/
08/
13
11/
15/
13
11/
22/
13
11/
29/
13
12/
06/
13
12/
13/
13
12/
20/
13
12/
27/
13
01/
03/
14
01/
10/
14
01/
17/
14
01/
24/
14
01/
31/
14
02/
07/
14
02/
14/
14
02/
21/
14
02/
28/
14
03/
07/
14
03/
14/
14
03/
21/
14
RH
(%
)
Date (mm/dd/yy)
H1-CCFLH2-LEDH10-LEDH11-CFLAmbient
H1-FL H2-LED H10-LED H11-FL Ambient
Temperature, ℃ 22.2±1.4 [a]
(26.2/18.1) [b] 22.6±1.6
(25.6/19.0) 21.1±1.3
(25.8/16.9) 21.1±1.3
(25.3/14.8) -1.2±11.6
(23.8/-24.6)
RH, % 65±7
(83/44) 64±7
(81/43) 65±8
(80/42) 61±6
(81/42) 75±10 (98/48)
2014 ASABE – CSBE/SCGAB Annual International Meeting Paper (Long et al.) Page 9
Temperatures of light cover, bulb, neck and holder There are concerns that some (poor quality) LED lights produce so much heat that they may cause
fire. Some insurance companies even refuse to insure poultry houses with LED lights. Table 3 shows temperatures of light covers, bulbs, necks and holders of the FL and LED lights. The measured temperatures of the FL and LED lights were below 67°C, meaning overheat is unlikely to occur since the light base can tolerate up to 100°C (personal communication with the producer).
The hanging light covers had similar temperatures among the FL and LED lights. The temperatures of LED light bulbs with covers were lower than that of FL light bulbs with covers. The temperature of LED light bulbs without covers was the lowest among all light bulbs. The LED neck was the hottest part of the light. Neck temperatures of ceiling lights were lower than those of hanging lights. The holder temperatures of CFL were higher than those of CCFL and LED lights.
Table 3. Temperatures (°C) of light cover, bulb, neck and holder of LED and florescent lights.
Light – location (with or without cover)
Cover Bulb Neck Holder[a]
FL* [b] – Hanging (with cover) 32 ± 1.1A 62 ± 1.0A 61 ± 1.2A 36 ± 1.3B FL* [b] – Ceiling (with cover) 27 ± 1.2B 53 ± 0.9B 58 ± 0.7AB 40 ± 1.4B FL^ [b] – Hanging (with cover) 33 ± 0.2A 49 ± 2.6BC 66 ± 3.5A 48 ± 2.4A FL^ [b] – Ceiling (with cover) 33 ± 0.2A 63 ± 2.2A 57 ± 1.2AB 44 ± 0.8AB LED – Hanging (with cover) 31 ± 1.3A 43 ± 1.0C 59 ± 0.9A 41 ± 1.1AB LED – Ceiling (with cover) 25 ± 1.3B 35 ± 0.7D 56 ± 0.8B 38 ± 0.9B LED – Ceiling (without cover) - 33 ± 0.5D 46 ± 0.9C 37 ± 0.8B
[a] All data are mean ± SE, SE = standard error. In the same column, means with different uppercase letters are significantly different (P < 0.05).
[b] FL* means CCFL in house 1, FL^ means CFL in house 11.
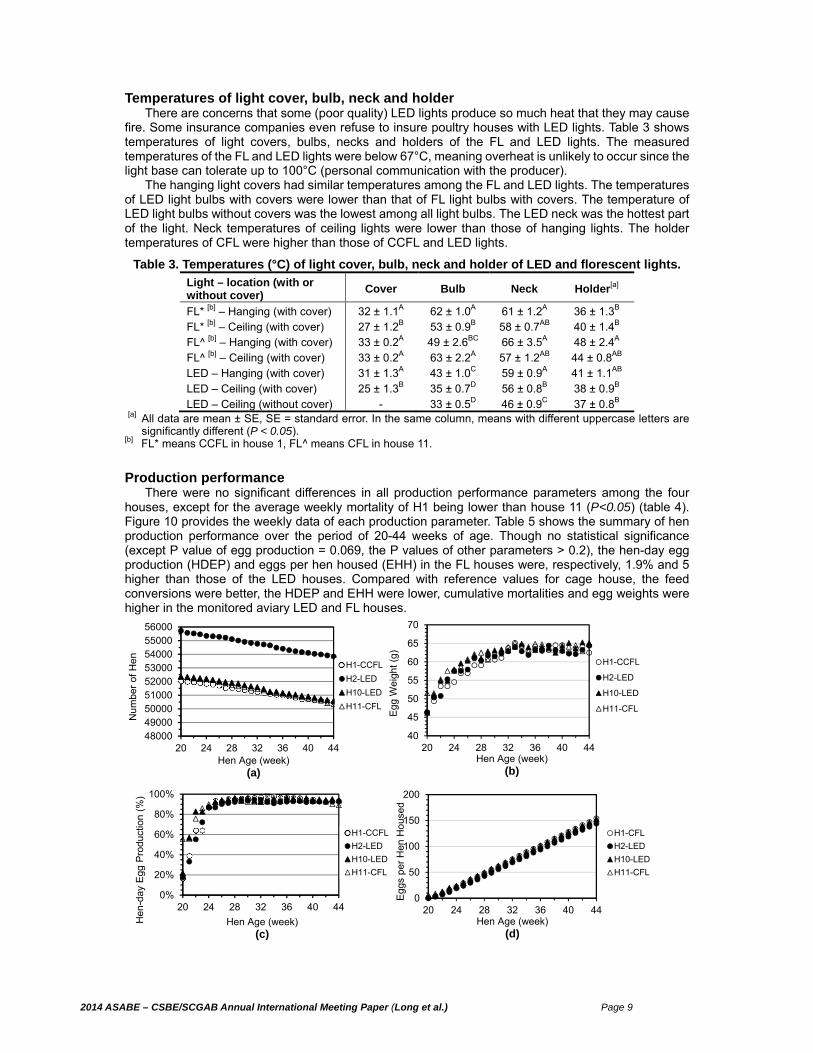
Production performance There were no significant differences in all production performance parameters among the four
houses, except for the average weekly mortality of H1 being lower than house 11 (P<0.05) (table 4). Figure 10 provides the weekly data of each production parameter. Table 5 shows the summary of hen production performance over the period of 20-44 weeks of age. Though no statistical significance (except P value of egg production = 0.069, the P values of other parameters ˃ 0.2), the hen-day egg production (HDEP) and eggs per hen housed (EHH) in the FL houses were, respectively, 1.9% and 5 higher than those of the LED houses. Compared with reference values for cage house, the feed conversions were better, the HDEP and EHH were lower, cumulative mortalities and egg weights were higher in the monitored aviary LED and FL houses.
480004900050000510005200053000540005500056000
20 24 28 32 36 40 44
Nu
mb
er
of H
en
Hen Age (week)(a)
H1-CCFL
H2-LED
H10-LED
H11-CFL
20 24 28 32 36 40 4440
45
50
55
60
65
70
Hen Age (week)(b)
Eg
g W
eig
ht
(g)
H1-CCFL
H2-LED
H10-LED
H11-CFL
0%
20%
40%
60%
80%
100%
20 24 28 32 36 40 44
Hen Age (week)(c)
H1-CCFL
H2-LED
H10-LED
H11-CFL
He
n-d
ayE
gg P
rodu
ctio
n (
%)
20 24 28 32 36 40 440
50
100
150
200
Hen Age (week)(d)
Eg
gs p
er H
en H
ous
ed
H1-CFL
H2-LED
H10-LED
H11-CFL
2014 ASABE – CSBE/SCGAB Annual International Meeting Paper (Long et al.) Page 10
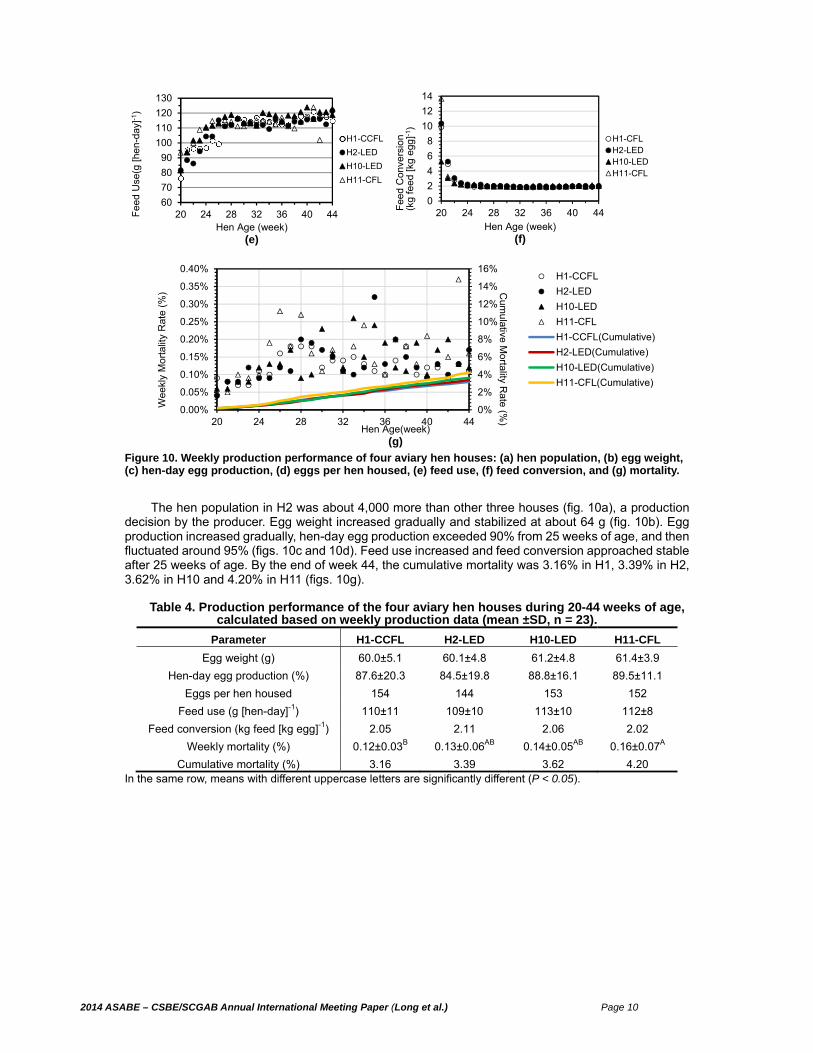
Figure 10. Weekly production performance of four aviary hen houses: (a) hen population, (b) egg weight, (c) hen-day egg production, (d) eggs per hen housed, (e) feed use, (f) feed conversion, and (g) mortality.
The hen population in H2 was about 4,000 more than other three houses (fig. 10a), a production
decision by the producer. Egg weight increased gradually and stabilized at about 64 g (fig. 10b). Egg production increased gradually, hen-day egg production exceeded 90% from 25 weeks of age, and then fluctuated around 95% (figs. 10c and 10d). Feed use increased and feed conversion approached stable after 25 weeks of age. By the end of week 44, the cumulative mortality was 3.16% in H1, 3.39% in H2, 3.62% in H10 and 4.20% in H11 (figs. 10g).
Table 4. Production performance of the four aviary hen houses during 20-44 weeks of age, calculated based on weekly production data (mean ±SD, n = 23).
Parameter H1-CCFL H2-LED H10-LED H11-CFL
Egg weight (g) 60.0±5.1 60.1±4.8 61.2±4.8 61.4±3.9
Hen-day egg production (%) 87.6±20.3 84.5±19.8 88.8±16.1 89.5±11.1
Eggs per hen housed 154 144 153 152
Feed use (g [hen-day]-1) 110±11 109±10 113±10 112±8
Feed conversion (kg feed [kg egg]-1) 2.05 2.11 2.06 2.02
Weekly mortality (%) 0.12±0.03B 0.13±0.06AB 0.14±0.05AB 0.16±0.07A
Cumulative mortality (%) 3.16 3.39 3.62 4.20 In the same row, means with different uppercase letters are significantly different (P < 0.05).
60
70
80
90
100
110
120
130
20 24 28 32 36 40 44Hen Age (week)
(e)
H1-CCFL
H2-LED
H10-LED
H11-CFL
Fe
ed
Use
(g [
hen
-day
]-1)
20 24 28 32 36 40 440
2
4
6
8
10
12
14
Hen Age (week)(f)
H1-CFLH2-LEDH10-LEDH11-CFL
Fee
d C
onve
rsio
n(k
g fe
ed
[kg
egg
]-1)
0%
2%
4%
6%
8%
10%
12%
14%
16%
0.00%
0.05%
0.10%
0.15%
0.20%
0.25%
0.30%
0.35%
0.40%
20 24 28 32 36 40 44
Cum
ulative Mortality R
ate (%)
Wee
kly
Mor
talit
y R
ate
(%)
Hen Age(week)(g)
H1-CCFL
H2-LED
H10-LED
H11-CFL
H1-CCFL(Cumulative)
H2-LED(Cumulative)
H10-LED(Cumulative)
H11-CFL(Cumulative)
2014 ASABE – CSBE/SCGAB Annual International Meeting Paper (Long et al.) Page 11
Table 5. Summary and comparison of hen production performance under LED or FL lights during 20-44 weeks of age. The values were based on weekly production data (mean ±SD, n = 23).
LED houses (H2, H10)
FL houses (H1, H11) Reference [a]
Egg weight (g) 60.7±4.8 60.7±4.6 58.4±5.6
Hen-day egg production (%) 86.7±18.0 88.6±16.2 90.0±11.6
Eggs per hen housed 148±6 153±1 156
Feed use (g [hen-day]-1) 111 ±10 111±9 108±6
Feed conversion (kg feed[kg egg]-1) 2.09±0.03 2.04±0.02 2.14
Weekly mortality (%) 0.14±0.05 0.14±0.06 −
Cumulative mortality (%) 3.51±0.16 3.68±0.74 2.10 [a] Reference data for Dekalb white hens in cage housing systems (Hendrix Genetics Company, Dec. 2011).
Egg quality Table 6-1 shows the age effect on egg quality in both lighting types. It can be seen that egg weight, yolk weight, and yolk percentage were significantly higher at 40 weeks than at 27 weeks (P<0.05?). This result was in line with observations by Butcher et al. (2003) and Nestor (1971) who reported older hens tended to lay heavier eggs and yolks, and that the yolk percentage generally increased as hen age increased. Yolk color primarily depends on the intake of plant pigment in the diet. Our results show that yolk color factor value increased in four houses as hen age increased, possibly due to the higher pigment contents in the diets at the 40 weeks of age. The shell strength decreased in both lighting types from 27 to 40 weeks of age. Studies have shown that egg shell strength decreases as hens get older (Butcher et al., 2003; Rodriguez-Navarro, 2002; Rajkumar et al., 2009). Some researchers explained that the increase in egg weight is not accompanied by a proportional increase in shell weight so that the ratio of shell weight to egg weight decreases; and this might be the reason that shell strength decreased with age (Butcher et al., 2003). The Haugh unite (HU) has been accepted as a measure of the quality of albumen and also of the whole egg (Eisen et al., 1962). According to the USDA standards (2000), egg quality is classified into three grades in terms of HU, namely, AA (HU≥72), A (72˃HU˃60) and B (HU≤60). In our experiment, the mean HU values of eggs in all the houses were 90 or higher, i.e., all AA grade eggs. Kato et al. (1970) reported that the HU value of fresh eggs decreased with increasing age of the hen. In our experiment, the mean HU values significantly decreased from 93.5±0.26 at 27 weeks to 91.6±0.35 (P < 0.05) at 40 weeks in LED houses; however, the HU values for the two laying periods were not significantly different in FL houses (P=0.38).
Table 6-1. Egg quality comparison at different ages (mean ± SE).
Parameter LED (H2, H10) FL (H1, H11)
27WK 40WK 27WK 40WK
Egg weight (g) 60.0±0.26B 62.6±0.28A 58.7±1.50b 63.5±0.28a
Albumen height (mm) 8.8±0.05A 8.5±0.06B 8.5±0.07 8.6±0.06
Yolk color factor 4.9±0.05B 5.6±0.05A 4.9±0.07b 5.6±0.04a
Haugh unit 93.5±0.26A 91.6±0.35B 92.2±0.26 91.8±0.30
Shell strength (N) 47.6±0.45A 45.4±0.46B 47.7±0.68a 44.0±0.46b
Shell thickness (mm) 0.37±0.00 0.37±0.00 0.37±0.00a 0.36±0.00b
Yolk weight (g) 13.5±0.1B 16.0±0.1A 13.1±0.1b 16.0±0.1a
Albumen weight (g) 36.5±0.2 36.3±0.2 35.5±0.2b 36.8±0.2a
Yolk percentage (%) 22.5±0.10B 25.6±0.11A 22.4±0.12b 25.2±0.12a For each lighting type, the values of each response at two ages followed by different uppercase or lowercase letters are significantly different (P < 0.05).
Table 6-2 shows the light effect on egg quality at 27 and 44 weeks of age. Some egg quality parameters were better in the LED houses than in the FL houses. At 27 weeks of age, egg weight, albumen height, HU, albumen weight and yolk weight for the LED houses were higher than those for the FL houses. At 40 weeks of age, only shell strength was found higher in the LED houses than in the FL houses.
2014 ASABE – CSBE/SCGAB Annual International Meeting Paper (Long et al.) Page 12
Table 6-2. Egg quality comparison with different lights (mean ± SE).
27WK 40WK
LED (H2, H10) FL (H1, H11) LED (H2, H10) FL (H1, H11)
Egg weight (g) 60.0±0.26A 58.7±1.50B 62.6±0.28 63.5±0.28
Albumen height (mm) 8.8±0.05A 8.5±0.07B 8.5±0.06 8.6±0.06
Yolk color factor 4.9±0.05 4.9±0.07 5.6±0.05 5.6±0.04
Haugh unit 93.5±0.26A 92.2±0.26B 91.6±0.35 91.8±0.30
Shell strength (N) 47.6±0.45 47.7±0.68 45.4±0.46 44.0±0.46
Shell thickness (mm) 0.37±0.00 0.37±0.00 0.37±0.00a 0.36±0.00b
Yolk weight (g) 13.5±0.1A 13.1±0.1B 16.0±0.1 16.0±0.1
Albumen weight (g) 36.5±0.2A 35.5±0.2B 36.3±0.2 36.8±0.2
Yolk percentage (%) 22.5±0.10 22.4±0.12 25.6±0.11 25.2±0.12 For each age period, the values of each response at two light types followed by different uppercase or lowercase letters are significantly different (P < 0.05).
Dust accumulation In the aviary house system, dust production was mainly affected by hen activities on the litter floor
(Nielsen et al., 2003, Cambra-López et al., 2010, Zhao et al., 2014). Light management can affect animal activity (Calvet et al., 2009). In this study, we used the settled dust as an indicator to the intensity of hen activities. Table 7 shows DAR of six consecutive days in November 2013 and January 2014. In the LED houses, DAR averaged 245 mg [hen-day]-1 or 3855 mg [m2-day]-1, and in the FL houses, DAR averaged 278 mg [hen-day]-1 or 4366 mg [m2-day]-1. There was no significant difference in DAR between different dates or light types. Therefore, it seems that the hen activities were not affected by the lighting type of LED vs. FL at the intensity used in the study.
Table 7. Dust accumulation rate (DAR) for different dates and lighting types (mean ± SD. n = 3).
Nov. 2013 Jan. 2014
LED (H2, H10) FL (H1, H11) LED (H2, H10) FL (H1, H11)
DAR (dry, mg [hen-day]-1) 232±43 284±66 259±43 272±43
DAR (dry, mg [m2-day]-1) 3661±668 4482±1020 4049±668 4249±668
Nov. 2013 Jan. 2014
DAR (dry, mg [hen-day]-1) 258±38 265±29
DAR (dry, mg [m2-day]-1) 4072±609 4149±471
LED houses (H2, H10) FL houses (H1, H11)
DAR (dry, mg [hen-day]-1) 245±29 278±38
DAR (dry, mg [m2-day]-1) 3855±473 4366±610
Feather condition Light may affect feather pecking (Klein, 2000), thus the feather condition (Bilcik et al., 1999). We
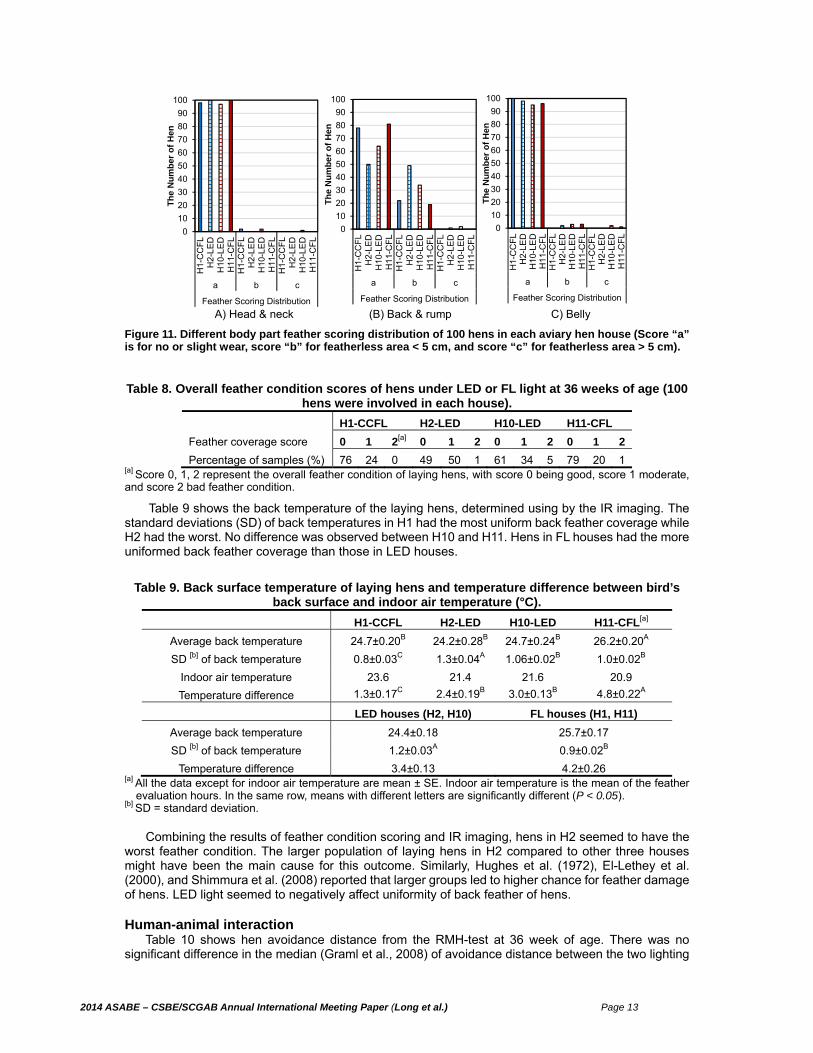
examined the feather conditions under LED and FL lights at 36 weeks of age. In general, back and rump feathers were more vulnerable to wear compared to feathers of other body parts (fig. 11), possibly because the back and rump received the most pecks (Bilcik et al., 1999). Based on the GENMOD procedure analysis, LED light resulted in worse feather condition in back and rump compared to FL (P<0.05). The feather conditions at head and neck, belly parts were not affected by light type. Table 8 shows the overall feather scores of the hens. The hens in LED houses had worse feather coverage than those in FL houses (P<0.05).
2014 ASABE – CSBE/SCGAB Annual International Meeting Paper (Long et al.) Page 13
A) Head & neck (B) Back & rump C) Belly
Figure 11. Different body part feather scoring distribution of 100 hens in each aviary hen house (Score “a” is for no or slight wear, score “b” for featherless area < 5 cm, and score “c” for featherless area > 5 cm).
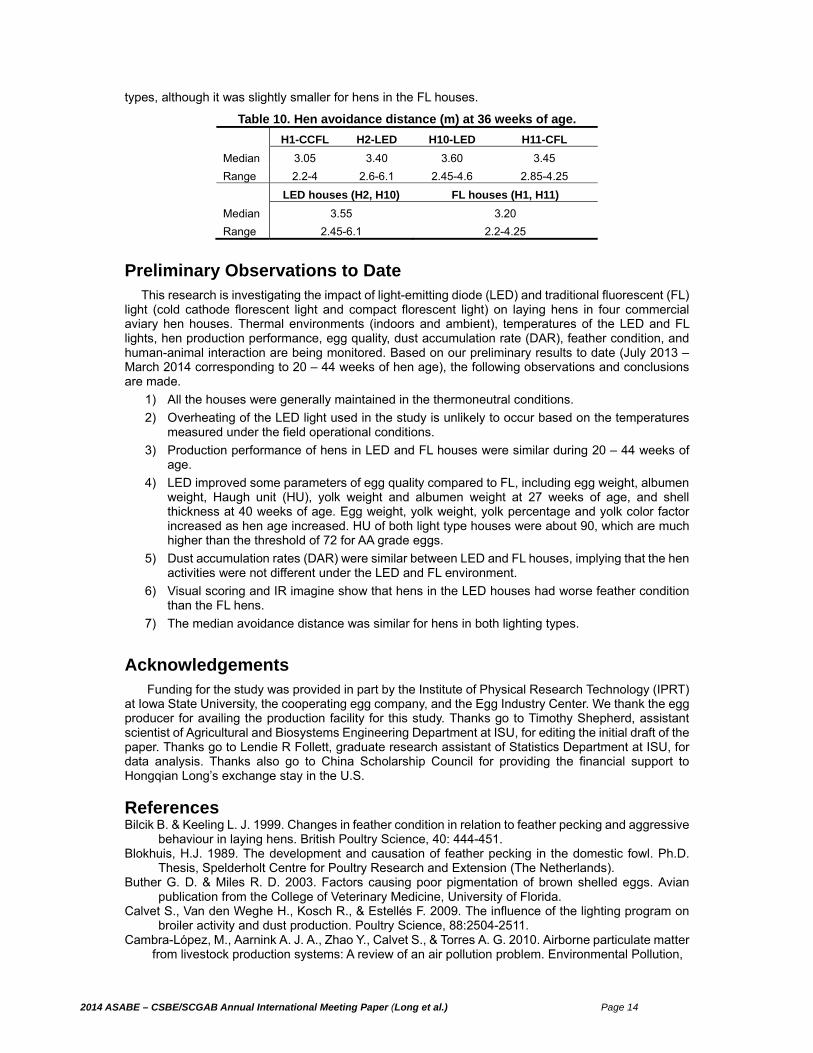
Table 8. Overall feather condition scores of hens under LED or FL light at 36 weeks of age (100 hens were involved in each house).
H1-CCFL H2-LED H10-LED H11-CFL
Feather coverage score 0 1 2[a] 0 1 2 0 1 2 0 1 2
Percentage of samples (%) 76 24 0 49 50 1 61 34 5 79 20 1 [a] Score 0, 1, 2 represent the overall feather condition of laying hens, with score 0 being good, score 1 moderate, and score 2 bad feather condition.
Table 9 shows the back temperature of the laying hens, determined using by the IR imaging. The standard deviations (SD) of back temperatures in H1 had the most uniform back feather coverage while H2 had the worst. No difference was observed between H10 and H11. Hens in FL houses had the more uniformed back feather coverage than those in LED houses.
Table 9. Back surface temperature of laying hens and temperature difference between bird’s back surface and indoor air temperature (°C).
H1-CCFL H2-LED H10-LED H11-CFL[a]
Average back temperature 24.7±0.20B 24.2±0.28B 24.7±0.24B 26.2±0.20A
SD [b] of back temperature 0.8±0.03C 1.3±0.04A 1.06±0.02B 1.0±0.02B
Indoor air temperature 23.6 21.4 21.6 20.9
Temperature difference 1.3±0.17C 2.4±0.19B 3.0±0.13B 4.8±0.22A
LED houses (H2, H10) FL houses (H1, H11)
Average back temperature 24.4±0.18 25.7±0.17
SD [b] of back temperature 1.2±0.03A 0.9±0.02B
Temperature difference 3.4±0.13 4.2±0.26 [a] All the data except for indoor air temperature are mean ± SE. Indoor air temperature is the mean of the feather
evaluation hours. In the same row, means with different letters are significantly different (P < 0.05). [b] SD = standard deviation.
Combining the results of feather condition scoring and IR imaging, hens in H2 seemed to have the worst feather condition. The larger population of laying hens in H2 compared to other three houses might have been the main cause for this outcome. Similarly, Hughes et al. (1972), El-Lethey et al. (2000), and Shimmura et al. (2008) reported that larger groups led to higher chance for feather damage of hens. LED light seemed to negatively affect uniformity of back feather of hens.
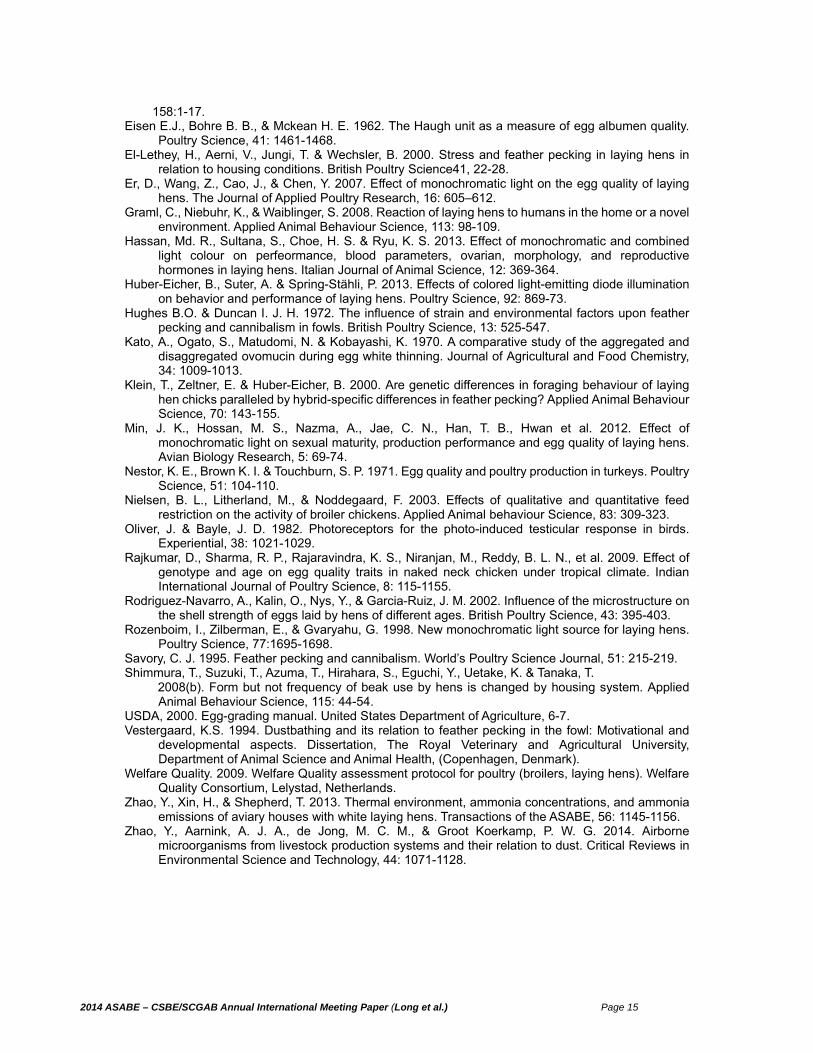
Human-animal interaction Table 10 shows hen avoidance distance from the RMH-test at 36 week of age. There was no
significant difference in the median (Graml et al., 2008) of avoidance distance between the two lighting
0
10
20
30
40
50
60
70
80
90
100
H1-
CC
FL
H2-
LED
H10
-LE
DH
11-C
FL
H1-
CC
FL
H2-
LED
H10
-LE
DH
11-C
FL
H1-
CC
FL
H2-
LED
H10
-LE
DH
11-C
FL
a b c
Feather Scoring Distribution
Th
e N
um
ber
of
Hen
0
10
20
30
40
50
60
70
80
90
100
H1-
CC
FL
H2-
LED
H10
-LE
DH
11-C
FL
H1-
CC
FL
H2-
LED
H10
-LE
DH
11-C
FL
H1-
CC
FL
H2-
LED
H10
-LE
DH
11-C
FL
a b c
Feather Scoring Distribution
Th
e N
um
be
r o
f H
en
0
10
20
30
40
50
60
70
80
90
100
H1-
CC
FL
H2-
LED
H10
-LE
DH
11-C
FL
H1-
CC
FL
H2-
LED
H10
-LE
DH
11-C
FL
H1-
CC
FL
H2-
LED
H10
-LE
DH
11-C
FL
a b c
Feather Scoring Distribution
Th
e N
um
ber
of
Hen
2014 ASABE – CSBE/SCGAB Annual International Meeting Paper (Long et al.) Page 14
types, although it was slightly smaller for hens in the FL houses.
Table 10. Hen avoidance distance (m) at 36 weeks of age.
H1-CCFL H2-LED H10-LED H11-CFL
Median 3.05 3.40 3.60 3.45
Range 2.2-4 2.6-6.1 2.45-4.6 2.85-4.25
LED houses (H2, H10) FL houses (H1, H11)
Median 3.55 3.20
Range 2.45-6.1 2.2-4.25
Preliminary Observations to Date This research is investigating the impact of light-emitting diode (LED) and traditional fluorescent (FL) light (cold cathode florescent light and compact florescent light) on laying hens in four commercial aviary hen houses. Thermal environments (indoors and ambient), temperatures of the LED and FL lights, hen production performance, egg quality, dust accumulation rate (DAR), feather condition, and human-animal interaction are being monitored. Based on our preliminary results to date (July 2013 – March 2014 corresponding to 20 – 44 weeks of hen age), the following observations and conclusions are made.
1) All the houses were generally maintained in the thermoneutral conditions.
2) Overheating of the LED light used in the study is unlikely to occur based on the temperatures measured under the field operational conditions.
3) Production performance of hens in LED and FL houses were similar during 20 – 44 weeks of age.
4) LED improved some parameters of egg quality compared to FL, including egg weight, albumen weight, Haugh unit (HU), yolk weight and albumen weight at 27 weeks of age, and shell thickness at 40 weeks of age. Egg weight, yolk weight, yolk percentage and yolk color factor increased as hen age increased. HU of both light type houses were about 90, which are much higher than the threshold of 72 for AA grade eggs.
5) Dust accumulation rates (DAR) were similar between LED and FL houses, implying that the hen activities were not different under the LED and FL environment.
6) Visual scoring and IR imagine show that hens in the LED houses had worse feather condition than the FL hens.
7) The median avoidance distance was similar for hens in both lighting types.
Acknowledgements
Funding for the study was provided in part by the Institute of Physical Research Technology (IPRT) at Iowa State University, the cooperating egg company, and the Egg Industry Center. We thank the egg producer for availing the production facility for this study. Thanks go to Timothy Shepherd, assistant scientist of Agricultural and Biosystems Engineering Department at ISU, for editing the initial draft of the paper. Thanks go to Lendie R Follett, graduate research assistant of Statistics Department at ISU, for data analysis. Thanks also go to China Scholarship Council for providing the financial support to Hongqian Long’s exchange stay in the U.S.
References Bilcik B. & Keeling L. J. 1999. Changes in feather condition in relation to feather pecking and aggressive
behaviour in laying hens. British Poultry Science, 40: 444-451. Blokhuis, H.J. 1989. The development and causation of feather pecking in the domestic fowl. Ph.D.
Thesis, Spelderholt Centre for Poultry Research and Extension (The Netherlands). Buther G. D. & Miles R. D. 2003. Factors causing poor pigmentation of brown shelled eggs. Avian
publication from the College of Veterinary Medicine, University of Florida. Calvet S., Van den Weghe H., Kosch R., & Estellés F. 2009. The influence of the lighting program on
broiler activity and dust production. Poultry Science, 88:2504-2511. Cambra-López, M., Aarnink A. J. A., Zhao Y., Calvet S., & Torres A. G. 2010. Airborne particulate matter from livestock production systems: A review of an air pollution problem. Environmental Pollution,
2014 ASABE – CSBE/SCGAB Annual International Meeting Paper (Long et al.) Page 15
158:1-17. Eisen E.J., Bohre B. B., & Mckean H. E. 1962. The Haugh unit as a measure of egg albumen quality.
Poultry Science, 41: 1461-1468. El-Lethey, H., Aerni, V., Jungi, T. & Wechsler, B. 2000. Stress and feather pecking in laying hens in
relation to housing conditions. British Poultry Science41, 22-28. Er, D., Wang, Z., Cao, J., & Chen, Y. 2007. Effect of monochromatic light on the egg quality of laying
hens. The Journal of Applied Poultry Research, 16: 605–612. Graml, C., Niebuhr, K., & Waiblinger, S. 2008. Reaction of laying hens to humans in the home or a novel
environment. Applied Animal Behaviour Science, 113: 98-109. Hassan, Md. R., Sultana, S., Choe, H. S. & Ryu, K. S. 2013. Effect of monochromatic and combined
light colour on perfeormance, blood parameters, ovarian, morphology, and reproductive hormones in laying hens. Italian Journal of Animal Science, 12: 369-364.
Huber-Eicher, B., Suter, A. & Spring-Stähli, P. 2013. Effects of colored light-emitting diode illumination on behavior and performance of laying hens. Poultry Science, 92: 869-73.
Hughes B.O. & Duncan I. J. H. 1972. The influence of strain and environmental factors upon feather pecking and cannibalism in fowls. British Poultry Science, 13: 525-547.
Kato, A., Ogato, S., Matudomi, N. & Kobayashi, K. 1970. A comparative study of the aggregated and disaggregated ovomucin during egg white thinning. Journal of Agricultural and Food Chemistry, 34: 1009-1013.
Klein, T., Zeltner, E. & Huber-Eicher, B. 2000. Are genetic differences in foraging behaviour of laying hen chicks paralleled by hybrid-specific differences in feather pecking? Applied Animal Behaviour Science, 70: 143-155.
Min, J. K., Hossan, M. S., Nazma, A., Jae, C. N., Han, T. B., Hwan et al. 2012. Effect of monochromatic light on sexual maturity, production performance and egg quality of laying hens. Avian Biology Research, 5: 69-74.
Nestor, K. E., Brown K. I. & Touchburn, S. P. 1971. Egg quality and poultry production in turkeys. Poultry Science, 51: 104-110.
Nielsen, B. L., Litherland, M., & Noddegaard, F. 2003. Effects of qualitative and quantitative feed restriction on the activity of broiler chickens. Applied Animal behaviour Science, 83: 309-323.
Oliver, J. & Bayle, J. D. 1982. Photoreceptors for the photo-induced testicular response in birds. Experiential, 38: 1021-1029.
Rajkumar, D., Sharma, R. P., Rajaravindra, K. S., Niranjan, M., Reddy, B. L. N., et al. 2009. Effect of genotype and age on egg quality traits in naked neck chicken under tropical climate. Indian International Journal of Poultry Science, 8: 115-1155.
Rodriguez-Navarro, A., Kalin, O., Nys, Y., & Garcia-Ruiz, J. M. 2002. Influence of the microstructure on the shell strength of eggs laid by hens of different ages. British Poultry Science, 43: 395-403.
Rozenboim, I., Zilberman, E., & Gvaryahu, G. 1998. New monochromatic light source for laying hens. Poultry Science, 77:1695-1698.
Savory, C. J. 1995. Feather pecking and cannibalism. World’s Poultry Science Journal, 51: 215-219. Shimmura, T., Suzuki, T., Azuma, T., Hirahara, S., Eguchi, Y., Uetake, K. & Tanaka, T. 2008(b). Form but not frequency of beak use by hens is changed by housing system. Applied
Animal Behaviour Science, 115: 44-54. USDA, 2000. Egg-grading manual. United States Department of Agriculture, 6-7. Vestergaard, K.S. 1994. Dustbathing and its relation to feather pecking in the fowl: Motivational and
developmental aspects. Dissertation, The Royal Veterinary and Agricultural University, Department of Animal Science and Animal Health, (Copenhagen, Denmark).
Welfare Quality. 2009. Welfare Quality assessment protocol for poultry (broilers, laying hens). Welfare Quality Consortium, Lelystad, Netherlands.
Zhao, Y., Xin, H., & Shepherd, T. 2013. Thermal environment, ammonia concentrations, and ammonia emissions of aviary houses with white laying hens. Transactions of the ASABE, 56: 1145-1156.
Zhao, Y., Aarnink, A. J. A., de Jong, M. C. M., & Groot Koerkamp, P. W. G. 2014. Airborne microorganisms from livestock production systems and their relation to dust. Critical Reviews in Environmental Science and Technology, 44: 1071-1128.
Related Documents