Comparative Ecology of Juvenile Striped Bass and Juvenile Hybrid Striped Bass in Claytor Lake, Virginia by Jacob M. Rash Thesis submitted to the Faculty of the Virginia Polytechnic Institute and State University in partial fulfillment of the requirements for the degree of Master of Science in Fisheries and Wildlife Sciences APPROVED: J. J. Ney, Chair E. M. Hallerman B. R. Murphy J. R. Copeland December 2003 Blacksburg, VA Keywords: Striped bass, Hybrid striped bass, Recruitment, Growth, Survival

Welcome message from author
This document is posted to help you gain knowledge. Please leave a comment to let me know what you think about it! Share it to your friends and learn new things together.
Transcript
Comparative Ecology of
Juvenile Striped Bass and Juvenile Hybrid Striped Bass
in Claytor Lake, Virginia
by
Jacob M. Rash
Thesis submitted to the Faculty of the
Virginia Polytechnic Institute and State University
in partial fulfillment of the requirements for the degree of
Master of Science
in
Fisheries and Wildlife Sciences
APPROVED:
J. J. Ney, Chair
E. M. Hallerman B. R. Murphy
J. R. Copeland
December 2003
Blacksburg, VA
Keywords: Striped bass, Hybrid striped bass, Recruitment, Growth, Survival

Comparative Ecology of Juvenile Striped Bass and
Juvenile Hybrid Striped Bass in Claytor Lake, Virginia
By
Jacob Michael Rash
ABSTRACT
Since the introduction of hybrid striped bass M. chrysops x M. saxatilis to Claytor
Lake, Virginia in 1993, relative abundance of striped bass Morone saxatilis has dropped
disproportionately to stocking density. Potentially deleterious interactions between the
two fishes that may limit recruitment to age 1 were considered in terms of trophic
relationships, physiological indices of health, overwinter survival, and post-stocking
predation.
Both fishes preferred habitat types characterized by structure-free sand or gravel
substrates, but striped bass and hybrid striped bass did not exhibit significant diet overlap
during the growing season. At a total length of approximately 120 mm, the juvenile
moronids shifted from a mixed diet of zooplankton and invertebrates to a diet comprised
primarily of age-0 fishes. However, after becoming piscivorous striped bass preyed
primarily upon age-0 alewife Alosa pseudoharengus, while hybrid striped bass consumed
age-0 sunfishes.
Striped bass achieved mean total lengths of 229 and 173 mm by the end of the
growing season in 2001 and 2002, respectively. Stocked into the reservoir three months
later than striped bass, mean hybrid striped bass total lengths reached 133 mm at the end
of the 2002 growing season. Condition factor, relative weight, and lipid index values
were low, but nearly equivalent for both striped bass and hybrid striped bass throughout
this study. Overwinter starvation of smaller (< 150 mm total length) striped bass was
observed for the 2001-2002 sampling season. Predation upon stocked fingerlings was not
considered significant in limiting juvenile survival; only three fingerling moronids were
found in the examination of stomach contents of 200 potential predators captured near
stocking sites.
It does not appear that resource competition with hybrid striped bass during the
growing season resulted in increased overwinter mortality of juvenile striped bass.
Delayed stocking of hybrid striped bass lessens the potential for trophic competition
between striped bass and hybrid striped bass at this early life-stage.
iii

ACKNOWLEDGEMENTS
I thank Dr. John J. Ney for giving me the opportunity to become one of his
students. His guidance, along with that of those who have served as graduate committee
members (Dr. C. Andrew Dolloff, Dr. Eric R. Hallerman, Dr. Brian R. Murphy, and Mr.
John R. Copeland), has piloted this study. During the experience there have been several
memorable moments, and all of which are distinguished by the unique charms of Dr.
Ney.
The long and odd hours of this study ensnared the help of many people. To those
who helped along the way, Forest Allen, Marcy Anderson, Travis Brenden, Dennis
Brown, Mike Clark, Tim Copeland, Jason Corrao, Josh Duty, Joe Grist, Whitney Grogan,
John Harris, Justin Homan, Aaron Liberty, Todd Lenger, Jay McGhee, Josh Milam, Greg
Murphy, Jason Persinger, Jamie Roberts, Larry Scarborough, Andy Strickland, Chris
Williams, and Lora Zimmerman, I thank you. Also, I express gratitude to Kathy Finne
and Dr. Eric Hallerman for their unselfishness in guiding me through the world of
genetics. Last, but certainly not least, I thank John Kilpatrick. Going above and beyond
the duties of a mentor and friend, John ensured that I completed whatever task was at
hand.
I thank American Electric Power, the Virginia Department of Game and Inland
Fisheries, and the Department of Fisheries and Wildlife Sciences at the Virginia
Polytechnic Institute and State University for their financial support.
I am forever grateful to my family and my wife, Lauren, for their undying belief
in me. Without their love and encouragement, this journey would not have been possible,
much less, completed. Lauren, thank you for understanding.
iv

TABLE OF CONTENTS INTRODUCTION.. ...................................................................................... 1
Justification..................................................................................................................... 6
Objectives ....................................................................................................................... 9 STUDY AREA............................................................................................. 10 METHODS. ................................................................................................. 15
Field Collections ........................................................................................................... 15
Stock Identification....................................................................................................... 16
First-Year Growth......................................................................................................... 18
Post-Winter Survival..................................................................................................... 19
Food Habits................................................................................................................... 19
Diet Overlap.................................................................................................................. 20
Indices of Health ........................................................................................................... 21
Condition Factor(K). ................................................................................................ 21
Relative Weight ......................................................................................................... 21
Lipid Index ................................................................................................................ 22
Habitat Usage................................................................................................................ 23
Predation ....................................................................................................................... 25
Statistical Analysis........................................................................................................ 25 RESULTS. ................................................................................................... 28
Field Collections ........................................................................................................... 28
Stock Identification....................................................................................................... 28
First-Year Growth......................................................................................................... 35
v

2001........................................................................................................................... 35
2002........................................................................................................................... 38
Post-Winter Survival..................................................................................................... 45
2001-2002. ................................................................................................................ 45
2002-2003. ................................................................................................................ 47
Food Habits................................................................................................................... 50
2001-2002. ................................................................................................................ 50
2002-2003. ................................................................................................................ 52
Diet Overlap.................................................................................................................. 60
Indices of Health ........................................................................................................... 63
2001-2002. ................................................................................................................ 63
2002-2003. ................................................................................................................ 66
Habitat Usage................................................................................................................ 76
Predation ....................................................................................................................... 78 DISCUSSION.............................................................................................. 82
Stock Identification....................................................................................................... 82
First-Year Growth......................................................................................................... 83
Post-Winter Survival..................................................................................................... 86
Food Habits................................................................................................................... 90
Indices of Health ........................................................................................................... 93
Condition Factor(K) ................................................................................................. 93
Relative Weight. ........................................................................................................ 94
Lipid Index ................................................................................................................ 96
vi

Habitat Usage................................................................................................................ 98
Predation ..................................................................................................................... 100 SUMMARY AND CONCLUSIONS....................................................... 103 MANAGEMENT RECOMMENDATIONS…………………………...108 LITERATURE CITED.. .......................................................................... 110 VITA........................................................................................................... 118
vii

LIST OF FIGURES Figure 1. Catch-per-unit-effort of adult Morone in Claytor Lake……………………..7 (1998-2002) Figure 2. Map of Claytor Lake, Virginia..................................................................... 11 Figure 3. Most effective sampling sites for juvenile striped bass and ........................ 30 juvenile hybrid striped bass in Claytor Lake (2001-2003) Figure 4. Temporal patterns of first-year increase in total length and wet ................. 36 weight for juvenile striped bass over the 2001 growing season Figure 5. Monthly length-frequency distributions of juvenile striped bass ................ 39 in Claytor Lake over the 2001 growing season Figure 6. Temporal patterns of first-year increase in total length and wet ................. 40 weight for juvenile striped bass and juvenile hybrid striped bass over the 2002 growing season Figure 7. Monthly length-frequency distributions of juvenile striped bass ................ 43 in Claytor Lake over the 2002 growing season Figure 8. Monthly length-frequency distributions of juvenile hybrid striped............. 44 bass in Claytor Lake over the 2002 growing season Figure 9. Length-frequency distributions of juvenile striped bass before................... 46 and after overwintering in Claytor Lake during the 2001-2002 sampling season Figure 10. Length-frequency distributions of juvenile striped bass before................... 48 and after overwintering in Claytor Lake during the 2002-2003 sampling season Figure 11. Length-frequency distributions of juvenile hybrid striped bass .................. 49
before and after overwintering in Claytor Lake during the 2002- 2003 sampling season
Figure 12. Temporal patterns in juvenile striped bass diet composition....................... 51 over the 2001 growing season Figure 13. Size-dependent patterns in juvenile striped bass diet composition.............. 54 over the 2001 growing season Figure 14. Size-dependent patterns in juvenile striped bass diet composition.............. 55 during the 2002 post-winter period
viii
Figure 15. Temporal patterns in juvenile striped bass and juvenile hybrid .................. 56 striped bass diet composition over the 2002 growing season Figure 16. Size-dependent patterns in juvenile striped bass and juvenile..................... 58 hybrid striped bass diet composition over the 2002 growing season Figure 17. Size-dependent patterns in juvenile striped bass and juvenile..................... 59 hybrid striped bass diet composition during the 2003 post- winter period Figure 18. Temporal patterns in condition factor for juvenile striped bass .................. 64 over the 2001 growing season Figure 19. Temporal patterns in relative weight for juvenile striped bass .................... 65 over the 2001growing season Figure 20. Size-dependent patterns in juvenile striped bass lipid index values ............ 67 before and after wintering in Claytor Lake during the 2001-2002 sampling season Figure 21. Temporal patterns in condition factor for juvenile striped bass .................. 69 and juvenile hybrid striped bass over the 2002 growing season Figure 22. Temporal patterns in relative weight for juvenile striped bass .................... 71 and juvenile hybrid striped bass over the 2002 growing season Figure 23. Temporal patterns in lipid index for juvenile striped bass and.................... 73 juvenile hybrid striped bass over the 2002 growing season Figure 24. Size-dependent patterns in juvenile striped bass and juvenile..................... 74 hybrid striped bass lipid index values over the 2002 growing season Figure 25. Size-dependent patterns in juvenile striped bass and juvenile..................... 75 hybrid striped bass lipid index values before and after wintering in Claytor Lake during the 2002-2003 sampling season
Figure 26. Catch-per-unit-effort of age 1 Morone in Claytor Lake…………………...99 (1996-2003)
ix

LIST OF TABLES
Table 1. Summary of juvenile striped bass and juvenile hybrid striped……......…...14 bass stocked at Claytor Lake in 2001 and 2002 Table 2. Statistical procedures used to analyze Claytor Lake data sets. .................... 27 2001-2003 Table 3. Total number of juvenile striped bass and juvenile hybrid striped.............. 29 bass collected by sampling season, sampling period, and collection method from Claytor Lake Table 4. Allele frequency of Morone......................................................................... 31 Table 5. Descriptive statistics for juvenile striped bass length and weight ............... 37 distributions over the 2001 growing season and 2002 post-winter period Table 6. Descriptive statistics for juvenile striped bass and juvenile hybrid............. 41 striped bass length and weight distributions over the 2002 growing season and 2003 post-winter period Table 7. Frequency of occurrence of food items in the diets of juvenile................... 53 striped bass and juvenile hybrid striped bass in all 2001-2002 and 2002-2003 season samples Table 8. Temporal patterns in diet overlap values for juvenile striped bass.............. 61 and juvenile hybrid striped bass over the 2002 growing season and 2003 post -winter period Table 9. Temporal patterns in diet overlap values for 10-mm total length................ 62 size classes of juvenile striped bass and juvenile hybrid striped bass over the 2002 growing season and 2003 post-winter period Table 10. Temporal patterns in habitat electivity values for juvenile striped.............. 77 bass and juvenile hybrid striped bass during the 2002 growing season Table 11. Temporal patterns in habitat overlap values for juvenile striped................. 79 bass and juvenile hybrid striped bass over the 2002 growing season Table 12. Frequency of occurrence of striped bass and hybrid striped bass................ 80 fingerlings in the diets of potential predators, following the stocking of striped bass and hybrid striped bass in 2002 Table 13. Total lengths attained by juvenile striped bass and juvenile hybrid ............ 84 striped bass for the first-year of growth reported in the literature
x

INTRODUCTION
The striped bass Morone saxatilis is a large, anadromous piscivore native to the
Atlantic and Gulf coasts of North America (Matthews et al. 1988). Several inland states
developed an intense interest in this fish after it became apparent that the species could
complete its life cycle in freshwater, as first noted in the Santee-Cooper, South Carolina
Reservoir system (Bailey 1975). The potential of striped bass to provide a trophy pelagic
fishery and its ability to control prolific gizzard shad Dorosoma cepedianum populations
(Harper and Jarman 1971), while not competing directly with native predators, such as
largemouth bass Micropterus salmoides, is attractive to both anglers and biologists (Moss
and Lawson 1982). Striped bass populations are generally maintained via annual
stocking of fingerlings, or more rarely, by natural reproduction (Cheek et al. 1985).
Interest also has developed in hybrid striped bass M. chrysops x M. saxatilis. Due
to their perceived advantages versus striped bass (higher temperature tolerance,
supposedly sedentary nature, and high catchability), hybrid striped bass often are stocked
as a substitute or, less frequently, as a supplement to striped bass in southeastern
reservoirs to diversify fisheries for large open-water game fish and to exert additional
predatory pressure on gizzard shad populations (Ott and Malvestuto 1981; Saul and
Wilson 1981; Woiwode and Adelman 1991; Zhang et al. 1994; Rudacille and Kohler
2000). Axon and Whitehurst (1985) noted the increase in popularity of both striped bass
and hybrid striped bass, reporting that 34 states have established fisheries for striped bass,
hybrid striped bass, or a combination of both.
Sympatric stockings of striped bass and hybrid striped bass have led to concerns
regarding the compatibility of the two fishes. Among Virginia systems, only Claytor
1

Lake supports a simultaneous fishery for both striped bass and hybrid striped bass.
However, since the introduction of hybrid striped bass to Claytor Lake in 1993, catch-
per-unit-effort for striped bass in Virginia Department of Game and Inland Fisheries
(VDGIF) annual fall gillnet surveys has dropped precipitously, possibly due to
competition with hybrid striped bass. Knowledge concerning the ecology of juvenile
striped bass and juvenile hybrid striped bass following stocking is sparse. Investigation
into the early-life histories of these two species in Claytor Lake may provide information
about the apparent decline in striped bass numbers since the introduction of hybrid
striped bass.
Bonds (2000) found that the diets of adult striped bass and hybrid striped bass in
Claytor Lake overlapped significantly, with each being heavily dependent on the clupeid
forage base. Juvenile Morone in other systems have been observed to shift food habits
from zooplankton and aquatic insects to larval and juvenile fishes at approximately 100
mm total length (TL) (Stevens 1958; Markle and Grant 1970; Ware 1970; Axon 1979;
Otto and Malvestuto 1981; Van Den Avyle et al. 1983; Saul and Wilson 1981; Kinman
1987; Matthews et al. 1992; Sutton 1997). Sutton and Ney (2001) reported that in Smith
Mountain Lake, Virginia, smaller striped bass juveniles (<120 mm TL) maintained a
mixed diet of invertebrates and age-0 cyprinids, while larger juveniles (>150 mm TL)
were strictly piscivorous. Saul and Wilson (1981) reported similar results for juvenile
hybrid striped bass in Cherokee Reservoir, Tennessee, with individuals less than 120 mm
TL feeding primarily on invertebrates, while individuals greater than 120 mm TL were
largely piscivorous.
2
For piscivorous fishes in temperate climates, rapid growth during the first months
of life can be critical for overwinter survival (Chevalier 1973; Forney 1976; Nielsen
1980; Craig 1982; Minton and McLean 1982; Sutton 1997; Sutton and Ney 2001). Both
striped bass and hybrid striped bass are characterized by rapid first-year growth. The
hybrid striped bass does not reach the same ultimate size as the striped bass, but does
grow more rapidly during the first two years of life than either white bass Morone
chrysops or striped bass parent (Tuncer et al. 1990; Jenkins and Burkhead 1993). In
controlled environments, hybrid striped bass fry can exhibit first-year growth rates of up
to 1.8 g/day (Zhang et al. 1994), ultimately becoming 23.0% longer than striped bass fry
over a 71-day period (Logan 1967). In natural systems, hybrid striped bass can achieve
lengths greater than 200 mm TL during the first year of growth (Crandall 1978; Gilliland
and Clady 1981; Layzer and Clady 1981; Saul and Wilson 1981; Austin and Hurley
1987).
Sutton and Ney (2001) described progressive increases in total length from time-
of-stocking through the end of the growing season for age-0 striped bass in Smith
Mountain Lake, Virginia. They reported that by December, the first-year total length of
Smith Mountain Lake striped bass ranged from 97 to 268 mm in 1994 and 128 to 262
mm in 1995. Growth rates observed by Sutton and Ney (2001) are consistent with those
observed in other inland waters, where first-year growth to sizes greater than 200 mm TL
for striped bass is common (Stevens 1958; Mensinger 1970; Ware 1970; Erickson et al.
1971; Axon 1979; Van Den Avyle and Higginbotham 1979; Moss and Lawson 1982;
Sutton 1997).
3

During the growing season, age-0 striped bass tend to frequent shallow, structure-
free littoral areas over sand or gravel substrate (Mensinger 1970; Van Den Avyle and
Higginbotham 1979; Van Den Avyle et al. 1983; Matthews et al. 1992; Sutton 1997), and
in East Fork Lake, Ohio, Austin and Hurley (1987) found juvenile hybrid striped bass
exhibiting preferences for these habitats types as well. Matthews et al. (1992) found a
significant overlap in habitat use by juvenile white bass and juvenile striped bass in Lake
Texoma, Oklahoma-Texas, but little information is available concerning the spatial
distribution of sympatric juvenile striped bass and juvenile hybrid striped bass. From a
thermal standpoint, age-0 hybrid striped bass exhibit optimal growth and peak conversion
efficiency at 26.8ºC, while juvenile striped bass have a preferred thermal niche of 24-
26°C (Coutant 1985; Woiwode and Adelman 1991). Thus, during the growing season,
juvenile hybrid striped bass and juvenile striped bass would be expected to occupy
similar thermal habitats within Claytor Lake. The cooler temperatures of late fall and
early winter result in a loss of preferred water temperatures for these moronids within the
littoral zone of the reservoir. The reduction in temperature may force juveniles of both
species to move to deeper pelagic regions in search of suitable food sources and higher
water temperatures.
The gradual movement of juvenile Morone from littoral habitats to pelagic
regions of a system may coincide with the arrival of cooler temperatures, but the initial
dispersal rates of Morone fingerlings from stocking sites can be rapid (Van Den Avyle
and Higginbotham 1979; Sutton 1997). Sutton (1997) reported both rapid and gradual
patterns of dispersal for juvenile striped bass in Smith Mountain Lake, Virginia. The
rapid dispersal of age-0 individuals from stocking sites could make the identification of
4

the mechanisms restricting juvenile survival difficult to determine because the monitoring
of individuals is not immediate, but rather delayed until dispersed individuals return to
littoral habitats where they can be monitored.
First-year survival of stocked striped bass fingerlings in inland water bodies is
often less than 20% (Bailey 1975; Moore et al. 1991; Michaelson et al. 2001), but causes
of this early mortality have received little attention until recently. Michaelson et al.
(2001) quantified losses of stocked striped bass by predation to largemouth bass (the
primary littoral piscivore) in Smith Mountain Lake, Virginia. Only 14 striped bass were
recovered in 1,147 largemouth bass stomachs over the two-year study period, resulting in
a 0.1-3.0% estimated loss of fingerlings to predation. McGovern and Olney (1988) noted
similar results when the examination of 235 stomachs of 14 species of fishes collected in
the Pamunkey River, Virginia provided no evidence of predation on striped bass eggs or
larvae. Austin and Hurley (1987) reported predation by black basses and yearling striped
bass on hybrid striped bass fingerlings in East Fork Lake, Ohio to be minimal. Thus,
mortality of Morone fingerlings due to predation may also be insignificant in the
regulation of first-year survival of juveniles within Claytor Lake, where the principal
littoral piscivores are Micropterus spp.
Kilpatrick (2003) failed to document the presence of any juvenile moronids below
Claytor Dam. Although emigration of Morone fingerlings from a reservoir has been
reported (Austin and Hurley 1987), the overall contribution of emigration to the loss of
individuals from a population should be minimal, given the small percentage of
individuals that leave the reservoir. Low survival of juvenile Morone is perhaps more
likely the result of size-dependent starvation (Austin and Hurley 1987; Sutton 1997).
5

Likelihood of overwinter survival for juvenile Morone is a function of the size of
individual at the end of the growing season (Hurst and Conover 1998; Sutton and Ney
2001) and is not species-specific (Harrell et al. 1988). Larger individuals are able to
accumulate greater lipid reserves than smaller individuals, and smaller individuals are
more vulnerable to overwinter mortality (Post and Evans 1989; Johnson and Evans 1990;
Hurst and Conover 1998; Sutton and Ney 2001).
The ability of an individual to obtain adequate energy reserves is critical for its
survival. If both juvenile striped bass and juvenile hybrid striped bass eat similar food
items and occupy the same habitat types, competition between the species could be
limiting growth and ultimately, survival. The factors regulating first-year growth,
survival, and recruitment to age 1 for stocked Morone fingerlings must be considered
when establishing reservoir fishery management strategies (Sutton 1997). If results of
this study indicate the presence of significant niche overlap between both fishes and the
occurrence of overwinter starvation in striped bass, the compatibility of the Morone
stocks within Claytor Lake should be questioned.
Justification This study describes and compares the ecology of age-0 striped bass and age-0
hybrid striped bass in Claytor Lake, Virginia, to determine if age-0 striped bass and age-0
hybrid striped bass are compatible in the reservoir. Both striped bass and hybrid striped
bass are prized gamefish, but their compatibility has received modest evaluation. Due to
the decline in the catch-per-unit-effort of striped bass since the introduction of hybrid
striped bass into the reservoir (Figure 1), an investigation into the early-life history
characteristics of these fishes is warranted in Claytor Lake. There is a need to determine
6

Figure 1. Catch-per-unit-effort for adult striped bass (solid line) and adult hybrid striped bass (dotted line) via Virginia Department of Game and Inland Fisheries annual gillnet sampling in Claytor Lake. Catch-per-unit-effort (CPUE) = number of fish caught per 9.29 m2 of gillnet.
0
0.2
0.4
0.6
0.8
1
1.2
1988 1990 1992 1994 1996 1998 2000 2002
Year
CPU
E
7

if the interactions of striped bass and hybrid striped bass at the juvenile life-stage are
potentially resulting in competition and eventual mortality.
A great majority of stocked Morone mortality occurs within the first year of life,
with survival often being less than 20% (Bailey 1975; Moore et al. 1991; Michaelson et
al. 2001). The causes of this high early mortality have garnered little investigation.
Predation does not appear to provide a substantial contribution to early mortality rates of
stocked striped bass (Michaelson et al. 2001), but overwinter starvation of striped bass
has been identified as a significant source of juvenile mortality (Hurst and Conover 1998;
Sutton and Ney 2001). Starvation occurs in smaller individuals that are unable to
accumulate sufficient energy reserves to survive the overwinter period. The appearance
of a bimodal size distribution before the overwinter period would indicate that the growth
of certain individuals is being limited. A potential source of this limitation could be
trophic competition between striped bass and hybrid striped bass. If individuals are out-
competed for available food sources during the growing season, then they may be unable
to amass the energy reserves required to survive the overwinter period. Thus, if the
potential for interspecific competition between juvenile striped bass and juvenile hybrid
striped bass is found in this study, consideration should be given to alternate management
strategies for the reservoir. By helping to identify possible limiting factors for Morone
survival, this study will provide information to enable managers to design and implement
stocking programs to enhance the recruitment of juvenile Morone into their fisheries.
8

Objectives The goal of this research is to describe and compare the ecology of juvenile
striped bass and juvenile hybrid striped bass in Claytor Lake, Virginia. Specific
objectives are to:
1. Quantify and compare first-year growth of juvenile striped bass and juvenile
hybrid striped bass;
2. Determine diet overlap of age-0 striped bass and age-0 hybrid striped bass;
3. Compare habitat associations of juvenile striped bass and juvenile hybrid
striped bass; and
4. Assess the impacts of predation and starvation upon survival of stocked
fingerlings of striped bass and hybrid striped bass.
9
STUDY AREA
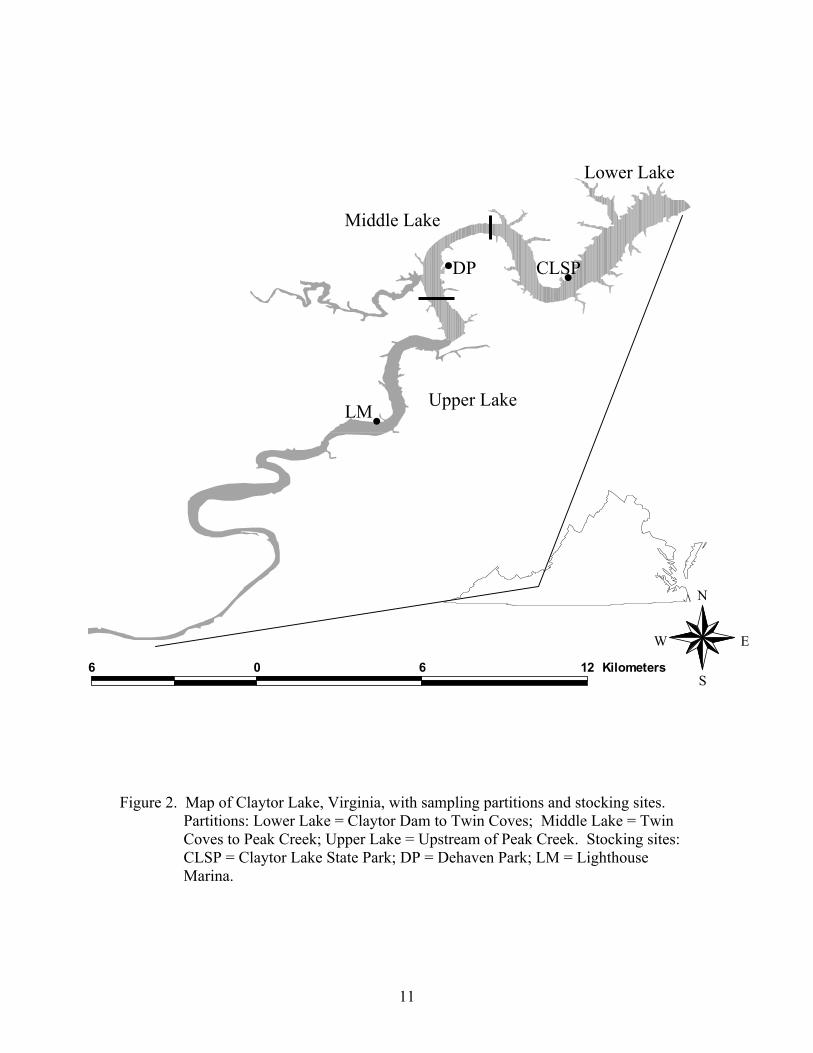
Claytor Lake was created in 1939 by closure of a dam on the New River in
Pulaski County, Virginia (Figure 2). Claytor Lake is a mainstream hydroelectric
impoundment that maintains a riverine morphometry throughout its 26 km length (Kohler
et al. 1986). The reservoir has a surface area of 1,820 ha at normal pool elevation of 663
m above mean sea level, with widths that range between 0.29 and 0.95 km. Claytor Lake
has 161 km of shoreline, a 15-m average depth, and a maximum depth of 37.5 m (Kohler
et al. 1986; Copeland 1999; Palmer 1999). The mean retention time of the reservoir has
been estimated as 33 days (Copeland 1999; Palmer 1999). The moderately eutrophic
reservoir is dimictic, experiencing spring and fall turnovers (Boaze 1972; Palmer 1999).
The steep-gradient shape of the reservoir results in a limited littoral zone, best developed
in a few bays and the major tributary, Peak Creek.
Since impoundment, fifteen species of fish have been stocked into Claytor Lake,
making fish stocking the primary management activity on the reservoir (Kohler et al.
1986; Copeland 1999). Initial stocking programs featured centrarchid species and
walleye Stizostedion vitreum (Kohler et al. 1986; Copeland 1999). Since 1960, stocking
programs have been directed toward the development of a pelagic fishery (Copeland
1999). Preliminary attempts to establish threadfin shad Dorsoma petenese, rainbow trout
Oncorhynchus mykiss, and brown trout Salmo trutta failed, and in 1968 striped bass
fingerlings were introduced into the reservoir to help fill the pelagic niche (Kohler et al.
1986; Copeland 1999). To provide forage for the pelagic fishery, alewife Alosa
pseudoharengus were introduced in the 1960s, and further expansion of the pelagic
forage base was achieved via angler introduction of gizzard shad in the 1980s. As a
10
6 0 6 12 Kilometers
W
Upper Lake
Lower Lake
. CLSP . Middle Lake
DP
.LM
Figure 2. Map of Claytor Lake, Virginia, with sampling partitions and stocking sites. Partitions: Lower Lake = Claytor Dam to Twin Coves; Middle Lake = Twin Coves to Peak Creek; Upper Lake = Upstream of Peak Creek. Stocking sites: CLSP = Claytor Lake State Park; DP = Dehaven Park; LM = Lighthouse Marina.
11
N
E
S
result, alewife, gizzard shad, and sunfishes Lepomis spp. are the principal forage fishes
(Bonds 2000).
Claytor Lake supports a fishery consisting of a mixture of warmwater and
coolwater species. Warmwater species such as black bass Micropterus spp., flathead
catfish Pylodictis olivaris, channel catfish Ictalurus punctatus, white bass, crappie
Pomoxis spp., and other sunfishes have self-sustaining populations. Coolwater species
such as walleye, muskellunge Esox masquinongy, striped bass, and hybrid striped bass
have been maintained through periodic stocking programs of VDGIF.
Striped bass were stocked in Claytor Lake from 1968 through 1992 at a rate of
approximately 70,000 fingerlings per year (John Copeland, VDGIF, pers. comm.).
Stockings were reduced to approximately 33,500 fingerlings per year from 1993 through
1997, and in 1999 and 2000 to accommodate the addition of hybrid striped bass.
However, stocking rates were again elevated back to approximately 70,000 individuals
per year in 1998, 2001, and 2002. Hybrid striped bass have been stocked at a rate of
33,500 fingerlings per year from 1993 through 2002. The current stocking rates of each
species result in density of approximately 38 fingerlings per hectare for striped bass and
18/ha for hybrid striped bass. The current striped bass stocking rate in Claytor Lake is
higher than the density utilized in Lake Anna, Virginia, which currently has a striped bass
stocking rate of approximately 20/ha (John Odenkirk, VDGIF, pers. comm.). However,
the combined striped bass and hybrid striped bass fingerling density of Claytor Lake is
similar to the stocking density of Smith Mountain Lake, Virginia, which currently
receives striped bass at a density of approximately 54/ha.
12
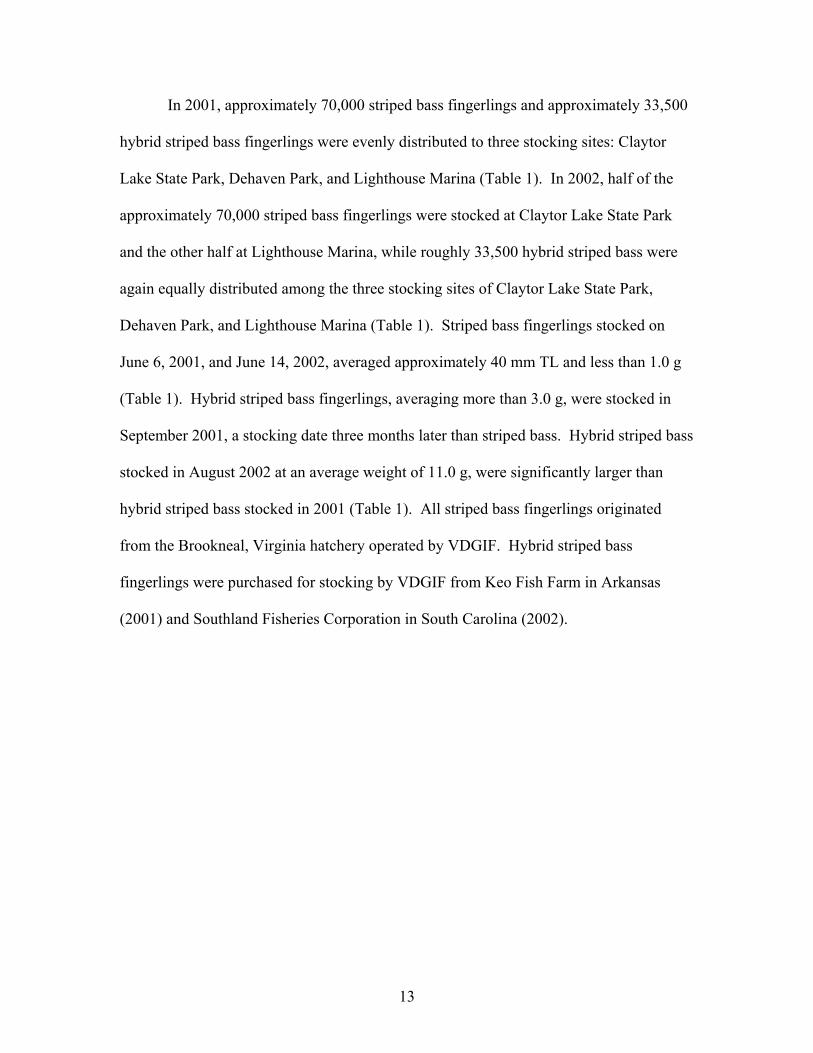
In 2001, approximately 70,000 striped bass fingerlings and approximately 33,500
hybrid striped bass fingerlings were evenly distributed to three stocking sites: Claytor
Lake State Park, Dehaven Park, and Lighthouse Marina (Table 1). In 2002, half of the
approximately 70,000 striped bass fingerlings were stocked at Claytor Lake State Park
and the other half at Lighthouse Marina, while roughly 33,500 hybrid striped bass were
again equally distributed among the three stocking sites of Claytor Lake State Park,
Dehaven Park, and Lighthouse Marina (Table 1). Striped bass fingerlings stocked on
June 6, 2001, and June 14, 2002, averaged approximately 40 mm TL and less than 1.0 g
(Table 1). Hybrid striped bass fingerlings, averaging more than 3.0 g, were stocked in
September 2001, a stocking date three months later than striped bass. Hybrid striped bass
stocked in August 2002 at an average weight of 11.0 g, were significantly larger than
hybrid striped bass stocked in 2001 (Table 1). All striped bass fingerlings originated
from the Brookneal, Virginia hatchery operated by VDGIF. Hybrid striped bass
fingerlings were purchased for stocking by VDGIF from Keo Fish Farm in Arkansas
(2001) and Southland Fisheries Corporation in South Carolina (2002).
13
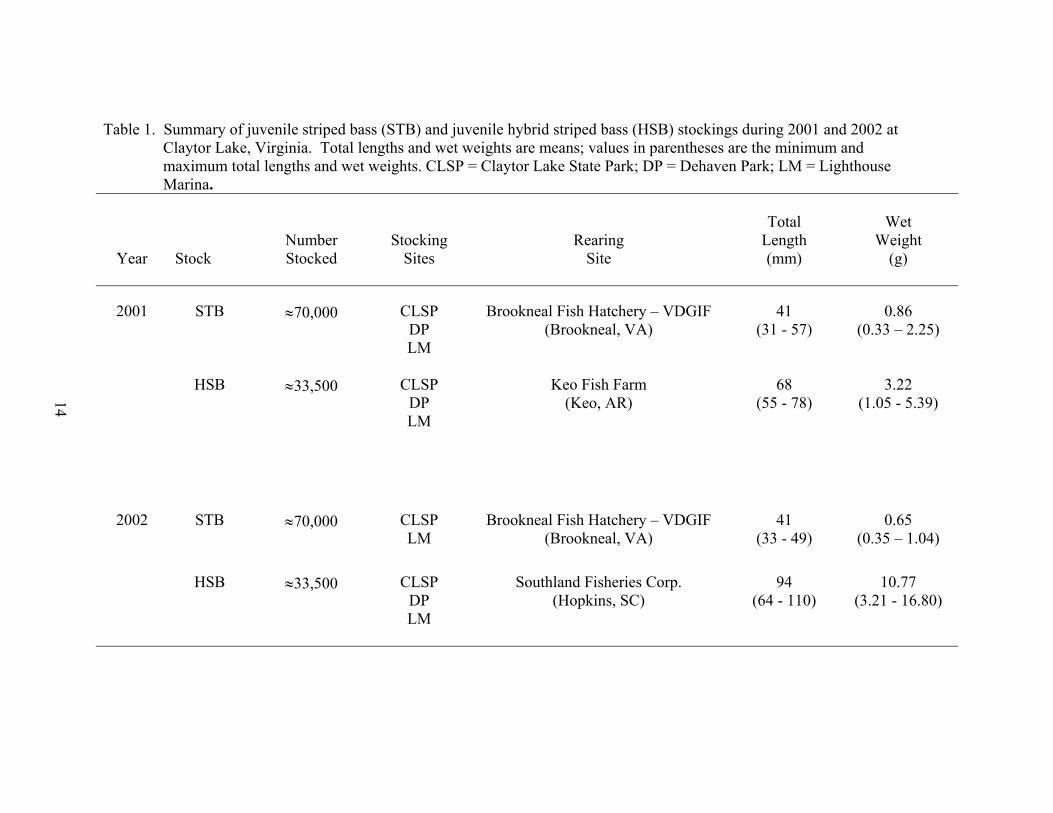
Table 1. Summary of juvenile striped bass (STB) and juvenile hybrid striped bass (HSB) stockings during 2001 and 2002 at Claytor Lake, Virginia. Total lengths and wet weights are means; values in parentheses are the minimum and maximum total lengths and wet weights. CLSP = Claytor Lake State Park; DP = Dehaven Park; LM = Lighthouse Marina.
Year
Stock
Number Stocked
Stocking Sites
Rearing Site
Total
Length (mm)
Wet
Weight (g)
2001
STB ≈70,000 CLSP DP LM
Brookneal Fish Hatchery – VDGIF (Brookneal, VA)
41 (31 - 57)
0.86 (0.33 – 2.25)
HSB ≈33,500 CLSP DP LM
Keo Fish Farm (Keo, AR)
68 (55 - 78)
3.22 (1.05 - 5.39)
2002 STB ≈70,000 CLSP LM
Brookneal Fish Hatchery – VDGIF (Brookneal, VA)
41 (33 - 49)
0.65 (0.35 – 1.04)
HSB ≈33,500 CLSP DP LM
Southland Fisheries Corp. (Hopkins, SC)
94 (64 - 110)
10.77 (3.21 - 16.80)
14
METHODS
Field Collections Age-0 striped bass and age-0 hybrid striped bass were sought weekly from
stocking dates until the second week of December 2001 and 2002 (the approximate end
of the growing season). In 2001, the littoral zone of the entire reservoir was searched
intensively for the presence of juvenile striped bass and juvenile hybrid striped bass.
With an increased understanding of the distribution of stocked juvenile Morone in the
system, during the second field season, collection efforts were concentrated upon the
areas where juvenile Morone were captured during the first year of sampling. However,
in December of 2002, no specimens were collected. The failure to obtain juvenile
Morone is probably due to the decline in water temperature (11.1ºC versus 5.5ºC, mean
December 2001 and 2002, respectively) (Kilpatrick 2003). Thus, by December 2002,
juveniles had likely moved from littoral to deep habitats to seek warmer water.
I partitioned the reservoir into three regions, lower lake (Claytor Dam to the Twin
Coves), middle lake (the area between the Twin Coves and Peak Creek), and upper lake
(area above Peak Creek) (Figure 2). I concentrated sampling efforts within each region
upon areas where juveniles were consistently found (sand or gravel substrates without
cover), during a single region each week. Habitats in each region found not to be
consistently used by juvenile striped bass or juvenile hybrid striped bass (all areas with
cover and all boulder substrates) also were monitored (see Habitat Usage), but in order to
maximize capture success, sampling was concentrated upon suitable habitats. Fishes
were again sought during the post-winter, pre-growing season period in March and April
2002 and 2003. However, I was unable to capture any juvenile moronids until April
15
2003 (one month later than first captures in the spring of 2002). March of 2003 was
much colder and thus, winter was prolonged longer than in March of 2002, which may
have affected distribution and activity of juvenile moronids.
To obtain representative samples of age-0 Morone over the size range present in
the lake, a variety of sampling gears were utilized. Electrofishing was conducted weekly
in each region to target fish in the littoral zone using a boom-type electrofisher with
pulsed-DC current. A global positioning system (GPS) was used to record the location of
each fish capture site. Horizontal gillnets were deployed each week from September
through December of 2001 and 2002, and again in March and April of 2002 and 2003 to
target fish not susceptible to electrofishing. Three bi-panel monofilament gillnets (30.5-
m long and 1.8-m deep consisting of two 15.2-m long panels with bar mesh sizes of 25
and 19 mm, 19 and 13 mm, and 25 and 13 mm) were set perpendicular to the shoreline
and anchored to the bottom to target fish that occupied waters deeper than those that
could be sampled via electrofishing. One of each net type was set each week. Nets were
set at dusk and retrieved at dawn the following day.
I sought to collect at least 30 juvenile striped bass and 30 hybrid striped bass in
total using all gear types employed during each weekly sampling period. All striped bass
and hybrid striped bass collected were immediately placed on ice. Upon return from field
collection, all fish were blotted dry and weighed to the nearest 0.01 g, measured to the
nearest 1 mm total length, and frozen for future stomach content analysis.
Stock Identification Juvenile striped bass and juvenile hybrid striped bass can be distinguished via
investigation of meristic characters. Differentiating features include the number of lateral
16
line scales (approximately 58 for striped bass and approximately 52 for hybrid striped
bass) and the length of the second anal spine (shorter in relation to third anal spine for
striped bass and longer in relation to third anal spine for hybrid striped bass) (Kerby
1979a; Kerby 1979b; Harrell and Dean 1988; Muoneke et al. 1991). While these
characters were used successfully to distinguish between striped bass and hybrid striped
bass stocked in 2002, over the course of the 2001-2002 season, I was unable to make a
distinction between stocks by comparing meristic characters. Individuals collected in the
late fall of 2001 (hybrids were stocked in late September) and the early spring of 2002
exhibited the diagnostic character of juvenile striped bass, but no individuals displayed
the defining characteristics of juvenile hybrid striped bass. Thus, alternative methods
were sought for species identification of age-0 moronids stocked in 2001.
Genetic markers were used to verify species type using amplification fragment
size analysis at microsatellite loci. To provide tissue samples for comparative analysis,
dorsal fin clips were removed from ten white bass (taken from Lake Norman and High
Rock Lake, NC), ten hybrid striped bass (Southland Fisheries Corp., Hopkins, SC), ten
striped bass (Brookneal Fish Hatchery, Brookneal, VA), two hybrid striped bass (Keo
Fish Farm, Keo, AR), and ten fish of “questionable” phenotype (as determined from
meristic analysis) from the 2001-2002 sampling season. Fin clips were frozen until
subsequent DNA extraction, which was conducted under the guidance of Dr. Eric
Hallerman and Kathy Finne of the Department of Fisheries and Wildlife Sciences at
Virginia Polytechnic Institute and State University. The DNA was extracted from fin
tissue using the Puregene DNA isolation kit (Gentra, Minneapolis, MN). Polymerase
chain reaction (PCR) was used to amplify six potentially diagnostic microsatellite loci
17
SB6, SB11, SB83 (Han et al. 2000), SB91, SB113 (Roy et al. 2000), and SB108 (C.
Couch, North Carolina State University, pers. comm.). DNA was amplified with a PCR
Express (Hybaid, Franklin, MA) thermocycler, with cycling conditions consisting of 30
amplification cycles of the following: 30 sec at 94°C; 30 sec at 49°C (SB6), 30 sec at
53°C (SB11, SB83 and SB91), or 30 sec at 46°C (SB108); 40 sec at 72°C; and a final
holding temperature of 4°C.
The amplification product was sent to the Virginia Bioinformatics Institute
(Blacksburg, VA) to determine molecular weights, where an Applied Biosystems (Foster
City, CA) 377 Genetic Analyzer was used for data collection, and Applied Biosystems
Genescan and Genotyper Software were used for analysis. Output then was interpreted
for species identification by Ms. Finne and Dr. Hallerman.
First-Year Growth Subsamples of juvenile Morone fingerlings were obtained from hatchery vehicles
at stocking sites or by the immediate sampling of stocked fingerlings to provide baseline
size information on stocked Morone (Table 1). Temporal patterns in growth were
described by calculating a monthly mean length and weight of juveniles, and then
plotting means over the growing season (June through December 2001 and 2002) (Sutton
1997). Monthly length-frequency histograms for 2001-2002 and 2002-2003 were
interpreted to describe patterns and size distribution in growth of juvenile striped bass
and juvenile hybrid striped bass (Sutton and Ney 2001).
Total first-year growth in length was calculated for juvenile striped bass and
juvenile hybrid striped bass during periods of linear growth via an absolute growth rate
equation, which is defined as:
18

absolute growth rate = (Y2 – Y1) / (t2 – t1),
where Y1 is the initial mean total length (mm) of juvenile Morone, Y2 is the mean total
length (mm) of juveniles for the final month of linear growth, t1 is the initial day of
stocking, and t2 is the final day of fish collection during the final month of linear growth
(Busacker et al. 1990).
Post-Winter Survival
Overwinter survival was evaluated by comparing length-frequency histograms
from late fall and early spring. Juvenile striped bass have been reported to exhibit little to
no growth over winter when water temperatures are below 10ºC (Cox and Coutant 1981;
Kerby et al. 1987; Woiwade and Adelman 1991; Hurst and Conover 1998; Sutton and
Ney 2001). Sutton and Ney (2001) noted that determination of size-dependent
overwinter mortality from length-frequency data requires that: 1) mean length of fish
increased over the winter while the variability in length decreased; and 2) the decrease in
variability should be due to an upward shift in the minimum but not the maximum length.
In addition, failure to attain some minimum size prior to the winter period may result in
the inability of an individual to obtain the energy reserves required to survive the
overwinter period (Sutton 1997). Therefore, lipid analysis was used as an indicator of
overwinter health (see Indices of Health).
Food Habits To assess diet composition, fish were thawed and stomachs, from the base of the
esophagus to the anterior portion of the intestine, were removed and preserved in 10%
formalin for subsequent analysis. Stomach contents were examined under a dissecting
microscope and identified to the lowest possible taxon (order or family for invertebrates
19

and genus or species for fish). Prey items were blotted dry and weighed to the nearest
0.01 g.
The percent contribution by weight of each prey type (Hylsop 1980) was
calculated using the following equation:
%WTPi = ∑(WTPi / WT) / N,
where %WTPi is the average percent contribution by weight for prey type i, WTPi is the
weight of prey i consumed by an individual predator, WT is the total weight of all prey
types consumed by that predator, and N is the total number of predators of that type
sampled that contained food (Sutton 1997). Percent contribution by weight allows food
types to be quantified in directly comparable mass units so that the relative importance of
these diet items can be estimated in terms of approximate nutrition gained by the predator
(Bowen 1996; Sutton 1997).
Diet Overlap
Diet overlap, as an index of interspecific trophic competition, was calculated
between juvenile striped bass and hybrid striped bass by month and by 10 mm size class
intervals during the 2001 and 2002 growing seasons and the 2002 and 2003 post-winter
periods (Sutton 1997). Overlap was evaluated by using diet composition weight
percentages and Schoener’s (1970) overlap index, which is defined as:
n
Cxy = 1.0 – 0.5 ∑ |pxi - pyi|, i=1
where Cxy is the overlap index, pxi is the proportion of food type i used by species x
(striped bass), pyi is the proportion of food type i used by species y (hybrid striped bass),
20

and n is the total number of food categories (Crowder 1990). Overlap values of 0.6 or
greater are considered indicative of potential trophic competition (Crowder 1990).
Indices of Health
Fulton condition factor (K), relative weight, and lipid index values were evaluated
to assess the health of juvenile moronids within this study.
Condition Factor (K). - Body condition of each juvenile Morone was evaluated
by the calculation of its Fulton condition factor (K), which is defined as:
K = (W / L3) x 100,000,
where W is the measured wet weight (nearest 0.01g) and L is the total length (nearest 1
mm) (Anderson and Neuman 1996).
Relative healthiness determined by condition factors only was compared within
species. Comparison of condition factors between juvenile striped bass and juvenile
hybrid striped bass would not be valid because of the different body shapes of these
fishes (Anderson and Neuman 1996).
Relative Weight. - The relative weight index (Wr) represents a refinement of the K
concept, via the ability to compare values between species and populations (Wege and
Anderson 1978; Brown and Murphy 1991a; Anderson and Neuman 1996; Sutton 1997).
However, due to the high variability in the length at which the growth form changes for
both striped bass and hybrid striped bass, the relative weight index is not accurate for
individuals less than 150 mm TL and 115 mm TL, respectively (Brown and Murphy
1991b; Anderson and Neuman 1996; Sutton 1997). Thus, relative weight index values
for striped bass greater than 150 mm TL and hybrid striped bass greater than 115 mm TL
were calculated for comparisons of fishes in Claytor Lake. Values calculated for
21

individuals greater than the cutoff ranges were evaluated in comparison to other
populations of Morone.
Relative weight was calculated using the following equation:
Wr = W / Ws x 100,
where Wr is the relative weight of an individual, W is the wet weight of an individual, and
Ws is the length-specific standard weight of an individual. The standard weight equations
for striped bass and hybrid striped bass (Brown and Murphy 1991b) are:
for striped bass:
log10Ws = -4.924 + 3.007 log10TL,
for hybrid striped bass:
log10Ws = -5.201 + 3.139 log10TL.
Lipid Index. - During periods of low food availability or environmental stress,
lipids provide an important source of energy, and their amount reflects the physiological
capacity of the fish (Sutton and Ney 2001). Large fish typically accumulate greater lipid
reserves (i.e., higher percentage of body composition in lipids) than smaller fish,
suggesting that overwinter survival, a period when fish feed very little, could be a
problem for juvenile fishes that do not attain some minimum size (and adequate lipid
reserves) prior to their first overwintering period (Sutton and Ney 2001). Lipid index
values were determined for juvenile Morone in Claytor Lake before and after winter, with
lipid index defined as:
LI = (LPW / LFDW) x 100,
where LPW is the weight of extracted lipid and LFDW is the lipid-free dry body weight
(Sutton 1997).
22

After stomach removal for diet analysis, all individuals were frozen, dried to a
constant weight (4-7 days) by heating at 55-60°C, and reweighed to the nearest 0.01 g.
Weight loss (due to the heating process) provided an estimate of body water content,
which was applied to the linear regression relationship between percent water and lipid
index developed by Sutton (1997) for age-0 striped bass from Smith Mountain Lake,
Virginia:
LI = 1.84 – 0.02(%BW), r2 = 0.98, P = 0.001,
where LI is the lipid index and %BW is the percent body water content for juvenile
Morone collected from Claytor Lake.
This equation was used to estimate the lipid index for the juveniles based on their
percent body water content as determined from the heating process. Temporal trends of
lipid index for individuals were analyzed over the 2002 growing season and before and
after winter in both the 2001-2002 and 2002-2003 seasons, to determine if a positive
relationship existed between fish length and physiological health after the growing
season.
Habitat Usage During both sampling seasons, while collecting fish for growth and diet analysis,
the habitat usage of the species in the littoral zone was documented. The dominant
substrate, sand (particle size 0.06-1 mm), gravel (2-15 mm), cobble (64-256 mm), or
boulder (> 256 mm) (Bain 1999) and percent and type of cover (woody debris and
vegetation) over which each individual was captured were documented. Dominant
substrate was determined by visual estimation of the largest percent of substrate type by
area.
23

During the 2002 growing season, I searched for 100-m units of shoreline within
the lower region of the reservoir that represented one of the possible habitat categories
(four substrates, with and without cover). Due to the lack of “gravel with cover” habitat,
this investigation resulted in a total of seven categories of 100-m units (four substrate
types, with and without cover, exclusive of “gravel with cover”). Once per month, each
habitat unit was electrofished for a continuous thirty-minute time interval to investigate
for the presence of age-0 striped bass and age-0 hybrid striped bass. The division of the
littoral zone into separate habitat units, coupled with standardization of sampling efforts,
allowed comparison of catch-per-unit-effort data across habitat types.
Monthly habitat usage overlap by juvenile striped bass and juvenile hybrid striped
bass then were calculated via Schoener’s (1970) overlap index, which is defined as:
n
Cxy = 1.0 – 0.5 ∑ |pxi - pyi|, i=1
where Cxy is the overlap index, pxi is the proportion of habitat type i used by species x
(striped bass), pyi is the proportion of habitat type i used by species y (hybrid striped
bass), and n is the total number of habitat categories. Habitat electivity was calculated by
using the Strauss linear selection index:
Li = ri - pi,
where ri is the usage proportion of habitat i by species, and pi is the proportion of habitat i
in the environment (14.3%) (Crowder 1990). Positive values indicate preference for a
habitat type, and negative values indicate avoidance of a habitat type.
24
Predation In 2002, electrofishing was conducted along the entire shorelines of the stocking
coves (approximately 460 and 75 m at Claytor Lake State Park and Dehaven Park,
respectively, and 410 m within the cove immediately downstream of Lighthouse Marina)
and approximately 100 m above and below each stocking cove on the date of stocking,
one day post-stocking, and three days post-stocking to capture potential predators (all
omnivorous and piscivorous species). Electrofishing was then conducted weekly (100 m
above and below and within stocking coves) for one month thereafter to target
Micropterus spp., the primary littoral piscivores of Claytor Lake. To evaluate predation,
predator stomach contents were evacuated with clear acrylic tubes and predators then
were released (Michaelson et al. 2001). Stomach contents were bagged, preserved on ice
and then returned to the lab.
Intensity of predation was assessed via frequency of occurrence of juvenile
striped bass and juvenile hybrid striped bass in the diets of predators. When all
specimens had been examined, the proportion of the potential predators that contained
one or more juvenile striped bass or juvenile hybrid striped bass was calculated as the
frequency of occurrence for that juvenile Morone as a food type (Bowen 1996).
Statistical Analysis
Statistical procedures used to analyze data are listed in Table 2. One-way analysis
of variance (ANOVA) was used to test for differences in population means (total length
and indices of health) (Ott and Longnecker 2001). To verify the accuracy of ANOVA
results; a corresponding nonparametric statistical procedure (Kruskal-Wallis test) was
used. Nonparametric procedures produced equivalent results, thus, only results of
25

ANOVAs are reported. Also, the Jonckheere-Terpstra trend test was applied to
determine the presence of a size-dependent shift in lipid index over the growing season
(Goodwin and Angermeier 2003). Statistical analysis were considered significant at P <
0.05 for Type I error.
26
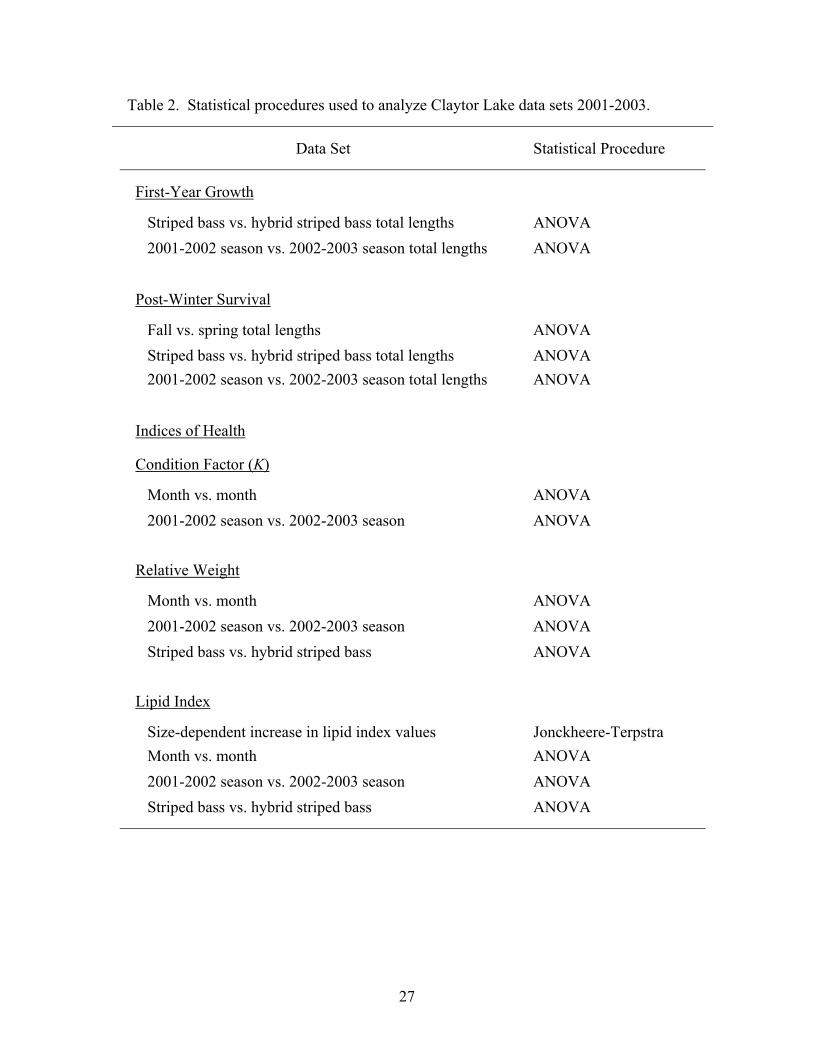
Table 2. Statistical procedures used to analyze Claytor Lake data sets 2001-2003.
Data Set
Statistical Procedure
First-Year Growth
Striped bass vs. hybrid striped bass total lengths ANOVA 2001-2002 season vs. 2002-2003 season total lengths ANOVA Post-Winter Survival
Fall vs. spring total lengths ANOVA Striped bass vs. hybrid striped bass total lengths ANOVA 2001-2002 season vs. 2002-2003 season total lengths ANOVA Indices of Health
Condition Factor (K)
Month vs. month ANOVA 2001-2002 season vs. 2002-2003 season ANOVA Relative Weight
Month vs. month ANOVA 2001-2002 season vs. 2002-2003 season ANOVA Striped bass vs. hybrid striped bass ANOVA Lipid Index
Size-dependent increase in lipid index values Jonckheere-Terpstra Month vs. month ANOVA 2001-2002 season vs. 2002-2003 season ANOVA Striped bass vs. hybrid striped bass ANOVA
27
RESULTS
Field Collections A total of 1,628 age-0 moronids (N = 1,507 for striped bass; N = 121 for hybrid
striped bass) were collected from Claytor Lake during the 2001-2002 and 2002-2003
sampling seasons (Table 3). An additional 285 fingerlings (N = 153 for striped bass; N =
132 for hybrid striped bass) were obtained from hatchery trucks on the stocking date.
More striped bass were collected during 2001-2002 (N = 842) than during 2002-2003 (N
= 665) (Table 3). Significantly greater numbers of hybrid striped bass were collected in
2002-2003 (N = 119) than in 2001-2002 (N = 3). Both species were most commonly
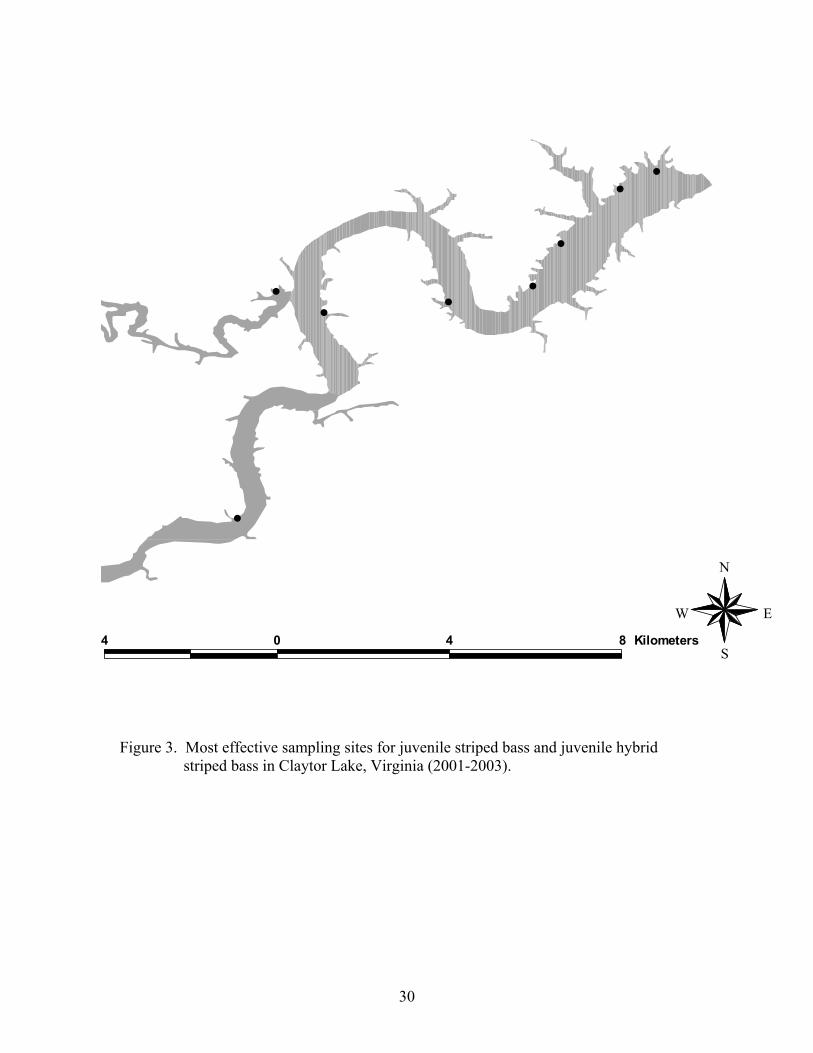
collected in shallow littoral areas with sand and gravel substrates lacking cover (Figure
3).
Stock Identification
The frequencies of alleles at the six microsatellite DNA loci examined in this
study are displayed in Table 4. Although the allelic overlap occurs among stock
categories, one can see the allele sizes at which white bass and striped bass tend to align,
and the mosaic of frequencies (i.e., combinations of parental alleles) that hybrid striped
bass exhibit. For example, at locus SB6, 88.0% of white bass alleles are between 201 and
207 base-pairs (bp), and 95.0% of striped bass alleles are between 185 and 201 bp (Table
4). Southland Fisheries, South Carolina hybrid striped bass alleles exhibit a broad range
of alle1e sizes from 89 to 233 bp, which is similar to the distribution of alleles for Keo
Fish Farm, Arkansas hybrid striped bass (from allele 185-235 bp), with both having
50.0% frequencies of the 199 bp allele. Individuals of questionable phenotype displayed
28

Table 3. Total number of juvenile striped bass (STB) and juvenile hybrid striped bass (HSB) collected by sampling season, sampling period, and collection method from Claytor Lake, Virginia.
STB
HSB
Sampling Season
Sampling
Period
Electro-fishing
Gillnetting
Total
Electro-fishing
Gillnetting
Total
2001-02
June
-----
-----
-----
-----
-----
-----
July 30 ----- 30 ----- ----- -----
August 110 ----- 110 ----- ----- -----
September 127 19 146 ----- ----- -----
October 173 38 211 ----- ----- -----
November 143 12 155 3 ----- 3
December 25 15 40 ----- ----- -----
March 5 5 10 ----- ----- -----
April 138 2 140 ----- ----- -----
May ----- ----- ----- ----- ----- -----
Total 842 3
2002-03 June 22 ----- 22 ----- -----
July 90 ----- 90 ----- -----
August 103 ----- 103 7 ----- 7
September 151 9 160 26 ----- 26
October 138 21 159 40 1 41
November 42 3 45 5 ----- 5
December ----- ----- ----- ----- ----- -----
March ----- ----- ----- ----- ----- -----
April 33 2 35 10 ----- 10
May 51 ----- 51 30 ----- 30
Total 665 119
29
#
#
##
#
#
#
#
4 0 4 8 Kilometers
N
EW
S Figure 3. Most effective sampling sites for juvenile striped bass and juvenile hybrid striped bass in Claytor Lake, Virginia (2001-2003).
30
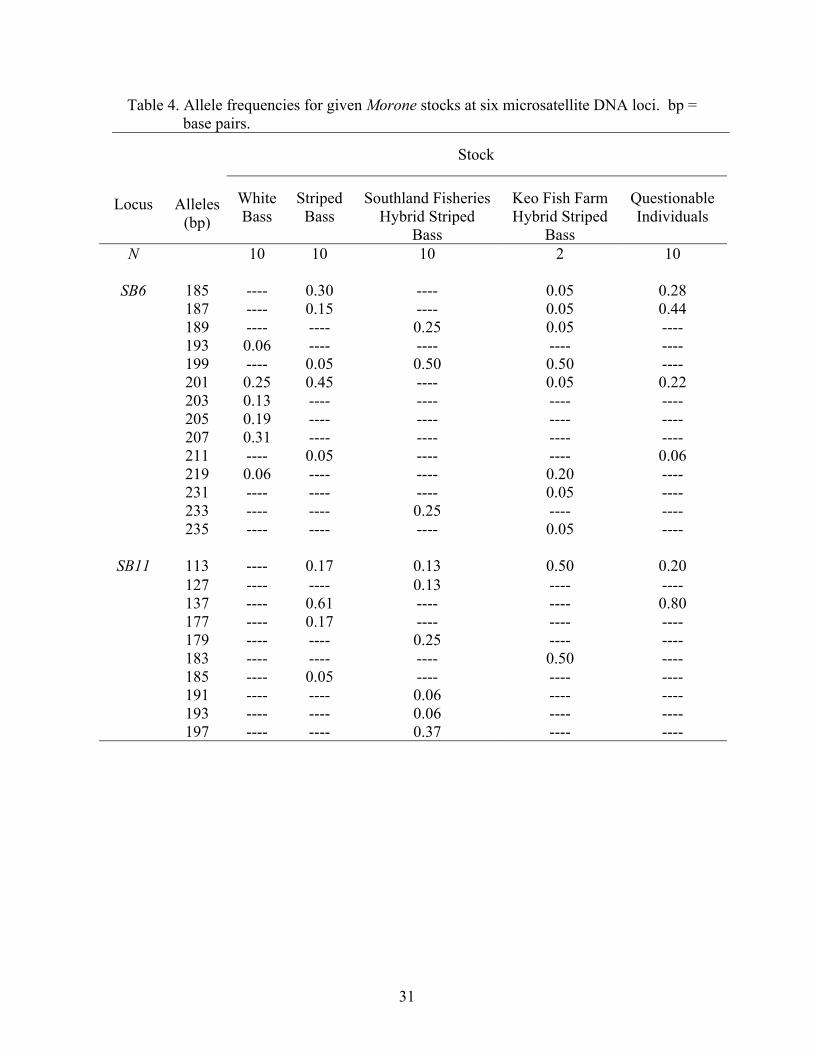
Table 4. Allele frequencies for given Morone stocks at six microsatellite DNA loci. bp = base pairs.
Stock
Locus
Alleles
(bp)
White Bass
Striped
Bass
Southland Fisheries
Hybrid Striped Bass
Keo Fish Farm Hybrid Striped
Bass
Questionable Individuals
N 10 10 10 2 10
SB6 185 ---- 0.30 ---- 0.05 0.28 187 ---- 0.15 ---- 0.05 0.44 189 ---- ---- 0.25 0.05 ---- 193 0.06 ---- ---- ---- ---- 199 ---- 0.05 0.50 0.50 ---- 201 0.25 0.45 ---- 0.05 0.22 203 0.13 ---- ---- ---- ---- 205 0.19 ---- ---- ---- ---- 207 0.31 ---- ---- ---- ---- 211 ---- 0.05 ---- ---- 0.06 219 0.06 ---- ---- 0.20 ---- 231 ---- ---- ---- 0.05 ---- 233 ---- ---- 0.25 ---- ---- 235 ---- ---- ---- 0.05 ----
SB11 113 ---- 0.17 0.13 0.50 0.20 127 ---- ---- 0.13 ---- ---- 137 ---- 0.61 ---- ---- 0.80 177 ---- 0.17 ---- ---- ---- 179 ---- ---- 0.25 ---- ---- 183 ---- ---- ---- 0.50 ---- 185 ---- 0.05 ---- ---- ---- 191 ---- ---- 0.06 ---- ---- 193 ---- ---- 0.06 ---- ---- 197 ---- ---- 0.37 ---- ----
31
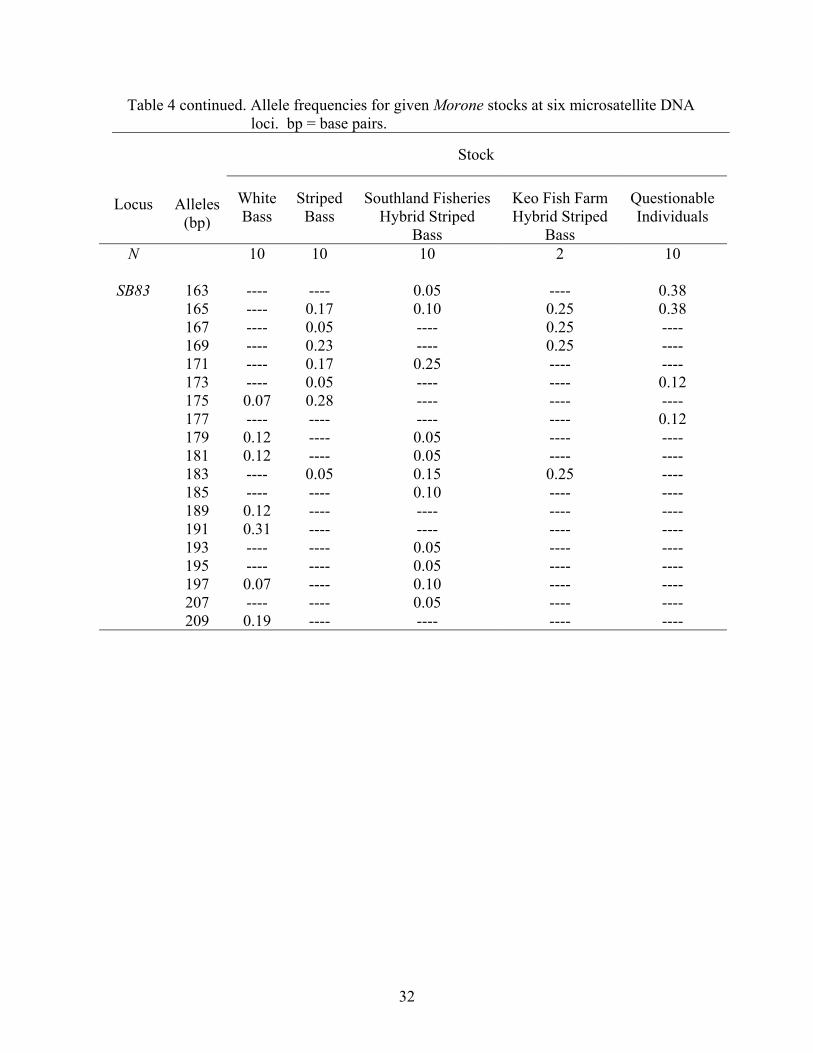
Table 4 continued. Allele frequencies for given Morone stocks at six microsatellite DNA loci. bp = base pairs.
Stock
Locus
Alleles
(bp)
White Bass
Striped
Bass
Southland Fisheries
Hybrid Striped Bass
Keo Fish Farm Hybrid Striped
Bass
Questionable Individuals
N 10 10 10 2 10
SB83 163 ---- ---- 0.05 ---- 0.38 165 ---- 0.17 0.10 0.25 0.38 167 ---- 0.05 ---- 0.25 ---- 169 ---- 0.23 ---- 0.25 ---- 171 ---- 0.17 0.25 ---- ---- 173 ---- 0.05 ---- ---- 0.12 175 0.07 0.28 ---- ---- ---- 177 ---- ---- ---- ---- 0.12 179 0.12 ---- 0.05 ---- ---- 181 0.12 ---- 0.05 ---- ---- 183 ---- 0.05 0.15 0.25 ---- 185 ---- ---- 0.10 ---- ---- 189 0.12 ---- ---- ---- ---- 191 0.31 ---- ---- ---- ---- 193 ---- ---- 0.05 ---- ---- 195 ---- ---- 0.05 ---- ---- 197 0.07 ---- 0.10 ---- ---- 207 ---- ---- 0.05 ---- ---- 209 0.19 ---- ---- ---- ----
32
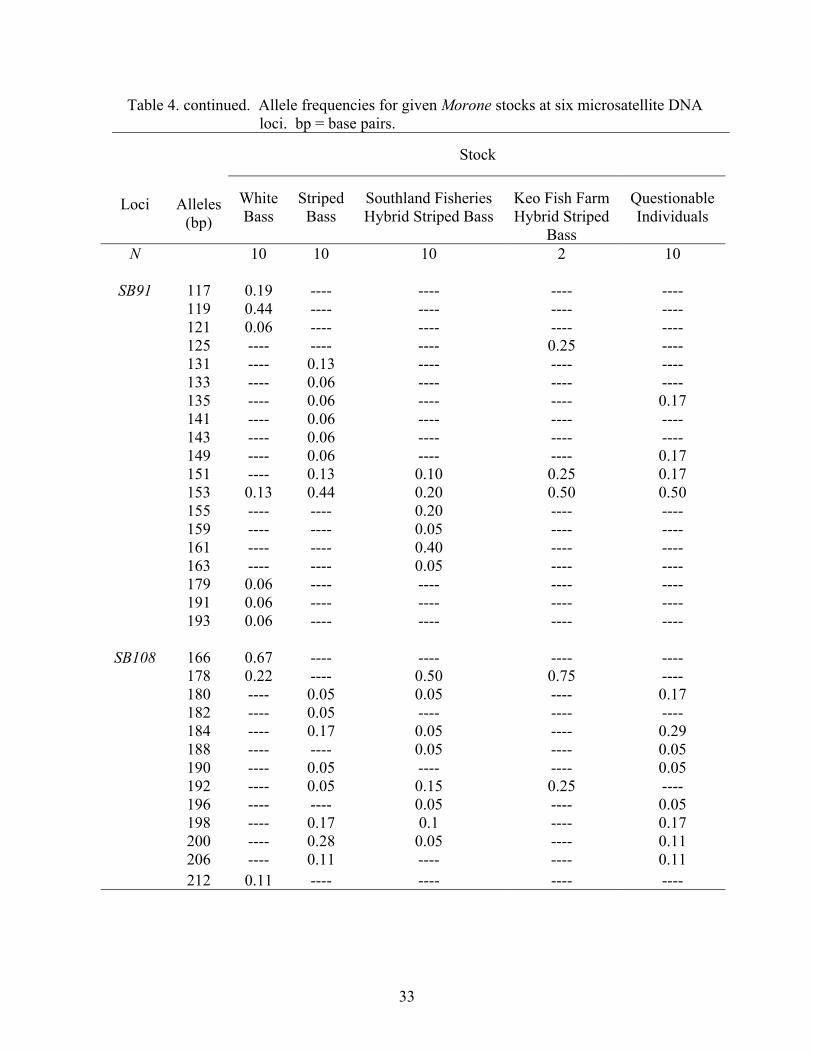
Table 4. continued. Allele frequencies for given Morone stocks at six microsatellite DNA loci. bp = base pairs.
Stock
Loci
Alleles
(bp)
White Bass
Striped
Bass
Southland Fisheries Hybrid Striped Bass
Keo Fish Farm Hybrid Striped
Bass
Questionable Individuals
N 10 10 10 2 10
SB91 117 0.19 ---- ---- ---- ---- 119 0.44 ---- ---- ---- ---- 121 0.06 ---- ---- ---- ---- 125 ---- ---- ---- 0.25 ---- 131 ---- 0.13 ---- ---- ---- 133 ---- 0.06 ---- ---- ---- 135 ---- 0.06 ---- ---- 0.17 141 ---- 0.06 ---- ---- ---- 143 ---- 0.06 ---- ---- ---- 149 ---- 0.06 ---- ---- 0.17 151 ---- 0.13 0.10 0.25 0.17 153 0.13 0.44 0.20 0.50 0.50 155 ---- ---- 0.20 ---- ---- 159 ---- ---- 0.05 ---- ---- 161 ---- ---- 0.40 ---- ---- 163 ---- ---- 0.05 ---- ---- 179 0.06 ---- ---- ---- ---- 191 0.06 ---- ---- ---- ---- 193 0.06 ---- ---- ---- ----
SB108 166 0.67 ---- ---- ---- ---- 178 0.22 ---- 0.50 0.75 ---- 180 ---- 0.05 0.05 ---- 0.17 182 ---- 0.05 ---- ---- ---- 184 ---- 0.17 0.05 ---- 0.29 188 ---- ---- 0.05 ---- 0.05 190 ---- 0.05 ---- ---- 0.05 192 ---- 0.05 0.15 0.25 ---- 196 ---- ---- 0.05 ---- 0.05 198 ---- 0.17 0.1 ---- 0.17 200 ---- 0.28 0.05 ---- 0.11 206 ---- 0.11 ---- ---- 0.11 212 0.11 ---- ---- ---- ----
33
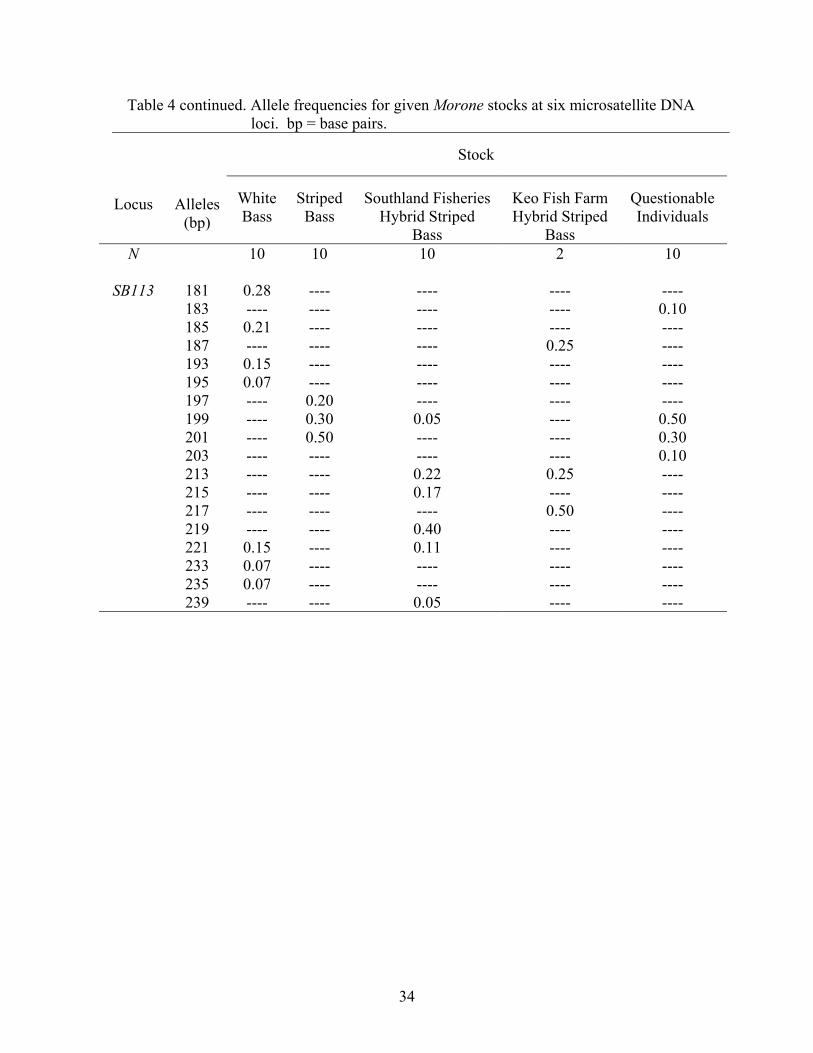
Table 4 continued. Allele frequencies for given Morone stocks at six microsatellite DNA loci. bp = base pairs.
Stock
Locus
Alleles
(bp)
White Bass
Striped
Bass
Southland Fisheries
Hybrid Striped Bass
Keo Fish Farm Hybrid Striped
Bass
Questionable Individuals
N 10 10 10 2 10
SB113 181 0.28 ---- ---- ---- ---- 183 ---- ---- ---- ---- 0.10 185 0.21 ---- ---- ---- ---- 187 ---- ---- ---- 0.25 ---- 193 0.15 ---- ---- ---- ---- 195 0.07 ---- ---- ---- ---- 197 ---- 0.20 ---- ---- ---- 199 ---- 0.30 0.05 ---- 0.50 201 ---- 0.50 ---- ---- 0.30 203 ---- ---- ---- ---- 0.10 213 ---- ---- 0.22 0.25 ---- 215 ---- ---- 0.17 ---- ---- 217 ---- ---- ---- 0.50 ---- 219 ---- ---- 0.40 ---- ---- 221 0.15 ---- 0.11 ---- ---- 233 0.07 ---- ---- ---- ---- 235 0.07 ---- ---- ---- ---- 239 ---- ---- 0.05 ---- ----
34

allele frequencies similar to those of striped bass, with 94.0% of their alleles between 185
and 201 bp in size.
Observations of allele frequencies led to several inferences key to the objective of
this study. First, comparisons of allele frequencies failed to indicate that 2001 hybrid
striped bass fingerlings provided by Keo Fish Farm were anything other than F1 hybrid
striped bass. Second, individuals of “questionable” phenotype were most probably
juvenile striped bass exhibiting poor condition.
Subsequent reexamination (via meristic characters) of all juvenile Morone
collected during the 2001-2002 sampling season revealed the presence of only three
juvenile hybrid striped bass. The original difficulty associated with correctly
differentiating between juvenile striped bass and hybrid striped bass appears to have been
a consequence of low capture success for hybrid striped bass fingerlings of the 2001
stocking. As a result, due to the lack of hybrid striped bass specimens, I did not compare
hybrid striped bass versus striped bass for the 2001-2002 sampling season.
First-Year Growth
2001. – Age-0 striped bass increased consistently in length and weight over the
2001 growing season (Figure 4). Length and weight distributions were relatively uniform
at the time of stocking, with ranges of 31-57 mm TL (mean = 41 mm TL and SE ± 0.47)
and 0.33-2.25 g (mean = 0.86 g and SE ± 0.03) (Table 5). Length distributions remained
fairly uniform in July, with lengths ranging from 37-94 mm TL (mean = 120 mm TL and
SE ± 1.73). However, by August, total lengths began to become more variable (range of
119 mm TL, mean = 146 mm TL, and SE ± 2.49) and ranges in total length distribution
remained highly uneven throughout the growing season (September: range = 117 mm,
35

Figure 4. Temporal patterns of first-year increase in total length (mm) and wet weight (g) for juvenile striped bass over the 2001 growing season in Claytor Lake. Mean total length and mean body weight are represented by solid lines, and 95% confidence intervals are represented by dashed lines.
0
50
100
150
200
250
Tota
l Len
gth
(mm
)
0
50
100
150
Jun Jul Aug Sep Oct Nov Dec
Month
Wet
Wei
ght (
g)
36
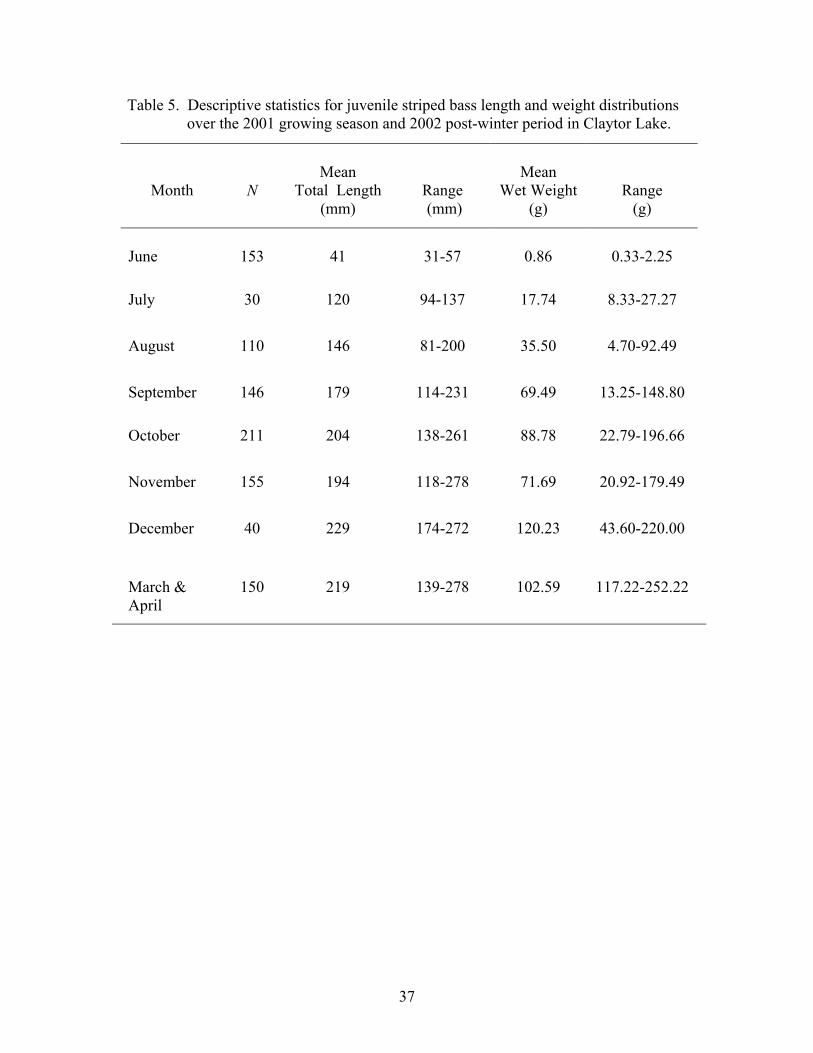
Table 5. Descriptive statistics for juvenile striped bass length and weight distributions over the 2001 growing season and 2002 post-winter period in Claytor Lake.
Month
N
Mean
Total Length (mm)
Range (mm)
Mean
Wet Weight (g)
Range (g)
June 153 41 31-57 0.86 0.33-2.25
July 30 120 94-137 17.74 8.33-27.27
August 110 146 81-200 35.50 4.70-92.49
September 146 179 114-231 69.49 13.25-148.80
October 211 204 138-261 88.78 22.79-196.66
November 155 194 118-278 71.69 20.92-179.49
December 40 229 174-272 120.23 43.60-220.00
March & April
150 219 139-278 102.59 117.22-252.22
37

mean = 179 mm TL, and SE ± 2.26; October: range =123 mm, mean = 204 mm TL, and
SE ± 1.92; and November: range = 160 mm, mean = 194 mm TL, and SE ± 2.30).
Weight varied more widely, but also increased in range over the growing season (August:
range = 87 g, mean = 35.51 g, and SE ± 1.92; September: range = 136 g, mean = 63.49 g,
and SE ± 2.47; October: range = 174 g, mean = 88.78 g, and SE ± 2.65; and November:
159 g, mean = 71.69, and SE ± 2.49). Although distributions were variable, juvenile
striped bass displayed a linear growth rate from the date of stocking until October, when
the growth rate became asymptotic (Figure 4). During the period of linear growth (June
to October) juvenile striped bass total lengths increased by 1.10 mm/day. By the final
month of the growing season, juvenile striped bass ranged from 174-278 mm TL (mean =
229 mm TL and SE ± 4.31) and 43.60-220.00 g (mean = 120.23 g and SE ± 7.93).
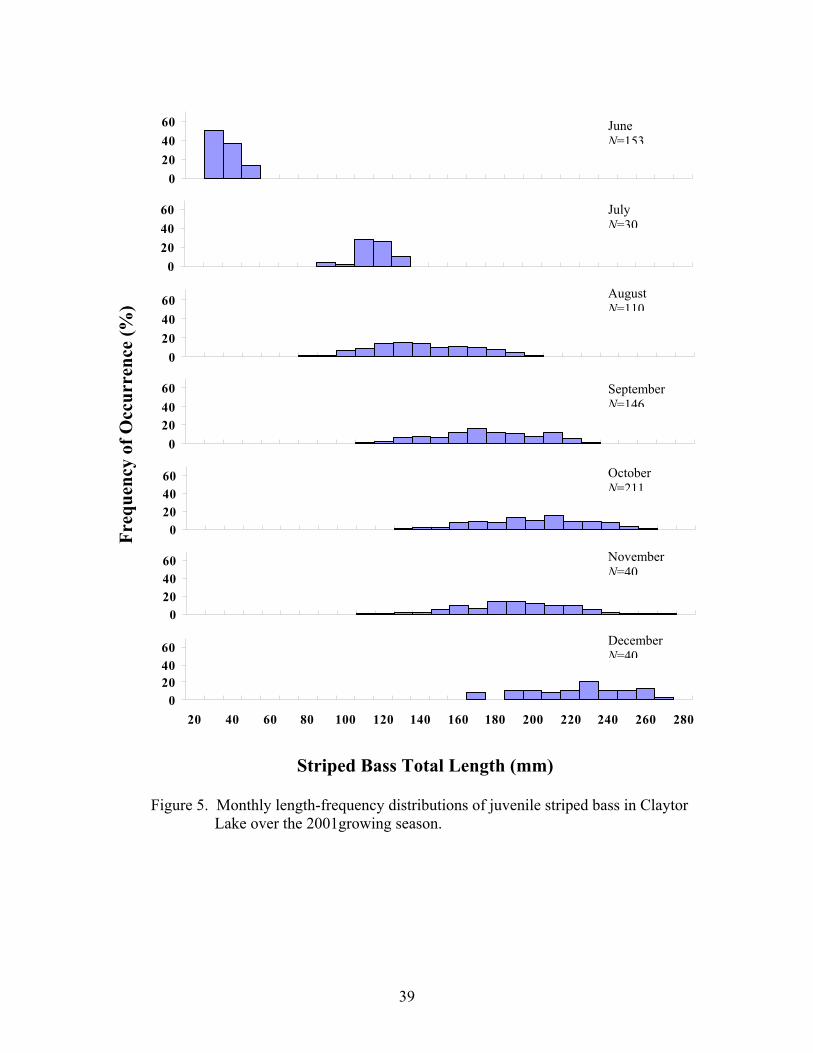
However, unlike the juvenile striped bass observed in Smith Mountain Lake,
Virginia, by Sutton (1997), age-0 striped bass in Claytor Lake did not demonstrate
significant divergence in size through the progression of the growing season (Figure 5).
By the end of the growing season, Sutton (1997) observed two distinct size modes of fish,
with mean total lengths of the small and large modes to be approximately 100 and 226
mm TL, respectively.
2002. – Both juvenile moronids experienced growth patterns during the 2002
growing season similar to those for striped bass in the 2001growing season (Figure 6).
The initial ranges of distributions for fingerling striped bass and fingerling hybrid striped
bass at the time of stocking were, 33-49 mm TL (mean = 41 mm TL and SE ± 1.06) and
0.35-1.04 g (mean = 0.65 and SE ± 0.05) and 64-125 mm TL (mean = 96 mm TL and SE
± 1.47) and 3.21-16.80 g (mean = 10.77 g and SE ± 0.45), respectively (Table 6).
38
Freq
uenc
y of
Occ
urre
nce
(%)
Striped Bass Total Length (mm)
Figure 5. Monthly length-frequency distributions of juvenile striped b Lake over the 2001growing season.
0204060
0204060
0204060
0204060
0204060
0204060
20 40 60 80 100 120 140 160 180 200 220 2
0204060
39
DecemberN=40
NovemberN=40
OctoberN=211
SeptemberN=146
August N=110
July N=30
June N=153
ass in Claytor
40 260 280
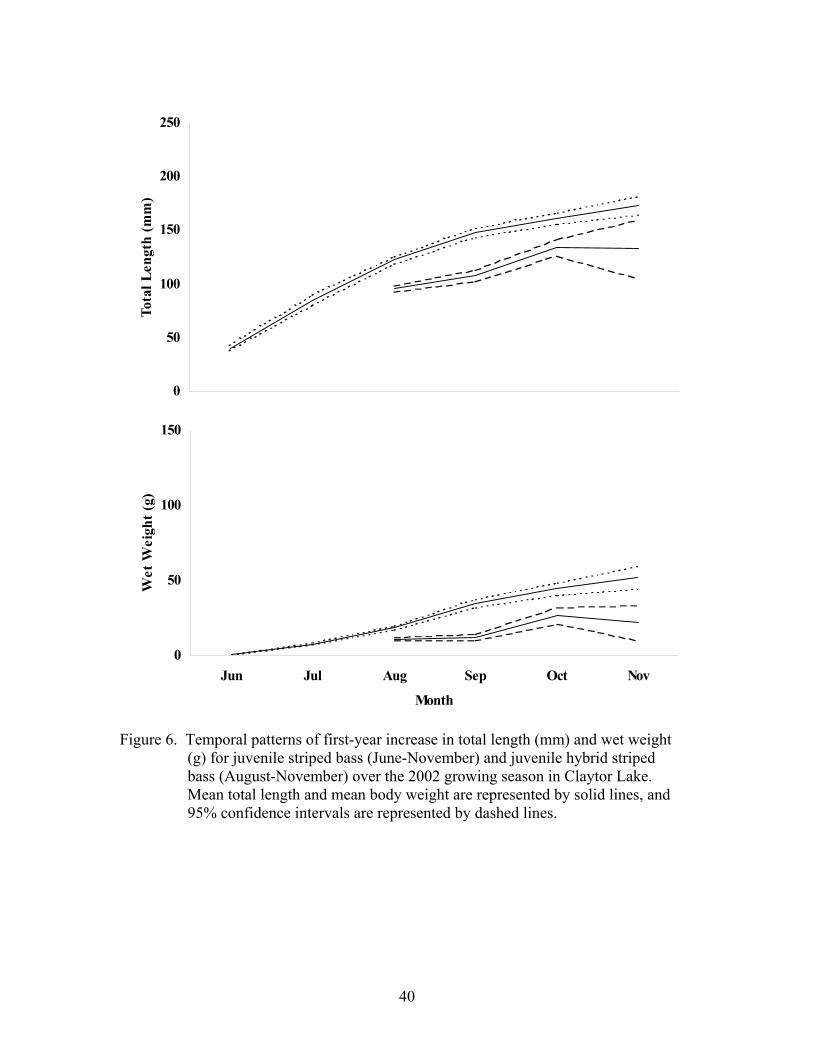
Figure 6. Temporal patterns of first-year increase in total length (mm) and wet weight (g) for juvenile striped bass (June-November) and juvenile hybrid striped bass (August-November) over the 2002 growing season in Claytor Lake. Mean total length and mean body weight are represented by solid lines, and 95% confidence intervals are represented by dashed lines.
0
50
100
150
200
250
Tota
l Len
gth
(mm
)
0
50
100
150
Jun Jul Aug Sep Oct Nov
Month
Wet
Wei
ght (
g)
40
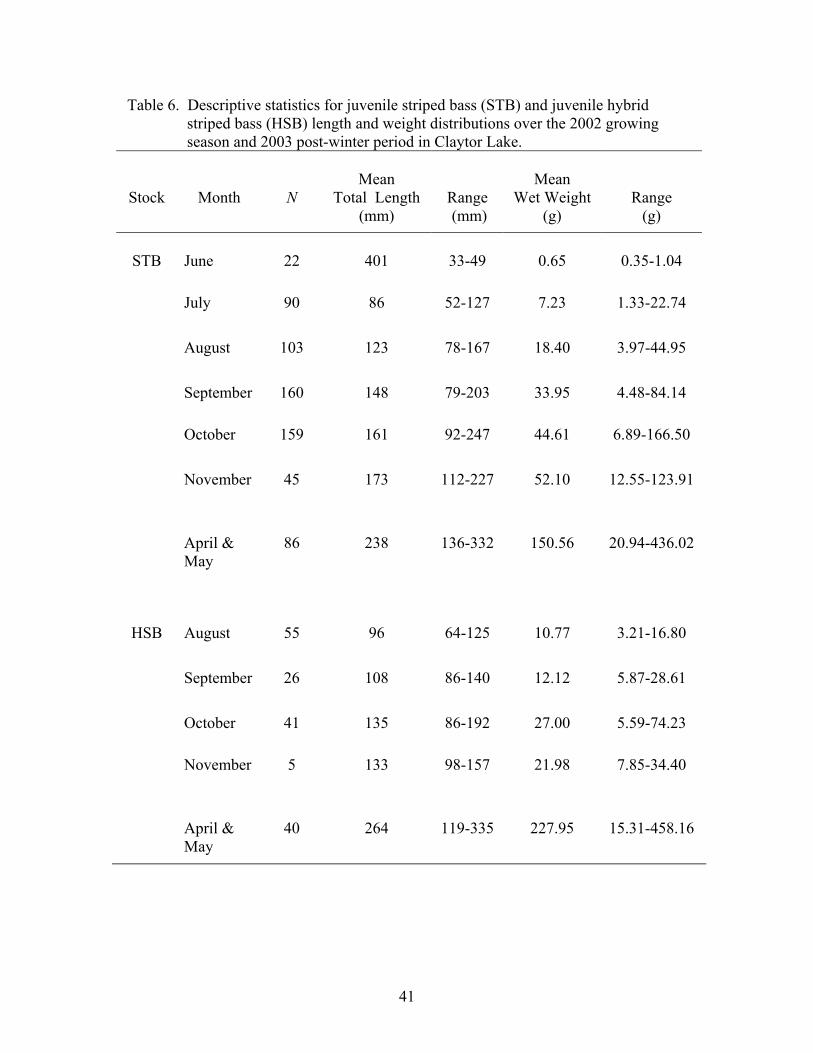
Table 6. Descriptive statistics for juvenile striped bass (STB) and juvenile hybrid striped bass (HSB) length and weight distributions over the 2002 growing season and 2003 post-winter period in Claytor Lake.
Stock
Month
N
Mean
Total Length (mm)
Range (mm)
Mean
Wet Weight (g)
Range (g)
STB June 22 401 33-49 0.65 0.35-1.04
July 90 86 52-127 7.23 1.33-22.74
August 103 123 78-167 18.40 3.97-44.95
September 160 148 79-203 33.95 4.48-84.14
October 161 92-247 44.61 6.89-166.50
November 45 173 112-227 52.10 12.55-123.91
April &
May 86 238 136-332 150.56 20.94-436.02
HSB August 55 96 64-125 10.77 3.21-16.80
September 26 108 86-140 12.12 5.87-28.61
October 41 135 86-192 27.00 5.59-74.23
November 5 133 98-157 21.98 7.85-34.40
April &
May 40 264 119-335 227.95 15.31-458.16
159
41

Variability in monthly length and weight distributions increased throughout the
growing season for both striped bass and hybrid striped bass. By October, striped bass
and hybrid striped bass lengths exhibited a range of 155 (mean = 162 mm TL and SE ±
2.57) and 106 mm TL (mean = 135 mm TL and SE ± 3.79), respectively, and the range in
weight was 160 (mean = 45 g and SE ± 2.17) and 69 g (mean = 27 g and SE ± 2.74), for
striped bass and hybrid striped bass, respectively.
Also, as seen in 2001, juvenile Morone exhibited a linear growth rate from the
month of stocking until October, at which time the growth rate began to plateau (Figure
6). For striped bass, the linear growth from June to October was characterized by a
growth rate of 0.81 mm/day, and by November, juvenile striped bass length and weight
exhibited a range of 155 mm (mean = 173 mm TL and SE ± 4.45) and 111 g (mean =
52.10 g and SE ± 3.88), respectively. Juvenile hybrid striped bass during the period of
linear growth (August to October) grew at a rate of approximately 0.52 mm/day, and by
November, juvenile hybrid striped bass displayed a range of 59 mm (mean = 133 mm TL
SE ± 13.49) and 27 g (mean = 21.98 g and SE ± 5.96), respectively. Juvenile striped bass
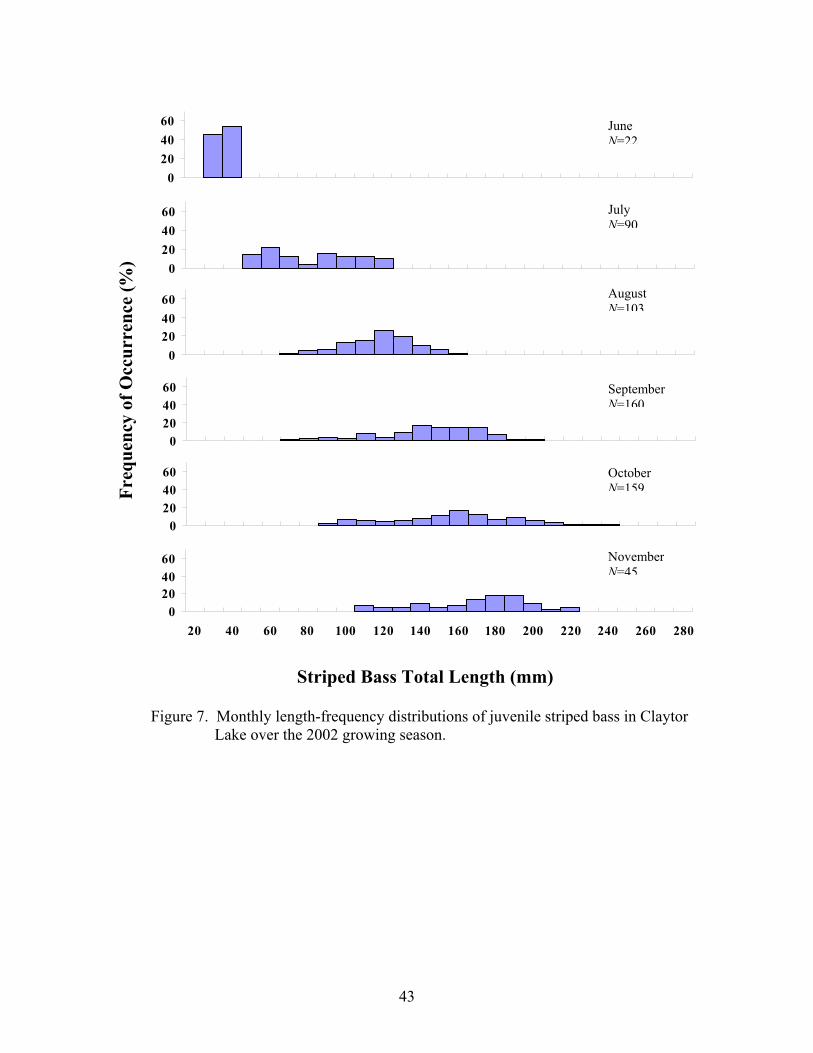
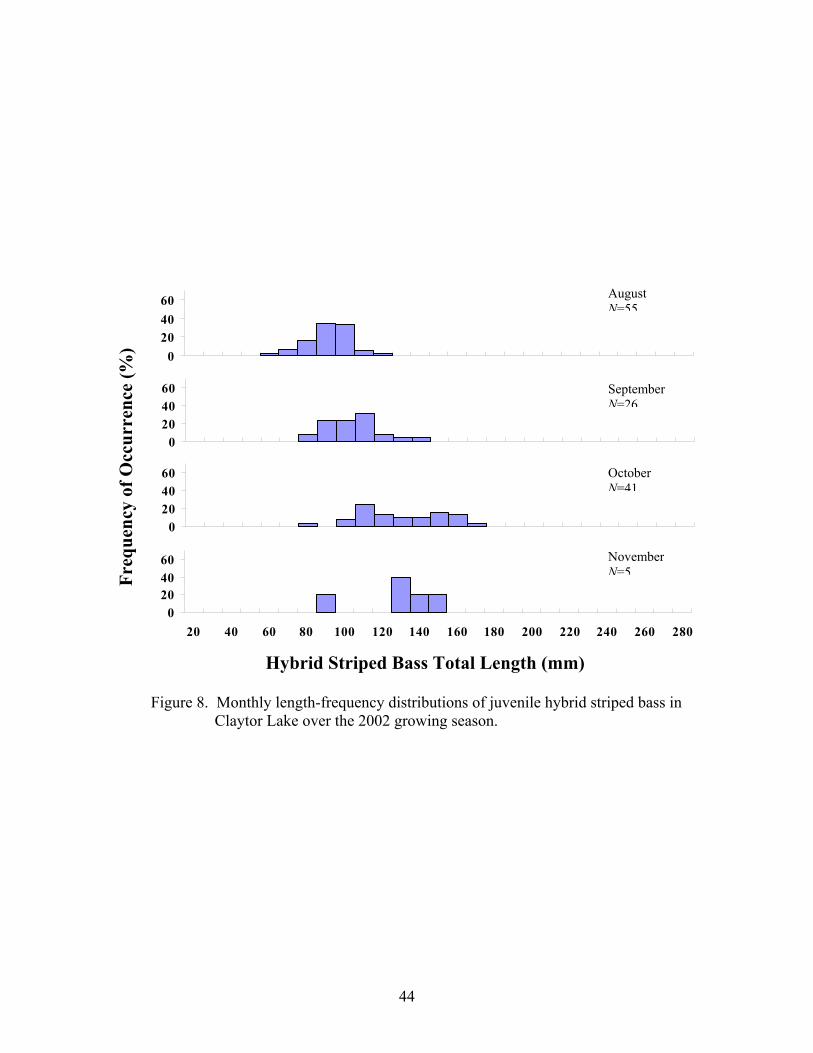
and juvenile hybrid striped bass did not present a clear bimodal size distribution late in
the 2002 growing season (Figures 7 and 8, respectively).
There was no significant difference between total lengths of striped bass
fingerlings stocked in 2001 and 2002 (ANOVA, F = 0.18, df = 173, P = 0.673).
However, the mean total length of 2002 hybrid striped bass fingerlings at stocking was
significantly greater (40%) than mean total lengths of 2001 hybrid striped bass
fingerlings (ANOVA, F = 426.24, df = 128, P < 0.001).
42
Freq
uenc
y of
Occ
urre
nce
(%)
Striped Bass Total Length (mm)
Figure 7. Monthly length-frequency distributions of juvenile striped b Lake over the 2002 growing season.
0204060
0204060
0204060
0204060
0204060
20 40 60 80 100 120 140 160 180 200 220 2
0204060
43
NovemberN=45
OctoberN=159
SeptemberN=160
August N=103
July N=90
June N=22
ass in Claytor
40 260 280
Fre
quen
cy o
f Occ
urre
nce
(%)
Hybrid Striped Bass Total Length (mm)
Figure 8. Monthly length-frequency distributions of juvenile hybrid striped bass in Claytor Lake over the 2002 growing season.
0204060
0204060
0204060
0204060
20 40 60 80 100 120 140 160 180 200 220 240 260 280
August N=55
September N=26
October N=41
November N=5
44
Although there was not a significant difference between initial total lengths of
striped bass in 2001 and 2002, and fish exhibited the same growth pattern (linear until
October), mean total lengths of 2001 striped bass were significantly greater than mean
total lengths of 2002 fingerlings at the same times during the growing season (July
40%: ANOVA, F = 62.16, df = 118, P < 0.001; August 18%: ANOVA, F =57.47, df =
211, P < 0.001; September 21%: ANOVA, F = 99.23, df = 304, P < 0.001; October 26%:
ANOVA, F = 177.73, df = 368, P < 0.001; November 12%: ANOVA, F = 18.02, df =
198, P < 0.001).
To compare total lengths attained by the end of the growing season, individuals in
the final months of the growing season (October and November) were pooled for both
striped bass and hybrid striped bass. At the end of the growing season striped bass mean
total lengths were 22% greater than hybrid striped bass mean total lengths (ANOVA, F =
34.11, df = 248, P < 0.001). Total lengths of individuals captured in spring are reviewed
in the following section (see Post-Winter Survival).
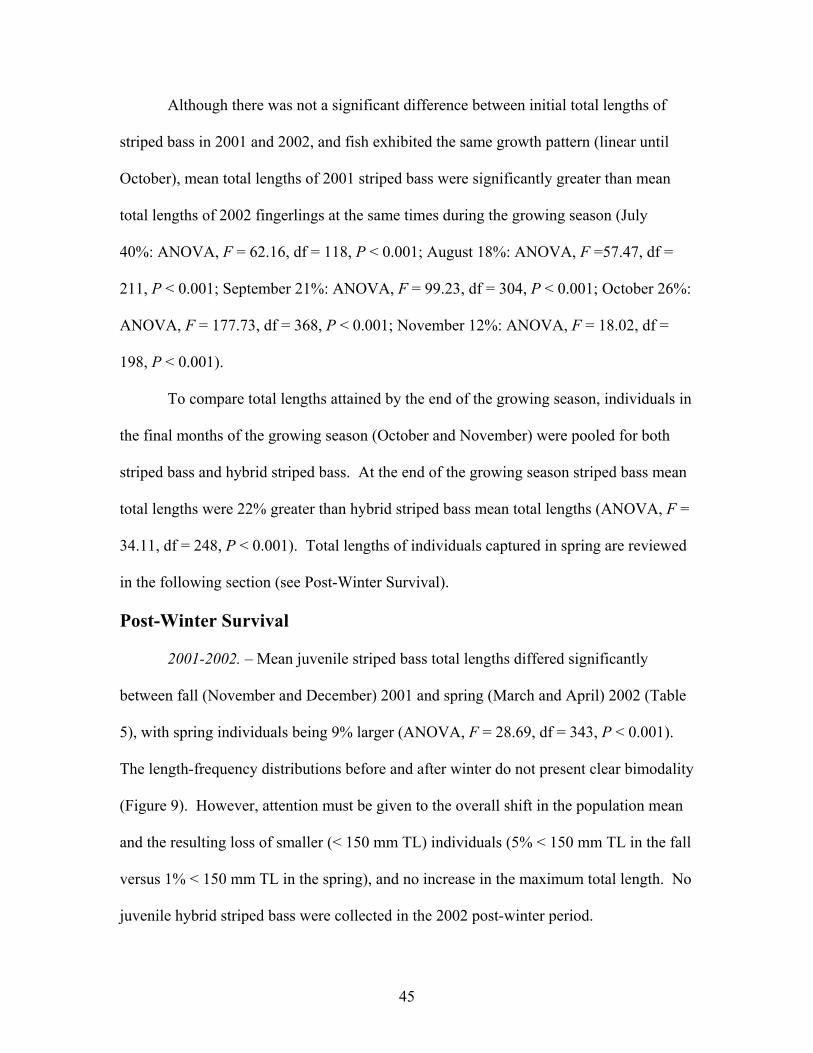
Post-Winter Survival 2001-2002. – Mean juvenile striped bass total lengths differed significantly
between fall (November and December) 2001 and spring (March and April) 2002 (Table
5), with spring individuals being 9% larger (ANOVA, F = 28.69, df = 343, P < 0.001).
The length-frequency distributions before and after winter do not present clear bimodality
(Figure 9). However, attention must be given to the overall shift in the population mean
and the resulting loss of smaller (< 150 mm TL) individuals (5% < 150 mm TL in the fall
versus 1% < 150 mm TL in the spring), and no increase in the maximum total length. No
juvenile hybrid striped bass were collected in the 2002 post-winter period.
45
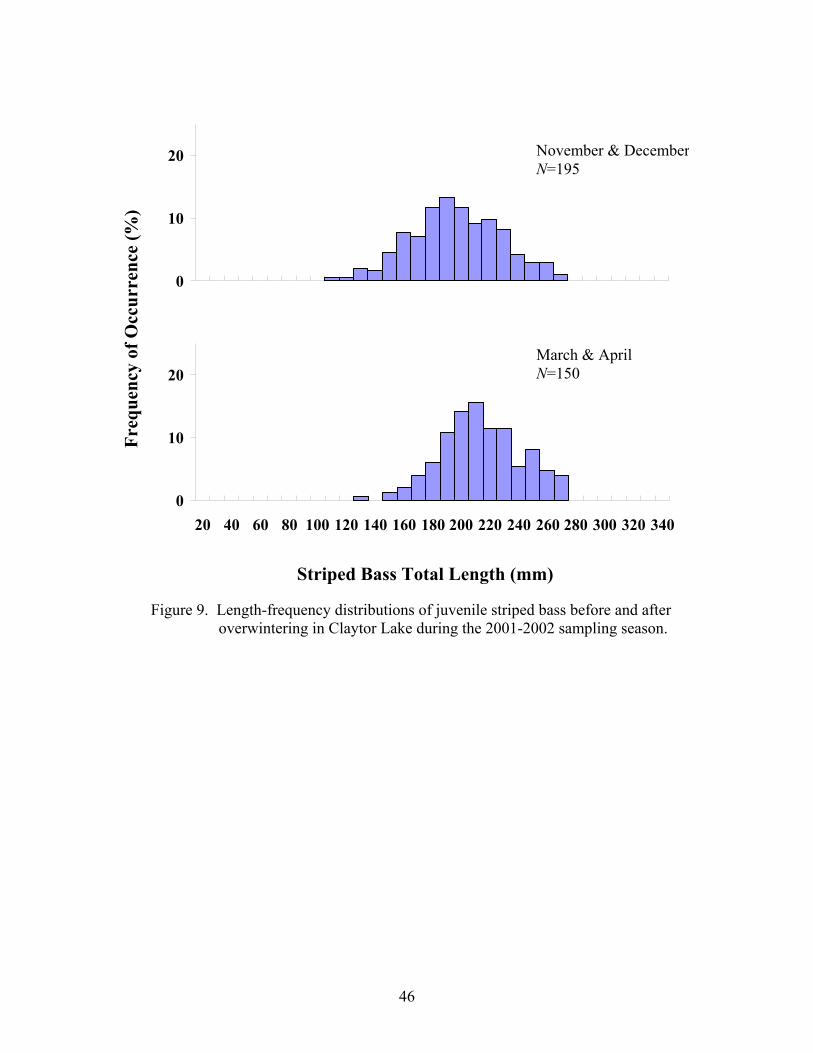
Freq
uenc
y of
Occ
urre
nce
(%)
Striped Bass Total Length (mm)
Figure 9. Length-frequency distributions of juvenile striped bass before and after overwintering in Claytor Lake during the 2001-2002 sampling season.
0
10
20
0
10
20
20 40 60 80 100 120 140 160 180 200 220 240 260 280 300 320 340
March & April N=150
November & DecemberN=195
46
2002-2003. – Age-0 striped bass mean total lengths differed significantly between
fall (October and November) 2002 and spring (Table 6), with striped bass mean total
lengths being 45% larger in spring (ANOVA, F = 263.87, df = 288, P < 0.001), coupled
with an 105 mm increase in the maximum length. Juvenile striped bass failed to display
a bimodal size distribution before the winter (Figure 10), but once more, striped bass did
exhibit a shift to larger-mode individuals in the spring distribution (32% < 150 mm TL in
the fall versus 1% < 150 mm TL in the spring).
Juvenile hybrid striped bass also had significantly different mean total lengths
between fall 2002 and spring 2003 periods (Table 6), with mean total length of spring
individuals being 97% larger (ANOVA, F = 236.78, df = 84, P < 0.001). Again, it is
difficult to detect the presence of bimodality upon visual observation of the length-
frequency distribution for hybrid striped bass (Figure 11). In late fall, 70% of hybrid
striped bass collected were less than 150 mm TL versus only 5% in the spring (Figure
11). Thus, I observed a substantial upward shift in size distribution for hybrid striped
bass following the overwinter period.
Given the violation of Sutton’s (1997) method for inferring overwinter mortality
(an increase in the mean, but not the maximum length), the increases in total length for
both striped bass and hybrid striped bass in the spring of 2003 are likely due to factors
other than the overwinter mortality of small individuals. First, consideration should be
given to the inefficiency of sampling techniques to representatively capture larger
individuals that may have been present in the fall. Second, individuals could have grown
over the winter months. Finally, individuals may have grown during the spring period
before becoming susceptible to capture. I consider these possible explanations in the
47
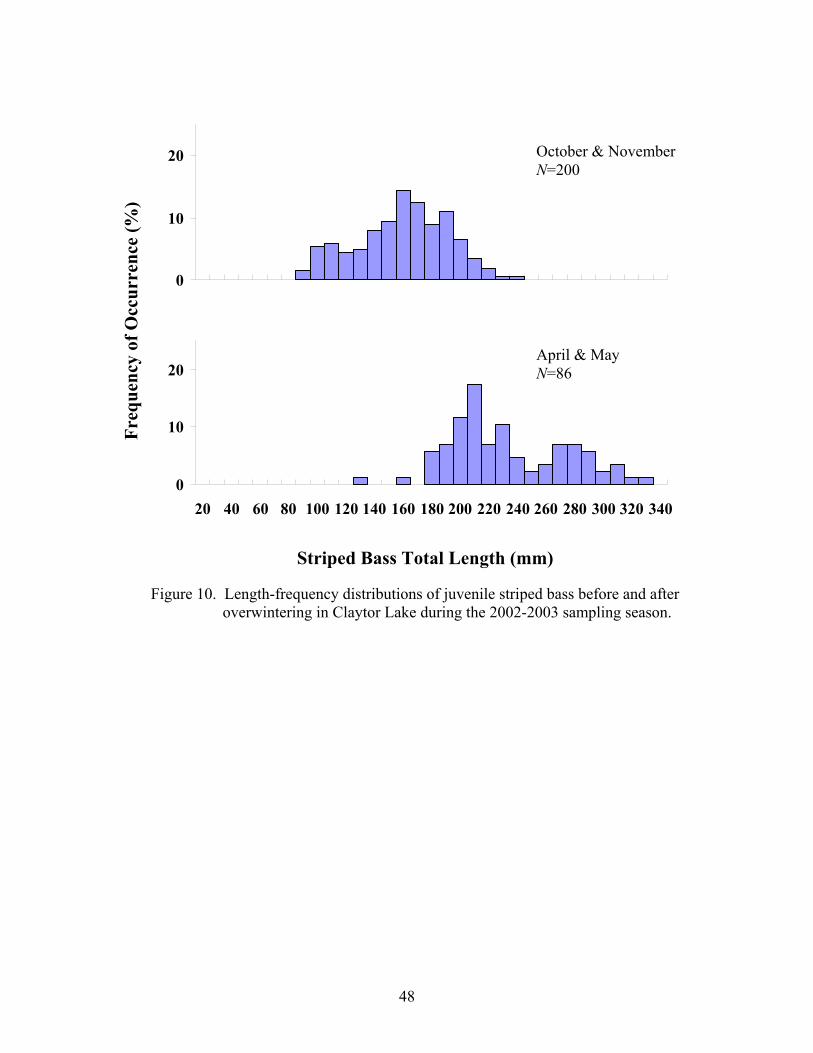
Freq
uenc
y of
Occ
urre
nce
(%)
Striped Bass Total Length (mm)
Figure 10. Length-frequency distributions of juvenile striped bass before and after overwintering in Claytor Lake during the 2002-2003 sampling season.
0
10
20
20 40 60 80 100 120 140 160 180 200 220 240 260 280 300 320 340
0
10
20
April & May N=86
October & November N=200
48
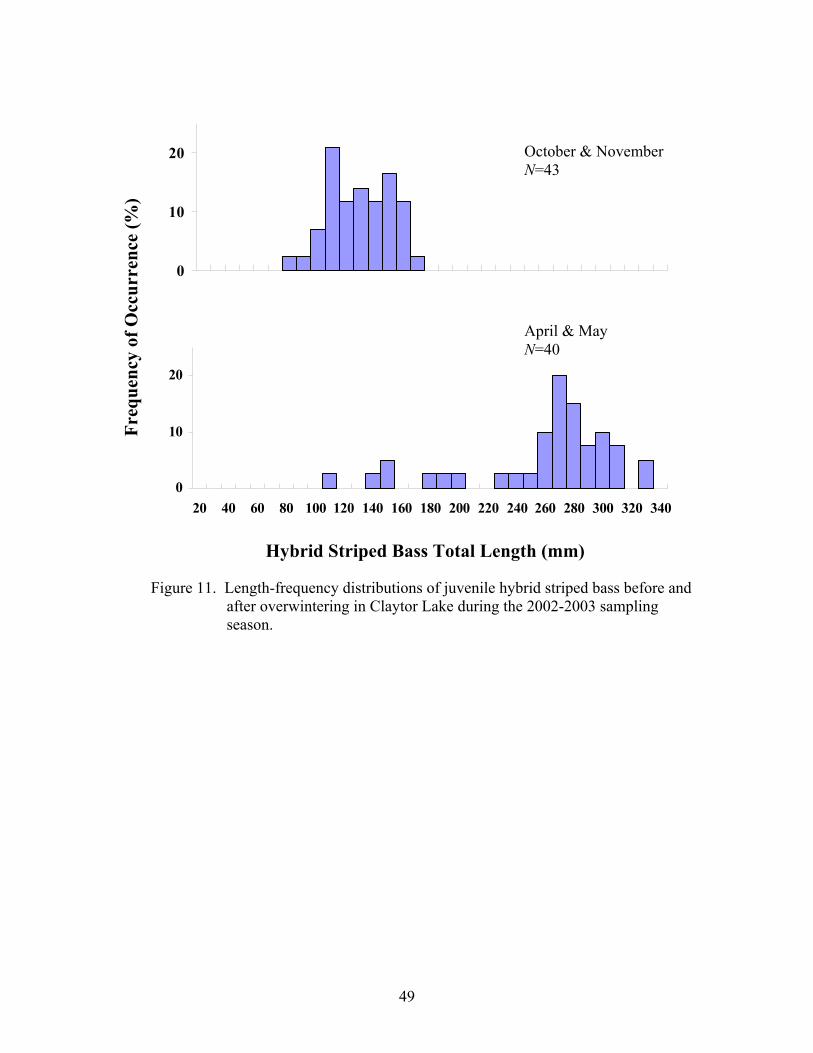
Freq
uenc
y of
Occ
urre
nce
(%)
Hybrid Striped Bass Total Length (mm)
Figure 11. Length-frequency distributions of juvenile hybrid striped bass before and after overwintering in Claytor Lake during the 2002-2003 sampling season.
0
10
20
0
10
20
20 40 60 80 100 120 140 160 180 200 220 240 260 280 300 320 340
April & May N=40
October & November N=43
49
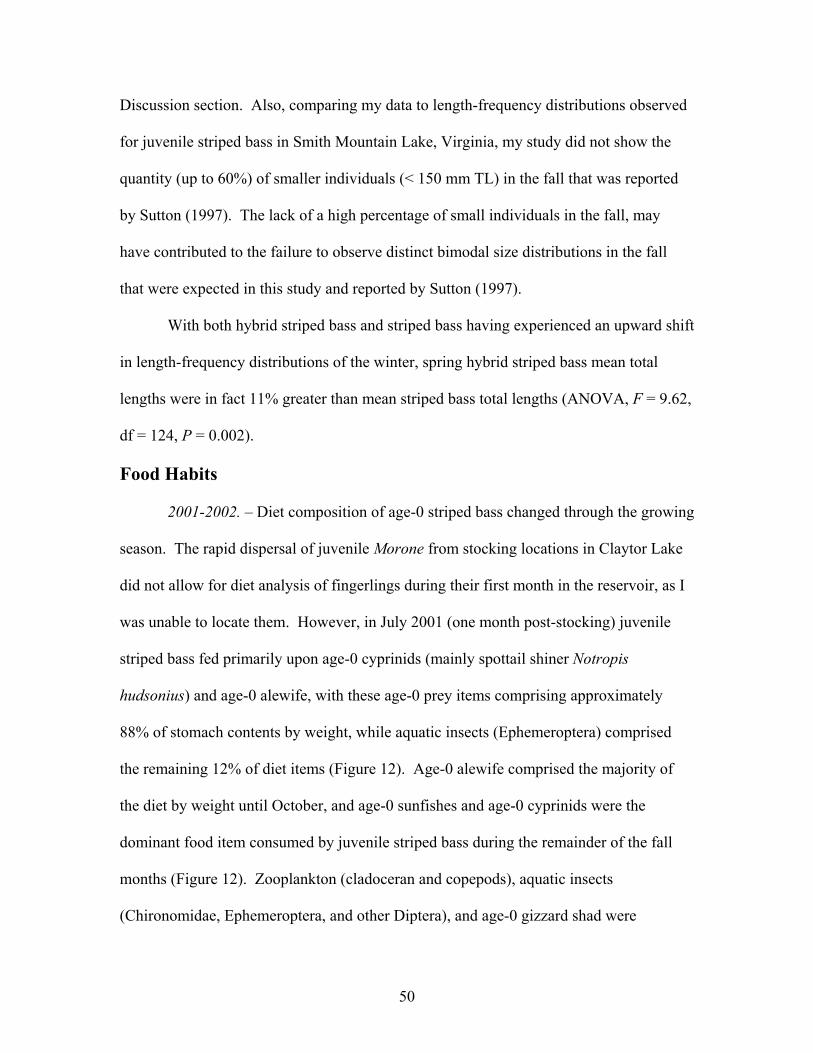
Discussion section. Also, comparing my data to length-frequency distributions observed
for juvenile striped bass in Smith Mountain Lake, Virginia, my study did not show the
quantity (up to 60%) of smaller individuals (< 150 mm TL) in the fall that was reported
by Sutton (1997). The lack of a high percentage of small individuals in the fall, may
have contributed to the failure to observe distinct bimodal size distributions in the fall
that were expected in this study and reported by Sutton (1997).
With both hybrid striped bass and striped bass having experienced an upward shift
in length-frequency distributions of the winter, spring hybrid striped bass mean total
lengths were in fact 11% greater than mean striped bass total lengths (ANOVA, F = 9.62,
df = 124, P = 0.002).
Food Habits
2001-2002. – Diet composition of age-0 striped bass changed through the growing
season. The rapid dispersal of juvenile Morone from stocking locations in Claytor Lake
did not allow for diet analysis of fingerlings during their first month in the reservoir, as I
was unable to locate them. However, in July 2001 (one month post-stocking) juvenile
striped bass fed primarily upon age-0 cyprinids (mainly spottail shiner Notropis
hudsonius) and age-0 alewife, with these age-0 prey items comprising approximately
88% of stomach contents by weight, while aquatic insects (Ephemeroptera) comprised
the remaining 12% of diet items (Figure 12). Age-0 alewife comprised the majority of
the diet by weight until October, and age-0 sunfishes and age-0 cyprinids were the
dominant food item consumed by juvenile striped bass during the remainder of the fall
months (Figure 12). Zooplankton (cladoceran and copepods), aquatic insects
(Chironomidae, Ephemeroptera, and other Diptera), and age-0 gizzard shad were
50
Perc
ent o
f Die
t by
Wei
ght
Figure 12. Temporal patterns in juvenile striped bass diet composition over the 2001 growing season in Claytor Lake.
0%
20%
40%
60%
80%
100%
Jul Aug Sep Oct Nov Dec
Month
Cladoceran Copepods ChironomidaeDecapoda Diptera EphemeropteraCyprinid Sunfish AlewifeGizzard Shad
51
infrequently consumed by juvenile striped bass during the 2001 growing season (Table
7). Also, 37% of juvenile striped bass collected had empty stomachs (Table 7).
Juvenile striped bass exhibited a size-dependent shift in food habits over the 2001
growing season, but were piscivorous at all sizes, from 110 to 260 mm TL (Figure 13).
Stomach contents of individuals greater than 120 mm TL contained progressively
increasing percentages of age-0 fishes, mainly cyprinids, sunfishes, and alewife (Figure
13). Individuals greater than 240 mm TL relied on diets composed almost entirely of
age-0 alewife (Figure 13).
During the 2002 post-winter period individuals less than 180 mm TL maintained a
mixed diet composed of approximately 50% age-0 fishes and 50% zooplankton and
aquatic insects (Figure 14). Individuals up to 220 mm TL had small percentages of
zooplankton and aquatic insects as well, and individuals 230 mm TL and greater were
100% piscivorous, with age-0 alewife serving as the dominant food item.
2002-2003. – As in the 2001-2002 sampling season, the rapid dispersal of
fingerling Morone from stocking locations did not allow for the analysis of striped bass
diets immediately following stocking. However, in July 2001 (one month post-stocking)
juvenile striped bass (95 to 127 mm TL) fed primarily upon age-0 alewife (approximately
69% of diet content by weight), with the remaining diet items consisting of a mixture of
age-0 sunfishes, age-0 cyprinids, cladocerans and chironomids (Figure 15). During the
course of the growing season, Ephemeroptera and other Diptera larvae were infrequently
consumed by juvenile striped bass (Table 7). Approximately one-third of striped bass
and hybrid striped bass lacked stomach contents, respectively (Table 7).
52
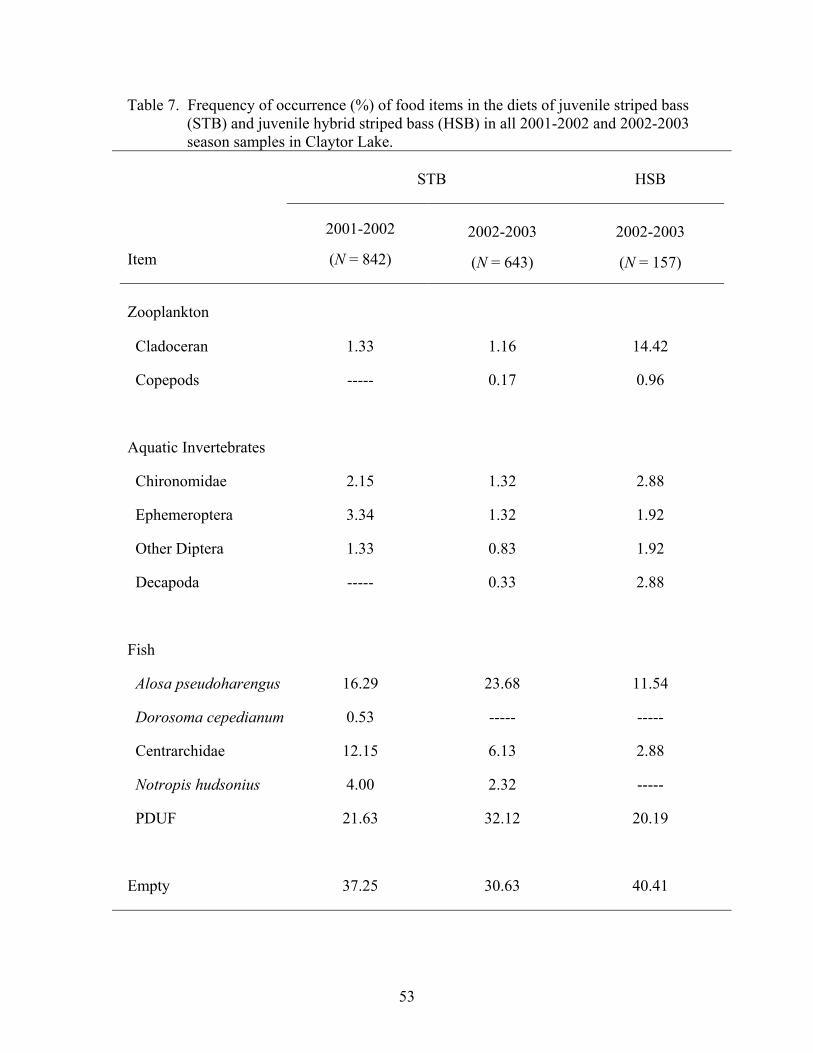
Table 7. Frequency of occurrence (%) of food items in the diets of juvenile striped bass (STB) and juvenile hybrid striped bass (HSB) in all 2001-2002 and 2002-2003 season samples in Claytor Lake.
STB HSB
Item
2001-2002
(N = 842)
2002-2003
(N = 643)
2002-2003
(N = 157)
Zooplankton
Cladoceran 1.33 1.16 14.42
Copepods ----- 0.17 0.96
Aquatic Invertebrates
Chironomidae 2.15 1.32 2.88
Ephemeroptera 3.34 1.32 1.92
Other Diptera 1.33 0.83 1.92
Decapoda ----- 0.33 2.88
Fish
Alosa pseudoharengus 16.29 23.68 11.54
Dorosoma cepedianum 0.53 ----- -----
Centrarchidae 12.15 6.13 2.88
Notropis hudsonius 4.00 2.32 -----
PDUF 21.63 32.12 20.19
Empty 37.25 30.63 40.41
53

Perc
ent o
f Die
t by
Wei
ght
Figure 13. Size-dependent patterns in juvenile striped bass diet composition over the 2001 growing season in Claytor Lake.
0%
20%
40%
60%
80%
100%
80 100 120 140 160 180 200 220 240 260 280
Total Length (mm)
Cladoceran Copepods ChironomidaeDecapoda Diptera EphemeropteraCyprinid Sunfish AlewifeGizzard Shad
54
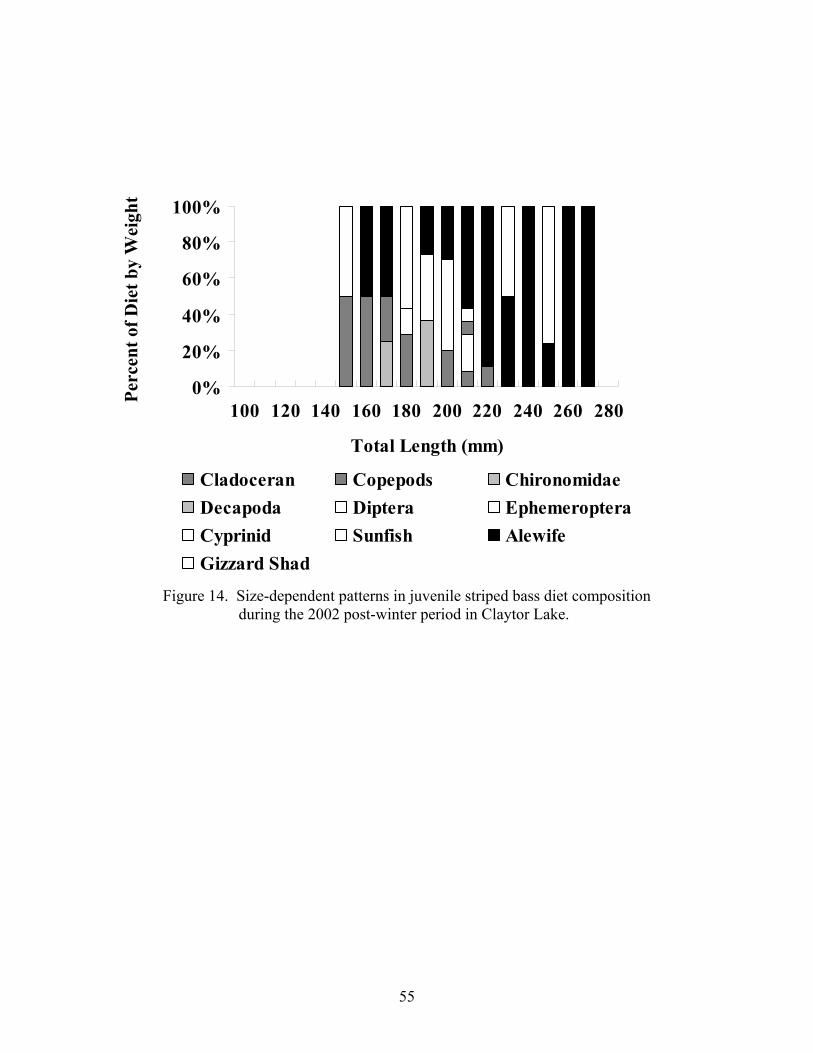
P
erce
nt o
f Die
t by
Wei
ght
Figure 14. Size-dependent patterns in juvenile striped bass diet composition during the 2002 post-winter period in Claytor Lake.
0%
20%
40%
60%
80%
100%
100 120 140 160 180 200 220 240 260 280
Total Length (mm)
Cladoceran Copepods ChironomidaeDecapoda Diptera EphemeropteraCyprinid Sunfish AlewifeGizzard Shad
55

Pe
rcen
t of D
iet b
y W
eigh
t
Figure 15. Temporal patterns in juvenile striped bass and juvenile hybrid striped bass diet composition over the 2002 growing season in Claytor Lake.
Striped Bass
0%
20%
40%
60%
80%
100%
Hybrid Striped Bass
0%
20%
40%
60%
80%
100%
Jul Aug Sep Oct Nov
Month
Cladoceran Copepods ChironomidaeDecapoda Diptera EphemeropteraCyprinid Sunfish Alewife
56
As in 2001, striped bass during the 2002 growing season exhibited a size-
dependent shift in food habits (Figure 16). Individuals in the 80-mm TL size class
consumed 100.0% cladocerans, while all size classes 90 mm TL or greater were at
leastpartially piscivorous (Figure 16). At approximately 120 mm TL and greater, age-0
fishes became the principal diet item for juvenile striped bass, with age-0 alewife
comprising the largest percentage of stomach contents (Figure 16).
Unlike juvenile striped bass during the 2001 and 2002 growing seasons, hybrid
striped bass in 2002 contained no alewives (Figure 15). During the fall months, hybrid
striped bass consumed a mixture of cladocerans, Chironomidae, Ephemeroptera, and
other Diptera, as well as age-0 sunfish (Figure 15). It should be noted that the high
percentage (100%) of age-0 sunfish in the hybrid striped bass diet in August might be an
artifact of small sample size; only one specimen (125 mm TL) of the five captured in
August had food in its stomach.
Juvenile hybrid striped bass exhibited a size-dependent shift in food habits over
the growing season (Figure 16) similar to that of striped bass in 2001 and 2002. Hybrid
striped shifted from a diet composed mainly of cladocerans, with infrequent amounts of
Chironomidae and Ephemeroptera, to piscivory at approximately 120 mm TL (Figure
16). Following the shift to piscivory, individuals greater than 120 mm TL had 100% of
stomach content by weight comprised of age-0 sunfish (Figure 16).
During spring 2003, age-0 alewife, age-0 sunfish, and decapoda comprised 100%
of the diet by weight for juvenile striped bass (Figure 17). While 140 mm TL hybrid
striped bass ate cladocerans, the larger size classes consumed age-0 alewife and/or
crayfish (Figure 17). Age-0 alewife constituted the largest percent contribution by
57
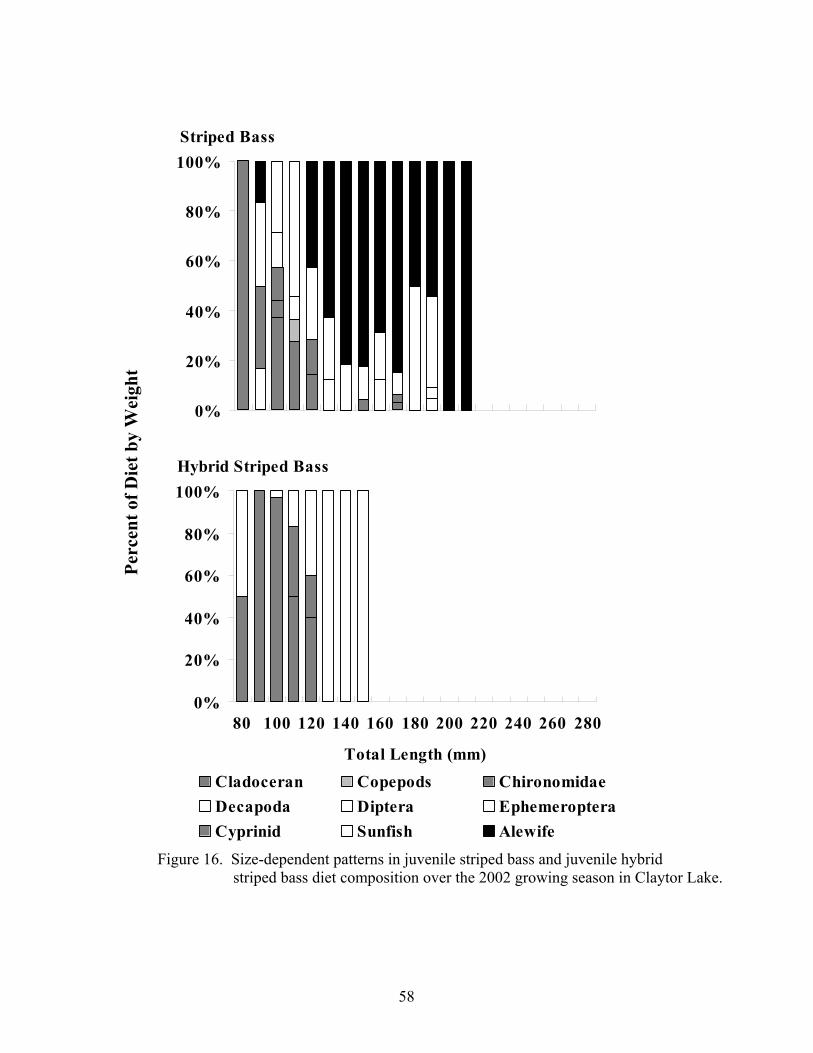
Perc
ent o
f Die
t by
Wei
ght
Figure 16. Size-dependent patterns in juvenile striped bass and juvenile hybrid striped bass diet composition over the 2002 growing season in Claytor Lake.
Striped Bass
0%
20%
40%
60%
80%
100%
Hybrid Striped Bass
0%
20%
40%
60%
80%
100%
80 100 120 140 160 180 200 220 240 260 280
Total Length (mm)Cladoceran Copepods ChironomidaeDecapoda Diptera EphemeropteraCyprinid Sunfish Alewife
58
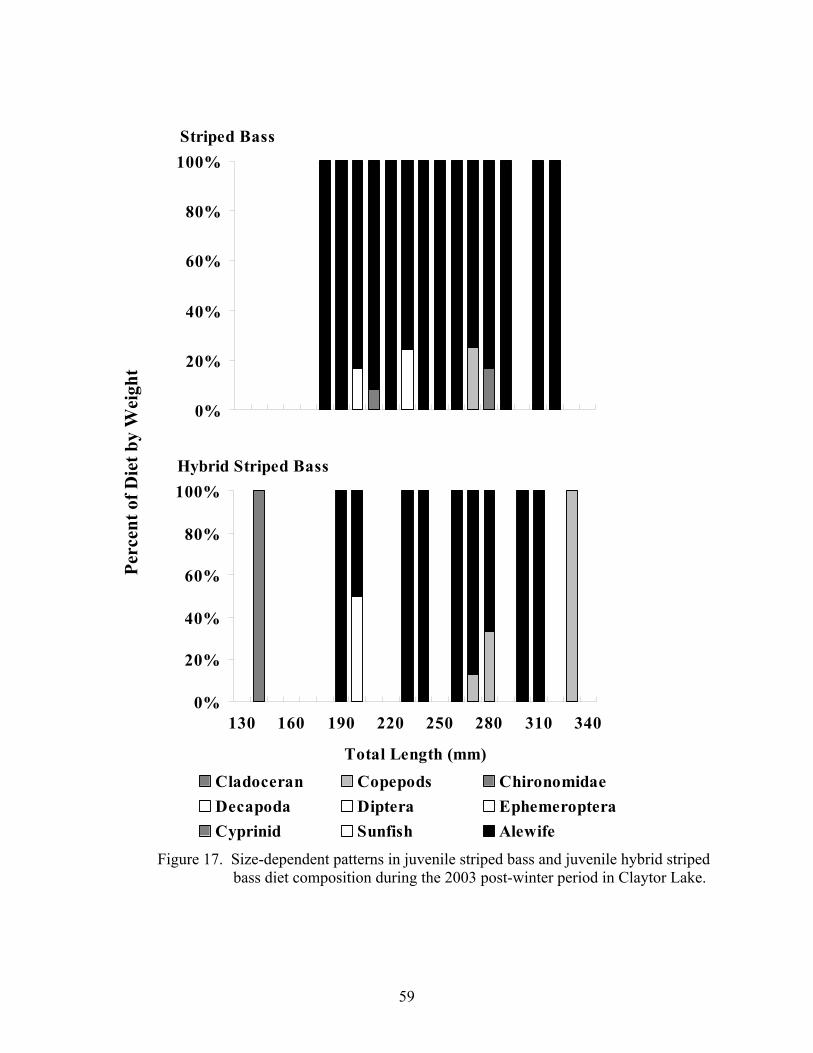
Perc
ent o
f Die
t by
Wei
ght
Figure 17. Size-dependent patterns in juvenile striped bass and juvenile hybrid striped bass diet composition during the 2003 post-winter period in Claytor Lake.
Striped Bass
0%
20%
40%
60%
80%
100%
Hybrid Striped Bass
0%
20%
40%
60%
80%
100%
130 160 190 220 250 280 310 340
Total Length (mm)Cladoceran Copepods ChironomidaeDecapoda Diptera EphemeropteraCyprinid Sunfish Alewife
59

weight for both striped bass and hybrid striped bass during the 2003 post-winter period
(Figure 17).
Diet Overlap
During the 2002 growing season, juvenile striped bass and juvenile hybrid striped
bass did not exhibit diet overlap values greater than 0.6 for any month (Table 8).
However, juvenile striped bass and juvenile hybrid striped bass did exhibit an overlap
value of 0.80 for the spring of 2003, when diets were predominately comprised of age-0
alewife (Table 8).
Diet overlap was calculated for age-0 striped bass and age-0 hybrid striped bass
over 10-mm TL size ranges by month of the growing season (Table 9). Although sample
sizes in these analyses were small, overlap values greater than 0.6 were calculated for 81-
90-mm TL and 91-100-mm TL classes for the month of September (Table 9). During
this period, a large portion of the diet was cladocerans, Chironomidae, and other Diptera.
Also, an overlap value of 1.00 was obtained for the 101-110-mm TL size class in the
month of October. Both striped bass and hybrid striped bass individuals within this size
range fed exclusively on cladocerans. During spring 2003, overlap values greater than
0.6 were obtained for all size classes present, except 281-290-mm TL. Age-0 alewife
were the principal food item for juvenile striped bass in the spring of 2003, but juvenile
hybrid striped bass in the 281-290-mm TL size range utilized more crayfish as prey
(Figure 17).
60
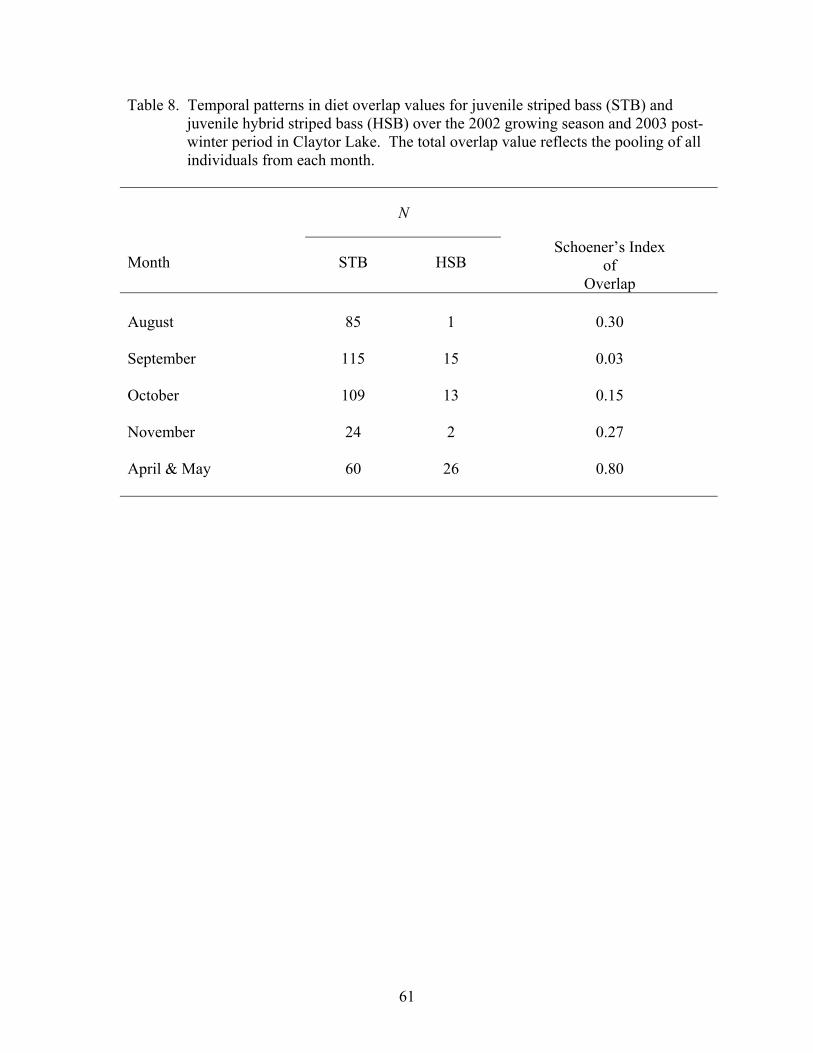
Table 8. Temporal patterns in diet overlap values for juvenile striped bass (STB) and juvenile hybrid striped bass (HSB) over the 2002 growing season and 2003 post- winter period in Claytor Lake. The total overlap value reflects the pooling of all individuals from each month.
N
Month
STB
HSB
Schoener’s Index of
Overlap August 85 1 0.30 September 115 15 0.03 October 109 13 0.15 November 24 2 0.27 April & May 60 26 0.80
61
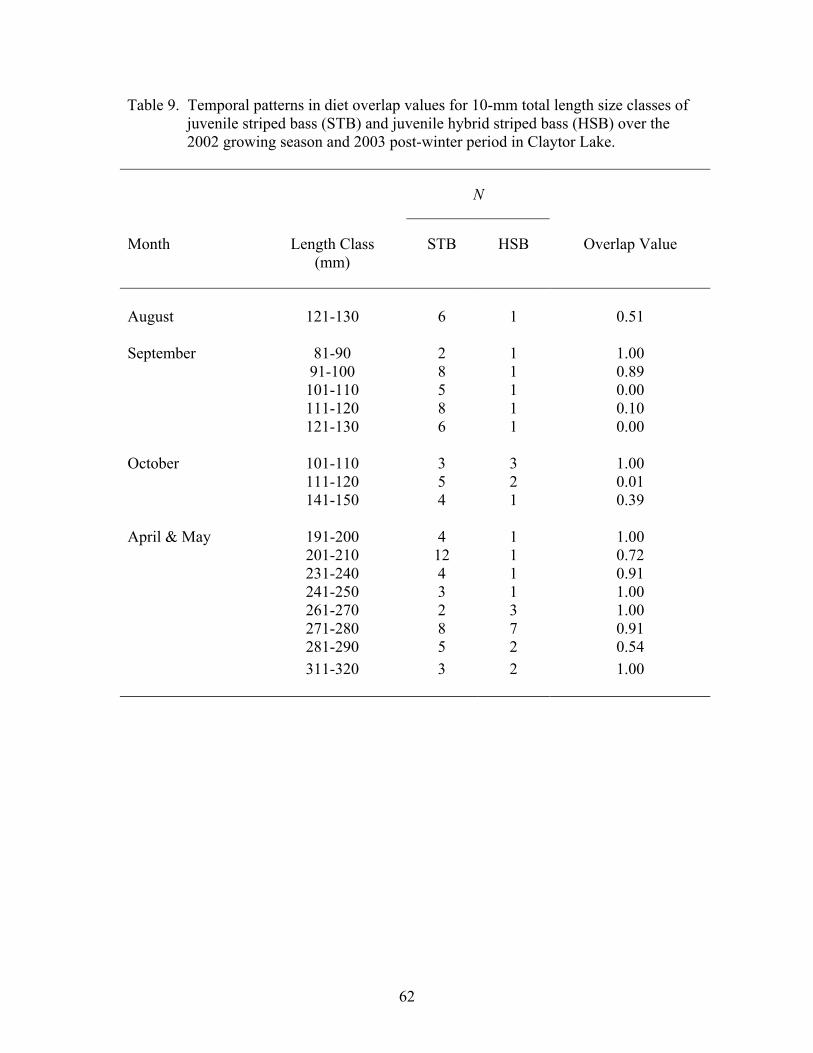
Table 9. Temporal patterns in diet overlap values for 10-mm total length size classes of juvenile striped bass (STB) and juvenile hybrid striped bass (HSB) over the 2002 growing season and 2003 post-winter period in Claytor Lake.
N
Month
Length Class
(mm)
STB
HSB
Overlap Value
August 121-130 6 1 0.51 September 81-90 2 1 1.00 91-100 8 1 0.89 101-110 5 1 0.00 111-120 8 1 0.10 121-130 6 1 0.00 October 101-110 3 3 1.00 111-120 5 2 0.01 141-150 4 1 0.39 April & May 191-200 4 1 1.00 201-210 12 1 0.72 231-240 4 1 0.91 241-250 3 1 1.00 261-270 2 3 1.00 271-280 8 7 0.91 281-290 5 2 0.54 311-320 3 2 1.00
62
Indices of Health
2001-2002. – During the 2001 growing season condition factor (K) (range 0.67-
1.40) and relative weight (range 54-103) for striped bass displayed similar patterns, with
both health index values indicating generally poor condition of age-0 striped bass. Other
researchers have reported juvenile moronid K values to range from 1.31-2.79 (Ware
1970; Burkuloo 1975; Kinman 1987; Austin and Hurley 1987). With, individuals with
relative weight values less than the benchmark of 100 considered to be in less than
“desirable” condition (Anderson and Neuman 1996). During the 2001-2002 season,
juvenile striped bass mean condition values (excluding the month of stocking) were
below 1.00, and monthly mean relative weight values did not to exceed 86.
Mean condition factor values for juvenile striped bass (all individuals) declined
over the growing season (from 1.17 in June to 0.94 in December) (Figure 18). Condition
factor values declined 14.6% from June (month of stocking) to July (ANOVA, F = 61.05,
df = 112, P < 0.001). Following the initial rapid decline from June to July, mean age-0
striped bass K values then declined 8.9% over the growing season (July to December)
(ANOVA, F = 25.79, df = 62, P < 0.001).
Declining trends were observed for relative weight values of age-0 striped bass
individuals above the 150 mm TL cutoff range (Figure 19). Juvenile striped bass did not
attain total lengths greater than 150 mm until the month of August. From August until
December, mean relative weight values decreased 14%, from 86 to 76 (ANOVA, F =
64.79, df = 78, P < 0.001). There was not a significant difference between fall and spring
mean condition factor values (0.92 and 0.90, respectively) (ANOVA, F = 3.21, df = 333,
63
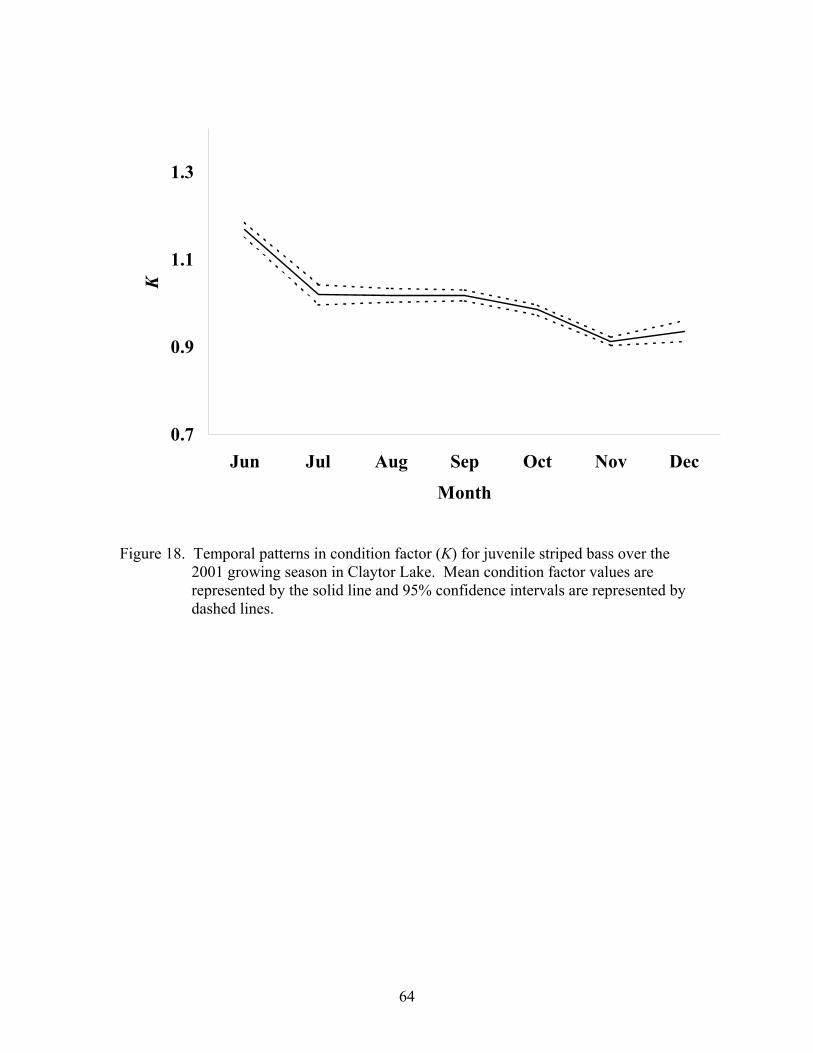
0.7
0.9
1.1
1.3
Jun Jul Aug Sep Oct Nov Dec
Month
K
Figure 18. Temporal patterns in condition factor (K) for juvenile striped bass over the 2001 growing season in Claytor Lake. Mean condition factor values are represented by the solid line and 95% confidence intervals are represented by
dashed lines.
64
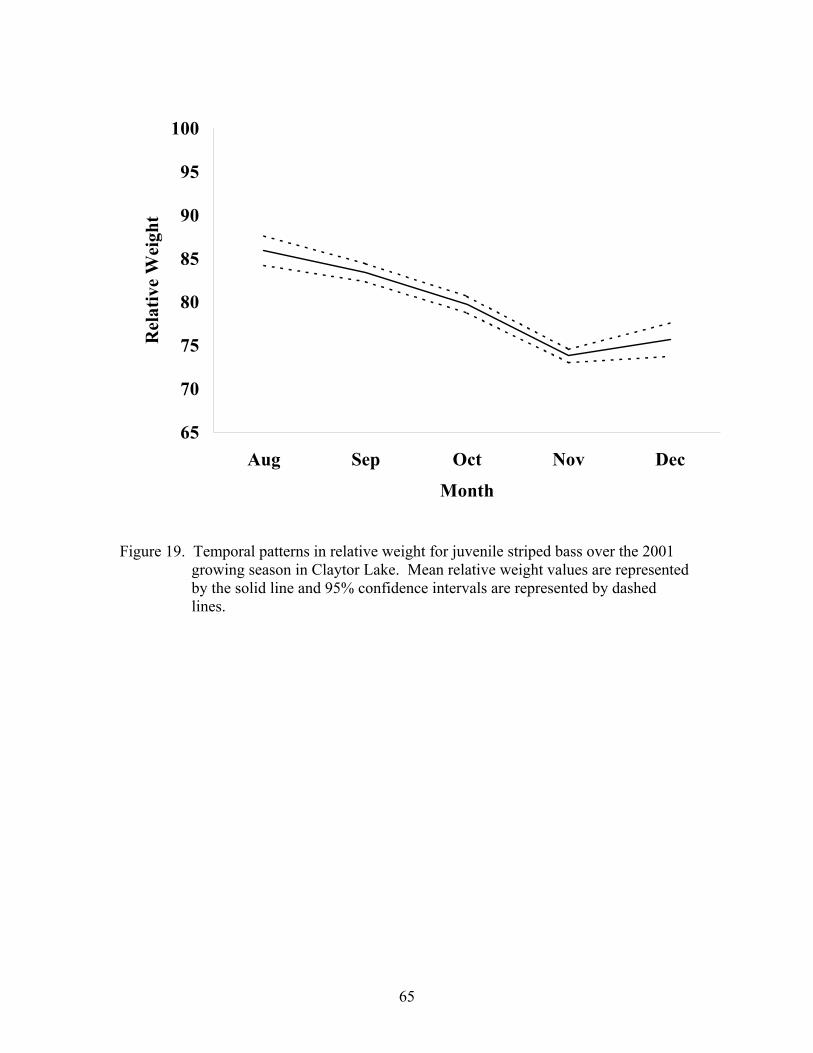
65
70
75
80
85
90
95
100
Aug Sep Oct Nov Dec
Month
Rel
ativ
e W
eigh
t
Figure 19. Temporal patterns in relative weight for juvenile striped bass over the 2001 growing season in Claytor Lake. Mean relative weight values are represented by the solid line and 95% confidence intervals are represented by dashed
lines.
65
P < 0.074) and relative weight values (74 and 73, respectively) (ANOVA, F = 2.66, df =
325, P < 0.104) for juvenile striped bass.
Juvenile striped bass had a mean lipid index value of 37.9 in the late fall, and this
value is slightly higher than the approximate mean of 30.0 observed by Sutton (1997).
Juvenile striped bass mean lipid index values decreased 2% from late fall to early spring
(35.7) (ANOVA, F = 32.15, df = 289, P < 0.001). The mean fall lipid index value
for smaller individuals (< 150 mm TL) was 35.1, but the comparison of fall and spring
lipid index values for smaller fish (< 150 mm TL) was not possible (none of the
individuals processed in the spring were less than 150 mm TL). However, mean fall lipid
index values were significantly higher then all corresponding spring 10-mm TL size class
values, except for 160 mm TL (ANOVA, F = 0.66, df = 14, P = 0.429), 260 mm TL
(ANOVA, F = 4.63, df = 9, P = 0.060), and 270 mm TL (ANOVA, F = 4.92, df = 4, P =
0.091) (Figure 20).
2002-2003. – Juvenile striped bass and juvenile hybrid striped bass exhibited
indices indicative of poor health over the growing season (condition factor: range 0.68-
1.22 and 0.68-1.38, respectively; relative weight: range 60-93 and 56-103, respectively).
Striped bass and hybrid striped bass throughout all months of the 2002-2003 sampling
season (except for hybrid striped bass in August), exhibited monthly mean K values
below 1.00. For both fishes, all monthly mean relative weight values were below 100.
Both striped bass and hybrid striped bass displayed mean lipid index values moderately
higher than those values observed by Sutton (1997). Individual juvenile striped bass and
hybrid striped bass had lipid index ranges of 24.6-48.2 and 28.1-40.6, respectively, with
all monthly means exceeding 30.0.
66
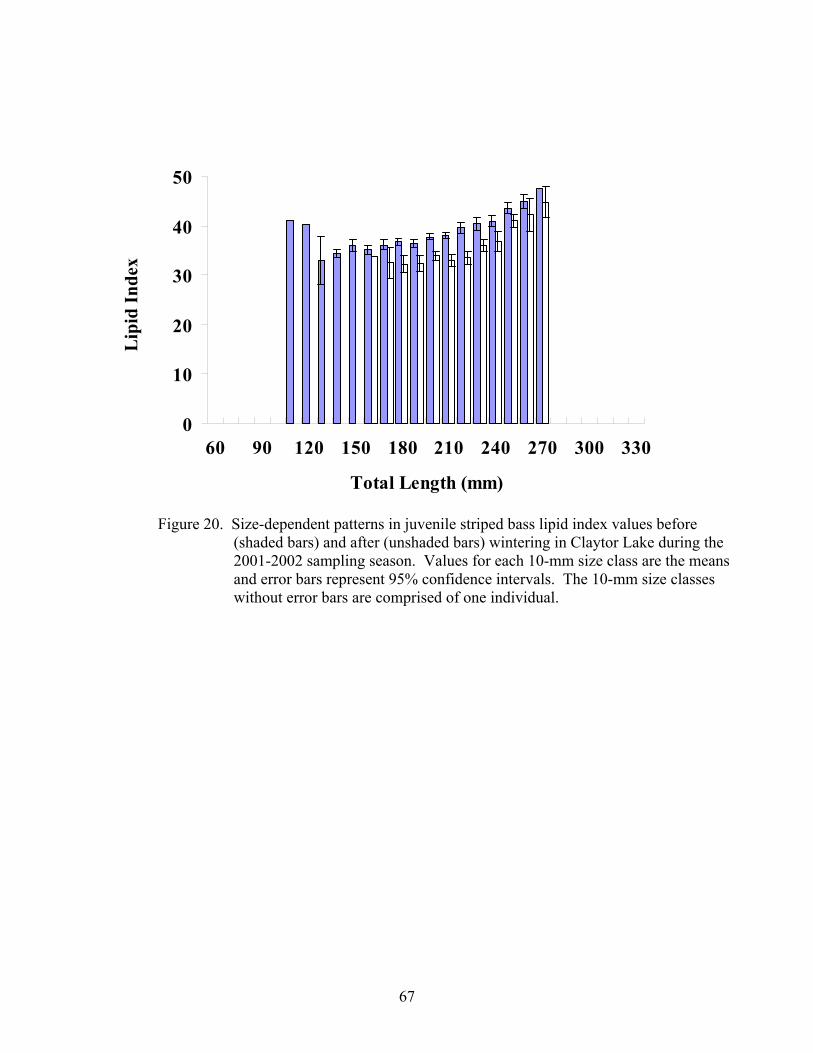
Lip
id In
dex
Figure 20. Size-dependent patterns in juvenile striped bass lipid index values before (shaded bars) and after (unshaded bars) wintering in Claytor Lake during the 2001-2002 sampling season. Values for each 10-mm size class are the means and error bars represent 95% confidence intervals. The 10-mm size classes without error bars are comprised of one individual.
0
10
20
30
40
50
60 90 120 150 180 210 240 270 300 330
Total Length (mm)
67

Unlike 2001, striped bass in 2002 did not exhibit a significant decrease in mean
condition factor values from the month of stocking (June) to July (ANVOA, F = 3.87, df
= 110, P = 0.052) (Figure 21). However, mean condition factor values for striped bass
decreased 7% over the growing season (0.93 to 0.88) (ANOVA, F = 10.48, df = 64, P =
0.002). Juvenile hybrid striped bass did, however, experience a dramatic decline in K
values from the month of stocking (August) to the following month (Figure 21). Age-0
hybrid striped bass K values decreased 35% from August to a September mean of 0.91
(ANOVA, F = 184.03, df = 80, P <0.001). This immediate decline did not continue over
the remainder of the growing season (ANOVA, F = 1.32, df = 29, P = 0.260).
Upon stocking in 2002, hybrid striped bass mean K values were 19% higher
(ANOVA, F = 147.99, df = 135, P < 0.001) than values for hybrid striped bass
fingerlings stocked into the reservoir in 2001, and 2002 striped bass mean condition
factor values at stocking were 25% less (ANOVA, F = 113.89, df = 169, P < 0.001) than
fingerlings stocked into the reservoir in 2001. Also, the mean fall striped bass K value
(0.91) was not significantly different from the mean spring value of 0.95 (ANOVA, F =
3.27, df = 283, P = 0.071), but the mean hybrid striped bass K value in the spring (1.09)
was 14% higher than the mean fall value of 0.96 (ANOVA, F = 18.41, df = 84, P <
0.001). There was not a significant difference between 2001 and 2002 fall striped bass K
values (ANOVA, F = 0.44, df = 386, P = 0.506). However, the mean condition factor
value for spring 2002 was 6% higher than the mean value for spring 2001 (ANOVA, F =
4.16, df = 230, P = 0.042).
As in 2001, age-0 striped bass did not attain lengths greater than the 150 mm TL
until August. However, in contrast to 2001, 2002 striped bass weight values during
68
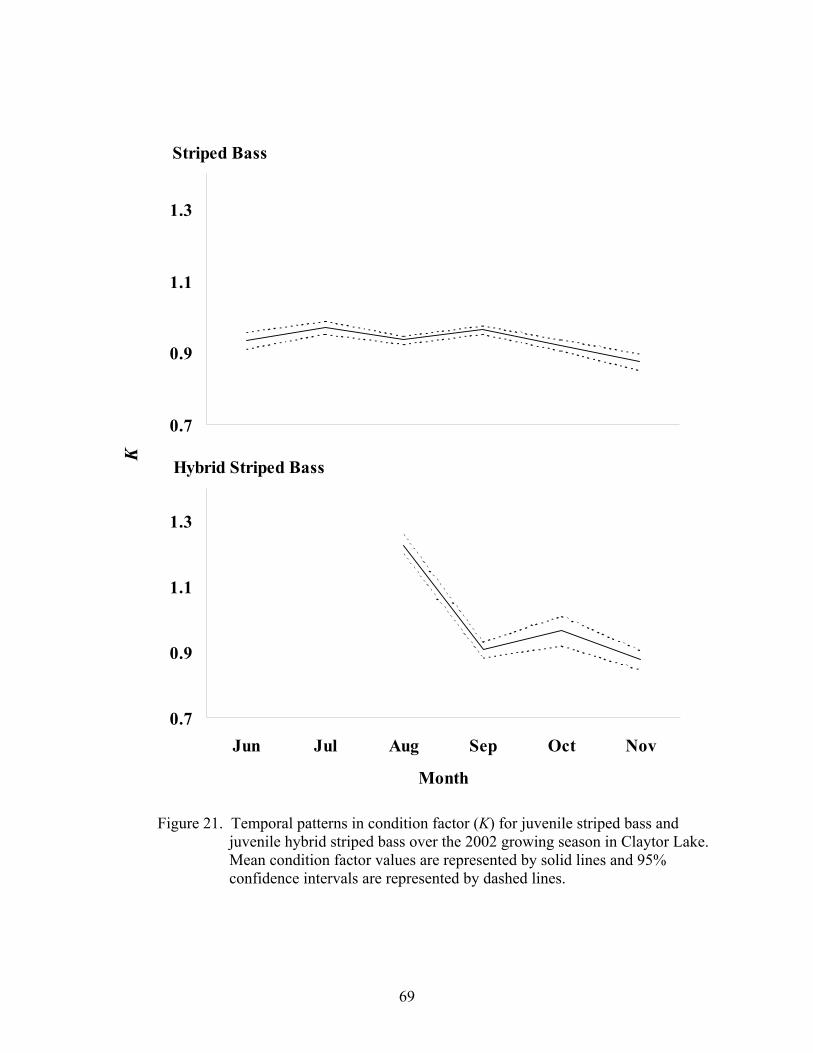
K
Figure 21. Temporal patterns in condition factor (K) for juvenile striped bass and juvenile hybrid striped bass over the 2002 growing season in Claytor Lake. Mean condition factor values are represented by solid lines and 95% confidence intervals are represented by dashed lines.
Striped Bass
0.7
0.9
1.1
1.3
Hybrid Striped Bass
0.7
0.9
1.1
1.3
Jun Jul Aug Sep Oct Nov
Month
69
the first months of the growing season (Figure 22). Age-0 striped bass mean relative
weight values increased 5% from August to a mean in September of 81 (ANOVA, F =
7.12, df = 90, P =0.002), but as observed for 2001, mean relative weight values
experienced a decline (12%) from September to November (ANOVA, F = 67.05, df =
118, P <0.001).
Like striped bass, juvenile hybrid striped bass attained lengths greater than the
minimum requirement for relative weight calculation (115 mm TL) during the month of
August. These individuals did not display a significant difference between relative
weight values in their first and second month in Claytor Lake, but did exhibit a 20%
decline in mean relative weight values over the growing season, concluding the growing
season with a November mean of 71 (ANOVA, F = 378.22, df = 4, P < 0.001).
Comparison of fall and spring relative weight values failed to reveal significant
differences between the two periods for either striped bass (76 and 76, respectively)
(ANOVA, F = 0.00, df = 219, P = 0.959) or hybrid striped bass (77 and 80, respectively)
(ANOVA, F = 1.01, df = 73, P = 0.319). Also, there was not a significant difference
between fall striped bass and fall hybrid striped bass (ANOVA, F = 0.63, df = 175, P =
0.429) or spring striped bass and spring hybrid striped bass (ANOVA, F = 1.65, df = 117,
P = 0.202) relative weight values. However, in 2002, mean fall striped bass relative
weight values were 3% greater than mean 2001 fall striped bass relative weight values
(ANOVA, F = 8.56, df = 318, P = 0.004). Also, mean spring 2003 striped bass relative
weight values were 4% larger than mean spring 2002 striped bass relative weight values
(ANOVA, F = 4.12, df = 226, P = 0.044). Nevertheless, mean relative weight values for
both fishes were well below the benchmark of 100.
70

Rel
ativ
e W
eigh
t
Figure 22. Temporal patterns in relative weight for juvenile striped bass and juvenile hybrid striped bass over the 2002 growing season in Claytor Lake. Mean relative weight values are represented by solid lines and 95% confidence intervals are represented by dashed lines.
Striped Bass
65
70
75
80
85
90
95
100
Hybrid Striped Bass
65
70
75
80
85
90
95
100
Aug Sep Oct Nov
Month
71

Over the 2002 growing season mean lipid index values increased 18% (ANOVA,
F = 67.18, df = 81, P < 0.001) for striped bass (30.0 to 35.4) and decreased 16%
(ANOVA, F = 42.87, df = 13, P < 0.001) for hybrid striped bass (38.4 to 33.1), with the
most remarkable changes occurring early in their respective growing seasons
(Figure 23). Juvenile striped bass mean lipid index values increased 9% from July to
August (ANOVA, F = 68.89, df = 147, P < 0.001) and for juvenile hybrid striped bass
mean lipid index values decreased 11% from August to September (ANOVA, F = 53.88,
df = 33, P < 0.001). Juvenile striped bass experienced a size-dependent increase in lipid
index values over the 2002 growing season (Jonckheere- Terpstra, J = 21.1, P < 0.001),
while juvenile hybrid striped bass did not (Jonckheere-Terpstra, J = -0.4, P ≈ 0.642)
(Figure 24). Juvenile striped bass mean lipid index values decreased 4% (ANOVA, F =
6.11, df = 287, P = 0.014) and juvenile hybrid striped bass mean lipid index values
increased 8% (ANOVA, F = 16.28, df = 85, P < 0.001) between the late fall and early
spring periods. During the late fall, the mean juvenile striped bass mean lipid index value
was 7% (ANOVA, F = 21.17, df = 250, P < 0.001) greater than the mean hybrid striped
bass lipid index value of 32.9. However, there was no significant difference between
striped bass and hybrid striped bass spring lipid index values (34.1 and 35.5, respectively)
(ANOVA, F = 3.17, df = 122, P = 0.077).
Mean fall lipid index values were significantly lower than all corresponding
spring striped bass 10-mm TL size class values, except for 160 mm TL (ANOVA, F =
2.40, df = 28, P = 0.132), 220 mm TL (ANOVA, F = 4.04, df = 8, P = 0.079), and 240
mm TL (ANOVA, F = 0.38, df = 3, P = 0.582) (Figure 25). Only one small mode (<150
mm TL) striped bass was collected following winter in 2003, and its lipid index value
72

Lip
id In
dex
Figure 23. Temporal patterns in lipid index for juvenile striped bass and juvenile hybrid striped bass over the 2002 growing season in Claytor Lake. Mean total lipid index values are represented by solid lines and 95% confidence intervals are represented by dashed lines.
Striped Bass
25
30
35
40
45
Hybrid Striped Bass
25
30
35
40
45
Jul Aug Sep Oct Nov
Month
73
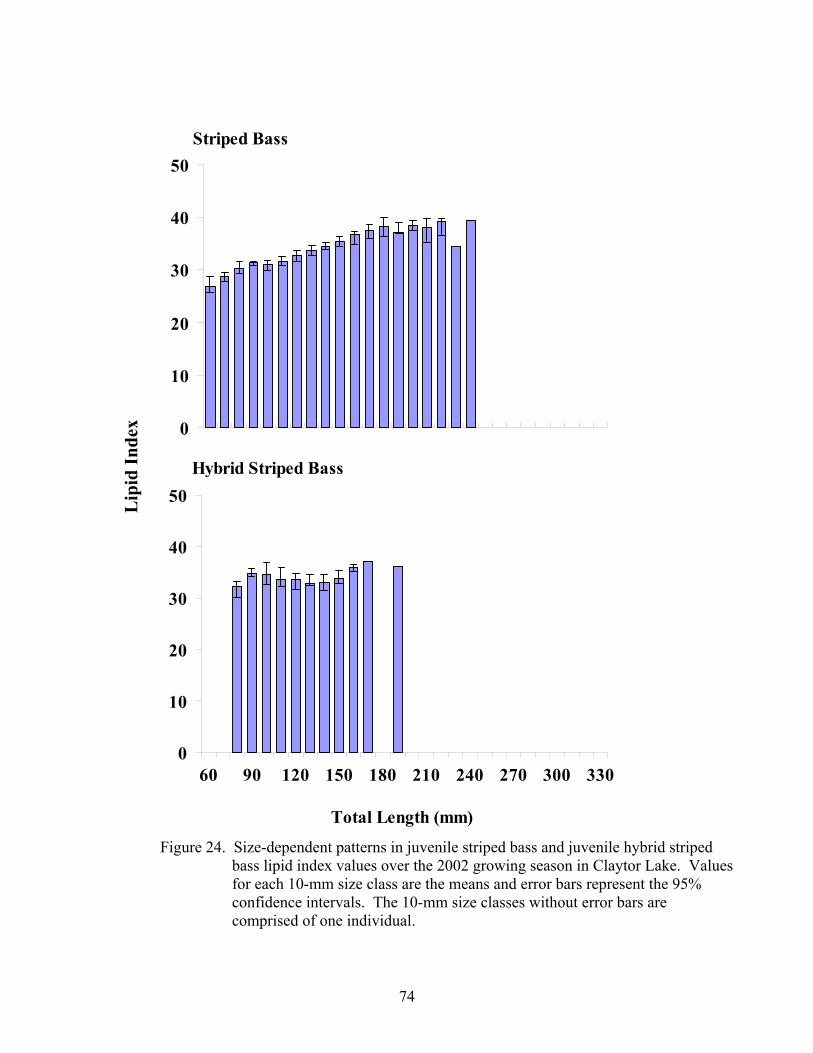
Lip
id In
dex
Figure 24. Size-dependent patterns in juvenile striped bass and juvenile hybrid striped bass lipid index values over the 2002 growing season in Claytor Lake. Values for each 10-mm size class are the means and error bars represent the 95% confidence intervals. The 10-mm size classes without error bars are
comprised of one individual.
Striped Bass
0
10
20
30
40
50
Hybrid Striped Bass
0
10
20
30
40
50
60 90 120 150 180 210 240 270 300 330
Total Length (mm)
74
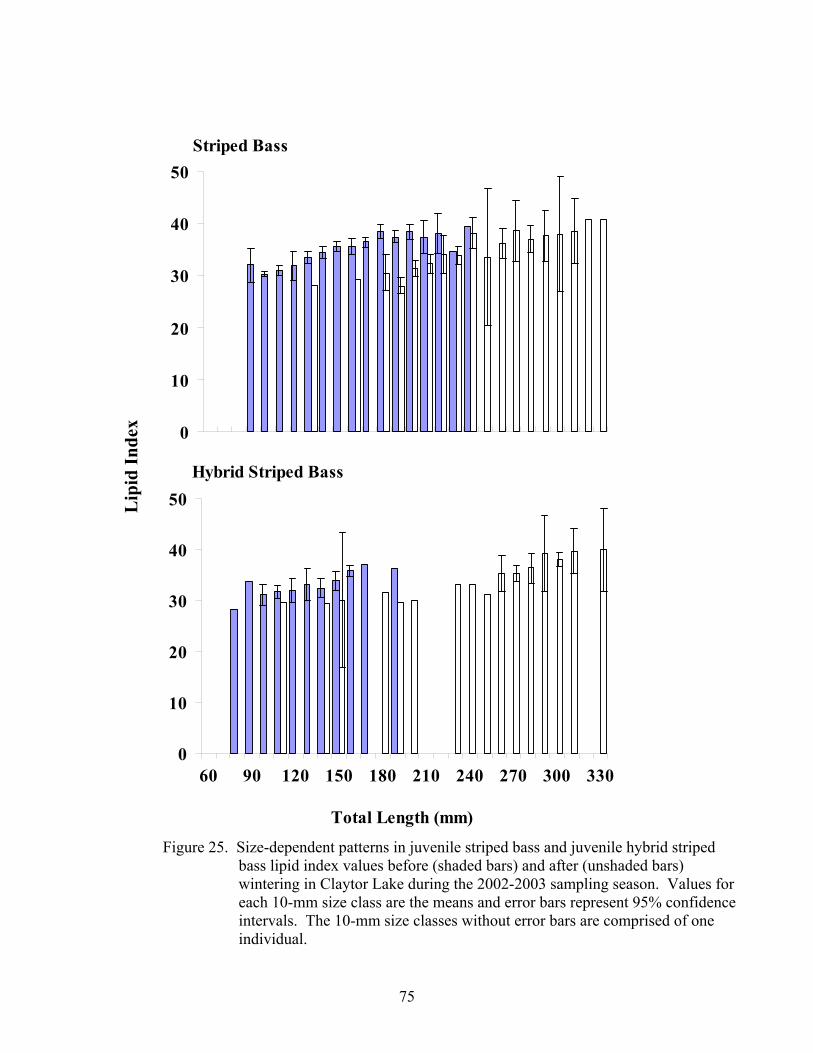
Lip
id In
dex
Figure 25. Size-dependent patterns in juvenile striped bass and juvenile hybrid striped bass lipid index values before (shaded bars) and after (unshaded bars) wintering in Claytor Lake during the 2002-2003 sampling season. Values for each 10-mm size class are the means and error bars represent 95% confidence intervals. The 10-mm size classes without error bars are comprised of one individual.
Striped Bass
0
10
20
30
40
50
Hybrid Striped Bass
0
10
20
30
40
50
60 90 120 150 180 210 240 270 300 330
Total Length (mm)
75
(28.2) was substantially less than the mean lipid index value of larger (>150 mm TL)
individuals in the spring (34.2).
Fall lipid index values did not differ significantly between corresponding spring
10 mm TL sizes classes for hybrid striped bass (110 mm TL: ANOVA, F = 1.46, df = 8,
P = 0.260; 140 mm TL: ANOVA, F = 2.82, df = 4, P = 0.169; 150 mm TL: ANOVA, F =
5.68, df = 7, P = 0.050) (Figure 25). However, larger (> 150 mm TL) hybrid striped bass
displayed a 21% higher mean lipid index value than smaller (< 150 mm TL) individuals
that survived the winter.
Juvenile striped bass in fall 2001 exhibited a mean lipid index value 9% greater
than juvenile striped bass in fall 2002 (ANOVA, F = 87.17, df = 416, P < 0.001).
However, there was no significant difference between mean spring lipid index values for
2001 and 2002 juvenile striped bass (ANOVA, F = 3.12, df = 230, P = 0.079). Also, in
2002, the juvenile hybrid striped bass mean lipid index value at the time of stocking
(46.7) was 14% higher than that for those stocked in 2001 (ANOVA, F = 49.14, df = 58,
P < 0.001).
Habitat Usage
Positive habitat electivity values reflect the preference of both juvenile striped
bass and juvenile hybrid striped bass for sand and gravel substrates without cover in 2002
(Table 10). During the month of November, striped bass exhibited a slight preference for
cobble substrate without cover, but the total electivity value (all monthly values pooled)
did not indicate preference for the habitat consisting of cobble substrate without cover
(Table 10). No striped bass or hybrid striped bass were captured or observed over sand
with cover, cobble with cover, boulder, and boulder with cover habitat units (Table 10).
76
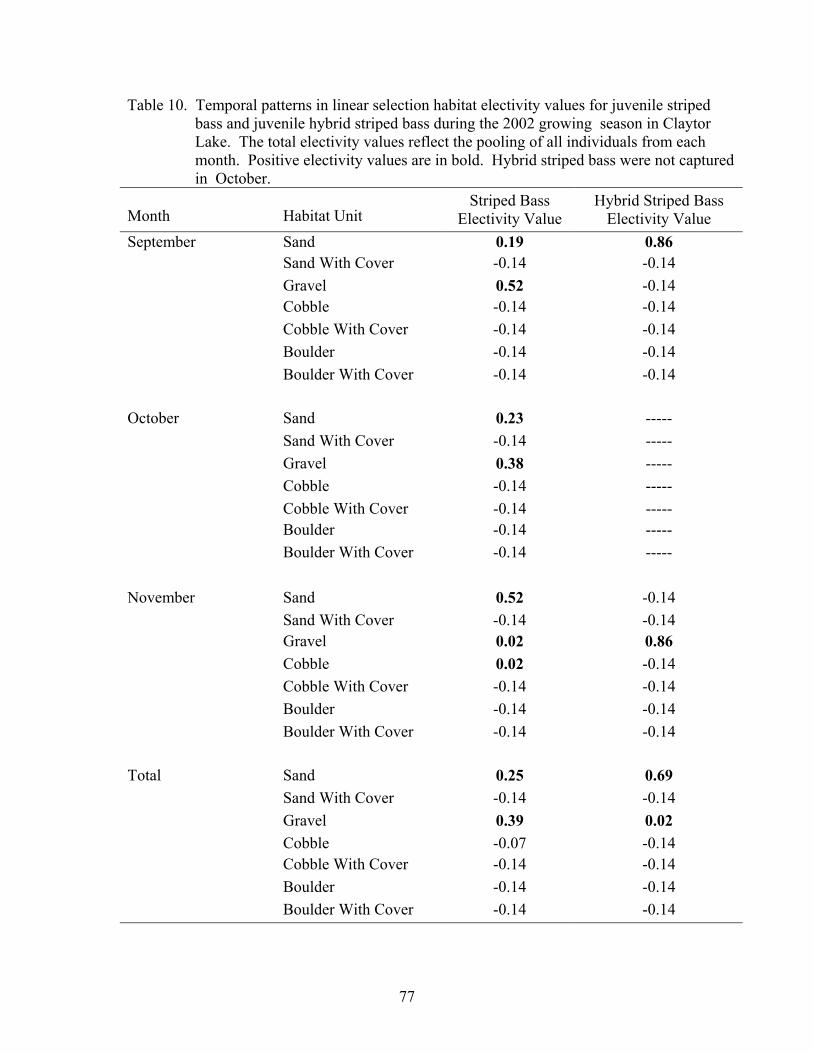
Table 10. Temporal patterns in linear selection habitat electivity values for juvenile striped bass and juvenile hybrid striped bass during the 2002 growing season in Claytor Lake. The total electivity values reflect the pooling of all individuals from each month. Positive electivity values are in bold. Hybrid striped bass were not captured in October.
Month
Habitat Unit
Striped Bass Electivity Value
Hybrid Striped Bass Electivity Value
September Sand 0.19 0.86 Sand With Cover -0.14 -0.14 Gravel 0.52 -0.14 Cobble -0.14 -0.14 Cobble With Cover -0.14 -0.14 Boulder -0.14 -0.14 Boulder With Cover -0.14 -0.14 October Sand 0.23 ----- Sand With Cover -0.14 ----- Gravel 0.38 ----- Cobble -0.14 ----- Cobble With Cover -0.14 ----- Boulder -0.14 ----- Boulder With Cover -0.14 ----- November Sand 0.52 -0.14 Sand With Cover -0.14 -0.14 Gravel 0.02 0.86 Cobble 0.02 -0.14 Cobble With Cover -0.14 -0.14 Boulder -0.14 -0.14 Boulder With Cover -0.14 -0.14 Total Sand 0.25 0.69 Sand With Cover -0.14 -0.14 Gravel 0.39 0.02 Cobble -0.07 -0.14 Cobble With Cover -0.14 -0.14 Boulder -0.14 -0.14 Boulder With Cover -0.14 -0.14
77
Each habitat type represented approximately 14% of the total, and the failure to collect
moronids over these habitat types resulted in electivities of –0.14 (ri = 0 and pi = 0.14).
Habitat overlap values greater than 0.6 were not detected for any individual
month of the growing season or for all months combined (Table 11). Low overlap may
be attributed to a species exhibiting preference for one habitat type one month and not in
a subsequent month, while the other species may have been doing the opposite, without
the habitat usage of the two fishes coinciding in the same month. For example, in
September, striped bass exhibited a greater preference for gravel than for sand, but hybrid
striped bass exhibited a preference for sand only for that same month (Table 10). During
the month of October, no hybrid striped bass were collected (Table 10). In November,
the species essentially reversed the trends displayed in the month of September, with
striped bass favoring sand and hybrid striped bass preferring gravel. Thus, it is possible
for each species to prefer the same habitat units (sand and gravel substrates without
cover), but the monthly variation did not result in significant overlap values.
Predation The frequency of occurrence of juvenile striped bass and juvenile hybrid striped
bass fingerlings in the diets of potential predators was minimal (Table 12). Predators
evaluated after striped bass stocking in 2002 consisted of 55 largemouth bass M.
salmoides, 20 smallmouth bass M. dolomieu, 17 spotted bass M. punctulatus, 7 yellow
perch Perca flavescens, 3 striped bass, 2 rock bass Ambloplites rupestris, and 1 flathead
catfish. None of the 105 predators sampled following striped bass introductions
contained an age-0 striped bass (Table 12).
78

Table 11. Temporal patterns in habitat overlap values for juvenile striped bass and juvenile hybrid striped bass over the 2002 growing season in Claytor Lake. The total overlap value reflects the pooling of all individuals from each month. Month
Overlap Value
Total 0.56
September 0.33
October -----
November 0.17
79
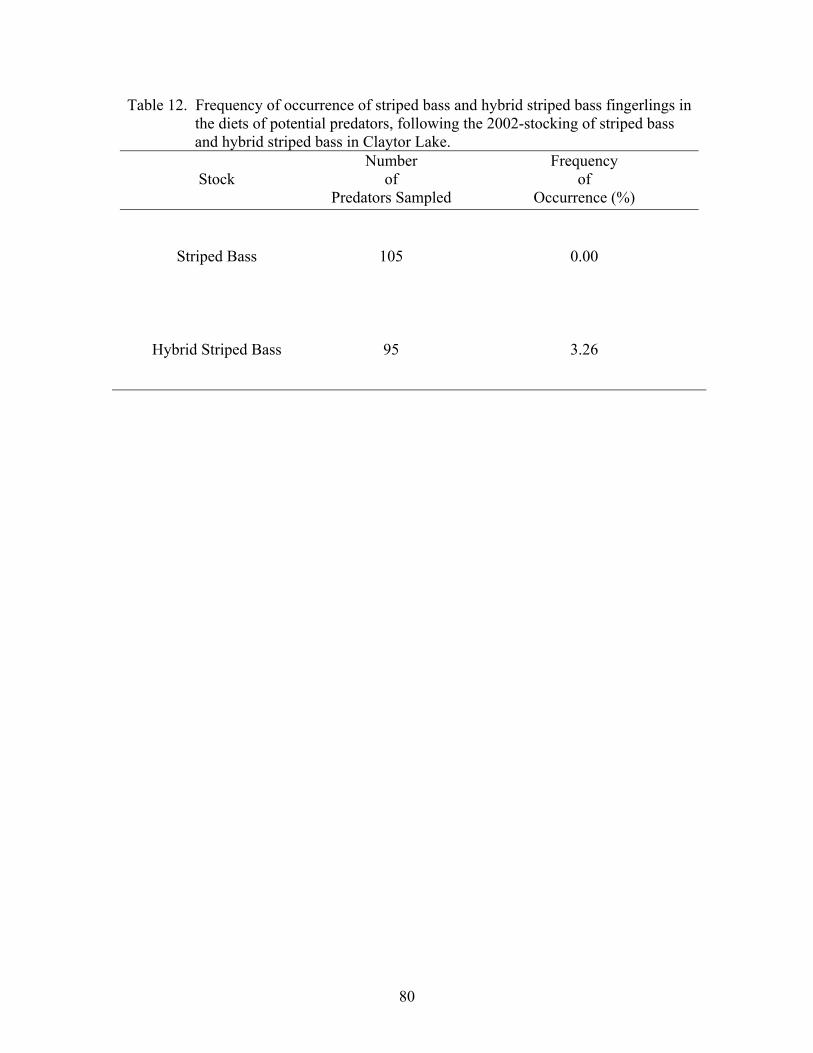
Table 12. Frequency of occurrence of striped bass and hybrid striped bass fingerlings in the diets of potential predators, following the 2002-stocking of striped bass and hybrid striped bass in Claytor Lake.
Stock
Number of
Predators Sampled
Frequency of
Occurrence (%)
Striped Bass
105
0.00
Hybrid Striped Bass
95
3.26
80

Predators investigated for the consumption of fingerling hybrid striped bass were
40 spotted bass, 29 smallmouth bass, 12 largemouth bass, 6 flathead catfish, 5 yellow
perch, 2 yellow bullhead Ameiurus natalis, and 1 rock bass. A single largemouth bass,
smallmouth bass, and spotted bass each contained a fingerling hybrid striped bass on the
night of stocking. Only 3 of the 95 predators sampled following hybrid striped bass
stocking in 2002 contained a hybrid striped bass fingerling (Table 12).
81

DISCUSSION
This study focused upon the comparative ecology of age-0 striped bass and age-0
hybrid striped bass in order to identify potentially deleterious interactions between the
two fishes that may limit recruitment to age 1. These interactions were considered in
particular within the context of trophic relationships, physiological indices of health,
overwinter survival, and habitat usage. Also, the impact of poststocking predation was
examined as a possible source of fingerling mortality.
Stock Identification In late September 2001, Claytor Lake was stocked with approximately 33,500
age-0 hybrid striped bass from Keo Fish Farm (Keo, AR). These individuals were
received one month after the period of requested delivery (John Copeland, VDGIF, pers.
comm.). Upon arrival, the 2001 hybrid striped bass mean total length (68) and lipid
index (41.1) values were 40% and 14%, respectively less than values for the August 2002
fingerlings provided by Southland Fisheries Corp. (Hopkins, SC), the usual supplier.
Also, 2001 hybrid striped bass were in poorer condition (mean K = 1.03) than those
stocked in 2002 (mean K = 1.23). The mean K value of 1.03 is substantially lower than
the average K value of approximately 1.25 reported for juvenile hybrid striped bass
stocked into East Fork Lake, Ohio (Austin and Hurley 1987). Thus, relatively poor
survival of these less-fit, 2001 hybrid striped bass fingerlings might be expected,
especially because they were stocked late in the growing season. Capture of only three
juvenile hybrid striped bass during the weeks following their stocking in 2001 and the
failure to capture any juvenile hybrid striped bass following the post-winter period in
2002 supports the hypothesis of poor survival of 2001 hybrid striped bass.
82
Alternatively, so few hybrid striped bass may have been identified because the
stocked fish were not true F1 (white bass x striped bass) hybrids. However, comparisons
of allele frequencies supported the conclusion that the 2001 fish were F1 hybrids, lending
further credence to the assumption of poor survival. Regardless of the underlying
explanation, I caught too few hybrid striped bass from the 2001 stocking to compare their
performance to the 2001 age-0 striped bass.
First-Year Growth Both striped bass and hybrid striped bass in Claytor Lake demonstrated
progressive increases in total length from time of stocking through the end of the growing
season. The growth for striped bass in Claytor Lake is consistent with the descriptions of
first-year growth reported for age-0 striped bass in other southeastern reservoirs, with
some specimens achieving total lengths greater than 200 mm (Table 13). In contrast,
age-0 hybrid striped bass (maximum = 157 mm TL) did not display total lengths as great
as those reported within the literature for first-year growth (Table 13). Juvenile hybrid
striped bass did not exhibit the more rapid growth rate than striped bass as reported for
these fishes in other systems (Bishop 1967; Logan 1967; Tuncer et al. 1990; Jenkins and
Burkhead 1993), perhaps because hybrid striped bass were stocked two months later than
striped bass.
Both striped bass and hybrid striped bass in this study exhibited S-shaped growth
curves during their first year of growth. During the period of linear growth (June to
October) in both 2001 and 2002, juvenile striped bass monthly mean total lengths
increased by 1.10 and 0.81 mm/day, respectively. This difference in growth rate between
years is likely due to annual variability of water levels within the reservoir, coupled with
83
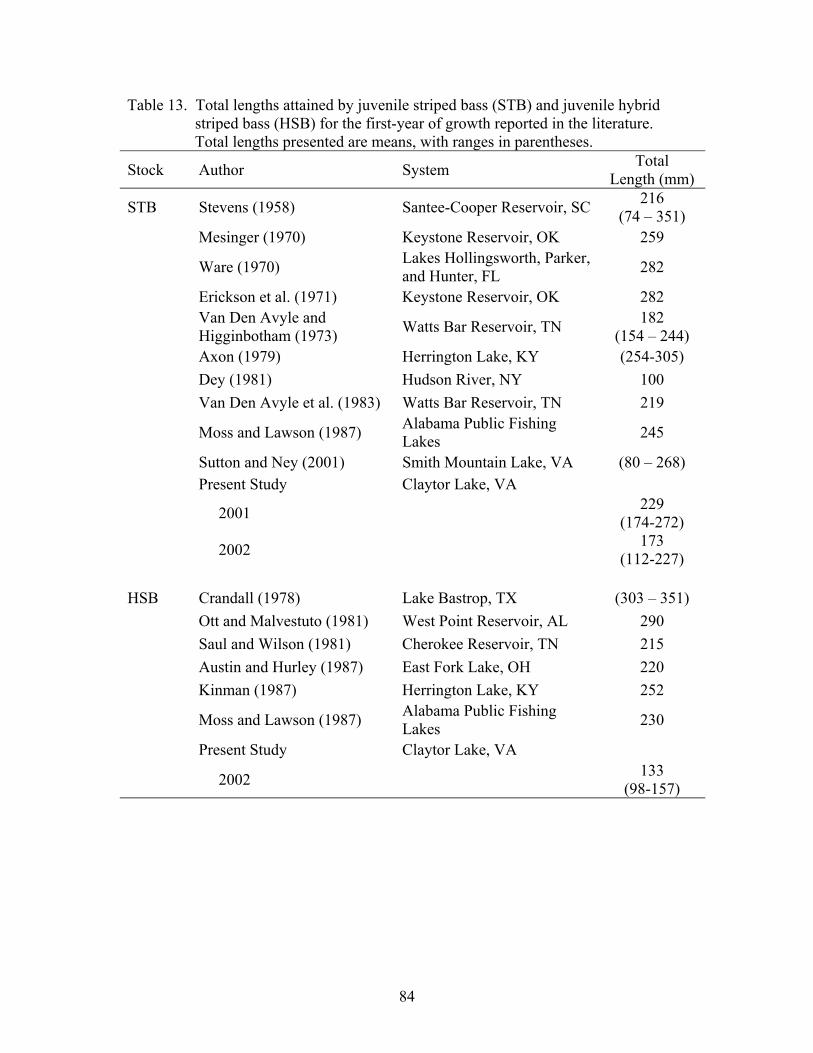
Table 13. Total lengths attained by juvenile striped bass (STB) and juvenile hybrid striped bass (HSB) for the first-year of growth reported in the literature. Total lengths presented are means, with ranges in parentheses.
Stock Author System Total Length (mm)
STB Stevens (1958) Santee-Cooper Reservoir, SC 216 (74 – 351)
Mesinger (1970) Keystone Reservoir, OK 259
Ware (1970) Lakes Hollingsworth, Parker, and Hunter, FL 282
Erickson et al. (1971) Keystone Reservoir, OK 282
Van Den Avyle and Higginbotham (1973) Watts Bar Reservoir, TN 182
(154 – 244) Axon (1979) Herrington Lake, KY (254-305) Dey (1981) Hudson River, NY 100 Van Den Avyle et al. (1983) Watts Bar Reservoir, TN 219
Moss and Lawson (1987) Alabama Public Fishing Lakes 245
Sutton and Ney (2001) Smith Mountain Lake, VA (80 – 268) Present Study Claytor Lake, VA
2001 229 (174-272)
2002 173 (112-227)
HSB Crandall (1978) Lake Bastrop, TX (303 – 351) Ott and Malvestuto (1981) West Point Reservoir, AL 290
Saul and Wilson (1981) Cherokee Reservoir, TN 215 Austin and Hurley (1987) East Fork Lake, OH 220
Kinman (1987) Herrington Lake, KY 252
Moss and Lawson (1987) Alabama Public Fishing Lakes 230
Present Study Claytor Lake, VA
2002 133 (98-157)
84
19% lower initial K values for 2002 striped bass fingerlings in comparison to those in
2001. Perhaps, due to the loss of preferred juvenile habitat within the littoral zone via the
reduced flow into the reservoir during summer 2002, foraging success of recently stocked
fingerlings was decreased. Thus, these juveniles in poorer condition may have been
forced to reallocate energy from initial growth to storage of energy reserves during this
period of environmental stress (as noted by juvenile striped bass lipid index values
increasing from a mean of 30.0 in July to a mean of 35.1 in September) (Post and
Parkinson 2001). Additionally, variation in ration may account for the yearly difference
in growth, but determination of forage availability was beyond the scope of this study.
The initial rapid increase in growth observed for striped bass in Claytor Lake is
consistent with reports from other systems. Mesinger (1970) reported that age-0 striped
bass displayed a rapid increase in total length during the months of June to September in
Keystone Reservoir, Oklahoma. Sutton and Ney (2001) observed a similar pattern in
growth for juvenile striped bass in Smith Mountain Lake, Virginia, with growth rates
slowing during the month of October. In Lakes Hollingsworth, Parker, and Hunter,
Florida, juvenile striped bass growth rates were characterized by swift growth from
August to September, with only a gradual increase in total length for the remainder of the
growing season (Ware 1970). Additionally, Dey (1981) found linear growth of juvenile
striped bass from June to August, followed by a plateau in growth rates through
December, for age-0 striped bass in the Hudson River, New York.
In contrast, during the period of linear growth (August to October 2002) juvenile
hybrid striped bass displayed a growth rate of only 0.52 mm/day, while juvenile striped
bass increased at the same rate (0.52 mm/day) during this same period. The observed
85
length at the end of the growing season of age-0 hybrid striped bass in Claytor Lake was
significantly less than that of age-0 striped bass in this study and those reported in the
literature (Table 13). In addition, the plateau of growth in October is inconsistent with
hybrid striped bass growth in other systems. Austin and Hurley (1987) reported that age-
0 hybrid striped bass in East Fork Lake, Ohio, did not display a plateau in growth during
the growing season. Also, in Cherokee Reservoir, Tennessee, juvenile hybrid striped
bass exhibited a continuous rapid increase in total length in the first year of growth until
the onset of winter (Saul and Wilson 1981).
Post-Winter Survival Analysis of the differences in length-frequency distributions between fall and
spring sampling periods for striped bass in 2001-2002 suggests that size-dependent
mortality over the winter period limits the recruitment of juveniles in Claytor Lake. The
observation of smaller individuals experiencing disproportionately higher overwinter
mortality than larger individuals is reported in numerous studies for a variety of age-0
fishes. Sutton and Ney (2001) reported substantial mortality of smaller (< 150 mm TL)
age-0 striped bass during the overwinter period in Smith Mountain Lake, Virginia. The
loss of small-mode (< 150 mm TL) individuals from the age-0 cohort also was observed
for hybrid striped bass in East Fork Lake, Ohio (Austin and Hurley 1987). Similar size-
dependent overwinter mortality has been documented for largemouth bass (Timmons et
al. 1980; Toneys and Coble 1980; Garvey et al. 1998; Fullerton et al. 2000), walleye
(Nielsen 1980), brook trout Salvelinus fontinalis (Toneys and Coble 1980; Cunjak and
Power 1986), yellow perch (Toneys and Coble 1980; Post and Evans 1991), Colorado
squawfish Ptychocheilus lucius (Thompson et al. 1991), green sunfish Lepomis cyanellus
86
(Toneys and Coble 1980), pumpkinseed Lepomis gibbosus (Benard and Fox 1997), and
Atlantic cod Gadus morhua (Gotceitas et al. 1999).
Overwinter loss of smaller individuals occurred in this study was not as dramatic
as that observed by Sutton and Ney (2001). Unlike Smith Mountain Lake, Virginia
(Sutton and Ney 2001), Claytor Lake lacked the large proportion of small striped bass (<
150 mm TL) entering into the winter. As a result, a clear bimodal size distribution never
developed for either striped bass or hybrid striped bass juveniles during this study. Thus,
greater attention was placed upon detecting the presence of an upward shift in the mean,
without an increase in the maximum total length of the population (Sutton and Ney
2001). Examination of length-frequency distributions did in fact reveal the loss of
smaller individuals (< 150 mm TL) over winter in the 2001-2002 sampling season. By
spring, the mean total length had increased 9% from fall, while the maximum total length
remained at approximately 270 mm TL. In addition, only 1% of individuals in the spring
were less than 150 mm TL, compared the 5% that had entered into the winter.
In late fall 2002, juvenile striped bass were smaller (32% < 150 mm TL versus
5% < 150 mm TL in 2001) and exhibited lipid reserves 9% lower than individuals of late
fall 2001. Thus, with striped bass individuals entering the harsh winter of 2002 at smaller
sizes and at a poorer condition in comparison to juvenile striped bass in 2001, the
potential existed for overwinter mortality in the 2002-2003 sampling season. In spring
2003, striped bass and hybrid striped bass were significantly longer than in the previous
fall (45% and 97% differences in total lengths, respectively). However, it was not
possible to accurately detect size-dependent overwinter mortality in 2002-2003 fish,
because the upward shift in the minimum and mean lengths of striped bass and hybrid
87
striped bass in the spring 2003 was accompanied by an increase in the maximum total
length for both fishes of 105 and 173 mm, respectively. The increase in the maximum
indicates that overwinter disappearance of small individuals may simply be due to their
growth beyond that size range. However, alternative explanations are possible for my
failure to collect the larger individuals in fall 2002 that were collected in spring 2003.
First, the sampling techniques utilized may have failed to representatively capture larger
individuals that may have been present in the fall. I feel this explanation is not plausible
due to the fact that sampling efforts were consistent between years and seasons, and these
efforts failed to reveal any anomalies until spring 2003. Second, individuals may have
grown over the winter, but that appears unlikely as well. Age-0 Morone have been
reported to cease growth at temperatures less than 10ºC (Cox and Coutant 1981; Kerby et
al. 1987; Woiwode and Adelman 1991; Hurst and Conover 1998; Sutton 1997). The
reported monthly mean air temperatures for Whitethorne, Virginia (approximately 14 km
north of Claytor Lake Dam) for November 2002 through April 2003 are 5.5, 0.0, 0.0, 0.5,
7.6, and 11.2ºC, respectively (Virginia Agricultural Experiment Station, 2003). During
the months of November and December 2002, Kilpatrick (2003) reported mean monthly
temperatures of Claytor Lake to be 11.7 and 5.5ºC, respectively. Due to the extreme low
temperatures experienced during this period, I feel that it is doubtful that overwinter
growth occurred. The third and most probable explanation for the dramatic increase in
total lengths from fall 2002 to spring 2003 is that individuals resumed growth in the
spring period before becoming susceptible to sampling gear. Sampling during spring
2002 and spring 2003 began in March and continued through May 2003. This sampling
regime yielded 150 striped bass in 2002, and 86 striped bass and 40 hybrid striped bass in
88

2003. In 2002 the majority of individuals were caught during March and the first two
weeks of April, but in 2003 individuals were not collected until the last two weeks of
April and the first two weeks of May. In addition, by the time both striped bass and
hybrid striped bass were collected in 2003, both fishes had established diets composed of
sunfish, crayfish, and predominately, alewife. Striped bass collected in spring 2002, were
found to have a mixed diet of invertebrates and fish. Thus, the additional time to grow,
coupled with the switch to an energetically profitable diet, more than likely gave juvenile
striped bass and juvenile hybrid striped bass the opportunity to grow before becoming
susceptible to the sampling gear deployed in spring 2003.
Nonetheless, in 2001-2002 juvenile striped bass experienced a legitimate loss of
small (< 150 mm TL) individuals over the winter. Sutton (1997) presented evidence that
small striped bass in Smith Mountain Lake, Virginia, had less energy reserves (i.e., lipid
index value was 37% less) than larger individuals entering winter, and thus were required
to utilize these limited stores to survive the winter. Sutton (1997) reported a positive
allometric relationship between body size and energy reserves and negative allometric
relationships between body size and metabolism. The emergence of larger juveniles from
the overwinter period, in better physiological health than smaller fish, substantiates the
relationship of energy variance and body size in determining overwinter survival in age-0
fishes (Sutton 1997). In this study, 2001-striped bass individuals greater than 150 mm
TL possessed lipid index values 8% higher than smaller (< 150 mm TL) individuals
entering into the winter, but due to the loss of small individuals over the winter, the
comparison of small and large size classes (> 150 mm TL) in the spring was not possible.
However, Sutton (1997) reported spring lipid index values for large size classes to be
89

67% higher than values for smaller (< 150 mm TL) individuals. The lack of smaller
individuals in the spring further supports the hypothesis of the relationship of energy
variance and body size in determining winter mortality. Fall versus spring indices of
health (condition factor, relative weight, and lipid index) are below (see Indices of
Health).
Food Habits Both juvenile striped bass and juvenile hybrid striped bass exhibited size-
dependent shifts in food habits at approximately 120 mm TL. Fish 80 to 120 mm TL
principally utilized aquatic insects and zooplankton, while individuals over 120 mm TL
mostly preyed upon age-0 fishes. This ontogenetic shift in food habits has also been
observed for other reservoir populations of age-0 striped bass (Ware 1970; Axon 1979;
Van Den Avyle et al. 1983; Matthews et al. 1992; Sutton 1997) and age-0 hybrid striped
bass (Ott and Malvestuto 1981; Saul and Wilson 1981; Austin and Hurley 1987; Kinman
1987), with the switch from mainly zooplankton and aquatic insects (chironomids) to
principally young-of-the-year fishes (alewife, gizzard shad, cyprinids, inland silversides
Menidia beryllina, and/or sunfishes) at total lengths greater than 100 mm. The shift in
diet at approximately 120 mm TL for striped bass in Claytor Lake was most similar to
that exhibited by striped bass in Smith Mountain Lake, Virginia, where individuals less
than 120 mm TL consumed a mixed diet comprised mainly of zooplankton and aquatic
insects and those greater than 120 mm TL preyed upon age-0 fishes (Sutton 1997). In
addition, the change in hybrid striped bass diet observed in this study closely resembles
the alteration in diet reported for hybrid striped bass in Cherokee Reservoir, Tennessee,
90

where individuals that achieved lengths of approximately 126 mm TL began to feed
predominately upon clupeid forage fishes (Saul and Wilson 1981).
Even though the two moronids were primarily piscivorous, they did not
concentrate on the same prey items during the growing season, resulting in low diet
overlap. Examination of stomach contents for juvenile striped bass and juvenile hybrid
striped bass revealed time-dependent feeding patterns. Given the early June stocking
date for fingerling striped bass, they were able to forage on young-of-the-year alewife by
July 2001 and 2002. The consumption of age-0 alewife was continued throughout the
growing season, albeit less frequently when alewife began to move to deeper waters
during October through December. In contrast, juvenile hybrid striped bass (stocked two
months later in the growing season at a mean of approximately 94 mm TL) did not
exhibit the same utilization of age-0 alewife as shown by juvenile striped bass, which in
August averaged approximately 122 mm TL. Instead, juvenile hybrid striped bass preyed
upon age-0 sunfish and cladocerans throughout the growing season. The delayed
stocking of hybrid striped bass within Claytor Lake may be limiting the ability of juvenile
hybrid striped bass to utilize age-0 alewife as a continuous food source throughout the
growing season.
Nigro (1980) found that by August, age-0 alewife in Claytor Lake exhibited mean
total lengths of approximately 110 and 90 mm in 1978 and 1979, respectively. In
addition, Tisa (1988) reported age-0 alewife in Smith Mountain Lake, Virginia, to reach a
mean total length of approximately 70 mm by early August. In 2002, hybrid striped bass
fingerlings were stocked into Claytor Lake in August at a mean total length of 93.6 mm.
Based on the relationship between predator mouth gape and prey body depth (Sutton
91

1997), age-0 striped bass 90 mm TL can only ingest alewife less than or equal to 30 mm
TL. If the maximum total length ingestibility limit values developed for Smith Mountain
Lake are applied to the juvenile hybrid striped bass entering Claytor Lake in August,
hybrid striped bass could not ingest age-0 alewife. Alewife possess the highest gross
energy values amongst clupeid forage fishes (Strange and Pelton 1987). The inability of
juvenile hybrid striped to utilize the energetically profitable, age-0 alewife during the
growing season has two potentially significant impacts upon the trophic interactions
within Claytor Lake. First, it allows the young-of-the-year alewife forage base to be
utilized more heavily by other lake piscivores (especially, age-0 striped bass). Second,
the inability to take advantage of alewife as a source of prey may force juvenile hybrid
striped bass to seek alternative prey items, such as cyprinids, age-0 gizzard shad, and age-
0 sunfishes.
Although low overlap was observed during the growing season, juvenile striped
bass and juvenile hybrid striped bass exhibited a significant diet overlap in the post-
winter period (0.80). By spring 2003, hybrid striped bass were large enough to overcome
their apparent initial inability to ingest alewife, forcing higher overlap values indicative
of potential competition, but these values were only observed after the “critical period” of
winter. Thus, it appears that due to the late stocking of hybrid striped bass, it is unlikely
(based on 2002-2003) that juvenile hybrid striped bass are causing overwinter starvation
mortality in juvenile striped bass. However, because I was unable to capture striped bass
in the spring of 2003 prior to the onset of new growth, I could not compare late fall
versus spring length-frequency distributions for evidence of size-dependent mortality. It
seems likely that some size-dependent overwinter mortality occurred as in 2001-2002
92

because; striped bass were small and in poor condition in fall and the winter was cold and
prolonged. If hybrid striped bass were able to feed, and grow during some winter periods
when striped bass could not, it is possible that undetected late-winter/early-spring trophic
competition could have occurred.
Indices of Health Condition Factor (K). - The condition factor values for both striped bass and
hybrid striped bass in Claytor Lake, except at stocking, were lower than values reported
for these species within the literature. Mean monthly condition factor values for
individuals in this study following the month of stocking were below 1.00. Condition
factor values for age-0 striped bass stocked in the Choctawhatchee River, Florida, ranged
from 1.65 to 2.54 (Wigfall and Burkuloo 1975). Ware (1970) reported condition factor
values of striped bass stocked in Lakes Hollingsworth, Parker, and Hunter, Florida, to
range between 1.31 and 2.79. Kinman (1987) found yearly condition factor values for
hybrid striped bass in Herrington Lake, Kentucky, to average 1.24. Austin and Hurley
(1987) reported hybrid striped bass to exhibit condition factor values greater than 1.25
during the growing season in East Fork Lake, Ohio.
Both juvenile striped bass and juvenile hybrid striped bass experienced a decline
in condition factor index and relative weight values over each growing season, with the
greatest change having occurred in the month immediately following the stocking of
heavy, hatchery-reared fingerlings. High initial K values at stocking, and the failure of
these values to increase proportionally with fish growth, has been reported for juvenile
striped bass in Lakes Hollingsworth, Parker, and Hunter (Ware 1970) and the
Choctawatchee River System, Flordia (Wigfall and Burkuloo 1975). This temporal trend
93
in condition values is unlike that observed for juvenile striped bass in Smith Mountain
Lake, Virginia (Sutton 1997). Sutton (1997) found relative condition factor (Kn) values
increased over the growing season for juvenile striped bass. However, the weight-length
regression equation used by Sutton (1997) was developed from all individuals within the
sample. Thus, when applied to all size classes, the temporal trend could be skewed by
data from the larger individuals of the late fall being applied to the weight-length
regression.
The decrease in condition factor values that was observed during this study has
been observed for juvenile hybrid striped bass in other systems. Saul and Wilson (1981)
also noted that the initial plumpness of fingerling hybrid striped bass at time of stocking
and a higher initial condition value followed by a subsequent decline for age-0 hybrid
striped bass in Cherokee Reservoir, Tennessee. Austin and Hurley (1986) reported mean
K values in one year of their study of age-0 hybrid striped bass in East Fork Lake, Ohio,
to be highest in the month of August and lowest in November. However, in the
remaining two years of the study, Austin and Hurley (1986) found the inverse trend to
occur, with condition factor values increasing over the growing season.
During both sampling seasons, juvenile striped bass did not exhibit a difference
between late fall and early spring K values. However, hybrid striped bass during the
2002-2003 sampling season experienced an increase in K values leaving the overwinter
period. This increase can be attributed to the heightened consumption of alewife and
apparent growth of hybrid striped bass during the spring.
Relative Weight. - Due to the two fishes having different body shapes, the
condition factor values of striped bass cannot be compared to values of hybrid striped
94

bass (Anderson and Neuman 1996). However, relative weight (Wr) values can be
compared between the two fishes above their respective cutoffs (striped bass: > 150 mm
TL and hybrid striped bass: >115 mm TL). Comparisons within this study revealed that
there were no significant differences between late fall and early spring relative weight
values for either striped bass or hybrid striped bass. In addition, comparison between
species did not reveal a significant difference in either spring or fall. Relative weight
values for both striped bass and hybrid striped bass declined over the growing season,
and relative weight values for each stock during both fall and spring periods were well
below the mark (100) for fish in “desirable” condition (Anderson and Neuman 1996).
During the growing season of 2001 and spring of 2002, only 1 and 0%, respectively, of
striped bass relative weights were above 100, and in the growing seasons of 2002 and
spring 2003, only 0 and 6% of individuals, respectively, exceeded the mark. Only 2% of
hybrid striped bass during the 2002 growing season possessed relative weight values
greater than 100, and 3% of hybrid striped bass in the spring 2003 surpassed relative
weight values of 100 as well.
Brown and Murphy (1991b) comprised a weight-length database for striped bass
and hybrid striped bass, which was developed from populations representative of striped
bass and hybrid striped bass distributions in the United States. From the 43 striped bass
populations and the 72 hybrid striped bass populations examined, the twenty-fifth
percentile of population means for striped bass and hybrid striped bass were 82 and 86,
respectively (Brown and Murphy 1991b). Monthly mean relative weight values for
striped bass (range = 72-86) and hybrid striped bass (range = 71-85) in this study fall
among the lowest percentiles of moronid population means.
95

Lipid Index. - Lipid index values increased for striped bass over each growing
season, but declined for hybrid striped bass during the 2002 growing season. However,
the decline in hybrid striped bass lipid index values can be attributed to the high fat
content of fingerlings upon stocking (mean = 46.7). Sutton (1997) noted the increase of
lipid index values for striped bass over the growing season to a mean of approximately
30.0, followed by the decline in values over winter to a mean of approximately 26.0.
Lipid index values for both striped bass and hybrid striped bass in Claytor Lake were
found to be slightly higher in late fall by Sutton (1997). Mean late fall lipid index values
were 37.9 and 35.4 in 2001 and 2002, respectively, and hybrid striped bass late fall lipid
index values in 2002 were 33.1.
Nevertheless, in 2001-2002 striped bass did not exhibit a significant difference in
mean lipid index values between fall and spring periods, but individuals less than 150
mm TL possessed mean lipid index values 8% lower than larger (> 150 mm TL)
individuals entering the winter. Sutton (1997) found smaller (<150 mm TL) individuals
to have lipid index values 47% less than larger individuals in the late fall. Subsequently,
Sutton (1997) reported lipid index values for larger individuals to be 67% higher than
values for smaller striped bass that survived the winter, with lipid index values for
smaller individuals having declined 72% from the fall. In my study, comparisons
between these size classes were not possible in the 2001-2002 sampling season, due to
the disappearance of individuals less than 150 mm TL over the winter. Given the large
decline in lipid index values for smaller individuals found by Sutton (1997), the loss of
these individuals during the overwinter period of 2001-2002 may in fact be due to their
lack of adequate energy reserves needed to survive the winter.
96
During late fall 2002, there was no significant difference between juvenile
striped bass and juvenile hybrid striped bass lipid index values. However, as observed by
Sutton (1997), both fishes experienced a decline in lipid index values over the winter
(striped bass: 4% and hybrid striped bass: 8%). In 2002-2003, lipid index values for both
fishes declined over the winter, but as in the 2001-2002 season, the disproportionate
decline for small (<150 mm TL) individuals observed by Sutton (1997) (72%), was not
found. However, with both fishes having utilized lipid stores over the winter, there was
not a difference between striped bass and hybrid striped bass lipid index values in late
spring 2003.
In summary, K and relative weight values for both striped bass and hybrid striped
bass during this study were low in comparison to values reported for young-of-the-year
moronids in other systems, but lipid levels were high relative to those reported by Sutton
(1997) for Smith Mountain Lake, Virginia, juvenile striped bass. These indices appear to
be contradictory; fish are thin (relatively), but have high fat content. Condition factor (K)
is difficult to interpret in between-waters comparisons, due to the lack of standardization
for the index (i.e., a K value indicative of a healthy fish in one population, may not be
representative of good condition in another system). The application of standard weight
equations to smaller fish, like the ones in this study, could be inaccurate due to increased
variance associated with the weights at length (Anderson and Neuman 1996). However,
Bonds (2000) found similar low relative weight values (mean of approximately 90) for
both adult striped bass and adult hybrid striped bass in Claytor Lake. Also, lipid index
values in comparison to Sutton (1997) were high. The difference that was observed in
this study may be the result of my utilization of Sutton’s (1997) relationship of lipid
97

index and percent body water. The regression equation developed for striped bass in
Smith Mountain Lake, by Sutton (1997), was species- and population-specific, and when
it was applied to both species in this study, it may have resulted in less-than-accurate
values. Regardless, the catch-per-unit-effort of 2001 striped bass that recruited to age 1
remained consistent in comparison to previous year classes (Figure 26), which have
produced a popular and productive fishery. Thus, the juvenile moronids observed in this
study appear to be surviving well within the reservoir.
Habitat Usage Habitat electivity values indicated preference by juvenile striped bass and juvenile
hybrid striped bass for similar habitat units during the months of September through
November 2002. The preference of both species for sand or gravel substrates without
cover is consistent with the findings reported within the literature. Mesinger (1970)
reported sandy littoral areas of Keystone Reservoir, Oklahoma, to be the predominant
habitat used by juvenile striped bass. In Watts Bar Reservoir, Tennessee, age-0 striped
bass were found to exhibit a strong preference for clay or sand substrates (Van Den
Avyle and Higginbotham 1979 and Van Den Avyle et al. 1983). Juvenile hybrid striped
bass in East Fork Lake, Ohio, were discovered to overwhelmingly prefer fine sand and
clay substrates, and no age-0 hybrid striped bass were captured in areas containing cover
(woody debris) (Austin and Hurley 1987). Inshore habitat use of juvenile striped bass in
Lake Texoma, Oklahoma-Texas, was found to be the highest for areas with substrates of
either fine gravel or sand (Matthews et al. 1992). Additionally, Sutton (1997) reported
catch-per-unit-effort of striped bass in Smith Mountain Lake, Virginia, to be highest in
98
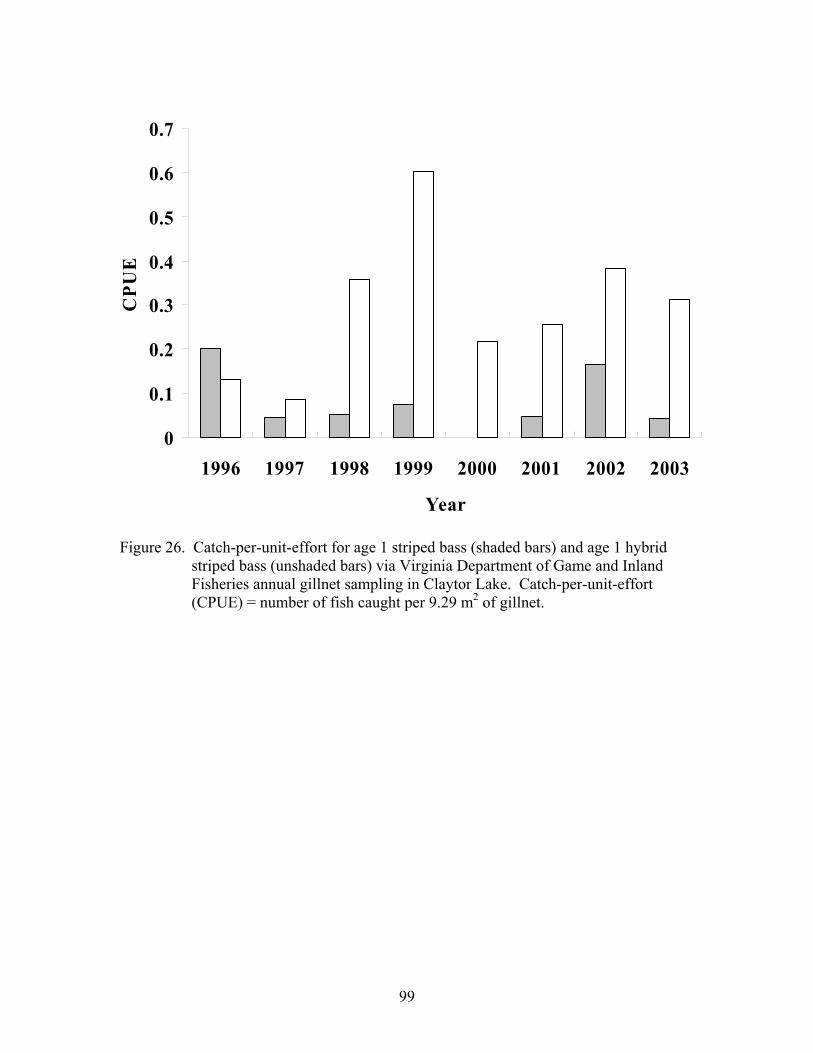
Figure 26. Catch-per-unit-effort for age 1 striped bass (shaded bars) and age 1 hybrid striped bass (unshaded bars) via Virginia Department of Game and Inland Fisheries annual gillnet sampling in Claytor Lake. Catch-per-unit-effort (CPUE) = number of fish caught per 9.29 m2 of gillnet.
0
0.1
0.2
0.3
0.4
0.5
0.6
0.7
1996 1997 1998 1999 2000 2001 2002 2003
Year
CPU
E
99

shallow, structureless zones containing a mixture of sand and gravel that graded
gradually to deep water.
Habitat overlap values as calculated in this study were low due to striped bass and
hybrid striped bass utilizing the same habitats, but not having habitat use coincide
temporally. Perhaps, increased monitoring of habitat overlap (more than once a month)
would have revealed higher overlap values. During weekly specimen collection for the
remaining objectives of the study, juvenile hybrid striped bass were always collected in
the presence of juvenile striped bass. Thus, it appears that habitat overlap values in this
study may be unrepresentative of the actual habitat utilization of age-0 striped bass and
age-0 hybrid striped bass, and habitat electivity values were accurate regarding the
habitat preference for these fishes in Claytor Lake as sand and gravel substrates lacking
cover.
Predation The effects of predation upon the first-year survival of juvenile striped bass and
juvenile hybrid striped bass in Claytor Lake were minimal. None of the predators
sampled following striped bass stocking were found to have consumed a fingerling
striped bass, and only three of ninety-five predator stomachs examined after the stocking
of hybrid striped bass contained a hybrid striped bass fingerling. The insignificant
amount of predation on juvenile Morone in Claytor Lake is consistent with that reported
within the literature. Austin and Hurley (1987) reported that post-stocking predation was
not a significant source of mortality of newly-stocked hybrid striped bass in East Fork
Lake, Ohio. In the Pamunkey River, Virginia, predation by fishes upon both eggs and
larvae of striped bass was not observed (McGovern and Olney 1998).
100
In addition, the loss of fingerling striped bass in Smith Mountain Lake, Virginia,
via predation by largemouth bass was not found to significantly contribute to the
mortality of fingerlings (Michaelson 1996; Michaelson et al. 2001). Michaelson et al.
(2001) estimated largemouth bass population size and daily consumption (bioenergetics
modeling) to calculate the total number of striped bass consumed. When applied to a
bioenergetics model, the minute percentage of largemouth bass that consumed a
fingerling striped bass only equaled an estimated percentage loss of striped bass to
largemouth bass in Smith Mountain Lake of 0.1 to 1.2%, which equates to 360 to 3062
fingerlings lost to predation (Michaelson et al. 2001). If the total percentages of
fingerlings lost to predation, as estimated by Michaelson et al. (2001), were applied to
fingerlings stocked in Claytor Lake, loss of fingerling hybrid striped bass would only
range from 35 to 420 individuals. In addition, during this period of increased fingerling
vulnerability following stocking, Micropterus spp. (the principal littoral predator in
Claytor Lake) were found to primarily consume bluegill and crayfish in Claytor Lake
(Bonds 2000).
The higher incidence of predation on hybrid striped bass than on striped bass may
be associated with the larger size at stocking of hybrid striped bass versus striped bass.
Michaelson et al. (2001) found that in pool experiments, largemouth bass preferred adult
alewife (mean = 109 mm TL) to smaller striped bass fingerlings (mean = 66 mm TL).
Thus, the larger size of hybrid striped bass fingerlings at the time of stocking (mean = 94
mm TL) may prove to be more attractive to potential predators, especially black basses.
However, such a low percentage of occurrence (3%) for hybrid striped bass in the diets of
Claytor Lake predators is also indicative of incidental, opportunistic feeding.
101

Regardless, immediate post-stocking predation upon fingerling striped bass and
fingerling hybrid striped bass had a negligible impact upon first-year mortality of these
fishes in Claytor Lake.
102
SUMMARY AND CONCLUSIONS
1. In 2001, approximately 70,000 striped bass were stocked in early June and
approximately 33,500 hybrid striped bass were stocked in mid-September. The
following year, approximately 70,000 striped bass were stocked in mid-June, and
approximately 33,500 hybrid striped bass were stocked in late August. In the
2001-2002 sampling season, I recaptured 842 striped bass and only three hybrid
striped bass, and during the 2002-2003 sampling season, I recaptured 665 and
119, striped bass and hybrid striped bass, respectively.
2. Diagnostic meristic features failed to positively differentiate striped bass and
hybrid striped bass fingerlings from the 2001 stockings (although they worked
well for moronids stocked in 2002). Genetic analysis supported the conclusion
that F1 hybrids were supplied by Keo Fish Farm (Keo, Arkansas). However, only
three specimens of the approximately 33,500 stocked in late September, at a mean
total length of 68 mm, were recaptured in this study.
3. Due to low capture success for hybrid striped bass, I was unable to compare
performance of striped bass and hybrid striped bass in the 2001-2002 sampling
season. However, in the 2002-2003 sampling season, comparisons between the
fishes were possible due to the collection of 119 hybrid striped bass and 665
striped bass throughout the sampling period.
4. Both striped bass and hybrid striped bass exhibited accelerated initial growth,
followed by a plateau in growth from October until the end of the growing season.
During the period of linear growth, striped bass displayed growth rates of 1.10
and 0.81 mm/day in 2001 and 2002, respectively. Hybrid striped bass during the
103
period of linear growth were found to grow at a rate of only 0.52 mm/day in 2002.
The rates observed in this study were consistent with those reported within the
literature for striped bass, but the growth rate was lower for hybrid striped bass,
possibly because they were stocked late in the growing season.
5. In 2001-2002, striped bass suffered from size-dependent overwinter mortality, as
evidenced by the loss of individuals less than 150 mm TL from the population.
However, both species increased in mean total length between fall 2002 and
spring 2003 collections, most likely due to early spring growth.
6. During the growing season, both striped bass and hybrid striped bass each
demonstrated a shift in food habits at approximately 120 mm TL. Smaller
individuals preyed predominately upon aquatic insects and zooplankton, while
individuals over 120 mm TL ate mainly age-0 fishes. Striped bass fed mainly
upon age-0 alewife, while hybrid striped bass utilized age-0 sunfishes as prey.
Striped bass and hybrid striped bass diets did not significantly overlap during the
growing season.
7. Striped bass and hybrid striped bass exhibited significant diet overlap in spring
2003 when both predominately ate alewife and were growing rapidly.
8. In 2001, striped bass experienced decreases in condition factor (K) and relative
weight values over the growing season of 15 and 14%, respectively. Condition
factor and relative weight values declined for both striped bass (7 and 12%,
respectively) and hybrid striped bass (35 and 20%, respectively) over the 2002
growing season. However, both fishes were found to be in poor condition
throughout the duration of this study, with striped bass monthly mean condition
104

factor and relative weight values ranging from 0.88-1.17 and 74-86, respectively,
and hybrid striped bass exhibited a range in monthly mean condition factor and
relative weight values of 0.88-1.22 and 70-85, respectively.
9. In the 2001-2002 sampling season, when loss of individuals less than 150 mm TL
due to overwinter mortality was documented, these smaller striped bass (< 150
mm TL) had 8% lower lipid index values than larger (> 150 mm TL) individuals
entering the winter. Lipid index values for all individuals declined 2% from fall
2001 to spring 2002. In the 2002-2003 sampling season, striped bass lipid index
values decreased 4%, while hybrid striped bass lipid index values increased 8%
over the winter. There was no significant difference between spring striped bass
and hybrid striped bass lipid index values.
10. Habitat overlap values were not found to be significant, but habitat electivity
values indicated a preference by both age-0 fishes for sand or gravel substrates
without cover.
11. Predation upon fingerling striped bass and fingerling hybrid striped bass was not
significant in limiting juvenile recruitment to age 1. None of the 105 predators
sampled following the stocking of striped bass contained a striped bass fingerling,
and only 3 of the 95 predators sampled following the stocking of hybrid striped
bass consumed a hybrid striped bass fingerling.
Since the 1993 introduction of hybrid striped bass, VDGIF catch-per-unit-effort
data from fall gillnet monitoring has shown that striped bass relative abundance declined
79% by 2000 (Bonds 2000; Kilpatrick 2003) while hybrid striped bass numbers have
105
continued to climb (J. Copeland, VDGIF, pers. comm.). The results of this study indicate
that the decline in striped bass numbers since the introduction of hybrid striped bass is
not likely due to competitive interactions at the age-0 life-stage. Although both fishes
were found to prefer the same habitat types, they did not eat the same prey items during
the growing season. In addition, both fishes had equivalent indices of health values.
Thus, under the current management plan, it appears that the delayed stocking of hybrid
striped bass helps to alleviate the competition between these age-0 fishes before the onset
of winter.
Perhaps loss of biomass is occurring in a later life-stage of striped bass in Claytor
Lake. Kilpatrick (2003) reported adult striped bass and adult hybrid striped bass to
occupy similar habitats within Claytor Lake, but hybrid striped bass were not limited by
the constraints of summer time habitat loss, due to higher thermal tolerance. Thus,
during this period of increased stress, hybrid striped bass are able to utilize additional
resources within the reservoir, while striped bass are habitat limited (Kilpatrick 2003).
Although less probable, another potential cause of the striped bass decline in
Claytor Lake could be related to changes in Claytor Dam operations. Since 1991, Claytor
Dam has operated under run-of-the-river conditions from April to October and
hydropeaking operations from October to April, in contrast to year round hydropeaking
operations before 1991 (J. Copeland, VDGIF, pers. comm.). Kilpatrick (2003) reported
suitable summertime refuge habitat for adult striped bass (< 25°C, > 2.5 mg/L of
dissolved oxygen) to exist at depths level with penstock openings for water discharge
through Claytor Dam. In fact, Kilpatrick (2003) found the temperature of Claytor Dam’s
discharge into the New River to correspond to the temperature of critical summertime
106

habitat within the reservoir. Along with the documentation of loss of habitat through the
dam, Kilpatrick (2003) also noted the presence of adult moronids below Claytor Dam.
Thus, given the continuous flow of critical habitat out of the reservoir during summer
months and the highly migratory nature of striped bass, increased emigration of adults,
which are confined to summertime refuge habitat, could be occurring.
Lastly, this study was inadequate to definitively prove that juvenile striped bass
and juvenile hybrid striped bass are trophically compatible. It appears that trophic
overlap in the fall is avoided via late stocking of hybrid striped bass, but perhaps
significant trophic overlap occurs in the spring before growth starts. I did find high diet
overlap among striped bass and hybrid striped bass once I was able to capture them in
late April 2003, when both fishes primarily consumed alewife. If both striped bass and
hybrid striped bass rely upon alewife as forage following winter, potential trophic
competition could occur at this period. This is especially important because energy
reserves of juvenile moronids are significantly reduced over the winter, and the
immediate acquisition of food following winter is required to maintain metabolic
processes. Thus, if hybrid striped bass are able to feed upon alewife (that may become
scarce if overwinter die-offs occur) at a period when less temperature-tolerant striped
bass could not, hybrid striped bass could in fact out compete striped bass for the
necessary food sources in early spring. Therefore, given my inability to assess trophic
compatibility across all seasons for these fishes during their first year of life, further
investigation into the understanding of the mechanisms influencing post-winter survival
is warranted.
107
MANAGEMENT RECOMMENDATIONS
1. To avoid substantial diet overlap between striped bass and hybrid striped bass,
hybrid striped bass should continue to be stocked later in the growing season than
striped bass. Stocking hybrid striped bass fingerlings in August allows striped
bass (stocked in June) to utilize age-0 alewife as prey throughout the growing
season, while not having to share the resource with age-0 hybrid striped bass. In
addition, the later stocking date of hybrid striped bass does not appear to limit
their recruitment to adults. As a result, VDGIF should continue to stock striped
bass in early June and hybrid striped bass in mid to late August to minimize
potential competition between the two fishes.
2. It is important to carefully choose suppliers, along with size, of hybrid striped
bass fingerlings. This recommendation is especially applicable if VDGIF is
satisfied with the product being received and performance of the fish is to be
monitored. Based upon the current stocking rate of approximately 33,500 hybrid
striped bass fingerlings per year, VDGIF should request fingerlings at a limit of
approximately 45 fish/lb. This will enable VDGIF to receive large, phase I
fingerlings (approximately 10 g) that should possess adequate energy reserves to
survive the over winter period.
3. VDGIF should target age-0 moronids in both fall (November and December) and
spring (March and April) sampling efforts to gain further insight into potential
overwinter mortality of these fishes. Collection efforts should include the use of
both gillnets and electrofishing to capture juveniles representative of all size
ranges present. Comparisons of length-frequency distributions before and after
108

winter should be made to detect the overwinter loss of smaller individuals. In
addition, diet analysis during both periods should be conducted. Further
knowledge of post-winter compatibility of these fishes is warranted, and if diet
analysis reveals trophic overlap before spring growth occurs, further study of the
compatibility of striped bass and hybrid striped bass is needed. Continued
monitoring of these juvenile fishes is especially important given the brevity of this
study, and my inability to compare the performance of the two fishes for more
than one year.
109
LITERATURE CITED
Anderson, R. O. and R. M. Neuman. 1996. Length, weight, and associated structural indices. Pages 447-482 in B. R. Murphy and D. W. Willis, editors. Fisheries techniques, 2nd edition. American Fisheries Society, Bethesda, Maryland.
Austin, M. R., and S. T. Hurley. 1987. Evaluation of a striped bass (Morone saxatilis) x white bass (Morone chrysops) hybrid introduction in East Fork Lake, Ohio. Ohio Division of Wildlife, Federal Aid in Fish Restoration Project F-29-R, Study 20, Final Report, Columbus, Ohio, USA.
Axon, J. R. 1979. An evaluation of striped bass introductions in Herrington Lake. Kentucky Department of Fish and Wildlife Resources, Fisheries Bulletin 63. Axon, J. R., and D. K. Whitehurst. 1985. Striped bass management in lakes with emphasis on management problems. Transactions of the American Fisheries Society 114:8-11.
Bailey, W. M. 1975. An evaluation of striped bass introductions in the Southeastern United States. Proceedings of the Annual Conference of the Southeastern Association of Fish and Wildlife Agencies 28:54-68.
Bain, B. B.1999. Substrate. Pages 95-104 in M. B. Bain and N. J. Stevenson, editors.
Aquatic Habitat Assessment. American Fisheries Society, Bethesda, Maryland.
Bishop, D. R. 1967. Evaluation of the striped bass (Roccus saxatilis) and white bass (R. chrysops) hybrids after two years. Proceedings of the Annual Conference of the Southeastern Association of Fish and Wildlife Agencies 21:245-254.
Benard, G., and M. G. Fox. 1997. Effects of body size and population density on
overwinter survival of age-0 pumpkinseeds. North American Journal of Fisheries Management 17:581-590.
Boaze, J. L. 1972. Effects of landlocked alewife introductions on white bass and walleye
populations, Claytor Lake, Virginia. Master’s thesis. Virginia Polytechnic Institute and State University, Blacksburg, Virginia.
Bonds, C. C. 2000. Assessment of the response of piscivorous sportfishes to the
establishment of gizzard shad in Claytor Lake, Virginia. Master’s thesis. Virginia Polytechnic Institute and State University, Blacksburg, Virginia.
Bowen, S. H. 1996. Quantitative description of the diet. Pages 513-532 in B. R. Murphy
and D. W. Willis, editors. Fisheries techniques, 2nd edition. American Fisheries Society, Bethesda, Maryland.
110
Brown, M. L., and B. R. Murphy. 1991a. Relationship of relative weight (Wr) to proximate composition of juvenile striped bass and hybrid striped bass. Transactions of the American Fisheries Society 120:509-518. Brown, M. L., and B. R. Murphy. 1991b. Standard weights (Ws) for striped bass, white
bass, and hybrid striped bass. North American Journal of Fisheries Management 11:451-467.
Busacker, G. P., I. R. Adelman, and E. M. Goolish. 1990. Growth, Pages 363-387 in C. B. Schreck and P. B. Moyle, editors. Methods for fish biology. American Fisheries Society, Bethesda, Maryland.
Cheek, T. E., M. J. Van Den Avyle, and C. C. Coutant. 1985. Influences of water quality
on distribution of striped bass in a Tennessee River impoundment. Transactions of the American Fisheries Society 114:67-76.
Chevalier, J. R. 1973. Cannibalism as a factor in first year survival of walleye in Oneida
Lake. Transactions of the American Fisheries Society 102:739-744. Copeland, J. R. 1999. Claytor Lake management report 1998. F111R7, Final Report.
Virginia Department of Game and Inland Fisheries, Richmond, Virginia. Coutant, C. C. 1985. Striped bass, temperature, and dissolved oxygen: a speculative hypothesis for environmental risk. Transactions of the American Fisheries Society 114:31-61. Cox, D. K., and C. C. Coutant. 1981. Growth dynamics of juvenile striped bass as
functions of temperature and ration. Transactions of the American Fisheries Society 110:226-238.
Craig, J. F. 1982. Population dynamics of Windermere perch. Report of the Freshwater
Biological Association 50:49-59.
Crandall, P. S. 1978. Evaluation of striped bass x white bass hybrids in a heated Texas reservoir. Proceedings of the Annual Conference of the Southeastern Association of Fish and Widllife Agencies 32:588-598.
Crowder, L. B. 1990. Community ecology. Pages 609-632 in C. B. Schreck and P. B. Moyle, editors. Methods for fish biology. American Fisheries Society, Bethesda, Maryland.
Cunjak, R. A., and G. Power. 1986. Seasonal changes in the physiology of brook trout,
Salvelinus fontinalis (Mitchill), in a sub-Arctic river system. Journal of Fish Biology 29:279-288.
111
Dey, W. P. 1981. Mortality and growth of young-of-the-year striped bass in the Hudson River estuary. Transactions of the American Fisheries Society 110:151-157.
Erickson, K. E., J. Harper, G. C. Mesinger, and D. Hicks. 1971. Status and artificial
reproduction of striped bass from Keystone Reservoir, Oklahoma. Proceedings of the Annual Conference Southeastern Association of Game and Fish Commissioners 25:513-522.
Forney, J. L. 1966. Factors affecting first-year growth of walleyes in Oneida Lake, New York. New York Fish and Game Journal 13:146-167.
Fullerton, A. H., J. E. Garvey, R. A. Wright, and R. A. Stein. 2000. Overwinter growth
and survival of largemouth bass: interactions among size, food, origin, and winter severity. Transactions of the American Fisheries Society 129:1-12.
Garvey, J. E., A. Wright, and R. A. Stein. 1998. Overwinter growth and survival of age-0
largemouth bass (Micropterus salmoides): revisiting the role of body size. Canadian Journal of Fisheries and Aquatic Sciences 55:2414-2424.
Gilliland, E. R., and M. D. Clady. 1981. Diet overlap of striped bass x white bass hybrids
and largemouth bass in Sooner Lake, Oklahoma. Proceedings of the Annual Conference of the Southeastern Association of Fish and Wildlife Agencies 35:317-330.
Goodwin, K. R. and P. L. Angermeier. 2003. Demographic characteristics of American
eel in the Potomac River Drainage, Virginia. Transactions of the American Fisheries Society 132:524-535.
Gotceitas, V., D. A. Methven, S. Fraser, and J. Brown. 1999. Effects of body size and
food ration on over-winter survival and growth of age-0 Atlantic cod, Gadus morhua. Environmental Biology of Fishes 54:413-420.
Han, K., L. Li, G. M. Leclerc, A. M. Hays, and B. Ely. 2000. Isolation and
characterization of microsatellite loci for striped bass (Morone saxatilis). Marine Biotechnology 2:405-408.
Harper, J. L., and R. Jarman. 1971. Investigation of striped bass, Morone saxatilis (Walbaum), culture in Oklahoma. Proceedings of the Annual Conference of the Southeastern Association of Fish and Wildlife Agencies 25:501-512. Harrell, R. M., and J. M. Dean. 1988. Identification of juvenile hybrids of Morone based
on meristics and morphometerics. Transactions of the American Fisheries Society 117:529-535.
112
Harrell, R. M., D. W. Meritt, J. N. Hochheimer, D. W. Webster, and W. D. Miller. 1988. Overwintering success of striped bass and hybrid striped bass held in cages in Maryland. The Progressive Fish-Culturist 50:120-121.
Hollander, M. and D. A. Wolfe. 1999. Nonparametric statistical methods, second editon.
John Wiley and Sons, Inc., New York, New York. Hurst, T. P., and D. O. Conover. 1998. Winter mortality of young-of-the-year Hudson
River striped bass (Morone saxatilis): size-dependent patterns and effects on recruitment. Canadian Journal of Fisheries and Aquatic Sciences 55:112-1130.
Hyslop, E. J. 1980. Stomach contents analysis – a review of methods and their application. Journal of Fish Biology 17:411-429. Jenkins, R. E., and N. M. Burkhead. 1993. Freshwater fishes of Virginia. American
Fisheries Society, Bethesda, Maryland. Johnson, T. B., and D. O. Evans. 1990. Size dependent winter mortality of young-of-the-
year white perch: climate warming and invasion of the Laurentian Great Lakes. Transactions of the American Fisheries Society 119:301-313.
Kerby, J. H. 1979a. Morphometric characters of two Morone hybrids. Proceedings of the
Annual Conference of the Southeastern Association of Fish and Wildlife Agencies 33:344-352.
Kerby, J. H. 1979b. Meristic characters of two Morone hybrids. Copeia 1979:513-518. Kerby, J. H., J. M. Hinshaw, and M. T. Huish. 1987. Increased growth and production of
striped bass x white bass hybrids in earthen ponds. Journal of the World Aquaculture Society 18:35-43.
Kilpatrick, J. M. 2003. Habitat use, movements, and exploitation of striped bass and
hybrid striped bass in Claytor Lake,Virginia. Master’s thesis. Virginia Polytechnic Institute and State University, Blacksburg, Virginia.
Kinman, B. T. 1987. Evaluation of hybrid striped bass introductions in Herrington Lake.
Fisheries Bulletin of the Kentucky Department of Fish and Wildlife Resources No. 82.
Kohler, C. C., J. J. Ney, and W. E. Kelso. 1986. Filling the void: development of a
pelagic fishery and its consequences to littoral fishes in a Virginia mainstream reservoir. Pages 166-177 in G. E. Hall and M. J. Van Den Avyle, editors. Reservoir Fisheries Management: Strategies for the 80s. American Fisheries Society, Bethesda, Maryland.
113
Layzer, J. B., and M. D. Clady. 1981. Evaluation of the striped bass x white bass hybrid for controlling stunted bluegills. Proceedings of the Annual Conference of the Southeastern Association of Fish and Wildlife Agencies 35:297-310.
Le Cren, E. D. 1951. The length-weight relationship and seasonal cycle in gonad weight
and condition in the perch (Perca flavescens). Journal of Animal Ecology 20:201-219.
Logan, H. J. 1967. Comparison of growth and survival rates of striped bass and striped bass x white bass hybrids under controlled environments. Proceedings of the Annual Conference of the Southeastern Association of Fish and Wildlife Agencies 21:260-263. Markle, D. F., and G. C. Grant. 1970. The summer food habits of young-of-the-year
striped bass in three Virginia rivers. Chesapeake Science 11:50-54. Matthews, W. J., L. G. Hill, D. R. Edds, J. J. Hoover, and T. G. Heger. 1988. Trophic ecology of striped bass, Morone saxatilis, in a freshwater reservoir (Lake Texoma, U. S. A). Journal of Fish Biology 33:273-288. Matthews, W. J., F. P. Gelwick, and J. J. Hoover. 1992. Food and habitat use by juveniles of species of Micropterus and Morone in a southwestern reservoir. Transactions of the American Fisheries Society 121:54-66. McGovern, J. C., and J. E. Olney. 1988. Potential predation by fish and invertebrates on early life history stages of striped bass in Pamunkey River, Virginia. Transactions of the American Fisheries Society 117:152-161. Mensinger, G. C. 1970. Observations on the striped bass, Morone saxatilis, in Keystone Reservoir, Oklahoma. Proceedings of the Annual Conference of the Southeastern Association of Fish and Wildlife Agencies 24:447-463. Michaelson, D. P. 1996. Impacts of stocking stress and largemouth bass predation on the
survivorship of juvenile striped bass stocked in Smith Mountain Lake, Virginia. Master’s thesis. Virginia Polytechnic Institute and State University, Blacksburg, Virginia.
Michaelson, D. P., J. J. Ney, and T. M. Sutton. 2001. Largemouth bass predation on stocked striped bass in Smith Mountain Lake, Virginia. Transactions of the American Fisheries Society 21:326-332. Minton, J. W. and R. B. McLean. 1982. Measurements of growth and consumption of
sauger (Stizostedion canadense): implication for fish energetics studies. Canadian Journal of Fisheries and Aquatic Sciences 39:1396-1403.
114

Moore, C. M., R. J. Neves, and J. J. Ney. 1991. Survival and abundance of stocked striped bass in Smith Mountain Lake, Virginia. North American Journal of Fisheries Management 11:393-399. Moss, L. J., and C. S. Lawson. 1982. Evaluation of striped bass and hybrid striped bass stockings in eight Alabama public fishing lakes. Proceedings of the Annual Conference of the Southeastern Association of Fish and Wildlife Agencies 36:33- 41. Muoneke, M. I., O. E. Maughan, and M. E. Douglas. 1991. Multivariate morphometric
analysis of striped bass, white bass, and striped bass x white bass. North American Journal of Fisheries Management 11:330-338.
Nielsen, L. A. 1980. Effect of walleye (Stizostedion vitreum vitreum) predation on juvenile mortality and recruitment of yellow perch (Perca flavescens) in Oneida Lake, New York. Canadian Journal of Fisheries and Aquatic Sciences 37:11-19.
Ott, L. R. and M. Longnecker. 2001. Statistical methods and data analysis, fifth edition.
Wadsworth Group, Pacific Grove, California. Ott, R. A., Jr., and S. P. Malvestuto. 1981. The striped bass x white bass hybrid in West Point Reservoir. Proceedings of the Annual Conference of the Southeastern Association of Fish and Wildlife Agencies 35:641-646. Palmer, G. C. 1999. Genetic characterization and intermixing of walleye stocks in
Claytor Lake and the upper New River, Virginia. Master’s thesis. Virginia Polytechnic Institute and State University, Blacksburg, Virginia.
Post, J. R., and D. O. Evans. 1989. Size-dependent overwinter mortality of young-of-the-year yellow perch (Perca flavenscens): laboratory, in situ enclosure, and field experiments. Canadian Journal of Fisheries and Aquatic Sciences 46:1958-1968.
Post, J. R., and E. A. Parkinson. 2001. Energy allocation strategy in youn fish: allometry
and survival. Ecology 82:1040-1051. Roy, N. K., L. Maceda, and I. Wirgin. 2000. Isolation of microsatellites in striped bass
Morone saxatilis (Teleostei) and their preliminary use in population identification. Molecular Ecology 9:817-829.
Rudacille, J. B. and C. C. Kohler. 2000. Aquaculture performance comparison of
sunshine bass, palmetto bass, and white bass. North American Journal of Aquaculture 62:114-124.
Santucci, V. J., and D. H. Wahl. 1993. Factors influencing survival and growth of stocked
walleye (Stizostedion vitreum) in a centrarchid-dominated impoundment. Canadian Journal of Fisheries and Aquatic Sciences 50:1548-1558.
115
Saul, B. M., and J. L. Wilson. 1981. Food habits and growth of young-of-the-year white
bass x striped bass hybrids in Cherokee Reservoir, Tennessee. Proceedings of the Annual Conference of the Southeastern Association of Fish and Wildlife Agencies 35:311-316.
Schoener, T. W. 1970. Non-synchronous spatial overlap of lizards in patchy habitats. Ecology 51:408-418.
Stein, R. A., R. F. Carline, and R. S. Hayward. 1981. Largemouth bass predation on stocked tiger muskellunge. Transactions of the American Fisheries Society 110:604-612.
Stevens, R. E. 1958. The striped bass of the Santee-Cooper reservoir. Proceedings of the Annual Conference of the Southeastern Association of Fish and Wildlife Agencies 11:253-264. Strange, R. J., and J. C. Pelton. 1987. Nutrient content of clupeid forage fishes.
Transactions of the American Fisheries Society 116:60-66. Sutton, T. M. 1997. Early life history dynamics of a stocked striped bass (Morone saxatilis) population and assessment of strategies for improving stocking success in Smith Mountain Lake, Virginia. Doctoral dissertation. Virginia Polytechnic Institute and State University, Blacksburg, Virginia. Sutton, T. M. and J. J. Ney. 2001. Size-dependent mechanisms influencing first-year
growth and winter survival of stocked striped bass in a Virginia mainstream reservoir. Transactions of the American Fisheries Society 130:1-17.
Thompson, J. M., E. P. Bergersen, C. A. Carlson, and L. R. Kaeding. 1991. Role of size,
condition, and lipid content in the overwinter survival of age-0 Colorado squawfish. Transactions of the American Fisheries Society 120:346-353.
Timmons, T. J., W. L. Shelton, and W. D. Davies. 1980. Differential growth of
largemouth bass in West Point Reservoir, Alabama-Georgia. Transactions of the American Fisheries Society 109:176-186.
Tisa, M. S. 1988. Compatibility and complementarity of alewife Alosa pseudoharengus
and gizzard shad Dorosoma cepedianum as forage fish in Smith Mountain Lake,Virginia. Doctoral dissertation. Virginia Polytechnic Institute and State University, Blacksburg, Virginia.
Toneys, M. L., and D. W. Coble. 1980. Mortality, hematocrit, osmolality, electrolyte
regulation, and fat depletion of young-of-the-year freshwater fishes under simulated water conditions. Canadian Journal of Fisheries and Aquatic Sciences 37:225-232.
116

Tuncer, H., R. M. Harrell, and E. D. Houde. 1990. Comparative energetics of striped bass (Morone saxatilis) and hybrids (M. saxatilis x M. chrysops) juveniles. Aquaculture 86:387-400.
Van Den Avyle, M. J., and B. J. Higginbotham. 1979. Growth, survival, and distribution of striped bass stocked into Watts Bar Reservoir, Tennessee. Proceedings of the Annual Conference of the Southeastern Association of Fish and Wildlife Agencies 33:361-370. Van Den Avyle, M. J., B. J. Higginbotham, B. T. James, and F. J. Bulow. 1983. Habitat preferences and food habits of young-of-the-year striped bass, white bass, and yellow bass in Watts Bar Reservoir, Tennessee. North American Journal of Fisheries Management 3:163-170. Virginia Agricultural Experiment Station. 2003. Kentland Farm Operation-Weather Data,
1999-2003. Virginia Polytechnic Institute and State University. Available: www.vaes.vt.edu/colleges/kentland/weather/. (September 2003).
Wege, G. J., and R. O. Anderson. 1978. Relative weight (Wr): a new index of condition
for largemouth bass. Pages 79-91 in G. D. Novinger and J. G. Dillard, editors. New approaches to the management of small impoundments. American Fisheries Society, North Central Division, Special Publication 5, Besthesda, Maryland.
Ware, F. J. 1970. Some early life history of Florida’s inland striped bass, Morone saxatilis. Proceedings of the Annual Conference of the Southeastern Association of Fish and Wildlife Agencies 24:439-447. Woiwode, J. G. and I. R. Adelman. 1991. Effects of temperature, photoperiod, and ration
size on growth of hybrid striped bass x white bass. Transaction of the American Fisheries Society 120:217-229.
Zhang, Q., R. C. Reigh, and W. R. Wolters. 1994. Growth and body composition of
pond-raised hybrid striped basses, Morone saxatilis x M. chrysops and M. saxatilis x M. mississippiensis, fed low and moderate levels of dietary lipid. Aquaculture 125:119-129.
117

VITA
Jacob Michael Rash was born on April 20, 1978, in Statesville, North Carolina.
His love for the aquatic world was fostered by the numerous fishing trips that he and his
father enjoyed. Following graduation from North Iredell High School in 1996, he began
his collegiate studies at North Carolina State University in Raleigh, North Carolina.
After receiving his Bachelor’s degree in Zoology from North Carolina State University,
he entered the graduate program in the department of Fisheries and Wildlife Sciences in
August 2001 at Virginia Polytechnic Institute and State University to pursue a Master of
Science degree in Fisheries Science. During his stay at Virginia Polytechnic Institute and
State University, he served as both a Teaching Assistant and Research Assistant, studying
the ecology of juvenile striped bass and juvenile hybrid striped bass in Claytor Lake,
Virginia.
118
Related Documents