COMPARATIVE COSTS OF IA SYSTEMS by Estelle James prepared for delivery at World Bank Institute Pension Reform Seminar, Budapest, 2001

COMPARATIVE COSTS OF IA SYSTEMS by Estelle James prepared for delivery at World Bank Institute Pension Reform Seminar, Budapest, 2001.
Jan 02, 2016
Welcome message from author
This document is posted to help you gain knowledge. Please leave a comment to let me know what you think about it! Share it to your friends and learn new things together.
Transcript

COMPARATIVE COSTS OF IA SYSTEMS
by
Estelle Jamesprepared for delivery at World Bank Institute Pension Reform Seminar,
Budapest, 2001

Comparative costs of IA systems
• Prefunding desirable--financial sustainability and long term saving
• Danger of political manipulation and low returns to publicly managed funds
• But decentralized individual accounts (IA’s) may have high administrative costs
• What is the most cost-effective way to organize IA systems?
– Key choice: retail or institutional market?

We compare:1) IA’s in retail market
• Direct relation between individual & fund
• Open entry, free choice, unrestricted fee
• Retail funds incur high marketing costs
• Administrative costs are 15-30% of new contributions, equivalent to .75-1.5% of assets per year for lifetime worker
• Examples: Latin America, Poland, Hungary, Kazakhstan, UK, US mutual funds

2) IA’s in institutional market• Intermediary aggregates IA contributions; main
competition is for market access: – competitive bidding over fees narrows eligible
pension funds to small number – winners compete for workers’ money but are likely to
get large money blocs
• Best if R&C and investment are separated • Costs are half as much as in retail market <
10% of new contributions, < .5% of assets, even less with passive investing
• Bolivia, industry funds in Australia, US TSP, US pension funds, Sweden
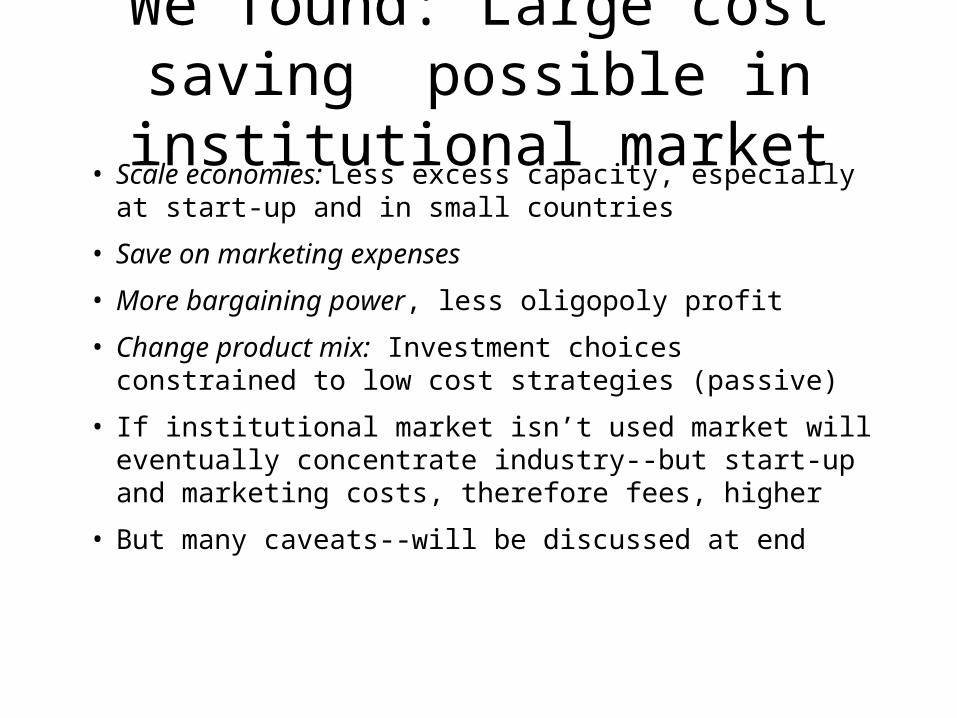
We found: Large cost saving possible in institutional market
• Scale economies: Less excess capacity, especially at start-up and in small countries
• Save on marketing expenses
• More bargaining power, less oligopoly profit
• Change product mix: Investment choices constrained to low cost strategies (passive)
• If institutional market isn’t used market will eventually concentrate industry--but start-up and marketing costs, therefore fees, higher
• But many caveats--will be discussed at end

Evidence from retail markets 1) Chile
• Admin costs in Chile overstated but are higher than we would like
• 15.6% of new contributions & final pension
• Equivalent to .76% of assets per year over lifetime of full career worker
• Snapshot: Annual costs 9% of assets initially, now 1.1% ($59 per acct); fees 1.3%
• Marketing costs about half of total

Costs of Chilean AFP System, 1982-1998
Relation Between Fee as % of Assets andAverage Account Size
0
1
2
3
4
5
6
7
8
9
10
0 1 2 3 4 5 6
Assets per Affiliate (1998 thousands US$)
Fee
per
Uni
t of A
sset
s (%
)

Economies of scale• My analysis shows scale economies continue
until 3 million affiliates, $15 billion per AFP--half total industry in Chile
• Concentration is being achieved through market (previously 20, now 7-8 AFP’s)
• Will probably fall to 5 AFP’s--scale economies but marketing costs continue
• Institutional approach would get us there faster, and with lower equilibrium costs, but raises other problems

2) Latin America
• Cost and fee is 15-25% of contributions
• Per unit of assets 4-9% ($21-98 per acct)
• Scale: Costs lower for larger AFP’s
• Expenses smaller in Bolivia (institutional approach) and Chile (size, experience, concentration)

C osts o f L atin A m erican A F P S ystem s, 1998
R ela tion B etw een C ost as % of A sse ts an dA verage A ccou n t S ize
0
1
2
3
4
5
6
7
8
9
10
0 1 2 3 4 5 6
Assets per Aff ilia te (U S $ 000 's )
Expe
nses
per
Uni
t of A
sset
s (%
)
C hile
B o livia
M e xico

3) U.S. Mutual funds
• Many years of operation, very large, service
• Costs & fees more dispersed but similar to Chile: average = 1.4% of assets
• Costs are lower for: larger funds, no-loads (no commissions), passive investments
• Marketing expenses about 50% of total cost
• Higher costs don’t lead to higher returns

U.S. Mutual Fund Costs, 1997
As % of Assets
Actively Managed Passively Managed
Asset Management 0.64 0.11
Marketing 0.65 0.03
R&C Costs 0.12 0.05
Other 0.08 0.13
Total 1.50 0.32
In $’s per Account
Actively Managed Passively Managed
Asset Management 160 28
Marketing 163 8
R&C Costs 30 13
Other 20 33
Total 375 80

Institutional market--1) U.S.• Large investors pay .04-.08% of assets for
passive mgt, .35-.65% for active mgt. + .1-.15% for other expenses. Half retail costs, lower for large institutions.
• Reasons for lower fees:– Large money blocs--scale economies– Low marketing costs– Low R&C costs– Heavy use of passive investment– Better information, bargaining power

Long Run Costs of Retail and
Institutional Markets in US
(in basis points)
Retail 1 Institutional 2
Passive Active Passive Active
Asset management 3 11 64 4-8 35-65
Marketing 3 65 1 5
R & C 5 12 9 9
Other 13 8 6 6
Total cost 32 150 14 – 18 49 - 79
$ cost per $25,000 account 80 375 35 - 45 122 - 197
1. Average for mutual fund2. Range for institutional investors3. Includes brokerage fees for trading

2) Bolivia
• International bidding process, 2 winners, no switching (greater entry & switching later)
• Fee structure: 5% contributions+.43% assets
• Equivalent to: .56% for full career worker
• Snapshot today: 3% of assets, $16 per account
• Much cheaper than Chile at start-up

Bolivia: caveats
• Is saving due to competitive bidding & no marketing or to lumping IA’s with large privatization assets & cross-subsidization?
• Potential problems: service, performance incentives, regulation, unexpected contingencies, rebidding problems

3) U.S. thrift savings plan
• Voluntary IA plan for federal government employees with matching contributions
• Competitive bidding with 3 portfolios, all passive management, 1 company
• Costs: .11% of assets or $30 per account
• Is saving due to competitive bidding, limited choice (index funds) or hidden costs?
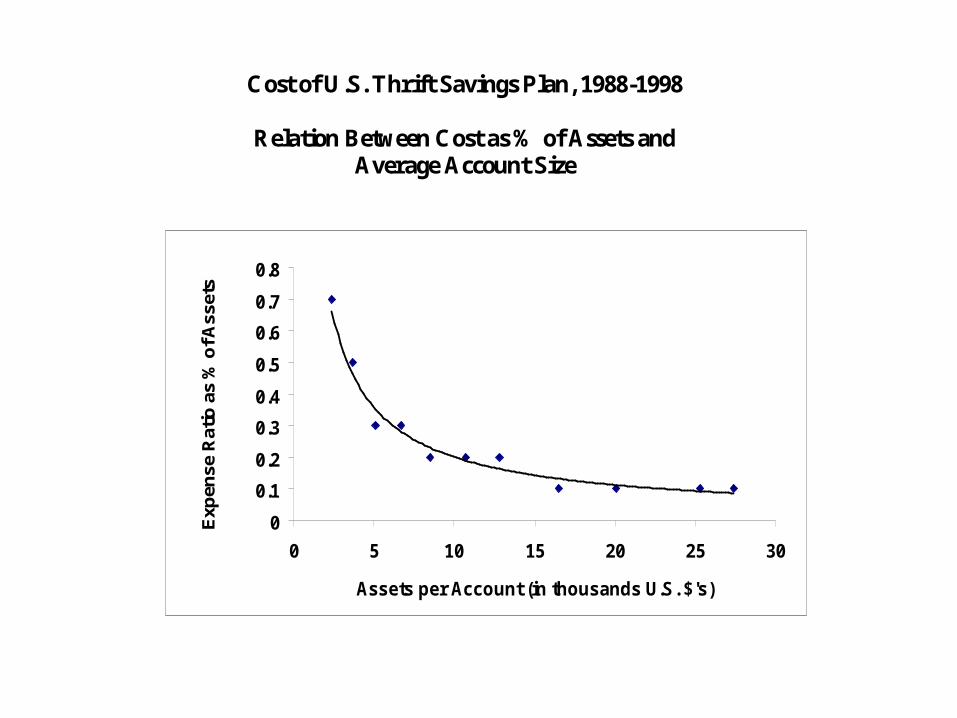
Cost of U.S. Thrift Savings Plan, 1988-1998
Relation Between Cost as % of Assets andAverage Account Size
0
0.1
0.2
0.3
0.4
0.5
0.6
0.7
0.8
0 5 10 15 20 25 30
Assets per Account (in thousands U.S. $'s)
Exp
ense
Rat
io a
s %
of A
sset
s

4) Sweden
• Centralized R&C: 2.5% IA contributions go to public agency, then reallocated (blind) to mutual funds selected by workers
• Mutual funds must accept agency’s fees--sliding scale, depending on funds attracted
• Estimated expected fee=.8% (.5% in lg run)
– lower than Chilean AFP’s, US or Swedish mutual funds because less marketing
– higher than TSP because greater choice

What does the evidence tell us?• Economies of scale: Cost per account falls as #
affiliates grow, cost per asset unit falls as assets grow; industry consolidates. This happens in retail and institutional markets
• Institutional costs lower than retail--competitive bidding limits number of funds, gains from scale economies early, low marketing costs, constrain choice to low cost products, bargaining power
• Costs <.5% of assets annually; would reduce pensions<10%, half as much as retail market, even less with passive investing
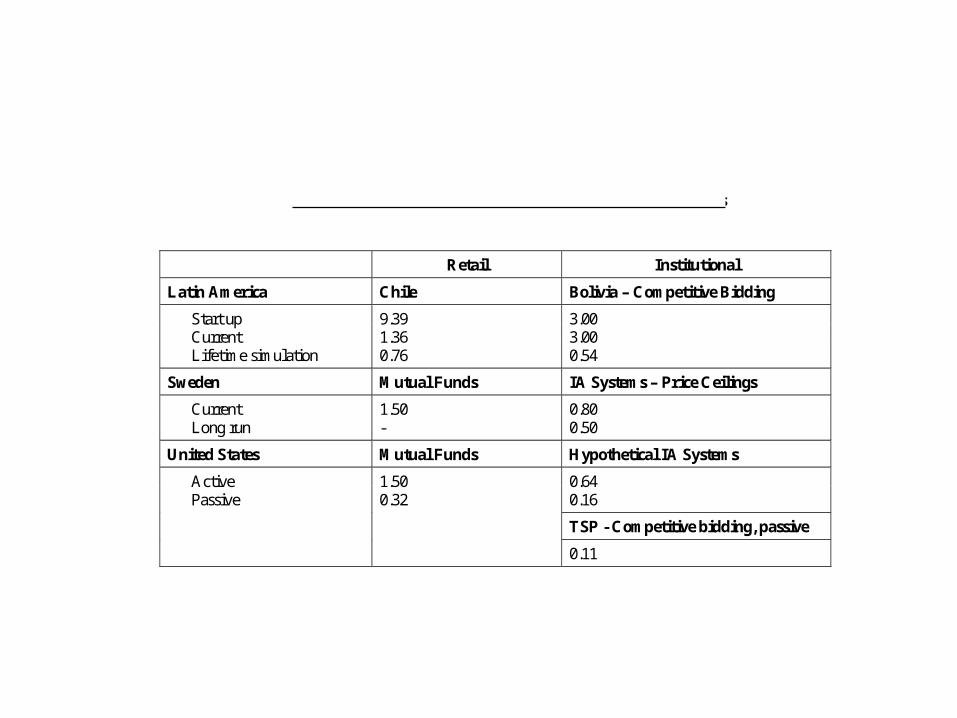
Average Annual Fees as % of Assets for Alternative IA Systems
Retail Institutional
Latin America Chile Bolivia – Competitive Bidding
Start up 9.39 3.00Current 1.36 3.00Lifetime simulation 0.76 0.54
Sweden Mutual Funds IA Systems – Price Ceilings
Current 1.50 0.80Long run - 0.50
United States Mutual Funds Hypothetical IA Systems
Active 1.50 0.64Passive 0.32 0.16
TSP - Competitive bidding, passive
0.11
Trade-offs and caveats• May choose wrong number of funds
• Performance incentives hard to specify
• Slow to innovate, adapt to new conditions
• Difficult to handle unforeseen contingencies
• Possible corruption, collusion, regulatory capture
• Credible rebidding strategy needed with fixed costs staying in system; or first entrants have long run monopolistic advantage
• But low cost IA system is feasible; especially useful at start-up and for small countries or contribution base
What is the relevance to ECA/FSU?
• As you choose your new systems, don’t automatically choose the retail model just because many other countries have done so
• Reforming countries, especially small countries, should consider pros and cons of the institutional approach, to attract foreign expertise and cut administrative costs
Related Documents


