This is an Accepted Manuscript, which has been through the Royal Society of Chemistry peer review process and has been accepted for publication. Accepted Manuscripts are published online shortly after acceptance, before technical editing, formatting and proof reading. Using this free service, authors can make their results available to the community, in citable form, before we publish the edited article. We will replace this Accepted Manuscript with the edited and formatted Advance Article as soon as it is available. You can find more information about Accepted Manuscripts in the Information for Authors. Please note that technical editing may introduce minor changes to the text and/or graphics, which may alter content. The journal’s standard Terms & Conditions and the Ethical guidelines still apply. In no event shall the Royal Society of Chemistry be held responsible for any errors or omissions in this Accepted Manuscript or any consequences arising from the use of any information it contains. Accepted Manuscript Molecular BioSystems www.rsc.org/molecularbiosystems View Article Online View Journal This article can be cited before page numbers have been issued, to do this please use: M. Kallubai, A. Rachamallu, D. P. Yeggoni and R. Subramanyam, Mol. BioSyst., 2015, DOI: 10.1039/C4MB00635F.

Welcome message from author
This document is posted to help you gain knowledge. Please leave a comment to let me know what you think about it! Share it to your friends and learn new things together.
Transcript

This is an Accepted Manuscript, which has been through the Royal Society of Chemistry peer review process and has been accepted for publication.
Accepted Manuscripts are published online shortly after acceptance, before technical editing, formatting and proof reading. Using this free service, authors can make their results available to the community, in citable form, before we publish the edited article. We will replace this Accepted Manuscript with the edited and formatted Advance Article as soon as it is available.
You can find more information about Accepted Manuscripts in the Information for Authors.
Please note that technical editing may introduce minor changes to the text and/or graphics, which may alter content. The journal’s standard Terms & Conditions and the Ethical guidelines still apply. In no event shall the Royal Society of Chemistry be held responsible for any errors or omissions in this Accepted Manuscript or any consequences arising from the use of any information it contains.
Accepted Manuscript
Molecular BioSystems
www.rsc.org/molecularbiosystems
View Article OnlineView Journal
This article can be cited before page numbers have been issued, to do this please use: M. Kallubai, A.
Rachamallu, D. P. Yeggoni and R. Subramanyam, Mol. BioSyst., 2015, DOI: 10.1039/C4MB00635F.

Binding of Lupeol Compounds with Plasma Proteins 279x95mm (96 x 96 DPI)
Page 1 of 38 Molecular BioSystems
Mol
ecul
arB
ioS
yste
ms
Acc
epte
dM
anus
crip
t
Publ
ishe
d on
10
Febr
uary
201
5. D
ownl
oade
d by
Uni
vers
ity o
f H
yder
abad
on
11/0
2/20
15 0
7:11
:18.
View Article OnlineDOI: 10.1039/C4MB00635F
1
Comparative Binding Mechanism of Lupeol Compounds with
Plasma Proteins and its Pharmacological Importance
Monika Kallubaia, Aparna Rachamallub, Daniel Pushparaju Yeggonia, Rajagopal
Subramanyama*
a Department of Plant Sciences, School of Life Sciences, University of Hyderabad, Hyderabad
500046, India
b National Institute of Animal Biotechnology, Axis Clinicals Building, Miyapur, Hyderabad,
500049, India
*Corresponding author Rajagopal Subramanyam
Department of Plant Sciences School of Life Sciences
University of Hyderabad 500 046 India Tel: +91-40-23134572 Fax: +91-40-23010120
Email:[email protected]
Page 2 of 38Molecular BioSystems
Mol
ecul
arB
ioS
yste
ms
Acc
epte
dM
anus
crip
t
Publ
ishe
d on
10
Febr
uary
201
5. D
ownl
oade
d by
Uni
vers
ity o
f H
yder
abad
on
11/0
2/20
15 0
7:11
:18.
View Article OnlineDOI: 10.1039/C4MB00635F

2
Abstract
Lupeol a triterpene, possesses beneficial effects like anti-inflammatory and anti-cancer
properties. Binding of lupeol and its derivative to plasma proteins such as human serum albumin
(HSA) and α-1-acid glycoprotein (AGP) is a major determinant in the disposition of drugs.
Cytotoxic studies with mouse macrophages (RAW 246.7) and HeLa cell lines revealed anti-
inflammatory and anti-cancer properties for both lupeol and lupeol derivative. Both molecules
reduced the expression of pro-inflammatory cytokines in LPS induced macrophages. Further,
apoptosis was observed from HeLa cell lines when the molecules incubated for 24 h. The
fluorescence quenching of HSA was observed upon titration with different concentrations of
lupeol and lupeol derivative; their binding constants were found to be 3 ± 0.01x 10⁴ M-1 and 6.2
± 0.02 x 10⁴ M-1, with binding free energies of -6.59 kcal M-1 and -7.2 kcal M-1. With AGP,
however, the lupeol and lupeol derivative showed binding constants of 0.9 ± 0.02 x 10³ M-1 and
2.7 ± 0.01x 10³ M-1, with free energies of -4.6 kcal M-1 and -5.1 kcal M-1 respectively. Molecular
displacement studies based on competition with site I-binding phenyl butazone (which binds site
I of HSA) and ibuprofen (which binds site II) suggest that lupeol binds in site II, and lupeol
derivative in site I. Molecular docking studies also confirmed that lupeol binds to the IIIA and
lupeol derivative to the IIA domain of HSA. Secondary structure changes were observed upon
formation of HSA-lupeol/derivative complexes by circular dichroism spectroscopy. Molecular
dynamics simulations support greater stability of HSA-lupeol and HSA-lupeol derivative
complexes compared to HSA alone.
Keywords: Human serum albumin, α-1-acid glycoprotein, Cytotoxic, Phytocompounds,
Molecular docking, Molecular dynamics simulations
Page 3 of 38 Molecular BioSystems
Mol
ecul
arB
ioS
yste
ms
Acc
epte
dM
anus
crip
t
Publ
ishe
d on
10
Febr
uary
201
5. D
ownl
oade
d by
Uni
vers
ity o
f H
yder
abad
on
11/0
2/20
15 0
7:11
:18.
View Article OnlineDOI: 10.1039/C4MB00635F

3
Introduction
Lupeol, a monohydroxylated pentacyclic triterpenoid found in fruits, vegetables and medicinal
plants possesses strong clinical properties. Lupeol isolated from the leaves of Aegle marmelos
appeared to be a good drug for antidyslipidemic, antihyperglycemic 1 and even
hypercholesterolemia 2. Lupeol is a diet-derived agent (acceptable to human), nontoxic and
bioavailable, and a dose tailored treatment was successful in the treatment of prostate cancer 3. It
also reduced the growth of granulomatous growth of the synovium and the severity of cartilage
and subchronal bone erosion associated with the adjuvant arthritis 4. Pentacyclic triterpenes have
been widely reported to exhibit anti-inflammatory activities 5. Recently, it has been proved that
changes in the pentacyclic ring, and the strength of hydrogen bonding capability or acidity at C-
19, C-20 and C-28 positions confirmed differences in biological activities of lupeol 6. Thus,
lupeol had a wide range of pharmacological action; distribution of these molecules and their
activity are controlled by their strong binding to proteins in the systemic circulation after oral
absorption. Thus, the interactions of small molecules with proteins which results in the formation
of complexes modify protein properties and structure have been a target of research.
Human serum albumin (HSA) and α-1 acid glycoprotein (AGP) are the predominant
proteins in human blood plasma. HSA has 585 amino acid residues and exists as a monomer of
molecular mass 66 kDa with 3 domains: domain I (Residues 1–195), domain II (196–383) and
domain III (384–585). Each domain can be subdivided into subdomains A and B, possessing
common structural motifs. The protein is stabilized by 17 disulfide bridges, resulting in a heart-
shaped tertiary structure 7, 8. HSA is the most abundant plasma protein and is known for its
capability to serve as carrier for a number of ligands like fatty acids, hormones and many drugs 9,
10. HSA binding often results in an increased solubility in plasma, decreased toxicity, protection
Page 4 of 38Molecular BioSystems
Mol
ecul
arB
ioS
yste
ms
Acc
epte
dM
anus
crip
t
Publ
ishe
d on
10
Febr
uary
201
5. D
ownl
oade
d by
Uni
vers
ity o
f H
yder
abad
on
11/0
2/20
15 0
7:11
:18.
View Article OnlineDOI: 10.1039/C4MB00635F

4
against oxidation, and prolonged in vivo half-life of the bound ligands 11. HSA has multiple
ligand-binding sites localized in these subdomains 12, 13. Two primary drug-binding sites have
been characterized: subdomains IIA and IIIA, also known as Sudlow’s site I and Sudlow’s site
II. These two sites received attention due to their high drug-binding affinity; site I is dominated
by strong hydrophobic interactions with neutral, bulky, heterocyclic compounds, while site II
binds mainly by dipole-dipole, van der Waals, and/or hydrogen-bonding interactions with
aromatic carboxylic acids 14-16. Phytocompounds like β-sitosterol, coumaryltyramine, asiastic
acid, coumarin derivatives and methimazole show binding to Sudlow’s site I (IIA), which is the
major drug binding site on HSA 17-21, whereas other phytocompounds like trimethoxyflavone and
ginsenoside Rg3 22, 23 bind to Sudlow’s site II (IIIA). Interestingly, synthetic 7-hydrocoumarin
derivatives also bind to the same subdomains (7HC-1 to IIIA, 7HC-2 to IIIB and 7HC-3 to IIIB)
24. Recent reports show that the IB site is also a good candidate for the binding of other drug
molecules including fatty acids and endogenous substances such as the hormones thyroxine,
bilirubin and hemin molecules 13, 25, 26. Our group has reported various coumarin derivatives and
trans-feruloyl maslinic acid interacting with HSA via domain I 20, 27. Hence, HSA is a
promiscuous ligand binder, with a surprising capacity to bind a large variety of biologically
active molecules.
Another important plasma protein, AGP (also known as orosomucoid), is a 44 kDa single
polypeptide encompassing 183 amino acid residues. It belongs to the lipocalin family of proteins,
a heterogeneous group of extracellular proteins that bind a variety of small hydrophobic ligands
28, 29. AGP is synthesized in the liver and secreted into the blood stream at concentrations of 0.6-
1.2 mg/ml, which is approximately 1-3% of total protein; HSA comprises 60% of the plasma
proteins 30, 31. AGP is greatly elevated under inflammatory or other pathological conditions, and
Page 5 of 38 Molecular BioSystems
Mol
ecul
arB
ioS
yste
ms
Acc
epte
dM
anus
crip
t
Publ
ishe
d on
10
Febr
uary
201
5. D
ownl
oade
d by
Uni
vers
ity o
f H
yder
abad
on
11/0
2/20
15 0
7:11
:18.
View Article OnlineDOI: 10.1039/C4MB00635F

5
is able to bind basic drugs 32. Still, the detailed characteristics of binding sites on HSA and AGP
are not yet clear.
Since lupeol compounds possess strong anti-oxidant, anti-inflammatory, anti-arthritic, anti-
mutagenic, anti-tumor and anti-malarial properties, we confirmed the anti-inflammatory and anti-
cancer properties of lupeol and its derivative through cytotoxic studies. Further, the interactions
of lupeol and its derivative with HSA and AGP has been studied using spectroscopic methods.
Lupeol derivative is structurally similar to lupeol, except for a double bond between the carbon
atoms at positions C3 and C7. To support our experimental studies and provide more structural
details, molecular docking and dynamics simulations were performed. Our work should be
helpful to understand the pharmacokinetic and pharmacodynamics aspects of lupeol treatment, as
well the ability of derivatives of natural compounds to improve their immunomodulatory
activities.
Materials and Methods
Preparation of stock solutions
Pure fat-free HSA (purchased from Sigma Aldrich) was prepared to 1.5 mM concentration
dissolved in 0.1 M phosphate buffer at pH 7.4. Lupeol and lupeol derivative (phytocompounds)
was purchased from Natural Remedies Pvt., Ltd, Benguluru India, with a purity of 95%. Its stock
solution (1.0 × 10 3 M-1) was prepared in 20:80 ethanol:water mixture. The molecular weight of
Lupeol and lupeol derivative is same 426.7 Da, while structurally lupeol derivative had a
difference in the double bond arrangement between C5 and C6 atoms. The optimum pH for HSA
was set to be 7.4 as it has the maximum absorption at this pH 27, 33. Thus for all the experiments,
we have used 0.1 M phosphate buffer at pH 7.4 as a physiological buffer. All other chemicals are
of analytical grade purchased from Sigma Aldrich.
Page 6 of 38Molecular BioSystems
Mol
ecul
arB
ioS
yste
ms
Acc
epte
dM
anus
crip
t
Publ
ishe
d on
10
Febr
uary
201
5. D
ownl
oade
d by
Uni
vers
ity o
f H
yder
abad
on
11/0
2/20
15 0
7:11
:18.
View Article OnlineDOI: 10.1039/C4MB00635F

6
Cell response assay (MTT assay)
To understand anti-inflammatory and anti-cancer property, a cell response assay was carried out
using 3-(4,5-dimethylthiazol-2-yl)-2,5-diphenyltetrazolium bromide (MTT) staining method 34.
LPS induced mouse macrophage cells (RAW 264.7) and human cervical cancer cells (HeLa)
were sub-cultured and seeded in 96 well plates at a density of 5 × 10³ cells. Lupeol and its
derivative were added to the above plates in a dose dependent manner (from 10 μM to 100 μM)
and the effect was tested for 48 hrs, a control was maintained without the addition of lupeol and
its derivative. After 48 hours20 μL (5mg/ml in PBS) of MTT was added and cells were incubated
further for 4 hours. To dissolve the MTT crystals 100 μL of DMSO was added to each well and
mixed with repeated pipetting. The Cell response was measured at 570 nm optical absorbance on
a micro plate reader (μ Quant Bio-tek Instrument, Inc.). The same experiments were performed
three times, in triplicates each time; changes in the cell responses were noted using control as
reference. The mean ± SE was calculated and reported in terms of the cell response (%) vs
concentration (μM).
Determination of cytokines production
We investigated the biological effects of lupeol and lupeol derivative on inflammatory cytokines
IL-1β and IL-6 using mouse ELISA kit (R&D systems, 210331). Mouse macrophages
(RAW264.7) were pretreated with lupeol and lupeol derivative for 1h and then LPS was added at
1µg/mL concentration and further incubated for 5h. Supernatant was collected and used for the
estimation of cytokines. The inhibitory effect of lupeol and lupeol derivative was determined by
an ELISA reader at 570 nm absorbance.
Page 7 of 38 Molecular BioSystems
Mol
ecul
arB
ioS
yste
ms
Acc
epte
dM
anus
crip
t
Publ
ishe
d on
10
Febr
uary
201
5. D
ownl
oade
d by
Uni
vers
ity o
f H
yder
abad
on
11/0
2/20
15 0
7:11
:18.
View Article OnlineDOI: 10.1039/C4MB00635F

7
Apoptosis Evaluation for anticancer activity
Cell death was measured by using Annexin V-FITC detecction Kit (Sigma cat no:
APOAF). Hela cells were treated with half the concentration of IC50 values of lupeol and its
derivative for 24 h, later cells were washed twice with phosphate buffer saline, then resuspended
in binding buffer and stained with 5 μl of Annexin V-FITC. It conjugate with fluorescent
isothiocyanate (FITC) to label phosphotidylserine sites on the membrane surface and 10 μl of
Propidium Iodide for 10min to label the cellular DNA in necrotic cells, where the cell membrane
is almost disrupted35.
Room temperature fluorescence spectra measurements
Protein-drug interactions can affect the molecular biological activity and function of proteins 36.
Fluorescence emission measurement is one method to help understand protein-drug binding. A
Perkin Elmer LS-55 fluorimeter was used to measure fluorescence spectra with a 1.0 cm quartz
cuvette. For both HSA and AGP, the excitation wavelength was 285 nm and emission spectra
were recorded at 25° C in the range of 300-500 nm; bandwidths for both excitation and emission
were 10 nm. A fixed concentration (0.001 mM) of HSA and AGP with different concentration of
lupeol from 0.001 to 0.009 mM in 0.1 M phosphate buffer solution was used at physiological pH
of 7.4. The incubation of each concentration of lupeol with HSA and AGP was 5 minutes. The
experiments were repeated twice for both lupeol and lupeol derivative, and each time
approximate spectrum values were obtained. Binding constants were calculated using
fluorescence intensity at the emission maximum (340 nm for AGP and 360 nm for HSA).
Molecular displacement experiment
Many drugs can bind to the same HSA drug binding sites or to different functionally linked clefts
either competitively or synergistically. Identifying the drug binding site is important to
Page 8 of 38Molecular BioSystems
Mol
ecul
arB
ioS
yste
ms
Acc
epte
dM
anus
crip
t
Publ
ishe
d on
10
Febr
uary
201
5. D
ownl
oade
d by
Uni
vers
ity o
f H
yder
abad
on
11/0
2/20
15 0
7:11
:18.
View Article OnlineDOI: 10.1039/C4MB00635F

8
understand the efficacy of drug delivery. Site-competitive replacement experiments were carried
out to understand the binding site of drug molecules to HSA using site specific markers (phenyl
butazone and ibuprofen for site I and site II, respectively). HSA and the binding site probe were
maintained at a concentration of 1 µM, whereas lupeol and lupeol derivative were titrated with
an increase in concentration from 0.001 to 0.009 mM. The excitation wavelength is 285 nm for
site specific markers phenyl butazone, ibuprofen and HSA as well, and the data were measured
using the modified Stern-Volmer equation 24, 37.
Circular dichroism measurements
HSA and HSA-lupeol complex secondary structures were measured by using Jasco J-810
spectropolarimeter (a Quartz cuvette with 0.02 mm path length under nitrogen atmosphere), and
spectra were recorded in the region of 190-260 nm, with a scan speed of 100 nm min-1. The
concentration of HSA was fixed at 0.001 mM, while the lupeol and its derivative were added in
an increasing concentration of 0.001, 0.002 and 0.003 mM. Jasco J-715 peltier was used for
measuring temperature dependent circular dichrosim spectra for HSA-lupeol and its derivative
complexes with increasing temperature of 25-850C. The web-based software CDNN 2.1 was
used to predict the percentages of secondary structure of α-helix, β-sheet and random coil of pure
HSA as well as the HSA-lupeol and HSA-lupeol derivative complexes.
Molecular modeling and docking
The crystal structure of HSA (PDB ID: 1AO6) was obtained from the Protein Data Bank. 3-
dimensional structure of lupeol and its derivative was built, and its geometry was optimized
through Discovery Studio 3.5 in InsightII/Builder. Structures were optimized and used as input
for AutoDock Tools. To find the binding site and types of interactions involved in the formation
of HSA-lupeol and HSA-lupeol derivative complexes, docking was performed using the
Page 9 of 38 Molecular BioSystems
Mol
ecul
arB
ioS
yste
ms
Acc
epte
dM
anus
crip
t
Publ
ishe
d on
10
Febr
uary
201
5. D
ownl
oade
d by
Uni
vers
ity o
f H
yder
abad
on
11/0
2/20
15 0
7:11
:18.
View Article OnlineDOI: 10.1039/C4MB00635F

9
Lamarckian genetic algorithm implemented in AutoDock 4.2. We found this to be the best-
performing docking method in terms of its ability to find the lowest energy and its structure
prediction accuracy; it also incorporates ligand flexibility 38, 39. AutoDock 4.2 takes water as
solvent by default, and polar hydrogens were added using the MGL tools interface. Blind
docking was carried out using the AutoGrid utility; the docking area was defined by a box with
grid spacing of 0.586 Å and the dimension of 126×126×126 Å with points along the x, y and z
axes. The docking parameters are: number of individuals in the population (set to 150);
maximum number of energy evaluations (set to 2,500,000), and maximum number of
generations (set to 2700), and number of genetic algorithm runs (set to 30). For each docking
simulation, 30 different conformers were generated, and the obtained conformations were
analyzed for the lowest free energy conformer, which is considered to be close to the
experimentally determined free energy values reported 24, 40. LIGPLOT was used for plotting
protein–ligand interactions, and also to analyze hydrophobic and hydrogen bond interactions
between HSA-lupeol and HSA-lupeol derivative 41. The same procedure was repeated for all the
three structures to understand the same binding modes and found no difference as the domains
are conserved in all the structures present in PDB data bank. Also 42 structures of human serum
albumin present in PDB were analyzed through dynamics simulations and concluded that
binding of small molecules does not induce significant structural changes 42. Thus the docking
complexes with crystal structure 1AO6 are selected for further studies.
Molecular dynamics simulations (MD)
The initial configurations used for MD simulations of the HSA-lupeol and lupeol derivative
complexes were the lowest-energy docked structures, with energies very close to the
experimental binding energies and binding constants. The Gromacs v4.6.3 package with force
Page 10 of 38Molecular BioSystems
Mol
ecul
arB
ioS
yste
ms
Acc
epte
dM
anus
crip
t
Publ
ishe
d on
10
Febr
uary
201
5. D
ownl
oade
d by
Uni
vers
ity o
f H
yder
abad
on
11/0
2/20
15 0
7:11
:18.
View Article OnlineDOI: 10.1039/C4MB00635F

10
field GROMOS96 43a1 43, was used for unliganded HSA, HSA-lupeol and HSA-lupeol
derivative complexes. Further, PRODRG2.5 server (beta) was used to build the topology
parameter of lupeol and lupeol derivative 44. Missing atoms were added to the initial coordinates
of the complexes, and the topology file was generated. During simulations, each complex was
placed in the center of a box with appropriate dimensions of 80×80×80 Å and water molecules
were added to fill the box using SPC 45, yielding a total system size of 5843 atoms. All protein
side chains were assumed to be in their default ionization states based on pKa calculations 46.
Sodium counter ions were added to each simulation box to maintain electro-neutrality and to
release conflicting contacts. Energy minimization was performed using the steepest descent
method for 1000 steps and conjugated gradient method for the subsequent 1000 steps.
Simulations were performed in the NPT ensemble, at a temperature of 300 K maintained
using a Berendsen thermostat 47 with a coupling constant of 1.0 ps. Protein and water/ions were
coupled independently. Pressure coupling used the Berendsen barostat with a coupling constant
of 1.0 ps. Long-range electrostatic interactions were calculated using the particle mesh Ewald
method 48 with a 10 Å cut-off. LINCS algorithm 49, was used to restrain bond lengths. Each
system was energy minimized followed by a short 200 ps simulation during which the protein,
and if present ligand, non-hydrogen atoms were harmonically restrained with a force constant of
1000 kJ/mol/Å2. All restraints were then removed and each simulation was run for 10 ns;
simulation and analysis were performed on Linux cluster with 36 nodes (dual Xeon processor) at
the Bioinformatics facility of the University of Hyderabad.
Results and discussion
Cell viability assay
Page 11 of 38 Molecular BioSystems
Mol
ecul
arB
ioS
yste
ms
Acc
epte
dM
anus
crip
t
Publ
ishe
d on
10
Febr
uary
201
5. D
ownl
oade
d by
Uni
vers
ity o
f H
yder
abad
on
11/0
2/20
15 0
7:11
:18.
View Article OnlineDOI: 10.1039/C4MB00635F

11
Evidence obtained from experiments on human melanoma cells indicate that lupeol has anti-
cancer properties 50. Vasconcelos et al. 51 confirmed that lupeol has potent anti-inflammatory
activity by a significant reduction in eosinophils infiltration and in Th2-associated cytokines (IL-
4, IL-5, IL-13) levels that trigger the immune responses in asthma. To reconfirm the importance
of lupeol molecules, we performed a cell viability assay by the MTT staining method, to test
anti-inflammatory property of lupeol and lupeol derivative (phytocompounds) on the mouse
macrophage (RAW 264.7) cell line. Our results indicated that the lupeol inhibits inflammation
with increasing concentrations of 20, 40, 60, 80 and 100 μM for 48 h in a final volume of 100 μl.
In a negative control, cells were grown in media without lupeol and its derivative. The results
showed anti-inflammatory response with an IC50 value of 80 μM for lupeol, whereas lupeol
derivative had an IC50 value of 63 μM (Fig. 1A and 1B). Thus, lupeol derivative showed stronger
inhibition of the growth of inflammated macrophages compared with lupeol. We have also tested
anticancer property on human cervical cancer cell lines (HeLa), and examined the effects of
lupeol and lupeol derivative on the viability of these cells by using the above method. A decrease
in cell viability with both the molecules in a dose-dependent manner was observed, and the effect
of these molecules represented with an IC50 values for lupeol and lupeol derivative was 30 μM
and 24 μM, respectively (Fig. 1C and 1D). We also, carried out these compounds on HepG2 cells
lines (hepatic carcinoma) but observed no effect.
Cytokines studies of lupeol compounds
We further evaluated the inhibitory effect of lupeol and lupeol derivative on the expression of
inflammatory cytokines IL-1β and IL-6 by ELISA. As shown in the (Fig. S1), both IL-1β and IL-
6 cytokines expression was down regulated by lupeol and lupeol derivative compared to the LPS
induced cells. However, the lupeol derivative is showing stronger inhibition of cytokines in a
Page 12 of 38Molecular BioSystems
Mol
ecul
arB
ioS
yste
ms
Acc
epte
dM
anus
crip
t
Publ
ishe
d on
10
Febr
uary
201
5. D
ownl
oade
d by
Uni
vers
ity o
f H
yder
abad
on
11/0
2/20
15 0
7:11
:18.
View Article OnlineDOI: 10.1039/C4MB00635F

12
dose dependent manner compared to lupeol. With same cytokines (IL-1β and IL-6) we have
tested for HeLa cell lines to understand the anti-cancer role; however, we did not see any
significant effect. This could be explained that for cancer, there are several other cytokines are
involved which may be studied in future.
Apoptotic studies from HeLa cell lines
Anticancer drugs can potentially kill cells in different ways by interfering with cellular process,
essential for cell viability and triggering an endogenous physiological cell death mechanism.
Further, we tested lupeol and lupeol derivative for induction of apoptosis from HeLa cell lines,
which is a morphological and biochemical distinct form of programmed cell death in many cells.
The normal cells contain phosphatidylserine residues in the inner membrane of cytoplasm and
during apoptosis of these residues are translocated and are exposed, an early event in apoptosis.
Annexin V is known to be phosphatidylserine-binding protein available conjugated with FITC to
label phosphatidylserine sites on the membrane surface. Propidum Iodide binds to cellular DNA
in cells, where the cell membrane is totally damaged. The number of cell replications was
assessed with the aid of fluorescent dye, which covalently binds to cytoplasmic components of
cell resulting green fluorescence, and the resolution can be allowed upto eight cycles of cell
division, which can be detected by flow cytometry. In our study, half the concentration of IC50
values from cell viability assay was treated with lupeol and its derivative, 15 and 12 μM
respectively for 24h to measure the cell death by using apoptotic detection kit as described in
methods. The results are shown as dot-plot representation (FITC-A on x-axis and PE-A on y-
axis) in quadrants and histogram (Fig. 2). The results showed that percent apoptotic cells are 0.8
with lupeol, while 2.6% for lupeol derivative, which is more than two fold cell death than lupeol.
The percentages of different cells in quadrants are given in Table S1. Our results suggest that
Page 13 of 38 Molecular BioSystems
Mol
ecul
arB
ioS
yste
ms
Acc
epte
dM
anus
crip
t
Publ
ishe
d on
10
Febr
uary
201
5. D
ownl
oade
d by
Uni
vers
ity o
f H
yder
abad
on
11/0
2/20
15 0
7:11
:18.
View Article OnlineDOI: 10.1039/C4MB00635F
13
lupeol derivative could be effective than lupeol in its anticancer activity. Further insights into the
molecular mechanisms that mediate the antitumor activities were needed to promote their
development as chemo preventive agents and cancer therapeutics in the ongoing battle against
cancer.
Analysis of fluorescence emission data
Anti-inflammatory drugs are known to bind to HSA with high affinity 14, 52, so it is necessary to
understand the protein-drug interactions, as the lupeol and lupeol derivative are known to be
highly anti-inflammatory and anti-cancer drugs. Fluorescence spectroscopic methods are the
primary research tools in biochemistry and biophysics to measure protein-drug interactions. The
fluorescence spectra of HSA in the absence and presence of lupeol and lupeol derivative were
measured; HSA showed a strong fluorescence emission at 360 nm (λex = 285 nm) while both
drugs were almost non-fluorescent (Fig. 3A and 3B). Increasing lupeol concentrations resulted in
a lowering of HSA fluorescence intensity, with slight decrease in maximum emission, which
clearly indicated that the binding of the lupeol to HSA changed the microenvironment around the
tryptophan residue. Previously it has been stated that, the fluorescence is due to amino acid
residues, tryptophan, tyrosine, and phenylalanine, out of which tryptophan plays a major role in
the intrinsic fluorescence of HSA, because of low quantum yield of phenylalanine. The
fluorescence of tyrosine is almost quenched if it is ionized or near an amino group, a carboxyl
group, or a tryptophan53.
A nonlinear relationship between the observed fluorescence intensity and concentrations
(Q) of lupeol and lupeol derivative was resulted with an increase in the concentrations of lupeol
and its derivative with both HSA and AGP, which increased the absorbance of excitation, and
Page 14 of 38Molecular BioSystems
Mol
ecul
arB
ioS
yste
ms
Acc
epte
dM
anus
crip
t
Publ
ishe
d on
10
Febr
uary
201
5. D
ownl
oade
d by
Uni
vers
ity o
f H
yder
abad
on
11/0
2/20
15 0
7:11
:18.
View Article OnlineDOI: 10.1039/C4MB00635F

14
emission radiation-inducing the inner filter effect that may decrease the intensity of fluorescence.
The inner filter effect can be corrected by using following equation
Fcor = Fobs 10 (Aexc + Aemi)/2 [1]
Where, Fcor and Fobs are the fluorescence intensity corrected and observed, Aexc and Aemi
represent the absorbance at the fluorescence excitation (285 nm) and emission wavelengths 360
nm. In order to understand the fluorescence quenching mechanism (static or dynamic) of HSA-
lupeol, and HSA-lupeol derivative complexes, the quenching data were analyzed using the Stern-
Volmer equation,
Fo/F= 1+ kqt0 [Q] = 1 + KD [Q] [2]
where F and Fo are the fluorescence intensities in the presence and absence of quencher, [Q] is
the quencher concentration, and KD is the Stern-Volmer quenching constant (Kq), which can be
written as KD = kqt0; where kq is the bimolecular quenching rate constant and t0 is the lifetime of
the fluorophore in the absence of quencher is 5.6 ns 54. From the above equation the quenching
constant was calculated to be 5.08 × 10¹³ M−1 s−1 for lupeol and 5.5 × 10¹³ M−1 s−1 for lupeol
derivative. Thus the quenching mechanism is static, as these values are much greater than the
maximum collisional quenching constant 2.0 × 10¹⁰ M−1 s−1 55 (Fig.S2). Since lupeol and lupeol
derivative induced fluorescence quenching of HSA as a static process, the binding constant (K)
and the number of bound complexes to HSA (n) were determined by plotting the fluorescence
data using modified Stern-Volmer equation 56.
log (Fo –F)/F =log Ks +n log [Q] [3]
Where Q, n and Ks denoted as quencher concentration, number of binding sites and binding
constant, respectively. Our results showed linear graph plotted with log [(F0-F)/F] versus log [Q],
which indicates HSA-lupeol and HSA-lupeol derivative binding are one-to-one interaction with
Page 15 of 38 Molecular BioSystems
Mol
ecul
arB
ioS
yste
ms
Acc
epte
dM
anus
crip
t
Publ
ishe
d on
10
Febr
uary
201
5. D
ownl
oade
d by
Uni
vers
ity o
f H
yder
abad
on
11/0
2/20
15 0
7:11
:18.
View Article OnlineDOI: 10.1039/C4MB00635F

15
HSA, supporting static quenching. From the intercept, binding constants of lupeol and lupeol
derivative with HSA were calculated to be KLup = 3 ± 0.01 × 10 4 M-1 and KLd = 6.2 ± 0.02× 10 4
M-1 for lupeol and lupeol derivative (Fig. 3A and 3B). Our results are in agreement to the
previous studies with flavonoids-displaying binding constant in the range of 1-5 × 10 4 M-1 57.
These binding constants K are further used to calculate the standard free energy with an equation
as follows:
ΔG0 = -RT ln K [4]
where ΔG0 is free energy change, K is binding constant at temperature 298 K, and R is the gas
constant. The calculated free energy for lupeol and lupeol derivative are -6.59 kcal M-1 and -7.2
kcal M-1, respectively. These values compare reasonably with computationally calculated free
energies (-6.45 kcal M-1 and -6.89 kcal M-1). This indicates that the lupeol molecules bind to the
protein mainly by hydrophobic interactions. Similar results were observed from our laboratory
with different molecules like β-sitosterol, coumaryltyramine, asiatic acid, coumarin derivatives,
trimethoxy flavone, 7-hydroxycoumarin derivatives and chitosan oligomers, which all bind to
HSA 17-20, 22, 24, 58.
Since AGP is an acute phase protein and most of the drugs also bind to this protein during
pathological conditions, we have checked the binding of lupeol to AGP. When lupeol molecules
were titrated with AGP the fluorescence maximum (340 nm) was quenched upon increasing
concentration of lupeol (Fig. 4A and 4B). This indicates that both lupeol and lupeol derivative
also bind to AGP, but with lower binding constants than with HSA, i.e. 0.9 ± 0.02 × 10 3 M-1 and
2.7 ± 0.01× 10 3 M-1 for lupeol and lupeol derivative. However, these binding constants are in the
range of FDA (Food and Drug Administration) i.e. 103 – 105 M-1 15. The free energies obtained
Page 16 of 38Molecular BioSystems
Mol
ecul
arB
ioS
yste
ms
Acc
epte
dM
anus
crip
t
Publ
ishe
d on
10
Febr
uary
201
5. D
ownl
oade
d by
Uni
vers
ity o
f H
yder
abad
on
11/0
2/20
15 0
7:11
:18.
View Article OnlineDOI: 10.1039/C4MB00635F

16
were found to be -4.6 kcal M-1 and -5.1 kcal M-1, respectively. The above results indicate that
these phytocompounds bind efficiently to the plasma proteins HSA and AGP.
Molecular displacement studies for site-specific binding
Generally there are several site specific fluorescence probes (warfarin, ibuprofen, diazepam,
phenyl butazone, ketoprofen) to find out the exact binding pocket of HSA 59. Warfarin, an anti-
coagulant drug, and ibuprofen, a non-steroidal anti-inflammatory agent, are considered as
stereotypical ligands for Sudlow’s site I and Sudlow’s site II, respectively. Hence, in order to
identify the precise binding site of HSA with lupeol molecules, phenyl butazone and ibuprofen
were used as site marker fluorescence probes for monitoring site I and II. In site-competitive
replacement experiments, the concentration of HSA and site specific marker are kept at equal
concentration (0.001 mM) and titrated with lupeol and lupeol derivative at increasing
concentrations. The fluorescence intensities are measured and analyzed. The titration of the
different concentration of lupeol to HSA-ibuprofen decreased the fluorescence emission
quenching; binding constant values for lupeol-HSA were found to be 1.8 ± 0.01× 10 4 M-1 (Fig.
5A), while it did not show any competition with phenyl butazone. Lupeol derivative showed
replacement of phenyl butazone (Fig. 5B) with a binding constant of 3.3 ± 0.02 × 10 4 M-1; these
values are close to the above experimental values (3 ± 0.01 × 10 4 M-1 and 6.2 ± 0.02× 10 4 M-1)
obtained from fluorescence emission. These results revealed that there is a competition between
lupeol and ibuprofen between lupeol derivative and phenyl butazone, suggesting that subdomain
IIIA (Sudlow’s site I) is the site for lupeol binding and subdomain IIA (Sudlow’s site II) for
lupeol derivative. Our experimental data is consistent with the docking studies that show lupeol
and lupeol derivative binding to the IIIA and IIA domains.
Secondary structure analysis by using circular dichroism data
Page 17 of 38 Molecular BioSystems
Mol
ecul
arB
ioS
yste
ms
Acc
epte
dM
anus
crip
t
Publ
ishe
d on
10
Febr
uary
201
5. D
ownl
oade
d by
Uni
vers
ity o
f H
yder
abad
on
11/0
2/20
15 0
7:11
:18.
View Article OnlineDOI: 10.1039/C4MB00635F

17
The phenomenon of circular dichroism (CD) is a sensitive technique to identify the secondary
structure of polypeptides and proteins. CD spectroscopy is a form of light absorption
spectroscopy that measures the difference in absorbance of right- and left-circularly polarized
light by a substance. It has been shown that CD spectra between 260 and approximately 180 nm
can be analyzed for the different secondary structural types: α-helix, parallel and antiparallel β-
sheets, β-turns, and others. The CD spectra of HSA with various concentrations of lupeol and
lupeol derivative in PBS (pH = 7.4) were taken at room temperature (Fig. 6). It can be seen from
the figure that HSA exhibits two negative bands at 208 and 222 nm respectively, which are
characteristic of the α-helices, and both contributed to n-π* transfer for the peptide bond of the α-
helical structure 60. The secondary structure protein conformation found to be 58% α-helix, 20%
β-sheet (including parallel and anti-parallel) and 22% random coil for HSA and which are closer
to the previous reports 18, 22, 24. It also indicated that conformational changes occur in HSA upon
complexation with lupeol and lupeol derivative. The secondary structure elements from HSA and
HSA-lupeol, HSA-lupeol derivative complex formation, were calculated by CDNN software.
Fig. 6A and 6B shows the complexion of HSA upon with titration of lupeol and lupeol
derivative (0.003mM), after complexation there is a decrease in α-helical content from 58 to 50.5
± 1.8 and 44.3% ± 1.0, while β-sheets increased from 20 to 24 ± 0.1 and 26.6% ± 2.1 and
random coils from 22 to 24 ± 0.1 and 26.6% ± 0.2, respectively. The percentages of the values
obtained for α-helix, β-sheet, random coils of lupeol and lupeol derivative are calculated and are
shown in Fig. 6C, and the data points are given in Table S2. The order of structural changes in α-
helical is in the ascending order, is as follows lupeol derivative > lupeol where lupeol derivative
> lupeol as the β-sheets and random coils lupeol derivative > lupeol. The conformational changes
upon complexation of HSA+lupeol derivative may be due to minor unfolding of the protein,
Page 18 of 38Molecular BioSystems
Mol
ecul
arB
ioS
yste
ms
Acc
epte
dM
anus
crip
t
Publ
ishe
d on
10
Febr
uary
201
5. D
ownl
oade
d by
Uni
vers
ity o
f H
yder
abad
on
11/0
2/20
15 0
7:11
:18.
View Article OnlineDOI: 10.1039/C4MB00635F

18
which is very common in ligand binding. Thus, the difference in α-helical content might be due
to structural rearrangements or changes in the microenvironment around tryptophan upon
protein-ligand complex formation. To further investigate these changes, MD simulations were
performed to visualize the structural changes in the protein. Our results corroborated with our
previous reports with similar conformational changes, while binding of coumarin derivatives and
7-hydroxycoumarin derivatives and chitosan oligomers with HSA 20, 24, 58.
Temperature-dependent CD was carried out for HSA and HSA with 0.003 mM lupeol and
lupeol derivatve, from 25–85 oC to resolve the stability of these complexes. The secondary
structural conformation of the protein was not significantly changed up to 65 oC in HSA-lupeol,
and HSA-lupeol derivative complexes. Above 65 oC, the α-helical content decreased
dramatically, while the random coil content increased in both complexes (Fig. S3). Earlier report
showed that the Tm of the HSA alone was around 65 oC, which shows that the unfolding of
protein occurs only after this point 61. This data reveals that HSA-lupeol derivative complexes are
very stable and thus, it can be a good candidate to deliver the drugs very efficiently even in
adverse conditions.
Molecular docking studies
The information of protein-ligand binding sites is very important not only for revealing true
binding mechanisms but also for rational drug design. To facilitate this, computational methods
such as docking and MD simulation are among the best approaches for the estimation of
molecular insights and the validation of experimental results. Molecular docking was carried out
to bind lupeol and lupeol derivative to HSA structure. The most favorable conformation (the one
with the lowest docked energy) found in the 30 independent docking runs, was taken on the basis
of free energy assessment estimated by intermolecular energy (including van der Waals energy,
Page 19 of 38 Molecular BioSystems
Mol
ecul
arB
ioS
yste
ms
Acc
epte
dM
anus
crip
t
Publ
ishe
d on
10
Febr
uary
201
5. D
ownl
oade
d by
Uni
vers
ity o
f H
yder
abad
on
11/0
2/20
15 0
7:11
:18.
View Article OnlineDOI: 10.1039/C4MB00635F
19
hydrogen bonding energy and electrostatic energy), internal energy, and torsional free energy.
Also, the lowest binding energy conformer obtained from docking results (-6.45 kcal M-1 and -
6.89 kcal M-1, lupeol and lupeol derivative) was closely matching to the experimentally
determined values (-6.59 kcal M-1 and -7.2 kcal M-1 lupeol and lupeol derivative). Among the
best conformers the lowest binding energy conformer is assessed for the binding site in receptor
(HSA) using LIGPLOT, as the HSA contains two drug-binding sites, namely site I and site II
located in hydrophobic cavities in subdomains IIA and IIIA, respectively 8, 14. In the best
conformer, lupeol is surrounded by residues Pro416, Gln417, Tyr497, Val469, Ser470, Asp494,
Thr496 and Val498, and Asp471 is stabilized by one hydrogen bond. The residues listed are part
of domain III (384-585) i.e. site II 8, 62. Further, lupeol derivative showed binding to site I,
domain II (196-383), forming hydrogen bonds with Ala300 and Pro299, and surrounded by
Met298, Asp301, Leu302, Pro303, Ser304, Leu305, Tyr334, Arg337, Tyr341, and His338 (Fig.
7C and 7F). When predicting the posing of a ligand into a protein, docking can provide a good
starting point to understand the preferred orientation of sterically acceptable ligands with protein.
Both lupeol and lupeol derivative are structurally similar except a difference in the double bond
arrangement, but the binding poses are different and are shown in Fig. 7B and 7E, which
explains that lupeol structure was stabilized by chair conformation and the unsaturated double
bond present outside the ring does not affect the hydrogen bond formation, whereas unsaturated
double bond in the ring of lupeol derivative causes restricted rotation of molecule, and double
bond adjacent to OH group decreases the electron with drawing capability of oxygen resulting in
formation of hydrogen bond with two basic amino acids. Essentially, because of this reason the
orientation of lupeol derivative changed to bind in site I instead of site II.
Page 20 of 38Molecular BioSystems
Mol
ecul
arB
ioS
yste
ms
Acc
epte
dM
anus
crip
t
Publ
ishe
d on
10
Febr
uary
201
5. D
ownl
oade
d by
Uni
vers
ity o
f H
yder
abad
on
11/0
2/20
15 0
7:11
:18.
View Article OnlineDOI: 10.1039/C4MB00635F
20
Also we have performed the docking with two more structures i.e. 2BXC and 1BM0 and
analyzed the binding modes and binding energies. Free energies obtained from docking studies
with PDB ID: 2BXC showed as -6.37 Kcal M-1 and -7.1 Kcal M-1 for lupeol and lupeol
derivative. Also, from PDB ID: 1BM0 showed as -6.88 kcal M-1 and -7.03 kcal M-1 for lupeol
and lupeol derivative, respectively when they bound to site II and site I (data not shown). Thus,
same binding modes are obtained even if we tried with other PDB’s of HSA since they have
similar binding pockets for all the crystal structures. Further, molecular displacement studies
confirm that lupeol binds in site II and lupeol derivative in site I (Fig. 5), in agreement with the
computationally determined docking studies. Thus the result of molecular modeling study is in
good accordance with the experimental study.
Molecular dynamics simulations studies
Molecular dynamics simulations (MD) have become a promising tool to generate multiple
conformations for the investigation of macromolecules, as they can provide insights of the
molecular properties on different timescales. Experiments on MD simulations of HSA with
explicit water molecules has been reported 63. Based on the agreement of experimental and
computational evidence, the best docking conformation of HSA-lupeol and HSA-lupeol
derivative was chosen (Fig. 7A and 7D) and used as the starting point for a 10 ns simulation.
After a series of 10 ns MD simulations, the trajectories were analyzed for stability and the
complete details of motions of protein and ligands in the system. Properties like root mean
square deviation (RMSD), radius of gyration (Rg) and root mean square fluctuations (RMSF) of
HSA-ligand complexes were examined, with respect to the unliganded HSA, which could
explain the experimentally observed activity and to cross check our results from docking.
Page 21 of 38 Molecular BioSystems
Mol
ecul
arB
ioS
yste
ms
Acc
epte
dM
anus
crip
t
Publ
ishe
d on
10
Febr
uary
201
5. D
ownl
oade
d by
Uni
vers
ity o
f H
yder
abad
on
11/0
2/20
15 0
7:11
:18.
View Article OnlineDOI: 10.1039/C4MB00635F

21
An initial evaluation of structural drift is provided by analysis of the Cα atom RMSDs from
the initial structures as a function of time. The RMSD values of Cα atoms in unliganded HSA
and HSA-lupeol and HSA-lupeol derivative complexes were shown in Fig. 8A and 8B. From 0-
10 ns trajectory data, the rmsd values for free HSA is 0.4 ± 0.3 nm, while the HSA-lupeol
complex fluctuated initially , and got stabilized after 3 ns simulation time with the data points 0.3
± 0.5 nm (Fig. 8A). HSA-lupeol derivative showed less fluctuation of heavy atoms compared to
HSA-lupeol complex, and all the heavy atoms are around 0.35 ± 0.2 to 0.38 ± 0.2, respectively
(Fig. 8B). This indicated that, with only few atomic fluctuations in the magnitude of RMSD of
both systems, protein-ligand complex reached to an equilibrium state. The interval
conformations during MD simulation was observed to check whether the ligand was anchored to
the residues in the active site using VMD software 64, which confirmed that the ligand anchored
into the active site during the 10 ns MD simulation (data not shown). Hence, we conclude that
during simulations the complexes remain stable and no significant structural drift occurred from
the initial docked conformers.
The variation of Rg with time is depicted in Fig. 8C and 8D, which explains the
compactness of the system (protein + ligand), over the course of MD simulations. The Rg values
of unliganded HSA is at 2.65 ± 0.35 nm, while the complexes initially fluctuated and then
achieved equilibrium after 5 ns at around 2.6 ± 0.003 and 2.58 ± 0.023 nm for lupeol and lupeol
derivative, indicating the stabilization of the complex. The earlier report shows that the Rg value
of HSA was experimentally measured in aqueous solution and reported to be 2.74 ± 0.035 65.
However, there is a decrease in Rg value, upon binding of lupeol and lupeol derivative, which
can corroborate with the similar results obtained from free HSA 2.59 ± 0.03 and upon HSA-β-
sitosterol complex 2.40 ± 0 .031 nm, betulinic acid stabilized from 2.59 ± 0.03 to 2.51 ± 0.01 nm
Page 22 of 38Molecular BioSystems
Mol
ecul
arB
ioS
yste
ms
Acc
epte
dM
anus
crip
t
Publ
ishe
d on
10
Febr
uary
201
5. D
ownl
oade
d by
Uni
vers
ity o
f H
yder
abad
on
11/0
2/20
15 0
7:11
:18.
View Article OnlineDOI: 10.1039/C4MB00635F

22
and it can also be observed from Rg of chitosan oligomers stabilizing at 2.52 ± 0.03 to 2.45 ±
0.031 18, 20, 40, while some ligands like fatty acids (myristates) showed increase in Rg value upon
binding with HSA 66. This indicates that these compounds changes the microenvironment of
HSA while binding and further leads to the conformational changes. The above observations also
supports the changes observed in CD data, as discussed above (Fig. 6C). Thus the RMSD and Rg
results suggest that HSA flexibility enable preferential affinity for several ligands.
Investigation of local protein mobility of HSA-lupeol and HSA-lupeol derivative
complexes explains the root mean square fluctuation of all residues over a 10 ns time scale. The
RMSF values of HSA-lupeol and HSA-lupeol derivative overlap with the RMSF values of
unliganded HSA and these are plotted against residue numbers. Our results showed less atomic
fluctuations at ligand binding sites I and II, with respect to other domain regions as shown in Fig.
9A and 9B. To investigate in details of atomic fluctuations at drug-binding sites, the RMSF value
of each amino acid residue at the site was determined. Fig. 9C and 9D focus on the residues
Pro416, Ser419, Thr467, Pro468, Val469, Ser470, Asp471, Thr498, Tyr497, Val498,
surrounding the binding pocket of lupeol in the region of site II, and residues Ala300, Asp301,
Leu302, Pro303, Ser304, Met298, Arg337, His338, Val381, Phe374, Lys378, Gln442, Met446,
Pro299, surrounding lupeol derivative in site I. In the present MD study, many of the residues
showed smaller RMSF values, suggesting that amino acids that can affect binding affinity in
HSA molecules have smaller atomic fluctuations; in other words, these amino acid residues are
rigid as compared with other residues. The structural movements of HSA domain display
different binding site properties which can help the ligands to adopt different binding modes, as
observed in the docking result (Fig. 7B and 7E). Consequently, different free energy values are
obtained from fluorescence binding studies and computational results (Table S3).
Page 23 of 38 Molecular BioSystems
Mol
ecul
arB
ioS
yste
ms
Acc
epte
dM
anus
crip
t
Publ
ishe
d on
10
Febr
uary
201
5. D
ownl
oade
d by
Uni
vers
ity o
f H
yder
abad
on
11/0
2/20
15 0
7:11
:18.
View Article OnlineDOI: 10.1039/C4MB00635F

23
MD simulations confirmed that there is significant movement of the protein after binding
of ligand molecules, which can influence on ligand recognition 67. To analyze the internal
motions of HSA-lupeol complexes, snapshots were taken at each nanosecond interval, to
understand the flexibility of ligand in interacting with the residues of HSA in binding pocket
during the simulation. Fig. S4 shows the snapshot taken at 0.1 ns, where the lupeol molecule is
formed hydrogen bond with Asn471, as we can also see in the docking conformer. While at 3 ns,
residing in the subdomain IIIA, there is a slight relative motions of lupeol showing hydrogen
bond with Val498, which is a part of intradomain connection between IIIA and IIIB 99, and
stabilized until 10 ns. These movements were supported by RMSD Cα deviation and radius of
gyration, discussed earlier (Fig. 8A and 8C). Although lupeol derivative did not show hydrogen
bonding with any of the protein residues, the 10ns MD simulation indicates that it is stable
around the binding site, compared with lupeol binding to HSA (Fig. S5). Due to these structural
arrangements, there is a change in microenvironment observed during fluorescence emission
shown in Fig. 3B, and also secondary conformational changes of HSA, discussed through CD
studies (Fig. 6B). This proves that the lupeol derivative is stable in the hydrophobic cavity of
HSA, changing its orientation while binding to HSA as showed in the above docking studies.
Thus, we suggest that the changes in atomic fluctuations observed in the present MD study
influence the binding affinity of both these drugs.
Conclusions
The goal of this study was to elucidate the effect of binding of phytocompounds i.e., lupeol and
lupeol derivative to HSA and AGP. Lupeol and its derivative were checked for their potency in
binding with the plasma proteins. Also, these molecules showed a decrease in viability of
inflammatory macrophages and human cervical cancer cells. IL-1β and IL-6 cytokines
Page 24 of 38Molecular BioSystems
Mol
ecul
arB
ioS
yste
ms
Acc
epte
dM
anus
crip
t
Publ
ishe
d on
10
Febr
uary
201
5. D
ownl
oade
d by
Uni
vers
ity o
f H
yder
abad
on
11/0
2/20
15 0
7:11
:18.
View Article OnlineDOI: 10.1039/C4MB00635F

24
expression was down regulated by lupeol and lupeol derivative indicating strong inhibition of
inflammatory cells. Percent apoptotic cells are raised with lupeol derivative than lupeol indicate
both molecules have anti-cancer activity. Slight difference in cytotoxic studies may be due to a
single double bond position difference in both molecules, addition of functional groups may
induce more changes in their activity. Lupeol and lupeol derivative bind to HSA and AGP,
change in fluorescence quenching reveals a change in microenvironment around the binding
pocket. Site-specific binding studies indicate that lupeol binds in site II whereas lupeol derivative
binds to site I, replacing ibuprofen and phenyl butazone, respectively. Further CD studies
revealed partial unfolding of the protein upon binding of lupeol, however, the degree of
unfolding is significantly greater when binding lupeol derivative. Additionally, the molecular
docking studies corroborated with the experimental study indicating that lupeol binds to
subdomain IIIA of site II and lupeol derivative to subdomain IIA of site I, with hydrophobic and
hydrogen bonding interactions. The primary HSA drug binding sites II and I, showed relatively
small RMSF values on average, underscoring the stability of HSA-lupeol and HSA-lupeol
derivatives after complex formation. Simulations over longer time periods are preferable for
further detailed investigation of the effect of binding. The present study, successfully provided
insights of lupeol and lupeol derivative and their surrounding residues of HSA, over a period of
time. The structural rearrangements and partial changes are in agreement with CD studies,
RMSD and Rg values. Our study provides useful and accurate information about HSA/AGP-
lupeol, HSA/AGP-lupeol derivative interactions. Thus, these studies will certainly give an
understanding of synthesizing new inspired lupeol drug to act upon life threatening diseases.
Page 25 of 38 Molecular BioSystems
Mol
ecul
arB
ioS
yste
ms
Acc
epte
dM
anus
crip
t
Publ
ishe
d on
10
Febr
uary
201
5. D
ownl
oade
d by
Uni
vers
ity o
f H
yder
abad
on
11/0
2/20
15 0
7:11
:18.
View Article OnlineDOI: 10.1039/C4MB00635F

25
Acknowledgements
This work was supported by Department of Science and Technology (No. SR/SO/BB-
0123/2010 and DST-FIST), DBT-CREBB, India and UPE-2, University of Hyderabad. We thank
CIL and BIF, University of Hyderabad, for CD and Bioinformatics facilities. The author Dr. K.
Monika is grateful to UGC-NEW Delhi for providing financial support under the scheme of Dr.
D. S. Kothari Postdoctoral Fellowship.
References
1. K. Papi Reddy, A. Singh, A. Puri, A. Srivastava and T. Narender, Bioorganic & medicinal chemistry letters, 2009, 19, 4463-4466.
2. S. V, K. SA, S. PT and V. P, Vascul Pharmacol, 2007, 46, 412-418. 3. H. R. Siddique, S. K. Mishra, R. J. Karnes and M. Saleem, Clinical Cancer Research, 2011, 17, 5379-5391. 4. G. Kweifio‐Okai, B. Field, B. A. Rumble, T. A. Macrides and F. De Munk, Drug development research,
1995, 35, 137-141. 5. M. A. Fernández, B. Heras, M. D. Garcia, M. T. Sáenz and A. Villar, Journal of Pharmacy and
Pharmacology, 2001, 53, 1533-1539. 6. M. Shahlaei, S. M. Ghanadian, A. M. Ayatollahi, M. A. Mesaik, O. M. Abdalla, S. Afsharypour and M.
Rabbani, Medicinal Chemistry Research, 2013, 22, 1795-1803. 7. P. Ascenzi and M. Fasano, Biophysical chemistry, 2010, 148, 16-22. 8. X. M. He and D. C. Carter, 1992. 9. U. Kragh-Hansen, Pharmacological Reviews, 1981, 33, 17-53. 10. T. Peters Jr, Advances in protein chemistry, 1985, 37, 161-245. 11. U. Kragh-Hansen, V. T. G. Chuang and M. Otagiri, Biological and Pharmaceutical Bulletin, 2002, 25, 695-
704. 12. M. Fasano, S. Curry, E. Terreno, M. Galliano, G. Fanali, P. Narciso, S. Notari and P. Ascenzi, IUBMB life,
2005, 57, 787-796. 13. C.-E. Ha and N. V. Bhagavan, Biochimica et Biophysica Acta (BBA)-General Subjects, 2013, 1830, 5486-
5493. 14. G. Sudlow, D. Birkett and D. Wade, Molecular Pharmacology, 1976, 12, 1052-1061. 15. A. Varshney, P. Sen, E. Ahmad, M. Rehan, N. Subbarao and R. H. Khan, Chirality, 2010, 22, 77-87. 16. S. Curry, Drug metabolism and pharmacokinetics, 2009, 24, 342-357. 17. B. Sudhamalla, M. Gokara, N. Ahalawat, D. G. Amooru and R. Subramanyam, The Journal of Physical
Chemistry B, 2010, 114, 9054-9062. 18. S. Neelam, M. Gokara, B. Sudhamalla, D. G. Amooru and R. Subramanyam, The Journal of Physical
Chemistry B, 2010, 114, 3005-3012. 19. M. Gokara, T. Malavath, S. K. Kalangi, P. Reddana and R. Subramanyam, Journal of Biomolecular
Structure and Dynamics, 2014, 32, 1290-1302. 20. A. Garg, D. M. Manidhar, M. Gokara, C. Malleda, C. S. Reddy and R. Subramanyam, PloS one, 2013, 8,
e63805. 21. S. Afrin, G. Rabbani and R. H. Khan, Journal of Luminescence, 2014, 151, 219-223. 22. M. Gokara, B. Sudhamalla, D. G. Amooru and R. Subramanyam, PloS one, 2010, 5, e8834. 23. W. Zhang, X. Bai, Y. Wang, B. Zhao, Y. Zhao, W. Hou, Y. Jin and D. Zhao, Spectrochimica Acta Part A:
Molecular and Biomolecular Spectroscopy, 2014, 117, 210-215. 24. D. P. Yeggoni, M. Gokara, D. Mark Manidhar, A. Rachamallu, S. Nakka, C. S. Reddy and R.
Subramanyam, Molecular pharmaceutics, 2014, 11, 1117-1131. 25. I. Petitpas, T. Grüne, A. A. Bhattacharya and S. Curry, Journal of molecular biology, 2001, 314, 955-960. 26. F. Zsila, Molecular pharmaceutics, 2013, 10, 1668-1682.
Page 26 of 38Molecular BioSystems
Mol
ecul
arB
ioS
yste
ms
Acc
epte
dM
anus
crip
t
Publ
ishe
d on
10
Febr
uary
201
5. D
ownl
oade
d by
Uni
vers
ity o
f H
yder
abad
on
11/0
2/20
15 0
7:11
:18.
View Article OnlineDOI: 10.1039/C4MB00635F

26
27. R. Subramanyam, M. Goud, B. Sudhamalla, E. Reddeem, A. Gollapudi, S. Nellaepalli, V. Yadavalli, M. Chinnaboina and D. G. Amooru, Journal of Photochemistry and Photobiology B: Biology, 2009, 95, 81-88.
28. T. Fournier, N. Medjoubi-N and D. Porquet, Biochimica et Biophysica Acta (BBA)-Protein Structure and Molecular Enzymology, 2000, 1482, 157-171.
29. V. Kopecký, R. Ettrich, K. Hofbauerová and V. Baumruk, Journal of Spectroscopy, 2004, 18, 323-330. 30. V. T. G. Chuang and M. Otagiri, Chirality, 2006, 18, 159-166. 31. J. R. Simard, P. A. Zunszain, J. A. Hamilton and S. Curry, Journal of molecular biology, 2006, 361, 336-
351. 32. C. Gambacorti-Passerini, M. Zucchetti, D. Russo, R. Frapolli, M. Verga, S. Bungaro, L. Tornaghi, F. Rossi,
P. Pioltelli and E. Pogliani, Clinical Cancer Research, 2003, 9, 625-632. 33. R. Subramanyam, A. Gollapudi, P. Bonigala, M. Chinnaboina and D. G. Amooru, Journal of
Photochemistry and Photobiology B: Biology, 2009, 94, 8-12. 34. T. Mosmann, Journal of immunological methods, 1983, 65, 55-63. 35. G. Zhang, V. Gurtu, S. R. Kain and G. Yan, Biotechniques, 1997, 23, 525-531. 36. J. R. Lakowicz and I. Gryczynski, Biophysical chemistry, 1992, 45, 1-6. 37. M. Mansouri, M. Pirouzi, M. R. Saberi, M. Ghaderabad and J. Chamani, Molecules, 2013, 18, 789-813. 38. G. M. Morris, D. S. Goodsell, R. Huey and A. J. Olson, Journal of computer-aided molecular design, 1996,
10, 293-304. 39. G. M. Morris, R. Huey, W. Lindstrom, M. F. Sanner, R. K. Belew, D. S. Goodsell and A. J. Olson, Journal
of computational chemistry, 2009, 30, 2785-2791. 40. C. Malleda, N. Ahalawat, M. Gokara and R. Subramanyam, Journal of molecular modeling, 2012, 18,
2589-2597. 41. A. C. Wallace, R. A. Laskowski and J. M. Thornton, Protein engineering, 1995, 8, 127-134. 42. T. C. Guizado, Journal of molecular modeling, 2014, 20, 1-13. 43. W. F. van Gunsteren, X. Daura and A. E. Mark, Encyclopedia of computational chemistry, 1998. 44. A. W. Schuttelkopf and D. M. Van Aalten, Acta Crystallographica Section D: Biological Crystallography,
2004, 60, 1355-1363. 45. J. Hermans, H. J. Berendsen, W. F. Van Gunsteren and J. P. Postma, Biopolymers, 1984, 23, 1513-1518. 46. C. Adcock, G. R. Smith and M. S. Sansom, Biophysical journal, 1998, 75, 1211-1222. 47. H. J. Berendsen, J. P. M. Postma, W. F. van Gunsteren, A. DiNola and J. Haak, The Journal of chemical
physics, 1984, 81, 3684-3690. 48. T. Darden, D. York and L. Pedersen, The Journal of chemical physics, 1993, 98, 10089-10092. 49. B. Hess, H. Bekker, H. J. Berendsen and J. G. Fraaije, Journal of computational chemistry, 1997, 18, 1463-
1472. 50. M. Saleem, Cancer letters, 2009, 285, 109-115. 51. J. Vasconcelos, M. Teixeira, J. Barbosa-Filho, A. Lúcio, J. Almeida, L. de Queiroz, R. Ribeiro-dos-Santos
and M. Soares, International immunopharmacology, 2008, 8, 1216-1221. 52. J. Ghuman, P. A. Zunszain, I. Petitpas, A. A. Bhattacharya, M. Otagiri and S. Curry, Journal of molecular
biology, 2005, 353, 38-52. 53. A. Sułkowska, Journal of Molecular Structure, 2002, 614, 227-232. 54. N. Tayeh, T. Rungassamy and J. R. Albani, Journal of pharmaceutical and biomedical analysis, 2009, 50,
107-116. 55. D. Agudelo, P. Bourassa, J. Bruneau, G. Bérubé, É. Asselin and H.-A. Tajmir-Riahi, PloS one, 2012, 7,
e43814. 56. L. Liang, H. Tajmir-Riahi and M. Subirade, Biomacromolecules, 2007, 9, 50-56. 57. C. Dufour and O. Dangles, Biochimica et Biophysica Acta (BBA)-General Subjects, 2005, 1721, 164-173. 58. M. Gokara, G. B. Kimavath, A. R. Podile and R. Subramanyam, Journal of Biomolecular Structure and
Dynamics, 2013, 1-15. 59. M. H. Rahman, K. Yamasaki, Y. Shin, C. C. Lin and M. Otagiri, Biological & pharmaceutical bulletin,
1993, 16, 1169-1174. 60. Z. Sattar, H. Iranfar, A. Asoodeh, M. R. Saberi, M. Mazhari and J. Chamani, Spectrochimica Acta Part A:
Molecular and Biomolecular Spectroscopy, 2012, 97, 1089-1100. 61. T. Kosa, T. Maruyama and M. Otagiri, Pharmaceutical research, 1998, 15, 449-454. 62. S. Sugio, A. Kashima, S. Mochizuki, M. Noda and K. Kobayashi, Protein engineering, 1999, 12, 439-446. 63. R. Artali, G. Bombieri, L. Calabi and A. Del Pra, Il Farmaco, 2005, 60, 485-495. 64. W. Humphrey, A. Dalke and K. Schulten, Journal of molecular graphics, 1996, 14, 33-38.
Page 27 of 38 Molecular BioSystems
Mol
ecul
arB
ioS
yste
ms
Acc
epte
dM
anus
crip
t
Publ
ishe
d on
10
Febr
uary
201
5. D
ownl
oade
d by
Uni
vers
ity o
f H
yder
abad
on
11/0
2/20
15 0
7:11
:18.
View Article OnlineDOI: 10.1039/C4MB00635F

27
65. M. Kiselev, I. Gryzunov, G. Dobretsov and M. Komarova, Biofizika, 2000, 46, 423-427. 66. S. i. Fujiwara and T. Amisaki, Proteins: Structure, Function, and Bioinformatics, 2006, 64, 730-739. 67. H. A. Carlson, K. M. Masukawa and J. A. McCammon, The Journal of Physical Chemistry A, 1999, 103,
10213-10219.
Figure Legends
Fig. 1 Cytotoxicity of lupeol and lupeol derivative. (A) lupeol and (B) lupeol derivative (Ld)
showing anti-inflammatory property against LPS induced mouse macrophages (RAW 264.7) in a
dose dependent manner. (C) lupeol and (D) lupeol derivative showing anti-cancer property
against human cervical cancer cells (HeLa). Cell growth was measured by the MTT assay and
the IC50 values are calculated for their inhibition.
Fig. 2 Apoptosis induction of 15 μM lupeol and 12 μM lupeol derivative on 24h culture of HeLa
cell line. The fluorescence was determined immediately by using flow cytometer. Cells were
estimated as percentages in quadrants, i.e. Q1 as late apoptotic or necrotic cells, Q2 dead cells,
Q3 as live cells and Q4 as apoptotic cells.
Fig. 3 Fluorescence emission spectra of HSA-ligands, λex = 285 nm, temperature 25° C. (A)
free HSA (0.001 mM) and different concentrations of lupeol (0.001 – 0.009 mM). (B) free HSA
and different concentrations of lupeol derivative (Ld). Plots of log (dF/F) against log [Q]. λex =
285 nm, λem = 362 nm.
Fig. 4 Fluorescence emission spectra of AGP-ligands, λex = 285 nm, temperature 25° C. (A)
free AGP (0.001 mM) and different concentrations of lupeol (0.001 – 0.009 mM). (B) free AGP
and different concentrations of lupeol derivative (Ld). Plots of log (dF/F) against log [Q] λex =
285 nm, λem = 340 nm.
Fig. 5 Site-specific binding of ligands with HSA. (A) displacement of ibuprofen from the HSA-
ibuprofen complex by lupeol. (B) displacement of phenyl butazone from the HSA-phenyl
Page 28 of 38Molecular BioSystems
Mol
ecul
arB
ioS
yste
ms
Acc
epte
dM
anus
crip
t
Publ
ishe
d on
10
Febr
uary
201
5. D
ownl
oade
d by
Uni
vers
ity o
f H
yder
abad
on
11/0
2/20
15 0
7:11
:18.
View Article OnlineDOI: 10.1039/C4MB00635F

28
butazone by lupeol derivative (Ld).
Fig. 6 CD spectra of free HSA and HSA+lupeol, lupeol derivative complexes. (A) HSA and
HSA -lupeol complex. (B) HSA and HSA -lupeol derivative complex with a protein
concentration of 0.001 mM and ligand concentrations of 0.001, 0.002 and 0.003 mM. (C)
Percentage concentrations of lupeol and lupeol derivative (Ld).
Fig. 7 Best docking conformation with lowest binding energy. (A) Lupeol bound to IIIA
domain on HSA and (D) lupeol derivative to IIA (Protein and ligand colored in magenta and red,
respectively) (B) Stereoview of docking pose of HSA-lupeol complex and (E) HSA-lupeol
derivative complex (prepared by using Pymol v 1.5) (C) Ligplot showing hydrophobic
interactions of HSA-lupeol and (F) HSA-lupeol derivative in the binding sites.
Fig. 8 Time dependence of RMSD of Cα atoms from the starting structure during 10 ns
MD simulations. (A) Plot of rmsd values for unliganded HSA and HSA-lupeol (B) unliganded
HSA and HSA-lupeol derivative (Ld) complex. (C) Time evolution of the radius of gyration (Rg)
during 10 ns of MD simulation of unliganded HSA and HSA-lupeol (D) unliganded HSA and
HSA-lupeol derivative complexes.
Fig. 9 Comparision of the RMSF of Cα atoms along the sequence derived from the 10 ns
simulations. (A) Red line represents the unliganded HSA and black line the HSA-lupeol
complex. (B) HSA-lupeol derivative complex. (C) The RMSF values of free HSA and HSA-
lupeol (D) HSA-lupeol derivative (Ld) complexes were plotted against residue numbers.
Residues showing rigidity in the subdomain IIIA and IIA.
Page 29 of 38 Molecular BioSystems
Mol
ecul
arB
ioS
yste
ms
Acc
epte
dM
anus
crip
t
Publ
ishe
d on
10
Febr
uary
201
5. D
ownl
oade
d by
Uni
vers
ity o
f H
yder
abad
on
11/0
2/20
15 0
7:11
:18.
View Article OnlineDOI: 10.1039/C4MB00635F

Figure 1
Page 30 of 38Molecular BioSystems
Mol
ecul
arB
ioS
yste
ms
Acc
epte
dM
anus
crip
t
Publ
ishe
d on
10
Febr
uary
201
5. D
ownl
oade
d by
Uni
vers
ity o
f H
yder
abad
on
11/0
2/20
15 0
7:11
:18.
View Article OnlineDOI: 10.1039/C4MB00635F
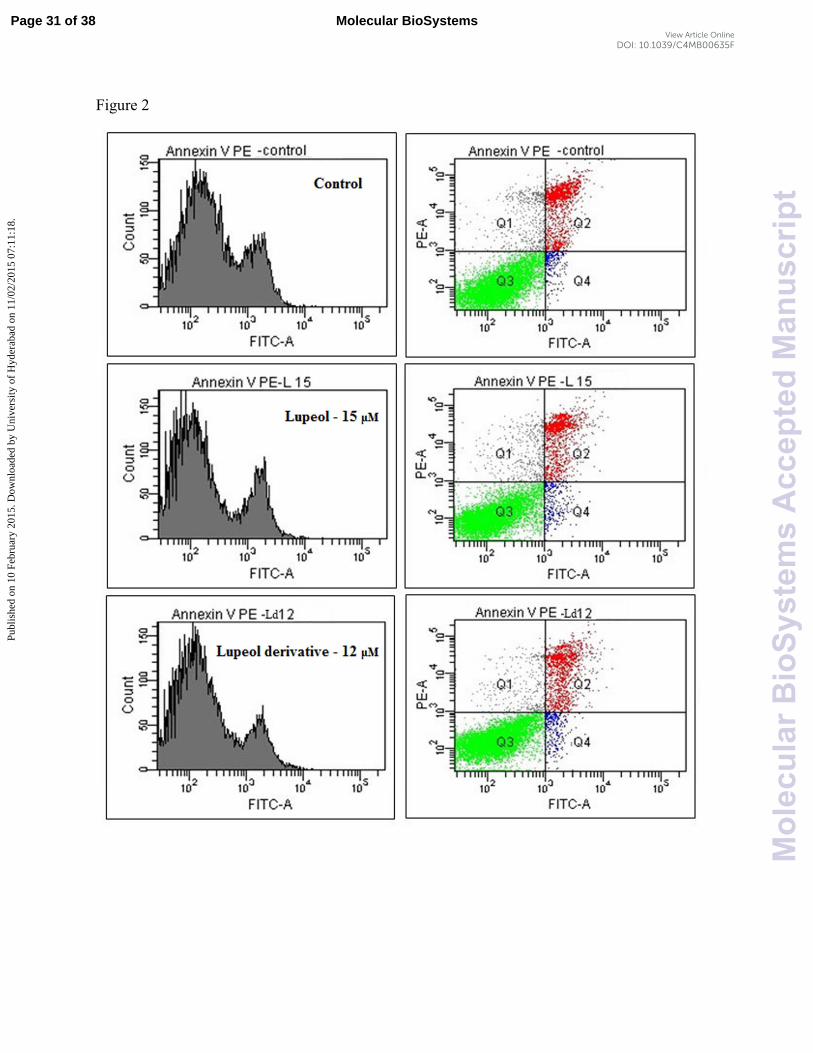
Figure 2
Page 31 of 38 Molecular BioSystems
Mol
ecul
arB
ioS
yste
ms
Acc
epte
dM
anus
crip
t
Publ
ishe
d on
10
Febr
uary
201
5. D
ownl
oade
d by
Uni
vers
ity o
f H
yder
abad
on
11/0
2/20
15 0
7:11
:18.
View Article OnlineDOI: 10.1039/C4MB00635F
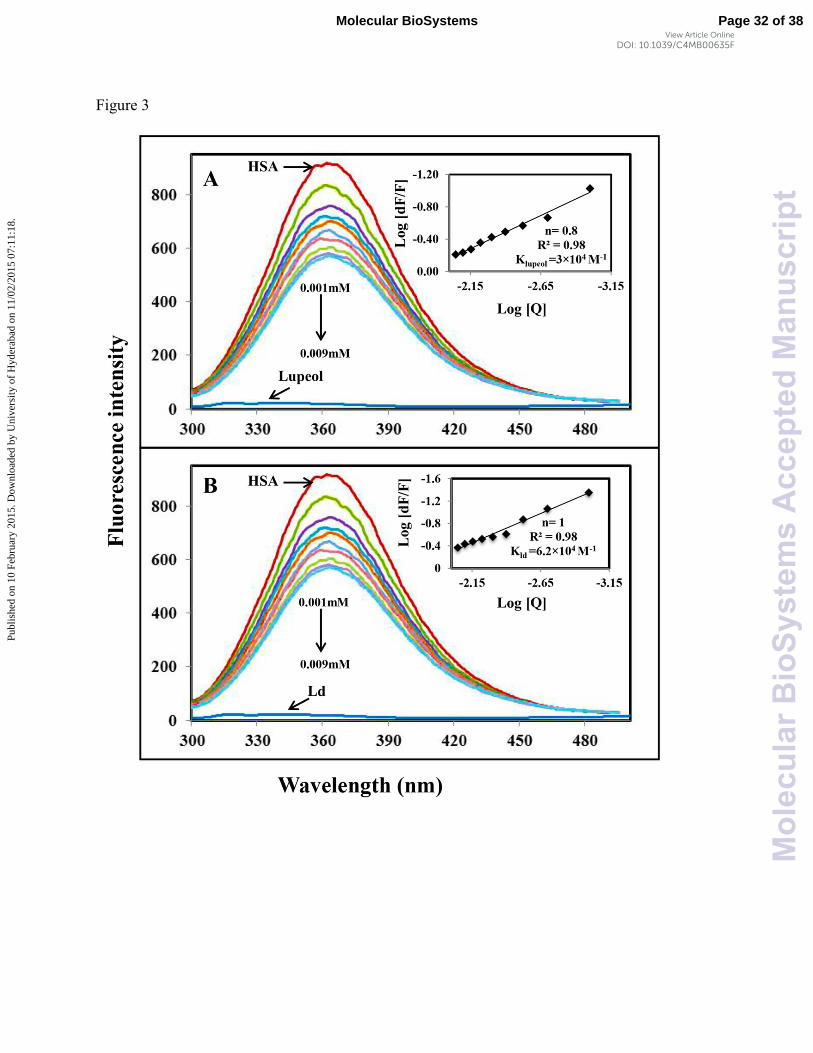
Figure 3
Page 32 of 38Molecular BioSystems
Mol
ecul
arB
ioS
yste
ms
Acc
epte
dM
anus
crip
t
Publ
ishe
d on
10
Febr
uary
201
5. D
ownl
oade
d by
Uni
vers
ity o
f H
yder
abad
on
11/0
2/20
15 0
7:11
:18.
View Article OnlineDOI: 10.1039/C4MB00635F

Figure 4
Page 33 of 38 Molecular BioSystems
Mol
ecul
arB
ioS
yste
ms
Acc
epte
dM
anus
crip
t
Publ
ishe
d on
10
Febr
uary
201
5. D
ownl
oade
d by
Uni
vers
ity o
f H
yder
abad
on
11/0
2/20
15 0
7:11
:18.
View Article OnlineDOI: 10.1039/C4MB00635F

Figure 5
Page 34 of 38Molecular BioSystems
Mol
ecul
arB
ioS
yste
ms
Acc
epte
dM
anus
crip
t
Publ
ishe
d on
10
Febr
uary
201
5. D
ownl
oade
d by
Uni
vers
ity o
f H
yder
abad
on
11/0
2/20
15 0
7:11
:18.
View Article OnlineDOI: 10.1039/C4MB00635F

Figure 6
Page 35 of 38 Molecular BioSystems
Mol
ecul
arB
ioS
yste
ms
Acc
epte
dM
anus
crip
t
Publ
ishe
d on
10
Febr
uary
201
5. D
ownl
oade
d by
Uni
vers
ity o
f H
yder
abad
on
11/0
2/20
15 0
7:11
:18.
View Article OnlineDOI: 10.1039/C4MB00635F
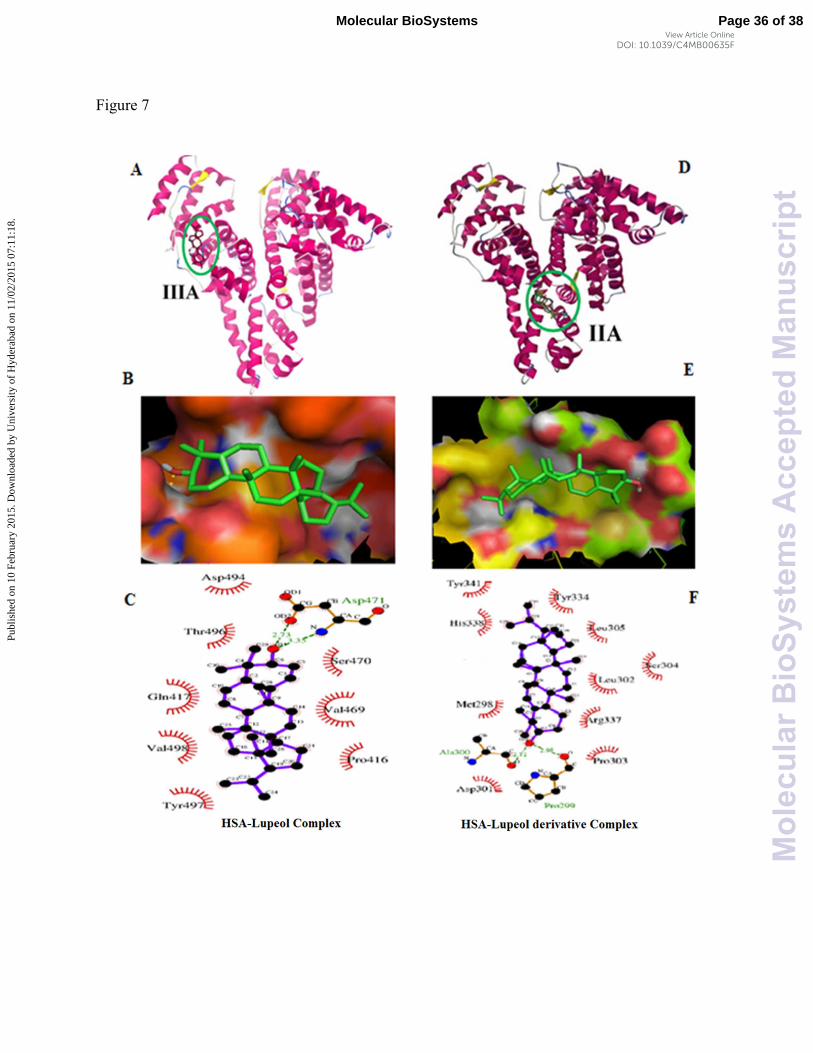
Figure 7
Page 36 of 38Molecular BioSystems
Mol
ecul
arB
ioS
yste
ms
Acc
epte
dM
anus
crip
t
Publ
ishe
d on
10
Febr
uary
201
5. D
ownl
oade
d by
Uni
vers
ity o
f H
yder
abad
on
11/0
2/20
15 0
7:11
:18.
View Article OnlineDOI: 10.1039/C4MB00635F

Figure 8
Page 37 of 38 Molecular BioSystems
Mol
ecul
arB
ioS
yste
ms
Acc
epte
dM
anus
crip
t
Publ
ishe
d on
10
Febr
uary
201
5. D
ownl
oade
d by
Uni
vers
ity o
f H
yder
abad
on
11/0
2/20
15 0
7:11
:18.
View Article OnlineDOI: 10.1039/C4MB00635F

Figure 9
Page 38 of 38Molecular BioSystems
Mol
ecul
arB
ioS
yste
ms
Acc
epte
dM
anus
crip
t
Publ
ishe
d on
10
Febr
uary
201
5. D
ownl
oade
d by
Uni
vers
ity o
f H
yder
abad
on
11/0
2/20
15 0
7:11
:18.
View Article OnlineDOI: 10.1039/C4MB00635F
Related Documents