Article Comparative Associations of Muscle Mass and Muscle Strength with Mortality in Dialysis Patients Naohito Isoyama,* † Abdul Rashid Qureshi,* Carla Maria Avesani, ‡ Bengt Lindholm,* Peter Ba`ra`ny,* Olof Heimbu ¨rger,* Tommy Cederholm, § Peter Stenvinkel,* and Juan Jesu ´s Carrero* | Abstract Background and objectives Reduced muscle mass and strength are prevalent conditions in dialysis patients. However, muscle strength and muscle mass are not congruent; muscle strength can diminish even though muscle mass is maintained or increased. This study addresses phenotype and mortality associations of these muscle dysfunction entities alone or in combination (i.e., concurrent loss of muscle mass and strength/mobility, here defined as sarcopenia). Design, setting, participants, & measurements This study included 330 incident dialysis patients (203 men, mean age 53613 years, and mean GFR 762 ml/min per 1.73 m 2 ) recruited between 1994 and 2010 and followed prospectively for up to 5 years. Low muscle mass (by dual-energy x-ray absorptiometry appendicular mass index) and low muscle strength (by handgrip) were defined against young reference populations according to the European Working Group on Sarcopenia in Older People. Results Whereas 20% of patients had sarcopenia, low muscle mass and low muscle strength alone were observed in a further 24% and 15% of patients, respectively. Old age, comorbidities, protein-energy wasting, physical inactivity, low albumin, and inflammation associated with low muscle strength, but not with low muscle mass (multivariate ANOVA interactions). During follow-up, 95 patients (29%) died and both conditions associated with mortality as separate entities. When combined, individuals with low muscle mass alone were not at increased risk of mortality (adjusted hazard ratio [HR], 1.23; 95% confidence interval [95% CI], 0.56 to 2.67). Individuals with low muscle strength were at increased risk, irrespective of their muscle stores being appropriate (HR, 1.98; 95% CI, 1.01 to 3.87) or low (HR, 1.93; 95% CI, 1.01 to 3.71). Conclusions Low muscle strength was more strongly associated with aging, protein-energy wasting, physical inactivity, inflammation, and mortality than low muscle mass. Assessment of muscle functionality may provide additional diagnostic and prognostic information to muscle-mass evaluation. Clin J Am Soc Nephrol 9: ccc–ccc, 2014. doi: 10.2215/CJN.10261013 Introduction CKD, especially ESRD, represents a major public health issue and an important contributor to the overall non- communicable disease burden. Its increasing prevalence is explained to a large extent by the longer life expec- tancy of the community because the majority of patients initiating dialysis are in their sixth and seventh decades of life (1). Markers of both muscle mass and strength are important predictors of outcomes in this patient popu- lation (2,3) subjected to a catabolic protein-energy wast- ing (PEW) syndrome (4). Etymologically, the term “sarcopenia” refers to a state of low muscle mass. However, international so- cieties recently proposed this term to encompass the concept of limited muscle mass with limited func- tion/mobility (5–7). The rationale is that muscle mass and muscle function do not have the same clin- ical relevance during the aging process (5–7). Within this study, we adhere to such terminology. Sarcopenia in these terms ( i.e. , reduced muscle mass with limited mobility/function) has been associated with frailty, cachexia, and functional disability, leading to worse quality of life and higher mortality rates (8). The prevalence of sarcopenia in non-CKD elderly in- dividuals ranges from 7%– 31% (8 – 10). CKD is considered a risk factor for accelerated aging (11), and prospective studies in older adults with CKD have quantified the risk for physical disability and cognitive decline as being approximately double that of the age-matched general population (12). Al- though the term sarcopenia is often used in the liter- ature to describe muscle derangements in patients with CKD (13–15), there are only two studies that have formally assessed its prevalence and clinical cor- relates. Sarcopenia was more prevalent in individuals with CKD stage$3 than in individuals with normal renal function (16), whereas it affected one third of prevalent hemodialysis patients (17). Nonetheless, muscle strength is not solely dependent upon muscle size, and both entities may disassociate (18). *Divisions of Renal Medicine and Baxter Novum, and | Center for Molecular Medicine, Karolinska Institute, Stockholm, Sweden; † Department of Urology, Yamaguchi University, Yamaguchi, Japan; ‡ Department of Applied Nutrition, Nutrition Institute, Rio de Janeiro State University, Rio de Janeiro, Brazil; and § Division of Clinical Nutrition and Metabolism, Department of Public Health and Caring Sciences, Uppsala University, Uppsala, Sweden Correspondence: Dr. Juan Jesu ´s Carrero, Divisions of Renal Medicine and Baxter Novum, Karolinska Institute, K56, Karolinska University Hospital at Huddinge, S-141 86 Stockholm, Sweden. Email: juan. [email protected] www.cjasn.org Vol 9 October, 2014 Copyright © 2014 by the American Society of Nephrology 1 . Published on July 29, 2014 as doi: 10.2215/CJN.10261013 CJASN ePress

Welcome message from author
This document is posted to help you gain knowledge. Please leave a comment to let me know what you think about it! Share it to your friends and learn new things together.
Transcript

Article
Comparative Associations of Muscle Mass and MuscleStrength with Mortality in Dialysis Patients
Naohito Isoyama,*† Abdul Rashid Qureshi,* Carla Maria Avesani,‡ Bengt Lindholm,* Peter Barany,* Olof Heimburger,*Tommy Cederholm,§ Peter Stenvinkel,* and Juan Jesus Carrero*|
AbstractBackground and objectives Reduced muscle mass and strength are prevalent conditions in dialysis patients.However,muscle strength andmusclemass are not congruent;muscle strength can diminish even thoughmusclemass is maintained or increased. This study addresses phenotype and mortality associations of these muscledysfunction entities alone or in combination (i.e., concurrent loss of muscle mass and strength/mobility, heredefined as sarcopenia).
Design, setting, participants, & measurements This study included 330 incident dialysis patients (203 men, meanage 53613 years, and mean GFR 762 ml/min per 1.73 m2) recruited between 1994 and 2010 and followedprospectively for up to 5 years. Low muscle mass (by dual-energy x-ray absorptiometry appendicular massindex) and lowmuscle strength (by handgrip)were defined against young reference populations according to theEuropean Working Group on Sarcopenia in Older People.
ResultsWhereas 20% of patients had sarcopenia, lowmuscle mass and lowmuscle strength alone were observedin a further 24% and 15% of patients, respectively. Old age, comorbidities, protein-energy wasting, physicalinactivity, low albumin, and inflammation associated with low muscle strength, but not with low muscle mass(multivariate ANOVA interactions). During follow-up, 95 patients (29%) died and both conditions associatedwith mortality as separate entities. When combined, individuals with low muscle mass alone were not atincreased risk of mortality (adjusted hazard ratio [HR], 1.23; 95% confidence interval [95% CI], 0.56 to 2.67).Individualswith lowmuscle strengthwere at increased risk, irrespective of their muscle stores being appropriate(HR, 1.98; 95% CI, 1.01 to 3.87) or low (HR, 1.93; 95% CI, 1.01 to 3.71).
Conclusions Low muscle strength was more strongly associated with aging, protein-energy wasting, physicalinactivity, inflammation, and mortality than lowmuscle mass. Assessment of muscle functionality may provideadditional diagnostic and prognostic information to muscle-mass evaluation.
Clin J Am Soc Nephrol 9: ccc–ccc, 2014. doi: 10.2215/CJN.10261013
IntroductionCKD, especially ESRD, represents a major public healthissue and an important contributor to the overall non-communicable disease burden. Its increasing prevalenceis explained to a large extent by the longer life expec-tancy of the community because the majority of patientsinitiating dialysis are in their sixth and seventh decadesof life (1). Markers of both muscle mass and strength areimportant predictors of outcomes in this patient popu-lation (2,3) subjected to a catabolic protein-energy wast-ing (PEW) syndrome (4).
Etymologically, the term “sarcopenia” refers to astate of low muscle mass. However, international so-cieties recently proposed this term to encompass theconcept of limited muscle mass with limited func-tion/mobility (5–7). The rationale is that musclemass and muscle function do not have the same clin-ical relevance during the aging process (5–7). Withinthis study, we adhere to such terminology. Sarcopeniain these terms (i.e., reduced muscle mass with
limited mobility/function) has been associated withfrailty, cachexia, and functional disability, leading toworse quality of life and higher mortality rates (8).The prevalence of sarcopenia in non-CKD elderly in-dividuals ranges from 7%–31% (8–10). CKD isconsidered a risk factor for accelerated aging (11),and prospective studies in older adults with CKDhave quantified the risk for physical disability andcognitive decline as being approximately doublethat of the age-matched general population (12). Al-though the term sarcopenia is often used in the liter-ature to describe muscle derangements in patientswith CKD (13–15), there are only two studies thathave formally assessed its prevalence and clinical cor-relates. Sarcopenia was more prevalent in individualswith CKD stage$3 than in individuals with normalrenal function (16), whereas it affected one third ofprevalent hemodialysis patients (17).Nonetheless, muscle strength is not solely dependent
uponmuscle size, and both entities may disassociate (18).
*Divisions of RenalMedicine and BaxterNovum, and |Center forMolecular Medicine,Karolinska Institute,Stockholm, Sweden;†Department ofUrology, YamaguchiUniversity, Yamaguchi,Japan; ‡Department ofApplied Nutrition,Nutrition Institute, Riode Janeiro StateUniversity, Rio deJaneiro, Brazil; and§Division of ClinicalNutrition andMetabolism,Departmentof Public Health andCaring Sciences,Uppsala University,Uppsala, Sweden
Correspondence:Dr. Juan Jesus Carrero,Divisions of RenalMedicine and BaxterNovum, KarolinskaInstitute, K56,Karolinska UniversityHospital at Huddinge,S-141 86 Stockholm,Sweden. Email: [email protected]
www.cjasn.org Vol 9 October, 2014 Copyright © 2014 by the American Society of Nephrology 1
. Published on July 29, 2014 as doi: 10.2215/CJN.10261013CJASN ePress

As people age, the rate of decline in muscle strength isgreater than the rate of loss of muscle mass (19), andmuscle strength can diminish even while muscle mass ismaintained or increased (20). Therefore, both conditionsneed to be defined independently because they may havedifferent clinical implications. This is of particular interestbecause therapeutic measures to maintain or increase musclemass or muscle strength are not necessarily the same (21).Against this background, this study assessed whethersarcopenia is common in dialysis patients, and whether thesetwo muscle dysfunction entities (muscle mass and strength)carry additive phenotype and mortality risk associations.
Materials and MethodsParticipants and Study DesignThis is a post hoc cross-sectional analysis with prospec-
tive follow-up from an ongoing cohort of incident dialysispatients (22). Patient recruitment occurred between De-cember 1994 and April 2010. Exclusion criteria includedage,18 or .75 years, signs of infection, and unwillingnessto participate. For this study, an additional exclusion cri-terion was absence of dual-energy x-ray absorptiometry(DEXA) data. Of 447 included patients, 330 patients(203 men, mean age 53613 years, and mean residualGFR 762 ml/min per 1.73 m2) met this criteria and wereconsidered in the analysis. As many as 99 patients hadalready initiated dialysis at the time of investigation. Themedian time between study inclusion and dialysis startwas 8 days (10th percentile–90th percentile, 1–35). Therewere no differences in demographics, comorbidities, andnutritional status in included versus nonincluded patients(data not shown). The causes of CKD were diabetic ne-phropathy (28%), chronic GN (27%), polycystic kidney dis-ease (13%), nephrosclerosis (6%), interstitial nephritis (2%),and other or unknown causes (24%). Diabetes mellitus waspresent in 31% of patients, whereas a history of cardiovas-cular disease (CVD; defined as cardiac, cerebrovascular, orperipheral vascular disease) was present in 36% of pa-tients. Most patients were taking antihypertensive medica-tions and drugs commonly used in ESRD, such asphosphate and calcium binders, diuretics, and vitamins.All patients were prospectively followed-up for #48months or until death, kidney transplantation, or July 1,2011, whichever event occurred first. The ethics committeeof the Karolinska Institute approved the study protocol,and informed consent was obtained from each individual.
Biochemical MethodsPlasma and serum were extracted after an overnight fast
and kept frozen at –70°C if not analyzed immediately.High-sensitivity C-reactive protein (CRP) was measuredby nephelometry. IL-6 was analyzed by ELISA (Roche Di-agnostics GmbH, Penzberg, Germany). TNF was analyzedat an Immulite system (Diagnostic Products Corp, Los An-geles, CA). Serum leptin levels were measured by an RIAkit (Linco Research Inc, Saint Charles, MO). The remainingbiochemical analyses were performed using routine meth-ods at the Department of Clinical Chemistry at KarolinskaUniversity Hospital at Huddinge. Residual GFR was cal-culated by the mean of renal urea and creatinine clear-ances from a 24-hour urine collection.
Body Composition and Nutritional Status AssessmentAll patients underwent assessment of body composition
and nutritional status, either at the time of or within 1 weekof blood sampling. Body compositionwas assessed bymeansof DEXA (Lunar Corp, Madison, WI), estimating lean bodymass and fat bodymass. DEXAwas performedwithin 7 daysfrom study inclusion and after the dialysis session if dialysiswas started. The lean body mass index (LBMI) and fat bodymass index (FBMI) were calculated in kilograms per meterssquared (23). Appendicular skeletal muscle mass was de-fined as the sum of the lean soft-tissue DEXA-estimatedmasses for the arms and legs (24). The appendicular skeletalmuscle index (ASMI) was calculated as follows: ASMI=Appendicular Skeletal Muscle Mass/Height2, and is ex-pressed in kilograms per meters squared. Midarm circumfer-ence was measured with a plastic tape measure. Midarmmuscle circumference (MAMC) was calculated by the follow-ing: MAMC=Midarm Circumference2(3.14163Triceps Skin-fold Thickness/10). Handgrip strength was measured using aHarpenden Handgrip Dynamometer (Yamar, Jackson, MI) inthe dominant hand or in the nonfistula hand if implanted.Each measurement was repeated three times, and the highestvalue was noted. Nutritional status was estimated by thesubjective global assessment. PEW was defined as an subjec-tive global assessment score.1 (25). Self-reported physicalactivity was recorded with the following predefined catego-ries: performance of regular exercise, ability to perform a nor-mal physical activity, and poor physical activity.
Definition of SarcopeniaPresence of sarcopenia was defined from the criteria
postulated by the European Working Group on Sarcopeniain Older People (7). ASMI cutoffs for low muscle masswere defined as values 2 SDs below the sex-specific meanfrom a young reference population (7.3 kg/m2 in men and5.5 kg/m2 in women) (26). Handgrip strength cutoffs for lowmuscle strength were also defined from young referencepopulations (,30 kg in men and ,20 kg in women) (27).Patients that fulfilled both criteria (i.e., presented concurrentlow levels of muscle mass and strength) were consideredsarcopenic.
Statistical AnalysesAll values are expressed as the mean6SD, median (10th
percentile–90th percentile), or percentage, as appropriate.A P value ,0.05 was considered statistically significant.Comparisons between two groups were performed by us-ing Wilcoxon’s rank-sum test, Fischer’s exact test, or thechi-squared test. Logistic regression models were per-formed to study multivariate correlates of variables as-sessed. A two-factor multivariate ANOVA with Wilks’ lwas used to measure the degree of correlation between thevariables. The model included a test for the effect of orderand tested interactions for the combined effect of low mus-cle mass and strength on patients’ phenotype. The generallinear model procedure with least–squares means wasused to identify significant interactions between factors.A chi-squared test was used for categorical variables. Sur-vival analysis was made with the Kaplan–Meier survivalcurve and the Cox proportional hazard model. We in-cluded plausible clinical and biochemical confounders as
2 Clinical Journal of the American Society of Nephrology

multivariable covariates in the association of interest. Coxregression analyses are presented as hazard ratios with95% confidence intervals. Biologic interactions betweenmuscle mass and strength on mortality prediction wereconsidered as a departure from causal additivity of effectsas assessed by the relative excess risk due to interaction,the synergy index, and the attributable proportion due tointeraction (28). Statistical analyses were performed usingSAS software (version 9.3; SAS, Cary, NC).
ResultsBaseline CharacteristicsThe mean age was 53613 years, with 23% of patients aged
.65 years. In addition, 203 participants (62%) were men,and the mean GFR was 762 ml/min per 1.73 m2. There
was a positive association between handgrip strength andappendicular muscle mass (r=0.28; P=0.001). In adjustedlogistic regression models (including age, sex, diabetes,CVD, GFR, PEW, and CRP), every SD reduction in musclemass associated with 13% lower odds of muscle weakness(low muscle strength; odds ratio, 0.13; 95% confidence in-terval, 0.03 to 0.61; P=0.01; pseudo r2=0.23).Table 1 shows patient characteristics according to the
presence/absence of either low appendicular musclemass or low muscle strength. Compared with patientswith appropriate muscle stores, those with low musclemass were older and more often men. Patients with lowmuscle mass more often had CVD, signs of PEW, and anonsignificant trend toward higher diabetic comorbidity.Low muscle mass associated with lower body mass index(BMI), lower FBMI, and lower surrogates of muscle mass.
Table 1. Clinical characteristics of incident dialysis patients (N=330) according to the presence of appropriate or low appendicularmuscle mass and appropriate or low muscle strength, respectively
CharacteristicMuscle Mass (N=330) Muscle Strength (N=330)
Appropriate Low P Value Appropriate Low P Value
Patients, n (%) 184 (56) 146 (44) 212 (64) 118 (36)Age, yr 53 (33–67) 58 (35–68) 0.003 51 (32–67) 61 (44–69) ,0.001Men 57 68 0.03 63 58 0.41Diabetes mellitus 35 26 0.07 22 43 0.002CVD 44 41 0.03 24 55 ,0.001PEW 19 43 ,0.001 16 52 ,0.001BMI, kg/m2 25.8 (21.5–31.7) 22.1 (18.8–27.0) ,0.001 24.1 (20.2–30.0) 23.3 (18.5–30.8) 0.29DEXA-LBMI,kg/m2
17.6 (14.4–20.5) 15.4 (13.0–17.6) ,0.001 16.8 (14.0–19.8) 15.8 (13.1–19.2) 0.002
DEXA-FBMI,kg/m2
7.5 (3.8–12.8) 6.0 (2.9–10.2) ,0.001 6.7 (3.6–11.5) 6.9 (3.2–11.7) 0.34
MAMC, cm 15.5 (7.4–31.5) 13.7 (6.1–27.2) 0.04 14.8 (7.4–30.5) 14.6 (6.2–28.5) 0.31CO2, mmol/L 23 (19–29) 25 (19–30) 0.12 24 (19–29) 24 (20–30) 0.29Serum albumin,g/dl
3.3 (2.6–4.0) 3.4 (2.6–4.1) 0.06 3.4 (2.7–4.1) 3.3 (2.5–3.9) 0.02
Serum creatinine,mg/dl
8.1 (5.3–11.7) 6.9 (4.2–10.4) ,0.001 8.3 (5.6–11.7) 6.46 (4.17–10.0) ,0.001
GFR, ml/minper 1.73 m2
7 (4–9) 6 (4–10) 0.80 7 (5–9) 6 (4–9) 0.27
Leptin, ng/ml(n=285)
10.0 (2.6–78.0) 9.8 (2.6–47.8) 0.34 9.0 (2.4–72.9) 11.5 (3.6–54.0) 0.30
Cholesterol,mg/dl
189 (116–278) 197 (135–293) 0.13 189 (123–278) 197 (123–274) 0.27
Hemoglobin, g/L 103 (86–121) 108 (89–127) 0.01 106 (88–123) 104 (85–126) 0.29Ferritin, ng/ml(n=323)
332 (98–690) 227 (66–715) 0.02 299 (93–715) 274 (54–684) 0.53
ACEIs/ARBs 61 39 0.04 68 32 0.07PO42 binders 57 43 0.55 66 34 0.28Ca2+ blockers 57 43 0.57 67 33 0.24Statins 57 43 0.89 62 38 0.68hsCRP, mg/L 3.9 (0.7–25.5) 6.8 (0.7–41) 0.05 3.9 (0.6–25.2) 6.7 (1.0–35.6) 0.002IL-6, pg/ml(n=317)
7.3 (2.1–52) 7.1 (2.2–59) 0.65 6.8 (2.1–50) 9.7 (3.0–78.6) 0.002
TNF, pg/ml(n=271)
9.8 (6.5–18.4) 10.3 (6.6–17.9) 0.72 9.7 (6.3–15.6) 10.5 (7.2–23.9) 0.02
Categorical data are shown as n (%) or %, whereas continuous data as presented as the median (10th percentile–90th percentile). CVD,cardiovascular disease; PEW, protein-energy wasting; BMI, body mass index; DEXA-LBMI, dual-energy x-ray absorptiometry totallean body mass index; DEXA-FBMI, dual-energy x-ray absorptiometry total fat body mass index; MAMC, midarm muscle circum-ference; ACE/ARB, angiotensin-converting enzyme/angiotensin receptor blocker; hsCRP, high-sensitivity C-reactive protein.
Clin J Am Soc Nephrol 9: ccc–ccc, October, 2014 Sarcopenia in Dialysis Patients, Isoyama et al. 3
In addition, a trend toward higher CRP and lower albu-min, hemoglobin, and ferritin was also observed.Compared with patients with appropriate muscle strength,
those with low strength were older and had more comorbid-ities. Although BMI, FBMI, and MAMC did not differ, LBMIand serum creatininewere significantly lower in patientswithlow muscle strength. Three inflammatory mediators werehigher, and serum albumin levels were significantly lower.When both conditions were crosscombined, 20% of the
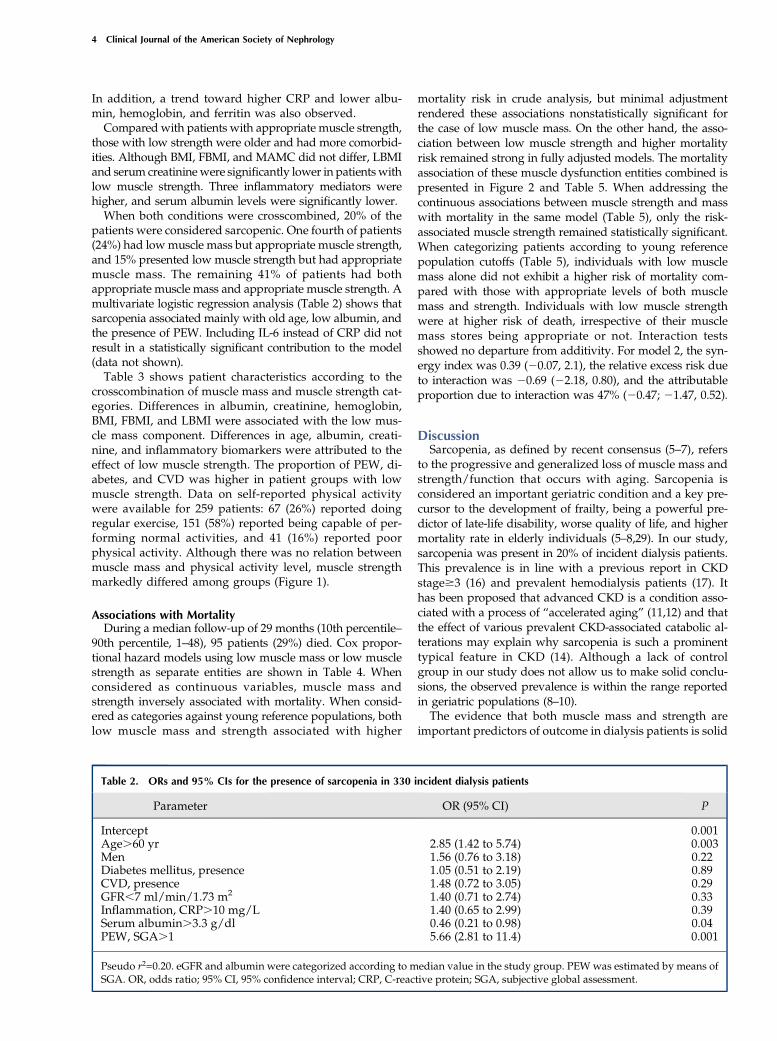
patients were considered sarcopenic. One fourth of patients(24%) had lowmuscle mass but appropriate muscle strength,and 15% presented low muscle strength but had appropriatemuscle mass. The remaining 41% of patients had bothappropriate muscle mass and appropriate muscle strength. Amultivariate logistic regression analysis (Table 2) shows thatsarcopenia associated mainly with old age, low albumin, andthe presence of PEW. Including IL-6 instead of CRP did notresult in a statistically significant contribution to the model(data not shown).Table 3 shows patient characteristics according to the
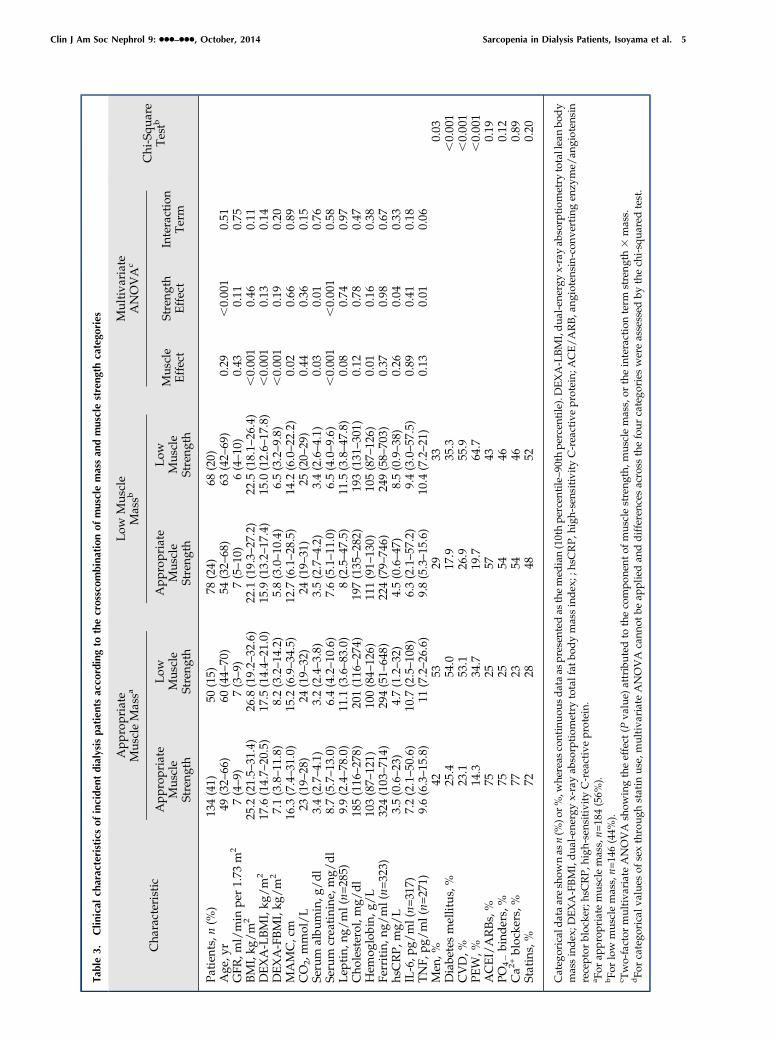
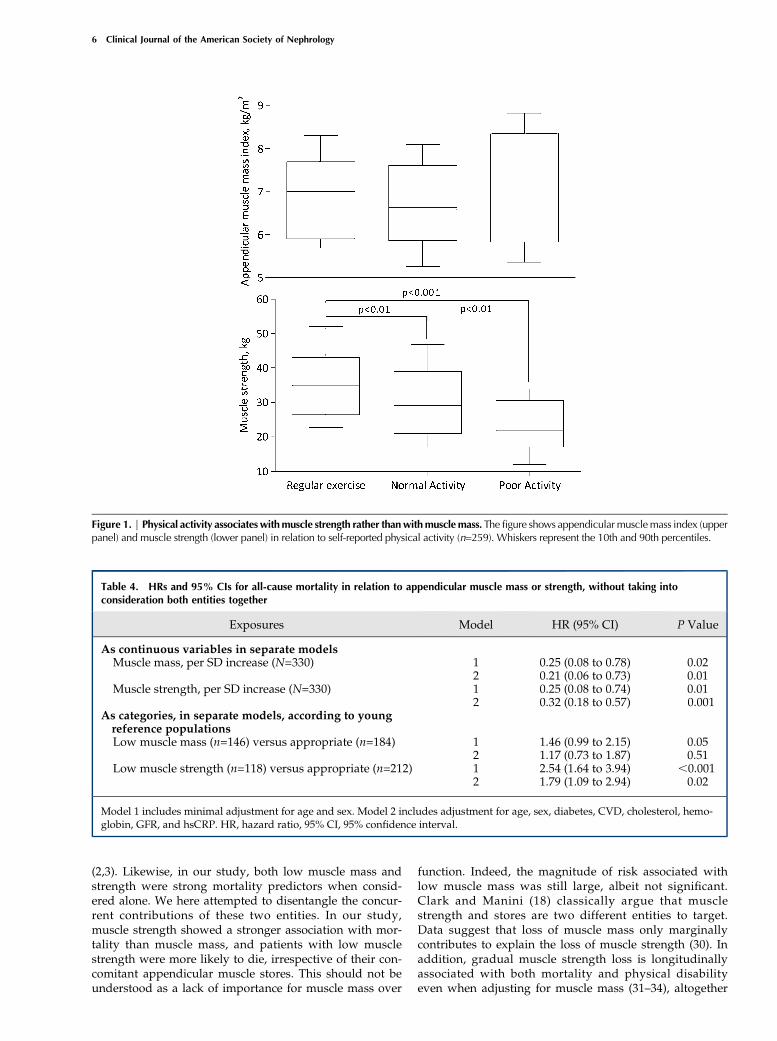
crosscombination of muscle mass and muscle strength cat-egories. Differences in albumin, creatinine, hemoglobin,BMI, FBMI, and LBMI were associated with the low mus-cle mass component. Differences in age, albumin, creati-nine, and inflammatory biomarkers were attributed to theeffect of low muscle strength. The proportion of PEW, di-abetes, and CVD was higher in patient groups with lowmuscle strength. Data on self-reported physical activitywere available for 259 patients: 67 (26%) reported doingregular exercise, 151 (58%) reported being capable of per-forming normal activities, and 41 (16%) reported poorphysical activity. Although there was no relation betweenmuscle mass and physical activity level, muscle strengthmarkedly differed among groups (Figure 1).
Associations with MortalityDuring a median follow-up of 29 months (10th percentile–
90th percentile, 1–48), 95 patients (29%) died. Cox propor-tional hazard models using low muscle mass or low musclestrength as separate entities are shown in Table 4. Whenconsidered as continuous variables, muscle mass andstrength inversely associated with mortality. When consid-ered as categories against young reference populations, bothlow muscle mass and strength associated with higher
mortality risk in crude analysis, but minimal adjustmentrendered these associations nonstatistically significant forthe case of low muscle mass. On the other hand, the asso-ciation between low muscle strength and higher mortalityrisk remained strong in fully adjusted models. The mortalityassociation of these muscle dysfunction entities combined ispresented in Figure 2 and Table 5. When addressing thecontinuous associations between muscle strength and masswith mortality in the same model (Table 5), only the risk-associated muscle strength remained statistically significant.When categorizing patients according to young referencepopulation cutoffs (Table 5), individuals with low musclemass alone did not exhibit a higher risk of mortality com-pared with those with appropriate levels of both musclemass and strength. Individuals with low muscle strengthwere at higher risk of death, irrespective of their musclemass stores being appropriate or not. Interaction testsshowed no departure from additivity. For model 2, the syn-ergy index was 0.39 (20.07, 2.1), the relative excess risk dueto interaction was 20.69 (22.18, 0.80), and the attributableproportion due to interaction was 47% (20.47; 21.47, 0.52).
DiscussionSarcopenia, as defined by recent consensus (5–7), refers
to the progressive and generalized loss of muscle mass andstrength/function that occurs with aging. Sarcopenia isconsidered an important geriatric condition and a key pre-cursor to the development of frailty, being a powerful pre-dictor of late-life disability, worse quality of life, and highermortality rate in elderly individuals (5–8,29). In our study,sarcopenia was present in 20% of incident dialysis patients.This prevalence is in line with a previous report in CKDstage$3 (16) and prevalent hemodialysis patients (17). Ithas been proposed that advanced CKD is a condition asso-ciated with a process of “accelerated aging” (11,12) and thatthe effect of various prevalent CKD-associated catabolic al-terations may explain why sarcopenia is such a prominenttypical feature in CKD (14). Although a lack of controlgroup in our study does not allow us to make solid conclu-sions, the observed prevalence is within the range reportedin geriatric populations (8–10).The evidence that both muscle mass and strength are
important predictors of outcome in dialysis patients is solid
Table 2. ORs and 95% CIs for the presence of sarcopenia in 330 incident dialysis patients
Parameter OR (95% CI) P
Intercept 0.001Age.60 yr 2.85 (1.42 to 5.74) 0.003Men 1.56 (0.76 to 3.18) 0.22Diabetes mellitus, presence 1.05 (0.51 to 2.19) 0.89CVD, presence 1.48 (0.72 to 3.05) 0.29GFR,7 ml/min/1.73 m2 1.40 (0.71 to 2.74) 0.33Inflammation, CRP.10 mg/L 1.40 (0.65 to 2.99) 0.39Serum albumin.3.3 g/dl 0.46 (0.21 to 0.98) 0.04PEW, SGA.1 5.66 (2.81 to 11.4) 0.001
Pseudo r2=0.20. eGFR and albumin were categorized according to median value in the study group. PEWwas estimated by means ofSGA. OR, odds ratio; 95% CI, 95% confidence interval; CRP, C-reactive protein; SGA, subjective global assessment.
4 Clinical Journal of the American Society of Nephrology
Tab
le3.
Clinical
charac
teristicsofinciden
tdialysispatients
acco
rdingto
thecrossco
mbinationofmuscle
massan
dmuscle
strengthca
tego
ries
Cha
racteristic
App
ropriate
Mus
cleMassa
Low
Mus
cle
Massb
Multiva
riate
ANOVA
c
Chi-Squ
are
Testb
Approp
riate
Mus
cle
Streng
th
Low
Mus
cle
Streng
th
Approp
riate
Mus
cle
Streng
th
Low
Mus
cle
Streng
th
Mus
cle
Effect
Streng
thEffect
Interaction
Term
Patien
ts,n
(%)
134(41)
50(15)
78(24)
68(20)
Age
,yr
49(32–
66)
60(44–
70)
54(32–
68)
63(42–
69)
0.29
,0.00
10.51
GFR
,ml/min
per1.73
m2
7(4–9)
7(3–9)
7(5–10
)6(4–10
)0.43
0.11
0.75
BMI,kg
/m
225
.2(21.5–
31.4)
26.8
(19.2–
32.6)
22.1
(19.3–
27.2)
22.5
(18.1–
26.4)
,0.00
10.46
0.11
DEXA-LBMI,kg
/m
217
.6(14.7–
20.5)
17.5
(14.4–
21.0)
15.9
(13.2–
17.4)
15.0
(12.6–
17.8)
,0.00
10.13
0.14
DEXA-FBMI,kg
/m
27.1(3.8–11
.8)
8.2(3.2–14
.2)
5.8(3.0–10
.4)
6.5(3.2–9.8)
,0.00
10.19
0.20
MAMC,cm
16.3
(7.4–31
.0)
15.2
(6.9–34
.5)
12.7
(6.1–28
.5)
14.2
(6.0–22
.2)
0.02
0.66
0.89
CO
2,mmol/L
23(19–
28)
24(19–
32)
24(19–
31)
25(20–
29)
0.44
0.36
0.15
Serum
albu
min,g
/dl
3.4(2.7–4.1)
3.2(2.4–3.8)
3.5(2.7–4.2)
3.4(2.6–4.1)
0.03
0.01
0.76
Serum
creatinine
,mg/
dl
8.7(5.7–13
.0)
6.4(4.2–10
.6)
7.6(5.1–11
.0)
6.5(4.0–9.6)
,0.00
1,0.00
10.58
Lep
tin,
ng/ml(n=
285)
9.9(2.4–78
.0)
11.1
(3.6–83
.0)
8(2.5–47
.5)
11.5
(3.8–47
.8)
0.08
0.74
0.97
Cho
lesterol,m
g/dl
185(116
–27
8)20
1(116
–27
4)19
7(135
–28
2)19
3(131
–30
1)0.12
0.78
0.47
Hem
oglobin,
g/L
103(87–
121)
100(84–
126)
111(91–
130)
105(87–
126)
0.01
0.16
0.38
Ferritin,n
g/ml(n=
323)
324(103
–71
4)29
4(51–
648)
224(79–
746)
249(58–
703)
0.37
0.98
0.67
hsCRP,
mg/
L3.5(0.6–23
)4.7(1.2–32
)4.5(0.6–47
)8.5(0.9–38
)0.26
0.04
0.33
IL-6,p
g/ml(n=
317)
7.2(2.1–50
.6)
10.7
(2.5–10
8)6.3(2.1–57
.2)
9.4(3.0–57
.5)
0.89
0.41
0.18
TNF,
pg/ml(n=
271)
9.6(6.3–15
.8)
11(7.2–26
.6)
9.8(5.3–15
.6)
10.4
(7.2–21
)0.13
0.01
0.06
Men
, %42
5329
330.03
Diabe
tesmellitus,%
25.4
54.0
17.9
35.3
,0.00
1CVD,%
23.1
53.1
26.9
55.9
,0.00
1PE
W,%
14.3
34.7
19.7
64.7
,0.00
1ACEI/ARBs,%
7525
5743
0.19
PO42
bind
ers,%
7525
5446
0.12
Ca2
+blocke
rs,%
7723
5446
0.89
Statins,%
7228
4852
0.20
Categ
oricaldataareshow
nas
n(%
)or%
,whe
reas
continuou
sdataas
presen
tedas
themed
ian(10thpe
rcen
tile–90
thpe
rcen
tile).DEXA-LBMI,dua
l-en
ergy
x-rayab
sorptiom
etry
totalleanbo
dy
massindex
;DEXA-FBMI,dua
l-en
ergy
x-rayab
sorptiom
etry
totalfat
bodymassindex
;;hsCRP,
high
-sen
sitivity
C-reactiveprotein;
ACE/ARB,a
ngiotens
in-con
vertingen
zyme/
angioten
sin
receptor
blocke
r;hsCRP,h
igh-sensitivityC-reactiveprotein.
a For
appropriate
mus
clemass,n=
184(56%
).bFo
rlow
mus
clemass,n=
146(44%
).c Two-factor
multiva
riateANOVA
show
ingtheeffect
(Pva
lue)
attributedto
thecompo
nent
ofmus
clestreng
th,m
usclemass,or
theinteractionterm
strength3
mass.
dFo
rcatego
ricalv
alue
sof
sexthroug
hstatin
use,multiva
riateANOVA
cann
otbe
appliedan
ddifferenc
esacross
thefour
catego
ries
wereassessed
bythech
i-squa
redtest.
Clin J Am Soc Nephrol 9: ccc–ccc, October, 2014 Sarcopenia in Dialysis Patients, Isoyama et al. 5
(2,3). Likewise, in our study, both low muscle mass andstrength were strong mortality predictors when consid-ered alone. We here attempted to disentangle the concur-rent contributions of these two entities. In our study,muscle strength showed a stronger association with mor-tality than muscle mass, and patients with low musclestrength were more likely to die, irrespective of their con-comitant appendicular muscle stores. This should not beunderstood as a lack of importance for muscle mass over
function. Indeed, the magnitude of risk associated withlow muscle mass was still large, albeit not significant.Clark and Manini (18) classically argue that musclestrength and stores are two different entities to target.Data suggest that loss of muscle mass only marginallycontributes to explain the loss of muscle strength (30). Inaddition, gradual muscle strength loss is longitudinallyassociated with both mortality and physical disabilityeven when adjusting for muscle mass (31–34), altogether
Figure 1. | Physical activity associateswithmuscle strength rather thanwithmusclemass. The figure shows appendicularmusclemass index (upperpanel) and muscle strength (lower panel) in relation to self-reported physical activity (n=259). Whiskers represent the 10th and 90th percentiles.
Table 4. HRs and 95% CIs for all-cause mortality in relation to appendicular muscle mass or strength, without taking intoconsideration both entities together
Exposures Model HR (95% CI) P Value
As continuous variables in separate modelsMuscle mass, per SD increase (N=330) 1 0.25 (0.08 to 0.78) 0.02
2 0.21 (0.06 to 0.73) 0.01Muscle strength, per SD increase (N=330) 1 0.25 (0.08 to 0.74) 0.01
2 0.32 (0.18 to 0.57) 0.001As categories, in separate models, according to youngreference populationsLow muscle mass (n=146) versus appropriate (n=184) 1 1.46 (0.99 to 2.15) 0.05
2 1.17 (0.73 to 1.87) 0.51Low muscle strength (n=118) versus appropriate (n=212) 1 2.54 (1.64 to 3.94) ,0.001
2 1.79 (1.09 to 2.94) 0.02
Model 1 includes minimal adjustment for age and sex. Model 2 includes adjustment for age, sex, diabetes, CVD, cholesterol, hemo-globin, GFR, and hsCRP. HR, hazard ratio, 95% CI, 95% confidence interval.
6 Clinical Journal of the American Society of Nephrology

suggesting that low muscle mass may be secondary to theeffects of low muscle strength (35). Such findings are con-sistent with the physiologic underpinnings of musclestrength, explained not only by alterations in muscle quan-tity but also by contractile quality, neural activation, andsystemic inflammation (36–38). Supporting this, importantdifferences in our patients’ phenotype (e.g., differences inage, comorbidities, presence of PEW, inflammation, andself-reported physical activity) were associated with lowmuscle strength rather than with low muscle mass (Figure2, Table 3). It is noteworthy that inflammation was a prom-inent feature of reduced muscle strength but was little af-fected by muscle mass (Tables 1 and 3). Our observations
agree with the findings of Storer et al. (39), who demon-strated that endurance exercise improves muscle strength,power, and physical performance in hemodialysis patients,while systemic inflammatory markers normalize in parallel.Althoughmuscle mass and strength are strongly related to
each other, we speculate that these entities may be affectedby different risk factors and that the association betweenmuscle mass and mortality may be partly explained by poormuscle function. Increasingmusclemass stores with anabolicagents and/or amino acid supplements has been the optionconsidered most in CKD-associated PEW to date (40,41). Ourresults, however, provide support for the hypothesis thattherapeutic measures specifically targeting muscle strength
Figure 2. | Survival rate of incident dialysis patients stratified according to the presence of appropriatemusclemass and strength, lowmusclemass alone, low muscle strength alone, or both (sarcopenia).
Table 5. HRs and 95% CIs associated with muscle strength and mass together as continuous variables and after categorizationregarding the presence of low muscle mass alone, low muscle strength alone, or both in incident dialysis patients
ExposuresModel 1 Model 2
HR (95% CI) P Value HR (95% CI) P Value
Together as continuous variables in thesame modelMuscle mass, per SD increase 0.58 (0.20 to 1.70) 0.32 0.43 (0.12 to 1.52) 0.19Muscle strength, per SD increase 0.26 (0.16 to 0.43) ,0.001 0.34 (0.18 to 0.61) ,0.001
Crosscombined as categories according toyoung reference populationsGroup 1: Appropriate muscle mass andstrength (n=134)
1.00 1.00
Group 2: Low muscle strength alone (n=50) 2.82 (1.57 to 5.21) 0.001 1.98 (1.01 to 3.87) 0.04Group 3: Low muscle mass alone (n=78) 1.35 (0.67 to 2.68) 0.39 1.23 (0.56 to 2.67) 0.59Group 4: Low muscle mass and strength(sarcopenia) (n=68)
2.94 (1.64 to 5.27) ,0.001 1.93 (1.01 to 3.71) 0.04
Model 1 includes minimal adjustment for age and sex. Model 2 includes adjustment for age, sex, diabetes, CVD, cholesterol, hemo-globin, GFR, and hsCRP. HR, hazard ratio; 95% CI, 95% confidence interval; hsCRP, high-sensitivity C-reactive protein.
Clin J Am Soc Nephrol 9: ccc–ccc, October, 2014 Sarcopenia in Dialysis Patients, Isoyama et al. 7
may also be of importance, and both approaches combinedare likely to bring the best benefit for the patient. This wasshown already by Johansen et al. (42), who tested the sole orcombined approach of anabolic agents and endurance exer-cise training in dialysis patients for 12 weeks. The inves-tigators reported that although exercise alone couldmarginally improve muscle mass (only quadriceps musclearea was increased) and anabolic agents alone could notimprove muscle strength, the combined therapeutic ap-proach elicited a stronger effect on nutritional status andmuscle mass than each treatment separately.This study has strengths and limitations. Strengths in-
clude the use of incident consecutive dialysis patients, theadoption of robust methods like DEXA, and the use of con-sensus definitions and cutoffs based on reference popula-tions. Limitations include the observational study design,a relatively low sample size, and the use of measurementsat single time points. We thus consider our findings ashypothesis-generating. Because the underlying mechanismscannot be elucidated from here, we hope that these resultsstimulate further research on the topic. Bias could have beenintroduced because DEXA estimations of fat-free mass canbe influenced by hydration status (43), likely underesti-mating the reported associations. Several factors such asdietary intake, adipokines, and the atherosclerosis burdencan influence muscle stores and muscle function, but suchdata were not readily available in our study. Because of thestudy inclusion criteria (incident, clinically stable, and aged,75 years), our results do not extrapolate to the generaldialysis population. Finally, because the study spans along time period, we cannot exclude the possibility thatchanges in practice patterns may have influenced the results.In conclusion, sarcopenia was observed in 20% of adult
incident dialysis patients and associated with old age andPEW. In cross-sectional analyses, lowmuscle strength, ratherthan low muscle mass, was associated with aging, comor-bidities, PEW, physical inactivity, and inflammation. Duringfollow-up, lowmuscle strength was more strongly associatedwith the risk of mortality than low muscle mass. Assessmentof muscle functionality may provide additional diagnosticand prognostic information to muscle-mass evaluation. Onthe basis of these findings, it seems prudent to suggest thattreatment options in dialysis patients should target not onlymaintenance or increase of muscle mass but also musclefunctionality. Achieving better muscle functionality may infact be a prodromal step toward improved physical func-tioning and the reduction of frailty (44).
AcknowledgmentsWe acknowledge research grants from the Swedish Research
Council. Baxter Novum is the result of a grant from Baxter HealthcareCorporation to the Karolinska Institute.
DisclosuresB.L. is affiliated with Baxter Healthcare.
References1. US Renal Data System: USRDS 2012 Annual Data Report: Atlas
of Chronic Kidney Disease and End-Stage Renal Disease in theUnited States, Bethesda, MD, National Institutes of Health,National Institute of Diabetes and Digestive and Kidney Dis-eases, 2012
2. Carrero JJ, ChmielewskiM, Axelsson J, Snaedal S, HeimburgerO,Barany P, Suliman ME, Lindholm B, Stenvinkel P, Qureshi AR:Muscle atrophy, inflammation and clinical outcome in incidentand prevalent dialysis patients. Clin Nutr 27: 557–564, 2008
3. Heimburger O, Qureshi AR, Blaner WS, Berglund L, StenvinkelP: Hand-grip muscle strength, lean body mass, and plasmaproteins as markers of nutritional status in patients with chronicrenal failure close to start of dialysis therapy. Am J Kidney Dis 36:1213–1225, 2000
4. Carrero JJ, Stenvinkel P, Cuppari L, Ikizler TA, Kalantar-Zadeh K,Kaysen G, Mitch WE, Price SR, Wanner C, Wang AY, ter Wee P,Franch HA: Etiology of the protein-energy wasting syndrome inchronic kidney disease: A consensus statement from the In-ternational Society of Renal Nutrition and Metabolism (ISRNM).J Ren Nutr 23: 77–90, 2013
5. Fielding RA, Vellas B, Evans WJ, Bhasin S, Morley JE, NewmanAB, Abellan van Kan G, Andrieu S, Bauer J, Breuille D,Cederholm T, Chandler J, De Meynard C, Donini L, Harris T,Kannt A, Keime Guibert F, Onder G, Papanicolaou D, Rolland Y,Rooks D, Sieber C, Souhami E, Verlaan S, Zamboni M: Sarcopenia:An undiagnosed condition in older adults. Current consensusdefinition: Prevalence, etiology, and consequences. Internationalworking group on sarcopenia. J Am Med Dir Assoc 12:249–256, 2011
6. Morley JE, Abbatecola AM, Argiles JM, Baracos V, Bauer J, BhasinS, Cederholm T, Coats AJ, Cummings SR, Evans WJ, Fearon K,Ferrucci L, Fielding RA, Guralnik JM, Harris TB, Inui A, Kalantar-Zadeh K, Kirwan BA, Mantovani G, Muscaritoli M, Newman AB,Rossi-Fanelli F, Rosano GM, Roubenoff R, Schambelan M, SokolGH, Storer TW, Vellas B, von Haehling S, Yeh SS, Anker SD;Society on Sarcopenia, Cachexia and Wasting Disorders TrialistWorkshop: Sarcopenia with limited mobility: An internationalconsensus. J Am Med Dir Assoc 12: 403–409, 2011
7. Muscaritoli M, Anker SD, Argiles J, Aversa Z, Bauer JM, Biolo G,Boirie Y, Bosaeus I, Cederholm T, Costelli P, Fearon KC, LavianoA, Maggio M, Rossi Fanelli F, Schneider SM, Schols A, Sieber CC:Consensus definition of sarcopenia, cachexia and pre-cachexia:joint document elaborated by Special Interest Groups (SIG)“cachexia-anorexia in chronic wasting diseases” and “nutritionin geriatrics”. Clin Nutr 29: 154–159, 2010
8. Patel HP, Syddall HE, Jameson K, Robinson S, DenisonH, RobertsHC, Edwards M, Dennison E, Cooper C, Aihie Sayer A: Preva-lence of sarcopenia in community-dwelling older people in theUK using the European Working Group on Sarcopenia in OlderPeople (EWGSOP) definition: Findings from the HertfordshireCohort Study (HCS). Age Ageing 42: 378–384, 2013
9. Bijlsma AY, Meskers CG, Ling CH, Narici M, Kurrle SE, CameronID, Westendorp RG, Maier AB: Defining sarcopenia: The impactof different diagnostic criteria on the prevalence of sarcopeniain a large middle aged cohort. Age (Dordr) 35: 871–881, 2013
10. Arango-Lopera VE, Arroyo P, Gutierrez-Robledo LM, Perez-Zepeda MU, Cesari M: Mortality as an adverse outcome of sar-copenia. J Nutr Health Aging 17: 259–262, 2013
11. Stenvinkel P, Larsson TE: Chronic kidney disease: A clinicalmodel of premature aging. Am J Kidney Dis 62: 339–351, 2013
12. Anand S, Johansen KL, Kurella Tamura M: Aging and chronickidney disease: The impact on physical function and cognition.J Gerontol A Biol Sci Med Sci 69: 315–322, 2014
13. Kim JC, Kalantar-Zadeh K, Kopple JD: Frailty and protein-energywasting in elderly patients with end stage kidney disease. J AmSoc Nephrol 24: 337–351, 2013
14. Fahal IH: Uraemic sarcopenia: Aetiology and implications[published online ahead of print April 25, 2013]. Nephrol DialTransplant doi:10.1093/ndt/gft070
15. Fouque D, Kalantar-Zadeh K, Kopple J, Cano N, Chauveau P,Cuppari L, Franch H, Guarnieri G, Ikizler TA, Kaysen G,Lindholm B, Massy Z, Mitch W, Pineda E, Stenvinkel P, Trevi~no-Becerra A, Wanner C: A proposed nomenclature and diagnosticcriteria for protein-energy wasting in acute and chronic kidneydisease. Kidney Int 73: 391–398, 2008
16. Foley RN, Wang C, Ishani A, Collins AJ, Murray AM: Kidneyfunction and sarcopenia in the United States general population:NHANES III. Am J Nephrol 27: 279–286, 2007
17. Kim JK, Choi SR, ChoiMJ, Kim SG, Lee YK,Noh JW, KimHJ, SongYR: Prevalence of and factors associated with sarcopenia in
8 Clinical Journal of the American Society of Nephrology

elderly patients with end-stage renal disease. Clin Nutr 33:64–68, 2013
18. Clark BC, Manini TM: Sarcopenia =/= dynapenia. J GerontolA Biol Sci Med Sci 63: 829–834, 2008
19. Goodpaster BH, Park SW, Harris TB, Kritchevsky SB, Nevitt M,Schwartz AV, Simonsick EM, Tylavsky FA, VisserM,NewmanAB:The loss of skeletal muscle strength, mass, and quality in olderadults: The health, aging and body composition study. J GerontolA Biol Sci Med Sci 61: 1059–1064, 2006
20. Hughes VA, Frontera WR, Wood M, Evans WJ, Dallal GE,Roubenoff R, Fiatarone Singh MA: Longitudinal muscle strengthchanges in older adults: Influence of musclemass, physical activity,and health. J Gerontol A Biol Sci Med Sci 56: B209–B217, 2001
21. Clark BC, Manini TM: What is dynapenia? Nutrition 28: 495–503, 2012
22. Stenvinkel P, Heimburger O, Paultre F, Diczfalusy U, Wang T,Berglund L, Jogestrand T: Strong association between malnutri-tion, inflammation, and atherosclerosis in chronic renal failure.Kidney Int 55: 1899–1911, 1999
23. Kyle UG, Schutz Y, Dupertuis YM, Pichard C: Body compositioninterpretation. Contributions of the fat-free mass index and thebody fat mass index. Nutrition 19: 597–604, 2003
24. Heymsfield SB, Smith R, Aulet M, Bensen B, Lichtman S, Wang J,Pierson RN Jr: Appendicular skeletal muscle mass: Measurementby dual-photon absorptiometry. Am J Clin Nutr 52: 214–218, 1990
25. Qureshi AR, Alvestrand A, Danielsson A, Divino-Filho JC,Gutierrez A, Lindholm B, Bergstrom J: Factors predicting mal-nutrition in hemodialysis patients: A cross-sectional study.Kidney Int 53: 773–782, 1998
26. Baumgartner RN, Koehler KM, Gallagher D, Romero L,Heymsfield SB, Ross RR, Garry PJ, Lindeman RD: Epidemiologyof sarcopenia among the elderly in NewMexico. Am J Epidemiol147: 755–763, 1998
27. Lauretani F, Russo CR, Bandinelli S, Bartali B, Cavazzini C, DiIorio A, Corsi AM, Rantanen T, Guralnik JM, Ferrucci L: Age-associated changes in skeletal muscles and their effect onmobility: An operational diagnosis of sarcopenia. J Appl Physiol(1985) 95: 1851–1860, 2003
28. Andersson T, Alfredsson L, Kallberg H, Zdravkovic S, Ahlbom A:Calculating measures of biological interaction. Eur J Epidemiol20: 575–579, 2005
29. Bao Y, Dalrymple L, Chertow GM, Kaysen GA, Johansen KL:Frailty, dialysis initiation, and mortality in end-stage renal dis-ease. Arch Intern Med 172: 1071–1077, 2012
30. Delmonico MJ, Harris TB, Visser M, Park SW, Conroy MB,Velasquez-Mieyer P, Boudreau R, Manini TM, Nevitt M,Newman AB, Goodpaster BH; Health, Aging, and Body: Longi-tudinal study of muscle strength, quality, and adipose tissue in-filtration. Am J Clin Nutr 90: 1579–1585, 2009
31. Newman AB, Kupelian V, Visser M, Simonsick EM, GoodpasterBH, Kritchevsky SB, Tylavsky FA, Rubin SM, Harris TB: Strength,but not muscle mass, is associated with mortality in the health,aging and body composition study cohort. J Gerontol A Biol SciMed Sci 61: 72–77, 2006
32. Metter EJ, Talbot LA, Schrager M, Conwit R: Skeletal musclestrength as a predictor of all-cause mortality in healthy men.J Gerontol A Biol Sci Med Sci 57: B359–B365, 2002
33. Goodpaster BH, Carlson CL, Visser M, Kelley DE, Scherzinger A,Harris TB, Stamm E, Newman AB: Attenuation of skeletal muscleand strength in the elderly: The Health ABC Study. J Appl Physiol(1985) 90: 2157–2165, 2001
34. Bruce SA, Newton D, Woledge RC: Effect of age on voluntaryforce and cross-sectional area of human adductor pollicis mus-cle. Q J Exp Physiol 74: 359–362, 1989
35. Clark BC, Manini TM: Functional consequences of sarcopeniaand dynapenia in the elderly.CurrOpinClinNutrMetabCare 13:271–276, 2010
36. Clark BC, Taylor JL: Age-related changes in motor corticalproperties and voluntary activation of skeletal muscle. CurrAging Sci 4: 192–199, 2011
37. McNeil CJ, Doherty TJ, Stashuk DW, Rice CL: Motor unit numberestimates in the tibialis anterior muscle of young, old, and veryold men. Muscle Nerve 31: 461–467, 2005
38. Delbono O: Expression and regulation of excitation-contractioncoupling proteins in aging skeletal muscle. Curr Aging Sci 4:248–259, 2011
39. Storer TW, Casaburi R, Sawelson S, Kopple JD: Endurance exer-cise training during haemodialysis improves strength, power,fatigability and physical performance in maintenance haemo-dialysis patients. Nephrol Dial Transplant 20: 1429–1437, 2005
40. Feldt-Rasmussen B, Lange M, Sulowicz W, Gafter U, Lai KN,Wiedemann J, Christiansen JS, El Nahas M; APCD Study Group:Growth hormone treatment during hemodialysis in a random-ized trial improves nutrition, quality of life, and cardiovascularrisk. J Am Soc Nephrol 18: 2161–2171, 2007
41. Supasyndh O, Satirapoj B, Aramwit P, Viroonudomphol D,Chaiprasert A, Thanachatwej V, Vanichakarn S, Kopple JD: Effectof oral anabolic steroid on muscle strength andmuscle growth inhemodialysis patients. Clin J Am Soc Nephrol 8: 271–279, 2013
42. JohansenKL, Painter PL, SakkasGK,Gordon P,Doyle J, Shubert T:Effects of resistance exercise training and nandrolone decanoateon body composition and muscle function among patients whoreceive hemodialysis: A randomized, controlled trial. J Am SocNephrol 17: 2307–2314, 2006
43. Konings CJ, Kooman JP, Schonck M, van Kreel B, Heidendal GA,Cheriex EC, van der Sande FM, Leunissen KM: Influence of fluidstatus on techniques used to assess body composition in perito-neal dialysis patients. Perit Dial Int 23: 184–190, 2003
44. Johansen KL, Chertow GM, Jin C, Kutner NG: Significance offrailty among dialysis patients. J Am SocNephrol 18: 2960–2967,2007
Received: October 9, 2013 Accepted: June 13, 2014
P.S. and J.J.C. contributed equally to this work.
Published online ahead of print. Publication date available at www.cjasn.org.
Clin J Am Soc Nephrol 9: ccc–ccc, October, 2014 Sarcopenia in Dialysis Patients, Isoyama et al. 9
Related Documents


