HAL Id: hal-02115225 https://hal.archives-ouvertes.fr/hal-02115225 Submitted on 30 Apr 2019 HAL is a multi-disciplinary open access archive for the deposit and dissemination of sci- entific research documents, whether they are pub- lished or not. The documents may come from teaching and research institutions in France or abroad, or from public or private research centers. L’archive ouverte pluridisciplinaire HAL, est destinée au dépôt et à la diffusion de documents scientifiques de niveau recherche, publiés ou non, émanant des établissements d’enseignement et de recherche français ou étrangers, des laboratoires publics ou privés. Comparative assessment of HDI with Composite Development Index (CDI) Ravi Prakash, Pulkit Garg To cite this version: Ravi Prakash, Pulkit Garg. Comparative assessment of HDI with Composite Development Index (CDI). Insights into Regional Development, Entrepreneurship and Sustainability Center, 2019, 1 (1), pp.58-76. 10.9770/ird.2019.1.1(5). hal-02115225

Welcome message from author
This document is posted to help you gain knowledge. Please leave a comment to let me know what you think about it! Share it to your friends and learn new things together.
Transcript
HAL Id: hal-02115225https://hal.archives-ouvertes.fr/hal-02115225
Submitted on 30 Apr 2019
HAL is a multi-disciplinary open accessarchive for the deposit and dissemination of sci-entific research documents, whether they are pub-lished or not. The documents may come fromteaching and research institutions in France orabroad, or from public or private research centers.
L’archive ouverte pluridisciplinaire HAL, estdestinée au dépôt et à la diffusion de documentsscientifiques de niveau recherche, publiés ou non,émanant des établissements d’enseignement et derecherche français ou étrangers, des laboratoirespublics ou privés.
Comparative assessment of HDI with CompositeDevelopment Index (CDI)
Ravi Prakash, Pulkit Garg
To cite this version:Ravi Prakash, Pulkit Garg. Comparative assessment of HDI with Composite Development Index(CDI). Insights into Regional Development, Entrepreneurship and Sustainability Center, 2019, 1 (1),pp.58-76. �10.9770/ird.2019.1.1(5)�. �hal-02115225�
INSIGHTS INTO REGIONAL DEVELOPMENT
ISSN 2669-0195 (online) http://jssidoi.org/IRD/
2019 Volume 1 Number 1 (March)
http://doi.org/10.9770/IRD.2019.1.1(5)
Publisher http://jssidoi.org/esc/home
58
COMPARATIVE ASSESSMENT OF HDI WITH COMPOSITE DEVELOPMENT INDEX (CDI)
Ravi Prakash1, Pulkit Garg2,
1 Motilal Nehru National Institute of Technology, Allahabad (UP), India 2 National Institute of Food Technology, Entrepreneurship and Management, Sonepat (Haryana), India
E-mails: 1 [email protected] ; 2 [email protected]
Received: 10 December 2018; accepted 15 March 2019; published 30 March 2019
Abstract. This paper presents a novel approach to measure the human development, progress and growth of any country. The authors have
developed an alternative index to the conventional 'HDI', named as 'Composite Development Index (CDI)' and have also presented an
original approach to evaluate it quantitatively. The CDI integrates all the three (social, economic and environmental) aspects of sustainable
development, along with peace and happiness. As proposed, the CDI is based on four parameters, i.e. Inequality adjusted HDI (IHDI),
Scaled Green Index, Scaled Peace Index and Scaled Happiness Index, evaluated from globally accepted standard databases. Hence, the CDI
is much more comprehensive and rational than the conventional HDI or GDP. The CDI values have been evaluated quantitatively for 126
countries of the world. Further, comparative assessment of the CDI has been done with the HDI for all the 126 nations. The results obtained
have been startling as no country was even able to have a CDI score of 0.8 on a scale of 0.1 to 1. Switzerland had the highest CDI of 0.767.
A country like Norway with the highest HDI of 0.953 had a CDI of only 0.742. On the other hand, countries like Costa Rica, Romania and
Uruguay are in the top 20 nations in the CDI Ranking, much ahead of the countries like United Kingdom, France, and USA. The CDI can
act as a single point of reference for policy-makers, governments and other development agencies, as it presents a consolidated picture of a
country's development. Future course of action on the basis of the concept of CDI are also proposed. It can be concluded that efforts to
have a high CDI (in comparison to a high GDP or HDI only) will pave the way forward for sustainable development and holistic progress
for all the countries of the world.
Keywords: Human Development Index (HDI); peace; happiness; ecological footprint; Composite Development Index
Reference to this paper should be made as follows: Prakash, R.; Garg, P. 2019. Comparative assessment of HDI with Composite
Development Index (CDI), Insights into Regional Development 1(1): 58-76. http://doi.org/10.9770/IRD.2019.1.1(5)
JEL Classifications: 011, 015
Additional disciplines (besides field of economics reflected in JEL classifications): sociology; ecology and environment.
1. Introduction
The adequacy of the GDP and the HDI as a measure of human welfare and development has been questionable for
many years now. GDP is an indicator of economic activity of an economy, but it has wrongly been referred to as a
very broad measure of human welfare (Costanza et al., 2009, Stiglitz et al., 2010). Nobel Laureate Joseph Stiglitz
(2009) has linked the economic recession in 2009 to GDP fetishism of countries. Kuznets (1934), Marcuss and
Kane (2007), McCulla and Smith (2007) have mentioned that GDP had never been developed to measure the
socio-economic welfare of a nation; still it is the most prevalent parameter in measuring the overall growth and
INSIGHTS INTO REGIONAL DEVELOPMENT
ISSN 2669-0195 (online) http://jssidoi.org/jesi/
2019 Volume 1 Number 1 (March)
http://doi.org/10.9770/IRD.2019.1.1(5)
59
performance of any country. Costanza et al (2004) have exemplified a major issue with the GDP with an oil spill,
whose occurrence would increase the GDP due to the associated cost of cleanup and remediation, but obviously
its occurrence is undesirable from the environmental perspective. One more potential flaw with the GDP is that it
does not take into account the distribution of income among individuals, which has a major impact on the social
well being of any person (Wilkinson and Pickett, 2009). Kubiszewski et al (2013) have developed the GPI
(Genuine Progress Index) because of these drawbacks of the GDP. Costanza et al (2009) have explicitly
mentioned the shortcomings associated with the GDP by stating that GDP is a measure of 'economic quantity' and
not 'economic quality' and 'human welfare'. They have also stated that due to the 'continued misuse' of the GDP,
an immediate change in the indicators is required for the policy makers and the governments to frame policies and
evaluate progress.
Due to these pitfalls associated with the GDP, many other indices of human welfare like the Human Development
Index (HDI), Index of Sustainable Economic Welfare (ISEW), Sustainable Net benefit Index (SNBI), Index of
Economic Well-Being (IEWB), Happy Planet Index (HPI) were developed (Lawn, 2005; Koroneos and Rokos,
2012). Prakash (2011, 2013) has developed the HPI (Holistic Progress Index) that is more comprehensive and
based on more factors than the HDI or GDP to reflect peaceful and sustainable development without curtailing
human freedom.
The Human Development Index (HDI) was created to emphasize that people and their capabilities should be the
ultimate criteria for assessing the development of a country, not economic growth alone. The HDI is a summary
measure of average achievement in key dimensions of human development: a long and healthy life, being
knowledgeable and having a decent standard of living. It is the geometric mean of normalized indices for each of
the three dimensions (HDR: Human Development Reports, UNDP).
But, the widely adopted HDI has also been a subject of much criticism and subsequent modification. Smith (1993)
pioneered to bring about and support significant modifications to the HDI. Noorbakhsh (1998) has highlighted
various criticisms of the HDI and has also developed four modified indices of the HDI. Taner et al. (2011) have
developed an alternative to the HDI considering unemployment. Mazumdar (2003) has developed an alternative
method to calculate the HDI using the unadjusted Per Capita Real Gross Domestic Product (PCRGDP). Comim
(2016) has tried to enlarge the human development perspective by using the capability approaches of Amartya
Sen and Martha Nussbaum. He also investigates alternative measures of human development, including
subjective, goals-based, sustainability and other indicators of human development. Jahan (2002) has identified
some imperfections in the HDI and has also listed some alternative indices like the HPI (Human Poverty Index),
GDI (Gender-related Development Index) and Gender Empowerment Measure (GEM). In 2010, a new index
named as Inequality Adjusted HDI was published considering the Gini Coefficient and the relevance of
inequalities due to efforts of Paul (1996), Hicks (1997) along with Hirschowitz and Orkin (1997). Ogwang (2000)
and Fukuda-Parr (2003) have given suggestions for the addition of gender dimensions to the HDI. Harttgen and
Klasen (2010) have advocated the use of a household based HDI. Furthermore, Doessel ve Gounder (1994) has
suggested the importance of absolute values over rankings in the estimation of the HDI. Panigrahi and
Sivramkrishna (2002), Osberg and Sharpe (2003), Cherchye, Ooghe and Van Puyenbroeck (2008) have expressed
their concerns with the HDI rankings. Harkness (2004) has highlighted reliable data collection as a major
obstruction in low-income countries.
Relevant scientific literature on security and sustainability issues around the world can be found; which indicates
a variety of approaches adopted for sustainable development. For energy security in the European Union, Melas et
al (2017) and Abrhám et al (2018) have pointed out the positive role of renewable energy and distributed 'green
energy' systems for self reliance. Bilan et al (2017) and Dudzevičiūtė and Prakapienė (2018) point out inclusive
growth in European countries by examining social enterprises and interlinkages between poverty and income
INSIGHTS INTO REGIONAL DEVELOPMENT
ISSN 2669-0195 (online) http://jssidoi.org/jesi/
2019 Volume 1 Number 1 (March)
http://doi.org/10.9770/IRD.2019.1.1(5)
60
inequality. Ślusarczyk and Kot (2018) have examined plastic free sustainable packaging as a contributor to
sustainability in Poland. Smaliukiene (2018) points out a new trend of incorporating sustainability in military
activities. Suleimenova et al (2018) examine requirements of environmental protection in food sector in a
megalopolis.
Rees (1992); Wackernagel and Rees (1996); Rees (2017); Wackernagel et al. (2002, 2005) have utilized
ecological footprint as an indicator of sustainable consumption. Moran et al. (2008) have mentioned that the
ecological footprint to biocapacity could act as a useful indicator of environmental sustainability. They have also
incorporated ecological footprint as a sustainability indicator alongwith the HDI so that development is within the
regenerative biocapacity of planet Earth (Moran et al., 2008). Hence, the inculcation of the ecological footprint as
an indicator of environmental sustainability is gaining much importance. Costanza et al., 2009 have also
advocated for development that is within the carrying capacity of our supporting ecosystems.
In view of the deficiencies of important development parameters such as ecological footprint, peace and happiness
in the above referred literature; the authors have developed an index of holistic progress and human development,
named as the Composite Development Index (CDI). The CDI presents a fresh and comprehensive approach to
measure the human development, progress, prosperity, welfare and growth of any country by taking into
consideration the following four factors: HDI, ecological footprint, peace and happiness. All these parameters
have been given equal weighting factors as the authors consider that all of them carry equal significance. A
nation's very high GDP growth with a degraded environment and poor happiness record is not only a facade, but
also self-destructing and impoverishing in the long run if the high economic growth is not in harmony with the
social and environmental realms. The authors have evaluated the CDI for 126 nations and have ranked them
accordingly. Also, a comparative assessment of the countries on the basis of their HDI ranking and their CDI
ranking has also been done. The CDI as proposed has the potential to act as a comprehensive and complete index
of sustainable development, human welfare and progress and the CDI rankings enlighten the way forward for all
the countries of the world (developed or developing) to move in the right direction. The CDI can act as a single
point of reference for policy-makers, governments and other development agencies and can pave the way forward
for our sustainable future on the planet Earth.
2. Methodology
The HDI is based on merely three parameters (GDP, Literacy and health) and essentially does not represent a
complete measure of human progress. It does not include other parameters like environmental impacts of human
activities, happiness and peace that are integral to human development and growth of any nation. On the other
hand, the Composite Development Index (CDI) incorporates practically all the major dimensions of a country's
prosperity and does not rank countries simply on the basis of their high GDP.
The following four parameters have been considered as crucial to determining the human development of any
country and have been included in the CDI:
1. Inequality adjusted HDI (IHDI)
2. Scaled Happiness Index
3. Scaled Peace Index
4. Scaled Green Index
All these 4 parameters have been taken from widely accepted and reputed indices from their official reports and
websites.
The formula used to calculate the CDI of any country is:
INSIGHTS INTO REGIONAL DEVELOPMENT
ISSN 2669-0195 (online) http://jssidoi.org/jesi/
2019 Volume 1 Number 1 (March)
http://doi.org/10.9770/IRD.2019.1.1(5)
61
CDI = 0.25 X (IHDI + Scaled Green Index + Scaled Happiness Index + Scaled Peace Index)
All the four parameters of the CDI have been given equal weighting factors in the CDI. This is due to the absence
any rational basis, which provides relative importance of various parameters linked to human development and
growth.
The value of the CDI would vary between 0.1 to 1 for any country.
2.1 Inequality adjusted HDI (IHDI)
It cannot be denied that the HDI is an apt measure of a country's economic prosperity, education and health of its
population. The IHDI goes a step further to show how the achievements in HDI are distributed among a nation's
residents. The IHDI connotes the level of human development when inequality is accounted for. The relative
difference between IHDI and HDI values is the loss due to inequality in distribution of the HDI within the
country.
The absolute values of the IHDI have been accessed from the UNDP's website (HDII, 2018).
Hence, the absolute IHDI values have been used for the evaluation of CDI as the IHDI is an improvement over
the conventional HDI. Further, the IHDI values as available from the cited reference vary between 0.25 to 0.88.
2.2 Scaled Green Index
The environmental impacts due to human activities have taken a toll on the Earth. The ecological footprint per
capita (EF/capita) helps in the quantitative assessment of the impacts of human activities on earth. It can be used
to examine various measures such as the feasibility of resource consumption, distribution of the world’s natural
resources, waste assimilation and the overall sustainability of a country. The purpose of including the scaled green
index in the CDI is to ensure that high human development does not occur at the cost of detrimental impacts to the
environment and high material and resource consumption. The sustainability of a nation has been given equal
importance as its GDP or IHDI.
The relative ranks of various countries based on their ecological footprint/capita have been taken from the 'Global
Footprint Network' website (GFN, 2018).
Scaled Green Index = (0.1 + 0.9 * (Xg /Xt))
Xt = Total number of countries considered for the scaled green index calculation
Xg = EF /capita rank of a country (The country with the highest EF/capita will have the Xg value of 1 and that
with the lowest EF/capita; Xg = Xt)
Hence, the quantitative value of the scaled green index would vary between 0.1 and 1.
2.3 Scaled Happiness Index
The Happiness Index has been based on the comprehensive 'World Happiness Report', 2018 (WHR, 2018). The
Happiness Index incorporates the following factors and ranks countries on the basis of their happiness level.
GDP per capita
Social support
INSIGHTS INTO REGIONAL DEVELOPMENT
ISSN 2669-0195 (online) http://jssidoi.org/jesi/
2019 Volume 1 Number 1 (March)
http://doi.org/10.9770/IRD.2019.1.1(5)
62
Healthy life expectancy
Freedom to make life choices
Generosity
Perceptions of corruption
Dystopia and residual factors
The scaled happiness index has been included in the evaluation of the CDI because the happiness level of the
people of any nation is equally important as its GDP or HDI growth. If a country has a majority of population that
is stressed and morose, it will eventually lead to unsustainable growth and internal conflicts, thereby reducing its
peace index.
Scaled Happiness Index = (0.1 + 0.9 * (Xt - Xh) /Xt)
Xt = Total number of countries considered for Scaled Happiness Index calculation
Xh = Relative rank of a country based on Happiness Index (The country with the highest happiness index will
have the Xh value of 1 and that with the lowest happiness index; Xh = Xt)
Hence, the quantitative value of the scaled happiness index would vary between 0.1 and 1.
2.4 Scaled Peace Index
The scaled peace index is based on the 'Global Peace Index' report, 2018 (GPI, 2018). The Peace Index considers
the following factors and ranks countries on the basis of their peace:
1. Safety and Security
2. Militarization
3. Ongoing Conflicts
The scaled peace index has been incorporated in the CDI because merely a high HDI or IHDI with great internal
dissent and unrest does not hold much water. Also, the Global Peace Index of any country shows the amount of
money spent for military expenditure (more than 5% of the GDP for some countries) that could be invested for
developmental purposes.
Scaled Peace Index = (0.1 + 0.9 * (Xt - Xp /Xt))
Xt = Total number of countries considered for the evaluation of scaled peace index.
Xp = Relative rank of a country based on its 'Global Peace Index' (The country with the highest peace index will
have the Xp value of 1 and that with the lowest happiness index; Xp = Xt)
Hence, the quantitative value of the scaled peace index would vary between 0.1 and 1.
3. Results
The CDI has been calculated for 126 nations by calculating the values for all the 4 parameters (i.e. IHDI, scaled
green index, scaled happiness index, scaled peace index). Then, the values of all the 4 parameters have been
summed up and multiplied by 0.25 so as to get the final value of CDI between 0.1 and 1.
INSIGHTS INTO REGIONAL DEVELOPMENT
ISSN 2669-0195 (online) http://jssidoi.org/jesi/
2019 Volume 1 Number 1 (March)
http://doi.org/10.9770/IRD.2019.1.1(5)
63
3.1 Inequality adjusted HDI (IHDI)
The absolute values of the IHDI have been used for the computation of the CDI and they have been mentioned in
Column (a) of Table 1.
3.2 Scaled Green Index
The scaled green index has been calculated using the formula given in section 2.2. The values of the scaled green
index for 126 nations are mentioned in Column (b) of Table 1. Countries like USA and Canada that have a very
high EF/capita have a very low scaled green index (very close to the minimum value 0.1). On the other hand,
countries with a low EF/capita like India and Zambia have a very high scaled green index (close to 1).
3.3 Scaled Happiness Index
The scaled happiness index has been calculated using the formula given in section 2.3. The values of the scaled
happiness index for 126 nations are mentioned in Column (c) of Table 1. Countries like Sweden and Netherlands
rank very high on the scaled happiness index (close to the maximum value 1). On the other hand, countries like
Angola, Togo and Sudan rank very low on the scaled happiness index (close to 0.1).
3.4 Scaled Peace Index
The scaled peace index has been calculated using the formula given in section 2.4. The values of the scaled peace
index for 126 nations are mentioned in Column (d) of Table 1. Countries like Pakistan and Sudan that have a high
degree of militarization and ongoing conflicts have a very low scaled peace index (very close to the minimum
value 0.1). On the other hand, peaceful countries like Ireland and Canada score very high on the scaled peace
index (close to 1).
Discussion
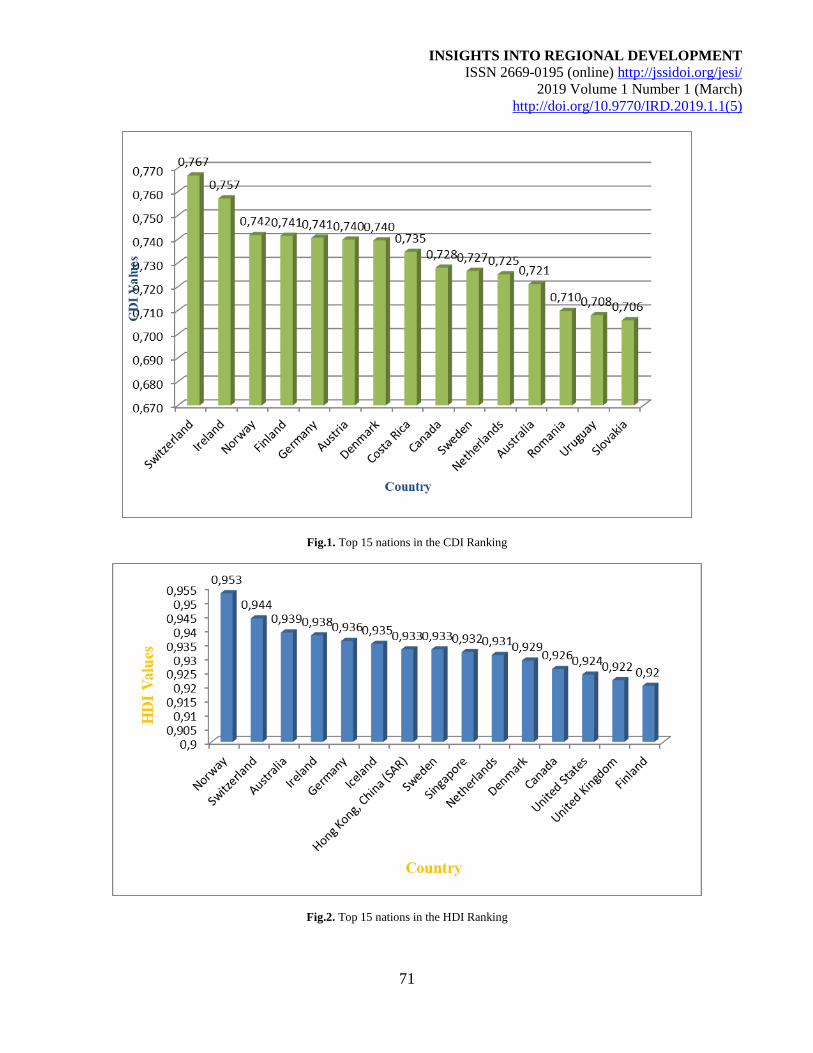
After substituting the values of all the 4 parameters in the formula of CDI, the values and ranks of CDI of all the
126 nations was computed. Switzerland emerged as the nation with the highest CDI (0.767), followed by Ireland
(0.757), Norway (0.742) and Finland (0.741).
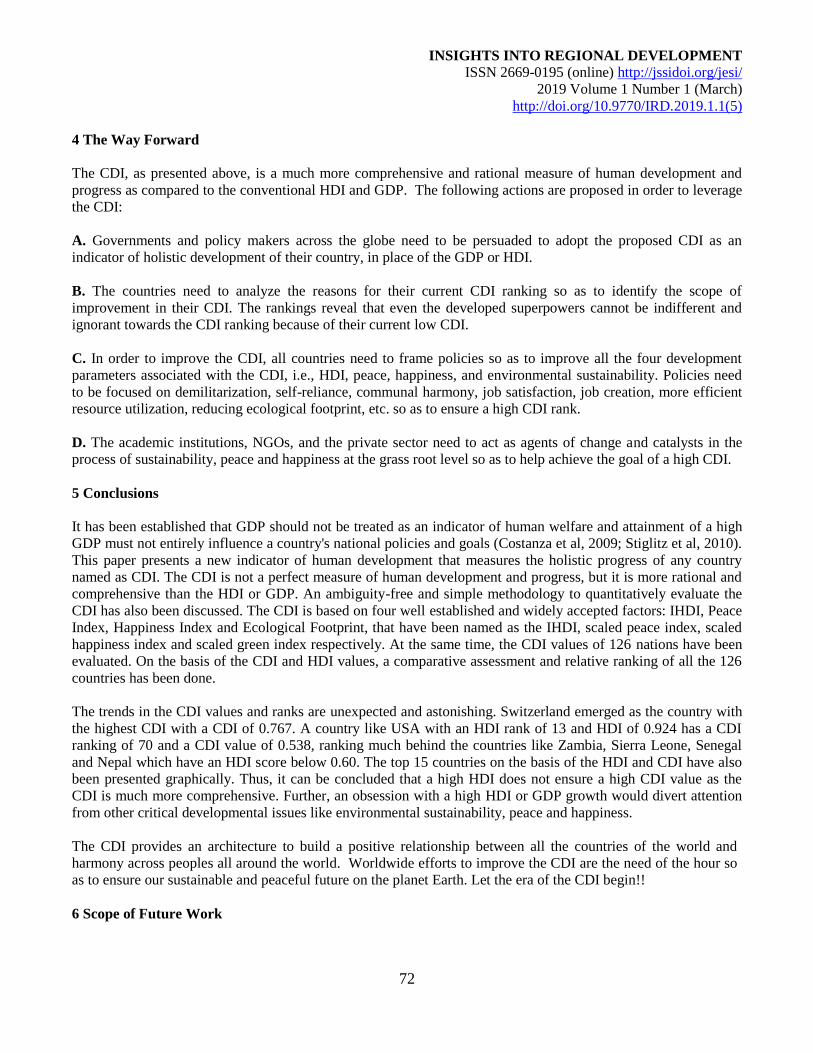
Further, the CDI and HDI ranks and values of all 126 nations were compared, and the complete comparative
assessment is given in Table 2. The top 15 countries on the basis of their CDI and HDI are represented in Fig. 1
and Fig. 2 respectively.
Norway, which has the highest HDI (0.953), has a CDI of 0.742. This is due to its high ecological footprint per
capita leading to a very low scaled green index (0.19). Similarly, countries like UK and France rank 24 and 31 as
per the CDI ranking due to their scaled green index and scaled peace index.
Surprisingly, countries like Romania, Uruguay and Costa Rica that rank 52nd, 55th and 63rd in the HDI ranking,
fare pretty well in the CDI ranking and secure the 13th, 14th and 8th spot respectively out of 126 countries,
surpassing even very high HDI countries like Singapore, USA, France and UK. This contrast is explained by the
higher scaled green index, scaled happiness index and scaled peace index of Romania, Uruguay and Costa Rica as
compared to Singapore, USA, France and UK.
INSIGHTS INTO REGIONAL DEVELOPMENT
ISSN 2669-0195 (online) http://jssidoi.org/jesi/
2019 Volume 1 Number 1 (March)
http://doi.org/10.9770/IRD.2019.1.1(5)
64
USA was able to secure the 70th rank in the CDI ranking, with a CDI of 0.538. On the other hand, it has a pretty
high HDI of 0.924 and ranks 13th as per the HDI ranking. The culprit is the high EF/capita of USA leading to a
poor scaled green index of 0.13 and the high degree of militarization leading to a low peace index of 0.33.
Even countries like Switzerland, Ireland and Norway that have bagged the top spots in the CDI ranking have a lot
of scope to improve their CDI values. They need to reduce their ecological footprint/capita so that their scaled
green index increase, thereby improving their CDI values.
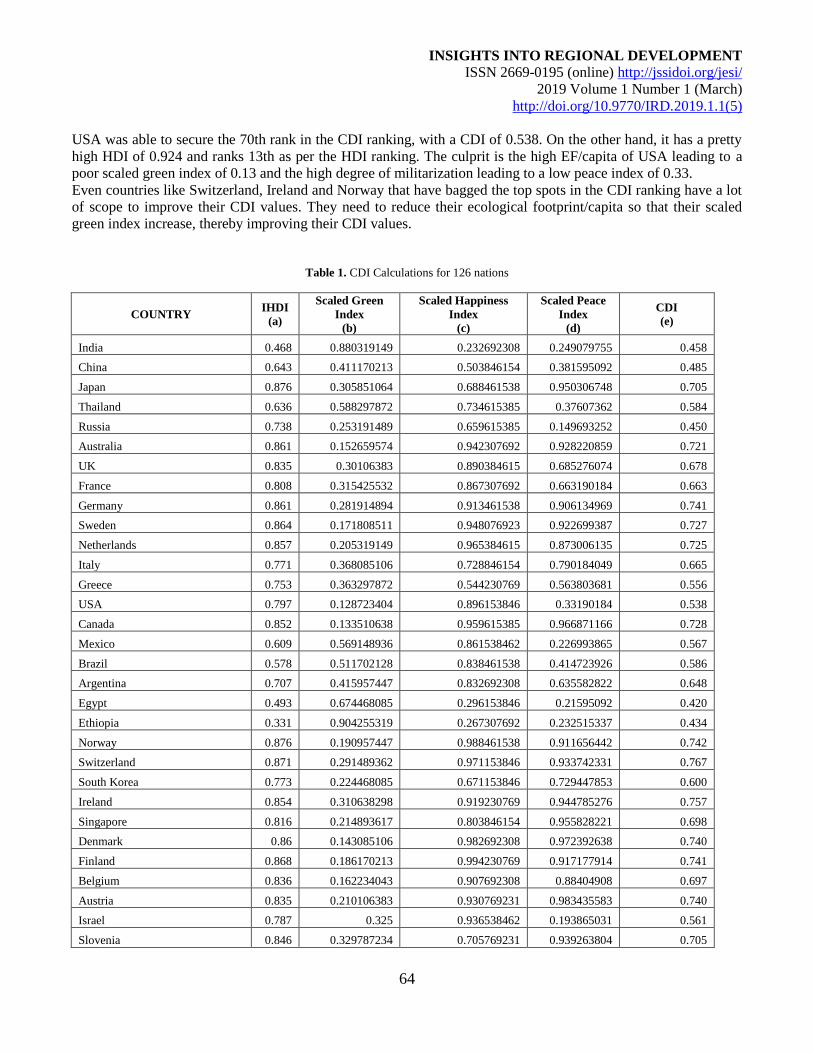
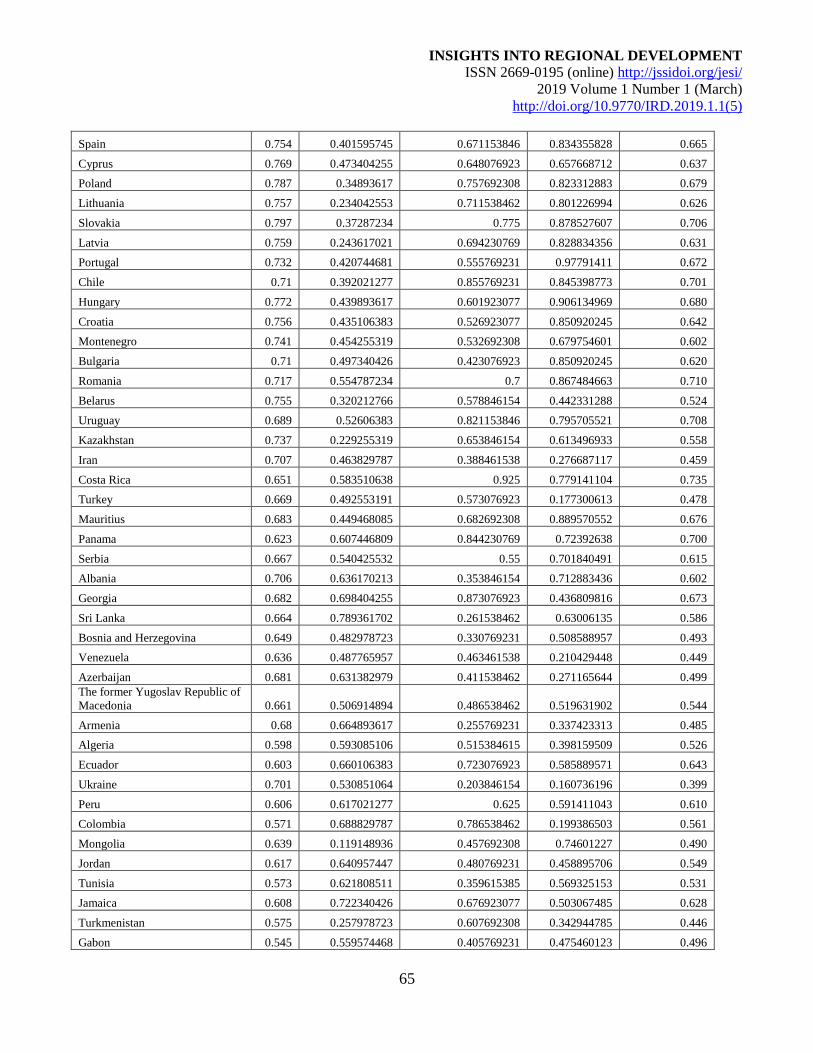
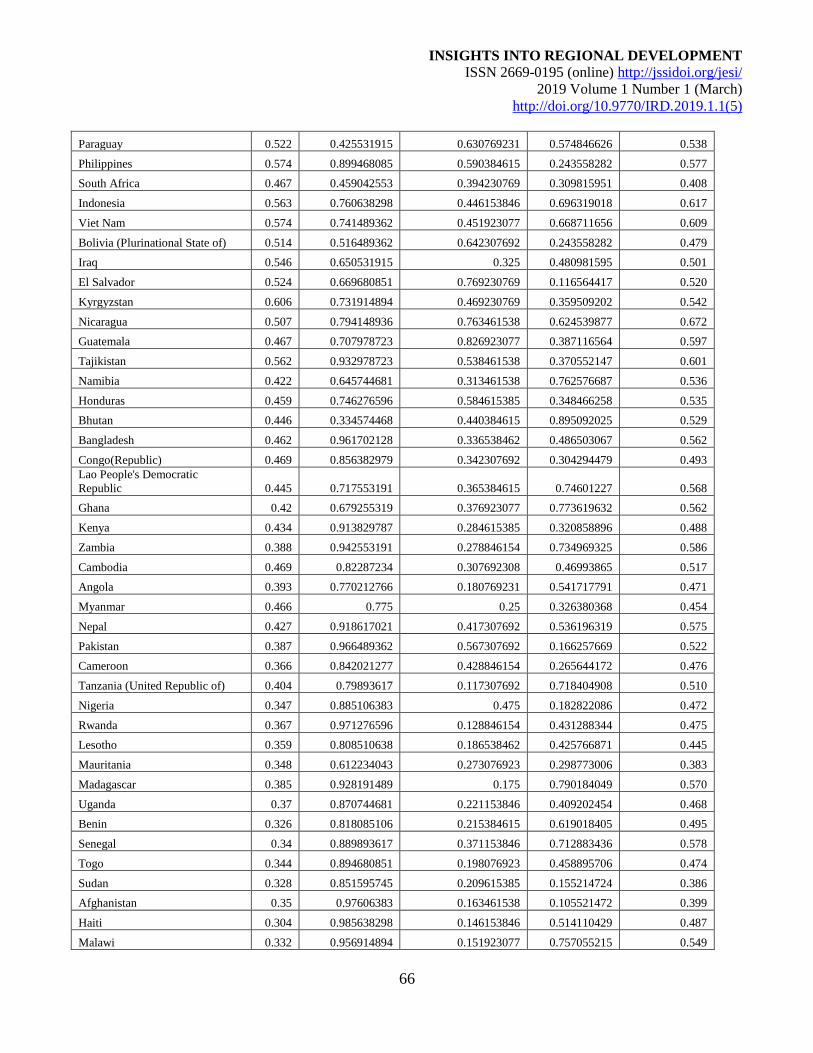
Table 1. CDI Calculations for 126 nations
COUNTRY IHDI
(a)
Scaled Green
Index
(b)
Scaled Happiness
Index
(c)
Scaled Peace
Index
(d)
CDI
(e)
India 0.468 0.880319149 0.232692308 0.249079755 0.458
China 0.643 0.411170213 0.503846154 0.381595092 0.485
Japan 0.876 0.305851064 0.688461538 0.950306748 0.705
Thailand 0.636 0.588297872 0.734615385 0.37607362 0.584
Russia 0.738 0.253191489 0.659615385 0.149693252 0.450
Australia 0.861 0.152659574 0.942307692 0.928220859 0.721
UK 0.835 0.30106383 0.890384615 0.685276074 0.678
France 0.808 0.315425532 0.867307692 0.663190184 0.663
Germany 0.861 0.281914894 0.913461538 0.906134969 0.741
Sweden 0.864 0.171808511 0.948076923 0.922699387 0.727
Netherlands 0.857 0.205319149 0.965384615 0.873006135 0.725
Italy 0.771 0.368085106 0.728846154 0.790184049 0.665
Greece 0.753 0.363297872 0.544230769 0.563803681 0.556
USA 0.797 0.128723404 0.896153846 0.33190184 0.538
Canada 0.852 0.133510638 0.959615385 0.966871166 0.728
Mexico 0.609 0.569148936 0.861538462 0.226993865 0.567
Brazil 0.578 0.511702128 0.838461538 0.414723926 0.586
Argentina 0.707 0.415957447 0.832692308 0.635582822 0.648
Egypt 0.493 0.674468085 0.296153846 0.21595092 0.420
Ethiopia 0.331 0.904255319 0.267307692 0.232515337 0.434
Norway 0.876 0.190957447 0.988461538 0.911656442 0.742
Switzerland 0.871 0.291489362 0.971153846 0.933742331 0.767
South Korea 0.773 0.224468085 0.671153846 0.729447853 0.600
Ireland 0.854 0.310638298 0.919230769 0.944785276 0.757
Singapore 0.816 0.214893617 0.803846154 0.955828221 0.698
Denmark 0.86 0.143085106 0.982692308 0.972392638 0.740
Finland 0.868 0.186170213 0.994230769 0.917177914 0.741
Belgium 0.836 0.162234043 0.907692308 0.88404908 0.697
Austria 0.835 0.210106383 0.930769231 0.983435583 0.740
Israel 0.787 0.325 0.936538462 0.193865031 0.561
Slovenia 0.846 0.329787234 0.705769231 0.939263804 0.705
INSIGHTS INTO REGIONAL DEVELOPMENT
ISSN 2669-0195 (online) http://jssidoi.org/jesi/
2019 Volume 1 Number 1 (March)
http://doi.org/10.9770/IRD.2019.1.1(5)
65
Spain 0.754 0.401595745 0.671153846 0.834355828 0.665
Cyprus 0.769 0.473404255 0.648076923 0.657668712 0.637
Poland 0.787 0.34893617 0.757692308 0.823312883 0.679
Lithuania 0.757 0.234042553 0.711538462 0.801226994 0.626
Slovakia 0.797 0.37287234 0.775 0.878527607 0.706
Latvia 0.759 0.243617021 0.694230769 0.828834356 0.631
Portugal 0.732 0.420744681 0.555769231 0.97791411 0.672
Chile 0.71 0.392021277 0.855769231 0.845398773 0.701
Hungary 0.772 0.439893617 0.601923077 0.906134969 0.680
Croatia 0.756 0.435106383 0.526923077 0.850920245 0.642
Montenegro 0.741 0.454255319 0.532692308 0.679754601 0.602
Bulgaria 0.71 0.497340426 0.423076923 0.850920245 0.620
Romania 0.717 0.554787234 0.7 0.867484663 0.710
Belarus 0.755 0.320212766 0.578846154 0.442331288 0.524
Uruguay 0.689 0.52606383 0.821153846 0.795705521 0.708
Kazakhstan 0.737 0.229255319 0.653846154 0.613496933 0.558
Iran 0.707 0.463829787 0.388461538 0.276687117 0.459
Costa Rica 0.651 0.583510638 0.925 0.779141104 0.735
Turkey 0.669 0.492553191 0.573076923 0.177300613 0.478
Mauritius 0.683 0.449468085 0.682692308 0.889570552 0.676
Panama 0.623 0.607446809 0.844230769 0.72392638 0.700
Serbia 0.667 0.540425532 0.55 0.701840491 0.615
Albania 0.706 0.636170213 0.353846154 0.712883436 0.602
Georgia 0.682 0.698404255 0.873076923 0.436809816 0.673
Sri Lanka 0.664 0.789361702 0.261538462 0.63006135 0.586
Bosnia and Herzegovina 0.649 0.482978723 0.330769231 0.508588957 0.493
Venezuela 0.636 0.487765957 0.463461538 0.210429448 0.449
Azerbaijan 0.681 0.631382979 0.411538462 0.271165644 0.499
The former Yugoslav Republic of
Macedonia 0.661 0.506914894 0.486538462 0.519631902 0.544
Armenia 0.68 0.664893617 0.255769231 0.337423313 0.485
Algeria 0.598 0.593085106 0.515384615 0.398159509 0.526
Ecuador 0.603 0.660106383 0.723076923 0.585889571 0.643
Ukraine 0.701 0.530851064 0.203846154 0.160736196 0.399
Peru 0.606 0.617021277 0.625 0.591411043 0.610
Colombia 0.571 0.688829787 0.786538462 0.199386503 0.561
Mongolia 0.639 0.119148936 0.457692308 0.74601227 0.490
Jordan 0.617 0.640957447 0.480769231 0.458895706 0.549
Tunisia 0.573 0.621808511 0.359615385 0.569325153 0.531
Jamaica 0.608 0.722340426 0.676923077 0.503067485 0.628
Turkmenistan 0.575 0.257978723 0.607692308 0.342944785 0.446
Gabon 0.545 0.559574468 0.405769231 0.475460123 0.496
INSIGHTS INTO REGIONAL DEVELOPMENT
ISSN 2669-0195 (online) http://jssidoi.org/jesi/
2019 Volume 1 Number 1 (March)
http://doi.org/10.9770/IRD.2019.1.1(5)
66
Paraguay 0.522 0.425531915 0.630769231 0.574846626 0.538
Philippines 0.574 0.899468085 0.590384615 0.243558282 0.577
South Africa 0.467 0.459042553 0.394230769 0.309815951 0.408
Indonesia 0.563 0.760638298 0.446153846 0.696319018 0.617
Viet Nam 0.574 0.741489362 0.451923077 0.668711656 0.609
Bolivia (Plurinational State of) 0.514 0.516489362 0.642307692 0.243558282 0.479
Iraq 0.546 0.650531915 0.325 0.480981595 0.501
El Salvador 0.524 0.669680851 0.769230769 0.116564417 0.520
Kyrgyzstan 0.606 0.731914894 0.469230769 0.359509202 0.542
Nicaragua 0.507 0.794148936 0.763461538 0.624539877 0.672
Guatemala 0.467 0.707978723 0.826923077 0.387116564 0.597
Tajikistan 0.562 0.932978723 0.538461538 0.370552147 0.601
Namibia 0.422 0.645744681 0.313461538 0.762576687 0.536
Honduras 0.459 0.746276596 0.584615385 0.348466258 0.535
Bhutan 0.446 0.334574468 0.440384615 0.895092025 0.529
Bangladesh 0.462 0.961702128 0.336538462 0.486503067 0.562
Congo(Republic) 0.469 0.856382979 0.342307692 0.304294479 0.493
Lao People's Democratic
Republic 0.445 0.717553191 0.365384615 0.74601227 0.568
Ghana 0.42 0.679255319 0.376923077 0.773619632 0.562
Kenya 0.434 0.913829787 0.284615385 0.320858896 0.488
Zambia 0.388 0.942553191 0.278846154 0.734969325 0.586
Cambodia 0.469 0.82287234 0.307692308 0.46993865 0.517
Angola 0.393 0.770212766 0.180769231 0.541717791 0.471
Myanmar 0.466 0.775 0.25 0.326380368 0.454
Nepal 0.427 0.918617021 0.417307692 0.536196319 0.575
Pakistan 0.387 0.966489362 0.567307692 0.166257669 0.522
Cameroon 0.366 0.842021277 0.428846154 0.265644172 0.476
Tanzania (United Republic of) 0.404 0.79893617 0.117307692 0.718404908 0.510
Nigeria 0.347 0.885106383 0.475 0.182822086 0.472
Rwanda 0.367 0.971276596 0.128846154 0.431288344 0.475
Lesotho 0.359 0.808510638 0.186538462 0.425766871 0.445
Mauritania 0.348 0.612234043 0.273076923 0.298773006 0.383
Madagascar 0.385 0.928191489 0.175 0.790184049 0.570
Uganda 0.37 0.870744681 0.221153846 0.409202454 0.468
Benin 0.326 0.818085106 0.215384615 0.619018405 0.495
Senegal 0.34 0.889893617 0.371153846 0.712883436 0.578
Togo 0.344 0.894680851 0.198076923 0.458895706 0.474
Sudan 0.328 0.851595745 0.209615385 0.155214724 0.386
Afghanistan 0.35 0.97606383 0.163461538 0.105521472 0.399
Haiti 0.304 0.985638298 0.146153846 0.514110429 0.487
Malawi 0.332 0.956914894 0.151923077 0.757055215 0.549
INSIGHTS INTO REGIONAL DEVELOPMENT
ISSN 2669-0195 (online) http://jssidoi.org/jesi/
2019 Volume 1 Number 1 (March)
http://doi.org/10.9770/IRD.2019.1.1(5)
67
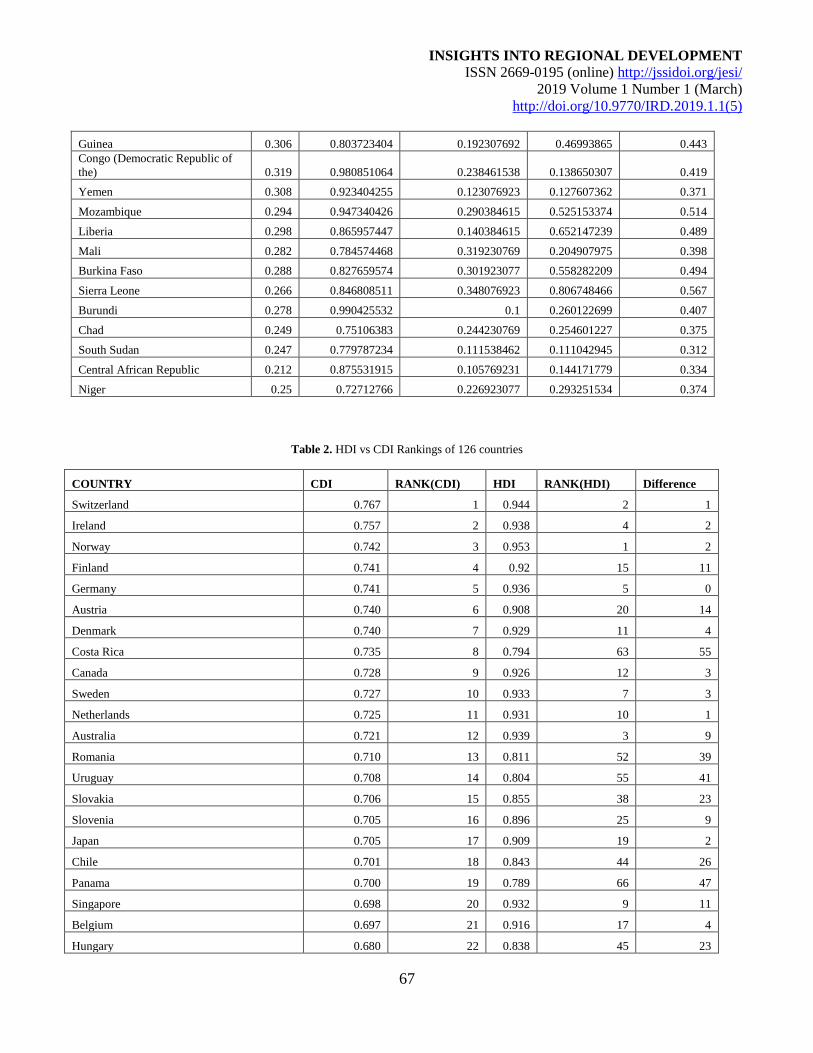
Guinea 0.306 0.803723404 0.192307692 0.46993865 0.443
Congo (Democratic Republic of
the) 0.319 0.980851064 0.238461538 0.138650307 0.419
Yemen 0.308 0.923404255 0.123076923 0.127607362 0.371
Mozambique 0.294 0.947340426 0.290384615 0.525153374 0.514
Liberia 0.298 0.865957447 0.140384615 0.652147239 0.489
Mali 0.282 0.784574468 0.319230769 0.204907975 0.398
Burkina Faso 0.288 0.827659574 0.301923077 0.558282209 0.494
Sierra Leone 0.266 0.846808511 0.348076923 0.806748466 0.567
Burundi 0.278 0.990425532 0.1 0.260122699 0.407
Chad 0.249 0.75106383 0.244230769 0.254601227 0.375
South Sudan 0.247 0.779787234 0.111538462 0.111042945 0.312
Central African Republic 0.212 0.875531915 0.105769231 0.144171779 0.334
Niger 0.25 0.72712766 0.226923077 0.293251534 0.374
Table 2. HDI vs CDI Rankings of 126 countries
COUNTRY CDI RANK(CDI) HDI RANK(HDI) Difference
Switzerland 0.767 1 0.944 2 1
Ireland 0.757 2 0.938 4 2
Norway 0.742 3 0.953 1 2
Finland 0.741 4 0.92 15 11
Germany 0.741 5 0.936 5 0
Austria 0.740 6 0.908 20 14
Denmark 0.740 7 0.929 11 4
Costa Rica 0.735 8 0.794 63 55
Canada 0.728 9 0.926 12 3
Sweden 0.727 10 0.933 7 3
Netherlands 0.725 11 0.931 10 1
Australia 0.721 12 0.939 3 9
Romania 0.710 13 0.811 52 39
Uruguay 0.708 14 0.804 55 41
Slovakia 0.706 15 0.855 38 23
Slovenia 0.705 16 0.896 25 9
Japan 0.705 17 0.909 19 2
Chile 0.701 18 0.843 44 26
Panama 0.700 19 0.789 66 47
Singapore 0.698 20 0.932 9 11
Belgium 0.697 21 0.916 17 4
Hungary 0.680 22 0.838 45 23
INSIGHTS INTO REGIONAL DEVELOPMENT
ISSN 2669-0195 (online) http://jssidoi.org/jesi/
2019 Volume 1 Number 1 (March)
http://doi.org/10.9770/IRD.2019.1.1(5)
68
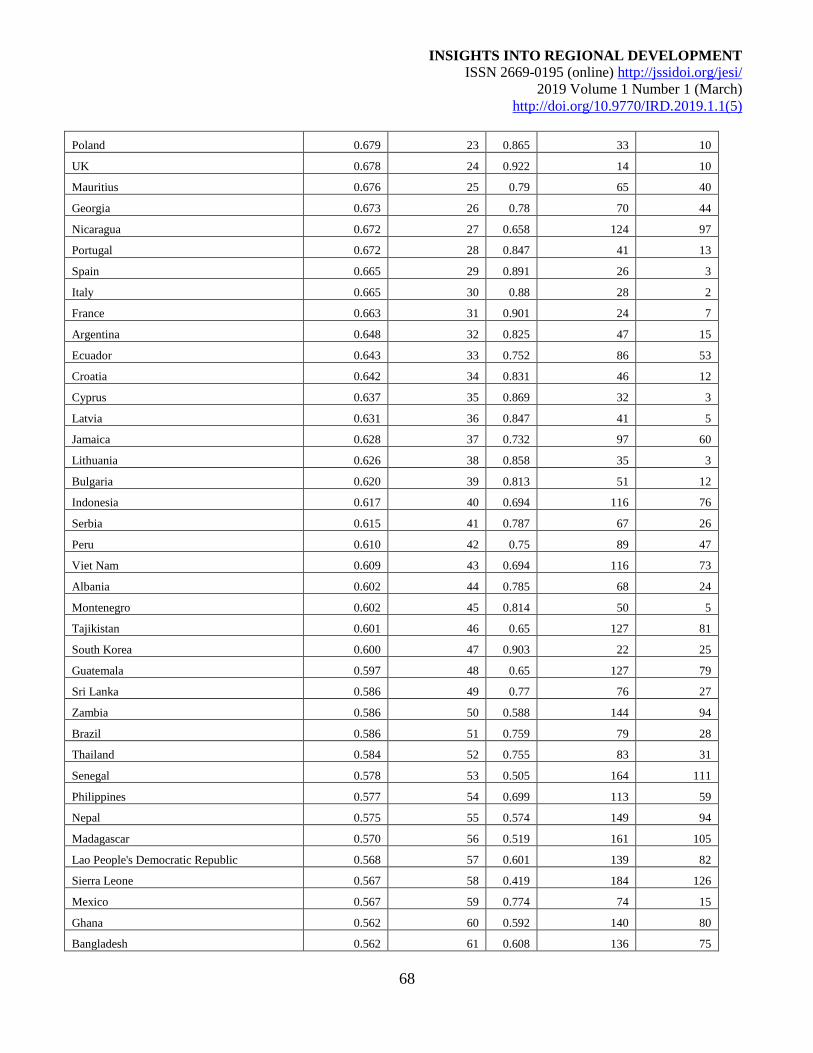
Poland 0.679 23 0.865 33 10
UK 0.678 24 0.922 14 10
Mauritius 0.676 25 0.79 65 40
Georgia 0.673 26 0.78 70 44
Nicaragua 0.672 27 0.658 124 97
Portugal 0.672 28 0.847 41 13
Spain 0.665 29 0.891 26 3
Italy 0.665 30 0.88 28 2
France 0.663 31 0.901 24 7
Argentina 0.648 32 0.825 47 15
Ecuador 0.643 33 0.752 86 53
Croatia 0.642 34 0.831 46 12
Cyprus 0.637 35 0.869 32 3
Latvia 0.631 36 0.847 41 5
Jamaica 0.628 37 0.732 97 60
Lithuania 0.626 38 0.858 35 3
Bulgaria 0.620 39 0.813 51 12
Indonesia 0.617 40 0.694 116 76
Serbia 0.615 41 0.787 67 26
Peru 0.610 42 0.75 89 47
Viet Nam 0.609 43 0.694 116 73
Albania 0.602 44 0.785 68 24
Montenegro 0.602 45 0.814 50 5
Tajikistan 0.601 46 0.65 127 81
South Korea 0.600 47 0.903 22 25
Guatemala 0.597 48 0.65 127 79
Sri Lanka 0.586 49 0.77 76 27
Zambia 0.586 50 0.588 144 94
Brazil 0.586 51 0.759 79 28
Thailand 0.584 52 0.755 83 31
Senegal 0.578 53 0.505 164 111
Philippines 0.577 54 0.699 113 59
Nepal 0.575 55 0.574 149 94
Madagascar 0.570 56 0.519 161 105
Lao People's Democratic Republic 0.568 57 0.601 139 82
Sierra Leone 0.567 58 0.419 184 126
Mexico 0.567 59 0.774 74 15
Ghana 0.562 60 0.592 140 80
Bangladesh 0.562 61 0.608 136 75
INSIGHTS INTO REGIONAL DEVELOPMENT
ISSN 2669-0195 (online) http://jssidoi.org/jesi/
2019 Volume 1 Number 1 (March)
http://doi.org/10.9770/IRD.2019.1.1(5)
69
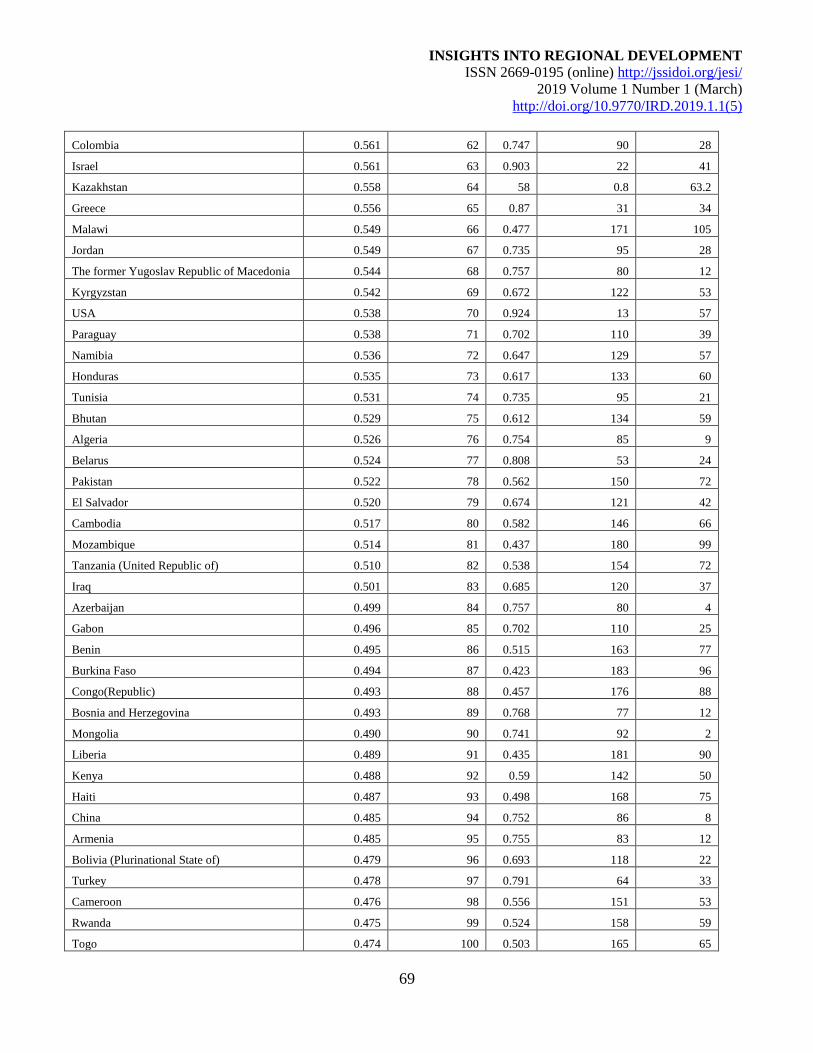
Colombia 0.561 62 0.747 90 28
Israel 0.561 63 0.903 22 41
Kazakhstan 0.558 64 58 0.8 63.2
Greece 0.556 65 0.87 31 34
Malawi 0.549 66 0.477 171 105
Jordan 0.549 67 0.735 95 28
The former Yugoslav Republic of Macedonia 0.544 68 0.757 80 12
Kyrgyzstan 0.542 69 0.672 122 53
USA 0.538 70 0.924 13 57
Paraguay 0.538 71 0.702 110 39
Namibia 0.536 72 0.647 129 57
Honduras 0.535 73 0.617 133 60
Tunisia 0.531 74 0.735 95 21
Bhutan 0.529 75 0.612 134 59
Algeria 0.526 76 0.754 85 9
Belarus 0.524 77 0.808 53 24
Pakistan 0.522 78 0.562 150 72
El Salvador 0.520 79 0.674 121 42
Cambodia 0.517 80 0.582 146 66
Mozambique 0.514 81 0.437 180 99
Tanzania (United Republic of) 0.510 82 0.538 154 72
Iraq 0.501 83 0.685 120 37
Azerbaijan 0.499 84 0.757 80 4
Gabon 0.496 85 0.702 110 25
Benin 0.495 86 0.515 163 77
Burkina Faso 0.494 87 0.423 183 96
Congo(Republic) 0.493 88 0.457 176 88
Bosnia and Herzegovina 0.493 89 0.768 77 12
Mongolia 0.490 90 0.741 92 2
Liberia 0.489 91 0.435 181 90
Kenya 0.488 92 0.59 142 50
Haiti 0.487 93 0.498 168 75
China 0.485 94 0.752 86 8
Armenia 0.485 95 0.755 83 12
Bolivia (Plurinational State of) 0.479 96 0.693 118 22
Turkey 0.478 97 0.791 64 33
Cameroon 0.476 98 0.556 151 53
Rwanda 0.475 99 0.524 158 59
Togo 0.474 100 0.503 165 65
INSIGHTS INTO REGIONAL DEVELOPMENT
ISSN 2669-0195 (online) http://jssidoi.org/jesi/
2019 Volume 1 Number 1 (March)
http://doi.org/10.9770/IRD.2019.1.1(5)
70
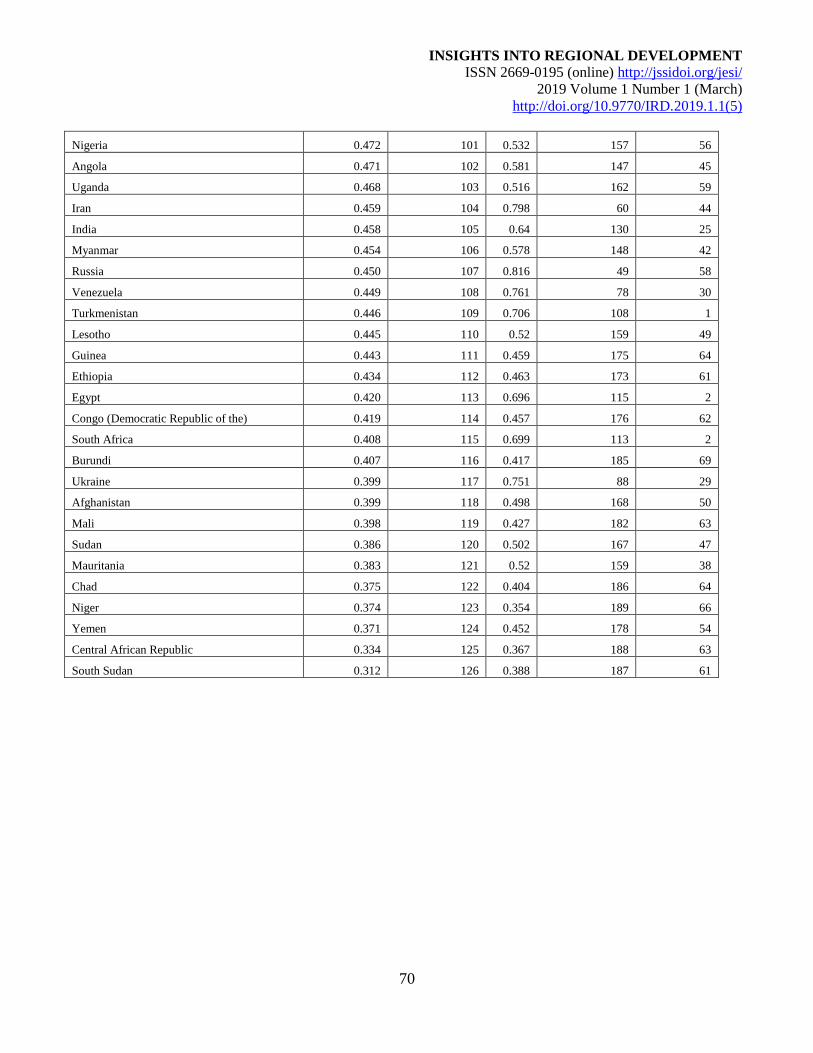
Nigeria 0.472 101 0.532 157 56
Angola 0.471 102 0.581 147 45
Uganda 0.468 103 0.516 162 59
Iran 0.459 104 0.798 60 44
India 0.458 105 0.64 130 25
Myanmar 0.454 106 0.578 148 42
Russia 0.450 107 0.816 49 58
Venezuela 0.449 108 0.761 78 30
Turkmenistan 0.446 109 0.706 108 1
Lesotho 0.445 110 0.52 159 49
Guinea 0.443 111 0.459 175 64
Ethiopia 0.434 112 0.463 173 61
Egypt 0.420 113 0.696 115 2
Congo (Democratic Republic of the) 0.419 114 0.457 176 62
South Africa 0.408 115 0.699 113 2
Burundi 0.407 116 0.417 185 69
Ukraine 0.399 117 0.751 88 29
Afghanistan 0.399 118 0.498 168 50
Mali 0.398 119 0.427 182 63
Sudan 0.386 120 0.502 167 47
Mauritania 0.383 121 0.52 159 38
Chad 0.375 122 0.404 186 64
Niger 0.374 123 0.354 189 66
Yemen 0.371 124 0.452 178 54
Central African Republic 0.334 125 0.367 188 63
South Sudan 0.312 126 0.388 187 61
INSIGHTS INTO REGIONAL DEVELOPMENT
ISSN 2669-0195 (online) http://jssidoi.org/jesi/
2019 Volume 1 Number 1 (March)
http://doi.org/10.9770/IRD.2019.1.1(5)
71
Fig.1. Top 15 nations in the CDI Ranking
Fig.2. Top 15 nations in the HDI Ranking
INSIGHTS INTO REGIONAL DEVELOPMENT
ISSN 2669-0195 (online) http://jssidoi.org/jesi/
2019 Volume 1 Number 1 (March)
http://doi.org/10.9770/IRD.2019.1.1(5)
72
4 The Way Forward
The CDI, as presented above, is a much more comprehensive and rational measure of human development and
progress as compared to the conventional HDI and GDP. The following actions are proposed in order to leverage
the CDI:
A. Governments and policy makers across the globe need to be persuaded to adopt the proposed CDI as an
indicator of holistic development of their country, in place of the GDP or HDI.
B. The countries need to analyze the reasons for their current CDI ranking so as to identify the scope of
improvement in their CDI. The rankings reveal that even the developed superpowers cannot be indifferent and
ignorant towards the CDI ranking because of their current low CDI.
C. In order to improve the CDI, all countries need to frame policies so as to improve all the four development
parameters associated with the CDI, i.e., HDI, peace, happiness, and environmental sustainability. Policies need
to be focused on demilitarization, self-reliance, communal harmony, job satisfaction, job creation, more efficient
resource utilization, reducing ecological footprint, etc. so as to ensure a high CDI rank.
D. The academic institutions, NGOs, and the private sector need to act as agents of change and catalysts in the
process of sustainability, peace and happiness at the grass root level so as to help achieve the goal of a high CDI.
5 Conclusions
It has been established that GDP should not be treated as an indicator of human welfare and attainment of a high
GDP must not entirely influence a country's national policies and goals (Costanza et al, 2009; Stiglitz et al, 2010).
This paper presents a new indicator of human development that measures the holistic progress of any country
named as CDI. The CDI is not a perfect measure of human development and progress, but it is more rational and
comprehensive than the HDI or GDP. An ambiguity-free and simple methodology to quantitatively evaluate the
CDI has also been discussed. The CDI is based on four well established and widely accepted factors: IHDI, Peace
Index, Happiness Index and Ecological Footprint, that have been named as the IHDI, scaled peace index, scaled
happiness index and scaled green index respectively. At the same time, the CDI values of 126 nations have been
evaluated. On the basis of the CDI and HDI values, a comparative assessment and relative ranking of all the 126
countries has been done.
The trends in the CDI values and ranks are unexpected and astonishing. Switzerland emerged as the country with
the highest CDI with a CDI of 0.767. A country like USA with an HDI rank of 13 and HDI of 0.924 has a CDI
ranking of 70 and a CDI value of 0.538, ranking much behind the countries like Zambia, Sierra Leone, Senegal
and Nepal which have an HDI score below 0.60. The top 15 countries on the basis of the HDI and CDI have also
been presented graphically. Thus, it can be concluded that a high HDI does not ensure a high CDI value as the
CDI is much more comprehensive. Further, an obsession with a high HDI or GDP growth would divert attention
from other critical developmental issues like environmental sustainability, peace and happiness.
The CDI provides an architecture to build a positive relationship between all the countries of the world and
harmony across peoples all around the world. Worldwide efforts to improve the CDI are the need of the hour so
as to ensure our sustainable and peaceful future on the planet Earth. Let the era of the CDI begin!!
6 Scope of Future Work
INSIGHTS INTO REGIONAL DEVELOPMENT
ISSN 2669-0195 (online) http://jssidoi.org/jesi/
2019 Volume 1 Number 1 (March)
http://doi.org/10.9770/IRD.2019.1.1(5)
73
In the future, this work can be expanded for all the remaining countries of the world, as and when the data for all
the four parameters is available. Inclusion of more factors in the CDI may also be considered as its
implementation begins in countries around the world. As pointed out in the methodology, equal weighting factors
were used for different parameters for CDI evaluation. If future research in social sciences provides relative
importance of various developmental parameters, suitable weighting factors may be applied accordingly in the
CDI evaluation. Policy instruments need to be developed that are aimed for CDI improvement so that the overall
well-being of any country increases.
Abbreviations:
CDI: Composite Development Index
GDP: Gross Domestic Product
HDI: Human Development Index
HPI: Holistic Progress Index
IHDI: Inequality adjusted Human Development Index
NGOs: Non-Governmental Organizations
UN: United Nations
References
Abrhám, J.; Britchenko, I.; Jankovic, M.; Garškaitė-Milvydienė, K. 2018. Energy security issues in contemporary Europe, Journal of
Security and Sustainability Issues 7(3): 387–398. https://doi.org/10.9770/jssi.2018.7.3(1)
Bilan, Y., Mishchuk, H., Pylypchuk, R. 2017. Towards sustainable economic development via social entrepreneurship, Journal of Security
and Sustainability Issues 6(4): 691-702 http://doi.org/10.9770/jssi.2017.6.4(13)
Cherchye, L., Ooghe, E., and Van Puyenbroeck, T. 2008. Robust human development rankings, Journal of Economic Inequality 6(4): 287-
321.
Comim, F. 2016. "Beyond the HDI? Assessing alternative measures of human development from a capability perspective", 2016 UNDP
Human Development Report Background Paper, http://hdr.undp.org/sites/default/files/comim_template_0.pdf , accessed on 23rd August,
2018
Costanza, R., Erickson, J., Fligger, K., Adams, A., Adams, C., Altschuler, B., Balter, S., Fisher, B., Hike, J., Kelly, J., Kerr, T., McCauley,
M., Montone, K., Rauch, M., Schmiedeskamp, K., Saxton, D., Sparacino, L., Tusinski, W., Williams, L., 2004. Estimates of the Genuine
Progress Indicator (GPI) for Vermont, Chittenden County and Burlington, from 1950 to 2000 , Ecological Economics 51 (1–2), 139–155.
Costanza, R., Hart, M., Posner, S., Talberth, J., 2009. Beyond GDP: The Need for New Measures of Progress., THE PARDEE PAPERS /
No. 4 / January 2009, The Frederick S. Pardee Center for the Study of the Longer-Range Future at Boston University
https://www.bu.edu/pardee/files/documents/PP-004-GDP.pdf , accesed on 25th December, 2018
Doessel, D.P., and Gounder, R. 1994. Theory and measurement of living levels: Some empirical results for the human development index,
Journal of International Development 6(4): 415–435
Dudzevičiūtė, G.; Prakapienė, D. 2018. Investigation of the economic growth, poverty and inequality inter-linkages in the European Union
countries, Journal of Security and Sustainability Issues 7(4): 839-854. https://doi.org/10.9770/jssi.2018.7.4(19)
Fukuda-Parr, S. 2003. “The Human Development Paradigm: Operationalizing Sen's Ideas On Capabilities, Feminist Economics 9: 301-317
'Global Footprint Network', GFN, http://data.footprintnetwork.org/#/ , accessed in September, 2018
INSIGHTS INTO REGIONAL DEVELOPMENT
ISSN 2669-0195 (online) http://jssidoi.org/jesi/
2019 Volume 1 Number 1 (March)
http://doi.org/10.9770/IRD.2019.1.1(5)
74
'Global Peace Index (GPI), 2018, Institute for Economics and Peace, http://visionofhumanity.org/app/uploads/2018/06/Global-Peace-Index-
2018-2.pdf , accessed on 14th October, 2018
Harkness, S. (2004), “Social and Political Indicators of Human Well- Being,” Research Paper, 2004/33, Helsinki: United Nations
University: World Institute for Development Economics Research (WIDER)
Harttgen, K., and Klasen, S. 2010. “A Household-Based Human Development Index,” Human Development Research Papers, 2010/22,
New York: United Nations Development Programme
HDR: Human Development Reports; http://hdr.undp.org/en/content/human-development-index-hdi
Hicks, D.A. 1997. The inequality-adjusted Human Development Index: A Constructive Proposal, World Development 25(8): 1283-1298.
Hirschowitz, R. and Orkin, M. 1997. Inequality in South Africa: Findings from the 1994 October Household Survey, Social Indicators
Research 41(1-3): 119-136.
Human Development Indices and Indicators (HDII), 2018 Statistical update;
http://hdr.undp.org/sites/default/files/2018_human_development_statistical_update.pdf, accessed in October, 2018
Jahan, S. 2002. Measuring living standards and poverty: The human development index as an alternate measure. Working paper of the
programme on Global Labor Standards and Living Wages, University of Massachusetts. www.umass.edu/peri/pdfs/glw_jahan.pdf
John F. Helliwell, Richard Layard and Jeffrey D. Sachs, 'World Happiness Report (WHR)', 2018, https://s3.amazonaws.com/happiness-
report/2018/WHR_web.pdf , accessed on 17th October, 2018
Koroneos, Ch. J.; Rokos, D. 2012. Sustainable and Integrated Development–A Critical Analysis, Sustainability 4: 141–153.
https://doi.org/10.3390/su4010141
Krishna Mazumdar. 2003. A New Approach to Human Development Index, Review of Social Economy 61(4): 535-549,
https://doi.org/10.1080/0034676032000160895
Kubiszewski, I., Costanza, R., Franco, C., Lawn, P., Talberth, J., Jackson, T., Aylmer, C. 2013. Beyond GDP: Measuring and achieving
global genuine progress, Ecological Economics 93 (2013) 57–68, Elsevier
Kuznets, S. 1934. National Income, 1929–1932.
Lawn, Ph. A. 2005. An Assessment of the Evaluation Methods used to calculate the Index of Sustainable Economic Welfare (ISEW),
Genuine Progress Indicator (GPI), and Sustainable Net Benefit Index (SNBI), Environment, Development and Sustainability 7: 185–208.
Marcuss, D., Kane, R.E. 2007. US national income and product statistics born of the Great Depression and World War II. Bureau of
Economic Analysis: Survey of Current Business 87(2), 32–46.
McCulla, S.H., Smith, S., 2007. Measuring the Economy: A Primer on GDP and the National Income and Product Accounts.
Melas, V.; Lisin, E.; Tvaronavičienė, M., Peresadko, G.; Radwański, R. 2017. Energy security and economic development: renewables and
the integration of energy systems, Journal of Security and Sustainability Issues 7(1): 133–139. http://dx.doi.org/10.9770/jssi.2017.7.1(11)
Moran, D., Wackernagel, M., Kitzes, J., Goldfinger, S., Boutaud, A. 2008. Measuring sustainable development — Nation by nation,
Ecological Economics 64: 470 – 474
Noorbakhsh, F. 1998. The Human Development Index: Some Technical Issues And Alternative Indices, Journal of International
Development, J. Int. Dev. 10, 589±605, John Wiley & Sons, Ltd.
Ogwang, T. 2000. Inter-country inequality in human development indicators, Applied Economics Letters 7(7): 443-446
INSIGHTS INTO REGIONAL DEVELOPMENT
ISSN 2669-0195 (online) http://jssidoi.org/jesi/
2019 Volume 1 Number 1 (March)
http://doi.org/10.9770/IRD.2019.1.1(5)
75
Osberg, L., and Sharpe, A. 2003). Human Well-being and Economic Well-being: What Values Are Implicit in Current Indices?, Centre for
the Study of Living Standards Research Report 2003/04, Ottowa: Centre for the Study of Living Standards.
Panigrahi, R., and Sivramkrishna, S. 2002. An adjusted Human Development Index: Robust country rankings with respect to the choice of
fixed maximum and minimum indicator values, Journal of Human Development 3(2): 301-311
Paul, S. 1996. A modified human development index and international comparison, Applied Economics Letters 3(10): 677-682.
Prakash, R. 2011. Is the concept of a green economy a useful way of framing policy discussions and policymaking to promote sustainable
development?, Natural Resource Forum 35(1): 63-72, United Nations, https://doi.org/10.1111/j.1477-8947.2011.01347.x
Prakash, R. 2013. Looking beyond the GDP: quantitative evaluation of the “Holistic Progress Index" (HPI)", Journal of Security and
Sustainability Issues 2(4): 57–64 http://dx.doi.org/10.9770/jssi.2013.2.4(6)
Rees, W. 1992. Ecological footprints and appropriated carrying capacity: what urban economics leaves out, Environment and Urbanisation
4.
Rees, W. 2017. Ecological Footprints and Appropriated Carrying Capacity: What Urban Economics Leaves Out, Urbanization 2(1): 66-77
https://doi.org/10.1177/2455747117699722
Ślusarczyk, B.; Kot S. 2018. Solution for sustainable development: provisions limiting the consumption of disposable plastic carrier bags in
Poland, Journal of Security and Sustainability Issues 7(3): 449–458. https://doi.org/10.9770/jssi.2018.7.3(7)
Smaliukiene, R. 2018. Sustainability issues in the military: genesis and prospects, Journal of Security and Sustainability Issues 8(1): 19-32.
https://doi.org/10.9770/jssi.2018.8.1(2)
Smith, P. 1993. Measuring human development, Asian Economic Journal 7(1): 89–106.
Stiglitz, J. 2009. GDP Fetishism. Available on the Internet: http://www.project syndicate.org/commentary/stiglitz116/English
Stiglitz, J.E., Sen, A., Fitoussi, J.P., 2010. Mismeasuring Our Lives: Why GDP Doesn't Add Up. The New Press, New York.
Suleimenova, M. S.; Kulazhanov, T.K.; Akhmetova, S. O.; Daribayev, Z.E.; Moldagazyyeva, Z. Y. 2018. Food security and ecological
safety of megalopolis: a case study analysis, Journal of Security and Sustainability Issues 7(3): 495–511.
https://doi.org/10.9770/jssi.2018.7.3(10)
Taner, M., Sezen, B., Mıhcı, H., Year. 2011. An Alternative Human Development Index Considering Unemployment, 6(1): 45-60, South
East European Journal of Economics and Business, The Journal of University of Sarajevo, https://doi.org/10.2478/v10033-011-0005-z
Wackernagel, M., Monfreda, C., Moran, D., Wermer, P., Goldfinger, S., Deumling, D., Murray, M., 2005. National footprint and
biocapacity accounts.The underlying calculation method. Global Footprint Network www.footprintnetwork.org
Wackernagel, M., Rees, W., 1996. Our Ecological Footprint: Reducing Human Impact on the Earth. New Society Publishers.
Wackernagel, M., Schulz, B., Deumling, D., Callejas Linares, A., Jenkins, M., Kapos, V., Monfreda, C., Loh, J., Myers, N., Norgaard, R.,
Randers, J., 2002. Tracking the ecological overshoot of the human economy. Proceedings of the National Academy of Science 99, 9266–
9271.
Wilkinson, R.G., Pickett, K., 2009. The Spirit Level: Why Greater Equality Makes Societies Stronger. Bloomsbury Press, New York.
INSIGHTS INTO REGIONAL DEVELOPMENT
ISSN 2669-0195 (online) http://jssidoi.org/jesi/
2019 Volume 1 Number 1 (March)
http://doi.org/10.9770/IRD.2019.1.1(5)
76
Ravi PRAKASH
ORCID ID: https://orcid.org/0000-0001-7299-7725
Pulkit GARG
ORCID ID: https://orcid.org/0000-0003-4830-3986
___________________________________________________________________________________________ Copyright © 2019 by author(s) and VsI Entrepreneurship and Sustainability Center
This work is licensed under the Creative Commons Attribution International License (CC BY).
http://creativecommons.org/licenses/by/4.0/
Related Documents