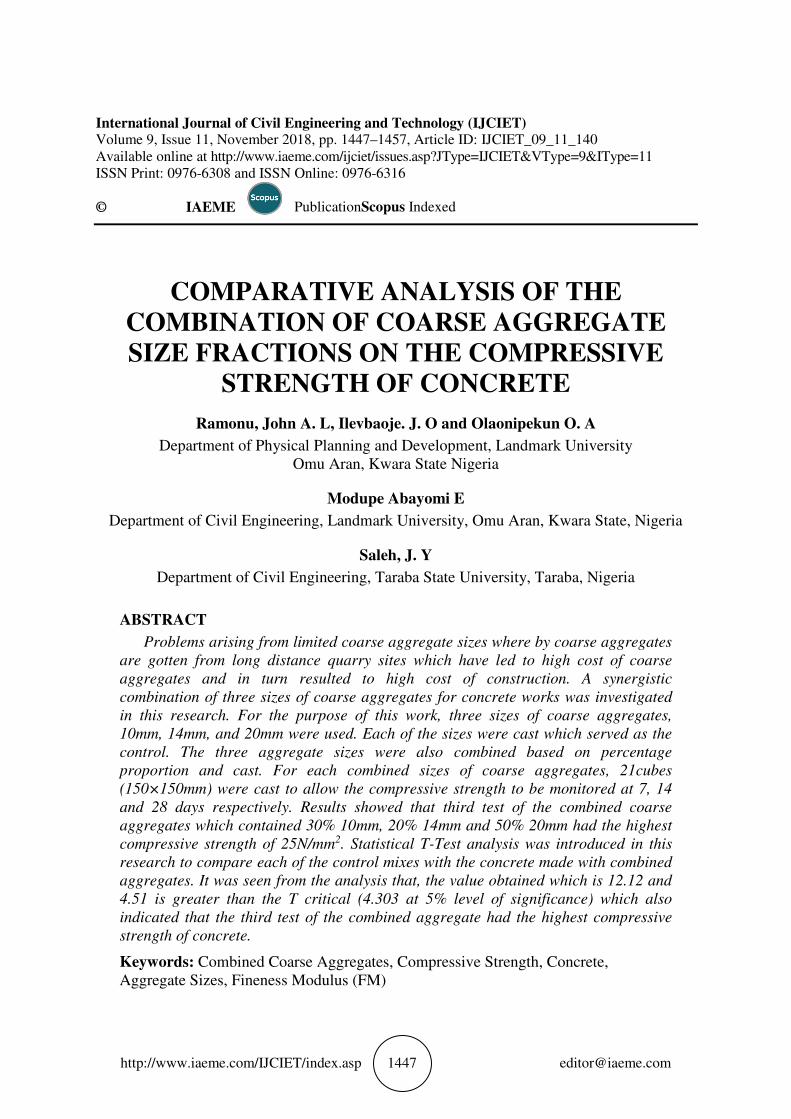
http://www.iaeme.com/IJCIET/index.asp 1447 [email protected] International Journal of Civil Engineering and Technology (IJCIET) Volume 9, Issue 11, November 2018, pp. 1447–1457, Article ID: IJCIET_09_11_140 Available online at http://www.iaeme.com/ijciet/issues.asp?JType=IJCIET&VType=9&IType=11 ISSN Print: 0976-6308 and ISSN Online: 0976-6316 © IAEME PublicationScopus Indexed COMPARATIVE ANALYSIS OF THE COMBINATION OF COARSE AGGREGATE SIZE FRACTIONS ON THE COMPRESSIVE STRENGTH OF CONCRETE Ramonu, John A. L, Ilevbaoje. J. O and Olaonipekun O. A Department of Physical Planning and Development, Landmark University Omu Aran, Kwara State Nigeria Modupe Abayomi E Department of Civil Engineering, Landmark University, Omu Aran, Kwara State, Nigeria Saleh, J. Y Department of Civil Engineering, Taraba State University, Taraba, Nigeria ABSTRACT Problems arising from limited coarse aggregate sizes where by coarse aggregates are gotten from long distance quarry sites which have led to high cost of coarse aggregates and in turn resulted to high cost of construction. A synergistic combination of three sizes of coarse aggregates for concrete works was investigated in this research. For the purpose of this work, three sizes of coarse aggregates, 10mm, 14mm, and 20mm were used. Each of the sizes were cast which served as the control. The three aggregate sizes were also combined based on percentage proportion and cast. For each combined sizes of coarse aggregates, 21cubes (150×150mm) were cast to allow the compressive strength to be monitored at 7, 14 and 28 days respectively. Results showed that third test of the combined coarse aggregates which contained 30% 10mm, 20% 14mm and 50% 20mm had the highest compressive strength of 25N/mm 2 . Statistical T-Test analysis was introduced in this research to compare each of the control mixes with the concrete made with combined aggregates. It was seen from the analysis that, the value obtained which is 12.12 and 4.51 is greater than the T critical (4.303 at 5% level of significance) which also indicated that the third test of the combined aggregate had the highest compressive strength of concrete. Keywords: Combined Coarse Aggregates, Compressive Strength, Concrete, Aggregate Sizes, Fineness Modulus (FM)

Welcome message from author
This document is posted to help you gain knowledge. Please leave a comment to let me know what you think about it! Share it to your friends and learn new things together.
Transcript
http://www.iaeme.com/IJCIET/index.asp 1447 [email protected]
International Journal of Civil Engineering and Technology (IJCIET) Volume 9, Issue 11, November 2018, pp. 1447–1457, Article ID: IJCIET_09_11_140
Available online at http://www.iaeme.com/ijciet/issues.asp?JType=IJCIET&VType=9&IType=11
ISSN Print: 0976-6308 and ISSN Online: 0976-6316
© IAEME PublicationScopus Indexed
COMPARATIVE ANALYSIS OF THE
COMBINATION OF COARSE AGGREGATE
SIZE FRACTIONS ON THE COMPRESSIVE
STRENGTH OF CONCRETE
Ramonu, John A. L, Ilevbaoje. J. O and Olaonipekun O. A
Department of Physical Planning and Development, Landmark University
Omu Aran, Kwara State Nigeria
Modupe Abayomi E
Department of Civil Engineering, Landmark University, Omu Aran, Kwara State, Nigeria
Saleh, J. Y
Department of Civil Engineering, Taraba State University, Taraba, Nigeria
ABSTRACT
Problems arising from limited coarse aggregate sizes where by coarse aggregates
are gotten from long distance quarry sites which have led to high cost of coarse
aggregates and in turn resulted to high cost of construction. A synergistic
combination of three sizes of coarse aggregates for concrete works was investigated
in this research. For the purpose of this work, three sizes of coarse aggregates,
10mm, 14mm, and 20mm were used. Each of the sizes were cast which served as the
control. The three aggregate sizes were also combined based on percentage
proportion and cast. For each combined sizes of coarse aggregates, 21cubes
(150×150mm) were cast to allow the compressive strength to be monitored at 7, 14
and 28 days respectively. Results showed that third test of the combined coarse
aggregates which contained 30% 10mm, 20% 14mm and 50% 20mm had the highest
compressive strength of 25N/mm2. Statistical T-Test analysis was introduced in this
research to compare each of the control mixes with the concrete made with combined
aggregates. It was seen from the analysis that, the value obtained which is 12.12 and
4.51 is greater than the T critical (4.303 at 5% level of significance) which also
indicated that the third test of the combined aggregate had the highest compressive
strength of concrete.
Keywords: Combined Coarse Aggregates, Compressive Strength, Concrete,
Aggregate Sizes, Fineness Modulus (FM)
Comparative Analysis of the Combination of Coarse Aggregate Size Fractions on the
Compressive Strength of Concrete
http://www.iaeme.com/IJCIET/index.asp 1448 [email protected]
Cite this Article: Ramonu, John A. L., Ilevbaoje J. O, Olaonipekun O. A , Saleh J. Y and
Modupe Abayomi E., Comparative Analysis Of The Combination Of Coarse Aggregate
Size Fractions On The Compressive Strength Of Concrete, International Journal of
Civil Engineering and Technology, 9(11), 2018, pp. 1447–1457.
http://www.iaeme.com/IJCIET/issues.asp?JType=IJCIET&VType=9&IType=11
1. INTRODUCTION
In past and recent times, the production of concrete has been modified to achieve concrete of
desirable strength and also to meet various purpose of concrete production in the construction
industry. For example; admixture can be added to concrete to improve its quality, also
aggregate can be partially replace in concrete production to produce a light weight concrete.
Problem arising from the limited coarse aggregate size where by coarse aggregate are gotten
from a far distance quarry site which has led to high cost of coarse aggregate and in turn led
to high cost of construction. There is therefore the need to find a way out by combining the
limited coarse aggregate size in a reasonable percentage proportion in concrete production.
The effect of coarse aggregate blending on fresh properties of self-compacting concrete
(SCC) was investigated by [1]. Two different sizes of coarse aggregate sizes; 10mm and
20mm were used. The result revealed that both 60:40 and 40:60 of the coarse aggregate mix
performed SCC fresh properties. The combination of different aggregate size fractions to
form a full portion of coarse aggregate can be economical in concrete production.
Proportioning of coarse aggregate involves the combination of different coarse aggregate size
fraction to form a full portion which can be used in concrete production [3, 4].This research
was undertaken to investigate the comparative analysis of the combination of three different
sizes of coarse aggregates on the compressive strength of normal concrete mix. Statistical
analysis was introduced to select and prove the validity of the work.
2. MATERIALS AND METHOD
Commercially available Dangote ordinarily Portland cement was used for this project work.
The cement has a specific gravity of 3.15.
Three sizes of coarse aggregate, 10mm, 14mm, and 20mm were used. It was free from
clay materials and organic matter. The fine aggregate is normal sand obtained from a burrow
pit.
The water used was suitable for drinking. It was obtained from the borehole behind civil
engineering laboratory, Federal university of technology Minna, Niger State. This conforms
to British standard (BS3148, 1990) specification.
A nominal mix ratio of 1:2:4 (cement, fine and coarse aggregate) was adopted for the
purpose of this work and a water-cement ratio of 0.5 was used. The mix composition was
done using the absolute volume method shown in equation (2.1) and the batch compositions
are also shown in table 1, 2, and 3.
Mix Ratio = 1:2:4
Water cement ratio = 0.5
Where 0.02 = entrapped air
Ramonu, John A. L., Ilevbaoje J. O, Olaonipekun O. A , Saleh J. Y and Modupe Abayomi E
http://www.iaeme.com/IJCIET/index.asp 1449 [email protected]
W = 0.5C
Where W = weight of water
C = weight of cement
Where Fa = fine aggregate
Ca = coarse aggregate
Table 1 Amount of material to be used for the control experiment
Materials 10mm 14mm 20mm
Cement 22.3kg 23.5kg 23.8kg
Water 11.2kg 11.8kg 11.9kg
Sand 44.6kg 47kg 47.6kg
Gravel 89.2kg 94kg 95.2kg
Table 2 Percentage of Aggregate Required
10mm 14mm 20mm
10% 40% 50%
20% 30% 50%
30% 20% 50%
40% 10% 50%
Table 3 Amount to be used based on percentage proportion
10mm 14mm 20mm Sand Cement Water
8.9kg 37.6kg 47.6kg 47.05kg 23.53kg 11.79kg
17.84kg 28.2kg 47.6kg 46.82kg 23.41kg 11.73kg
26.76kg 18.8kg 47.6kg 46.58kg 23.29kg 11.67kg
35.68kg 9.4kg 47.6kg 46.34kg 23.2kg 11.61kg
The constituent of concrete materials to be used was weighed as specified in the design
mix [5, 8]. The fine aggregate (sand) and the binder (cement) were first mixed on the mixing
tray thoroughly to form a uniform coloration, after which the measured coarse aggregates for
the control was poured and mixed thoroughly. The specified amount of water was then

Comparative Analysis of the Combination of Coarse Aggregate Size Fractions on the
Compressive Strength of Concrete
http://www.iaeme.com/IJCIET/index.asp 1450 [email protected]
poured into the already mixed constituent. It was then mixed thoroughly to ensure suitable
consistency for the proportioned coarse aggregate replacement. It was further measured as
stated in the design mix and poured on the already made mixed binder and fine aggregate.
Water of specified weight was poured and mixed thoroughly to obtain an even and consistent
mix. For each type of coarse aggregate, 21 cubes (150x150mm) were cast in accordance to
[2].
Overall, sixty three (63) cubes were cast for the control and eighty four cubes were cast
for the proportion of coarse aggregate. After placement in the mould it was left for 24 hours
before it was remolded and placed in the curing tank. These cubes were cured for 7days,
14days and 28days respectively for compressive strength [6, 7]. The curing of the cube was
done according to [10].
Plate III: Mixing of concrete Plate IV: Cubes to be cured
Plate VII: Crushing of cubes using compressive Plate VIII: Failure zone of concrete
Testing machine
A research hypothesis for this research was proposed as follows;
• Null hypothesis, (Ho): there was no significant difference in the compressive
strength of the controlled concrete to the concrete made with combined coarse
aggregate.
Ramonu, John A. L., Ilevbaoje J. O, Olaonipekun O. A , Saleh J. Y and Modupe Abayomi E
http://www.iaeme.com/IJCIET/index.asp 1451 [email protected]
• Alternative hypothesis, (H1): there was a significant difference in the
compressive strength of the controlled concrete to the concrete made with
combined coarse aggregates.
4. RESULT AND DISCUSSION
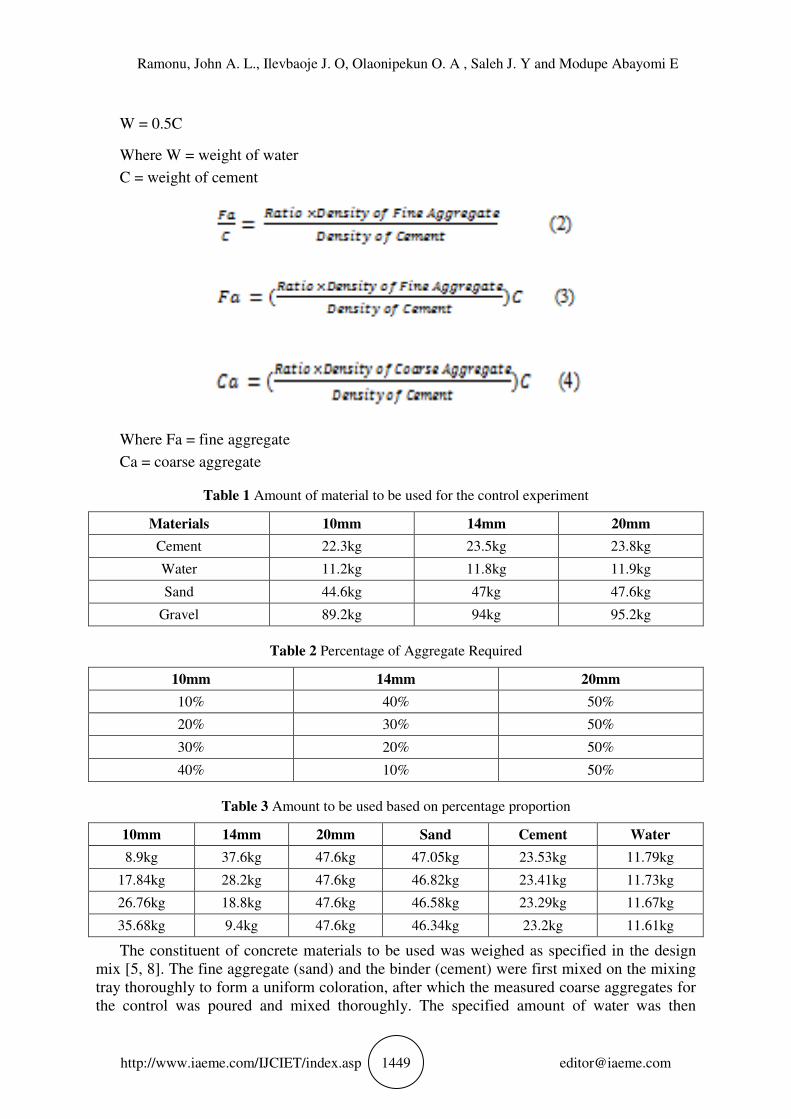
The results of the sieve analysis test on the aggregate are shown in figure. The fineness
modulus (FM) got shows that, the FM gotten is within the FM range of 2.1 to 3.1 as specified
in American Society of Testing and Materials (ASTM) C33. Therefore, the fine aggregate is
suitable for construction work.
The value of specific gravity of the aggregate are from 2.58 to 2.75 (table 4.1) the lose
bulk density, measures the value that the aggregate will occupy in concrete. The results of the
loose bulk density are shown in table 4.1.
Finess Modulus (FM) =
Figure 1 Particle- Size Distribution Curve for Sand
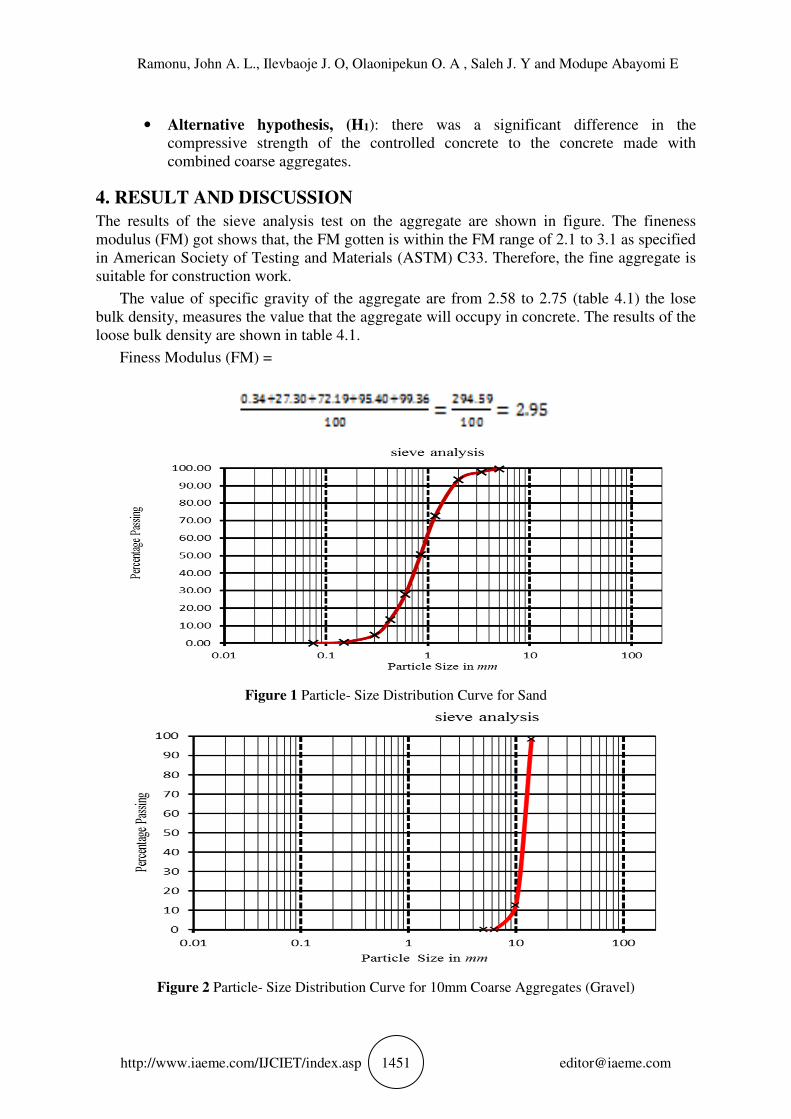
Figure 2 Particle- Size Distribution Curve for 10mm Coarse Aggregates (Gravel)
Comparative Analysis of the Combination of Coarse Aggregate Size Fractions on the
Compressive Strength of Concrete
http://www.iaeme.com/IJCIET/index.asp 1452 [email protected]
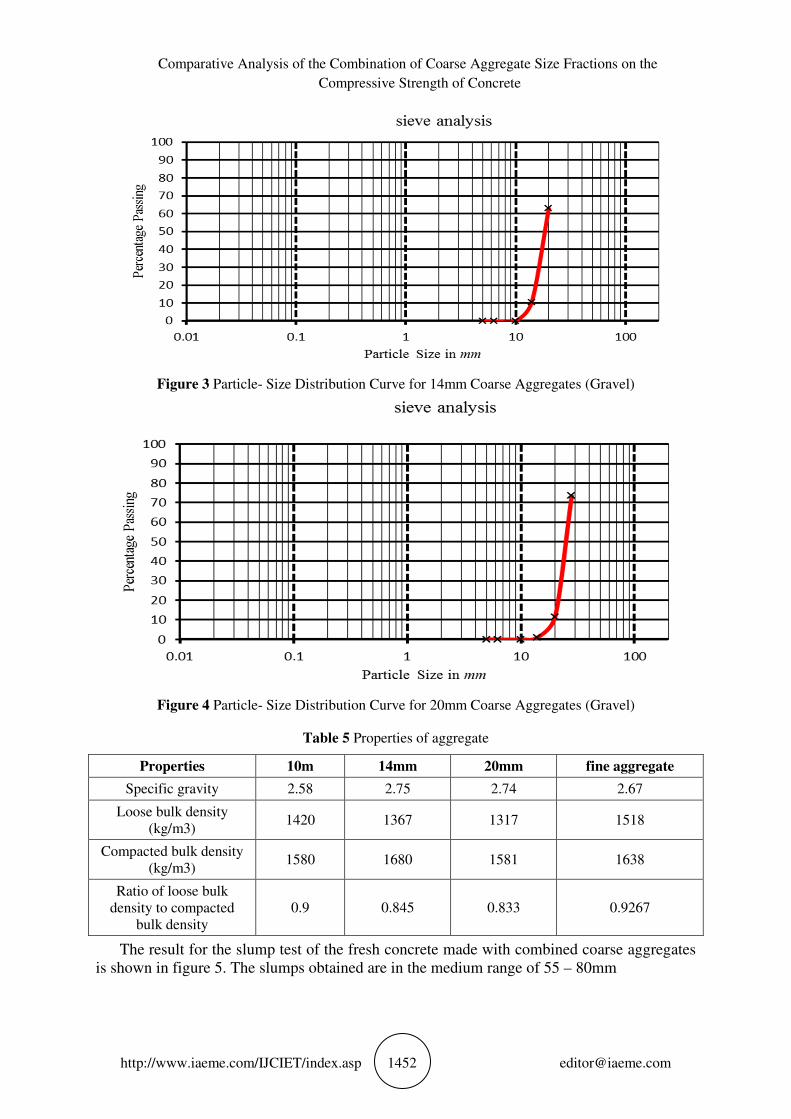
Figure 3 Particle- Size Distribution Curve for 14mm Coarse Aggregates (Gravel)
Figure 4 Particle- Size Distribution Curve for 20mm Coarse Aggregates (Gravel)
Table 5 Properties of aggregate
Properties 10m 14mm 20mm fine aggregate
Specific gravity 2.58 2.75 2.74 2.67
Loose bulk density
(kg/m3) 1420 1367 1317 1518
Compacted bulk density
(kg/m3) 1580 1680 1581 1638
Ratio of loose bulk
density to compacted
bulk density
0.9 0.845 0.833 0.9267
The result for the slump test of the fresh concrete made with combined coarse aggregates
is shown in figure 5. The slumps obtained are in the medium range of 55 – 80mm

Ramonu, John A. L., Ilevbaoje J. O, Olaonipekun O. A , Saleh J. Y and Modupe Abayomi E
http://www.iaeme.com/IJCIET/index.asp 1453 [email protected]
Figure 5 showing the bar chart of slump height against the combined aggregate.
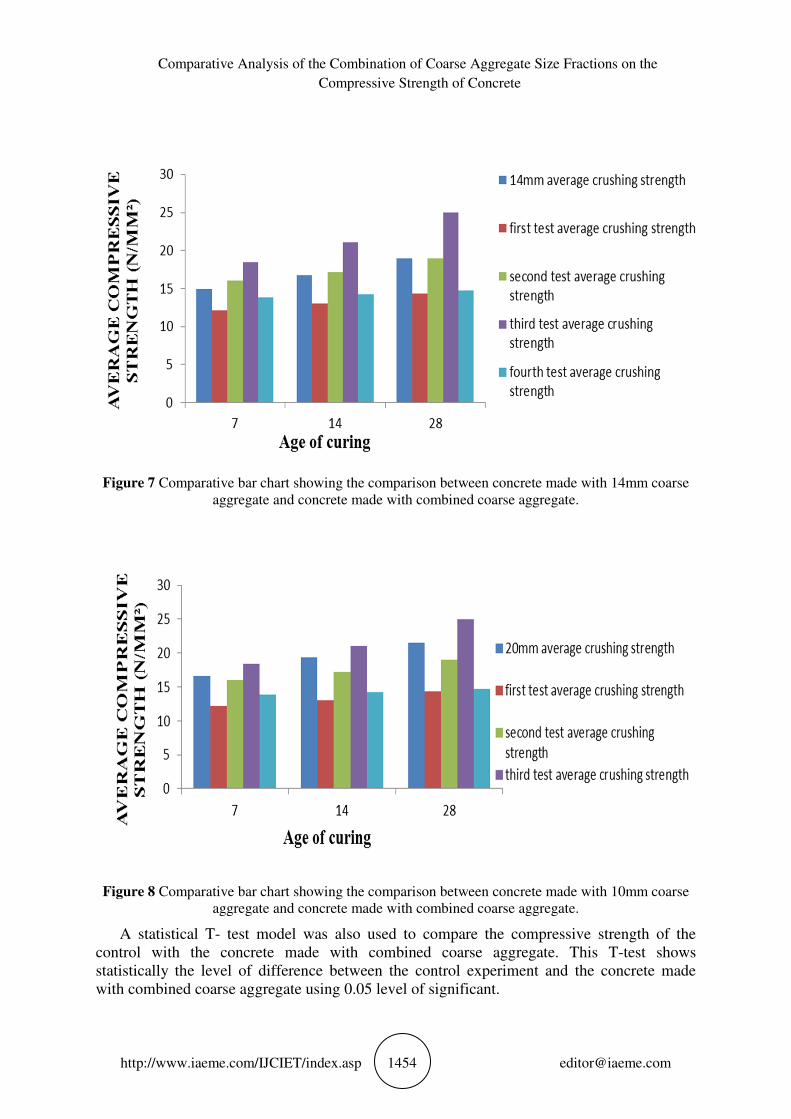
The result for the compressive strength test on the concrete is shown figure 6, 7 and 8.
For the concrete made with combined coarse aggregate, it was observed that the third test of
the combined coarse aggregate which composes of 30% 10mm, 20% 14mm, and 50% 20mm
has the highest compressive strength. The compressive strength for the third test was also
found to be higher than the control experiment.
Figure 6 Comparative bar chart showing the comparison between concrete made with 10mm coarse
aggregate and concrete made with combined coarse aggregate.
Comparative Analysis of the Combination of Coarse Aggregate Size Fractions on the
Compressive Strength of Concrete
http://www.iaeme.com/IJCIET/index.asp 1454 [email protected]
Figure 7 Comparative bar chart showing the comparison between concrete made with 14mm coarse
aggregate and concrete made with combined coarse aggregate.
Figure 8 Comparative bar chart showing the comparison between concrete made with 10mm coarse
aggregate and concrete made with combined coarse aggregate.
A statistical T- test model was also used to compare the compressive strength of the
control with the concrete made with combined coarse aggregate. This T-test shows
statistically the level of difference between the control experiment and the concrete made
with combined coarse aggregate using 0.05 level of significant.

Ramonu, John A. L., Ilevbaoje J. O, Olaonipekun O. A , Saleh J. Y and Modupe Abayomi E
http://www.iaeme.com/IJCIET/index.asp 1455 [email protected]
Table 5 Showing T Test Result.
PAIRED SAMPLE T TEST
T
VALUE DF
P-
VALUE VERDICT
PAIR 1 10MM COARSE AGGREGATE - FIRST TEST 0.26 2 0.819
NULL
HYPOTHESIS
ACCEPTED
PAIR 2 10MM COARSE AGGREGATE - SECOND TEST -4.32 2 0.049
NULL
HYPOTHESIS
REJECTED
PAIR 3 10MM COARSE AGGREGATE - THIRD TEST -12.2 2 0.007
NULL
HYPOTHESIS
REJECTED
PAIR 4 10MM COARSE AGGREGATE - FOURTH TEST -0.76 2 0.524
NULL
HYPOTHESIS
ACCEPTED
PAIR 5 14MM COARSE AGGREGATE - FIRST TEST 12.11 2 0.007
NULL
HYPOTHESIS
REJECTED
PAIR 6 14MM COARSE AGGREGATE - SECOND TEST -0.49 2 0.676
NULL
HYPOTHESIS
ACCEPTED
PAIR 7 14MM COARSE AGGREGATE - THIRD TEST -4.02 2 0.057
NULL
HYPOTHESIS
REJECTED
PAIR 8 14MM COARSE AGGREGATE - FOURTH TEST 4.017 2 0.055
NULL
HYPOTHESIS
ACCEPTED
PAIR 9 20MM COARSE AGGREGATE - FIRST TEST 8.635 2 0.013
NULL
HYPOTHESIS
REJECTED
PAIR 10 20MM COARSE AGGREGATE - SECOND TEST 1.933 2 0.076
NULL
HYPOTHESIS
ACCEPTED
PAIR 11 20MM COARSE AGGREGATE - THIRD TEST -3.42 2 0.076
NULL
HYPOTHESIS
ACCEPTED
PAIR 12 20MM COARSE AGGREGATE - FOURTH TEST 4.508 2 0.046
NULL
HYPOTHESIS
ACCEPTED
T critical from t table = 4.303 for 5% level of significant two tailed test.
DF = degree of freedom
P – Value = Probability value
From the statistical result, controlled concrete made with10mm coarse aggregate paired
with the fourth, fifth, sixth, seventh test of the combined aggregate, only the fifth and sixth
test of the combined coarse aggregate shows that, there is a strong significant difference in
the compressive strength of concrete made with 10mm coarse aggregate size to the one made
with combined coarse aggregate size.
This was drawn from the fact that the P- values obtained for the fifth and sixth test of the
concrete made with combined aggregate was less than 0.05 significant level, also the t value
is greater than the t critical.
Since from the p value obtain, there is a strong significant difference of 1% between the
compressive strength of concrete made with combined coarse aggregate size for the first test
Comparative Analysis of the Combination of Coarse Aggregate Size Fractions on the
Compressive Strength of Concrete
http://www.iaeme.com/IJCIET/index.asp 1456 [email protected]
to the one made with 10mm coarse aggregate size, I can say that, there is a strong difference
between the compressive strength of concrete made with combined coarse aggregate to that
made with 10mm coarse aggregate size.
Also, controlled concrete made with 14mm coarse aggregate paired with the fourth, fifth,
sixth and seventh test of the combined aggregate shows that, only the sixth test shows that,
there is strong significant difference in the compressive strength of concrete made with
14mm coarse aggregate size to the one made with combined coarse aggregate. This verdict
was as a result of the p – value which is less than 0.05 level of significant and also it has a t -
value greater than the critical value obtained from the table.
Finally, controlled concrete made with 20mm coarse aggregate paired with the fourth,
fifth, sixth and seventh test of the combined aggregate shows that, only the fourth test shows
that, there is strong significant difference in the compressive strength of concrete made with
20mm coarse aggregate size to the one made with combined coarse aggregate. From the null
rejected there is a strong significant different between the compressive strength of controlled
coarse aggregate to the concrete made with combined coarse aggregate.
5. CONCLUSION
Based on the result of the experiment carried out, the following conclusions may be drawn;
• The compressive strength of concrete depends upon a number of factor such as,
mix ratio, size of coarse aggregate (i.e. the combination of coarse aggregate size)
and fine aggregate, method of compaction, curing period.
• Combined coarse aggregate has effect on the compressive strength of a normal
concrete. The higher compressive strength was achieved from the third test of the
combined coarse aggregate, followed by the second portion. The first test show
the least strength developed.
• Also, it was observed that, the third portion of the combined coarse aggregate with
composition; 30% of 10mm, 20% of14mm and 50% of 20mm is the highest in
strength when compared with the concrete made with coarse aggregate of
individual sizes which was the control.
REFERENCES
[1] Guru Jawahar, J. Premchand M.M .Sashidhar C, Ramana Reddy & Annie Peter J. (2012).
Effect of Coarse Aggregate Blending on Fresh Properties of Self-Compacting Concrete.
International Journal of Advances in Engineering and Technology (IJAET).volume 3.
[2] BS 1881: Part 108, (1983), Method for Making Test Cubes from Fresh Concrete. British
Standards Institution, Her Majesty Stationery Office, London.
[3] abdullahi M. (2013).Effect of aggregate types on compressive strength of concrete.
International journal of civil and structural engineering Volume2, No 3.
[4] American concrete institute. (ACI) Education Bulletin E1-07, Aggregate for concrete
[5] Applied petrography Group Special Report: SR3 (Draft for Comment June 2010) on
concrete terminology.Part 2
[6] Bhikshma V. and Annie Florence G. V, (2013), Asian journal of civil engineering
(BHRC) vol.14, NO.1 Pages 101-109.
[7] BS 1881: Part 102, (1983), Method for determination of slump. British Standards
Institution, Her Majesty Stationery Office, London.

Ramonu, John A. L., Ilevbaoje J. O, Olaonipekun O. A , Saleh J. Y and Modupe Abayomi E
http://www.iaeme.com/IJCIET/index.asp 1457 [email protected]
[8] Macjinley TJ and Choo. B. S (1990) Reinforced concrete design theory and example,
second edition, London
[9] Neil Jackson and Ravindra K. Dhir. (1996) Civil Engineering Materials Edited. Fifth
Edition.
[10] Neville, A.M and Brooks, J.J (2002), Concrete Technology Longman Publisher,
Singapore.
Related Documents