HAL Id: hal-02460380 https://hal.archives-ouvertes.fr/hal-02460380 Submitted on 30 Jan 2020 HAL is a multi-disciplinary open access archive for the deposit and dissemination of sci- entific research documents, whether they are pub- lished or not. The documents may come from teaching and research institutions in France or abroad, or from public or private research centers. L’archive ouverte pluridisciplinaire HAL, est destinée au dépôt et à la diffusion de documents scientifiques de niveau recherche, publiés ou non, émanant des établissements d’enseignement et de recherche français ou étrangers, des laboratoires publics ou privés. Comparative analysis of synthetic GNSS time series - Bias and precision of velocity estimations Stephane Mazzotti, Aline Déprez, Eric Henrion, Christine Masson, Frédéric Masson, Jean-Luc Menut, Marianne Métois, Jean Matthieu Nocquet, Lucie Rolland, Pierre Sakic, et al. To cite this version: Stephane Mazzotti, Aline Déprez, Eric Henrion, Christine Masson, Frédéric Masson, et al.. Compar- ative analysis of synthetic GNSS time series - Bias and precision of velocity estimations. [Research Report] RESIF. 2020. hal-02460380

Welcome message from author
This document is posted to help you gain knowledge. Please leave a comment to let me know what you think about it! Share it to your friends and learn new things together.
Transcript
HAL Id: hal-02460380https://hal.archives-ouvertes.fr/hal-02460380
Submitted on 30 Jan 2020
HAL is a multi-disciplinary open accessarchive for the deposit and dissemination of sci-entific research documents, whether they are pub-lished or not. The documents may come fromteaching and research institutions in France orabroad, or from public or private research centers.
L’archive ouverte pluridisciplinaire HAL, estdestinée au dépôt et à la diffusion de documentsscientifiques de niveau recherche, publiés ou non,émanant des établissements d’enseignement et derecherche français ou étrangers, des laboratoirespublics ou privés.
Comparative analysis of synthetic GNSS time series -Bias and precision of velocity estimations
Stephane Mazzotti, Aline Déprez, Eric Henrion, Christine Masson, FrédéricMasson, Jean-Luc Menut, Marianne Métois, Jean Matthieu Nocquet, Lucie
Rolland, Pierre Sakic, et al.
To cite this version:Stephane Mazzotti, Aline Déprez, Eric Henrion, Christine Masson, Frédéric Masson, et al.. Compar-ative analysis of synthetic GNSS time series - Bias and precision of velocity estimations. [ResearchReport] RESIF. 2020. �hal-02460380�
RENAG–09/2019–SyntheticGNSStimeseriescomparisonsandvelocityestimations 1
RENAG-RESIFReportComparativeanalysisofsyntheticGNSStimeseries-Biasandprecisionofvelocityestimations

RENAG–09/2019–SyntheticGNSStimeseriescomparisonsandvelocityestimations 2
RENAG–09/2019–SyntheticGNSStimeseriescomparisonsandvelocityestimations 3
ComparativeanalysisofsyntheticGNSStimeseries-BiasandprecisionofvelocityestimationsStephaneMazzotti1,AlineDeprez2,EricHenrion3,ChristineMasson1,FrédéricMasson3,Jean-LucMenut4,MarianneMétois5,Jean-MatthieuNocquet4,6,LucieRolland4,PierreSakic7,AnneSocquet2,AlvaroSantamaría-Gómez8,PierreValty9,MathildeVergnole4,PhilippeVernant1
1.GéosciencesMontpellier(GM),UMR5243,UniversitédeMontpellier,CNRS.PlaceE.Bataillon,34095Montpelliercedex,France.
2.InstitutdesSciencesdelaTerre(ISTerre),UGA,CNRS,USMB,IRD,IFSTTAR.38058GrenobleCedex9,France.
3.InstitutdePhysiqueduGlobe,UMR7516,UniversitédeStrasbourg/EOST,CNRS.5rueRenéDescartes,F-67084StrasbourgCedex,France.
4.Géoazur,UniversitéCôted'Azur,CNRS,ObservatoiredelaCôted'Azur,IRD.250rueAlbertEinstein,SophiaAntipolis,06560Valbonne,France.
5.LaboratoiredeGéologiedeLyon(LGTPE),UniversitéClaudeBernardLyon1,bat.Géode,69100Villeurbane,France.
6.InstitutdePhysiqueduGlobeParis.1rueJussieu,75238Pariscedex05,France.
7.Helmholtz-Zentrum,GeoForschungsZentrum.Telegrafenberg(GFZ),D-14473Potsdam,Germany.
8.GET,UniversitédeToulouse,CNES,CNRS,IRD,UPS.Toulouse,France.
9.Servicedegéodésieetnivellement,IGN.73,Av.deParis,94160SaintMande,France.
ThisreportsummarizestheanalysescarriedoutbetweenFebruary2018andJune2019withintheRENAGconsortium(RéseauNationalGNSS,http://renag.resif.fr),partoftheRESIFresearchinfrastructure (FrenchSeismologicandGeodeticNetwork,https://www.resif.fr).TheprojectwasimplementedasaninternalexercisedesignedtoassessthevariabilityinGNSStimeseriesanalysesandderivedvelocitiesfortheRENAG-RESIFstations.
Synthetictimeseriescreations,statisticalanalysesofsolutions,andfiguresweredoneusingtheRsoftware(RCoreTeam,2016).
RENAG–09/2019–SyntheticGNSStimeseriescomparisonsandvelocityestimations 4
Summary105synthetictimeseriesreplicatingGNSS3DpositionseriesareanalyzedindependentlybyninedifferentgroupswithintheRENAGconsortiuminordertocharacterizethevariabilityin estimations of long-term velocities. The main objective is not a detailed study of theparametersandsourcescontrollingvelocityvariations,butsimply toestablish first-orderconclusions regarding theuncertaintiesonGNSSvelocityestimationsasa functionof thedifferentanalysismethodsandsoftware.Becausethetruevelocitiesareknown,ourresultsarepresentedintermsofvelocitybiases(i.e.deviationsoftheestimatedvelocitiesrelativeto the expected values). Statistics on these biases can then be used as indicators of thepotentialprecisionofactualGNSSvelocities.
Tofirstorder,theninemethodsandsoftwareoftimeseriesanalysisprovidehorizontal(resp.vertical)velocityestimationsatprecisionsbetterthan1.0mm/a(resp.2.0mm/a).Noneofthetestedmethodsorsoftwareclearlystandsoutassignificantlybetterorworsethantheothers.However, a group of four solutions (including the unweighted average of all ninesolutions) provides systematically better results than the others. They are based on astandardtimeseriesanalysisusingaleast-squareinversionofaparametricmodel(velocity,seasonalterms,offsets)witheitherautomaticandmanualoffsetdetectionmethods.
FortimeserieswithnoiseanddurationcharacteristicscorrespondingtoclassicalGNSSdata(e.g.,RENAG-RESIFstations),thevelocitybiases(andthuspotentialGNSSvelocityprecision)arecharacterizedbythefollowingstatistics:
• Medians ca. 0.1 mm/a (horizontal components) and 0.1–0.3 mm/a (verticalcomponent).
• 95th percentiles ca. 0.2–0.7 mm/a (horizontal components) and 0.5–2.0 mm/a(verticalcomponent).
• RMS (root-mean-square) ca. 0.1–0.3 mm/a (horizontal components) and 0.3–0.9mm/a(verticalcomponent).
Inadditiontothevariabilityofvelocityestimationsasafunctionoftheanalysismethods,first order information can be derived regarding the solution combination and velocityuncertainties:
• Theunweightedaverageofallnineanalysesyieldsresultssystematicallyintheuppertierofallindividualsolutions.
• Formal velocityuncertainties (standard errors) calculatedon thebasis of colored-noisemodelsarestaticallyrepresentativeofthevelocitybiases.
• In contrast, formal velocity uncertainties (standard errors) calculated using othermethods (whitenoiseorstatisticalvariance)arenot representativeof thevelocitybiases(resp.significantlytoolowortoohigh).
RENAG–09/2019–SyntheticGNSStimeseriescomparisonsandvelocityestimations 5
1)SyntheticdatadescriptionSyntheticpositiontimeseriesaregeneratedforasetof35stationsgroupedin5categoriesrepresenting the spectrum of actual GNSS series characteristics (noise level, number ofoffsets,completeness).Fromthehighesttothelowestquality,thefivegroupsare:“SC”(SuperClean, stations SC01–SC07); “RC” (Rather Clean, stations RC01–RC07); “MR” (Mid Range,stationsMR01–MR07);“RU”(RatherUgly,stationsRU01–RU07);“SU”(SuperUgly,stationsSU01–SU07).Thelong-termvelocities(cf.eq.1)rangebetween-2and+2mm/a,withthemajorityca.-0.5–+0.5mm/a,inordertorepresenttherelativevelocitiesbetweenstationsinFranceandWesternEurope(i.e., intraplatevelocitiesinalocalreferenceframesuchasthosemeasuredbyRENAG-RESIFstations).
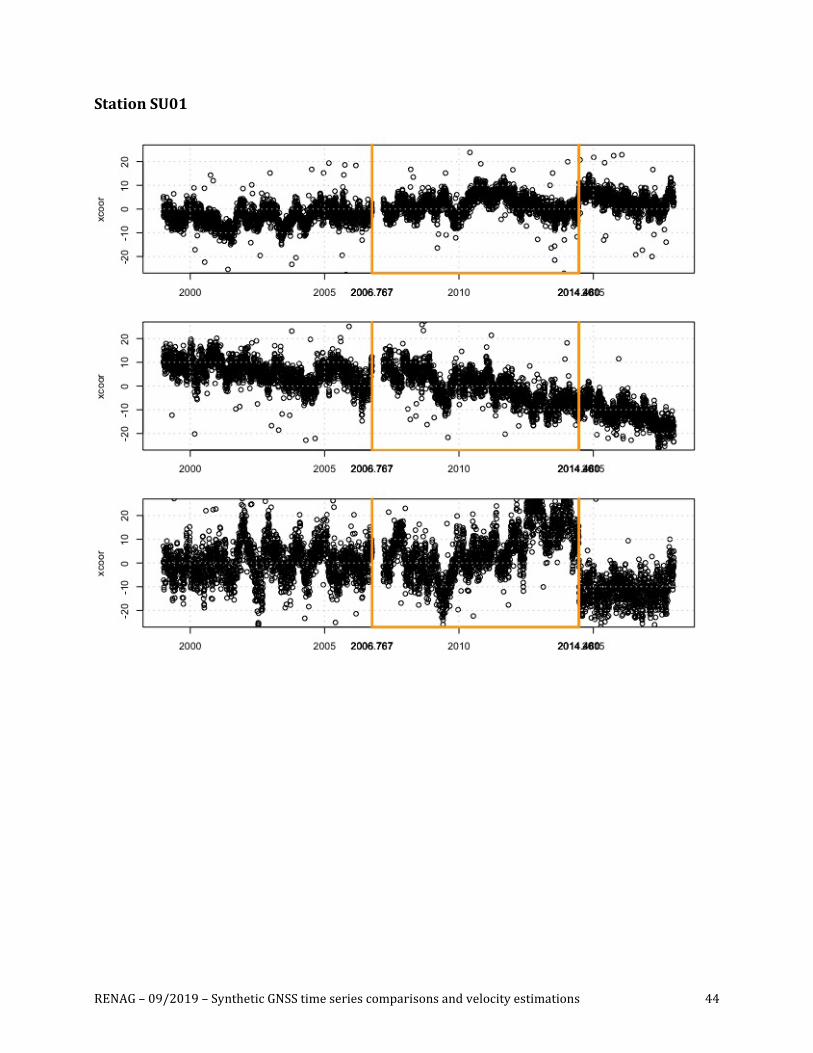
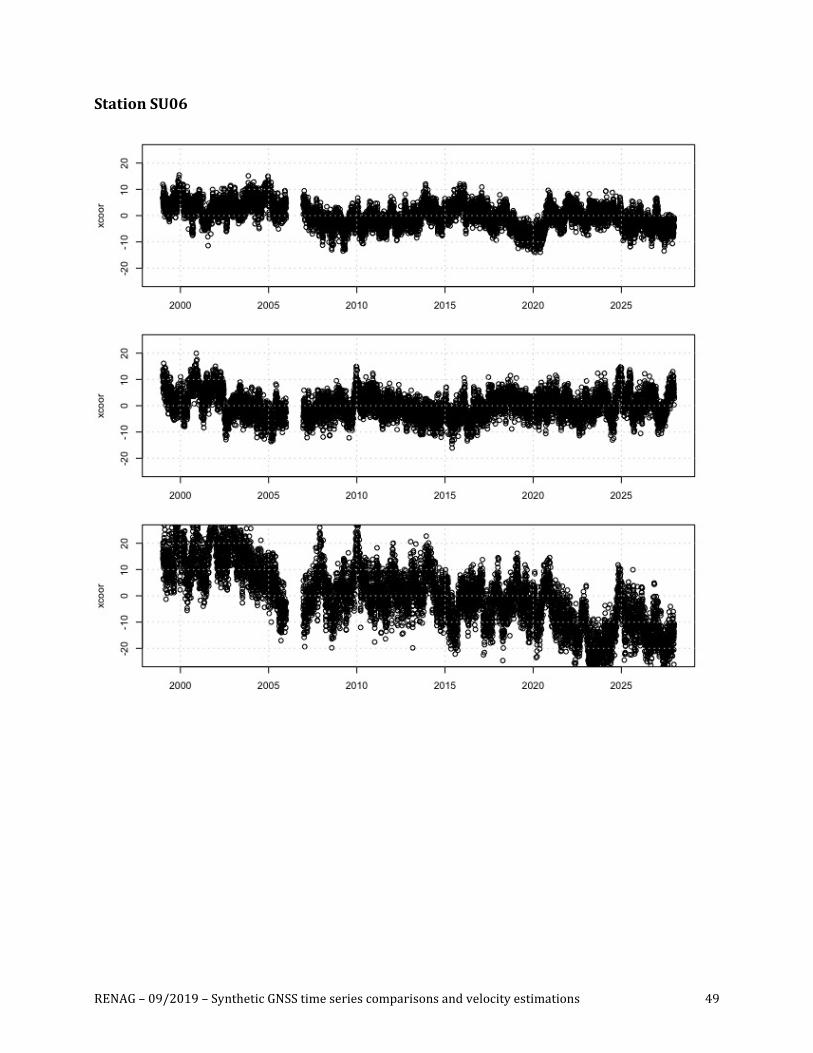
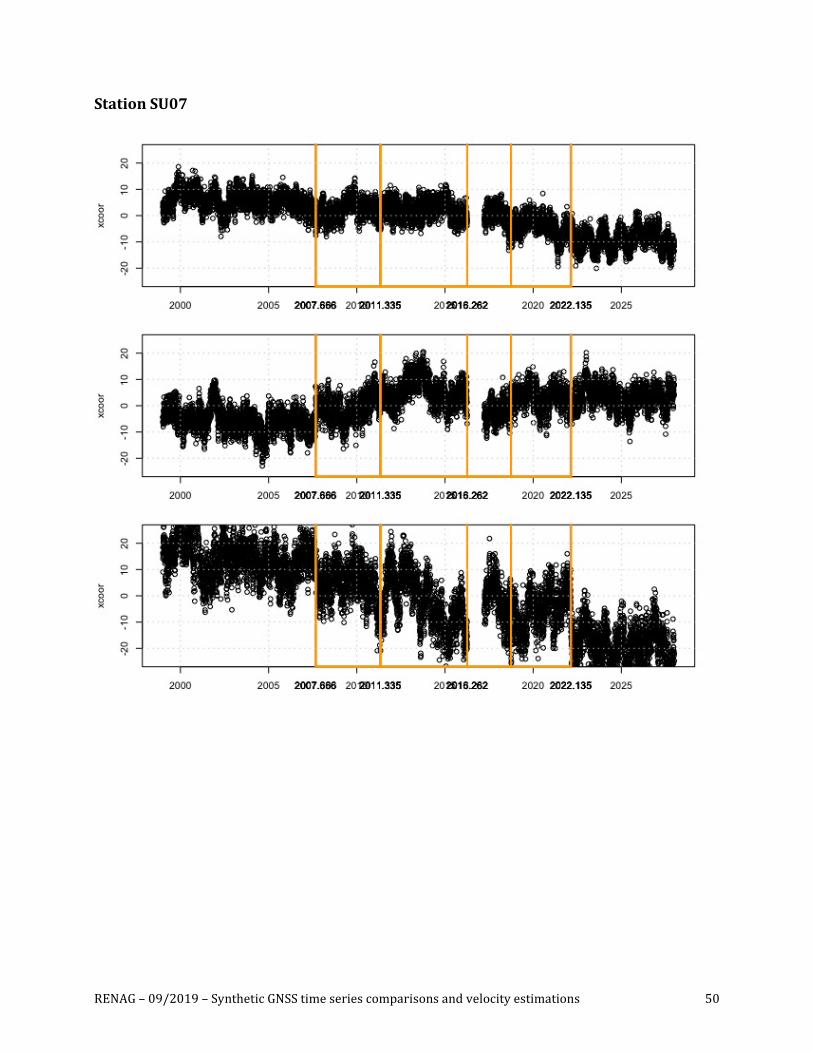
NB: Stations in the SU group correspond to rare cases of extreme noise levels and are notrepresentative of standard GNSS series used in geodetic studies. They are provided forinformationbutarenotincludedintheresultsandconclusions.
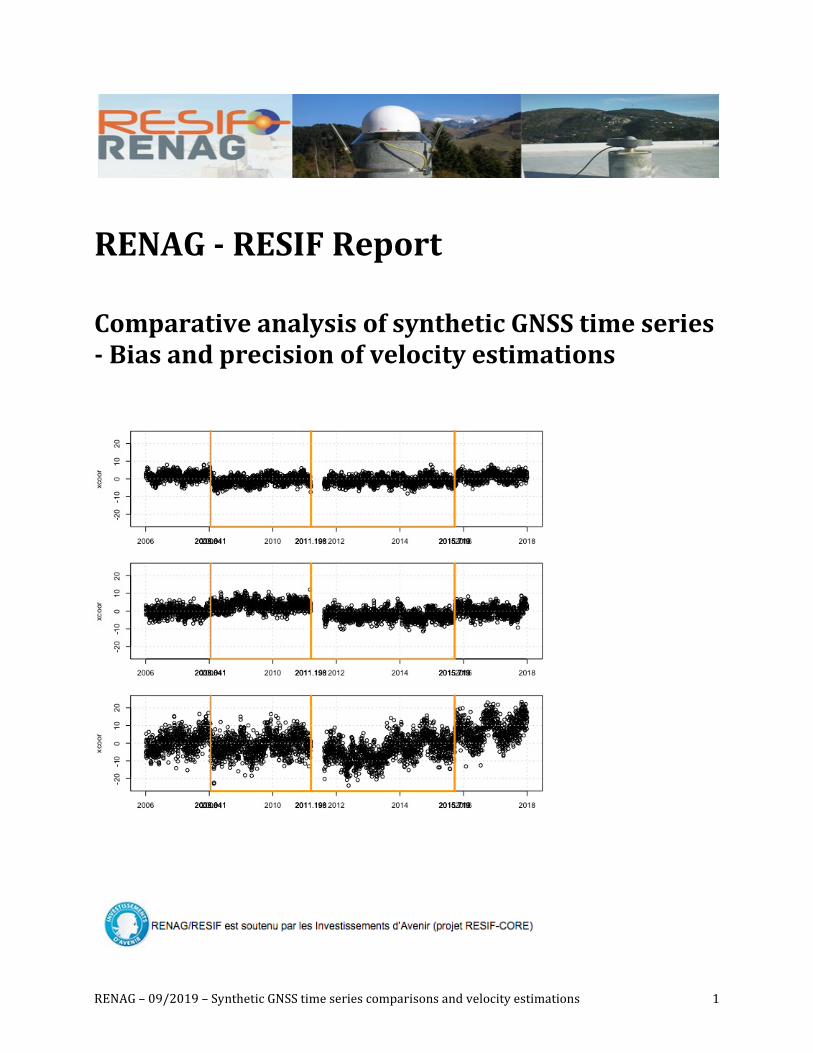
Foreachstation,threedailypositiontimeseriesx(t)aregeneratedtorepresenttheNorth,EastandUpcomponents:
𝑥(𝑡) = 𝑥& + 𝑣𝑡 + 𝐴*𝑠𝑖𝑛(𝜔*𝑡 + 𝜙*) + 𝐴0𝑠𝑖𝑛(𝜔0𝑡 + 𝜙0) + 𝐵2𝐻(𝑡, 𝑇2) + 𝜀(𝑡, 𝜅, 𝐶) (1)
withx0:interceptofthepositionseries;v:linearvelocity;𝜔*and𝜔0:periodsoftheannualandsemi-annualsignals;A1andA2:amplitudesoftheannualandsemi-annualsignals;BiandTi:amplitudeanddateoftheithoffsetexpressedasaHeavisidefunction:
𝐻(𝑡, 𝑇2) = 0, 𝑡 < 𝑇2; 𝐻(𝑡, 𝑇2) = 1, 𝑡 ≥ 𝑇2 (2)
TheoffsetdatesTi are identical for the three componentsbut theamplitudesBi canvarybetween each component. A random daily dispersion 𝜀(𝑡, 𝜅, 𝐶) is added to each seriesfollowing a colored-noise model (Kasdin, 1995), with 𝜅 and C the spectral index andamplitude(expressedasthedailyRMS_Root-Mean-Square)ofthedispersion.Theannualandsemi-annualphases(𝜙*and𝜙0)arerandomlygeneratedforeachseries.TheparametervaluesaregiveninTable1.
Foreachqualitygroup,syntheticseriesareproducedfordurationsof10–12,19and29years(resp.,2or3stations,2or3stations,2stations).ThesedurationsarechosentorepresentstandardGNSSdatausedingeodynamicstudies(10–20years),plusprolongeddataallowingtestingtheimpactonvelocityestimationsofanextra10yearsofdata.
ThemethodtodetectandmanageoffsetsisacriticalelementofGNSStimeseriesanalysisand velocity estimation (Gazeau et al., 2013; Masson et al., 2019). Our objective is not adetailedstudyofthiseffectbutonlytoprovidesetsofresultsrepresentativeofactualGNSSdata. In order to include offset management as a study parameter, each station isaccompaniedbyapseudo“logfile”comprisingdatesof“equipmentchanges”.Thesedatescorrespondpartly toactualoffsets imposed in theseriesandpartly to “falsealarms” (i.e.,dateswithnoimposedoffset).Inaddition,someoftheimposedoffsetsarenotincludedinthelogfiles.
RENAG–09/2019–SyntheticGNSStimeseriescomparisonsandvelocityestimations 6
The position time series for the 35 stations are shown in Appendix 1. The full datasetcomprises,foreachstation,textfileswithpositionsanddates,pseudologs,trueparametervalues(velocities,offsetdatesandamplitudes).Itisavailableinthearchiveaccompanyingthisreportanduponrequesttotheauthors.
NB: The true parameter values were not transmitted to the analysis groups during theprocessingphase.
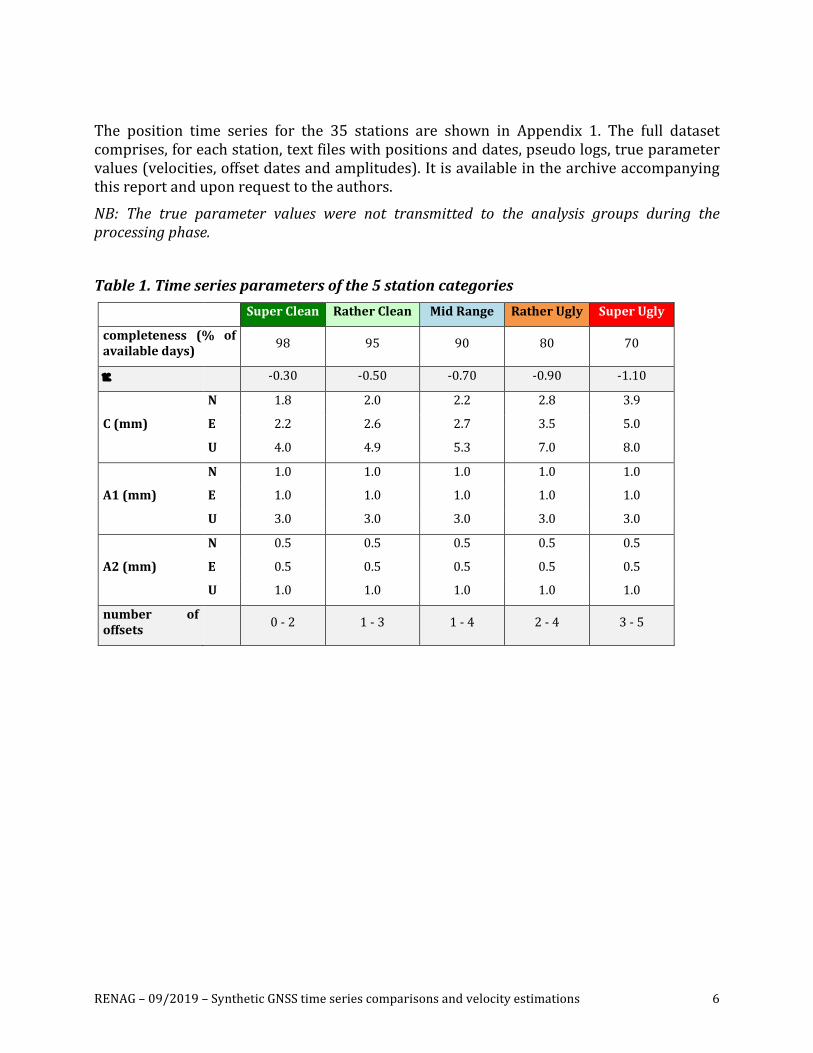
Table1.Timeseriesparametersofthe5stationcategories SuperClean RatherClean MidRange RatherUgly SuperUgly
completeness (% ofavailabledays) 98 95 90 80 70
k -0.30 -0.50 -0.70 -0.90 -1.10
N 1.8 2.0 2.2 2.8 3.9
C(mm) E 2.2 2.6 2.7 3.5 5.0
U 4.0 4.9 5.3 7.0 8.0
N 1.0 1.0 1.0 1.0 1.0
A1(mm) E 1.0 1.0 1.0 1.0 1.0
U 3.0 3.0 3.0 3.0 3.0
N 0.5 0.5 0.5 0.5 0.5
A2(mm) E 0.5 0.5 0.5 0.5 0.5
U 1.0 1.0 1.0 1.0 1.0
number ofoffsets 0-2 1-3 1-4 2-4 3-5
RENAG–09/2019–SyntheticGNSStimeseriescomparisonsandvelocityestimations 7
2)TimeseriesanalysismethodsandsoftwareThesynthetictimeseriesareanalyzedindependentlybydifferentlaboratoriesandresearchdepartmentsoftheRENAGconsortiumusingvarioussoftwareandmethods,yieldingnineindependentsolutions:
• S1- MIDAS software (Blewitt et al., 2016). Automatic velocity and uncertaintyestimationsbased statistical analysisofposition couplesoverone-year spread.Nooffsetdetectionorestimation.Dataanalysis:A.Deprez,A.Socquet,ISTerre.1
• S2- homemade software (MATLAB based). Least-square inversion of parametricmodel(eq.1),uncertaintiescomputedusingCATSsoftware(Williams,2008).Offsetsimposedbasedonmanualdetection.Dataanalysis:E.Henrion,EOST.
• S3-homemadesoftware(Rbased).Least-squareinversionofparametricmodel(eq.1),uncertaintiescomputedwithcolored-noiseapproximation.Automaticdetection+manualverificationofoffsets.Dataanalysis:C.Masson,GM.
• S4-softwaredevelopedatINGV,Roma.Least-squareinversionofparametricmodel(eq. 1), uncertainties computed using CATS software (Williams, 2008). Manualdetectionofoffsets.Dataanalysis:M.Métois,LGLTPE.
• S5- Pyacs software (Tran, 2013; Nocquet, 2018). Least-square inversion ofparametricmodel(eq.1),uncertaintiescomputedwithwhite-noiseapproximation.Automaticdetectionandrepairofdiscontinuities(outliersandoffsets)withF-ratiotest for thesignificance (99%confidence levelminimumfor robustdetection)andreprocessing after manual verification of offsets. Data analysis: J.-L. Menut, J.-M.Nocquet,L.Rolland,M.Vergnolle,Geoazur.2
• S6-HECTORsoftware(Bosetal.,2013)andGeodeZYXToolbox(Sakicetal.,2019).MaximumLikelihood estimation of velocities, annual and semi-annual parametersusing white-and power-law noise. Offsets based on logsheet information + visualdetectionwithamanual"pointandclick".Dataanalysis:P.Sakic,GFZ.
• S7-SARIsoftware(Santamaría-Gómez,2019.).Least-squareinversionofparametricmodel (eq. 1), uncertainties computed using white-noise approximation. Manualdetectionofoffsets.Dataanalysis:A.Santamaria,GET.
• S8- GeoTS software (Gazeaux et al., in prep). Joint estimation (least-square) ofvelocity, annual and semi-annual, andoffsetswithwhiteandautoregressivenoise.OffsetsaredetectedusingHotellingstatistics.Offsetdatesandnoisecharacteristicsarecommontothe3components.Dataanalysis:P.Valty,J.Gazeau,IGN.
• S9- TSView software (MIT, http://www-gpsg.mit.edu/~tah/GGMatlab/#_tsview).Least-square inversion of parametricmodel (eq. 1), uncertainties computed usingcolored-noiseapproximation.Manualdetectionofoffsets.Dataanalysis:P.Vernant,GM.
1SolutionS2isusedtocomputevelocityproductsbytheEPOSGNSSprocessingcenterlocatedatISTerre.https://www.epos-ip.org/tcs/gnss-data-and-products/news/epos-gnss-data-and-products-presents-data-analysis-double-difference2Exceptforthelaststep(reprocessingaftermanualvisualization),SolutionS5isusedbytheRENAGDataCentertoproduceoperationalpositiontimeseriesfortheRENAG-RESIFstations.http://renag.resif.fr/ts/charts/stop/
RENAG–09/2019–SyntheticGNSStimeseriescomparisonsandvelocityestimations 8
Inaddition,theaverageofallninesolutionsiscomputedwithequalweightingofallsolutions:
• S10-unweightedaverage.
Methodsummary
• S1:statisticsonvelocitiesoverone-yearspread;• S2,S4,S7andS9:least-squareinversionofaparametricmodelwithoffsetsbasedon
logsfilesormanagedmanually;• S3, S5 and S8:least-square inversion of a parametricmodelwith automatic offset
detection(plusmanualverification);• S6:MaximumLikelihoodEstimationwithoffsetdetection(plusmanualverification
basedonlogfiles).
Velocityuncertaintysummary
• S1:statisticsonvelocities;• S2andS4:CATSfullcolored-noiseestimation;• S3,S6andS8:colored-noiseapproximation;• S5andS7:white-noiseapproximation;• S9:colored-noiseapproximationwithautoregressivemodel.
RENAG–09/2019–SyntheticGNSStimeseriescomparisonsandvelocityestimations 9
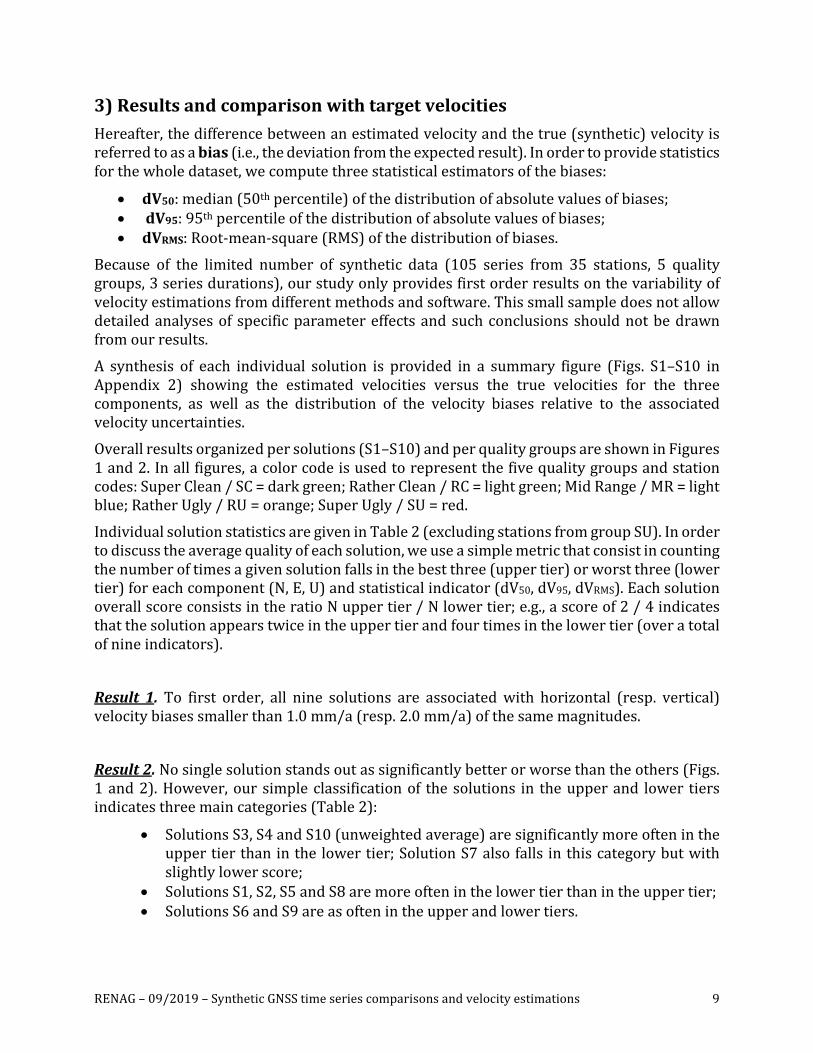
3)ResultsandcomparisonwithtargetvelocitiesHereafter,thedifferencebetweenanestimatedvelocityandthetrue(synthetic)velocityisreferredtoasabias(i.e.,thedeviationfromtheexpectedresult).Inordertoprovidestatisticsforthewholedataset,wecomputethreestatisticalestimatorsofthebiases:
• dV50:median(50thpercentile)ofthedistributionofabsolutevaluesofbiases;• dV95:95thpercentileofthedistributionofabsolutevaluesofbiases;• dVRMS:Root-mean-square(RMS)ofthedistributionofbiases.
Because of the limited number of synthetic data (105 series from 35 stations, 5 qualitygroups,3seriesdurations),ourstudyonlyprovidesfirstorderresultsonthevariabilityofvelocityestimationsfromdifferentmethodsandsoftware.Thissmallsampledoesnotallowdetailedanalysesof specificparametereffectsandsuchconclusions shouldnotbedrawnfromourresults.
A synthesis of each individual solution is provided in a summary figure (Figs. S1–S10 inAppendix 2) showing the estimated velocities versus the true velocities for the threecomponents, as well as the distribution of the velocity biases relative to the associatedvelocityuncertainties.
Overallresultsorganizedpersolutions(S1–S10)andperqualitygroupsareshowninFigures1and2.Inallfigures,acolorcodeisusedtorepresentthefivequalitygroupsandstationcodes:SuperClean/SC=darkgreen;RatherClean/RC=lightgreen;MidRange/MR=lightblue;RatherUgly/RU=orange;SuperUgly/SU=red.
IndividualsolutionstatisticsaregiveninTable2(excludingstationsfromgroupSU).Inordertodiscusstheaveragequalityofeachsolution,weuseasimplemetricthatconsistincountingthenumberoftimesagivensolutionfallsinthebestthree(uppertier)orworstthree(lowertier)foreachcomponent(N,E,U)andstatisticalindicator(dV50,dV95,dVRMS).EachsolutionoverallscoreconsistsintheratioNuppertier/Nlowertier;e.g.,ascoreof2/4indicatesthatthesolutionappearstwiceintheuppertierandfourtimesinthelowertier(overatotalofnineindicators).
Result 1. To first order, all nine solutions are associatedwith horizontal (resp. vertical)velocitybiasessmallerthan1.0mm/a(resp.2.0mm/a)ofthesamemagnitudes.
Result2.Nosinglesolutionstandsoutassignificantlybetterorworsethantheothers(Figs.1and2).However,oursimpleclassificationof thesolutions in theupperand lower tiersindicatesthreemaincategories(Table2):
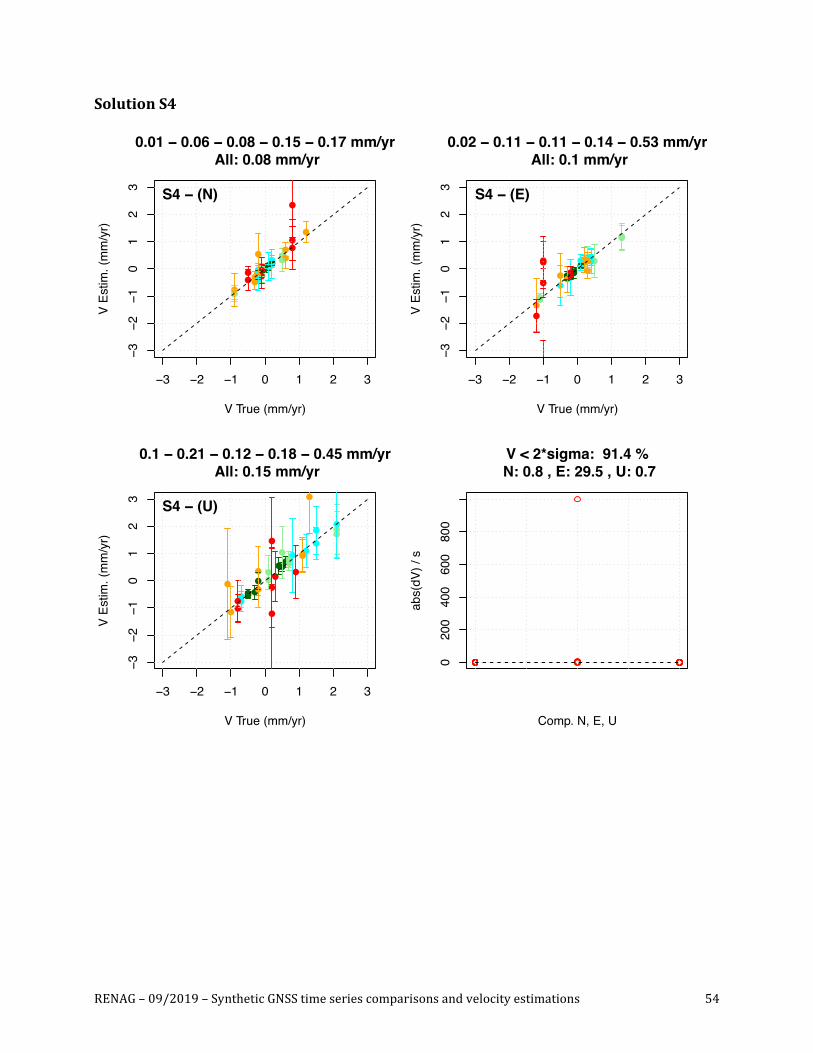
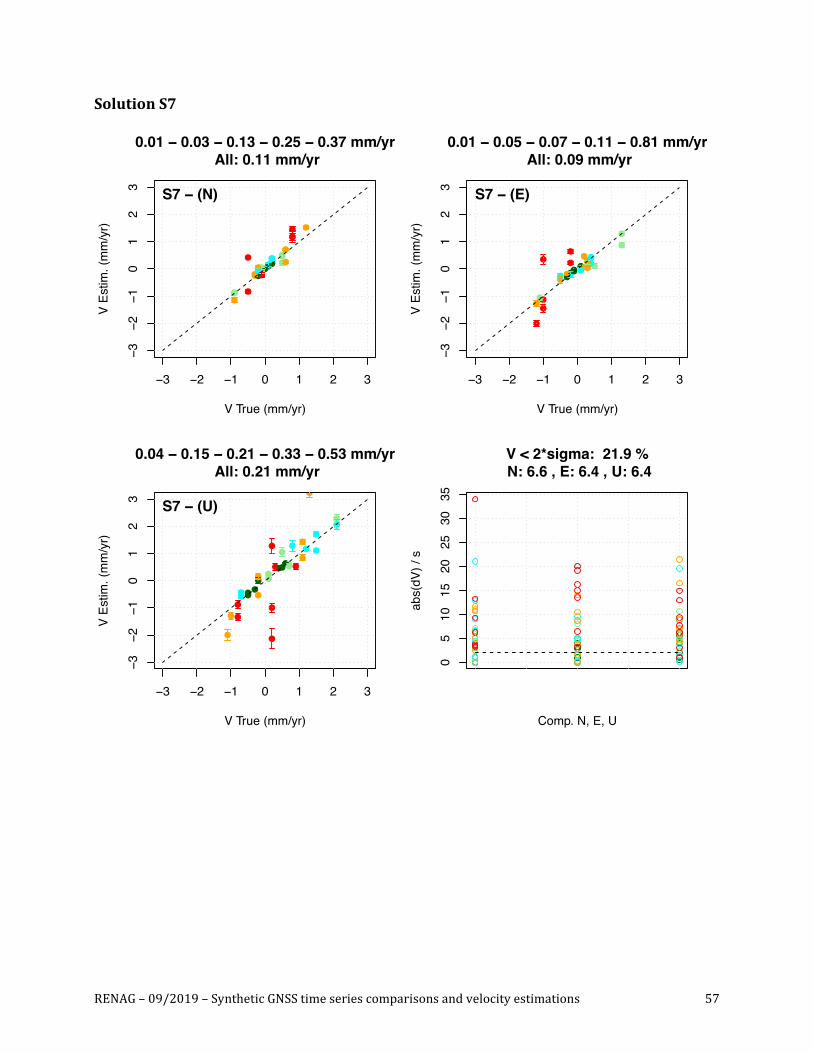
• SolutionsS3,S4andS10(unweightedaverage)aresignificantlymoreoftenintheuppertierthaninthelowertier;SolutionS7alsofalls inthiscategorybutwithslightlylowerscore;
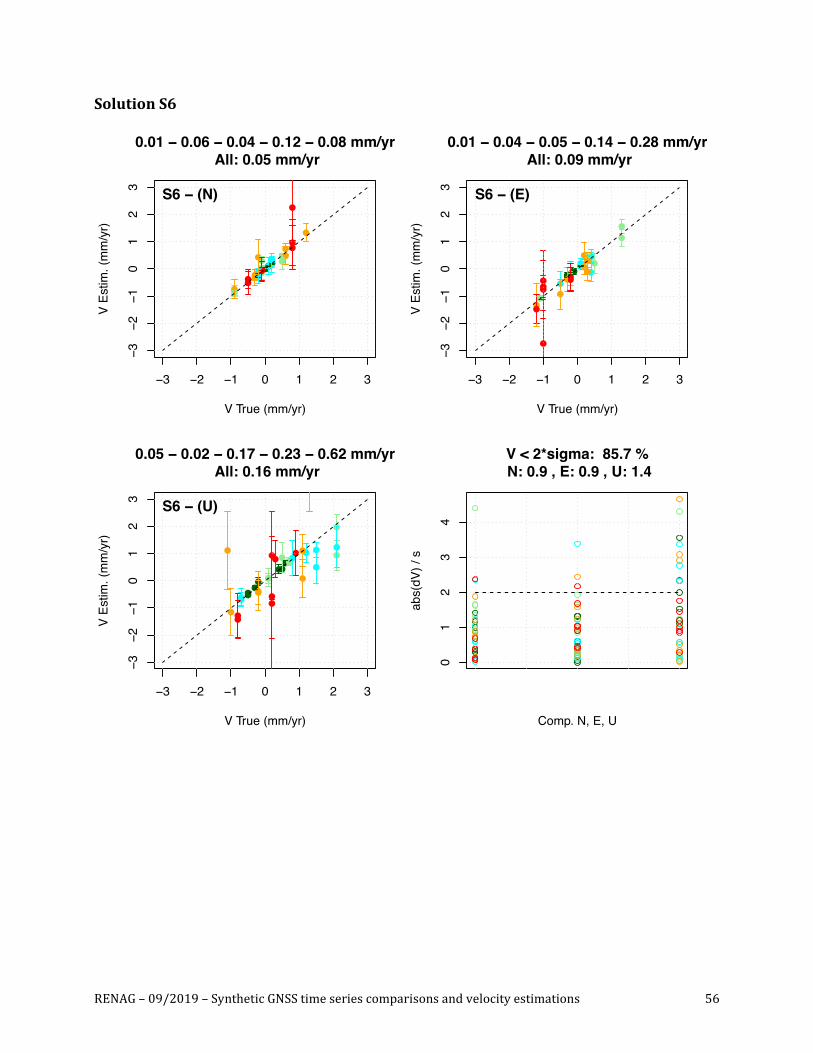
• SolutionsS1,S2,S5andS8aremoreofteninthelowertierthanintheuppertier;• SolutionsS6andS9areasoftenintheupperandlowertiers.
RENAG–09/2019–SyntheticGNSStimeseriescomparisonsandvelocityestimations 10
Result3.VelocitybiasesforstationsfromgroupsSC–RU,representativeofstandardGNSSdata,varybetweenca.0.1and2.0mm/adependingonthecomponent(N,E,U)andindicator(Table2).Specifically:
• Medianbiases(dV50)areca.0.1mm/a(horizontalcomponents)and0.1–0.3mm/a(verticalcomponent).
• dV50=0.04–0.11mm/aNorthcomp.;• dV50=0.04–0.15mm/aEastcomp.;• dV50=0.07–0.36mm/aUpcomp.
• The95thpercentiles(dV95)showalargevariabilitybetweensolutions,ca.0.2–0.7
mm/a(horizontalcomponents)and0.5–2.0mm/a(verticalcomponent).• dV95=0.23–0.53mm/aNorthcomp.;• dV95=0.24–0.71mm/aEastcomp.;• dV95=0.43–2.03mm/aUpcomp.
• RMSofbiases(dVRMS)arepositionedbetweenthemedianand95thstatistics,ca.
0.1–0.3mm/a(horizontalcomponents)and0.3–0.9mm/a(verticalcomponent).• dVRMS=0.14–0.24mm/aNorthcomp.;• dVRMS=0.13–0.28mm/aEastcomp.;• dVRMS=0.28–0.96mm/aUpcomp.
ThedifferencesbetweentheNorthandEastcomponentsinallindicatorsreflectthehighernoiseamplitude(dailydispersion)ofthelatter(cf.Table1).
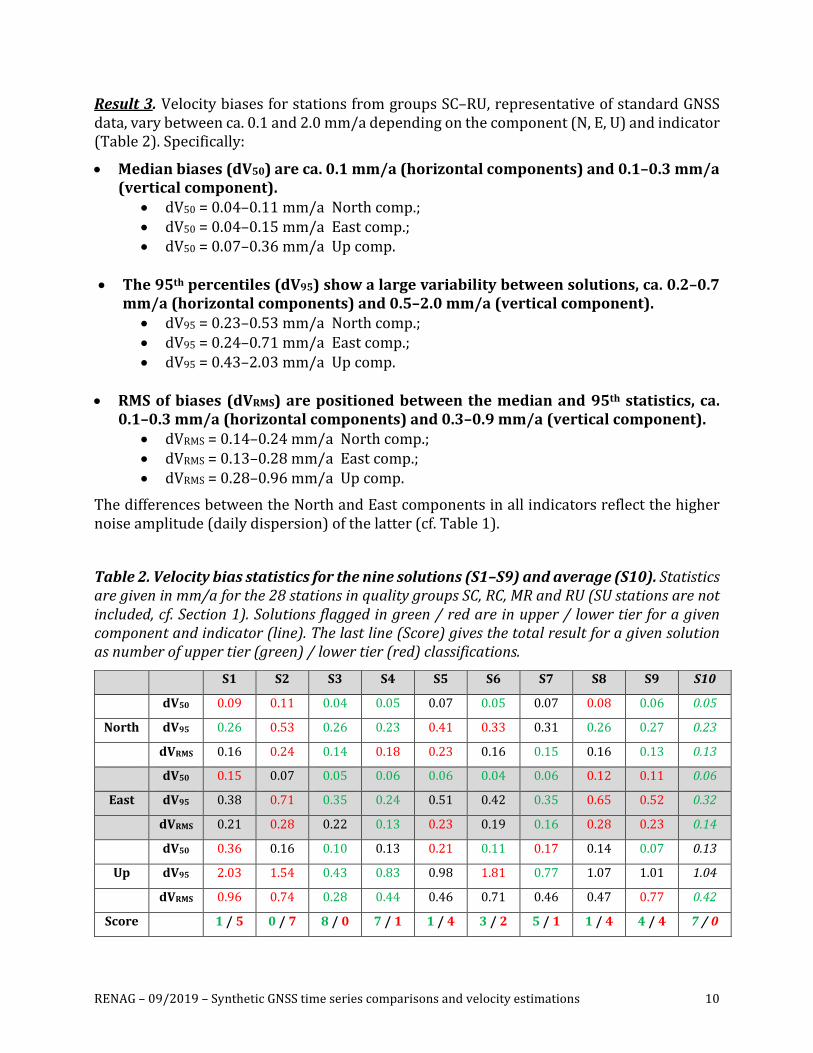
Table2.Velocitybiasstatisticsfortheninesolutions(S1–S9)andaverage(S10).Statisticsaregiveninmm/aforthe28stationsinqualitygroupsSC,RC,MRandRU(SUstationsarenotincluded,cf.Section1).Solutionsflaggedingreen/redareinupper/lowertierforagivencomponentandindicator(line).Thelastline(Score)givesthetotalresultforagivensolutionasnumberofuppertier(green)/lowertier(red)classifications.
S1 S2 S3 S4 S5 S6 S7 S8 S9 S10
dV50 0.09 0.11 0.04 0.05 0.07 0.05 0.07 0.08 0.06 0.05
North dV95 0.26 0.53 0.26 0.23 0.41 0.33 0.31 0.26 0.27 0.23
dVRMS 0.16 0.24 0.14 0.18 0.23 0.16 0.15 0.16 0.13 0.13
dV50 0.15 0.07 0.05 0.06 0.06 0.04 0.06 0.12 0.11 0.06
East dV95 0.38 0.71 0.35 0.24 0.51 0.42 0.35 0.65 0.52 0.32
dVRMS 0.21 0.28 0.22 0.13 0.23 0.19 0.16 0.28 0.23 0.14
dV50 0.36 0.16 0.10 0.13 0.21 0.11 0.17 0.14 0.07 0.13
Up dV95 2.03 1.54 0.43 0.83 0.98 1.81 0.77 1.07 1.01 1.04
dVRMS 0.96 0.74 0.28 0.44 0.46 0.71 0.46 0.47 0.77 0.42
Score 1/5 0/7 8/0 7/1 1/4 3/2 5/1 1/4 4/4 7/0
RENAG–09/2019–SyntheticGNSStimeseriescomparisonsandvelocityestimations 11
Result4.Thevertical(Up)componentisassociatedwithvelocitybiasesca.2–5timeslargerthanthehorizontalcomponentsandwithastrongervariabilitybetweensolutions(Table2,Figs.1and2).Thiseffectislikelyduetothelargernoiseamplitudecoupledwithlargeroffsetamplitudes compared to the horizontal components. As a result, the various offsetmanagementmethodsyieldahighervariabilityinthevelocityestimations.
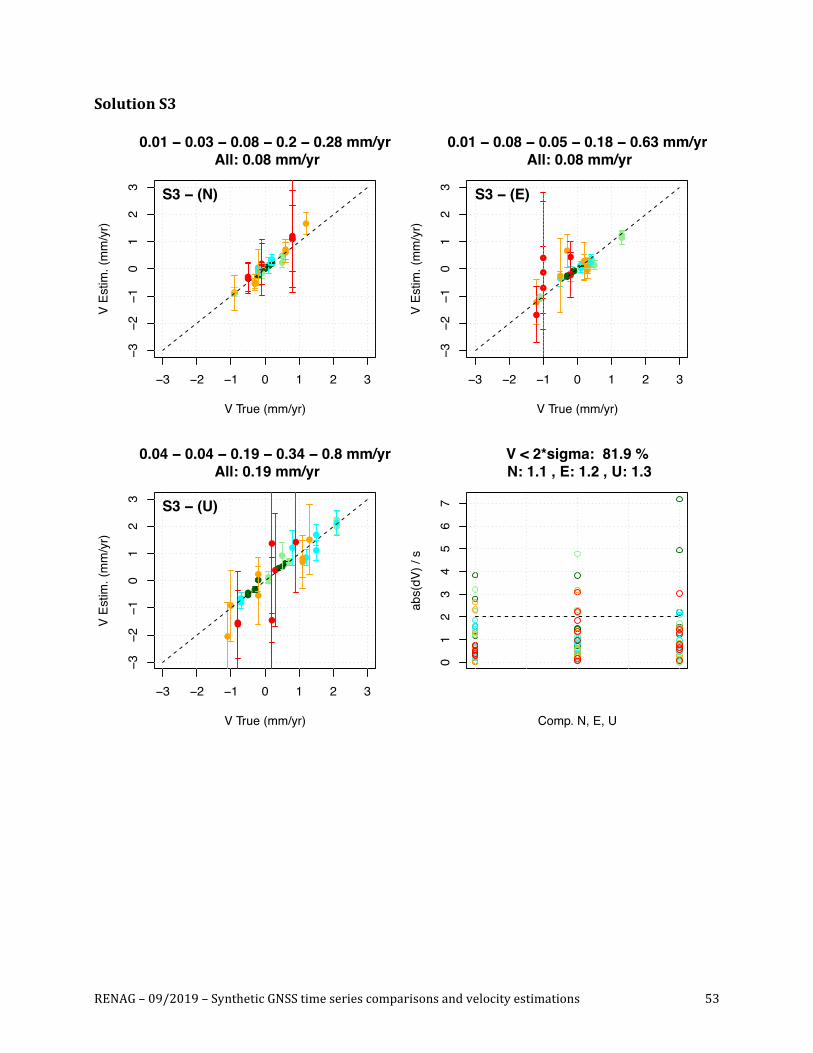
Inparticular,solutionS1(MIDASmethod)standsoutasslightlyworsethantheothersonthethree indicators for theverticalcomponent(Table2).Thismightpointoutaneedforbettertuningofthemethodforserieswithhighnoise/largeoffsets.Incontrast,solutionS3(automaticoffsetdetection)providesbetterresultsthantheothersforthedV95anddVRMSof the vertical component, suggesting that automatic offset detection may be a betteralternativeinthesecases(comparedtomanualdetection).
Result5.Theunweightedaverageofallninesolutions(S10)yieldsresultssystematicallyintheuppertierofallindividualsolutions(Table2,Figs.1and2).
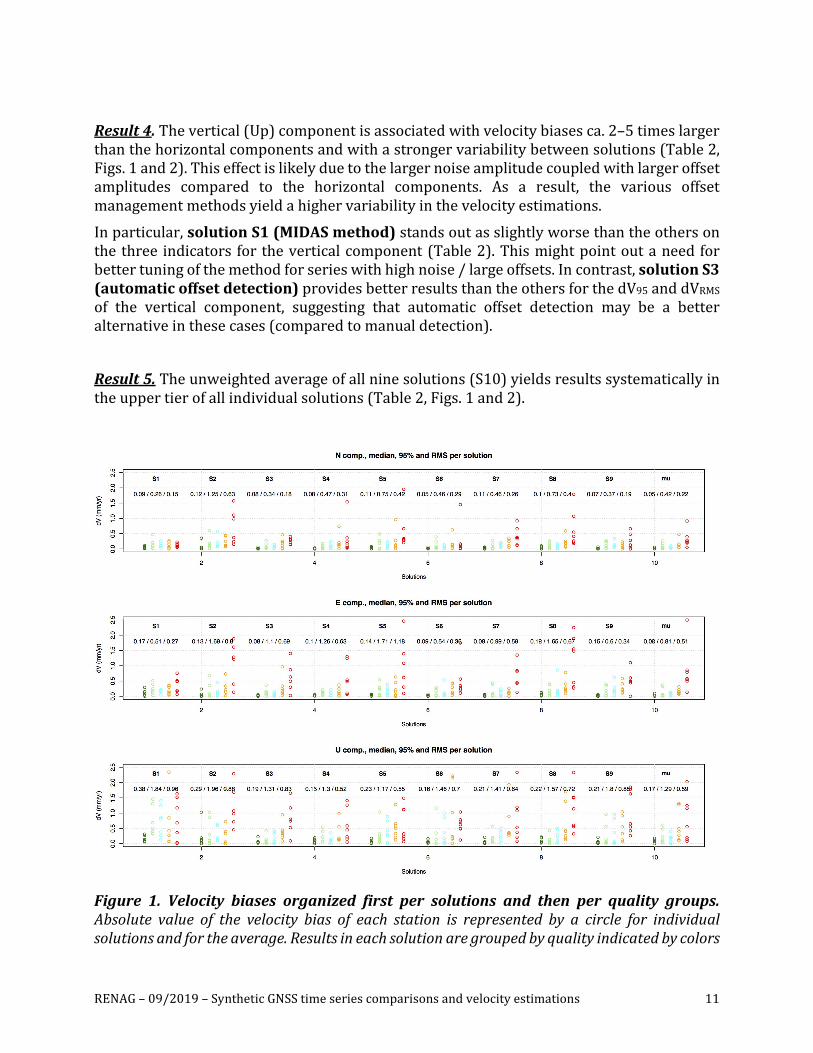
Figure 1. Velocity biases organized first per solutions and then per quality groups.Absolute value of the velocity bias of each station is represented by a circle for individualsolutionsandfortheaverage.Resultsineachsolutionaregroupedbyqualityindicatedbycolors
RENAG–09/2019–SyntheticGNSStimeseriescomparisonsandvelocityestimations 12
(fromSCtoSU=greentored,cf.text).Foreachsolutionthemedian,95thpercentileandRMSofallstationsaregiveninmm/yr(NB:thesestatisticsincludestationsfromgroupSU,incontrastwiththoseinTable2).N,E,U:North,EastandVerticalcomponents.
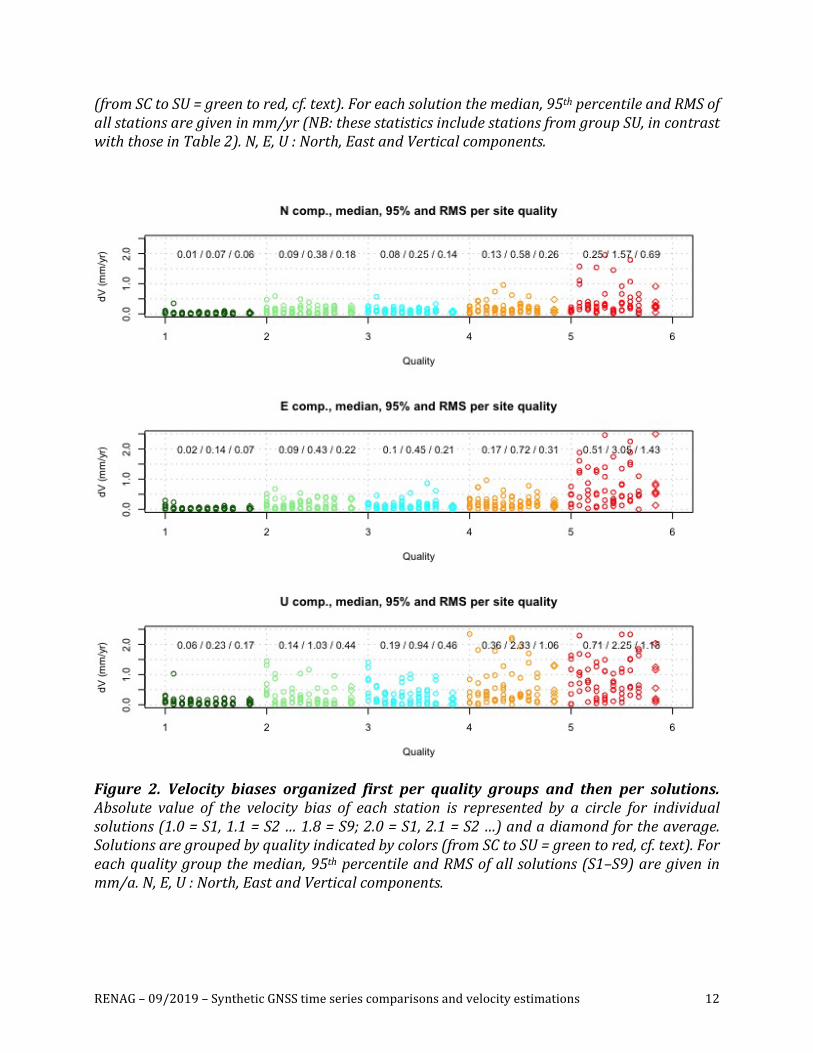
Figure 2. Velocity biases organized first per quality groups and then per solutions.Absolute value of the velocity bias of each station is represented by a circle for individualsolutions(1.0=S1,1.1=S2…1.8=S9;2.0=S1,2.1=S2…)andadiamondfortheaverage.Solutionsaregroupedbyqualityindicatedbycolors(fromSCtoSU=greentored,cf.text).Foreachqualitygroupthemedian,95thpercentileandRMSofallsolutions(S1–S9)aregiveninmm/a.N,E,U:North,EastandVerticalcomponents.
RENAG–09/2019–SyntheticGNSStimeseriescomparisonsandvelocityestimations 13
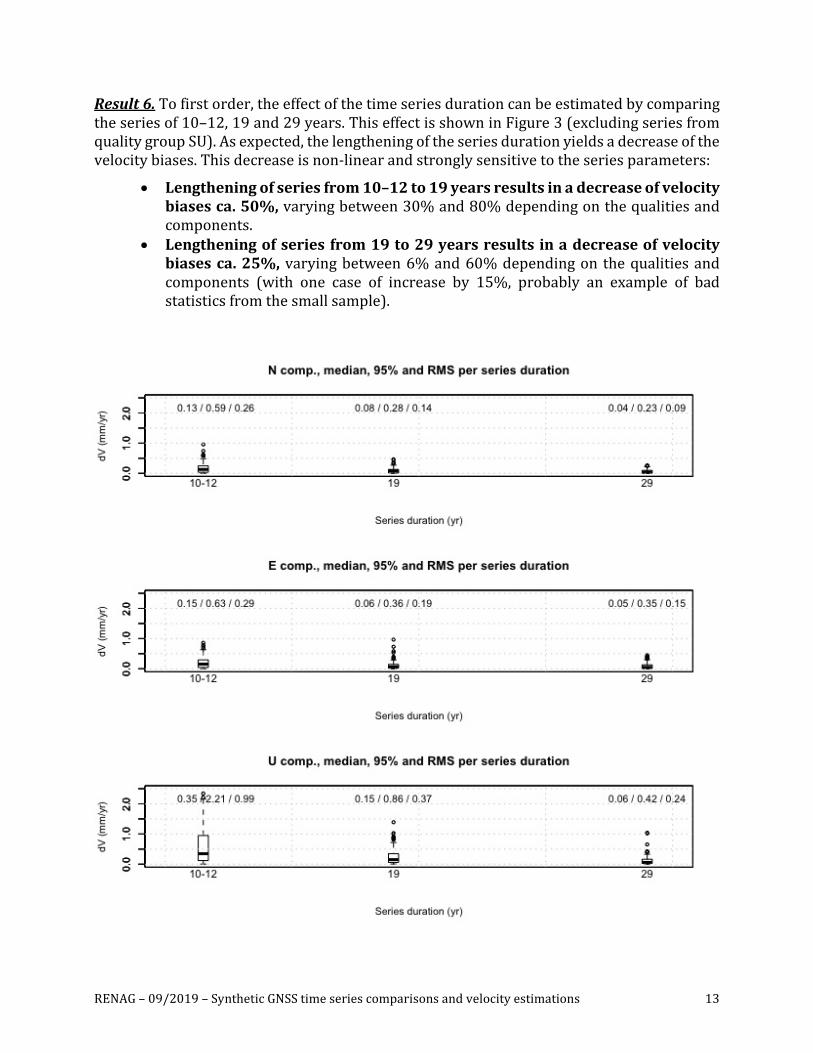
Result6.Tofirstorder,theeffectofthetimeseriesdurationcanbeestimatedbycomparingtheseriesof10–12,19and29years.ThiseffectisshowninFigure3(excludingseriesfromqualitygroupSU).Asexpected,thelengtheningoftheseriesdurationyieldsadecreaseofthevelocitybiases.Thisdecreaseisnon-linearandstronglysensitivetotheseriesparameters:
• Lengtheningofseriesfrom10–12to19yearsresultsinadecreaseofvelocitybiasesca.50%,varyingbetween30%and80%dependingonthequalitiesandcomponents.
• Lengtheningofseriesfrom19to29yearsresultsinadecreaseofvelocitybiasesca.25%,varyingbetween6%and60%dependingon thequalitiesandcomponents (with one case of increase by 15%, probably an example of badstatisticsfromthesmallsample).
RENAG–09/2019–SyntheticGNSStimeseriescomparisonsandvelocityestimations 14
Figure3.Velocitybiasesorganizedper seriesdurations.Absolute values of the velocitybiases(excludingqualitygroupSU)areshownasboxplots(quartilesandoutliers).Themedian,95thpercentileandRMSaregivenforeachduration(10–12,19and29years).
Result7.Theninesolutionsareassociatedwithdifferentmethodstoestimatethevelocityformaluncertainties(standarderrors,cf.Section2).AssumingaGaussiandistributionofthevelocity estimations, these uncertainties should be such that 68.3% (resp. 95.4%) of thevelocitybiasesareinferiorto1(resp.2)timesthestandarderrors.Thecomparisonofthevelocitybiasesrelativeto theirstandarderrors foreachsolution(Appendix2)allowsthefollowingobservations:
• Methodsbasedoncolored-noisemodels(solutionsS2,S3,S4,S6andS8)yieldreasonable estimations of the velocity standard errors (although on averageslightlytoosmall):80–91%ofthevelocitybiasesareinferiortotwicetheirstandarderrors.
• Unsurprisingly,methods based on white-noise models (solutions S5 and S7)yieldstandarderrorssystematicallytoosmall:only20–25%ofthevelocitybiasesareinferiortotwicetheirstandarderrors.AveragedV/sratiosvarybetween6and14,suggestingstandarderrorstoosmallbyafactorof3–7.
• TheMIDASmethod(solutionS1)yieldsstandarderrorssystematicallytoolarge,especiallyforthehorizontalcomponentsforwhich100%ofthevelocityaresmallerthantwicetheirstandarderrors.dV/sratiossuggestthatthestandarderrorsaretoolargebyafactorca.2.
• TheTSView“RealSigma”method(solutionS9)yieldsstandarderrorsslightlytoosmall,withca.60%ofthevelocitybiasesinferiortotwicetheirstandarderrors(averagedV/sratiosca.2).
RENAG–09/2019–SyntheticGNSStimeseriescomparisonsandvelocityestimations 15
Bibliography
Benoist, C. (2018). Prise en compte de la dépendance spatiotemporale des sériestemporellesdecoordonnéesGNSSpourunemeilleuredéterminationdesplaquestectoniquesmajeures par rapport au centre de la Terre.Thèse de Doctorat del'ObservatoiredeParis.
Blewitt, G., C.Kreemer,W.C.Hammond, and J. Gazeaux (2016).MIDAS robust trendestimator for accurateGPS station velocitieswithout stepdetection, Journal ofGeophysicalResearch,121,doi:10.1002/2015JB012552.
Bos,M.S.,Fernandes,R.M.S.,Williams,S.D.P.,&Bastos,L.(2013).Fasterroranalysisof continuousGNSS observationswithmissing data. Journal of Geodesy, 87(4),351–360.doi:10.1007/s00190-012-0605-0.
Gazeaux,J.,Williams,S.D.P.,King,M.A.,Bos,M.S.,Dach,R.,Deo,M.,Moore,A.W.,Ostini,L.,Petrie,E.J.,Roggero,M.,Teferle,N.F.,Olivares,G.andWebb,F.H.(2013).DetectingoffsetsinGPStimeseries:FirstresultsfromthedetectionofoffsetsinGPSexperiment,JournalofGeophysicalResearch,118(5),2397–2407,doi:10.1002/jgrb.50152.
Kasdin,N.J.(1995).DiscreteSimulationofColoredNoiseandStochasticProcessesand1/f^aPowerLawNoiseGeneration,ProceedingsoftheIEEE,83(5),802-827.
Masson,C.,Mazzotti,S.andVernant,P.(2019).PrecisionofcontinuousGPSvelocitiesfrom statistical analysis of synthetic time series, Solid Earth, 10, 329–342,doi:10.5194/se-10-329-2019.
Nocquet, J.-M. (2018). Pyacs: A set of Python tools for GPS analysis and tectonicmodelling.WegenerConference,Strasbourg,France.
R Core Team (2016). R: A language and environment for statistical computing. RFoundation for Statistical Computing, Vienna, Austria. URL https://www.R-project.org/.
Sakic,P.,Mansur,G.,Chaiyaporn,K.,andBallu,V.(2019).ThegeodeZYXtoolbox:aversatile Python 3 toolbox for geodetic-oriented purposes. V. 4.0. GFZ DataServices.http://doi.org/10.5880/GFZ.1.1.2019.002.
Santamaría-Gómez,A.(2019).SARI:interactiveGNSSpositiontimeseriesanalysissoftware.GPSsolutions,23:52.doi:10.1007/s10291-019-0846-y.
Tran,D.T.(2013).AnalyserapideetrobustedessolutionsGPSpourlatectonique.PhDthesis,UniversitédeNiceSophiaAntipolis.
Williams, S.D.P. (2008). CATS: GPS coordinate time series analysis software,GPSSolut,12,147-153.doi:10.1007/s10291-007-0086-4.
RENAG–09/2019–SyntheticGNSStimeseriescomparisonsandvelocityestimations 16
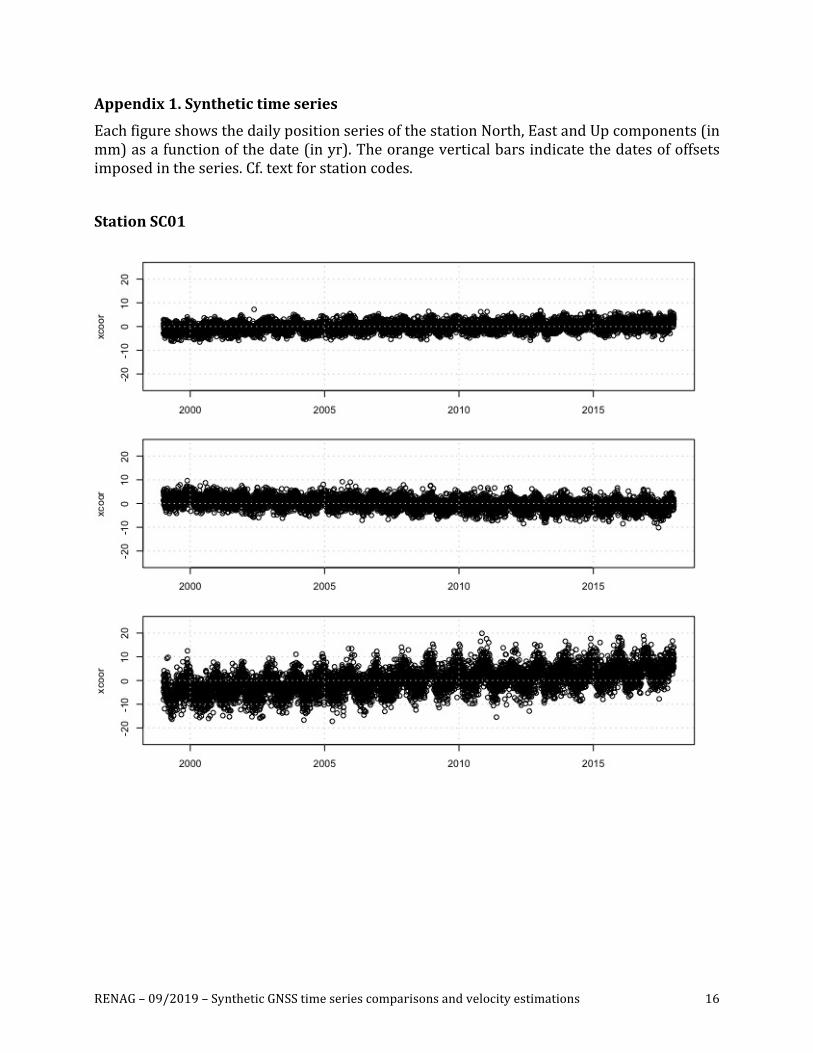
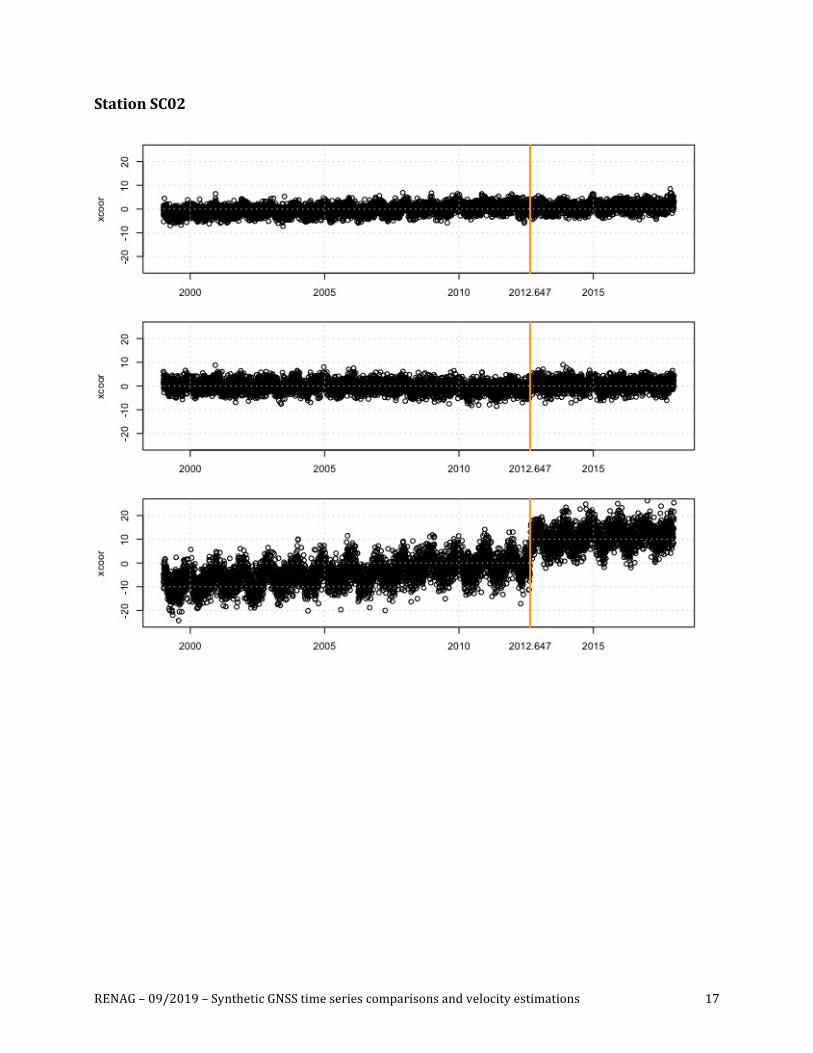
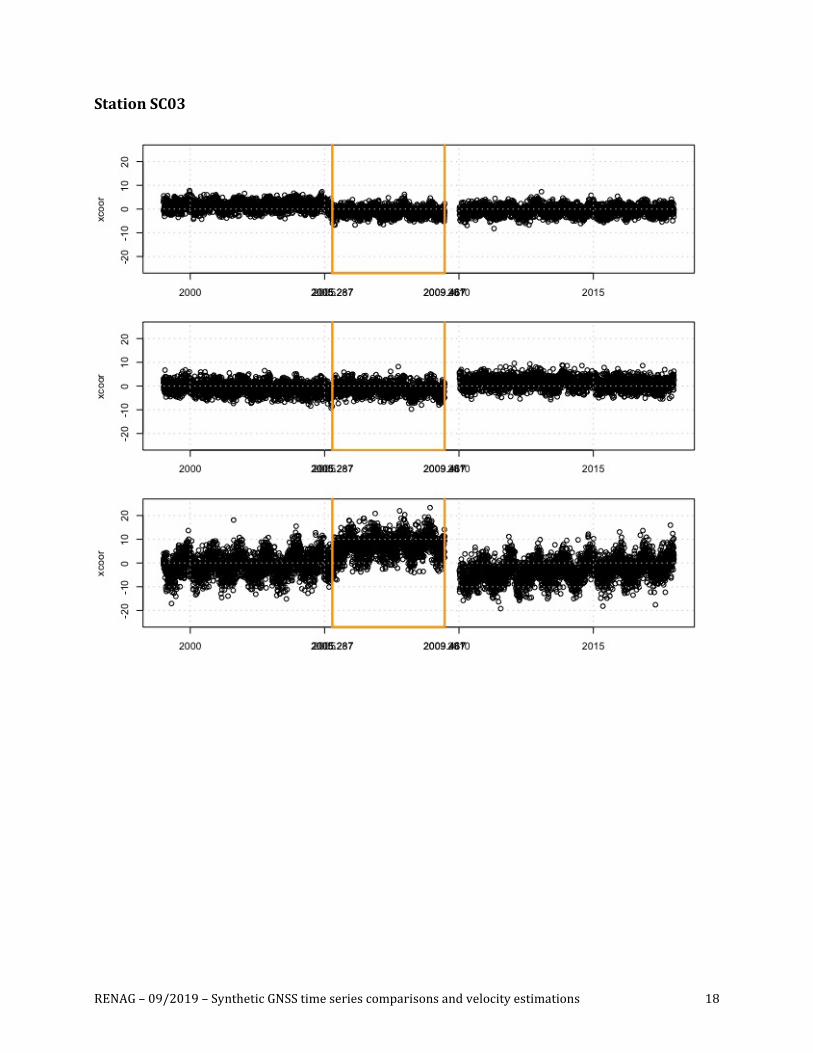
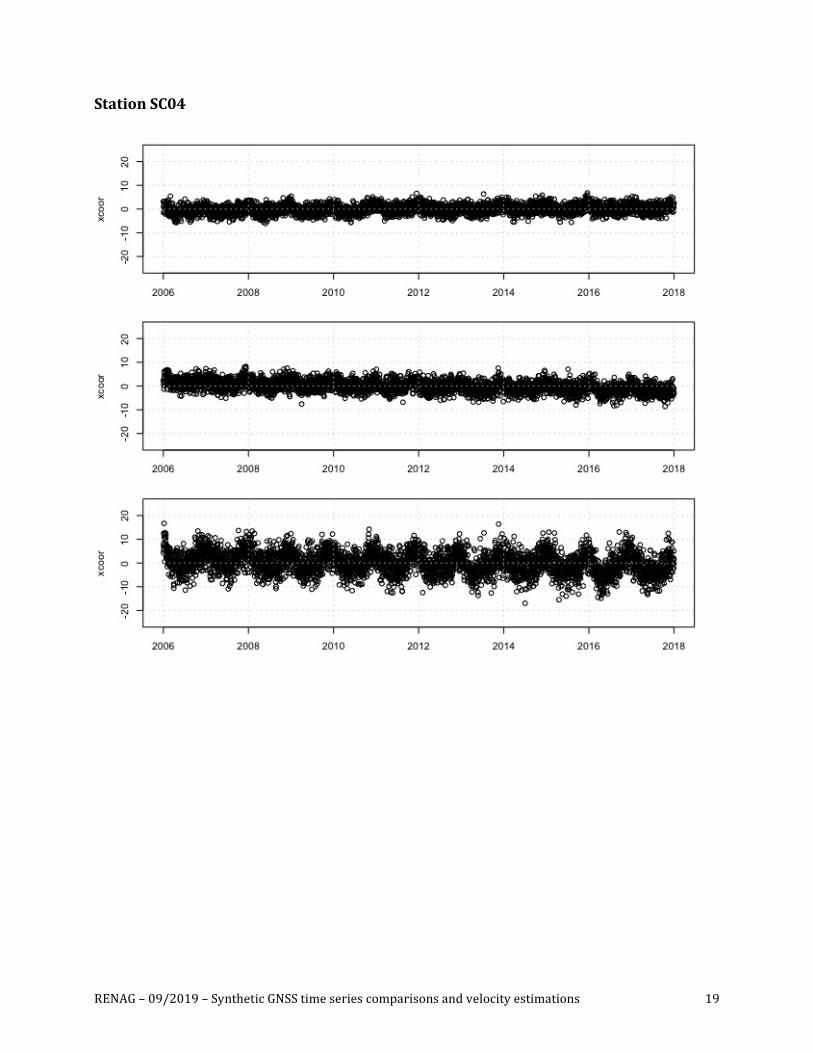
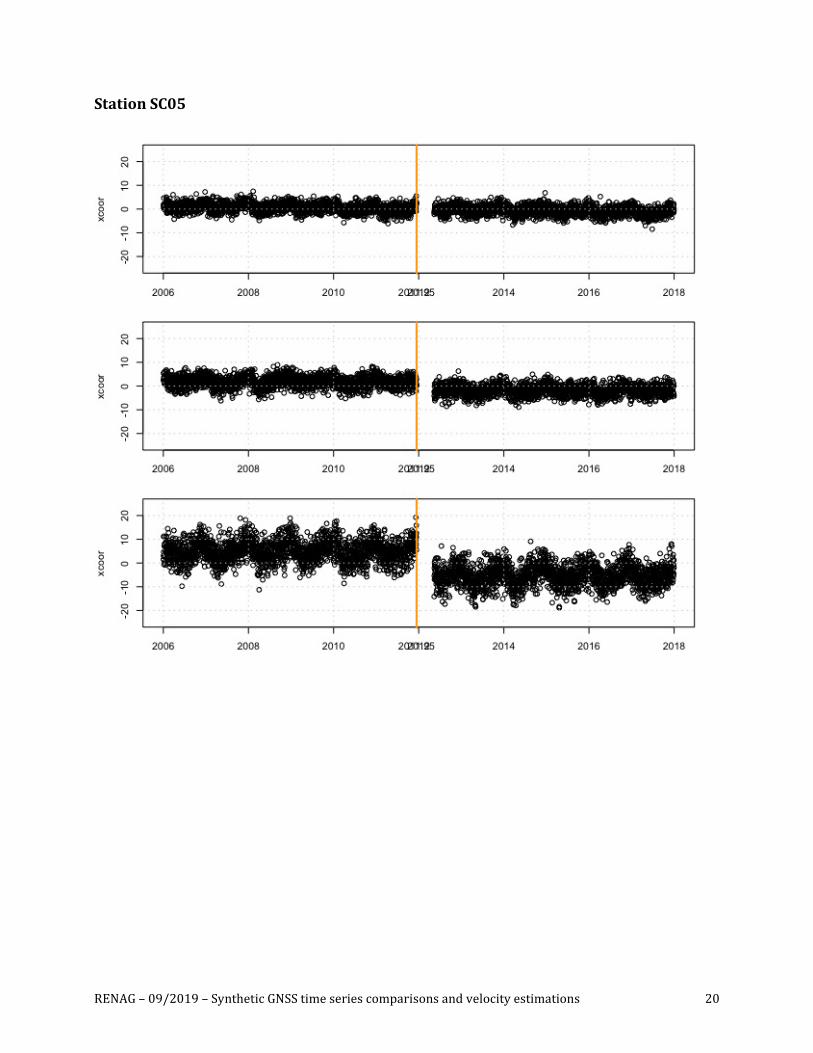
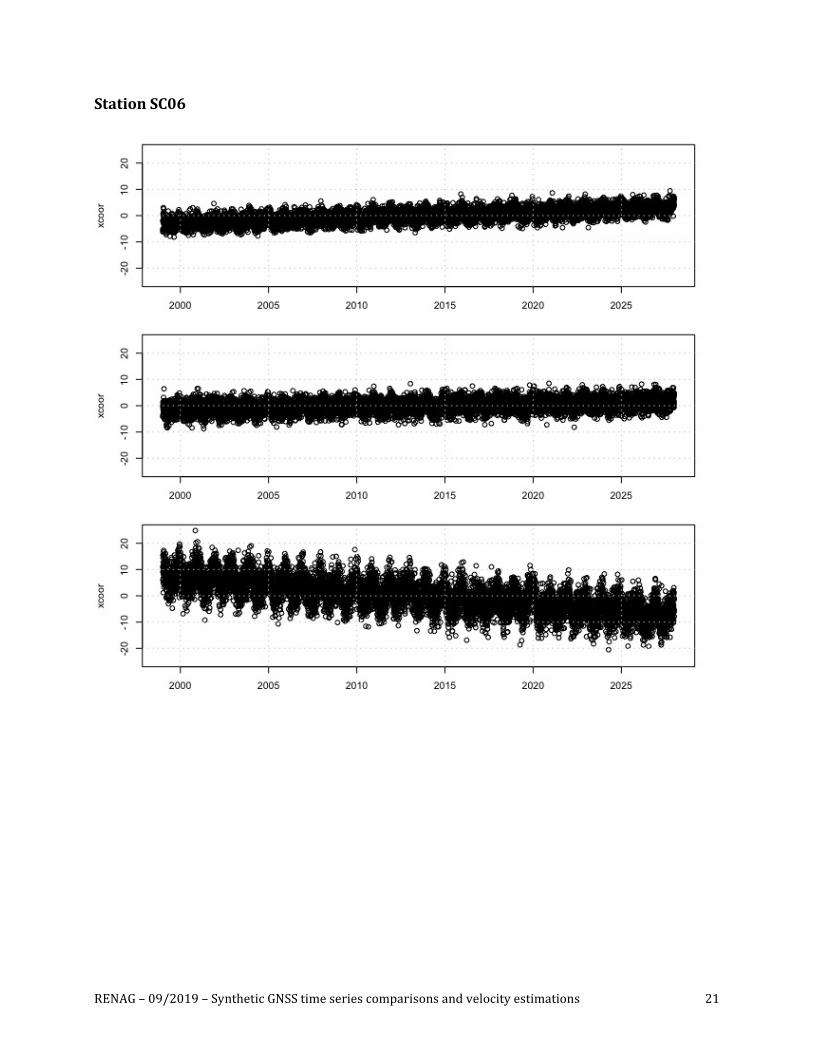
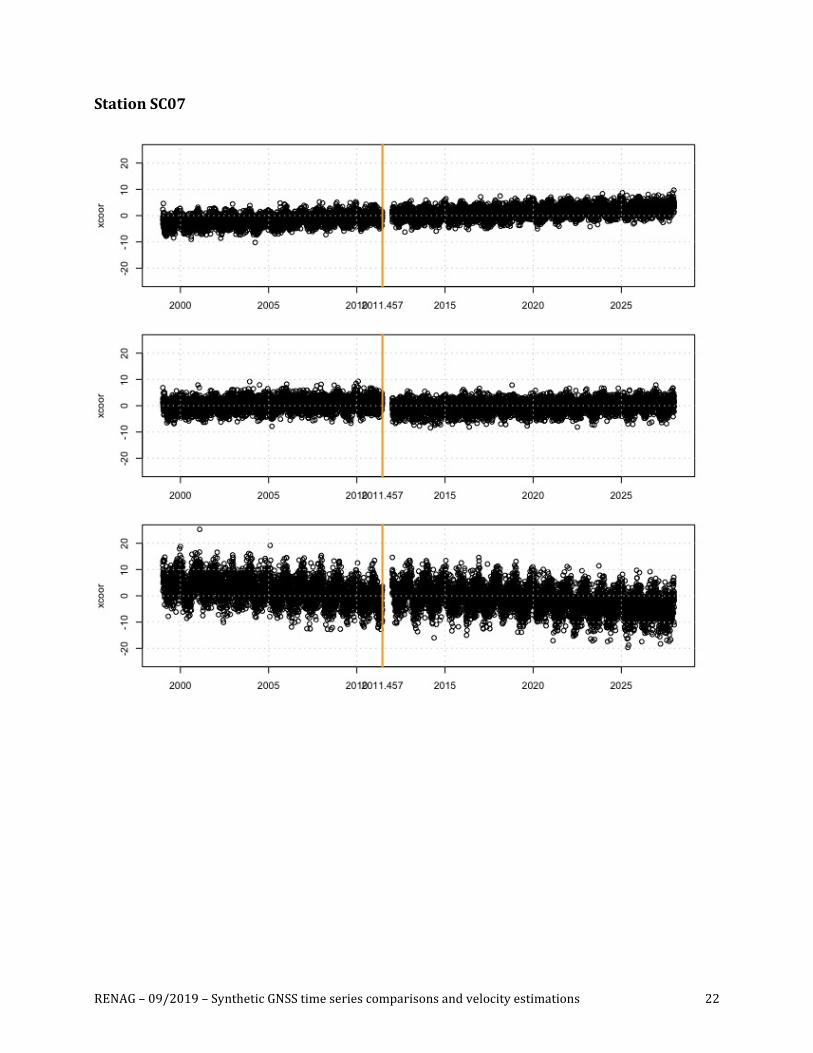
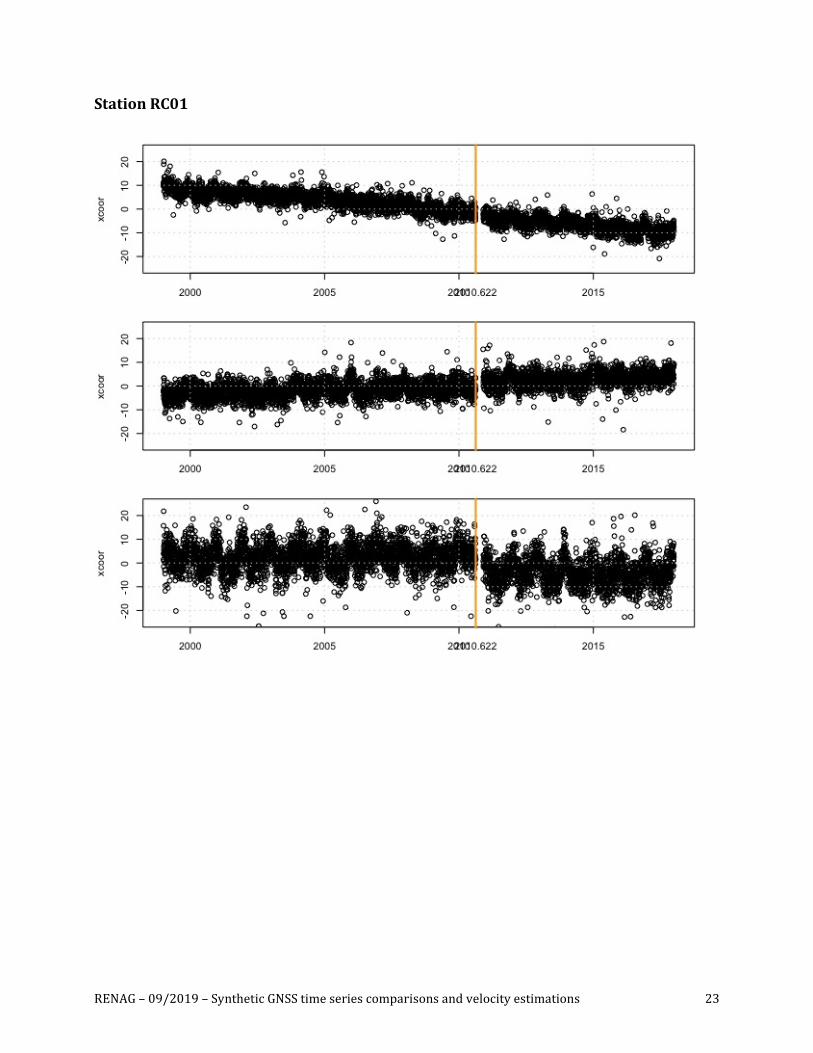
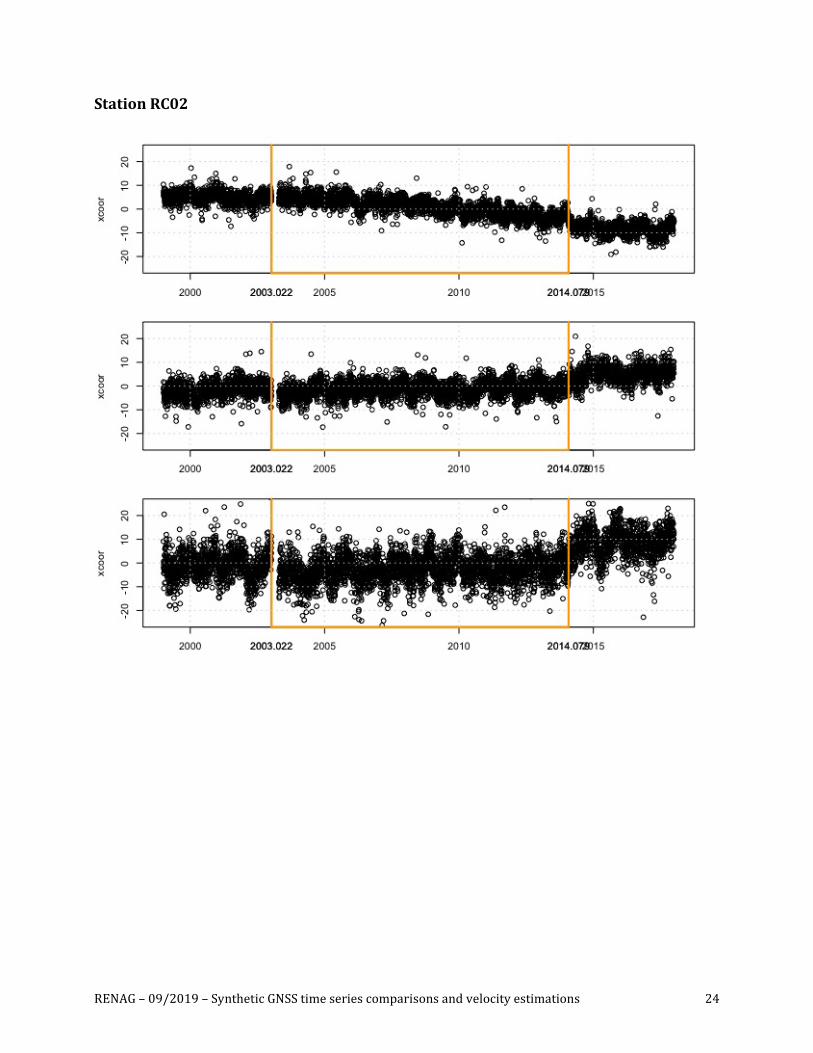
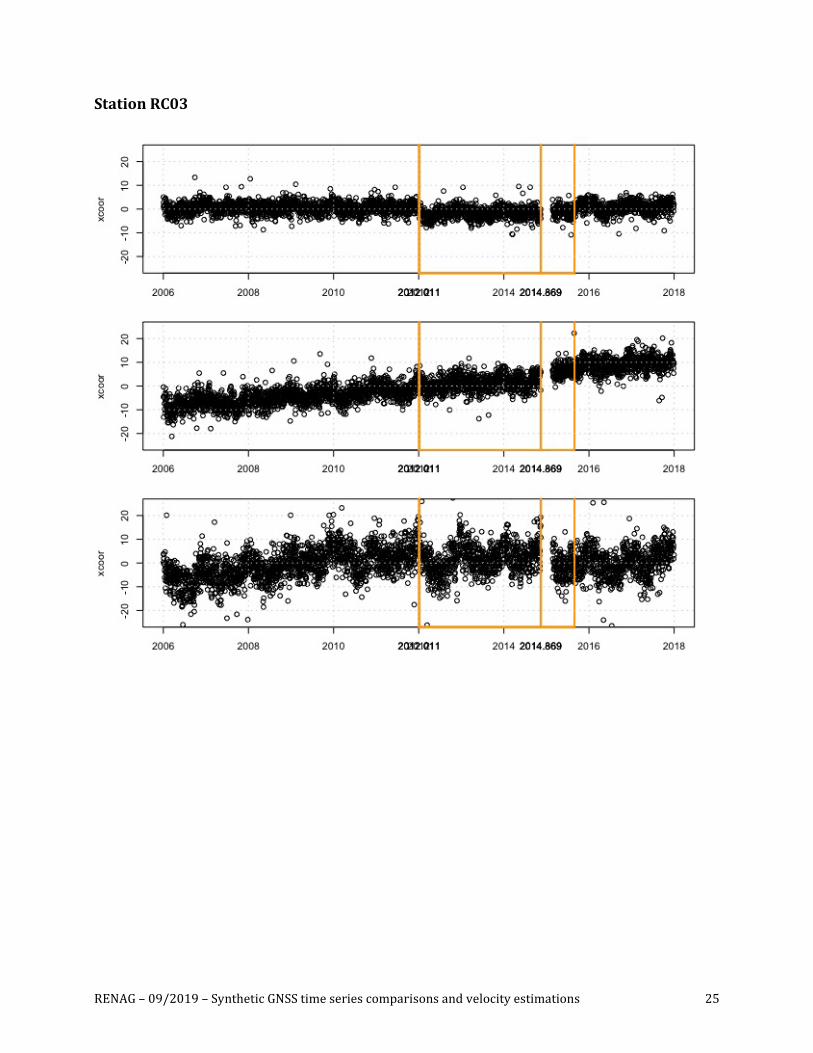
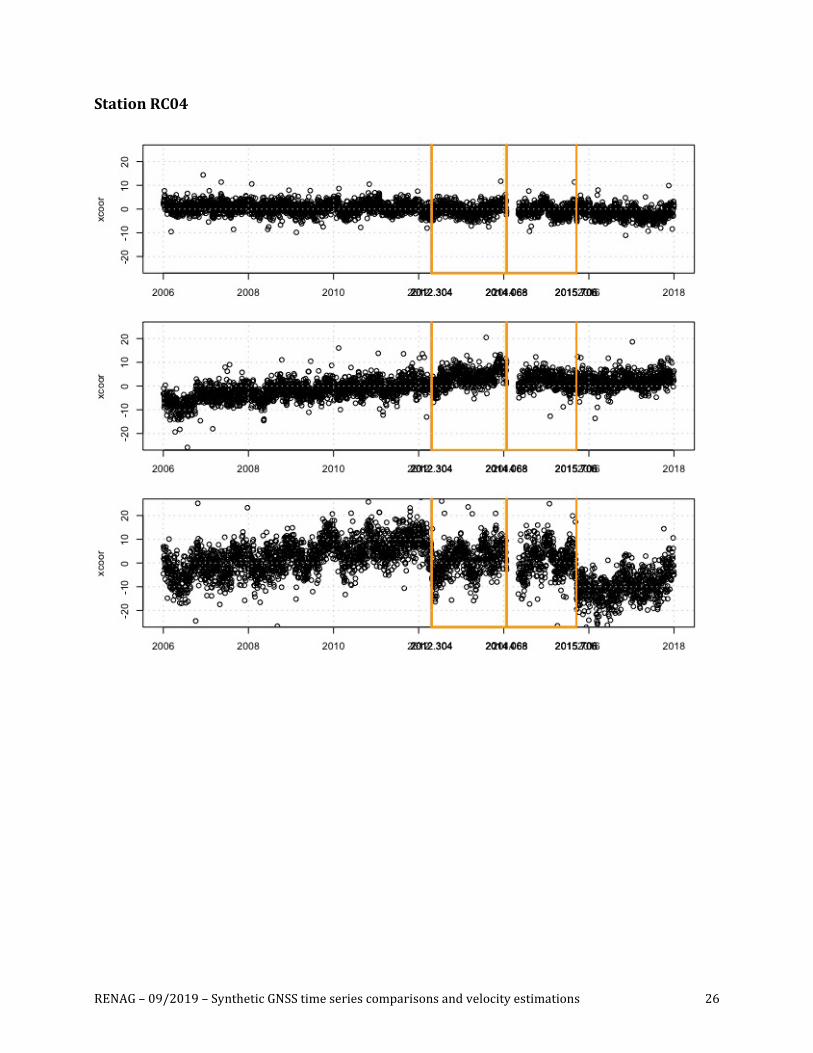
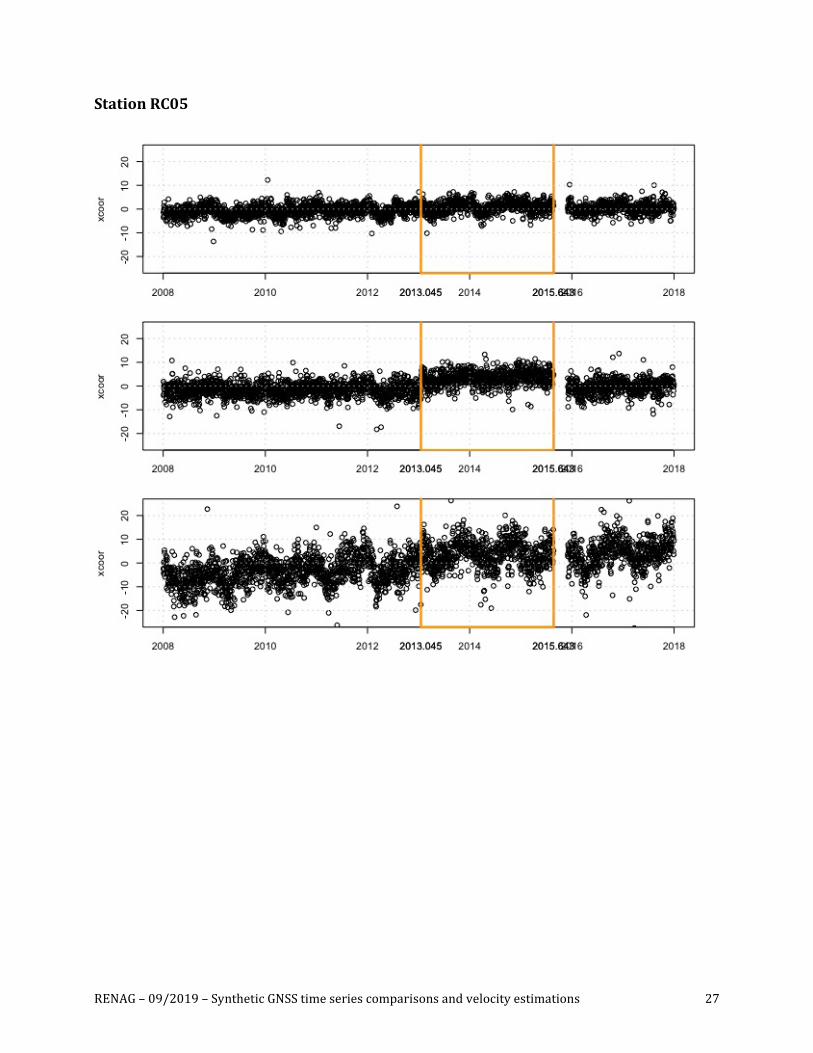
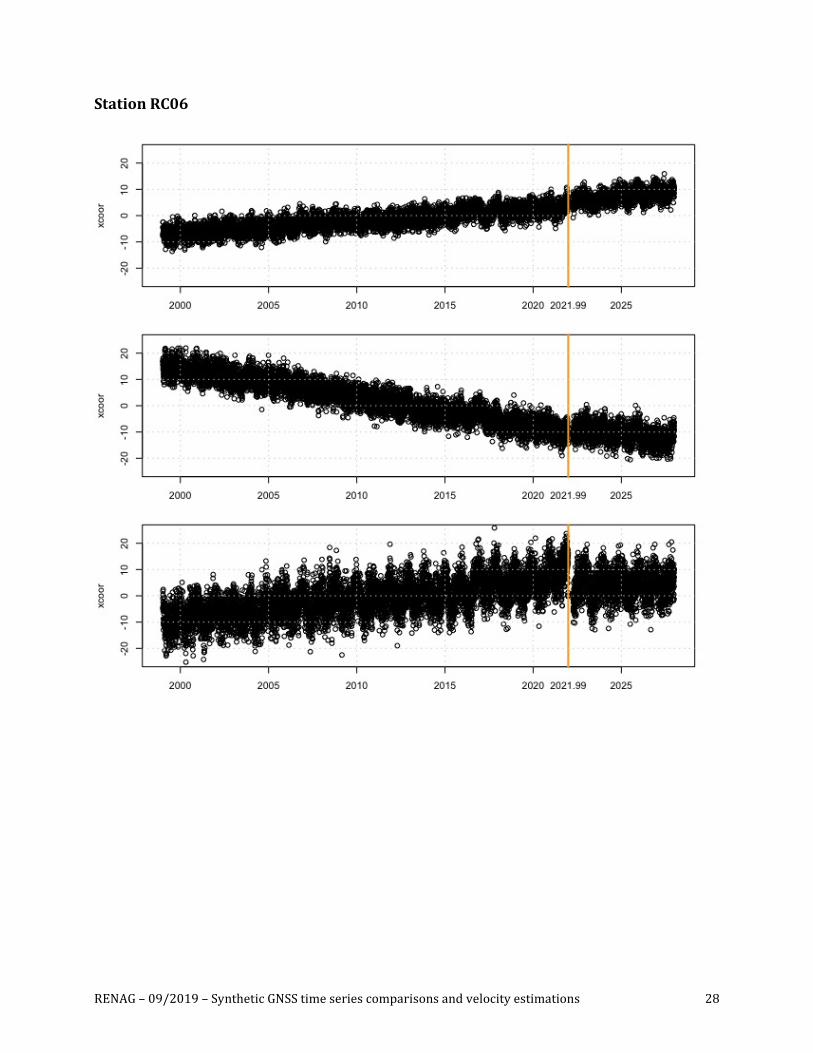
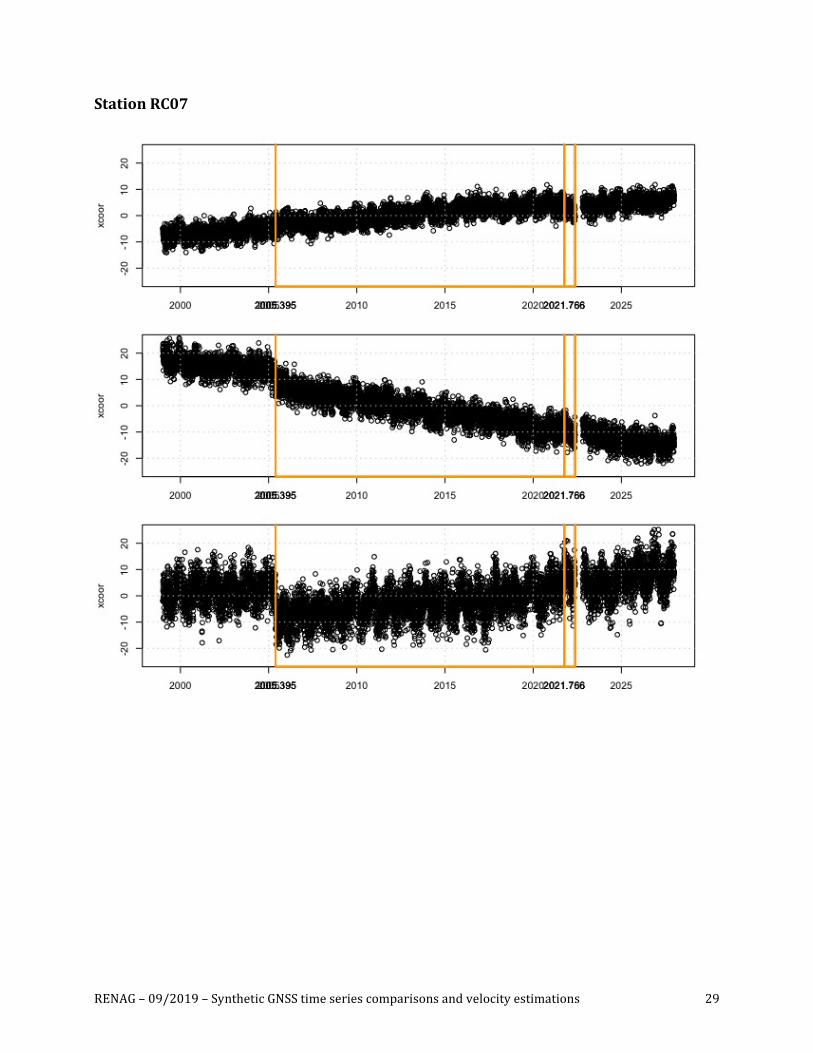
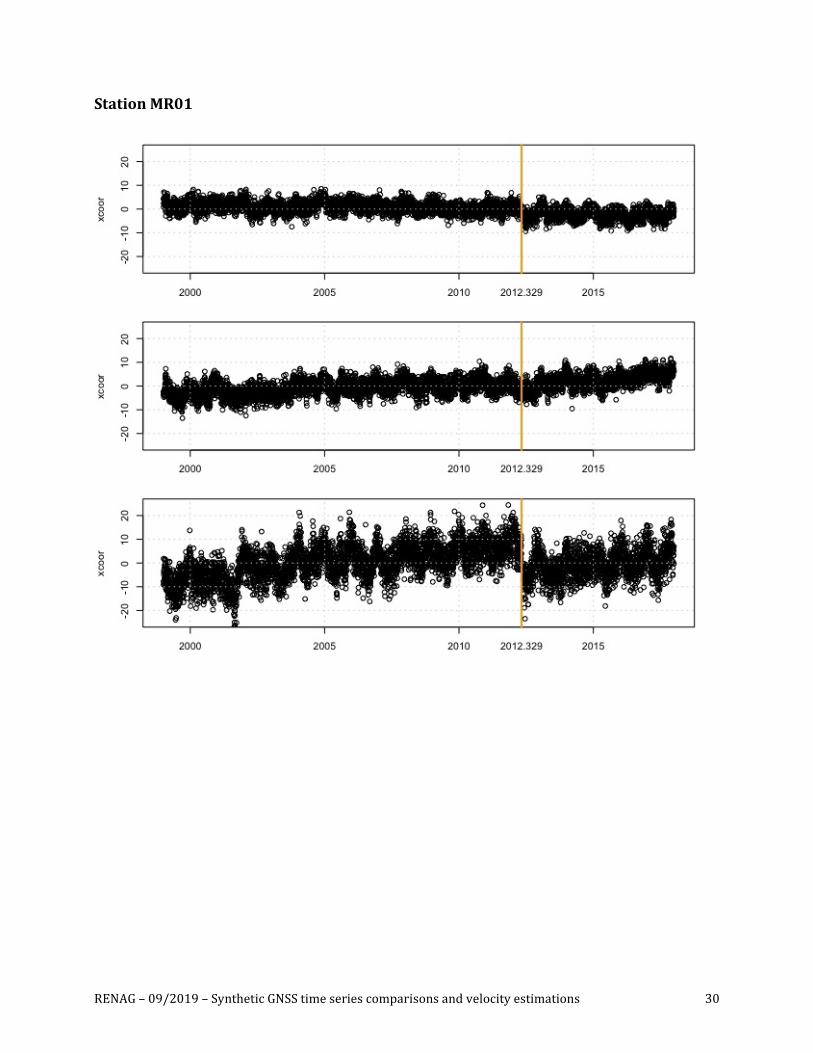
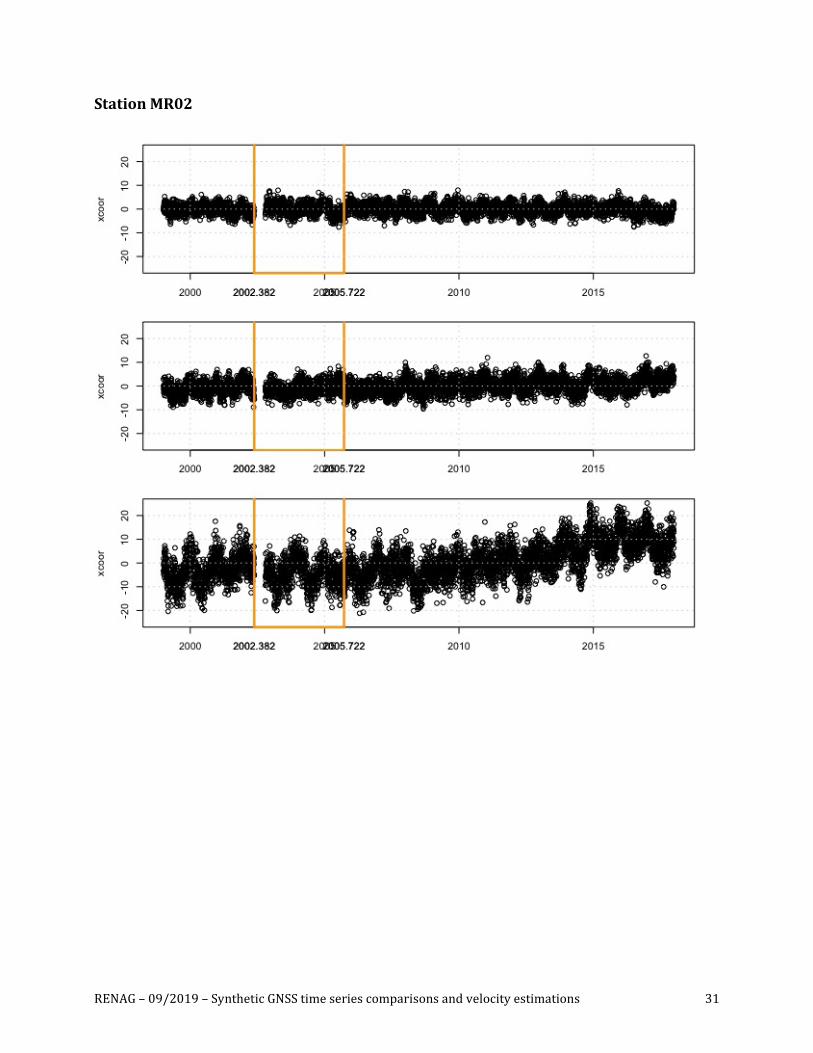
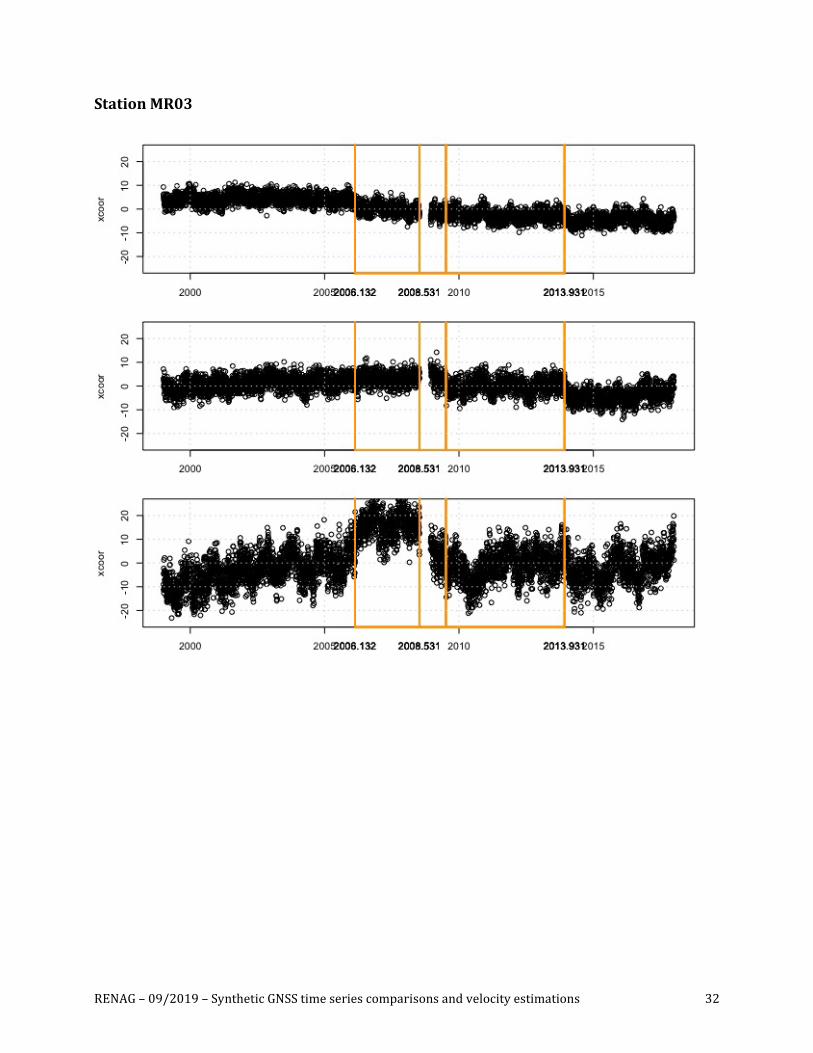
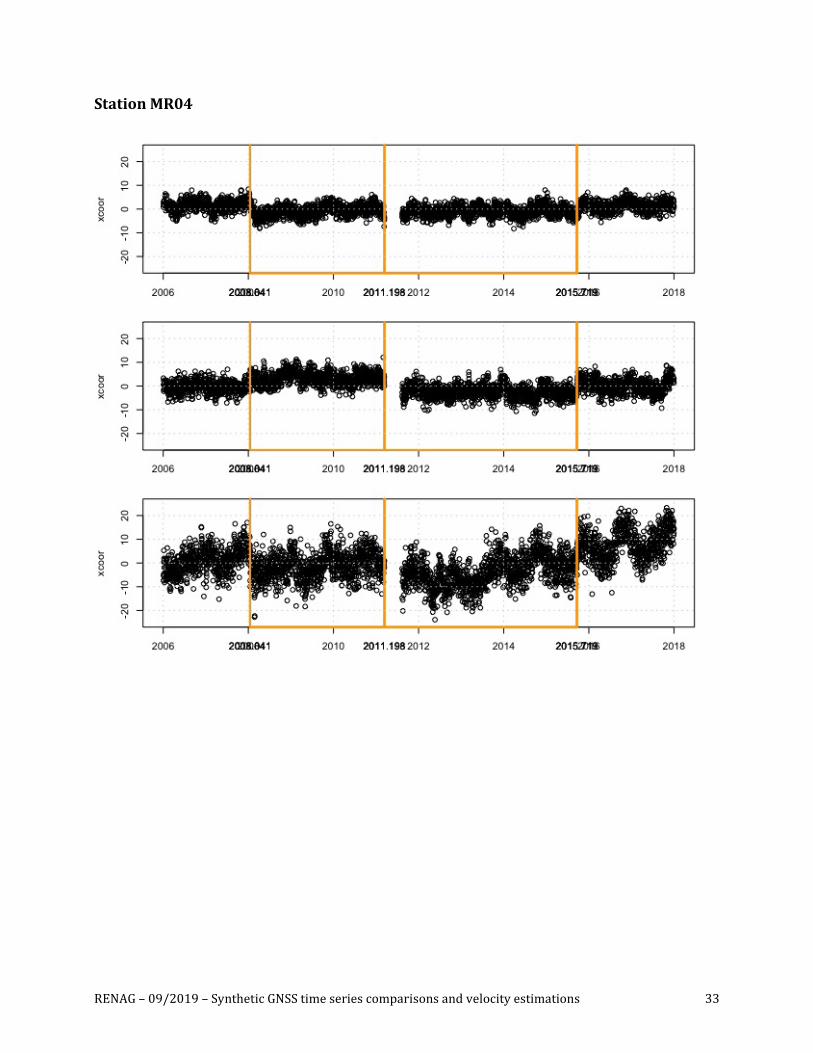
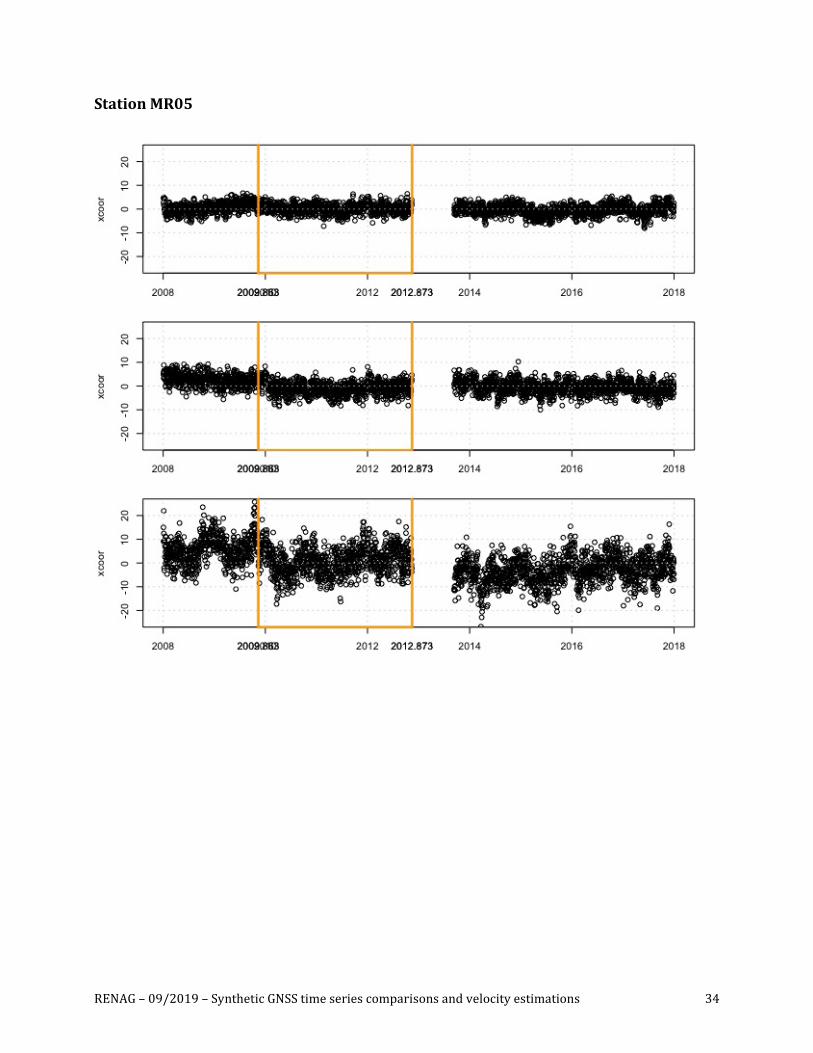
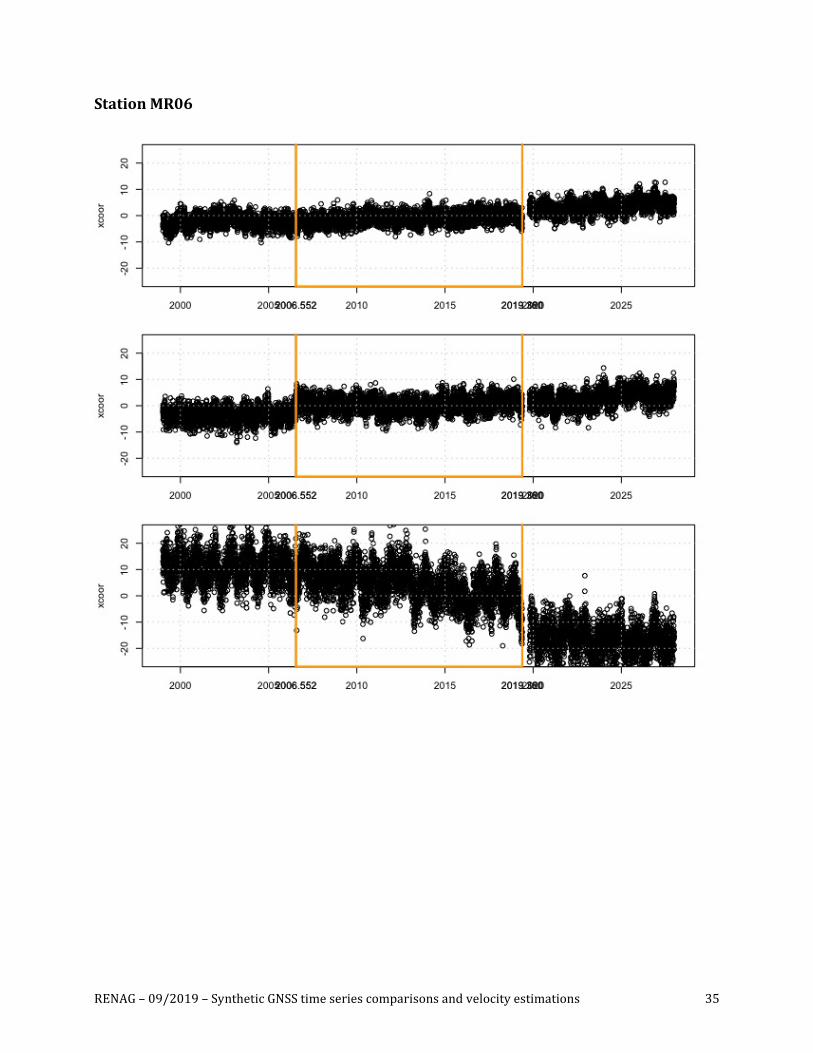
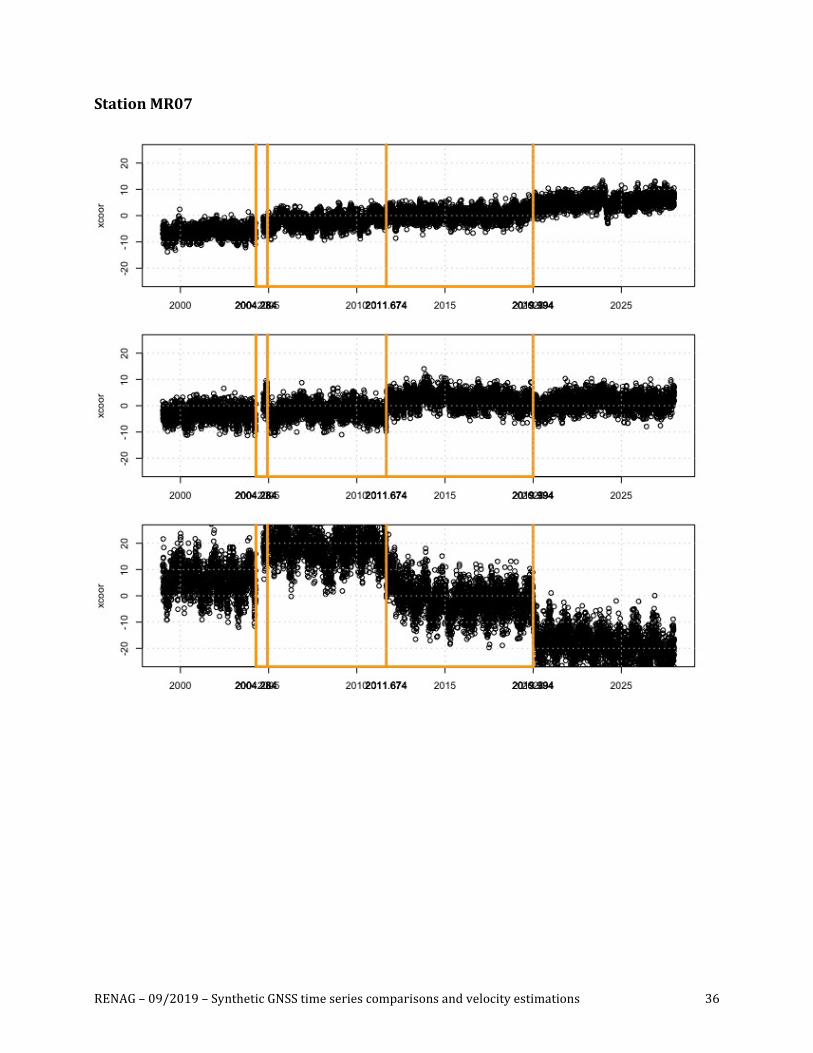
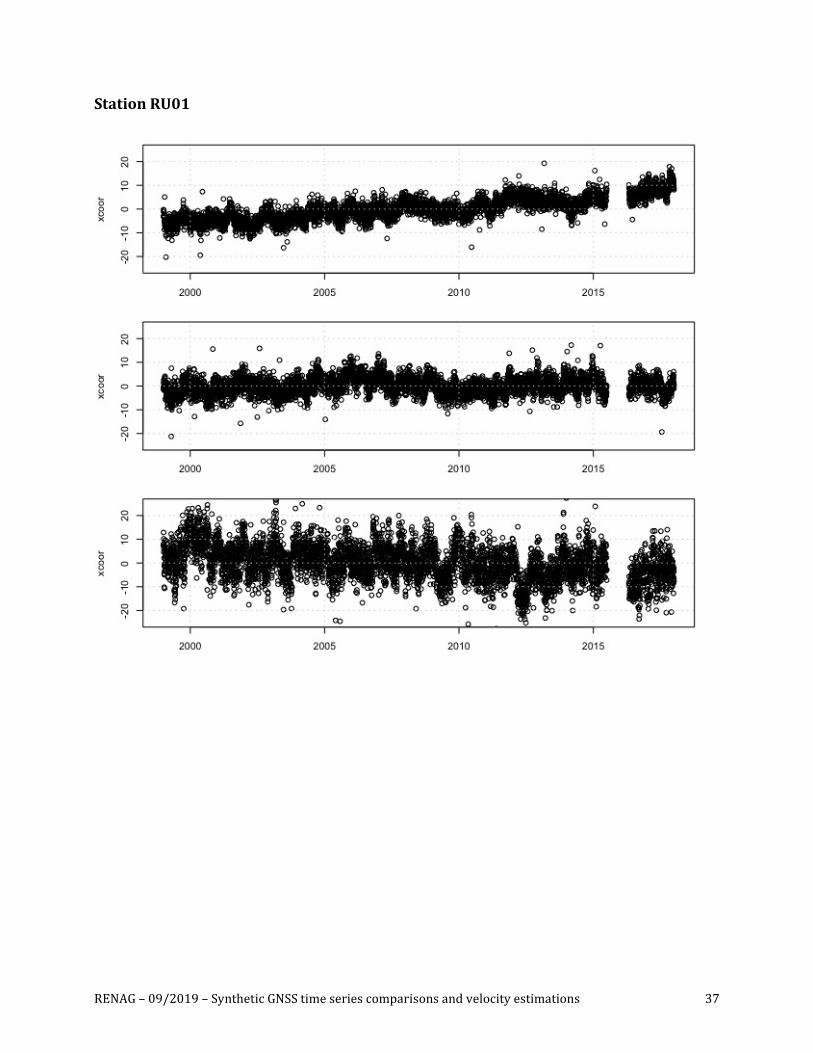
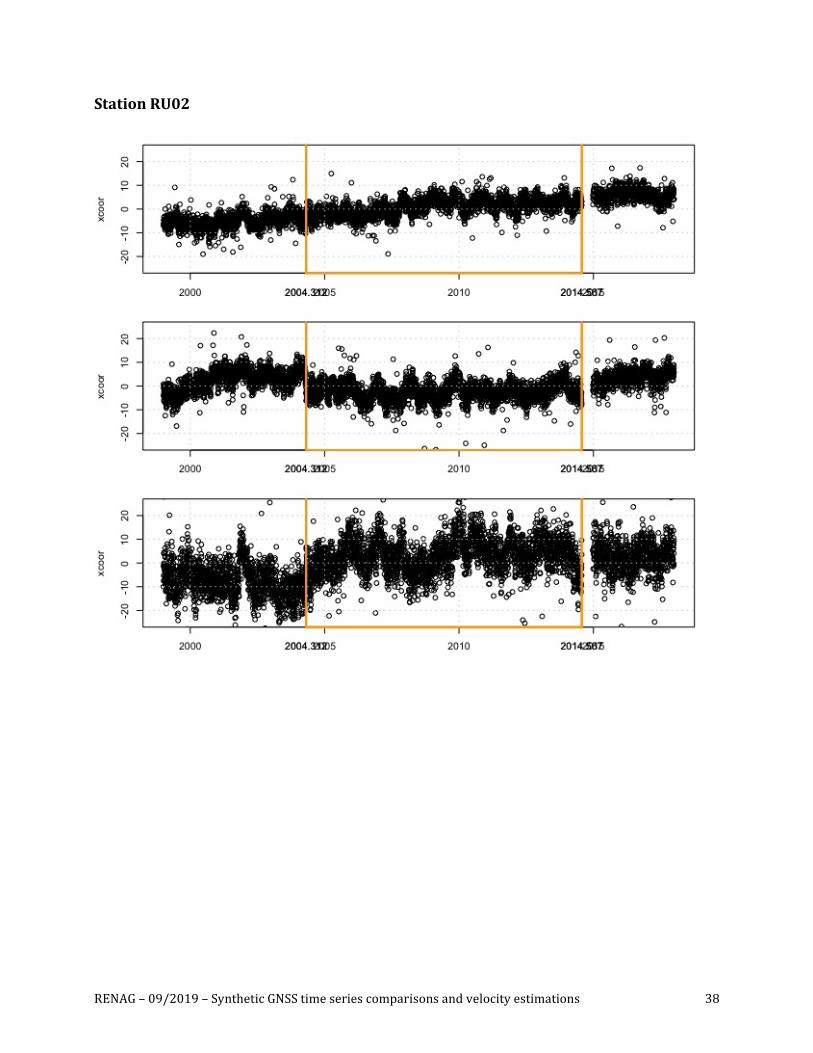
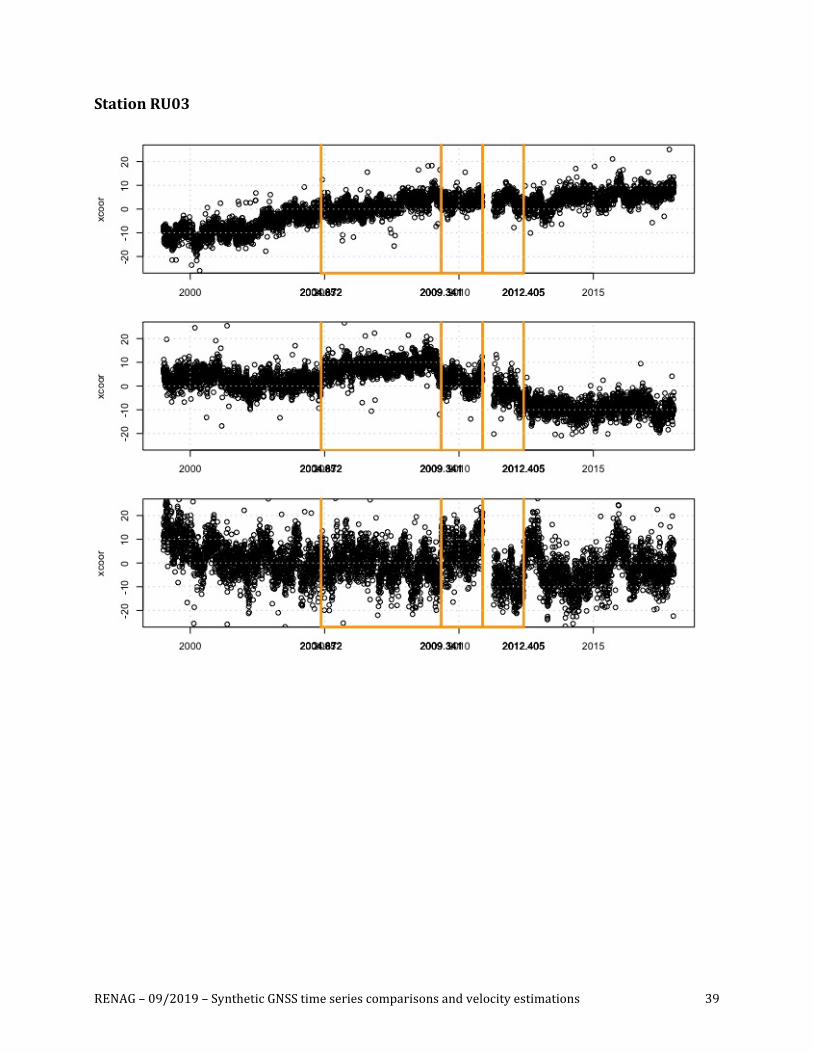
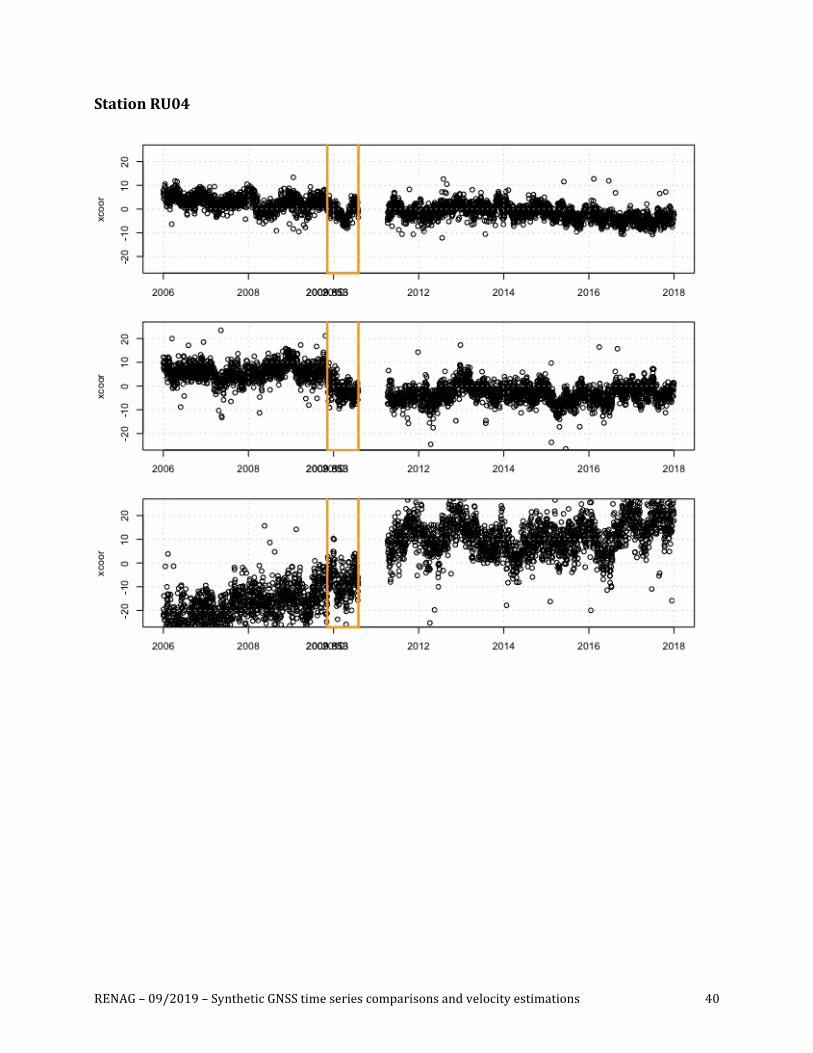
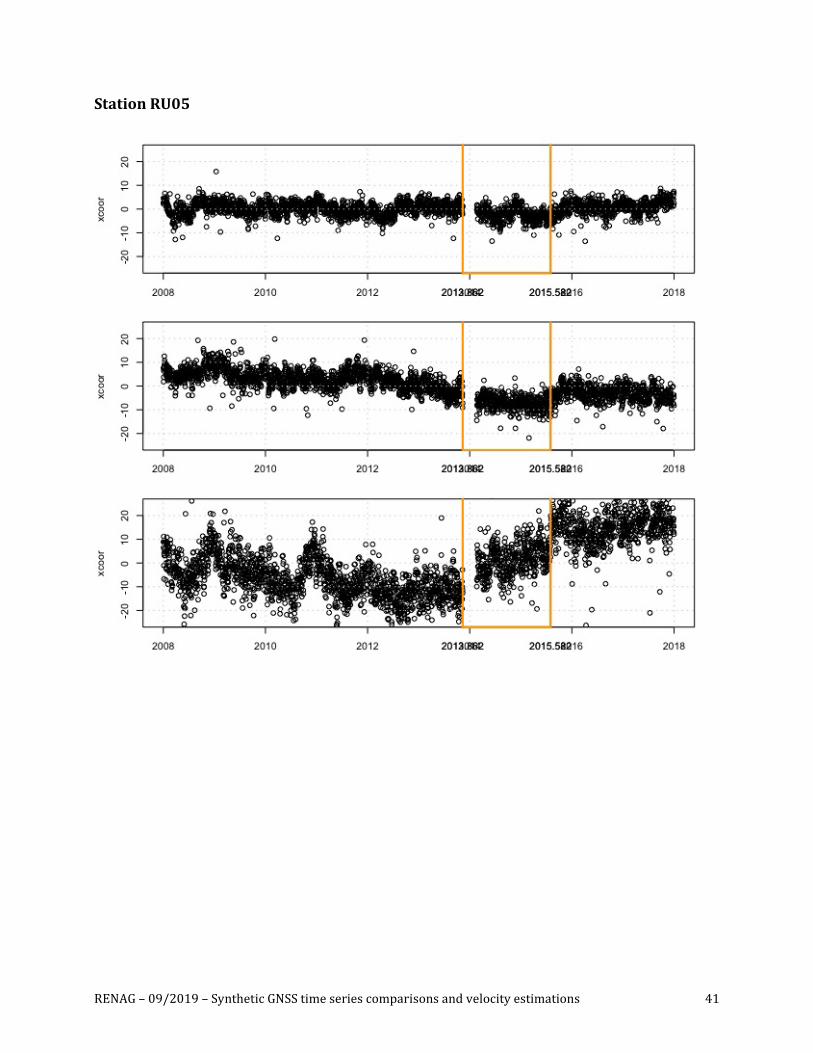
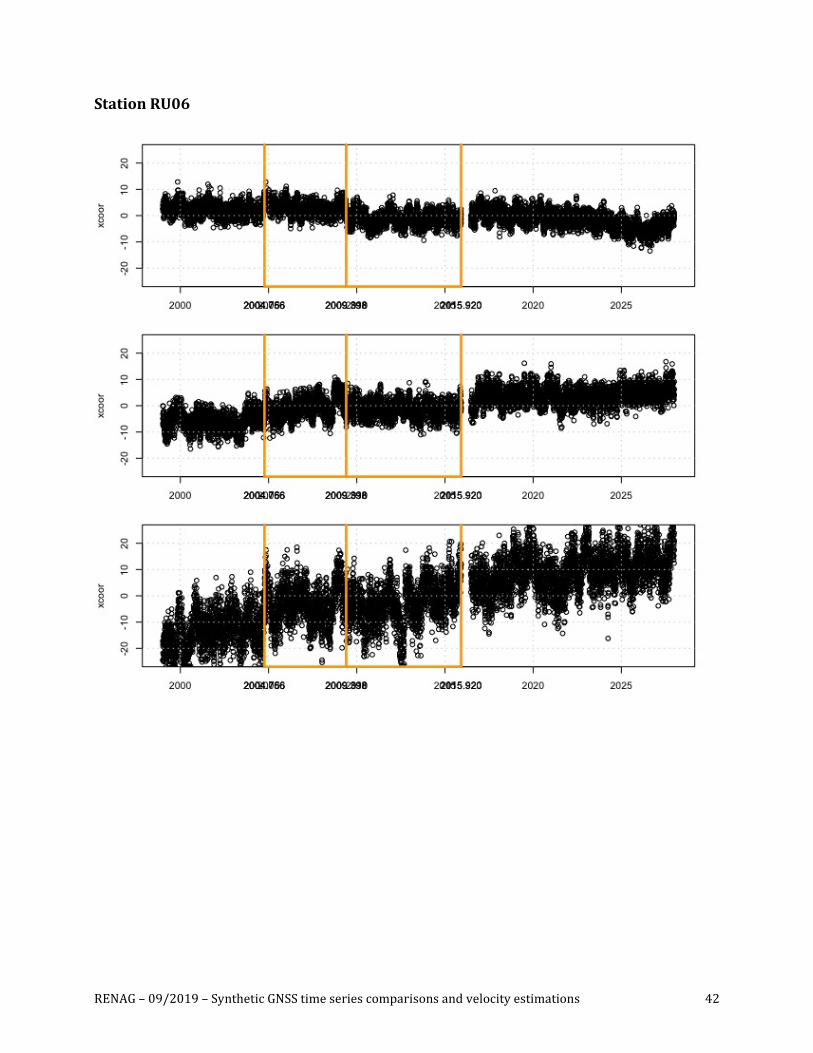
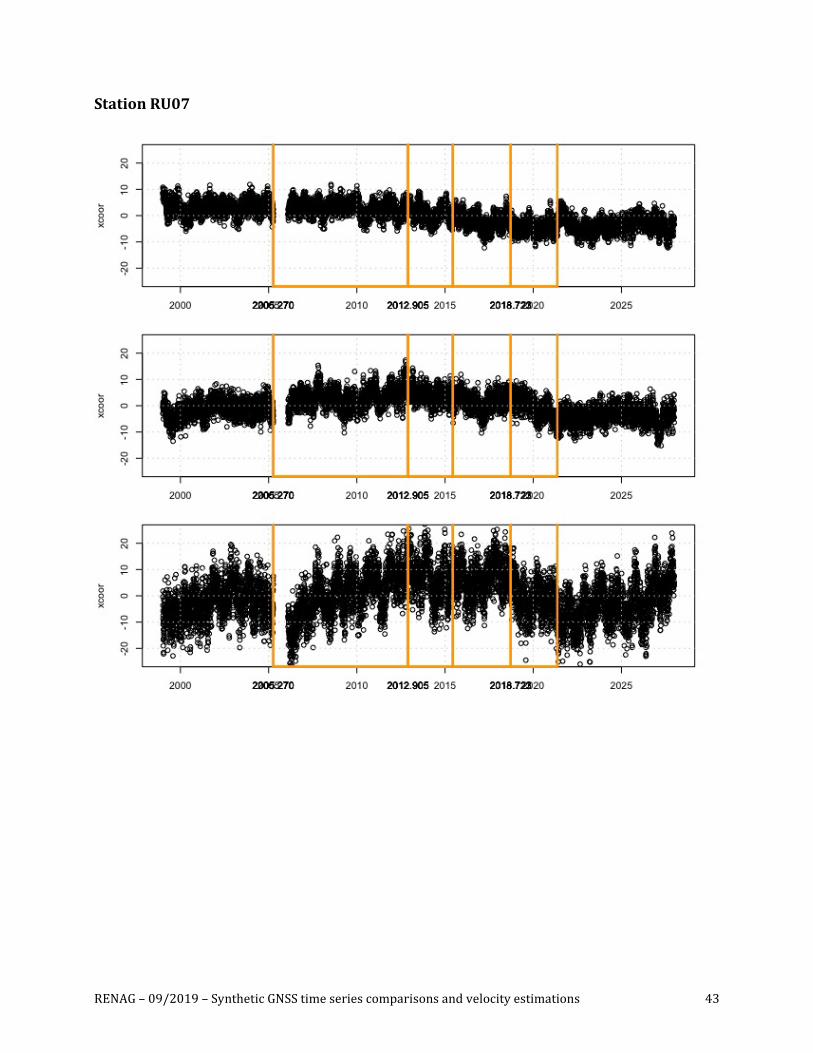
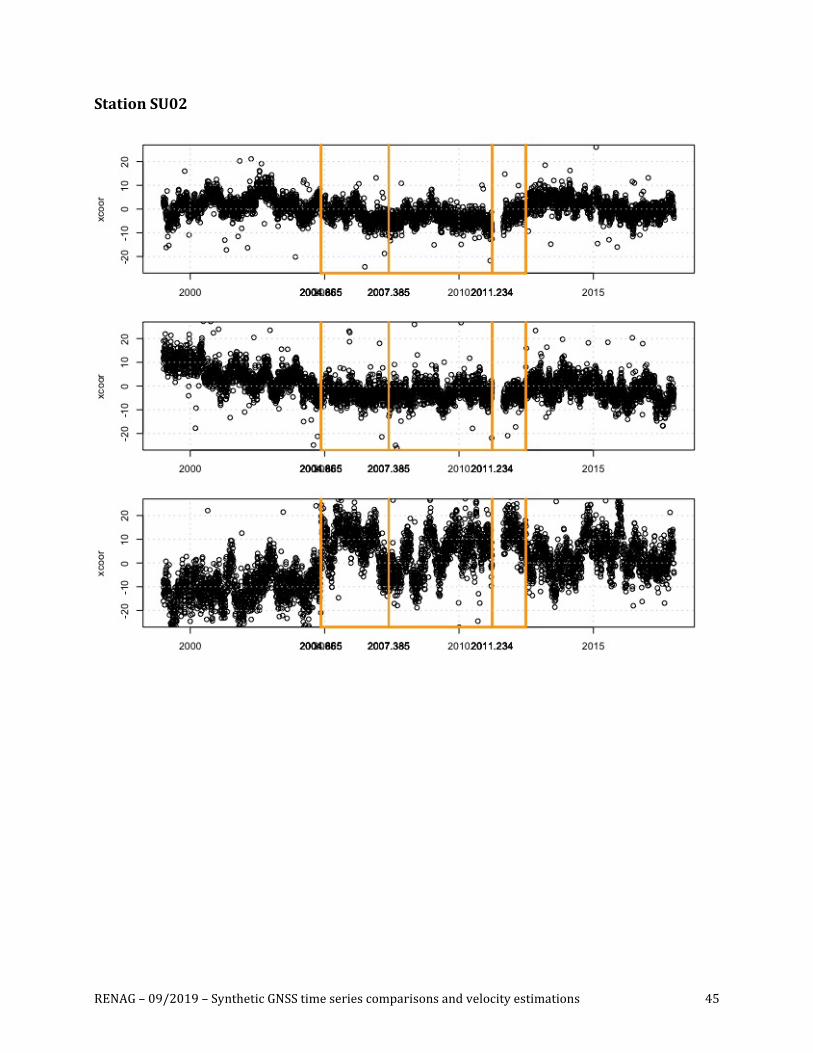
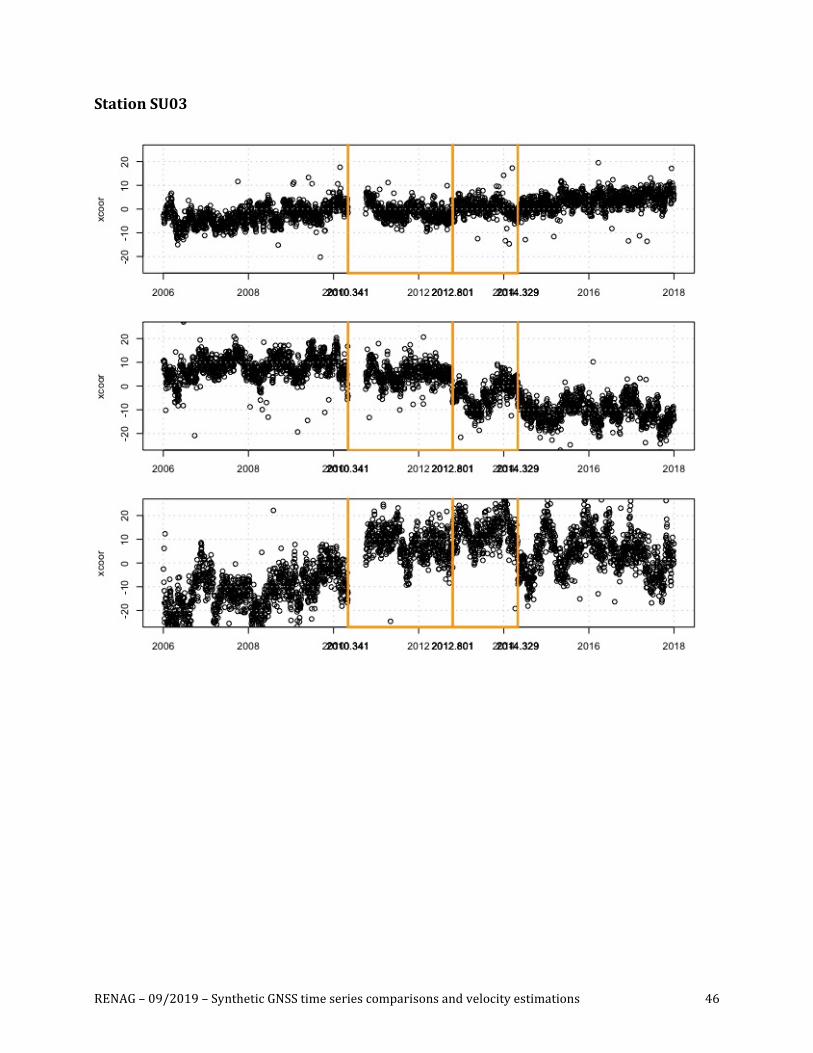
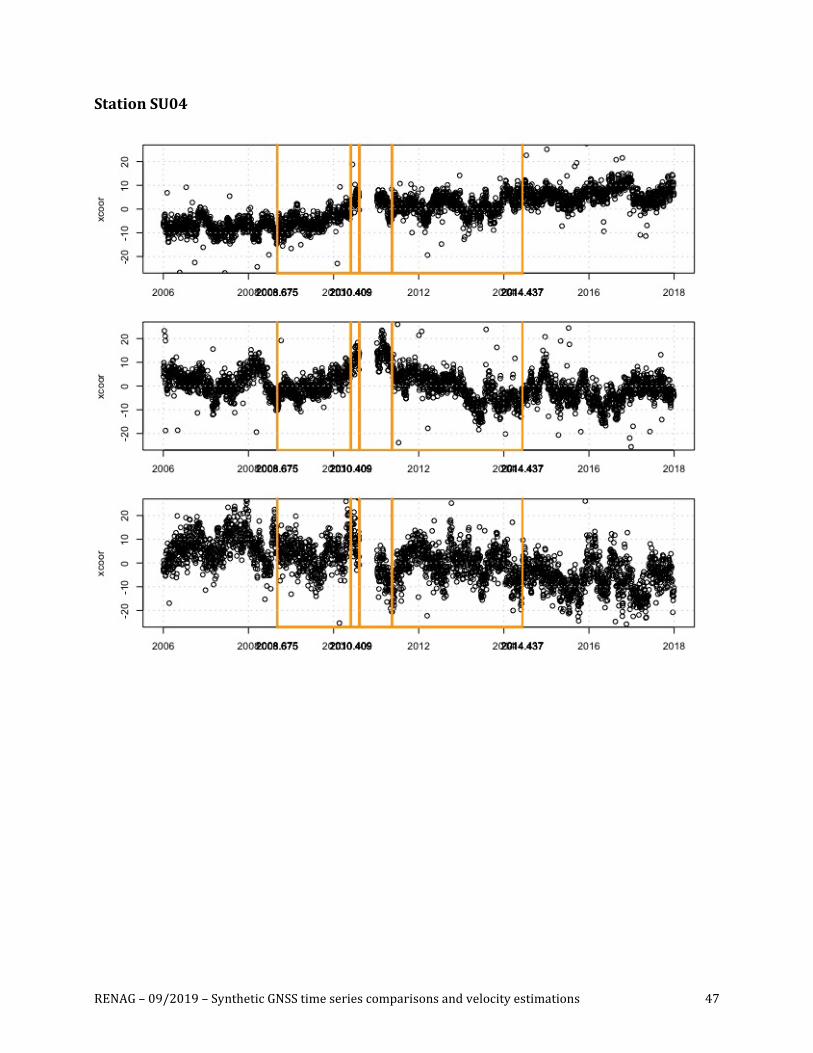
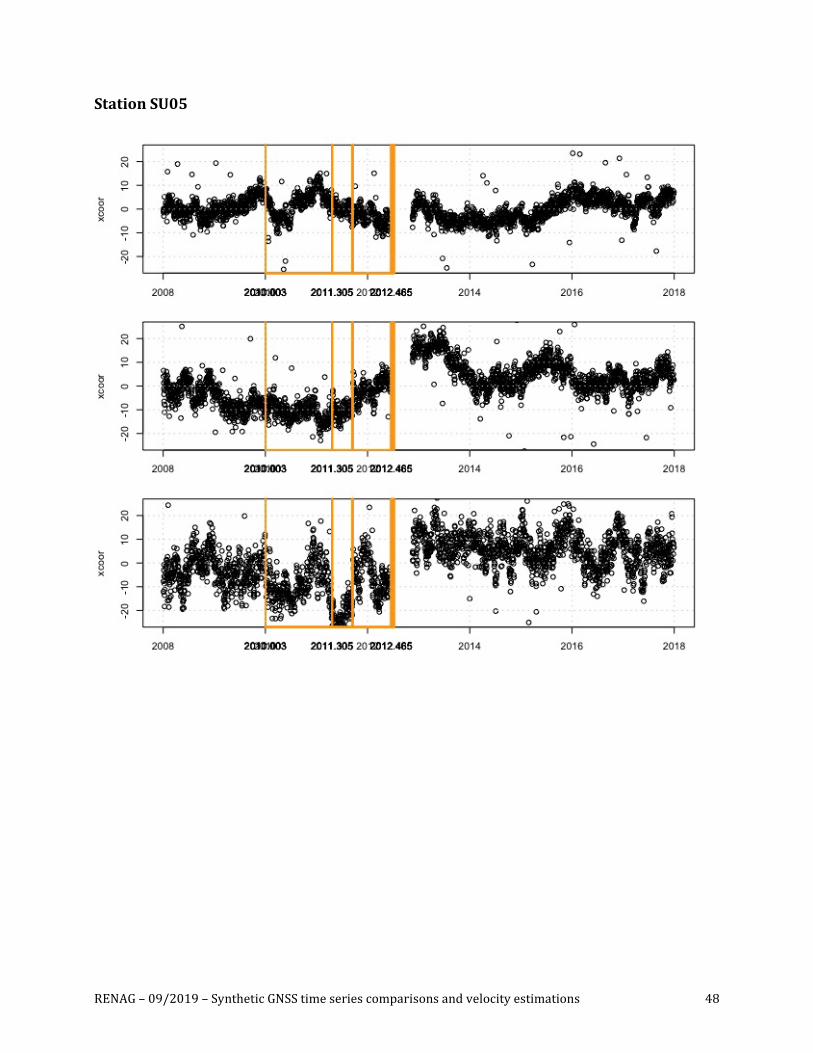
Appendix1.Synthetictimeseries
EachfigureshowsthedailypositionseriesofthestationNorth,EastandUpcomponents(inmm)asafunctionofthedate(inyr).Theorangeverticalbarsindicatethedatesofoffsetsimposedintheseries.Cf.textforstationcodes.
StationSC01
RENAG–09/2019–SyntheticGNSStimeseriescomparisonsandvelocityestimations 17
StationSC02
RENAG–09/2019–SyntheticGNSStimeseriescomparisonsandvelocityestimations 18
StationSC03
RENAG–09/2019–SyntheticGNSStimeseriescomparisonsandvelocityestimations 19
StationSC04
RENAG–09/2019–SyntheticGNSStimeseriescomparisonsandvelocityestimations 20
StationSC05
RENAG–09/2019–SyntheticGNSStimeseriescomparisonsandvelocityestimations 21
StationSC06
RENAG–09/2019–SyntheticGNSStimeseriescomparisonsandvelocityestimations 22
StationSC07
RENAG–09/2019–SyntheticGNSStimeseriescomparisonsandvelocityestimations 23
StationRC01
RENAG–09/2019–SyntheticGNSStimeseriescomparisonsandvelocityestimations 24
StationRC02
RENAG–09/2019–SyntheticGNSStimeseriescomparisonsandvelocityestimations 25
StationRC03
RENAG–09/2019–SyntheticGNSStimeseriescomparisonsandvelocityestimations 26
StationRC04
RENAG–09/2019–SyntheticGNSStimeseriescomparisonsandvelocityestimations 27
StationRC05
RENAG–09/2019–SyntheticGNSStimeseriescomparisonsandvelocityestimations 28
StationRC06
RENAG–09/2019–SyntheticGNSStimeseriescomparisonsandvelocityestimations 29
StationRC07
RENAG–09/2019–SyntheticGNSStimeseriescomparisonsandvelocityestimations 30
StationMR01
RENAG–09/2019–SyntheticGNSStimeseriescomparisonsandvelocityestimations 31
StationMR02
RENAG–09/2019–SyntheticGNSStimeseriescomparisonsandvelocityestimations 32
StationMR03
RENAG–09/2019–SyntheticGNSStimeseriescomparisonsandvelocityestimations 33
StationMR04
RENAG–09/2019–SyntheticGNSStimeseriescomparisonsandvelocityestimations 34
StationMR05
RENAG–09/2019–SyntheticGNSStimeseriescomparisonsandvelocityestimations 35
StationMR06
RENAG–09/2019–SyntheticGNSStimeseriescomparisonsandvelocityestimations 36
StationMR07
RENAG–09/2019–SyntheticGNSStimeseriescomparisonsandvelocityestimations 37
StationRU01
RENAG–09/2019–SyntheticGNSStimeseriescomparisonsandvelocityestimations 38
StationRU02
RENAG–09/2019–SyntheticGNSStimeseriescomparisonsandvelocityestimations 39
StationRU03
RENAG–09/2019–SyntheticGNSStimeseriescomparisonsandvelocityestimations 40
StationRU04
RENAG–09/2019–SyntheticGNSStimeseriescomparisonsandvelocityestimations 41
StationRU05
RENAG–09/2019–SyntheticGNSStimeseriescomparisonsandvelocityestimations 42
StationRU06
RENAG–09/2019–SyntheticGNSStimeseriescomparisonsandvelocityestimations 43
StationRU07
RENAG–09/2019–SyntheticGNSStimeseriescomparisonsandvelocityestimations 44
StationSU01
RENAG–09/2019–SyntheticGNSStimeseriescomparisonsandvelocityestimations 45
StationSU02
RENAG–09/2019–SyntheticGNSStimeseriescomparisonsandvelocityestimations 46
StationSU03
RENAG–09/2019–SyntheticGNSStimeseriescomparisonsandvelocityestimations 47
StationSU04
RENAG–09/2019–SyntheticGNSStimeseriescomparisonsandvelocityestimations 48
StationSU05
RENAG–09/2019–SyntheticGNSStimeseriescomparisonsandvelocityestimations 49
StationSU06
RENAG–09/2019–SyntheticGNSStimeseriescomparisonsandvelocityestimations 50
StationSU07
RENAG–09/2019–SyntheticGNSStimeseriescomparisonsandvelocityestimations 51
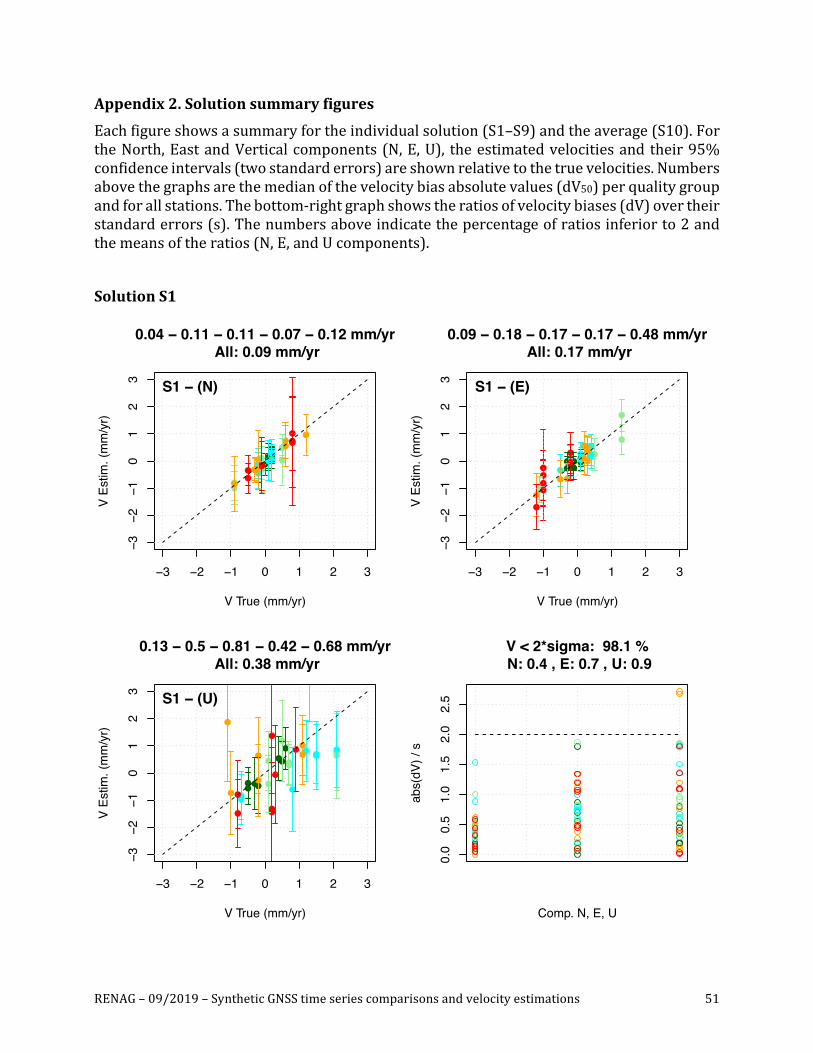
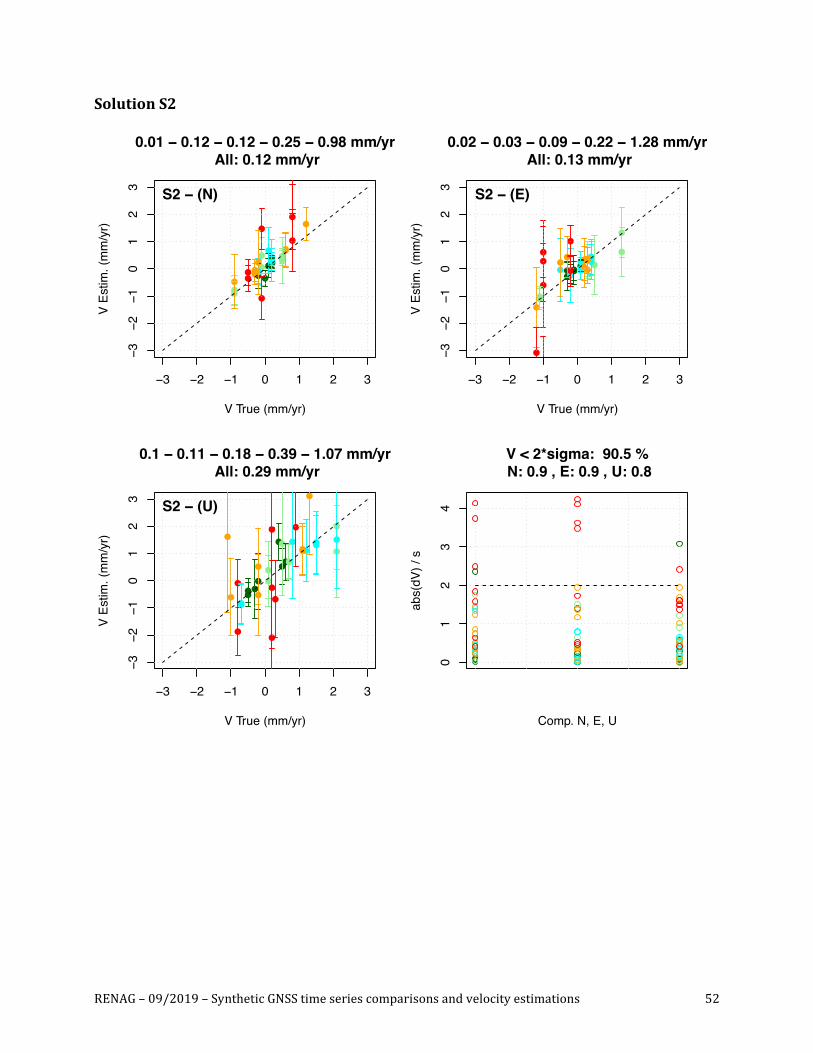
Appendix2.Solutionsummaryfigures
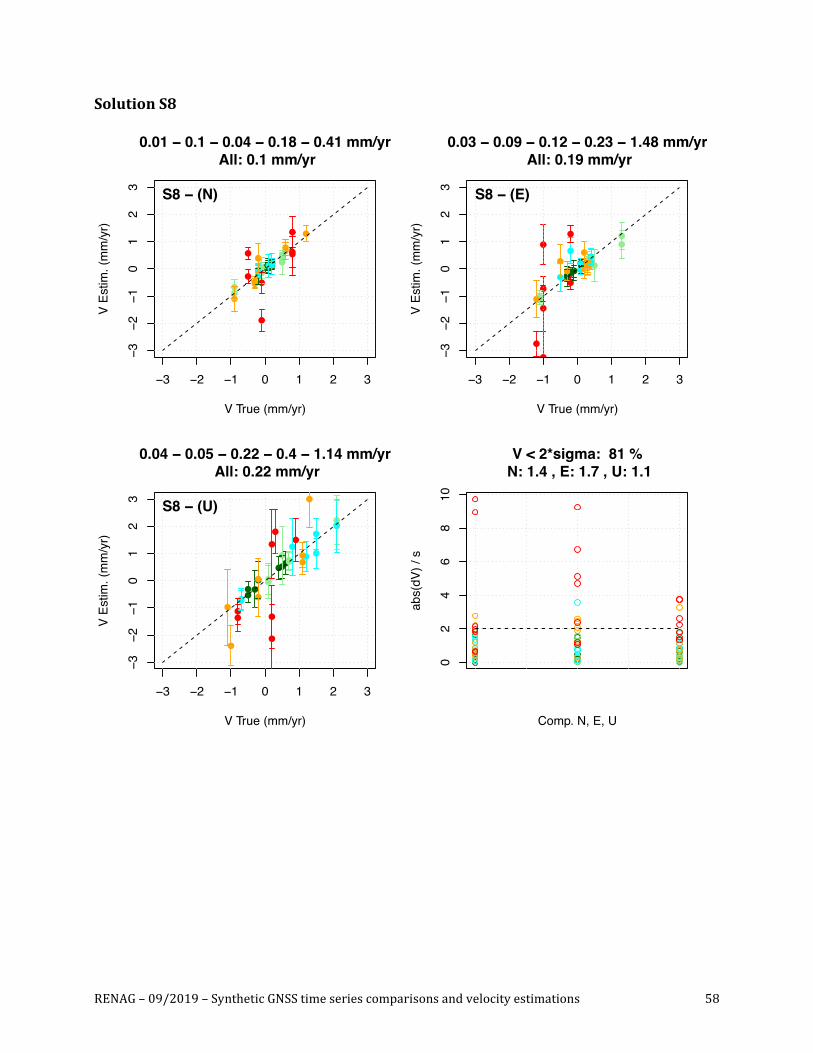
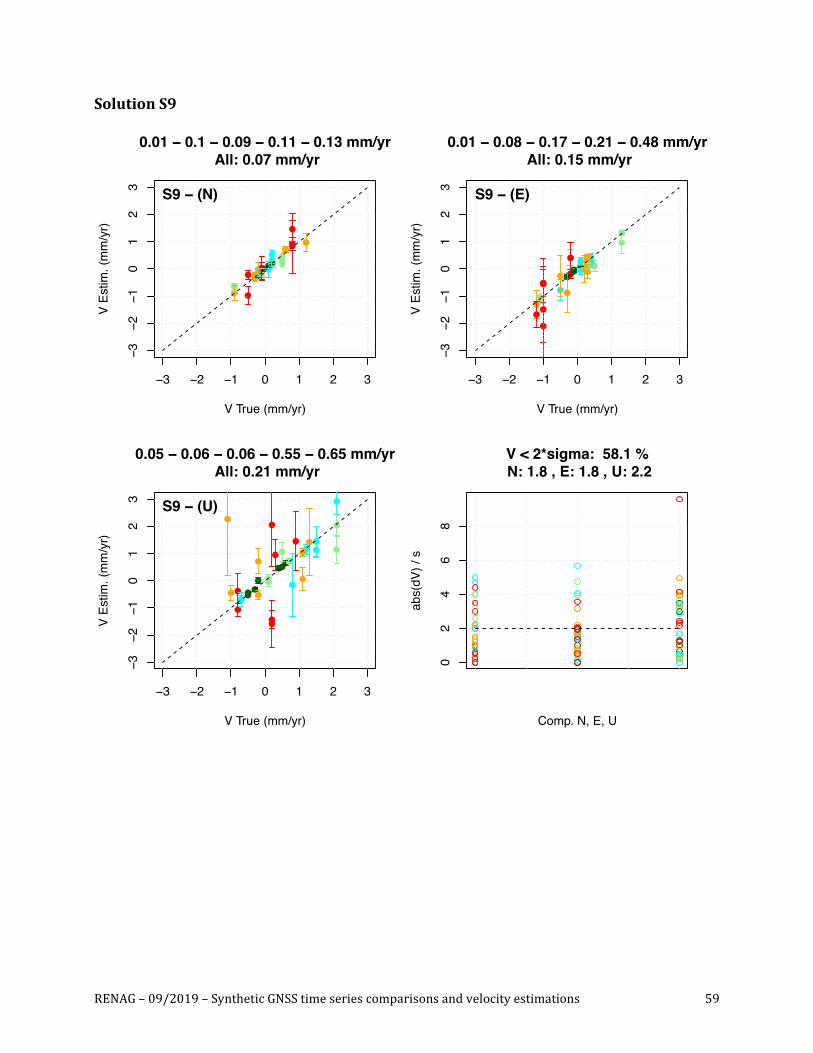
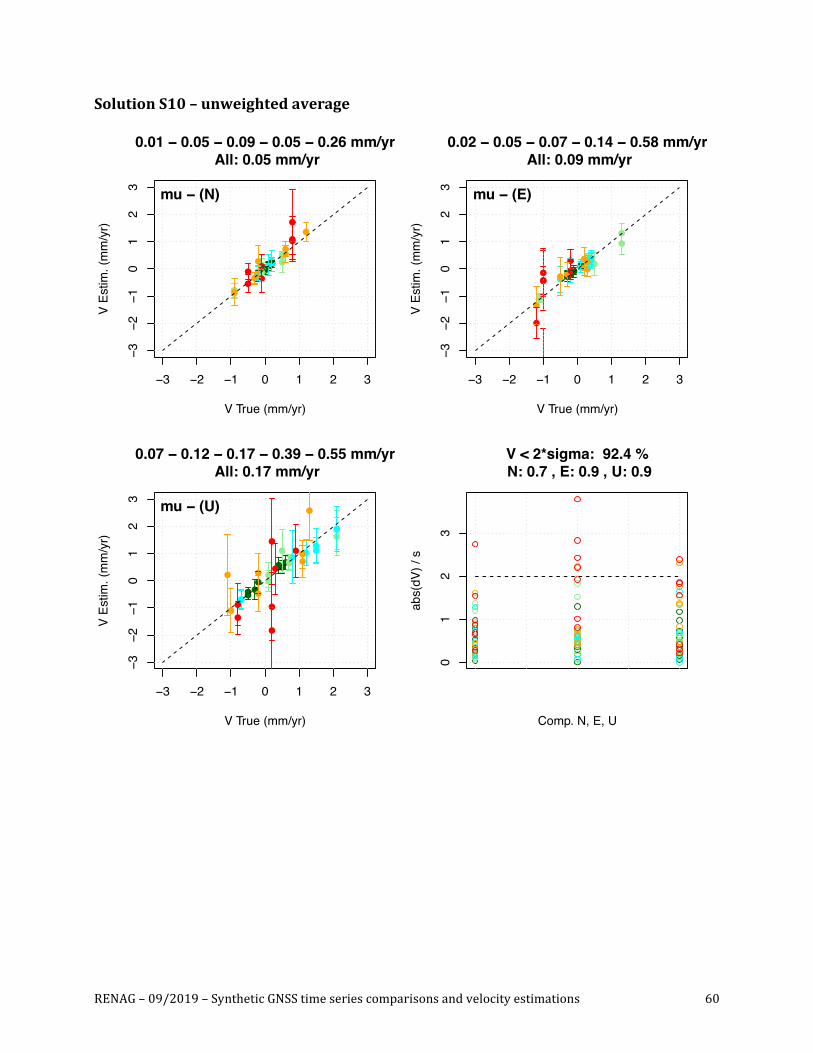
Eachfigureshowsasummaryfortheindividualsolution(S1–S9)andtheaverage(S10).FortheNorth,EastandVerticalcomponents(N,E,U), theestimatedvelocitiesandtheir95%confidenceintervals(twostandarderrors)areshownrelativetothetruevelocities.Numbersabovethegraphsarethemedianofthevelocitybiasabsolutevalues(dV50)perqualitygroupandforallstations.Thebottom-rightgraphshowstheratiosofvelocitybiases(dV)overtheirstandarderrors(s).Thenumbersaboveindicatethepercentageofratiosinferiorto2andthemeansoftheratios(N,E,andUcomponents).
SolutionS1
−3 −2 −1 0 1 2 3
−3−2
−10
12
3
V True (mm/yr)
V Es
tim. (
mm
/yr)
0.04 − 0.11 − 0.11 − 0.07 − 0.12 mm/yr All: 0.09 mm/yr
S1 − (N)
−3 −2 −1 0 1 2 3
−3−2
−10
12
3
V True (mm/yr)
V Es
tim. (
mm
/yr)
0.09 − 0.18 − 0.17 − 0.17 − 0.48 mm/yr All: 0.17 mm/yr
S1 − (E)
−3 −2 −1 0 1 2 3
−3−2
−10
12
3
V True (mm/yr)
V Es
tim. (
mm
/yr)
0.13 − 0.5 − 0.81 − 0.42 − 0.68 mm/yr All: 0.38 mm/yr
S1 − (U)
0.0
0.5
1.0
1.5
2.0
2.5
Comp. N, E, U
abs(
dV) /
s
V < 2*sigma: 98.1 % N: 0.4 , E: 0.7 , U: 0.9
RENAG–09/2019–SyntheticGNSStimeseriescomparisonsandvelocityestimations 52
SolutionS2
−3 −2 −1 0 1 2 3
−3−2
−10
12
3
V True (mm/yr)
V Es
tim. (
mm
/yr)
0.01 − 0.12 − 0.12 − 0.25 − 0.98 mm/yr All: 0.12 mm/yr
S2 − (N)
−3 −2 −1 0 1 2 3
−3−2
−10
12
3
V True (mm/yr)V
Estim
. (m
m/y
r)
0.02 − 0.03 − 0.09 − 0.22 − 1.28 mm/yr All: 0.13 mm/yr
S2 − (E)
−3 −2 −1 0 1 2 3
−3−2
−10
12
3
V True (mm/yr)
V Es
tim. (
mm
/yr)
0.1 − 0.11 − 0.18 − 0.39 − 1.07 mm/yr All: 0.29 mm/yr
S2 − (U)
01
23
4
Comp. N, E, U
abs(
dV) /
s
V < 2*sigma: 90.5 % N: 0.9 , E: 0.9 , U: 0.8
RENAG–09/2019–SyntheticGNSStimeseriescomparisonsandvelocityestimations 53
SolutionS3
−3 −2 −1 0 1 2 3
−3−2
−10
12
3
V True (mm/yr)
V Es
tim. (
mm
/yr)
0.01 − 0.03 − 0.08 − 0.2 − 0.28 mm/yr All: 0.08 mm/yr
S3 − (N)
−3 −2 −1 0 1 2 3
−3−2
−10
12
3
V True (mm/yr)V
Estim
. (m
m/y
r)
0.01 − 0.08 − 0.05 − 0.18 − 0.63 mm/yr All: 0.08 mm/yr
S3 − (E)
−3 −2 −1 0 1 2 3
−3−2
−10
12
3
V True (mm/yr)
V Es
tim. (
mm
/yr)
0.04 − 0.04 − 0.19 − 0.34 − 0.8 mm/yr All: 0.19 mm/yr
S3 − (U)
01
23
45
67
Comp. N, E, U
abs(
dV) /
s
V < 2*sigma: 81.9 % N: 1.1 , E: 1.2 , U: 1.3
RENAG–09/2019–SyntheticGNSStimeseriescomparisonsandvelocityestimations 54
SolutionS4
−3 −2 −1 0 1 2 3
−3−2
−10
12
3
V True (mm/yr)
V Es
tim. (
mm
/yr)
0.01 − 0.06 − 0.08 − 0.15 − 0.17 mm/yr All: 0.08 mm/yr
S4 − (N)
−3 −2 −1 0 1 2 3
−3−2
−10
12
3
V True (mm/yr)V
Estim
. (m
m/y
r)
0.02 − 0.11 − 0.11 − 0.14 − 0.53 mm/yr All: 0.1 mm/yr
S4 − (E)
−3 −2 −1 0 1 2 3
−3−2
−10
12
3
V True (mm/yr)
V Es
tim. (
mm
/yr)
0.1 − 0.21 − 0.12 − 0.18 − 0.45 mm/yr All: 0.15 mm/yr
S4 − (U)
020
040
060
080
0
Comp. N, E, U
abs(
dV) /
s
V < 2*sigma: 91.4 % N: 0.8 , E: 29.5 , U: 0.7

RENAG–09/2019–SyntheticGNSStimeseriescomparisonsandvelocityestimations 55
SolutionS5
−3 −2 −1 0 1 2 3
−3−2
−10
12
3
V True (mm/yr)
V Es
tim. (
mm
/yr)
0.04 − 0.19 − 0.07 − 0.13 − 0.3 mm/yr All: 0.11 mm/yr
S5 − (N)
−3 −2 −1 0 1 2 3
−3−2
−10
12
3
V True (mm/yr)V
Estim
. (m
m/y
r)
0.02 − 0.21 − 0.14 − 0.14 − 1.08 mm/yr All: 0.14 mm/yr
S5 − (E)
−3 −2 −1 0 1 2 3
−3−2
−10
12
3
V True (mm/yr)
V Es
tim. (
mm
/yr)
0.03 − 0.22 − 0.31 − 0.5 − 0.32 mm/yr All: 0.23 mm/yr
S5 − (U)
020
4060
80
Comp. N, E, U
abs(
dV) /
s
V < 2*sigma: 21.9 % N: 8.5 , E: 13.1 , U: 14.2
RENAG–09/2019–SyntheticGNSStimeseriescomparisonsandvelocityestimations 56
SolutionS6
−3 −2 −1 0 1 2 3
−3−2
−10
12
3
V True (mm/yr)
V Es
tim. (
mm
/yr)
0.01 − 0.06 − 0.04 − 0.12 − 0.08 mm/yr All: 0.05 mm/yr
S6 − (N)
−3 −2 −1 0 1 2 3
−3−2
−10
12
3
V True (mm/yr)V
Estim
. (m
m/y
r)
0.01 − 0.04 − 0.05 − 0.14 − 0.28 mm/yr All: 0.09 mm/yr
S6 − (E)
−3 −2 −1 0 1 2 3
−3−2
−10
12
3
V True (mm/yr)
V Es
tim. (
mm
/yr)
0.05 − 0.02 − 0.17 − 0.23 − 0.62 mm/yr All: 0.16 mm/yr
S6 − (U)
01
23
4
Comp. N, E, U
abs(
dV) /
s
V < 2*sigma: 85.7 % N: 0.9 , E: 0.9 , U: 1.4
RENAG–09/2019–SyntheticGNSStimeseriescomparisonsandvelocityestimations 57
SolutionS7
−3 −2 −1 0 1 2 3
−3−2
−10
12
3
V True (mm/yr)
V Es
tim. (
mm
/yr)
0.01 − 0.03 − 0.13 − 0.25 − 0.37 mm/yr All: 0.11 mm/yr
S7 − (N)
−3 −2 −1 0 1 2 3
−3−2
−10
12
3
V True (mm/yr)V
Estim
. (m
m/y
r)
0.01 − 0.05 − 0.07 − 0.11 − 0.81 mm/yr All: 0.09 mm/yr
S7 − (E)
−3 −2 −1 0 1 2 3
−3−2
−10
12
3
V True (mm/yr)
V Es
tim. (
mm
/yr)
0.04 − 0.15 − 0.21 − 0.33 − 0.53 mm/yr All: 0.21 mm/yr
S7 − (U)
05
1015
2025
3035
Comp. N, E, U
abs(
dV) /
s
V < 2*sigma: 21.9 % N: 6.6 , E: 6.4 , U: 6.4
RENAG–09/2019–SyntheticGNSStimeseriescomparisonsandvelocityestimations 58
SolutionS8
−3 −2 −1 0 1 2 3
−3−2
−10
12
3
V True (mm/yr)
V Es
tim. (
mm
/yr)
0.01 − 0.1 − 0.04 − 0.18 − 0.41 mm/yr All: 0.1 mm/yr
S8 − (N)
−3 −2 −1 0 1 2 3
−3−2
−10
12
3
V True (mm/yr)V
Estim
. (m
m/y
r)
0.03 − 0.09 − 0.12 − 0.23 − 1.48 mm/yr All: 0.19 mm/yr
S8 − (E)
−3 −2 −1 0 1 2 3
−3−2
−10
12
3
V True (mm/yr)
V Es
tim. (
mm
/yr)
0.04 − 0.05 − 0.22 − 0.4 − 1.14 mm/yr All: 0.22 mm/yr
S8 − (U)
02
46
810
Comp. N, E, U
abs(
dV) /
s
V < 2*sigma: 81 % N: 1.4 , E: 1.7 , U: 1.1
RENAG–09/2019–SyntheticGNSStimeseriescomparisonsandvelocityestimations 59
SolutionS9
−3 −2 −1 0 1 2 3
−3−2
−10
12
3
V True (mm/yr)
V Es
tim. (
mm
/yr)
0.01 − 0.1 − 0.09 − 0.11 − 0.13 mm/yr All: 0.07 mm/yr
S9 − (N)
−3 −2 −1 0 1 2 3
−3−2
−10
12
3
V True (mm/yr)V
Estim
. (m
m/y
r)
0.01 − 0.08 − 0.17 − 0.21 − 0.48 mm/yr All: 0.15 mm/yr
S9 − (E)
−3 −2 −1 0 1 2 3
−3−2
−10
12
3
V True (mm/yr)
V Es
tim. (
mm
/yr)
0.05 − 0.06 − 0.06 − 0.55 − 0.65 mm/yr All: 0.21 mm/yr
S9 − (U)
02
46
8
Comp. N, E, U
abs(
dV) /
s
V < 2*sigma: 58.1 % N: 1.8 , E: 1.8 , U: 2.2
RENAG–09/2019–SyntheticGNSStimeseriescomparisonsandvelocityestimations 60
SolutionS10–unweightedaverage
−3 −2 −1 0 1 2 3
−3−2
−10
12
3
V True (mm/yr)
V Es
tim. (
mm
/yr)
0.01 − 0.05 − 0.09 − 0.05 − 0.26 mm/yr All: 0.05 mm/yr
mu − (N)
−3 −2 −1 0 1 2 3
−3−2
−10
12
3
V True (mm/yr)V
Estim
. (m
m/y
r)
0.02 − 0.05 − 0.07 − 0.14 − 0.58 mm/yr All: 0.09 mm/yr
mu − (E)
−3 −2 −1 0 1 2 3
−3−2
−10
12
3
V True (mm/yr)
V Es
tim. (
mm
/yr)
0.07 − 0.12 − 0.17 − 0.39 − 0.55 mm/yr All: 0.17 mm/yr
mu − (U)
01
23
Comp. N, E, U
abs(
dV) /
s
V < 2*sigma: 92.4 % N: 0.7 , E: 0.9 , U: 0.9
Related Documents


