1 Comparative Analysis of Regions with Distorted Segregation in Three Diploid Populations of Potato Norma C. Manrique-Carpintero*, Joseph J. Coombs*, Richard E. Veilleux † , C. Robin Buell § , and David S. Douches* * Department of Plant, Soil and Microbial Sciences, Michigan State University, 1066 Bogue St, Molecular Plant Sciences Bldg, East Lansing, MI, 48824, USA † Department of Horticulture, Virginia Polytechnic Institute and State University, 544 Latham Hall 220 Ag Quad Ln, Blacksburg, VA, 24061, USA § Department of Plant Biology, Michigan State University, 612 Wilson Road, East Lansing, MI, 48824, USA G3: Genes|Genomes|Genetics Early Online, published on June 24, 2016 as doi:10.1534/g3.116.030031 © The Author(s) 2013. Published by the Genetics Society of America.

Welcome message from author
This document is posted to help you gain knowledge. Please leave a comment to let me know what you think about it! Share it to your friends and learn new things together.
Transcript

1
Comparative Analysis of Regions with Distorted Segregation in Three Diploid Populations
of Potato
Norma C. Manrique-Carpintero*, Joseph J. Coombs*, Richard E. Veilleux†, C. Robin Buell§, and David S. Douches* * Department of Plant, Soil and Microbial Sciences, Michigan State University, 1066 Bogue St,
Molecular Plant Sciences Bldg, East Lansing, MI, 48824, USA
† Department of Horticulture, Virginia Polytechnic Institute and State University, 544 Latham
Hall 220 Ag Quad Ln, Blacksburg, VA, 24061, USA
§ Department of Plant Biology, Michigan State University, 612 Wilson Road, East Lansing, MI,
48824, USA
G3: Genes|Genomes|Genetics Early Online, published on June 24, 2016 as doi:10.1534/g3.116.030031
© The Author(s) 2013. Published by the Genetics Society of America.

2
Short Running Title
Distorted segregation in diploid potato
Key words
Recombination rates, high-dense linkage map, Infinium 8303 potato array
Corresponding Author
David S. Douches
Department of Plant, Soil and Microbial Sciences, Michigan State University
1066 Bogue St, Molecular Plant Sciences Bldg
East Lansing, MI, 48824, USA
Phone number: 517 884-6946
E-mail: [email protected]

3
Abstract
Genes associated with gametic and zygotic selection could underlie segregation distortion,
observed as alterations of expected Mendelian genotypic frequencies in mapping populations.
We studied highly dense genetic maps based on single nucleotide polymorphisms to elucidate
the genetic nature of distorted segregation in potato. Three intra- and interspecific diploid
segregating populations were used. DRH and D84 are crosses between the sequenced doubled
monoploid DM 1-3 516 R44 Solanum tuberosum Group Phureja and either RH89-039-16 S.
tuberosum or 84SD22, a S. tuberosum × S. chacoense hybrid. MSX902 is an interspecific cross
between 84SD22 and Ber83 S. berthaultii × 2x species mosaic. At the 0.05 significance level,
21%, 57% and 51% of the total markers mapped in DRH, D84 and MSX902 exhibited distorted
segregation. Segregation distortion regions for DRH were located on chromosomes 9 and 12; for
D84 on chromosomes 2, 3, 4, 6, 7 and 8; and on chromosomes 1, 2, 7, 9 and 12 for MSX902. In
general, each population had unique segregation distortion regions and directions of distortion.
Interspecific crosses showed greater levels of distorted segregation and lower recombination
rates as determined from the male parents. The different genomic regions where the segregation
distortion regions occurred in the three populations likely reflect unique genetic combinations
producing distorted segregation.

4
Introduction
Distorted segregation, the deviation of the observed genotypic ratios from the expected
frequencies based on Mendel’s laws of inheritance, is considered an evolutionary force primarily
associated with genetic factors involved in reproduction and fitness (Sandler and Novitski 1957;
Taylor and Ingvarsson 2003). Several mechanisms, as well as genes associated with distorted
segregation, have been reported in plants. In the meiotic drive system, deleterious alleles or
meiotic associated loci cause gametophytic abortion, sterility, or preferential transmission of
chromosomal segments or alleles to the germinal cells (Fishman and Saunders 2008; Kanizay et
al. 2013). Zygotic selection, chromosomal rearrangement and genomic interactions are also
associated with distorted segregation causing zygotic abortion, hybrid sterility, haploid
induction, and restriction of gene introgression (Gadish and Zamir 1987; Jiang et al. 2000; Moyle
and Graham 2006; Rieseberg et al. 1995; Xu et al. 2013). The type of cross and mapping
population can influence the incidence of genomic regions exhibiting distorted segregation (Liu
et al. 2010). Greater levels of distortion have been found in interspecific compared to
intraspecific crosses of various Solanaceae species, as well as in rice doubled haploid (DH)
compared to F2 populations derived from the same intraspecific cross (Yamagishi et al. 2010;
Zamir and Tadmor 1986). Genomic interactions causing distorted segregation decreased in near-
isogenic lines (NILs) compared with early backcross generations of a tomato interspecific
segregating population (Moyle and Graham 2006). In general, the study of segregation distortion
has been useful to screen and identify gametophytic mutants affecting male and female fertility
in plants (Baumbach et al. 2012; Grini et al. 1999; Lalanne et al. 2004), as well as several hybrid
sterility, hybrid weakness, and gametophytic competition genes acting as inter- or intraspecific

5
reproductive barriers (Harushima et al. 2002; Lu et al. 2002). Gametic and zygotic hybridization
barriers, their impact on the process of speciation and gene flow, have critical interest for both
plant evolutionists and breeders.
Distorted segregation has been commonly reported in linkage analysis of diploid populations of
potato (Bonierbale et al. 1988; Felcher et al. 2012; Gebhardt et al. 1991; Jacobs et al. 1995;
Kreike and Stiekema 1997; Rivard et al. 1996) with percentages of distortion varying from 6-
40%. In general, lower proportions of distorted segregation have been observed in intraspecific
crosses compared with populations derived from introgression of wild potato species.
Differences in chromosomal structure, presence of the self-incompatibility locus, meiotic
mutants [genetic variants affecting microsporogenesis or megasporogenesis (Peloquin et al.
1999)], and lethal alleles have been proposed as factors influencing distorted segregation in
potato (Chani et al. 2002; Gebhardt et al. 1991; Jacobs et al. 1995).
Highly saturated genetic maps facilitate the study of genetic phenomena such as distorted
segregation (Harushima et al. 1996). The genome coverage and density of markers of these maps
allow the identification of segregation distortion regions (SDRs). The SDRs are defined by
clusters of markers closely linked to genes causing distortion, as markers with distorted
segregation will co-segregate and result in the highest-skewed genotypic frequencies associated
with the distorting factor (Lu et al. 2002; Tai et al. 2000; Zamir and Tadmor 1986). Analysis of
SDRs in multiple mapping populations has been used to determine whether zygotic or
gametophytic factors are associated, and in some cases, to identify the genes underlying the
distorted segregation (Kumar et al. 2007; Lu et al. 2002; Wu et al. 2010; Xu et al. 1997).

6
Likewise, SDRs exhibiting similar patterns of distortion at the same chromosomal regions in
several species-related populations could lead to identification of common genetic factors
causing distorted segregation (Lu et al. 2002). Studies of SDRs are important to understand
evolutionary mechanisms triggering reproductive barriers between related species (Li et al.
2012). In plant breeding, detection of cross-specific SDR could help overcome limitations for
introgression of genes with improved breeding value. As disease resistance genes have been
reported to co-segregate with segregation distorters (Li et al. 2009; Tonguç et al. 2003),
understanding the direction and the rate of segregation distortion facilitate estimation of the
appropriate population size and strategy that would enable selection of individuals with the
desired trait (Li et al. 2010; Zhang et al. 2010). For example, if the trait of interest is linked to the
self-incompatibility locus, the most common distorted segregation factor in potato, then a larger
sized population would be necessary to identify progeny segregating the self-incompatibility
locus from the trait of interest. The parental allelic identity of the self-incompatibility locus
mediates the pollen-pistil incompatibility reproductive barrier that interferes with successful
fertilization in selfed and intraspecific crosses (Camadro et al. 2004). The self-incompatibility
locus (S) codes for an S-ribonuclease and is tightly linked to a S-F-box protein which are
expressed in the pistil and the pollen, respectively. A non-self recognition system allows pollen
fertilization (Kubo et al. 2010).
The objective of this study was to document the distorted segregation phenomenon for an
outcrossing, highly heterozygous species (potato) by comparing regions with distorted
segregation in three segregating diploid mapping populations. The Infinium 8303 Potato Array
was used to genotype and construct highly dense genetic maps for the three mapping populations

7
(Felcher et al. 2012). The SNP (Single Nucleotide Polymorphism) unified mapping platform
allowed comparison of commonly mapped regions, and showed that differential recombination
rates affected the number of saturated zones per map. High collinearly was identified in the five
genetic maps, with a total of 693 commonly mapped SNPs. Lower recombination rates were
found for interspecific compared to intraspecific hybrid parents, especially when used as the
male parent. Cross specific patterns of distortion were evident. The presence of the self-
incompatibility locus, deleterious alleles, and incongruity genes are likely candidates driving the
distortion.

8
Material and Methods
Mapping Populations
Four parental lines were used to generate three diploid mapping populations: the sequenced
doubled monoploid DM1-3 516 R44 (DM 1-3) Solanum tuberosum Group Phureja (Paz and
Veilleux 1999); two heterozygous breeding lines: a) 84SD22, a hybrid from S. tuberosum × S.
chacoense (Douches and Quiros 1987) and b) RH89-039-16 S. tuberosum (RH) hybrid, kindly
provided by Wageningen University Dr. Herman J. van Eck, (Rouppe van der Voort et al. 1997;
Van Os et al. 2006); and a c) wild potato S. berthaultii hybrid (Ber83) from the Michigan State
University Potato Breeding and Genetics Program (pedigree in Fig. S1). Three mapping
populations were developed from crosses between DM 1-3 × RH (DRH), DM 1-3 × 84SD22
(D84) and 84SD22 × Ber83 (MSX902). DRH and D84 populations were previously reported by
Felcher et al. (2012). The numbers of progeny per cross were 96, 130 and 129, for DRH, D84
and MSX902, respectively.
SNP Genotyping and Linkage Mapping
The parents and progeny of the three mapping populations were SNP genotyped using the
Infinium 8303 Potato Array (Felcher et al. 2012). DNA was extracted from leaf tissue using the
Qiagen DNeasy Plant Mini Kit (Qiagen, Germantown, MD), then quantified using Quant-iTTM
PicoGreen® dsDNA Assay Kit (Invitrogen, San Diego, CA) and adjusted to a concentration of 50
ng/μl. DNA (250 ng) was genotyped using the Infinium 8303 Potato Array and the Infinium®
HD Assay Ultra on an Illumina iScan Reader (Illumina, Inc., San Diego, CA). Fluorescent

9
signals were converted to SNP genotypic classes using the Illumina Genome Studio 2011.1
software (Illumina, San Diego, CA) and a three cluster custom file.
Segregating SNPs were selected from the raw genotypic data for each mapping population. SNPs
were removed from the initial dataset for the following reasons: low quality signal, any missing
data, monomorphism, inconsistences or missing data in the SNP genotype calls within two
technical repetitions of each parental line, and localization in more than one position in the
potato genome sequence version 4.03 (Sharma et al. 2013). An additional visual inspection of
clustering patterns in Genome Studio was performed to identify and exclude SNPs potentially
located within paralogous loci in the genome.
The biallelic nature of these SNP markers permitted the identification of two segregation patterns
in these mapping populations. Single parent (female or male) segregation (1:1) or simultaneous
segregation of both parents (1:2:1). According to the type of segregation, we coded the
segregating SNPs as <lmxll>, <nnxnp> and <hkxhk> and imported the genotypic data to
JoinMap 4.1 software for mapping (Van Ooijen 2006). Redundant markers and individuals were
excluded from linkage analysis. Linkage groups were estimated based on a test for independence
with a LOD threshold from 3 to 10. Final maps were calculated using the multipoint maximum
likelihood mapping algorithm adjusted for cross-pollinated populations (Van Ooijen 2011).
Information on the SNP location within the potato genome was also used to identify the linkage
groups, and to adjust the direction of the order of loci along the genetic maps according with
potato pseudomolecule assembly. The quality of each map was validated by examining the
recombination break point patterns in the progeny as well as the nearest neighbor fit (N.N. Fit)

10
values. These criteria allowed identification of individuals with unexpectedly more
recombination events, or SNPs occurring outside their expected positions.
Segregation Distortion Study
Distorted segregation, deviation of the expected 1:1 (homozygous:heterozygous) and 1:2:1
(homozygous:heterozygous:homozygous) Mendelian genotypic class frequencies, was
determined by a Chi-square test for each SNP marker. Four levels of significance 5, 1, 0.1 and
0.001% that corresponded to P-values lower than 0.05, 0.01, 0.001, and 0.00001, were used to
study distorted segregation. For the D84 and DRH populations, only heterozygous markers in the
male parental line were expected to segregate with a 1:1 ratio, whereas for MSX902, three types
of loci were segregating: loci segregating with an expected 1:2:1 ratio, when both male and
female parents were heterozygous at a SNP locus, and loci segregating with an expected 1:1 ratio
when either the male or female parent was heterozygous and the other parent homozygous. SDRs
were defined when more than five closely linked markers, exhibiting significant distortion for a
threshold alpha level of 0.1%, clustered at a minimal distance of 5 cM. Patterns and distribution
of SDRs along chromosomes were characterized. Thus, two parent chromosome-haplotypes were
established based on marker order and linkage phases calculated for loci segregating in
individual parental maps. The chromosome-haplotype segregation frequencies were plotted
against physical and genetic position and used to characterize the distribution of SDRs.
Recombination Rate Variation
Genetic maps are calculated based on the number of recombination events in a segregating
population. Comparison of physical and genetic maps reveals variation in recombination rate on

11
a scale of megabases (Mb). The physical position of SNPs in the Infinium 8303 Potato Array
was based on potato pseudomolecule assembly version 4.03 (Sharma et al. 2013). Total physical
length of each map was calculated based on the genomic coverage of mapped loci. The first Mb
position of mapped loci per chromosome was subtracted from the last position. The total
physical map length was calculated as the sum of the physical map lengths of all 12
chromosomes. The average genome-wide recombination rate was obtained by dividing the total
linkage map size in centimorgans (cM) by its corresponding physical map length in Mb for each
population. The average chromosome recombination rate in cM/Mb was calculated by dividing
the genetic and physical lengths of each chromosome. Variation for recombination rate along
chromosomes was also estimated. The genetic position of each marker was plotted against its
physical position to generate Marey maps (Chakravarti 1991). Outlier loci in the curve, due to
discrepancies in sequential increasing order between the genetic and the physical position, were
excluded from the data set. SNPs that were genetically mapped but did not have assigned
positions on any of the 12 chromosomes of the potato pseudomolecule assembly 4.03, were also
eliminated from the analysis. Cubic spline interpolations were calculated to obtain smooth and
monotonic curves (Yu et al. 2001). The recombination rates were estimated as the derivative of
the adjusted curve for each chromosome. Variation of recombination rates was characterized by
plotting against Mb position along the chromosomes. The calculations and graphs were made
using JMP® 10 SAS Institute Inc. (Cary, NC, USA).
Epistatic Interactions
Nucleotide coding of loci at unique bin positions was reconstructed for each homologous
chromosome for the entire progeny of each mapping population based on linkage phases

12
estimated by JoinMap4.1. All possible pairs of markers were tested for nonrandom association of
alleles at unlinked loci using the linkage disequilibrium analysis in Tassel4.0 (Bradbury et al.
2007). A P-value threshold of 0.005 was established to identify the significant allelic
interactions. This threshold was obtained based on the probability distribution of r2 from the
linkage disequilibrium analysis for all the crosses as done in McDaniel et al. (2007).
Map Comparison
Maps of DRH, D84 and MSX902 mapping populations were aligned to check concordance of
SNPs mapped on homologous chromosomes. Graphs were constructed using MapChart software
(Voorrips 2002).

13
Results and Discussion
Linkage Map Construction
Highly dense genetic maps with different frequencies of loci with distorted segregation were
compared to detect the effect of these loci on quality and resolution of the genetic maps (Table
1). Two criteria were used to exclude loci with distorted segregation, a segregation ratio
threshold and a chi-square test using an alpha threshold level of 0.001%. The initial map
included all segregating SNPs. A second map, made only for DRH and MSX902 mapping
populations, used a segregation ratio threshold of 1:10 and 1:5:5 based on population size, for
paternal or maternal and bi-parental segregation types, respectively. The D84 mapping
population did not have markers outside this threshold criterion. A third map was generated with
the set of SNPs remaining after excluding distorted segregation based on a 0.001% alpha
threshold. In general, the markers had a wide and similar distribution along the linkage groups
when comparing the maps for each mapping population. Map quality in terms of interval
distances was not modified, but resolution decreased, especially when distorted loci at 0.001%
were excluded. The number of uniquely mapped loci or bins decreased 4.3% for DRH, 20% for
D84 and 3.1% for MSX902. On chromosome 12 the linkage group was split in two new groups
when loci were excluded using the 1:10 threshold, and reduced to a small representation when
using 0.001% alpha threshold. There were considerably fewer mapped SNPs on chromosome 12
for DRH and MSX902, and chromosomes 2, 3, 4, 6, 7, and 8 for D84 than in the other maps,
resulting in an overall smaller size of the D84 genetic map. In the three different distortion-
mapping conditions for each mapping population, common SNPs were mapped to the same
chromosomes in each mapping population although some rearrangements of SNP order along the
chromosomes was observed. However, this SNP position shifting among maps occurred mainly

14
in chromosomes for the combined map of MSX902, which was not present in the individual
parental maps. Similarly, the minimal interval distances in the integrated map of MSX902 were
smaller than expected, which was not observed in individual parental maps with only maternal or
paternal loci.
Three major factors could affect mapping quality: genotyping errors, missing data and distorted
segregation (Hackett and Broadfoot 2003). In this analysis, SNPs with missing data were
excluded, and genotype calls were manually evaluated to eliminate any SNP with genotype
errors. Confirmation of recombination break points, nearest neighbor fit (N.N. Fit) values, and
presence of markers with suspicious linkage in JoinMap4.1 also helped validate map quality.
There were no differences in terms of map order and interval distances due to distorted
segregation as found by Hackett and Broadfoot (2003). In their study, genotyping errors were the
main factor affecting map quality. As we observed in preliminary maps (data not shown),
genotyping error created long interval distances in the chromosome flanking regions, joined
different linkage groups, and produced rearrangements of SNP order along chromosomes. The
multipoint maximum likelihood method adjusted for cross-pollinated populations in JoinMap4.1
used in this analysis has several advantages: a) use of Gibbs sampling to estimate multipoint
recombination frequency for each parent separately but simultaneously taking linkage phase into
account; b) simulated annealing to determine the order of loci using maximum likelihood, and c)
spatial sampling to help to determine the missing genotypes and the genotyping errors (Van
Ooijen 2011). We also used the test of independence of segregation to calculate the linkage
groups; this test is recommended because it is not affected by systematic segregation distortion
(Maliepaard et al. 1997). JoinMap4.1 estimates the maps of the two parents separately and

15
simultaneously under the constraint that the order of the loci with bi-parental segregation is the
same in both maps. The integrated map is calculated by averaging lengths over anchored
segments and by interpolating or extrapolating for markers segregating in one parent only. This
process can produce incorrect ordering in some segments. Thus, the few shifts in the order of loci
in the combined map of MSX902 in comparison to individual parental maps were likely due to
the manner that JoinMap4.1 generated the combined map. The recombination probabilities
calculated by maximum likelihood in the combined map also creates the small interval distances
reported.
Since the map order and size were similar among the different distortion-mapping conditions, the
map with all segregating loci detected per mapping population was used for further analysis
(Table 2). For the two populations with DM 1-3 as a female parent, the genetic size of the map
was 813.2 cM for DRH and 637.9 cM for D84. For the MSX902 cross, three genetic maps were
generated, a combined map of 781.1 cM and two separate maps for each parent of 808.1 cM for
84SD22 and 730.3 cM for Ber83. The average density of markers, estimated for total number of
loci mapped to unique bin positions, ranged from 1 – 2 cM per SNP with interval genetic
distances between 0.004 and 14.2 cM. The average number of SNPs mapped per chromosome
varied from 162 to 254 in the populations, ranging from a minimum of 88 to a maximum of 362
SNPs per chromosome. The Infinium 8303 Potato Array has a genome wide coverage of 720.6
Mb of the 725.1 Mb of the net sequence assembled in 12 pseudomolecules of potato genome
sequence version 4.03. The physical size of DRH, D84 and MSX902 corresponded to 99.3, 99
and 99.2% of genome-wide coverage of the array.

16
Besides genome-wide coverage, the Infinium 8303 Potato Array provided many polymorphic
markers 1,948, 2,348, and 3,043 for DRH, D84 and MSX902 populations, respectively.
Therefore, small population size and low recombination rates were the main limitations to
generate more saturated maps for DRH, D84 and Ber83 with 414, 460, and 469 recombination
bins compared to 84SD22 in MSX902 with 533. The ultrahigh-density map of potato created
with a set of 10,365 AFLP and SSR, and a population of 136 individuals had 569 maternal and
549 paternal bin signatures (Van Os et al. 2006). The greatest interval marker distances in DRH,
D84 and MSX902 varied from 9.3 to 14.3 cM. These gaps could be associated with alternating
recombination hot and cold spots on the genome, but also with non-polymorphic regions in the
genome (Van Os et al. 2006).
Comparative Analysis of Genetic Maps
The number of commonly mapped SNPs in the three mapping populations was calculated, and a
map comparison was done to check SNP co-localization between homologous chromosomes in
the DRH, D84, and MSX902 maps. A total of 4,130 SNPs from the 8,303 total SNPs on the
Infinium Potato Array was mapped in at least one of the three mapping populations, while 693
SNPs were commonly mapped in all the mapping populations (Table 3). Even though differences
in recombination rates caused modifications of genetic distances between loci for each mapping
population, there was 98.4% (680) concordance in SNP order along chromosomes for the
commonly mapped SNPs in all the mapping populations, and two SNPs mapped to different
chromosome in each mapping population. From the 760 commonly mapped SNPs in DRH and
D84, two mapped to different chromosomes, and one on chromosome 12 shifted 19.7 cM in
order position between D84 and DRH. In DRH and MSX902, 1,001 SNPs were mapped in both

17
mapping populations. Four of those SNPs were located on different chromosomes, and 27 SNPs
shifted position within neighboring loci (0.02 – 3 cM) along sequential marker order between
mapping populations, two SNPs on chromosome 9 and 11 shifted 23.9 and 7.9 cM, respectively.
Comparing D84 and MSX902, 31 of the 2,141 commonly mapped SNPs shifted within close
positions (0.2 – 2.6 cM). The final comparative map unified 1,612 SNPs that corresponded to
unique positions of DRH, D84 and MSX902 genetic maps and the common maker positions
commonly mapped to all mapping populations and any combination of two mapping populations
(Fig. S2).
Distorted Segregation
Hybridization may cause interactions involving a wide range of type and levels of genic
divergence between the parental forms, due to intrinsic or environmentally mediated
incompatibilities (Abbott et al. 2013). The proportion of distorted segregation in the progeny of
hybrid populations could be considered as an estimation of level of hybrid intrinsic
incompatibilities, since in several cases this has been reported as positively correlated with the
level of genomic divergence in inter- and intraspecific parents (Hall and Willis 2005). The
percentage of loci with distorted segregation in this study was calculated at four levels of
significance using the Chi-square test (5, 1 0.1 and 0.001%); the latter considered the proportion
of loci with the greatest levels of distortions (Table 4 and Tables S1 - S6). At the 5% level of
significance, distorted segregation ranged from 21% to 63% for the three mapping populations.
There was a wide distribution of loci with distorted segregation at this level of significance,
mostly located on chromosomes 1, 2, 9, 11 and 12 for DRH. For D84, loci with distorted
segregation occurred on 11 chromosomes with the exception being chromosome 9. The

18
combined map of MSX902 exhibited loci with distorted segregation on all chromosomes.
However, based on the segregation type (bi-parental, maternal or paternal), loci with distorted
segregation were located on: all chromosomes, all chromosomes except chromosomes 1, 3 and
10; and all chromosomes except chromosome 8 for each category, respectively. At the 1% and
0.1% threshold of significance, the amount of distorted segregation dropped to ranges of 15-45%
and 9-39%, respectively. The distribution of distorted segregation at these levels of significance
was restricted to fewer chromosomes. For DRH, most of the loci with distorted segregation at the
1% of significance were on chromosomes 2, 9 and 12, whereas at the 0.1% level of significance
they were located on chromosomes 9 and 12 (Fig. 1 A). For D84, chromosomes 2, 3, 4, 5, 6, 7, 8
and 12 exhibited loci with distortion at the 1% of significance, and chromosomes 2, 3, 4, 6, 7,
and 8 at the 0.1% level of significance (Fig. 1 B). For MSX902, loci with distorted segregation
were located on all chromosomes at the 1% of significance, with only a few loci on
chromosomes 4, 10 and 11. For the biparental segregation type, they were primarily on
chromosomes 1, 2, 5, 7, 8 and 12; maternal segregation type on chromosomes 2, 7, and 12; and
paternal segregation type on chromosomes 1, 2, 3, 6, 7, 9, 12. At the 0.1% level of significance,
the distorted segregation spanned chromosomes 1, 2, 5, 6, 7, 9 and 12: on chromosomes 2 and 9
for maternal (Fig. 1 C); chromosomes 1, 2, 7, 12 for paternal segregation type (Fig. 1 D);
chromosomes 2, 5, 6, 7, and 12 for biparental (Fig. S3). In general, the lowest proportion of loci
with distorted segregation occurred in the DRH, whereas D84 had the greatest proportion of
distortion, widely distributed across many chromosomes. The proportion of loci with distorted
segregation corresponded with the level of divergence between parents of each mapping
population. DRH being an intraspecific cross, MSX902 and D84 interspecific crosses with
greater divergence in D84.

19
The percentage of highly distorted segregation calculated based on 0.001% threshold of
significance ranged between 0% and 35% across the three mapping populations. The loci with
highly distorted segregation were located exclusively on chromosome 12 for DRH,
chromosomes 2, 3, 4, 6, 7, and 8 for D84, and chromosomes 2, 7 and 12 for MSX902 maps. In
addition to the chromosome location, the proportion of mapped loci with distorted segregation
also varied among chromosomes. For DRH, all loci on chromosome 12 showed distorted
segregation at some level of significance, with 83% in the highly distorted segregation class. For
D84, more than 60% of mapped loci on chromosomes 3, 4, 6, 7, 8 exhibited highly distorted
segregation. More than 50% of mapped loci on chromosomes 2 and 12 showed distorted
segregation at the 0.1% of significance for MSX902 for biparental and paternal segregation,
while on chromosomes 2 for maternal segregation. On chromosome 12, 40% of mapped loci
showed highly distorted segregation.
Segregation Distortion Regions
Genetic as well as physical map positions of loci with distorted segregation at a 0.1%
significance level were used to define distribution of SDRs along chromosome maps (Table 5).
In heterozygous diploid potato clones, the male or female distorted segregation and allele
haplotype with preferential transmission was detected by analyzing those loci where only one
parent was segregating. The proportions of homozygous and heterozygous genotypic classes in
conjunction with the linkage phase from the genetic maps were used to construct the two
chromosome haplotypes for each parent and plot their segregation in the progeny along
chromosomes (Fig. 1 and Fig. S3). As expected, the distorted segregation patterns were gradual

20
and smoothly increasing toward the point with the greatest level of distortion. For the DRH and
D84 mapping populations only the male parental line was segregating. Two SDRs were
identified for DRH on chromosomes 9 and 12 (Fig. 1 A). The distortion on chromosome 9
reached a maximum proportion of 1:2.6 that peaked at 68 cM and 56.7 Mb in the genetic and
physical map positions, respectively. In a region near the end of the long arm, the SDR spanned a
length of 22.4 cM between 53.1-75.5 cM in the genetic map corresponding to 4.3 Mb between
54.1-58.4 Mb in the physical map. On chromosome 12, it was evident that genetic factors
throughout the chromosome caused preferential transmission of one chromosome haplotype of
RH (designated as RH-2). All SNPs mapped on chromosome 12 showed highly distorted
segregation with increasing levels of distortion towards the end of the long arm. The distortion
ranged from a ratio of 1:2.2 to 1:18.2, having a maximum peak of distortion at 4 Mb. DRH had
the lowest proportion of loci and fewer chromosomes with distorted segregation, but the greatest
distorted segregation ratio.
The D84 mapping population had six SDRs on chromosomes 2, 3, 4, 6, 7 and 8 (Fig. 1 B). For
chromosomes 2, 3 and 4, the distortion spanned smaller regions in the distal border of the short
arm of those chromosomes reaching levels of distortion of 1:3.0, 1:3.4 and 1:2.6, respectively.
The SDRs on chromosomes 6, 7 and 8 cover greater length with similar patterns of distortion
toward the distal end of the short arm of each chromosome. Chromosomes 6 and 8 have the
greatest proportions of distortion of 1:6.4 and 1:6, respectively. Almost all SNPs on chromosome
7 showed distorted segregation with a maximum proportion of distortion of 1:2.7, thus causing
preferential transmission of one of the entire chromosome haplotypes of 84SD22 (designated
84SD22-1).

21
In the case of MSX902 mapping population, SDRs were identified not only from each parental
line but also due to the influence of segregating bi-parental loci (Fig. 1 C, D and Fig. S3). The bi-
parental loci with distorted segregation found on chromosomes 2, 7 and 12 were partially
situated within the location of distorted segregation of maternal and/or paternal loci. However,
those on chromosomes 5 and 6 did not correspond to regions with distorted segregation of the
parental loci. When analyzing the four possible combinations of two homologues chromosome
haplotypes of each parent, there was a tendency for preferential transmission of one combination
of chromosomal haplotype or haplotype region influenced by parent segregation. Taking in
account only distorted segregation driven by maternal and paternal loci, we identified a total of
five SDRs in the combined map on chromosomes 1, 2, 7, 9 and 12. The SDR located in the short
arm of chromosome 1 came from the male parent, with a length of 11.8 cM and 17.6 cM for the
MSX902 and Ber83 genetic maps, and 6.6 Mb for both physical maps. The maximum ratio of
distortion was 1:1.9. On chromosome 2, both parental lines showed distortion along the
chromosome causing preferential transmission of one haplotype per parent. 84SD22 reached the
threshold for distorted segregation in a long region (40.3 cM and 21.5 Mb) with proportions up
to 1:2.2, while for Ber83, the SDR was confined to a 18.6 cM and 11.6 Mb region on the distal
long arm with ratios of 1:2. In the combined map, the region was located between 14.2 – 58.5
cM and 25.8 - 47.6 Mb. On chromosome 7, distortion occurred along the entire chromosome for
both parental lines, reaching significance only for Ber83 in a region of 29.1 cM and 13.5 Mb,
and at 40.1 cM and 13.2 Mb in the MSX902 map. This region was located in the distal part of
the long arm with a maximum ratio of 1:2.4. On chromosome 9, the SDR was detected in
84SD22 segregation spanning from 0.4 – 4.7 cM and 0 – 0.7 Mb, and 2.4 cM length in MSX902

22
map. The maximum ratio found was 1:1.9. On chromosome 12, we observed the greatest levels
of distortion for this mapping population. For Ber83 loci, the distortion occurred along the entire
chromosome reaching levels of distortion of 1:3.9 toward the distal end of the long arm. Using
the proportion of segregation along two allele haplotypes per parent, we calculated the
segregation of four possible chromosome combinations in the progeny (Fig. S3). The distorted
segregation in both parental lines produced preferential transmission of one combination on
chromosomes 2, 7 and two combinations on chromosome 12 based on a Chi-square test using a
threshold of 0.1%.
Few patterns of distorted segregation were common among mapping populations. On
chromosome 2, SDRs were detected for D84 and MSX902 in unique regions, whereas the DRH
and Ber83 MSX902 male maps shared a similar region and direction of distortion even though
the distortion was not significant for DRH at 0.1%. The 84SD22 maps from D84 and MSX902
crosses showed similar patterns of distorted segregation only on chromosome 7, and in this
instance, the distortion was not significant for D84 at 0.1%. For chromosome 7, the distorted
segregation of the Ber83 map was in the opposite direction. Chromosome 12 with strong patterns
of distorted segregation along the chromosome for DRH and Ber83, showed contrasting
direction and peaks of distortion.
Different biological factors could be associated with distorted segregation. Genetic factors
driving deleterious mutations or causing preferential transmission of alleles or chromosomes
through male or female gametes known as gametic or pre-zygotic selection (Fishman and
Saunders 2008; Kanizay et al. 2013; Lyttle 1991); or genetic factors mediating selective

23
fertilization and plant developmental fitness, classified as zygotic or postzygotic selection
(Gadish and Zamir 1987; Jiang et al. 2000; Moyle and Graham 2006; Rieseberg et al. 1995; Xu
et al. 2013).
In Solanum species within section Petota, different internal hybridization barriers (pollen-pistil
incompatibility, nuclear-cytoplasmic male sterility, and the endosperm) have been studied
(Camadro et al. 2004; Camadro et al. 2012). The pollen-pistil incompatibility reproductive
barrier interferes with successful fertilization in self, intra-, and interspecific crosses. The
incompatibility sites include the stigma and the first, second and last third of the style.
Incongruity, the lack of genetic information in one parent for some critical characters in the other
that produces no functional interaction between two partners (Hogenboom 1979), could cause
preferential transmission of one of the alleles in an interspecific cross, but also reduce production
of hybrids from incompatible crosses when hybridization barriers are incomplete. In self-
pollinations and backcrosses, the identical allelic configuration of the self-incompatibility locus
in the parents has driven distorted segregation on chromosome 1 by producing the absence of
specific genotypes in the progeny (Gebhardt et al. 1991; Jacobs et al. 1995; Rivard et al. 1996).
Both the presence of loci with sub-lethal as well as meiotic mutant alleles were also reportedly
linked to regions with distorted segregation on chromosomes 10 and 8, respectively (Jacobs et al.
1995). These correspond to the recessive crcr “crumpled” morphological mutation (stunted plant
with contorted stems and crumpled leaves that died a few weeks after germination (Jongedijk et
al. 1990)) and the ds1ds1 desynaptic meiotic mutant (affecting development of normal gametes).
The cross described by Jacobs et al (1995) with mainly S. tuberosum Groups Tuberosum and

24
Phureja genetic background allowed the occurrence of nonviable recessive homozygotes for sub-
lethal loci identical by descent, thus producing distorted segregation by zygotic selection.
In general, SDRs reported in this study were detected in parent-specific segregation. Due to the
homozygosity of the DM 1-3 female parent in DRH and D84 populations, only SDRs from male
parent were analyzed. Two SDRs on chromosomes 9 and 12 were identified in DRH.
Examination of the allelic configuration of the RH haplotype segment with the greatest distorted
segregation ratio 1:15-1:18, revealed a block of 11 loci spanning 7 cM corresponding to 0.4 Mb
units of RH haplotype 1 that was similar to the DM 1-3 haplotype, except for one locus on
position 7. This segment, which would have resulted in homozygous progeny at this region, was
significantly underrepresented in the mapping population (0.06%). Similar results were found for
a 12-locus segment of 12.8 cM and 1.7 Mb on chromosome 9 for RH haplotype 1 with up to
1:2.6 distorted segregation ratio. The assumption of homozygous recessive alleles with sub-lethal
effects on zygotic viability is unlikely for the strong selection observed on chromosome 12, since
DM 1-3 is viable in the homozygous combination. However, meiotic mutations or deleterious
alleles producing male gamete abortion or sterility could be associated, taking in account that
DM1-3 is male sterile and as female parent the progeny could have inherited similar nuclear-
cytoplasm interactions. Abbott et al. (2013), proposed that the genetic divergence underling
hybrid attributes that reduce or increase fitness, due to the creation of genetic combinations that
have not been tested by selection in parental populations, could be due to similar mechanisms.
Unlike the classic Dobzhansky-Muller genic speciation model, independently proposed by
several authors (Bateson 1909; Dobzhansky 1937; Muller 1942), where negative effects of a
single locus or epistasis among two or more genes allow hybrid inviability or sterility; two more

25
broadly occurring mechanisms could be considered to interpret novel hybrid phenotypes in
populations with divergent parental lines: a) additive effects of alleles fixed in different
directions, where a novel phenotype depends upon combination, and b) interactions (dominance
or epistasis) between alleles fixed independently in divergent parents. The strong deviation
against the homozygous genotype on chromosome 12 fits a single-locus selection model or
incongruity with negative fitness effects. While, gametic competition or fitness advantage genes
could be associated with the preferential transmission of heterozygous combinations with RH
haplotype 2 to the progeny on chromosome 9.
Several regions and chromosomes affected by distorted segregation have been reported in diploid
populations of potato (Bonierbale et al. 1988; Felcher et al. 2012; Gebhardt et al. 1991; Jacobs et
al. 1995; Kreike and Stiekema 1997). The cross D84 showed the greatest number of SDRs, on
chromosomes 2, 3, 4, 6, 7 and 8. The regions and patterns of distortion were consistent with
those reported by Bonierbale et al. (1988) in a similar cross between S. phureja × (S. tuberosum
× S. chacoense). In that cross, the clusters of loci with distorted segregation for the male parent
were located on chromosomes 1, 6, 7, 8 and 10. The greatest ratios of distortion were on
chromosomes 6 and 8 (1:8 and 1:3.3 respectively), as reported in this study for the D84 mapping
population. In both crosses, the male parent was an interspecific hybrid with 50% S. chacoense
in its pedigree. The D84 mapping population compared to DRH and MSX902 is the most
divergent interspecific cross. In Solanum species a large extent of genome and gene order or
synteny is conserved, as was also confirmed by the high collinearity among maps in this study.
Therefore, chromosomal rearrangements could not be considered as potential cause of distorted
segregation. Interspecific incongruity in pollen guidance and compatibility interactions could be

26
affecting successful fertilization, thus engendering more SDRs. Broad sets of signals secreted by
the female tissue are responsible for pollen guidance; moreover, pollen associated molecular
patterns are generated from pollen-pistil interaction depending on pollen compatibility
(Dresselhaus and Franklin-Tong 2013).
In the MSX902 cross, five SDRs were identified on chromosomes 1, 2, 7, 9 and 12. The Ber83
parent showed a SDR on chromosome 1 with preferential transmission of a segment of Ber83
haplotype 2. In this instance, the self-incompatibility locus could have been associated with the
SDR since Ber83 has 84SD22 and S. tuberosum Group Phureja in its pedigree. The patterns of
segregation showed strong and specific constraint on genotype combinations with Ber83
haplotype 1 for SDRs on chromosome 01 and 12. On the other had, the concordance of bi-
parental loci with distorted segregation and SDR for maternal and paternal loci on chromosomes
2, and paternal on chromosomes 7 and 12, suggest additional association of distorted segregation
with zygotic selection produced by recessive homozygous loci with sub-lethal effects. Reciprocal
crosses will allow differentiating male or female specific effects of each parent and elucidation
of whether gametic or/and zygotic selection produce distorted segregation as reported by
Fishman and Willis (2005). In a cross between a self-incompatible and self-compatible diploid
potato lines where the male parent was comprised of half S. chacoense (Hosaka and Hanneman
1998), Hosaka and Hanneman likewise observed segregation distortion for seven markers
surrounding the Sli (Self-incompatible locus inhibitor) gene on the distal arm of chromosome 12.
They suggested a gametophytic advantage of pollen carrying the Sli gene. The male parent of our
MSX902 mapping population with S. chacoense genetic background generated similar distortion
segregation.

27
Multiple allelic epistatic interactions between unlinked loci were identified for DRH, D84 and
MSX902 crosses (149, 449, and 1680, respectively). The two-loci significant interactions
occurred in 14, 16, and 48 different chromosome combinations. Several patterns of interactions
were observed. Multiple locus positions along one chromosome mainly interacting with a single
locus on another chromosome, several random specific two-loci interactions along a two-
chromosome combination, or few loci with a significant two-locus interaction between two
chromosomes. In most cases, neither of the interactions was located between two regions with
distorted segregation, nor towards the point with the greatest distorted segregation. Except for
D84, where multiple two-locus interactions (88) between chromosomes 4 and 8 were located in
the zone with the greatest distorted segregation in both chromosomes, 0-18 and 6-9 cM,
respectively. These were also part of the most significant interactions (P-value <0.0001). For
MSX902 two-loci interactions were detected within chromosomes from same parent as well as
between parents. These results confirm a wide set of genomic interactions, some on SDR
potentially causing preferential transmission of some allelic combinations.
Recombination Rates Along Chromosomes
Comparison between genetic and physical maps was used to estimate genome-wide variation of
recombination rates. Initially, we analyzed the averages of genome-wide and chromosome
recombination rates for each population (Table 6). The average recombination rates were 1.1, 0.9
and 1.1 cM/Mb for DRH, D84 and MSX902, respectively. The average recombination rate per
chromosome varied among and within populations, ranging from 0.9-1.5, 0.7-1.2, and 0.9-1.7
cM/Mb for DRH, D84 and MSX902, respectively. In general, D84 had the lowest recombination

28
rates at genome and chromosome levels. Chromosomes 2 and 11 had the greatest recombination
rates for most of the populations, followed by chromosome 5 for DRH and MSX902. The
recombination rates along chromosomes increased toward the telomeres, and decreased toward
the centromere regions, as expected. SDRs were indiscriminately distributed along centromere
and arms of the chromosomes with variable recombination rates (Fig. 2 and Fig. S4 – S7).
Regression analysis between recombination rates and minus logarithm of chi square test P-value
of segregating genotypes per locus was performed for chromosomes with SDRs. Loci with
distorted segregation were defined by values greater than 3 (equivalent to α less than 0.001).
There was positive correlation between greater recombination rates and the most distorted loci
on chromosome 9 (n=166, r2=0.25, P<0.0001*) and chromosome 12 (n=121, r2=0.41, P<0.001*)
in DRH (Fig. 2 A). On the other hand, lower recombination rates correlated with greater levels of
distorted segregation were common for chromosomes with SDRs in D84 (n=267, r2=0.11,
P<0.0001*; n=225, r2=0.38, P<0.0001*; n=154, r2=0.8, P<0.0001*; n=205, r2=0.73, P<0.0001*;
n=241, r2=0.7, P<0.0001*; n=171, r2=0.51, P<0.0001* for chromosomes 2, 3, 4, 6, 7, and 8,
respectively). For MSX902, there was no correlation between recombination rates and distorted
segregation on chromosomes 2 and 9 for the 84SD22 parental map (n=164, r2=0.03, P=0.04, and
n=88, r2=0.01, P=0.42). Similar results were found for Ber83 on chromosomes 1, 2, and 7 (n=95,
r2=0.01, P=0.32, n=53, r2=0.001, P=0.83, and n=83, r2=0.02, P=0.2). However, a positive
correlation between recombination rates and distorted segregation was detected on chromosome
12 (n=63, r2=0.28, P<0.0001*) of Ber83 map.
The spatial and temporal context where hybridization occurs modulates the outcome, breakdown
or strengthening of barriers to gene exchange (Abbott et al. 2013). A balance between selection

29
and recombination in the framework of the cline theory explains the dynamics to stabilize or
increase reproductive barriers to gene exchange. In the context of genome divergence and
recombination levels versus development of hybridizations barriers, we found that interspecific
hybridity of parental clones and androgenic rather than gynogenic gamete formation, were
associated with lower recombination rates in this study. In general, there were smaller genetic
map lengths from male than female parents and from inter- versus intraspecific crosses. The
813.2 cM DRH map with 756 recombination events and average of 7.9 for plant (S. tuberosum
Group Phureja and Tuberosum cross) was larger than D84 (637.9 cM) and Ber83 (730.3 cM)
with 810 and 916 recombination events and average of 6.2 and 7.1 per plant, respectively.
However, 84SD22 with 808.1 cM showed greater recombination frequencies (1,015
recombination events, 7.9 per plant) when acting as female parent in MSX902. In the D84 and
MSX902 populations, the hybrid parents contained germplasm from S. tuberosum Groups
Phureja and Tuberosum, S. chacoense, and S. berthaultii compared to the S. tuberosum Groups
Phureja and Tuberosum background of DRH. Similar results were reported by Gebhardt et al.
(1991), i.e., smaller genetic maps associated with lower recombination frequency in parental
clones with interspecific hybridity compared to parents with intraspecific genetic background.
Checking the recombination rates in the regions with distorted segregation in the progeny, we
found six and four SDRs in D84 and MSX902 interspecific crosses in the male parents (84SD22
and Ber83), compared to two in 84SD22 as the female parent of MSX902 or two in DRH, a more
intraspecific cross. The SDRs in the 84SD22 and Ber83 male maps were mainly associated with
lower local recombination rates. However, for chromosome 9 in DRH and 12 in DRH and
MSX902, the SDRs from the male parent were located in regions with greater recombination

30
rates. Interspecific male parents with lower total recombination rates and high levels of distorted
segregation have been reported (Bonierbale et al. 1988; Gebhardt et al. 1991). Likewise, greater
levels of distorted segregation from the male parent were found in an intraspecific cross (Jacobs
et al. 1995), and lower recombination rates combined with greater percentages of distorted
segregation of a S. tuberosum clone when used as a male than female parent (Kreike and
Stiekema 1997). Therefore, there is a clear pattern where greater levels of genome divergence in
the parent genome produced lower proportion of recombination events, and those regions with
lower recombination rates were the ones that suffered distorted segregation.
Conclusions
Given the differences in the occurrence of distorted segregation among the three diploid
populations in our study, even when sharing a common parent, it seems likely that segregation
distortion in a highly heterozygous crop such as potato will be population specific, reflecting the
diverse genetic load within selected parents. Interspecific hybridity of parental clones and sex-
specific recombination rates were factors associated with SDR. Presence of meiotic mutations,
deleterious alleles producing male gamete abortion or sterility, gametic competition, the self-
incompatilility locus, the S-locus inhibitor gene, and interspecific incongruity were considered
potentially associated with distorted segregation in this study. The SNP genotyping platform
used in this study was important not only to study segregation distortion, but also to compare
three high-density co-linear genetic maps. We found that genotype errors corresponded to the
most limiting factor to obtain high quality maps rather than distorted segregation.
Acknowledgments

31
This research was supported by the National Science Foundation under Grant No. IOS-1237969
to C. Robin Buell, Yuehua Cui, David Douches, Jiming Jiang, and Richard E. Veilleux. We
thank Daniel Zarka for assistance in SNP genotyping.

32
References Abbott, R., Albach, D., Ansell, S., Arntzen, J.W., Baird, S.J.E., Bierne, N., Boughman, J.W.,
Brelsford, A., Buerkle, C.A., Buggs, R., Butlin, R.K., Dieckmann, U., Eroukhmanoff, F., Grill,
A., Cahan, S.H., Hermansen, J.S., Hewitt, G., Hudson, A.G., Jiggins, C., Jones, J., Keller, B.,
Marczewski, T., Mallet, J., Martinez-Rodriguez, P., Most, M., Mullen, S., Nichols, R., Nolte,
A.W., Parisod, C., Pfennig, K., Rice, A.M., Ritchie, M.G., Seifert, B., Smadja, C.M., Stelkens,
R., Szymura, J.M., Vainola, R., Wolf, J.B.W., and Zinner, D. 2013. Hybridization and
speciation. J Evolution Biol 26(2): 229-246. doi: 10.1111/j.1420-9101.2012.02599.x.
Bateson, W. 1909. Heredity and variation in modern lights. In Darwin and modern science.
Edited by A.C. Seward. Cambridge University Press, Cambridge. pp. pp. 85–101.
Baumbach, J., Rogers, J.P., Slattery, R.A., Narayanan, N.N., Xu, M., Palmer, R.G.,
Bhattacharyya, M.K., and Sandhu, D. 2012. Segregation distortion in a region containing a male-
sterility, female-sterility locus in soybean. Plant Sci 195: 151-156. doi:
10.1016/j.plantsci.2012.07.003.
Bonierbale, M.W., Plaisted, R.L., and Tanksley, S.D. 1988. RFLP maps based on a common set
of clones reveal modes of chromosomal evolution in potato and tomato. Genetics 120(4): 1095-
1103.
Bradbury, P.J., Zhang, Z., Kroon, D.E., Casstevens, T.M., Ramdoss, Y., and Buckler, E.S. 2007.
TASSEL: software for association mapping of complex traits in diverse samples. Bioinformatics
23(19): 2633-2635. doi: 10.1093/bioinformatics/btm308.

33
Camadro, E.L., Carputo, D., and Peloquin, S.J. 2004. Substitutes for genome differentiation in
tuber-bearing Solanum: interspecific pollen-pistil incompatibility, nuclear-cytoplasmic male
sterility, and endosperm. Theor Appl Genet 109(7): 1369-1376. doi: Doi 10.1007/S00122-004-
1753-2.
Camadro, E.L., Erazzu, L.E., Maune, J.F., and Bedogni, M.C. 2012. A genetic approach to the
species problem in wild potato. Plant Biology 14(4): 543-554. doi: 10.1111/j.1438-
8677.2012.00563.x.
Chakravarti, A. 1991. A graphical representation of genetic and physical maps - the Marey map.
Genomics 11(1): 219-222. doi: Doi 10.1016/0888-7543(91)90123-V.
Chani, E., Ashkenazi, V., Hillel, J., and Veilleux, R.E. 2002. Microsatellite marker analysis of an
anther-derived potato family: skewed segregation and gene-centromere mapping. Genome 45(2):
236-242. doi: Doi 10.1039/G01-140.
Dobzhansky, T. 1937. Genetics and the origin of species. New York : Columbia Univ. Press.
Douches, D.S., and Quiros, C.F. 1987. Use of 4x-2x crosses to determine gene-centromere map
distances of isozyme loci in Solanum species. Genome 29(4): 519-527.
Dresselhaus, T., and Franklin-Tong, N. 2013. Male-female crosstalk during pollen germination,
tube growth and guidance, and double fertilization. Mol Plant 6(4): 1018-1036. doi:
10.1093/mp/sst061.

34
Felcher, K.J., Coombs, J.J., Massa, A.N., Hansey, C.N., Hamilton, J.P., Veilleux, R.E., Buell,
C.R., and Douches, D.S. 2012. Integration of two diploid potato linkage maps with the potato
genome sequence. PLoS One 7(4): 11. doi: 10.1371/journal.pone.0036347.
Fishman, L., and Saunders, A. 2008. Centromere-associated female meiotic drive entails male
fitness costs in monkeyflowers. Science 322(5907): 1559-1562. doi: Doi
10.1126/Science.1161406.
Fishman, L., and Willis, J.H. 2005. A novel meiotic drive locus almost completely distorts
segregation in Mimulus (monkeyflower) hybrids. Genetics 169(1): 347-353. doi: Doi
10.1534/Genetics.104.032789.
Gadish, I., and Zamir, D. 1987. Differential zygotic abortion in an interspecific Lycopersicon
cross. Genome 29(1): 156-159. doi: 10.1139/g87-026.
Gebhardt, C., Ritter, E., Barone, A., Debener, T., Walkemeier, B., Schachtschabel, U.,
Kaufmann, H., Thompson, R.D., Bonierbale, M.W., Ganal, M.W., Tanksley, S.D., and Salamini,
F. 1991. RFLP maps of potato and their alignment with the homoeologous tomato genome.
Theor Appl Genet 83(1): 49-57.
Grini, P.E., Schnittger, A., Schwarz, H., Zimmermann, I., Schwab, B., Jurgens, G., and
Hulskamp, M. 1999. Isolation of ethyl methanesulfonate-induced gametophytic mutants in
Arabidopsis thaliana by a segregation distortion assay using the multimarker chromosome 1.
Genetics 151(2): 849-863.

35
Hackett, C.A., and Broadfoot, L.B. 2003. Effects of genotyping errors, missing values and
segregation distortion in molecular marker data on the construction of linkage maps. Heredity
90(1): 33-38. doi: Doi 10.1038/Sj.Hdy.6800173.
Harushima, Y., Kurata, N., Yano, M., Nagamura, Y., Sasaki, T., Minobe, Y., and Nakagahra, M.
1996. Detection of segregation distortions in an indica-japonica rice cross using a high-
resolution molecular map. Theor Appl Genet 92(2): 145-150. doi: 10.1007/BF00223368.
Harushima, Y., Nakagahra, M., Yano, M., Sasaki, T., and Kurata, N. 2002. Diverse variation of
reproductive barriers in three intraspecific rice crosses. Genetics 160(1): 313-322.
Hogenboom, N.G. 1979. Incompatibility and incongruity in Lycopersicon. In The biology and
taxonomy of the Solanaceae. Edited by L.R. Hawkes JG, Skelding AD. Academic Press.,
London. pp. 435-444.
Hosaka, K., and Hanneman, R.E. 1998. Genetics of self-compatibility in a self-incompatible wild
diploid potato species Solanum chacoense. 2. Localization of an S locus inhibitor (Sli) gene on
the potato genome using DNA markers. Euphytica 103(2): 265-271. doi: Doi
10.1023/A:1018380725160.
Jacobs, J.M.E., Van Eck, H.J., Arens, P., Verkerk-Bakker, B., Hekkert, B.T.L., Bastiaanssen,
H.J.M., Elkharbotly, A., Pereira, A., Jacobsen, E., and Stiekema, W.J. 1995. A genetic map of
potato (Solanum tuberosum) integrating molecular markers, including transposons, and classical
markers. Theor Appl Genet 91(2): 289-300.

36
Jiang, C.X., Chee, P.W., Draye, X., Morrell, P.L., Smith, C.W., and Paterson, A.H. 2000.
Multilocus interactions restrict gene introgression in interspecific populations of polyploid
Gossypium (cotton). Evolution 54(3): 798-814.
Jongedijk, E., Van der Wolk, J.M.A.S.A., and Suurs, L.C.J.M. 1990. Analysis of glutamate
oxaloacetate transaminase (GOT) isozyme variants in diploid tuberous Solanum; inheritance and
linkage relationships to ds1 (desynapsis), y (tuber flesh colour), cr (crumpled) and yc (yellow
cotyledon). Euphytica 45(2): 155-167.
Kanizay, L.B., Pyhajarvi, T., Lowry, E.G., Hufford, M.B., Peterson, D.G., Ross-Ibarra, J., and
Dawe, R.K. 2013. Diversity and abundance of the abnormal chromosome 10 meiotic drive
complex in Zea mays. Heredity 110(6): 570-577. doi: Doi 10.1038/Hdy.2013.2.
Kreike, C.M., and Stiekema, W.J. 1997. Reduced recombination and distorted segregation in a
Solanum tuberosum (2x) x S. spegazzinii (2x) hybrid. Genome 40(2): 180-187. doi: Doi
10.1139/G97-026.
Kubo, K., Entani, T., Takara, A., Wang, N., Fields, A.M., Hua, Z.H., Toyoda, M., Kawashima,
S., Ando, T., Isogai, A., Kao, T., and Takayama, S. 2010. Collaborative non-self recognition
system in S-RNase-based self-incompatibility. Science 330(6005): 796-799. doi:
10.1126/science.1195243.

37
Kumar, S., Gill, B.S., and Faris, J.D. 2007. Identification and characterization of segregation
distortion loci along chromosome 5B in tetraploid wheat. Mol Genet Genomics 278(2): 187-196.
doi: 10.1007/s00438-007-0248-7.
Lalanne, E., Michaelidis, C., Moore, J.M., Gagliano, W., Johnson, A., Patel, R., Howden, R.,
Vielle-Calzada, J.P., Grossniklaus, U., and Twell, D. 2004. Analysis of transposon insertion
mutants highlights the diversity of mechanisms underlying male progamic development in
Arabidopsis. Genetics 167(4): 1975-1986. doi: Doi 10.1534/Genetics.104.030270.
Li, H.B., Kilian, A., Zhou, M.X., Wenzl, P., Huttner, E., Mendham, N., McIntyre, L., and
Vaillancourt, R.E. 2010. Construction of a high-density composite map and comparative
mapping of segregation distortion regions in barley. Mol Genet Genomics 284(5): 319-331. doi:
Doi 10.1007/S00438-010-0570-3.
Li, H.B., Zhou, M.X., and Liu, C.J. 2009. A major QTL conferring crown rot resistance in barley
and its association with plant height. Theor Appl Genet 118(5): 903-910. doi: Doi
10.1007/S00122-008-0948-3.
Li, S.X., Tang, Z.X., Zhang, D.F., Ye, N., Xu, C.W., and Yin, T.M. 2012. Genome-wide
detection of genetic loci triggering uneven descending of gametes from a natural hybrid pine.
Tree Genet Genomes 8(6): 1371-1377. doi: Doi 10.1007/S11295-012-0524-5.
Liu, X., Guo, L., You, J., Liu, X., He, Y., Yuan, J., Liu, G., and Feng, Z. 2010. Progress of
segregation distortion in genetic mapping of plants. Res J Agron 4(4): 78-83.

38
Lu, H., Romero-Severson, J., and Bernardo, R. 2002. Chromosomal regions associated with
segregation distortion in maize. Theor Appl Genet 105(4): 622-628. doi: 10.1007/s00122-002-
0970-9.
Lyttle, T.W. 1991. Segregation distorters. Annu Rev Genet 25: 511-557. doi: Doi
10.1146/Annurev.Ge.25.120191.002455.
Maliepaard, C., Jansen, J., and Van Ooijen, J.W. 1997. Linkage analysis in a full-sib family of an
outbreeding plant species: Overview and consequences for applications. Genet Res 70(3): 237-
250. doi: 10.1017/s0016672397003005.
McDaniel, S.F., Willis, J.H., and Shaw, A.J. 2007. A linkage map reveals a complex basis for
segregation distortion in an interpopulation cross in the moss Ceratodon purpureus. Genetics
176(4): 2489-2500. doi: 10.1534/genetics.107.075424.
Moyle, L.C., and Graham, E.B. 2006. Genome-wide associations between hybrid sterility QTL
and marker transmission ratio distortion. Mol Biol Evol 23(5): 973-980. doi: Doi
10.1093/Molbev/Msj112.
Muller, H.J. 1942. Isolating mechanisms, evolution and temperature. In Biol. Symp. pp. 71-125.
Paz, M.M., and Veilleux, R.E. 1999. Influence of culture medium and in vitro conditions on
shoot regeneration in Solanum phureja monoploids and fertility of regenerated doubled
monoploids. Plant Breeding 118(1): 53-57. doi: Doi 10.1046/J.1439-0523.1999.118001053.X.

39
Peloquin, S.J., Boiteux, L.S., and Carputo, D. 1999. Meiotic mutants in potato: Valuable
variants. Genetics 153(4): 1493-1499.
Rieseberg, L.H., Linder, C.R., and Seiler, G.J. 1995. Chromosomal and genic barriers to
introgression in Helianthus. Genetics 141(3): 1163-1171.
Rivard, S.R., Cappadocia, M., and Landry, B.S. 1996. A comparison of RFLP maps based on
anther culture derived, selfed, and hybrid progenies of Solanum chacoense. Genome 39(4): 611-
621. doi: Doi 10.1139/G96-078.
Rouppe van der Voort, J., Wolters, P., Folkertsma, R., Hutten, R., van Zandvoort, P., Vinke, H.,
Kanyuka, K., Bendahmane, A., Jacobsen, E., Janssen, R., and Bakker, J. 1997. Mapping of the
cyst nematode resistance locus Gpa2 in potato using a strategy based on comigrating AFLP
markers. Theor Appl Genet 95(5-6): 874-880. doi: Doi 10.1007/S001220050638.
Sandler, L., and Novitski, E. 1957. Meiotic drive as an evolutionary force. Am Nat 91(857): 105-
110. doi: Doi 10.1086/281969.
Sharma, S.K., Bolser, D., de Boer, J., Sonderkaer, M., Amoros, W., Carboni, M.F., D'Ambrosio,
J.M., de la Cruz, G., Di Genova, A., Douches, D.S., Eguiluz, M., Guo, X., Guzman, F., Hackett,
C.A., Hamilton, J.P., Li, G., Li, Y., Lozano, R., Maass, A., Marshall, D., Martinez, D., McLean,
K., Mejia, N., Milne, L., Munive, S., Nagy, I., Ponce, O., Ramirez, M., Simon, R., Thomson,
S.J., Torres, Y., Waugh, R., Zhang, Z., Huang, S., Visser, R.G., Bachem, C.W., Sagredo, B.,
Feingold, S.E., Orjeda, G., Veilleux, R.E., Bonierbale, M., Jacobs, J.M., Milbourne, D., Martin,

40
D.M., and Bryan, G.J. 2013. Construction of reference chromosome-scale pseudomolecules for
potato: integrating the potato genome with genetic and physical maps. G3 3(11): 2031-2047. doi:
Doi 10.1534/g3.113.007153.
Tai, G.C.C., Seabrook, J.E.A., and Aziz, A.N. 2000. Linkage analysis of anther-derived
monoploids showing distorted segregation of molecular markers. Theor Appl Genet 101(1-2):
126-130. doi: Doi 10.1007/S001220051460.
Taylor, D., and Ingvarsson, P. 2003. Common features of segregation distortion in plants and
animals. Genetica 117(1): 27-35. doi: 10.1023/A:1022308414864.
Tonguç, M., Earle, E.D., and Griffiths, P.D. 2003. Segregation distortion of Brassica carinata
derived black rot resistance in Brassica oleracea. Euphytica 134(3): 269-276. doi: Doi
10.1023/B:Euph.0000004947.37512.92.
Van Ooijen, J.W. 2006. JoinMap ® 4, Software for the calculation of genetic linkage maps in
experimental populations. In Kyazma B. V., Wageningen, Netherlands.
Van Ooijen, J.W. 2011. Multipoint maximum likelihood mapping in a full-sib family of an
outbreeding species. Genet Res 93(05): 343-349. doi: Doi 10.1017/S0016672311000279.
Van Os, H., Andrzejewski, S., Bakker, E., Barrena, I., Bryan, G.J., Caromel, B., Ghareeb, B.,
Isidore, E., De Jong, W., Van Koert, P., Lefebvre, V., Milbourne, D., Ritter, E., van der Voort, J.,
Rousselle-Bourgeois, F., Van Vliet, J., Waugh, R., Visser, R.G.F., Bakker, J., and Van Eck, H.J.

41
2006. Construction of a 10,000-marker ultradense genetic recombination map of potato:
Providing a framework for accelerated gene isolation and a genomewide physical map. Genetics
173(2): 1075-1087. doi: Doi 10.1534/genetics.106.055871.
Voorrips, R.E. 2002. MapChart: Software for the graphical presentation of linkage maps and
QTLs. Journal of Heredity 93(1): 77-78. doi: Doi 10.1093/Jhered/93.1.77.
Wu, Y., Ko, P., Lee, W., Wei, F., Kuo, S., Ho, S., Hour, A., Hsing, Y., and Lin, Y. 2010.
Comparative analyses of linkage maps and segregation distortion of two F2 populations derived
from Japonica crossed with Indica rice. Hereditas 147(5). doi: 10.1111/j.1601-
5223.2010.02120.x.
Xu, X.W., Li, L., Dong, X., Jin, W.W., Melchinger, A.E., and Chen, S.J. 2013. Gametophytic
and zygotic selection leads to segregation distortion through in vivo induction of a maternal
haploid in maize. J Exp Bot 64(4): 1083-1096. doi: Doi 10.1093/Jxb/Ers393.
Xu, Y., Zhu, L., Xiao, J., Huang, N., and McCouch, S.R. 1997. Chromosomal regions associated
with segregation distortion of molecular markers in F2, backcross, doubled haploid, and
recombinant inbred populations in rice (Oryza sativa L.). Mol Gen Genet 253(5): 535-545.
Yamagishi, M., Takeuchi, Y., Tanaka, I., Kono, I., Murai, K., and Yano, M. 2010. Segregation
distortion in F2 and doubled haploid populations of temperate Japonica rice. J Genet 89(2): 237-
241. doi: http://dx.doi.org/10.1007/s12041-010-0032-z.

42
Yu, A., Zhao, C.F., Fan, Y., Jang, W.H., Mungall, A.J., Deloukas, P., Olsen, A., Doggett, N.A.,
Ghebranious, N., Broman, K.W., and Weber, J.L. 2001. Comparison of human genetic and
sequence-based physical maps. Nature 409(6822): 951-953. doi: Doi 10.1038/35057185.
Zamir, D., and Tadmor, Y. 1986. Unequal segregation of nuclear genes in plants. Botanical
Gazette 147(3): 355-358.
Zhang, L., Wang, S., Li, H., Deng, Q., Zheng, A., Li, S., Li, P., Li, Z., and Wang, J. 2010.
Effects of missing marker and segregation distortion on QTL mapping in F2 populations. Theor
Appl Genet 121(6): 1071–1082. doi: 10.1007/s00122-010-1372-z.

43
Tables

44
Table 1. Comparison of genetic maps of diploid segregating mapping populations using different levels of loci with distorted segregation Interval Distance (cM) Population* Segregation Distortion
Level † No. Bin Positions
cM Mean Min Max
DRH All Distortion 414 813.2 2 1.1 11.7 Ratio threshold 411 797.8 2 1.1 11.7 α threshold 396 764.3 2 1.1 11.7 D84 All Distortion 460 637.9 1.4 0.8 9.3 α threshold 368 520.3 1.5 0.8 9.3 MSX902 All Distortion 798 781.1 1 0.004 8.4 Ratio threshold 801 774.7 1 0.004 8.4 α threshold 773 782.9 1 0.004 8.4 MSX902-P1 All Distortion 405 799.8 2 0.8 17.9 Ratio threshold 405 795.1 2 0.8 17.9 α threshold 405 796.8 2 0.8 17.9 MSX902-P2 All Distortion 305 702.1 2.4 0.8 25.7 Ratio threshold 304 693 2.4 0.8 25.7 α threshold 283 667.4 2.5 0.8 27.6 *Three maps for the MSX902 mapping population: combined map and individual maternal (P1) and paternal (P2) information only for <lmxll> and <nnxnp> segregation type. †The ratio threshold was 1:10 for single parent segregation and 1:5:5 for bi-parental segregation type. Chi square alpha threshold was 0.001%. D84 mapping population did not have markers with this ratio threshold.

45
Table 2. General characteristics of five genetic maps using all segregating loci identified for three segregating diploid populations DRH D84 MSX902
(Combined) P1 MSX902 (84SD22)
P2 MSX902 (Ber83)
Total mapped SNPs 1,948 2,348 3,043 2,227 1,847 Unique bin positions 414 460 798 533 469 Recombination events 756 810 1,931 1,015 916 Map length (cM) 813.2 637.9 781.1 808.1 730.3 Inter-locus distance (cM): Mean 2.0 1.4 1.0 1.6 1.6 Range 1.1-11.7 0.8-9.3 0.004-8.4 0.004-10.3 0.07-14.2 Map length (Mb) 715.8 713.2 714.8 713.7 704.4 Physical coverage vs. DM 1-3*
99.3% 99.0% 99.2% 99.0% 97.8 %
No Mapped SNPs/Chr: 162.3 195.7 253.6 185.6 153.9 Average Range 88-259 125-267 145-362 112-262 98-226 *The Infinium 8303 Potato Array has genome coverage of 720.6 Mb of the assembled pseudomolecules version 4.03. This value was used to estimate the physical coverage of each map.

46
Table 3. Number of common single nucleotide polymorphic (SNP) markers mapped in three diploid populations of potato
Chr Total mapped
Common for all maps
DRH and D84
DRH and MSX902
D84 and MSX902
chr01 479 103 108 151 252 chr02 413 91 100 114 246 chr03 358 22 25 39 213 chr04 403 65 70 115 151 chr05 243 37 45 47 118 chr06 353 94 104 120 186 chr07 420 51 54 76 235 chr08 287 51 55 61 172 chr09 372 55 59 96 168 chr10 229 44 49 65 110 chr11 275 41 43 48 147 chr12 296 37 46 65 143 Disconcordant 2 2 2 4 0 Total 4,130 693 760 1,001 2,141

47
Table 4. Proportion of loci with distorted segregation at different levels of significance (5, 1, 0.1 and 0.001%) in three diploid populations of potato Population* Segregating SNPs P < 0.05 P < 0.01 P < 0.001 P < 0.00001 DRH 1,948 21% 15% 9% 6% D84 2,348 57% 45% 39% 35% MSX902 3,043 51% 35% 15% 4% <lmxll> 1,196 37% 27% 9% 0% <nnxnp> 816 63% 44% 21% 5% <hkxhk> 1,031 56% 37% 18% 7% *MSX902 population marker segregation type: maternal (<lmxll>), paternal (<nnxnp>) and biparental (<hkxhk>)

48
Table 5. Range of distorted segregation regions (SDRs) in genetic (cM) and physical (Mb) distances along chromosomes (Chr) identified in three diploid populations of potato
Chr Distance DRH D84 MSX902
(Combined) P1 MSX902
(84SD22) P2 MSX902
(Ber83) chr01 cM 19.1 - 30.9 10.2-27.8 Mb 61 - 67.6 61 - 67.6 chr02 cM 0 - 11.7 14.2 - 58.5 18.9 - 59.2 38.5 - 57.1 Mb 6.1 - 29.4 25.8 - 47.6 25.8 - 47.3 36 - 47.6 chr03 cM 0 - 18.0 Mb 1 - 51.2 chr04 cM 0 - 18 Mb 0 - 62.4 chr05 cM Mb chr06 cM 0 - 28.9 Mb 0.2 - 51.5 chr07 cM 0 - 38.3 22.5 - 62.6 30.9 - 60.0 Mb 0.4 - 55.3 43.1 - 56.6 43.1 - 56.6 chr08 cM 0 - 34.8 Mb 0.3 - 51.1 chr09 cM 53.1 - 75.5 0 - 2.4 0 - 4.7 Mb 54.1 - 58.4 0 - 0.7 0 - 0.7 chr10 cM Mb chr11 cM Mb chr12 cM 0 - 59.7 9.7 - 68.1 5.1 - 56.8 Mb 0.2 - 61.1 2 - 60.5 2 - 60.5

49
Table 6. Average of genome-wide and chromosome recombination rates in cM/Mb for three diploid populations.
Chromosome DRH D84 MSX902
(Combined) P1
MSX902 (84SD22)
P2 MSX902 (Ber83)
chr01 1.1 0.7 0.9 0.9 0.9 chr02 1.4 1.2 1.5 1.5 1.6 chr03 1.1 0.8 0.9 1.0 0.7 chr04 1.1 0.9 1.0 1.1 0.8 chr05 1.4 1.0 1.2 1.1 1.3 chr06 0.9 0.9 1.0 1.1 0.8 chr07 0.9 0.8 1.1 1.2 1.1 chr08 1.0 1.0 1.0 0.9 1.2 chr09 1.4 0.9 1.0 0.9 1.0 chr10 1.0 0.9 1.1 1.2 1.0 chr11 1.5 0.9 1.7 1.6 1.7 chr12 1.0 0.9 1.1 1.3 0.9 Genome-wide 1.1 0.9 1.1 1.1 1.0

50
Figures Captions

51
Fig. 1. Distribution of segregation ratios of allele haplotypes. RH haplotypes (RH-1 blue, RH-2
red) along the genetic linkage map (cM) of DRH population (A). 84SD22 haplotypes (84SD22-1
blue, 84SD22-2 red) along the genetic map of D84 population (B). 84SD22 haplotypes female
parent P1 (84SD22-1 blue, 84SD22-2 red) along the genetic map of MSX902 population (C).
Ber83 haplotypes male parent P2 (Ber83-1 blue, Ber83-2 red) along the genetic map of MSX902
population (D). The direction of the order of loci for each chromosomes (chr) is according to
potato pseudomolecule assembly 4.03. SNPs are represented by asterisks; those with distorted
segregation occur outside of the lines of the confidence interval for a Chi-square test with α
threshold = 0.1%.
Fig. 2. Distribution of recombination rates along chromosomes with distorted segregation
regions. Chromosomes (chr) 9 and 12 for DRH population (A), chromosomes 4, and 6 for D84
(B). For each chromosome square, in the upper panel is the Marey map, the middle panel is the
recombination rate (cM/Mb), and the lower panel is the significance of distorted segregation
reported as the minus logarithm of chi square test P-value (P-value), plotted against physical
position in Mb based on potato genome assembly version 4.03 (Mb v4.03). The 0.1% threshold
of significance used to define distorted segregation corresponds to orange line of 3. Black stars
highlight loci with distorted segregation.

52
Supplementary Figure Captions

53
Fig. S1. Pedigree scheme of Ber83. A dihaploid of Solanum tuberosum Group Tuberosum was
cross with a Solanum chacoense clone to generate the 84SD22 hybrid. 84SD22 was crossed to a
S. tuberosum Group Phureja clone to generate MSA133-57. Finally MSA133-57 was crossed to
Solanum berthaultii PI498104 to obtain the hybrid Ber83.
Fig. S2. Comparative map of DRH, D84 and MSX902 genetic maps. A total of 1612 SNPs that
mapped to unique positions in the individual population maps, the common maker positions
commonly mapped to all populations, and any combination of two populations.
Fig. S3. Distribution of segregation ratios of parental haplotype combinations along the genetic
linkage map (cM) for MSX902 population. The lines in each chromosome (chr) represent the
confidence interval for a Chi-square test with α =0.1%. SNPs with distorted segregation
represented by asterisks are located outside the confidence interval. Haplotype combinations
84SD22-1 and Ber83-1 (ac), 84SD22-1 and Ber83-2 (ad), 84SD22-2 and Ber83-1 (bc), 84SD22-
2 and Ber83-2 (bd).
Fig. S4. Distribution of recombination rates along chromosomes with distorted segregation
regions for DRH population. For each chromosome (chr), in the upper panel is the Marey map,
the middle panel is the recombination rate (cM/Mb), and the lower panel is the significance of
distorted segregation reported as the minus logarithm of chi square test P-value (P-value), plotted
against physical position in Mb based on potato genome assembly version 4.03 (Mb v4.03). The
0.1% threshold of significance used to define distorted segregation corresponds to orange line of
3. Black stars highlight loci with distorted segregation.

54
Fig. S5. Distribution of recombination rates along chromosomes with distorted segregation
regions for D84 population. For each chromosome (chr), in the upper panel is the Marey map,
the middle panel is the recombination rate (cM/Mb), and the lower panel is the significance of
distorted segregation reported as the minus logarithm of chi square test P-value (P-value), plotted
against physical position in Mb based on potato genome assembly version 4.03 (Mb v4.03). The
0.1% threshold of significance used to define distorted segregation corresponds to orange line of
3. Black stars highlight loci with distorted segregation.
Fig. S6. Distribution of recombination rates along chromosomes with distorted segregation
regions for 84SD22 female parent P1 of MSX902 population. For each chromosome (chr), in the
upper panel is the Marey map, the middle panel is the recombination rate (cM/Mb), and the
lower panel is the significance of distorted segregation reported as the minus logarithm of chi
square test P-value (P-value), plotted against physical position in Mb based on potato genome
assembly version 4.03 (Mb v4.03). The 0.1% threshold of significance used to define distorted
segregation corresponds to orange line of 3. Black stars highlight loci with distorted segregation.
Fig. S7. Distribution of recombination rates along chromosomes with distorted segregation
regions for Ber83 female parent P2 of MSX902 population. For each chromosome (chr), in the
upper panel is the Marey map, the middle panel is the recombination rate (cM/Mb), and the
lower panel is the significance of distorted segregation reported as the minus logarithm of chi
square test P-value (P-value), plotted against physical position in Mb based on potato genome

55
assembly version 4.03 (Mb v4.03). The 0.1% threshold of significance used to define distorted
segregation corresponds to orange line of 3. Black stars highlight loci with distorted segregation.

56
Supplementary Table Captions

57
Table S1. Number of loci with distorted and expected segregation based on a Chi-square test
using four thresholds of significance (5%, 1%, 0.1% and 0.001%) for DRH population.
Table S2. Number of loci with distorted and expected segregation based on a Chi-square test
using four thresholds of significance (5%, 1%, 0.1% and 0.001%) for D84 population.
Table S3. Number of loci with distorted and expected segregation based on a Chi-square test
using four thresholds of significance (5%, 1%, 0.1% and 0.001%) for MSX902 population.
Table S4. Number of hkxhk loci with distorted and expected segregation based on a Chi-square
test using four thresholds of significance (5%, 1%, 0.1% and 0.001%) for MSX902 population.
Table S5. Number of lmxll loci with distorted and expected segregation based on a Chi-square
test using four thresholds of significance (5%, 1%, 0.1% and 0.001%) for 84SD22 parent of
MSX902 population.
Table S6. Number of nnxnp loci with distorted and expected segregation based on a Chi-square
test using four thresholds of significance (5%, 1%, 0.1% and 0.001%) for Ber83 parent of
MSX902 population.
Table S7. Significant nonrandom association between unlinked loci on DRH cross.
Table S8. Significant nonrandom association between unlinked loci on D84 cross.

58
Table S9. Significant nonrandom association between unlinked loci on MSX902 cross.
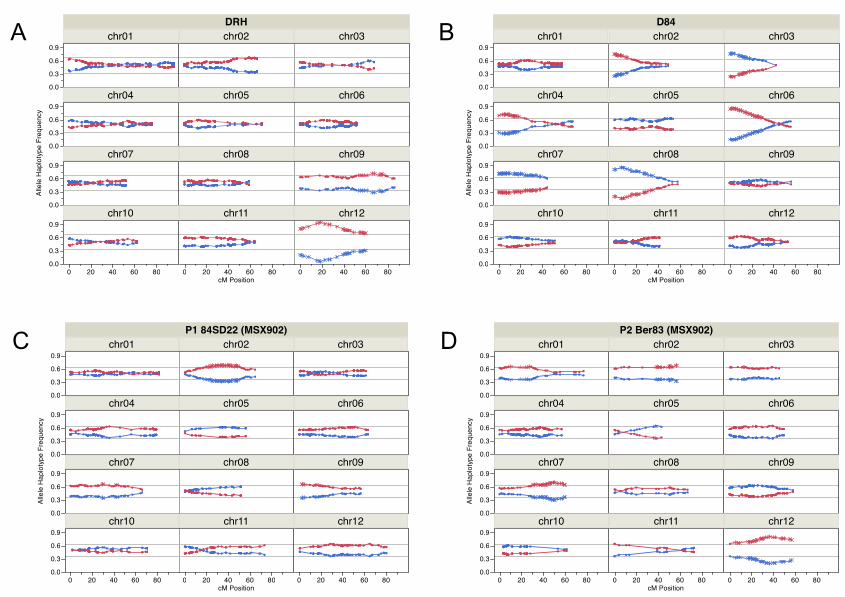
DRHAl
lele
Hap
loty
pe F
requ
ency
0.0
0.3
0.6
0.9
0.0
0.3
0.6
0.9
0.0
0.3
0.6
0.9
0.0
0.3
0.6
0.9
chr01 chr02 chr03
chr04 chr05 chr06
chr07 chr08 chr09
chr10 chr11 chr12
0 20 40 60 80 0 20 40 60 80 0 20 40 60 80cM Position
D84
Alle
le H
aplo
type
Fre
quen
cy
0.0
0.3
0.6
0.9
0.0
0.3
0.6
0.9
0.0
0.3
0.6
0.9
0.0
0.3
0.6
0.9
chr01 chr02 chr03
chr04 chr05 chr06
chr07 chr08 chr09
chr10 chr11 chr12
0 20 40 60 80 0 20 40 60 80 0 20 40 60 80cM Position
P1 84SD22 (MSX902)
Alle
le H
aplo
type
Fre
quen
cy
0.0
0.3
0.6
0.9
0.0
0.3
0.6
0.9
0.0
0.3
0.6
0.9
0.0
0.3
0.6
0.9
chr01 chr02 chr03
chr04 chr05 chr06
chr07 chr08 chr09
chr10 chr11 chr12
0 20 40 60 80 0 20 40 60 80 0 20 40 60 80cM Position
P2 Ber83 (MSX902)
Alle
le H
aplo
type
Fre
quen
cy
0.0
0.3
0.6
0.9
0.0
0.3
0.6
0.9
0.0
0.3
0.6
0.9
0.0
0.3
0.6
0.9
chr01 chr02 chr03
chr04 chr05 chr06
chr07 chr08 chr09
chr10 chr11 chr12
0 20 40 60 80 0 20 40 60 80 0 20 40 60 80cM Position
A
C
B
D

DRHcM
cM/M
bP-
valu
e
0
40
80
0
5
10
1015
3
chr09 chr12
0 20 40 60 80 0 20 40 60 80Mb v4.03
D84
cMcM
/Mb
P-va
lue
0
40
80
-505
10
05
1015
chr04 chr06
0 5 15 25 35 45 55 65 0 5 15 25 35 45 55 65Mb v4.03
A B
Related Documents