Journal of Global Economy, Volume 4 No 2, APRIL-JUNE, 2008 160 Comparative Analysis of Financial Performance of Private Sector Banks in India: Application of CAMEL Model Sumeet Gupta 1 and Renu Verma 2 Introduction As soon the bottom lines of Domestic Banks come under increasing pressure and the options for organic growth exhaust themselves, Indian Banks will need to explore ways for inorganic expansion. This, in turn, is likely to unleash the forces of consolidation in Indian banking. C. Rangarajan Chairman of Economic Advisory Council of the Prime Minister In the early 1990s the then Narasimha Rao government embarked on a policy of liberalization and gave licences to a small number of private banks, which came to be known as New Generation tech-savvy banks, which included banks such as UTI Bank (now re-named as Axis Bank) (the first of such new generation banks to be set up), ICICI Bank and HDFC Bank. This move, along 1 Prof Sumeet Gupta, Faculty, Finance, IBS Jaipur 302019 2 Dr Renu Verma, Faculty, Economics, IBS Gurgaon 122017 JGE

Welcome message from author
This document is posted to help you gain knowledge. Please leave a comment to let me know what you think about it! Share it to your friends and learn new things together.
Transcript
Journal of Global Economy,
Volume 4 No 2, APRIL-JUNE, 2008
160
Comparative Analysis of Financial Performance of Private
Sector Banks in India: Application of CAMEL Model
Sumeet Gupta1 and Renu Verma
2
Introduction
As soon the bottom lines of Domestic Banks come under increasing pressure
and the options for organic growth exhaust themselves, Indian Banks will
need to explore ways for inorganic expansion. This, in turn, is likely to
unleash the forces of consolidation in Indian banking.
C. Rangarajan
Chairman of Economic Advisory Council of the Prime Minister
In the early 1990s the then Narasimha Rao government embarked on a
policy of liberalization and gave licences to a small number of private banks,
which came to be known as New Generation tech-savvy banks, which included
banks such as UTI Bank (now re-named as Axis Bank) (the first of such new
generation banks to be set up), ICICI Bank and HDFC Bank. This move, along
1 Prof Sumeet Gupta, Faculty, Finance, IBS Jaipur 302019
2 Dr Renu Verma, Faculty, Economics, IBS Gurgaon 122017
JGE
Journal of Global Economy,
Volume 4 No 2, APRIL-JUNE, 2008
161
with the rapid growth in the economy of India, kick started the banking sector
in India, which has seen rapid growth with strong contribution from all the
three sectors of banks, namely, government banks, private banks and foreign
banks. The next stage for the Indian banking has been setup with the proposed
relaxation in the norms for Foreign Direct Investment, where all Foreign
Investors in banks may be given voting rights which could exceed the present
cap of 10%, at present it has gone up to 49% with some restrictions. The new
policy shook the Banking sector in India completely. Bankers, till this time,
were used to the 4-6-4 method (Borrow at 4%; Lend at 6%; Go home at 4) of
functioning. The new wave ushered in a modern outlook and tech-savvy
methods of working for traditional banks. All this led to the retail boom in
India. People not just demanded more from their banks but also received more.
Now Banking in India is mature in terms of supply, product range and
reach-even in rural India through rural banking and remote banking. In terms
of quality of assets and capital adequacy, Indian banks are considered to have
clean, strong and transparent balance sheets. The present research work
analyses the overall financial performance of major private sector banks in
India through application of CAMEL Model. Besides it also attempts to
compare the performance of these Banks with the help of Composite Ranking
Method.
OBJECTIVES OF THE STUDY
The present study is an attempt to achieve the following objectives:
1. To study the overall performance of major Private Sector Banks
applying CAMEL(Capital Adequacy, Assets Quality, Management,
Earning Quality, Liquidity) Model.
2. To make a comparative analysis of major Private Sector banks by using
Composite Ranking Method
3. On the basis of result of the result of the study to suggest various
measures to improve the performance of the Banks in future.
Journal of Global Economy,
Volume 4 No 2, APRIL-JUNE, 2008
162
METHODOLOGY
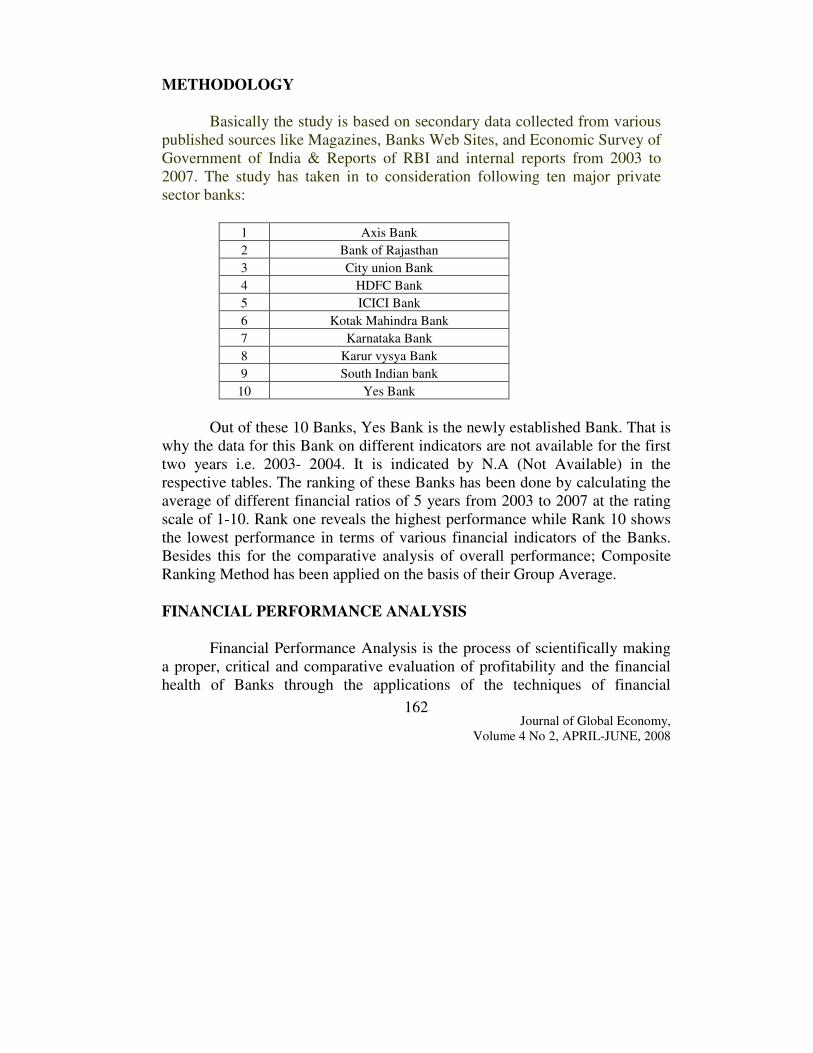
Basically the study is based on secondary data collected from various
published sources like Magazines, Banks Web Sites, and Economic Survey of
Government of India & Reports of RBI and internal reports from 2003 to
2007. The study has taken in to consideration following ten major private
sector banks:
1 Axis Bank
2 Bank of Rajasthan
3 City union Bank
4 HDFC Bank
5 ICICI Bank
6 Kotak Mahindra Bank
7 Karnataka Bank
8 Karur vysya Bank
9 South Indian bank
10 Yes Bank
Out of these 10 Banks, Yes Bank is the newly established Bank. That is
why the data for this Bank on different indicators are not available for the first
two years i.e. 2003- 2004. It is indicated by N.A (Not Available) in the
respective tables. The ranking of these Banks has been done by calculating the
average of different financial ratios of 5 years from 2003 to 2007 at the rating
scale of 1-10. Rank one reveals the highest performance while Rank 10 shows
the lowest performance in terms of various financial indicators of the Banks.
Besides this for the comparative analysis of overall performance; Composite
Ranking Method has been applied on the basis of their Group Average.
FINANCIAL PERFORMANCE ANALYSIS
Financial Performance Analysis is the process of scientifically making
a proper, critical and comparative evaluation of profitability and the financial
health of Banks through the applications of the techniques of financial
Journal of Global Economy,
Volume 4 No 2, APRIL-JUNE, 2008
163
statement analysis. Financial Analysis covers a vast area and is of great
practical importance. The Banks use various ratios for measuring the financial
performance which tells us the true financial position of the bank. In the
present study CAMEL Model has been applied for the same purpose. Various
ratios calculated under the Model help in identifying the strengths/weaknesses
of banks and suggesting improvement in its future working. In the present
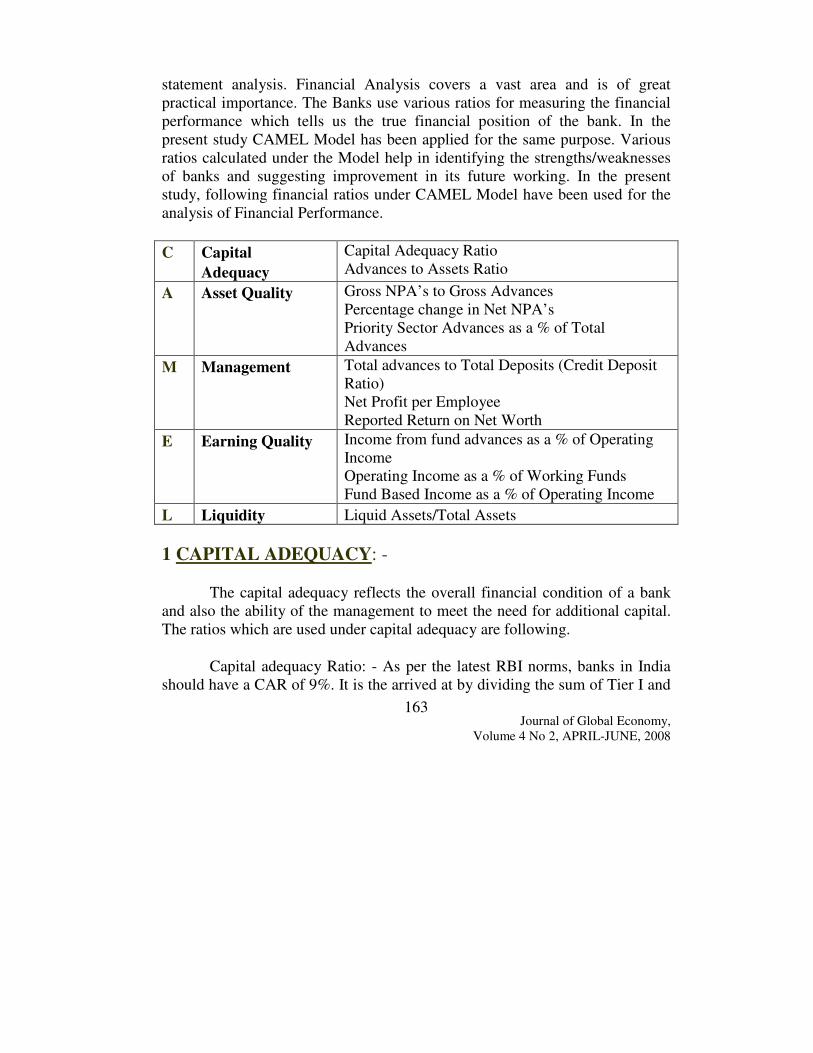
study, following financial ratios under CAMEL Model have been used for the
analysis of Financial Performance.
C Capital
Adequacy
Capital Adequacy Ratio
Advances to Assets Ratio
A Asset Quality Gross NPA’s to Gross Advances
Percentage change in Net NPA’s
Priority Sector Advances as a % of Total
Advances
M Management Total advances to Total Deposits (Credit Deposit
Ratio)
Net Profit per Employee
Reported Return on Net Worth
E Earning Quality Income from fund advances as a % of Operating
Income
Operating Income as a % of Working Funds
Fund Based Income as a % of Operating Income
L Liquidity Liquid Assets/Total Assets
1 CAPITAL ADEQUACY: -
The capital adequacy reflects the overall financial condition of a bank
and also the ability of the management to meet the need for additional capital.
The ratios which are used under capital adequacy are following.
Capital adequacy Ratio: - As per the latest RBI norms, banks in India
should have a CAR of 9%. It is the arrived at by dividing the sum of Tier I and
Journal of Global Economy,
Volume 4 No 2, APRIL-JUNE, 2008
164
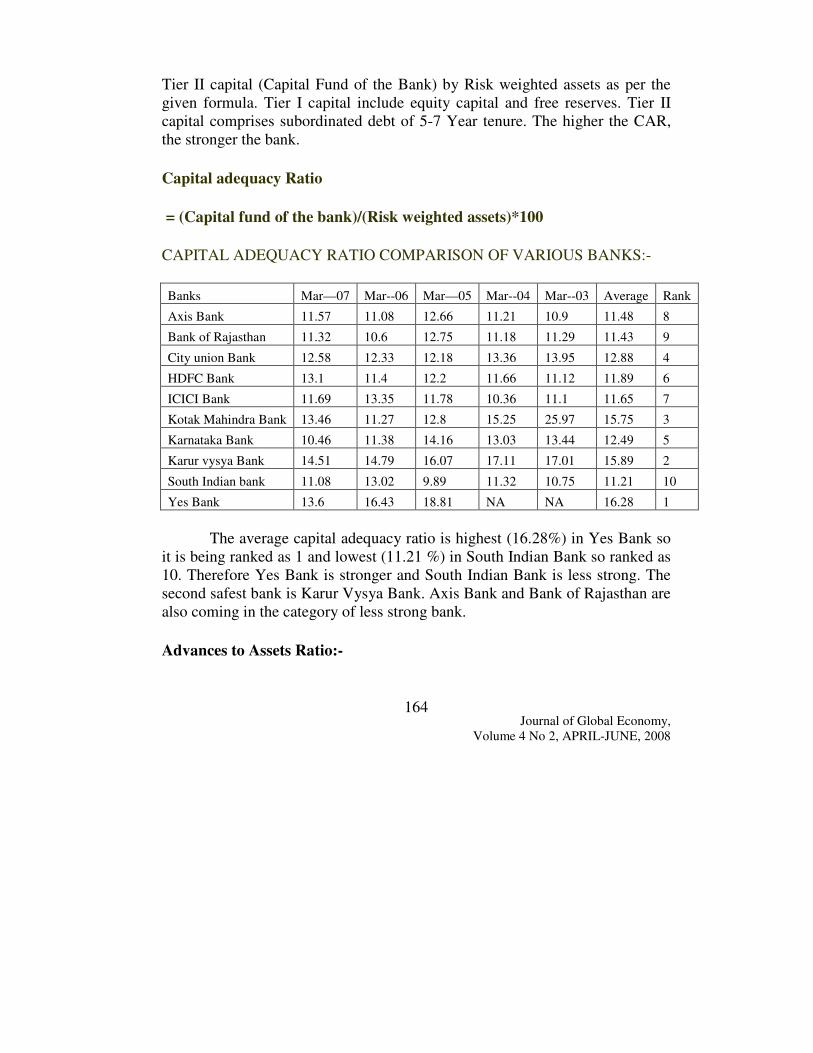
Tier II capital (Capital Fund of the Bank) by Risk weighted assets as per the
given formula. Tier I capital include equity capital and free reserves. Tier II
capital comprises subordinated debt of 5-7 Year tenure. The higher the CAR,
the stronger the bank.
Capital adequacy Ratio
= (Capital fund of the bank)/(Risk weighted assets)*100
CAPITAL ADEQUACY RATIO COMPARISON OF VARIOUS BANKS:-
Banks Mar—07 Mar--06 Mar—05 Mar--04 Mar--03 Average Rank
Axis Bank 11.57 11.08 12.66 11.21 10.9 11.48 8
Bank of Rajasthan 11.32 10.6 12.75 11.18 11.29 11.43 9
City union Bank 12.58 12.33 12.18 13.36 13.95 12.88 4
HDFC Bank 13.1 11.4 12.2 11.66 11.12 11.89 6
ICICI Bank 11.69 13.35 11.78 10.36 11.1 11.65 7
Kotak Mahindra Bank 13.46 11.27 12.8 15.25 25.97 15.75 3
Karnataka Bank 10.46 11.38 14.16 13.03 13.44 12.49 5
Karur vysya Bank 14.51 14.79 16.07 17.11 17.01 15.89 2
South Indian bank 11.08 13.02 9.89 11.32 10.75 11.21 10
Yes Bank 13.6 16.43 18.81 NA NA 16.28 1
The average capital adequacy ratio is highest (16.28%) in Yes Bank so
it is being ranked as 1 and lowest (11.21 %) in South Indian Bank so ranked as
10. Therefore Yes Bank is stronger and South Indian Bank is less strong. The
second safest bank is Karur Vysya Bank. Axis Bank and Bank of Rajasthan are
also coming in the category of less strong bank.
Advances to Assets Ratio:-
Journal of Global Economy,
Volume 4 No 2, APRIL-JUNE, 2008
165
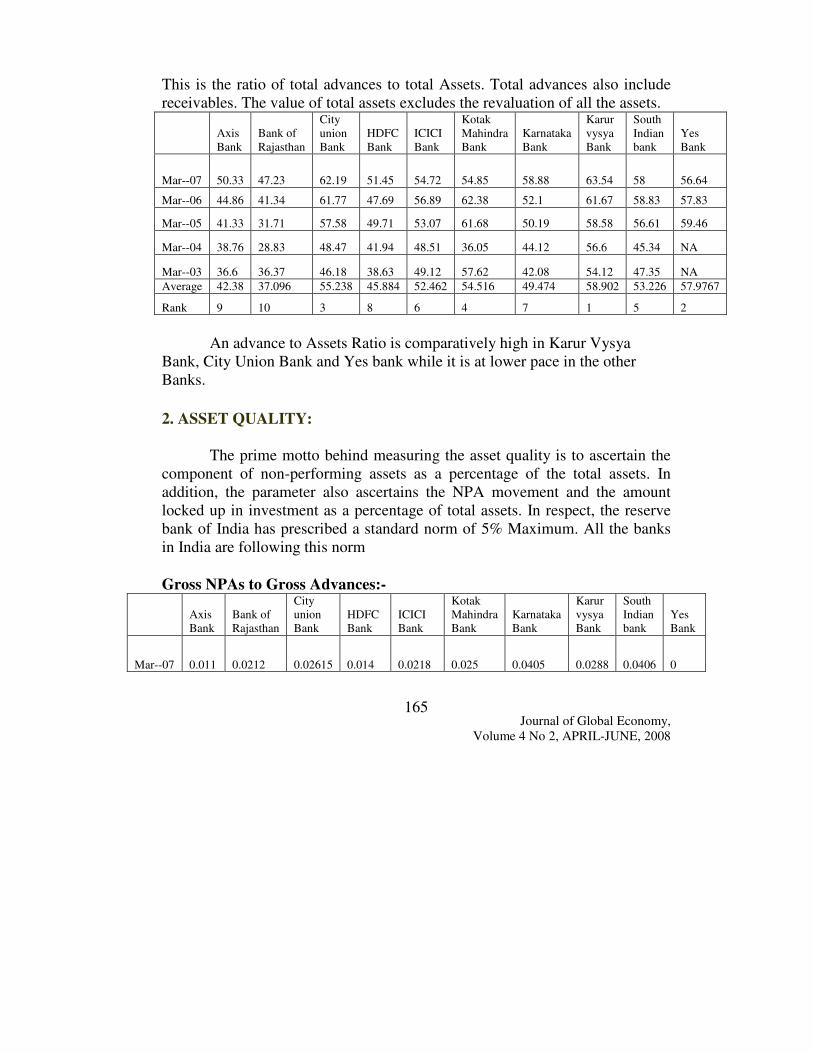
This is the ratio of total advances to total Assets. Total advances also include
receivables. The value of total assets excludes the revaluation of all the assets.
Axis
Bank
Bank of
Rajasthan
City
union
Bank
HDFC
Bank
ICICI
Bank
Kotak
Mahindra
Bank
Karnataka
Bank
Karur
vysya
Bank
South
Indian
bank
Yes
Bank
Mar--07 50.33 47.23 62.19 51.45 54.72 54.85 58.88 63.54 58 56.64
Mar--06 44.86 41.34 61.77 47.69 56.89 62.38 52.1 61.67 58.83 57.83
Mar--05 41.33 31.71 57.58 49.71 53.07 61.68 50.19 58.58 56.61 59.46
Mar--04 38.76 28.83 48.47 41.94 48.51 36.05 44.12 56.6 45.34 NA
Mar--03 36.6 36.37 46.18 38.63 49.12 57.62 42.08 54.12 47.35 NA
Average 42.38 37.096 55.238 45.884 52.462 54.516 49.474 58.902 53.226 57.9767
Rank 9 10 3 8 6 4 7 1 5 2
An advance to Assets Ratio is comparatively high in Karur Vysya
Bank, City Union Bank and Yes bank while it is at lower pace in the other
Banks.
2. ASSET QUALITY:
The prime motto behind measuring the asset quality is to ascertain the
component of non-performing assets as a percentage of the total assets. In
addition, the parameter also ascertains the NPA movement and the amount
locked up in investment as a percentage of total assets. In respect, the reserve
bank of India has prescribed a standard norm of 5% Maximum. All the banks
in India are following this norm
Gross NPAs to Gross Advances:-
Axis
Bank
Bank of
Rajasthan
City
union
Bank
HDFC
Bank
ICICI
Bank
Kotak
Mahindra
Bank
Karnataka
Bank
Karur
vysya
Bank
South
Indian
bank
Yes
Bank
Mar--07 0.011 0.0212 0.02615 0.014 0.0218 0.025 0.0405 0.0288 0.0406 0
Journal of Global Economy,
Volume 4 No 2, APRIL-JUNE, 2008
166
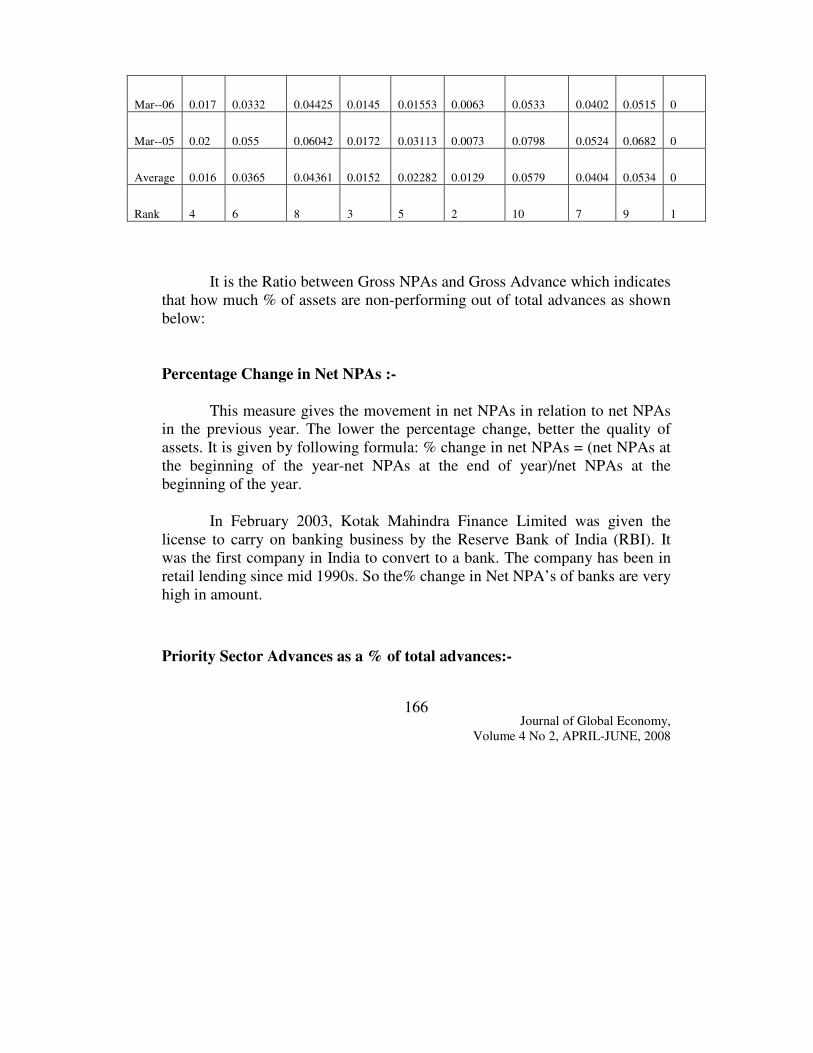
Mar--06 0.017 0.0332 0.04425 0.0145 0.01553 0.0063 0.0533 0.0402 0.0515 0
Mar--05 0.02 0.055 0.06042 0.0172 0.03113 0.0073 0.0798 0.0524 0.0682 0
Average 0.016 0.0365 0.04361 0.0152 0.02282 0.0129 0.0579 0.0404 0.0534 0
Rank 4 6 8 3 5 2 10 7 9 1
It is the Ratio between Gross NPAs and Gross Advance which indicates
that how much % of assets are non-performing out of total advances as shown
below:
Percentage Change in Net NPAs :-
This measure gives the movement in net NPAs in relation to net NPAs
in the previous year. The lower the percentage change, better the quality of
assets. It is given by following formula: % change in net NPAs = (net NPAs at
the beginning of the year-net NPAs at the end of year)/net NPAs at the
beginning of the year.
In February 2003, Kotak Mahindra Finance Limited was given the
license to carry on banking business by the Reserve Bank of India (RBI). It
was the first company in India to convert to a bank. The company has been in
retail lending since mid 1990s. So the% change in Net NPA’s of banks are very
high in amount.
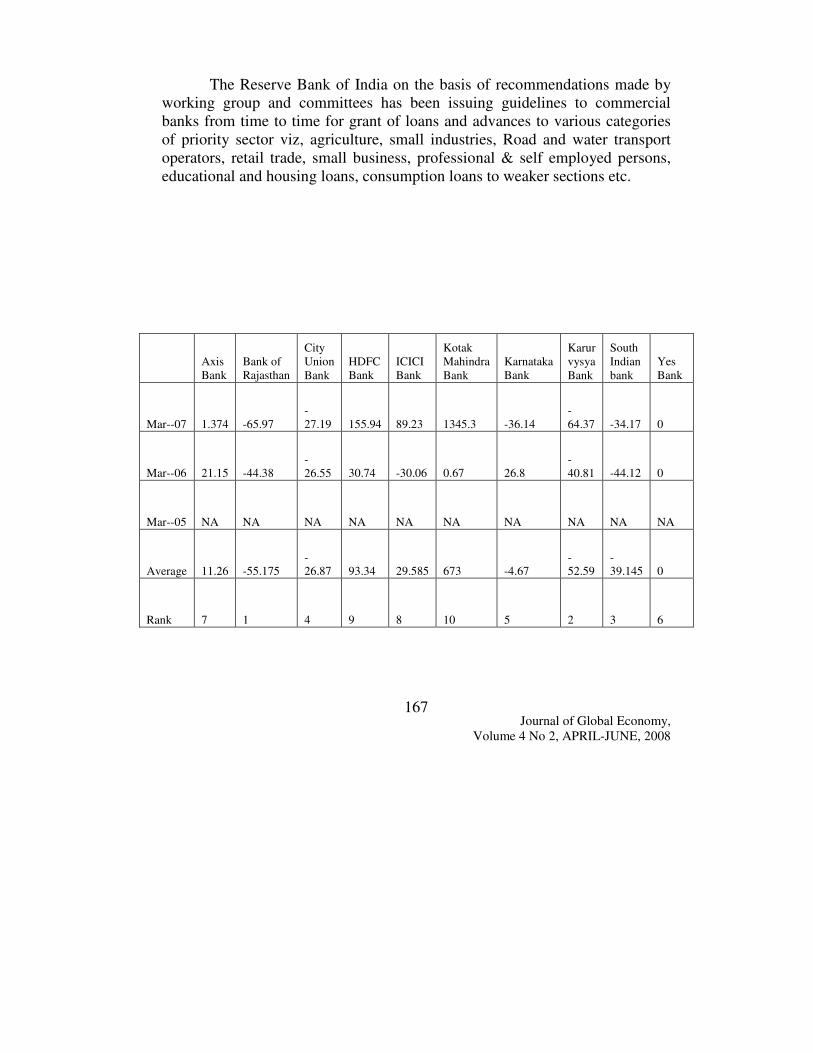
Priority Sector Advances as a % of total advances:-
Journal of Global Economy,
Volume 4 No 2, APRIL-JUNE, 2008
167
The Reserve Bank of India on the basis of recommendations made by
working group and committees has been issuing guidelines to commercial
banks from time to time for grant of loans and advances to various categories
of priority sector viz, agriculture, small industries, Road and water transport
operators, retail trade, small business, professional & self employed persons,
educational and housing loans, consumption loans to weaker sections etc.
Axis
Bank
Bank of
Rajasthan
City
Union
Bank
HDFC
Bank
ICICI
Bank
Kotak
Mahindra
Bank
Karnataka
Bank
Karur
vysya
Bank
South
Indian
bank
Yes
Bank
Mar--07 1.374 -65.97
-
27.19 155.94 89.23 1345.3 -36.14
-
64.37 -34.17 0
Mar--06 21.15 -44.38
-
26.55 30.74 -30.06 0.67 26.8
-
40.81 -44.12 0
Mar--05 NA NA NA NA NA NA NA NA NA NA
Average 11.26 -55.175
-
26.87 93.34 29.585 673 -4.67
-
52.59
-
39.145 0
Rank 7 1 4 9 8 10 5 2 3 6
Journal of Global Economy,
Volume 4 No 2, APRIL-JUNE, 2008
168
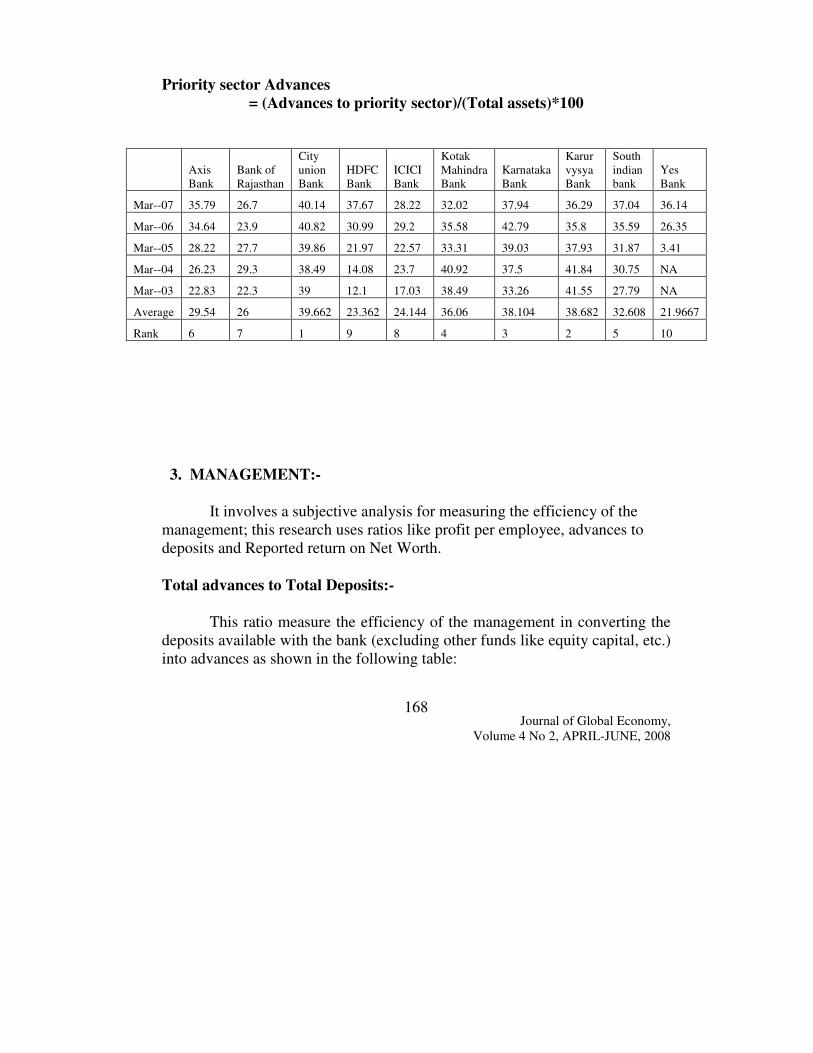
Priority sector Advances
= (Advances to priority sector)/(Total assets)*100
Axis
Bank
Bank of
Rajasthan
City
union
Bank
HDFC
Bank
ICICI
Bank
Kotak
Mahindra
Bank
Karnataka
Bank
Karur
vysya
Bank
South
indian
bank
Yes
Bank
Mar--07 35.79 26.7 40.14 37.67 28.22 32.02 37.94 36.29 37.04 36.14
Mar--06 34.64 23.9 40.82 30.99 29.2 35.58 42.79 35.8 35.59 26.35
Mar--05 28.22 27.7 39.86 21.97 22.57 33.31 39.03 37.93 31.87 3.41
Mar--04 26.23 29.3 38.49 14.08 23.7 40.92 37.5 41.84 30.75 NA
Mar--03 22.83 22.3 39 12.1 17.03 38.49 33.26 41.55 27.79 NA
Average 29.54 26 39.662 23.362 24.144 36.06 38.104 38.682 32.608 21.9667
Rank 6 7 1 9 8 4 3 2 5 10
3. MANAGEMENT:-
It involves a subjective analysis for measuring the efficiency of the
management; this research uses ratios like profit per employee, advances to
deposits and Reported return on Net Worth.
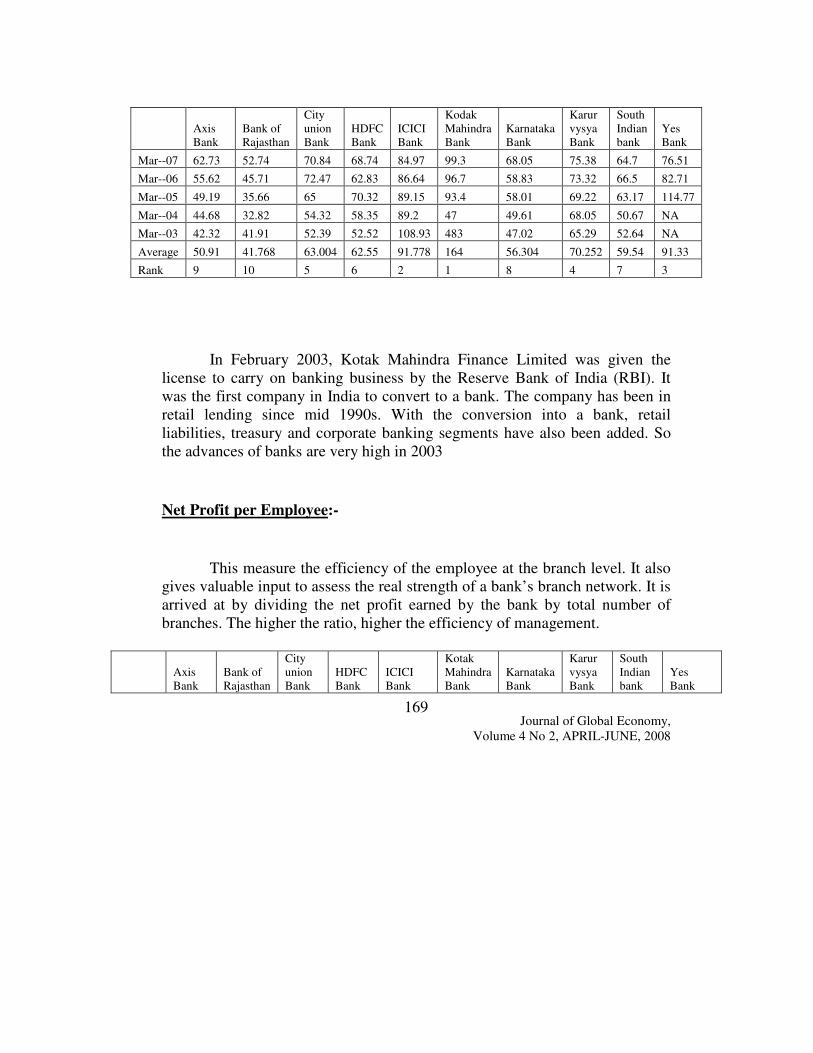
Total advances to Total Deposits:-
This ratio measure the efficiency of the management in converting the
deposits available with the bank (excluding other funds like equity capital, etc.)
into advances as shown in the following table:
Journal of Global Economy,
Volume 4 No 2, APRIL-JUNE, 2008
169
In February 2003, Kotak Mahindra Finance Limited was given the
license to carry on banking business by the Reserve Bank of India (RBI). It
was the first company in India to convert to a bank. The company has been in
retail lending since mid 1990s. With the conversion into a bank, retail
liabilities, treasury and corporate banking segments have also been added. So
the advances of banks are very high in 2003
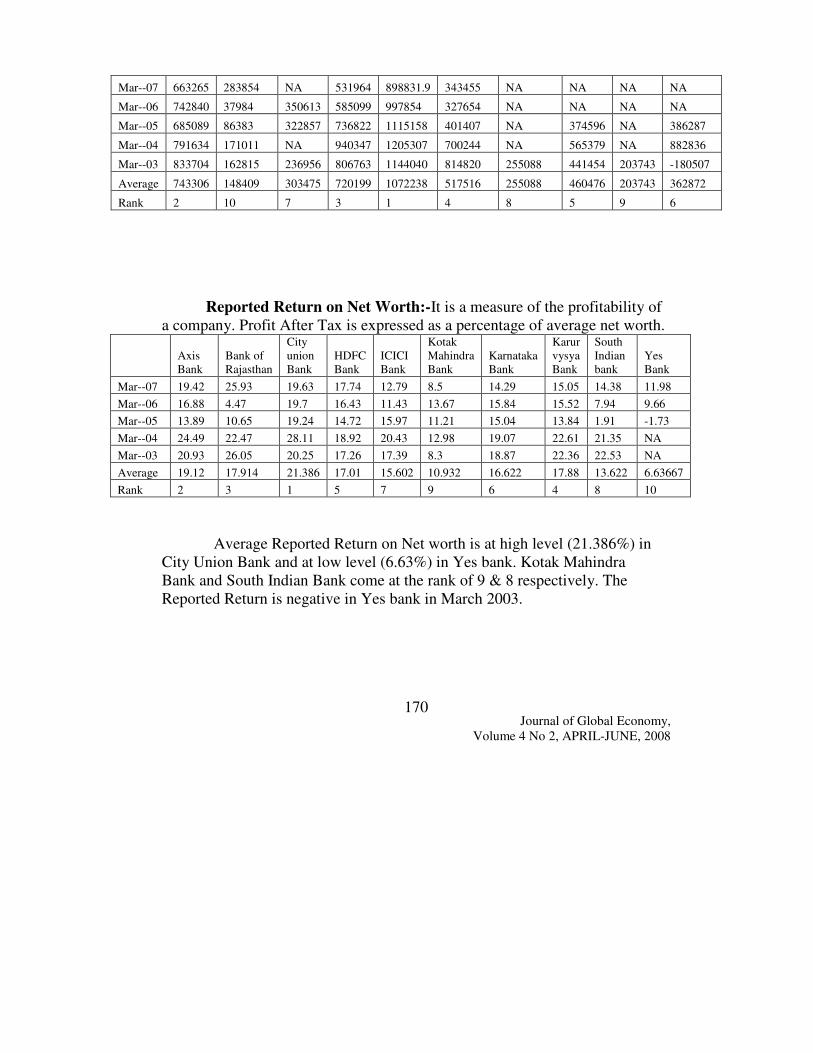
Net Profit per Employee:-
This measure the efficiency of the employee at the branch level. It also
gives valuable input to assess the real strength of a bank’s branch network. It is
arrived at by dividing the net profit earned by the bank by total number of
branches. The higher the ratio, higher the efficiency of management.
Axis
Bank
Bank of
Rajasthan
City
union
Bank
HDFC
Bank
ICICI
Bank
Kotak
Mahindra
Bank
Karnataka
Bank
Karur
vysya
Bank
South
Indian
bank
Yes
Bank
Axis
Bank
Bank of
Rajasthan
City
union
Bank
HDFC
Bank
ICICI
Bank
Kodak
Mahindra
Bank
Karnataka
Bank
Karur
vysya
Bank
South
Indian
bank
Yes
Bank
Mar--07 62.73 52.74 70.84 68.74 84.97 99.3 68.05 75.38 64.7 76.51
Mar--06 55.62 45.71 72.47 62.83 86.64 96.7 58.83 73.32 66.5 82.71
Mar--05 49.19 35.66 65 70.32 89.15 93.4 58.01 69.22 63.17 114.77
Mar--04 44.68 32.82 54.32 58.35 89.2 47 49.61 68.05 50.67 NA
Mar--03 42.32 41.91 52.39 52.52 108.93 483 47.02 65.29 52.64 NA
Average 50.91 41.768 63.004 62.55 91.778 164 56.304 70.252 59.54 91.33
Rank 9 10 5 6 2 1 8 4 7 3
Journal of Global Economy,
Volume 4 No 2, APRIL-JUNE, 2008
170
Mar--07 663265 283854 NA 531964 898831.9 343455 NA NA NA NA
Mar--06 742840 37984 350613 585099 997854 327654 NA NA NA NA
Mar--05 685089 86383 322857 736822 1115158 401407 NA 374596 NA 386287
Mar--04 791634 171011 NA 940347 1205307 700244 NA 565379 NA 882836
Mar--03 833704 162815 236956 806763 1144040 814820 255088 441454 203743 -180507
Average 743306 148409 303475 720199 1072238 517516 255088 460476 203743 362872
Rank 2 10 7 3 1 4 8 5 9 6
Reported Return on Net Worth:-It is a measure of the profitability of
a company. Profit After Tax is expressed as a percentage of average net worth.
Axis
Bank
Bank of
Rajasthan
City
union
Bank
HDFC
Bank
ICICI
Bank
Kotak
Mahindra
Bank
Karnataka
Bank
Karur
vysya
Bank
South
Indian
bank
Yes
Bank
Mar--07 19.42 25.93 19.63 17.74 12.79 8.5 14.29 15.05 14.38 11.98
Mar--06 16.88 4.47 19.7 16.43 11.43 13.67 15.84 15.52 7.94 9.66
Mar--05 13.89 10.65 19.24 14.72 15.97 11.21 15.04 13.84 1.91 -1.73
Mar--04 24.49 22.47 28.11 18.92 20.43 12.98 19.07 22.61 21.35 NA
Mar--03 20.93 26.05 20.25 17.26 17.39 8.3 18.87 22.36 22.53 NA
Average 19.12 17.914 21.386 17.01 15.602 10.932 16.622 17.88 13.622 6.63667
Rank 2 3 1 5 7 9 6 4 8 10
Average Reported Return on Net worth is at high level (21.386%) in
City Union Bank and at low level (6.63%) in Yes bank. Kotak Mahindra
Bank and South Indian Bank come at the rank of 9 & 8 respectively. The
Reported Return is negative in Yes bank in March 2003.
Journal of Global Economy,
Volume 4 No 2, APRIL-JUNE, 2008
171
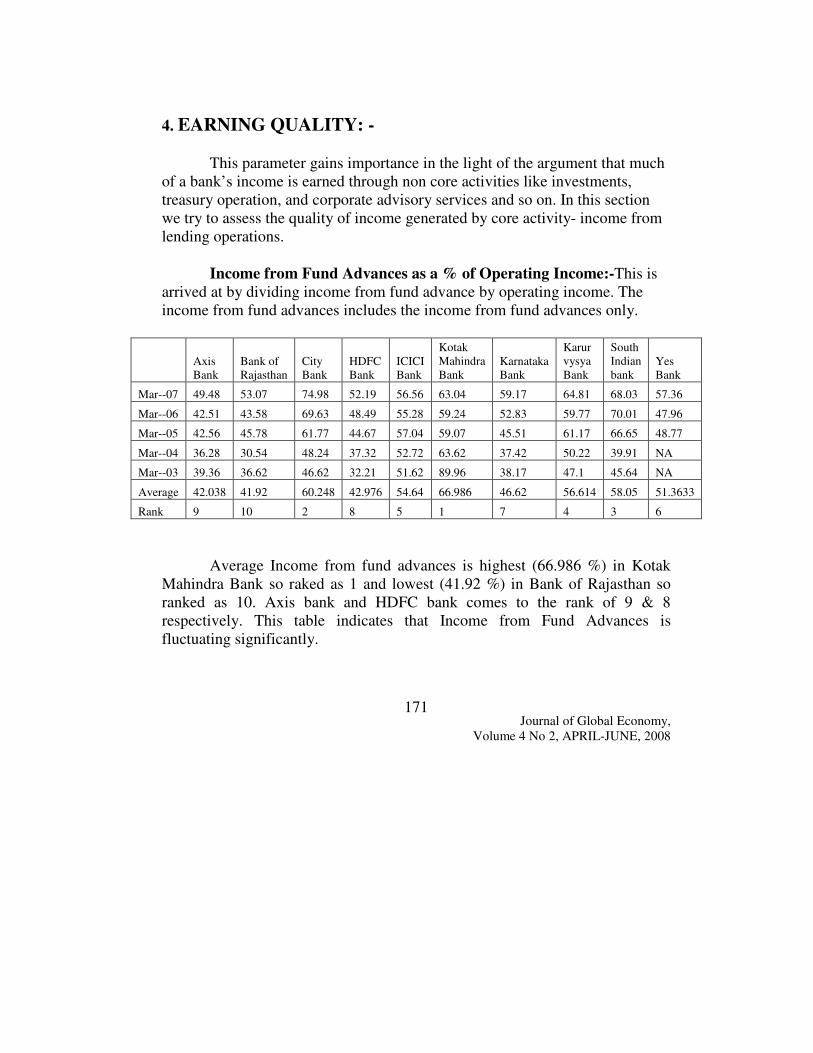
4. EARNING QUALITY: -
This parameter gains importance in the light of the argument that much
of a bank’s income is earned through non core activities like investments,
treasury operation, and corporate advisory services and so on. In this section
we try to assess the quality of income generated by core activity- income from
lending operations.
Income from Fund Advances as a % of Operating Income:-This is
arrived at by dividing income from fund advance by operating income. The
income from fund advances includes the income from fund advances only.
Axis
Bank
Bank of
Rajasthan
City
Bank
HDFC
Bank
ICICI
Bank
Kotak
Mahindra
Bank
Karnataka
Bank
Karur
vysya
Bank
South
Indian
bank
Yes
Bank
Mar--07 49.48 53.07 74.98 52.19 56.56 63.04 59.17 64.81 68.03 57.36
Mar--06 42.51 43.58 69.63 48.49 55.28 59.24 52.83 59.77 70.01 47.96
Mar--05 42.56 45.78 61.77 44.67 57.04 59.07 45.51 61.17 66.65 48.77
Mar--04 36.28 30.54 48.24 37.32 52.72 63.62 37.42 50.22 39.91 NA
Mar--03 39.36 36.62 46.62 32.21 51.62 89.96 38.17 47.1 45.64 NA
Average 42.038 41.92 60.248 42.976 54.64 66.986 46.62 56.614 58.05 51.3633
Rank 9 10 2 8 5 1 7 4 3 6
Average Income from fund advances is highest (66.986 %) in Kotak
Mahindra Bank so raked as 1 and lowest (41.92 %) in Bank of Rajasthan so
ranked as 10. Axis bank and HDFC bank comes to the rank of 9 & 8
respectively. This table indicates that Income from Fund Advances is
fluctuating significantly.
Journal of Global Economy,
Volume 4 No 2, APRIL-JUNE, 2008
172
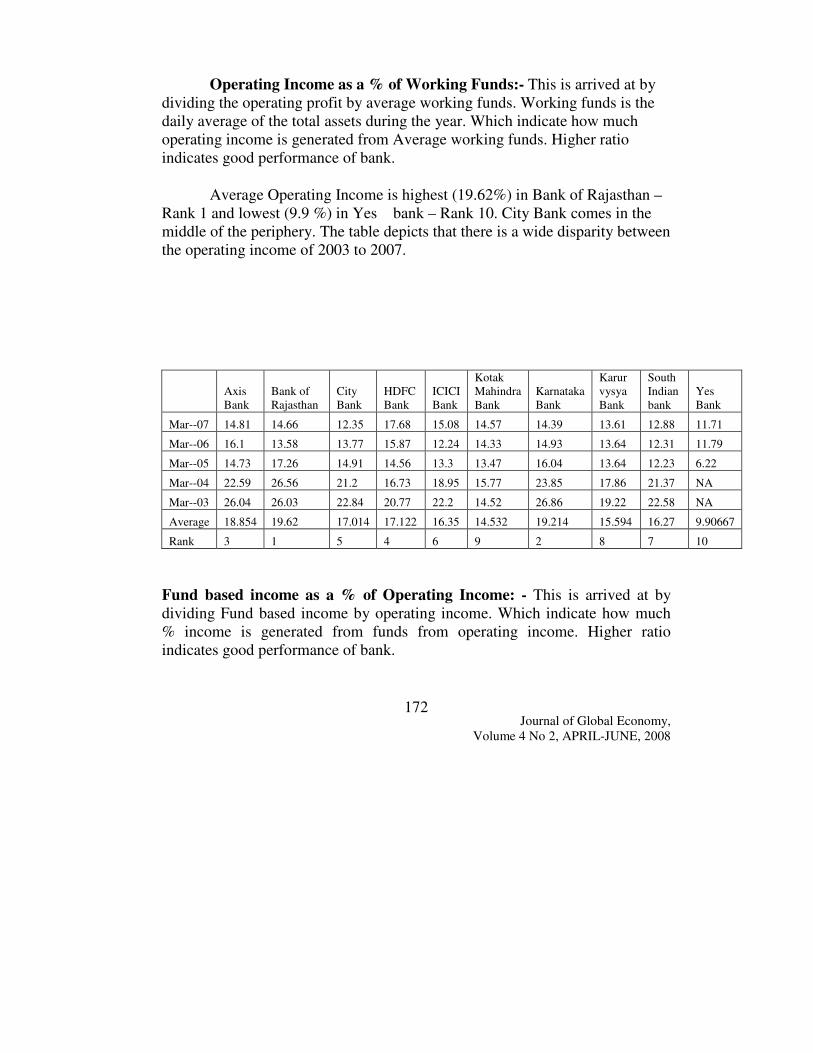
Operating Income as a % of Working Funds:- This is arrived at by
dividing the operating profit by average working funds. Working funds is the
daily average of the total assets during the year. Which indicate how much
operating income is generated from Average working funds. Higher ratio
indicates good performance of bank.
Average Operating Income is highest (19.62%) in Bank of Rajasthan –
Rank 1 and lowest (9.9 %) in Yes bank – Rank 10. City Bank comes in the
middle of the periphery. The table depicts that there is a wide disparity between
the operating income of 2003 to 2007.
Axis
Bank
Bank of
Rajasthan
City
Bank
HDFC
Bank
ICICI
Bank
Kotak
Mahindra
Bank
Karnataka
Bank
Karur
vysya
Bank
South
Indian
bank
Yes
Bank
Mar--07 14.81 14.66 12.35 17.68 15.08 14.57 14.39 13.61 12.88 11.71
Mar--06 16.1 13.58 13.77 15.87 12.24 14.33 14.93 13.64 12.31 11.79
Mar--05 14.73 17.26 14.91 14.56 13.3 13.47 16.04 13.64 12.23 6.22
Mar--04 22.59 26.56 21.2 16.73 18.95 15.77 23.85 17.86 21.37 NA
Mar--03 26.04 26.03 22.84 20.77 22.2 14.52 26.86 19.22 22.58 NA
Average 18.854 19.62 17.014 17.122 16.35 14.532 19.214 15.594 16.27 9.90667
Rank 3 1 5 4 6 9 2 8 7 10
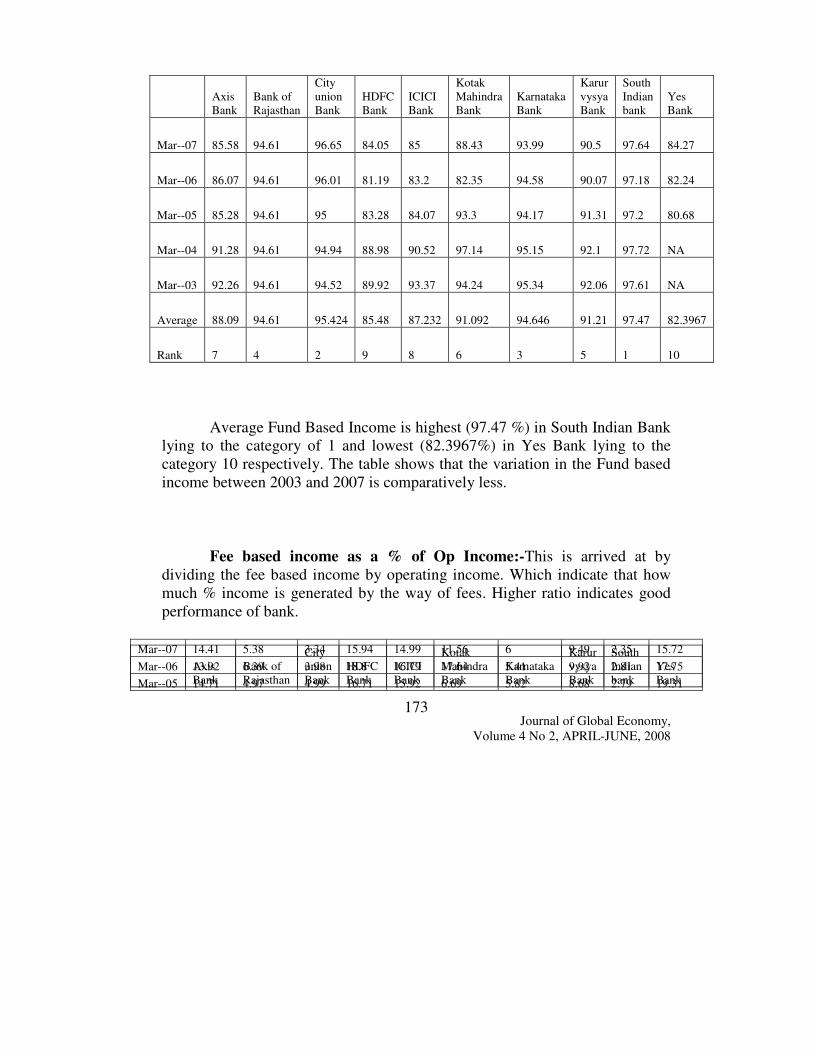
Fund based income as a % of Operating Income: - This is arrived at by
dividing Fund based income by operating income. Which indicate how much
% income is generated from funds from operating income. Higher ratio
indicates good performance of bank.
Journal of Global Economy,
Volume 4 No 2, APRIL-JUNE, 2008
173
Axis
Bank
Bank of
Rajasthan
City
union
Bank
HDFC
Bank
ICICI
Bank
Kotak
Mahindra
Bank
Karnataka
Bank
Karur
vysya
Bank
South
Indian
bank
Yes
Bank
Mar--07 85.58 94.61 96.65 84.05 85 88.43 93.99 90.5 97.64 84.27
Mar--06 86.07 94.61 96.01 81.19 83.2 82.35 94.58 90.07 97.18 82.24
Mar--05 85.28 94.61 95 83.28 84.07 93.3 94.17 91.31 97.2 80.68
Mar--04 91.28 94.61 94.94 88.98 90.52 97.14 95.15 92.1 97.72 NA
Mar--03 92.26 94.61 94.52 89.92 93.37 94.24 95.34 92.06 97.61 NA
Average 88.09 94.61 95.424 85.48 87.232 91.092 94.646 91.21 97.47 82.3967
Rank 7 4 2 9 8 6 3 5 1 10
Average Fund Based Income is highest (97.47 %) in South Indian Bank
lying to the category of 1 and lowest (82.3967%) in Yes Bank lying to the
category 10 respectively. The table shows that the variation in the Fund based
income between 2003 and 2007 is comparatively less.
Fee based income as a % of Op Income:-This is arrived at by
dividing the fee based income by operating income. Which indicate that how
much % income is generated by the way of fees. Higher ratio indicates good
performance of bank.
Axis
Bank
Bank of
Rajasthan
City
union
Bank
HDFC
Bank
ICICI
Bank
Kotak
Mahindra
Bank
Karnataka
Bank
Karur
vysya
Bank
South
Indian
bank
Yes
Bank
Mar--07 14.41 5.38 3.34 15.94 14.99 11.56 6 9.49 2.35 15.72
Mar--06 13.92 6.39 3.98 18.8 16.79 17.64 5.41 9.92 2.81 17.75
Mar--05 14.71 4.97 4.99 16.71 15.92 6.69 5.82 8.68 2.79 19.31
Journal of Global Economy,
Volume 4 No 2, APRIL-JUNE, 2008
174
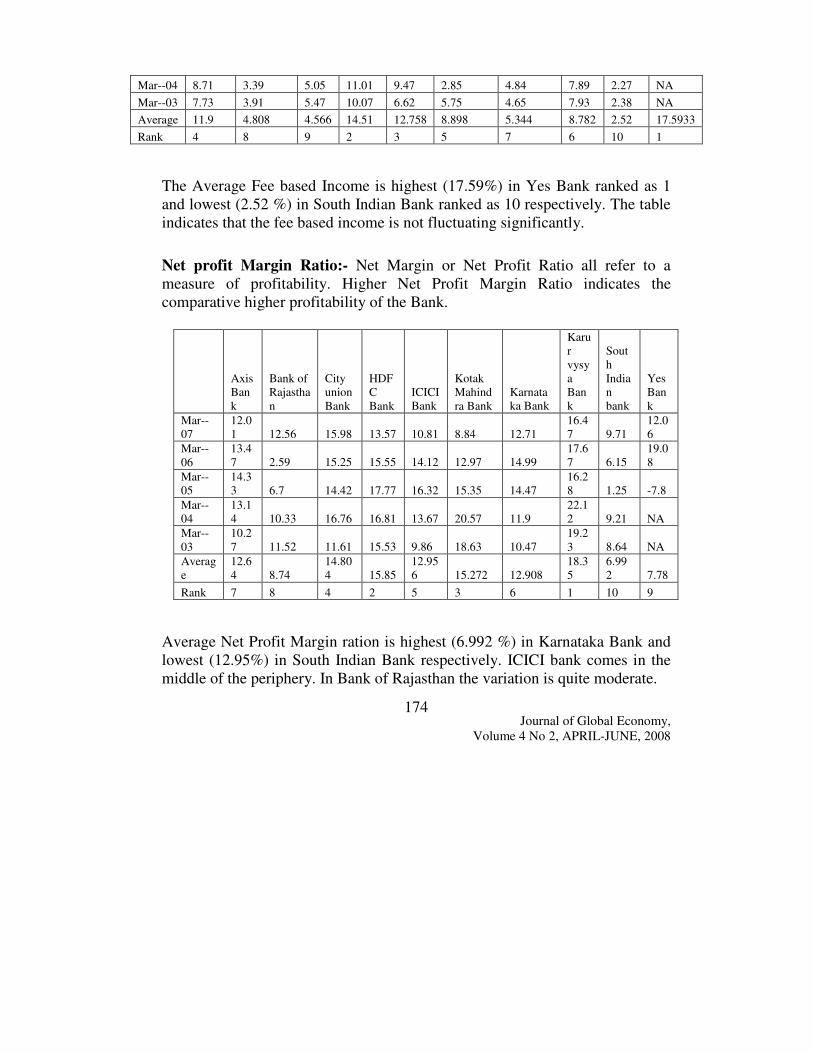
The Average Fee based Income is highest (17.59%) in Yes Bank ranked as 1
and lowest (2.52 %) in South Indian Bank ranked as 10 respectively. The table
indicates that the fee based income is not fluctuating significantly.
Net profit Margin Ratio:- Net Margin or Net Profit Ratio all refer to a
measure of profitability. Higher Net Profit Margin Ratio indicates the
comparative higher profitability of the Bank.
Axis
Ban
k
Bank of
Rajastha
n
City
union
Bank
HDF
C
Bank
ICICI
Bank
Kotak
Mahind
ra Bank
Karnata
ka Bank
Karu
r
vysy
a
Ban
k
Sout
h
India
n
bank
Yes
Ban
k
Mar--
07
12.0
1 12.56 15.98 13.57 10.81 8.84 12.71
16.4
7 9.71
12.0
6
Mar--
06
13.4
7 2.59 15.25 15.55 14.12 12.97 14.99
17.6
7 6.15
19.0
8
Mar--
05
14.3
3 6.7 14.42 17.77 16.32 15.35 14.47
16.2
8 1.25 -7.8
Mar--
04
13.1
4 10.33 16.76 16.81 13.67 20.57 11.9
22.1
2 9.21 NA
Mar--
03
10.2
7 11.52 11.61 15.53 9.86 18.63 10.47
19.2
3 8.64 NA
Averag
e
12.6
4 8.74
14.80
4 15.85
12.95
6 15.272 12.908
18.3
5
6.99
2 7.78
Rank 7 8 4 2 5 3 6 1 10 9
Average Net Profit Margin ration is highest (6.992 %) in Karnataka Bank and
lowest (12.95%) in South Indian Bank respectively. ICICI bank comes in the
middle of the periphery. In Bank of Rajasthan the variation is quite moderate.
Mar--04 8.71 3.39 5.05 11.01 9.47 2.85 4.84 7.89 2.27 NA
Mar--03 7.73 3.91 5.47 10.07 6.62 5.75 4.65 7.93 2.38 NA
Average 11.9 4.808 4.566 14.51 12.758 8.898 5.344 8.782 2.52 17.5933
Rank 4 8 9 2 3 5 7 6 10 1
Journal of Global Economy,
Volume 4 No 2, APRIL-JUNE, 2008
175
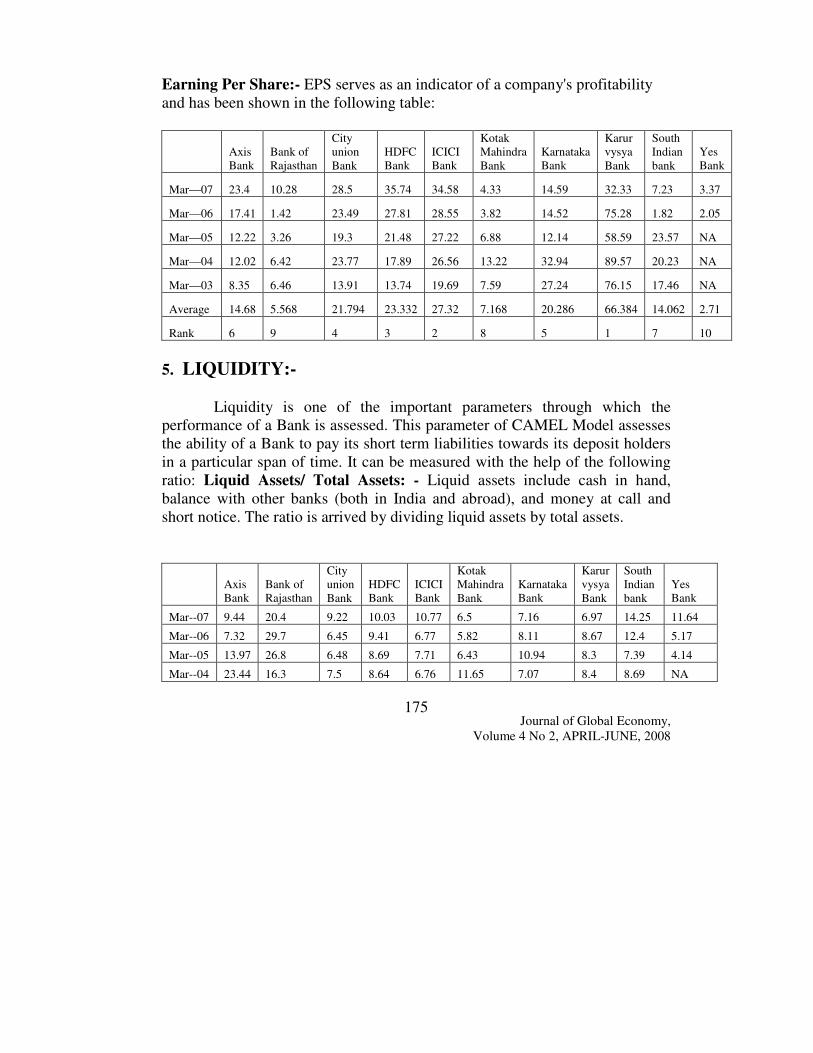
Earning Per Share:- EPS serves as an indicator of a company's profitability
and has been shown in the following table:
Axis
Bank
Bank of
Rajasthan
City
union
Bank
HDFC
Bank
ICICI
Bank
Kotak
Mahindra
Bank
Karnataka
Bank
Karur
vysya
Bank
South
Indian
bank
Yes
Bank
Mar—07 23.4 10.28 28.5 35.74 34.58 4.33 14.59 32.33 7.23 3.37
Mar—06 17.41 1.42 23.49 27.81 28.55 3.82 14.52 75.28 1.82 2.05
Mar—05 12.22 3.26 19.3 21.48 27.22 6.88 12.14 58.59 23.57 NA
Mar—04 12.02 6.42 23.77 17.89 26.56 13.22 32.94 89.57 20.23 NA
Mar—03 8.35 6.46 13.91 13.74 19.69 7.59 27.24 76.15 17.46 NA
Average 14.68 5.568 21.794 23.332 27.32 7.168 20.286 66.384 14.062 2.71
Rank 6 9 4 3 2 8 5 1 7 10
5. LIQUIDITY:-
Liquidity is one of the important parameters through which the
performance of a Bank is assessed. This parameter of CAMEL Model assesses
the ability of a Bank to pay its short term liabilities towards its deposit holders
in a particular span of time. It can be measured with the help of the following
ratio: Liquid Assets/ Total Assets: - Liquid assets include cash in hand,
balance with other banks (both in India and abroad), and money at call and
short notice. The ratio is arrived by dividing liquid assets by total assets.
Axis
Bank
Bank of
Rajasthan
City
union
Bank
HDFC
Bank
ICICI
Bank
Kotak
Mahindra
Bank
Karnataka
Bank
Karur
vysya
Bank
South
Indian
bank
Yes
Bank
Mar--07 9.44 20.4 9.22 10.03 10.77 6.5 7.16 6.97 14.25 11.64
Mar--06 7.32 29.7 6.45 9.41 6.77 5.82 8.11 8.67 12.4 5.17
Mar--05 13.97 26.8 6.48 8.69 7.71 6.43 10.94 8.3 7.39 4.14
Mar--04 23.44 16.3 7.5 8.64 6.76 11.65 7.07 8.4 8.69 NA
Journal of Global Economy,
Volume 4 No 2, APRIL-JUNE, 2008
176
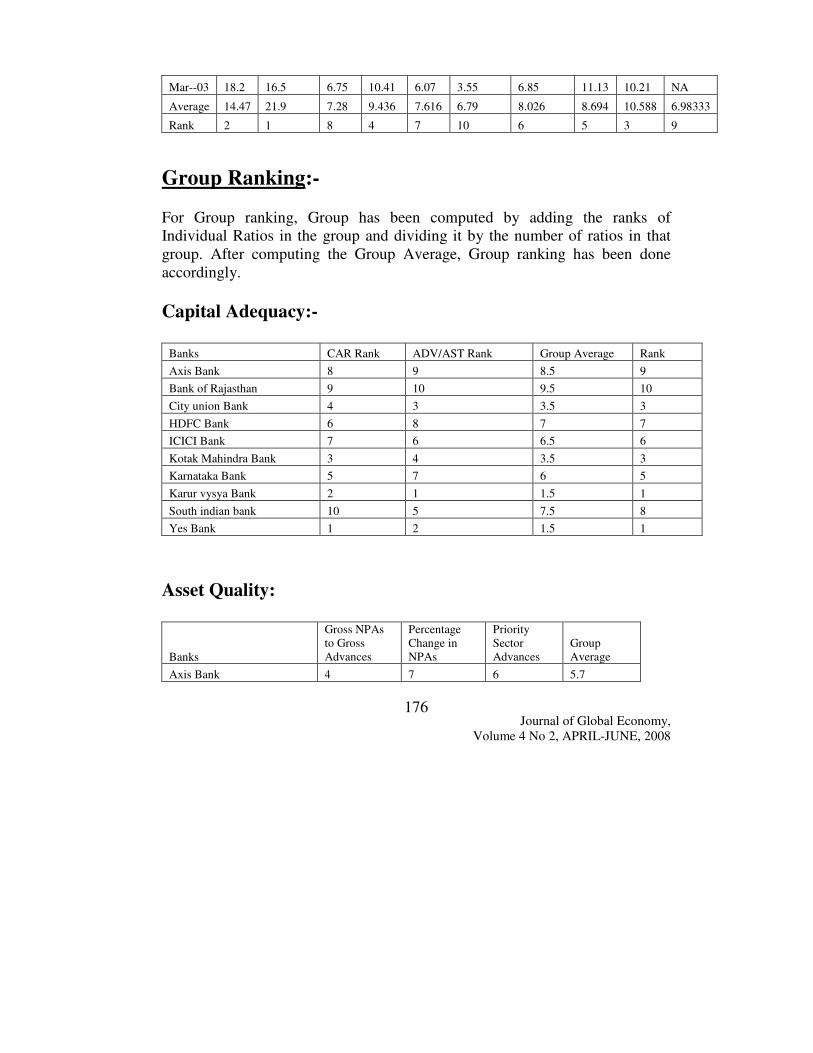
Mar--03 18.2 16.5 6.75 10.41 6.07 3.55 6.85 11.13 10.21 NA
Average 14.47 21.9 7.28 9.436 7.616 6.79 8.026 8.694 10.588 6.98333
Rank 2 1 8 4 7 10 6 5 3 9
Group Ranking:-
For Group ranking, Group has been computed by adding the ranks of
Individual Ratios in the group and dividing it by the number of ratios in that
group. After computing the Group Average, Group ranking has been done
accordingly.
Capital Adequacy:-
Banks CAR Rank ADV/AST Rank Group Average Rank
Axis Bank 8 9 8.5 9
Bank of Rajasthan 9 10 9.5 10
City union Bank 4 3 3.5 3
HDFC Bank 6 8 7 7
ICICI Bank 7 6 6.5 6
Kotak Mahindra Bank 3 4 3.5 3
Karnataka Bank 5 7 6 5
Karur vysya Bank 2 1 1.5 1
South indian bank 10 5 7.5 8
Yes Bank 1 2 1.5 1
Asset Quality:
Banks
Gross NPAs
to Gross
Advances
Percentage
Change in
NPAs
Priority
Sector
Advances
Group
Average
Axis Bank 4 7 6 5.7
Journal of Global Economy,
Volume 4 No 2, APRIL-JUNE, 2008
177
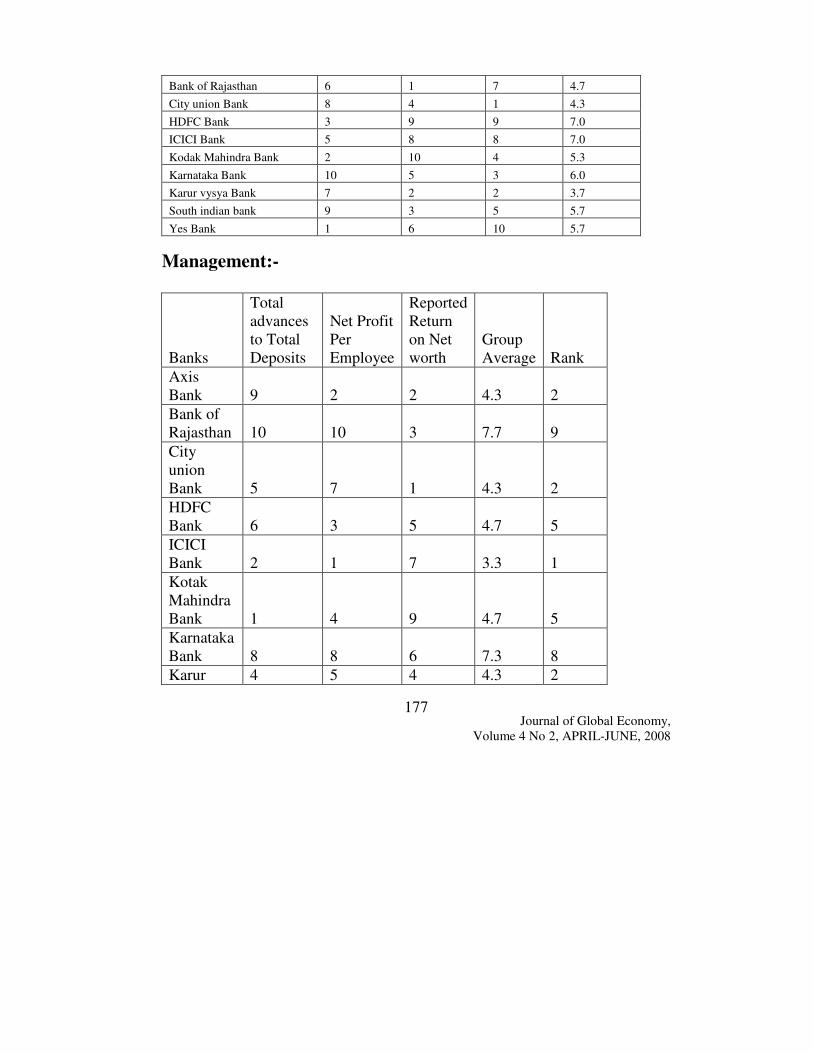
Bank of Rajasthan 6 1 7 4.7
City union Bank 8 4 1 4.3
HDFC Bank 3 9 9 7.0
ICICI Bank 5 8 8 7.0
Kodak Mahindra Bank 2 10 4 5.3
Karnataka Bank 10 5 3 6.0
Karur vysya Bank 7 2 2 3.7
South indian bank 9 3 5 5.7
Yes Bank 1 6 10 5.7
Management:-
Banks
Total
advances
to Total
Deposits
Net Profit
Per
Employee
Reported
Return
on Net
worth
Group
Average Rank
Axis
Bank 9 2 2 4.3 2
Bank of
Rajasthan 10 10 3 7.7 9
City
union
Bank 5 7 1 4.3 2
HDFC
Bank 6 3 5 4.7 5
ICICI
Bank 2 1 7 3.3 1
Kotak
Mahindra
Bank 1 4 9 4.7 5
Karnataka
Bank 8 8 6 7.3 8
Karur 4 5 4 4.3 2
Journal of Global Economy,
Volume 4 No 2, APRIL-JUNE, 2008
178
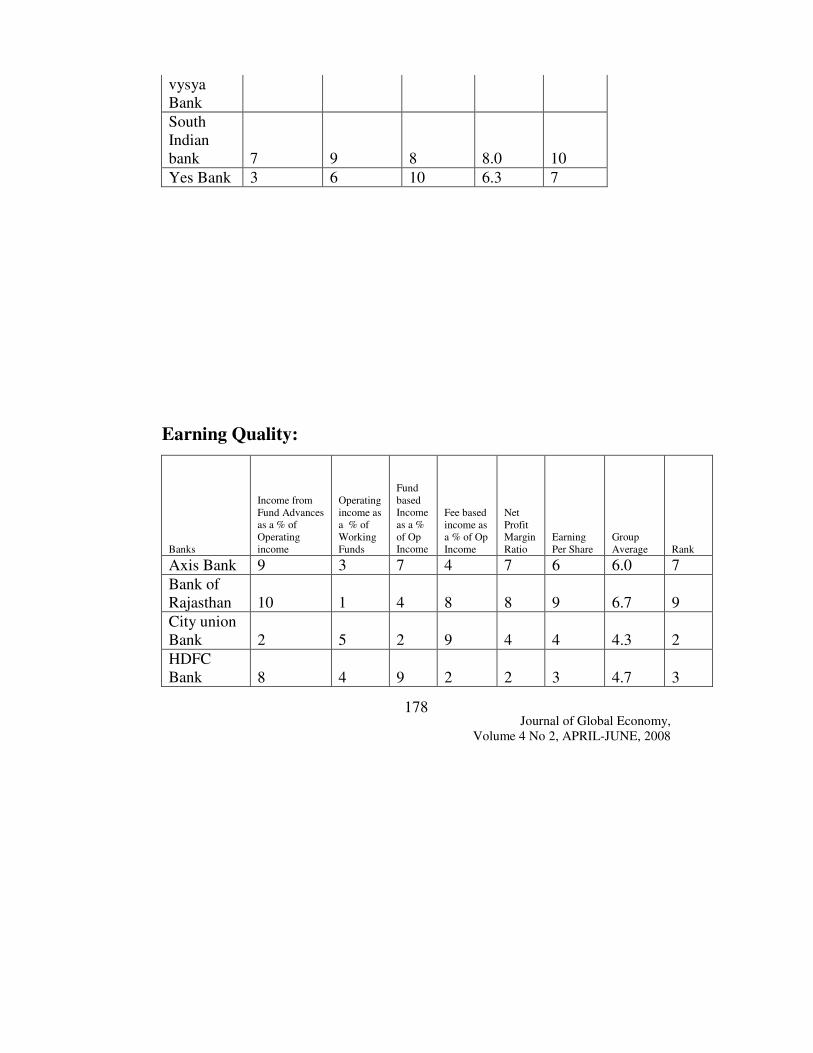
vysya
Bank
South
Indian
bank 7 9 8 8.0 10
Yes Bank 3 6 10 6.3 7
Earning Quality:
Banks
Income from
Fund Advances
as a % of
Operating
income
Operating
income as
a % of
Working
Funds
Fund
based
Income
as a %
of Op
Income
Fee based
income as
a % of Op
Income
Net
Profit
Margin
Ratio
Earning
Per Share
Group
Average Rank
Axis Bank 9 3 7 4 7 6 6.0 7
Bank of
Rajasthan 10 1 4 8 8 9 6.7 9
City union
Bank 2 5 2 9 4 4 4.3 2
HDFC
Bank 8 4 9 2 2 3 4.7 3
Journal of Global Economy,
Volume 4 No 2, APRIL-JUNE, 2008
179
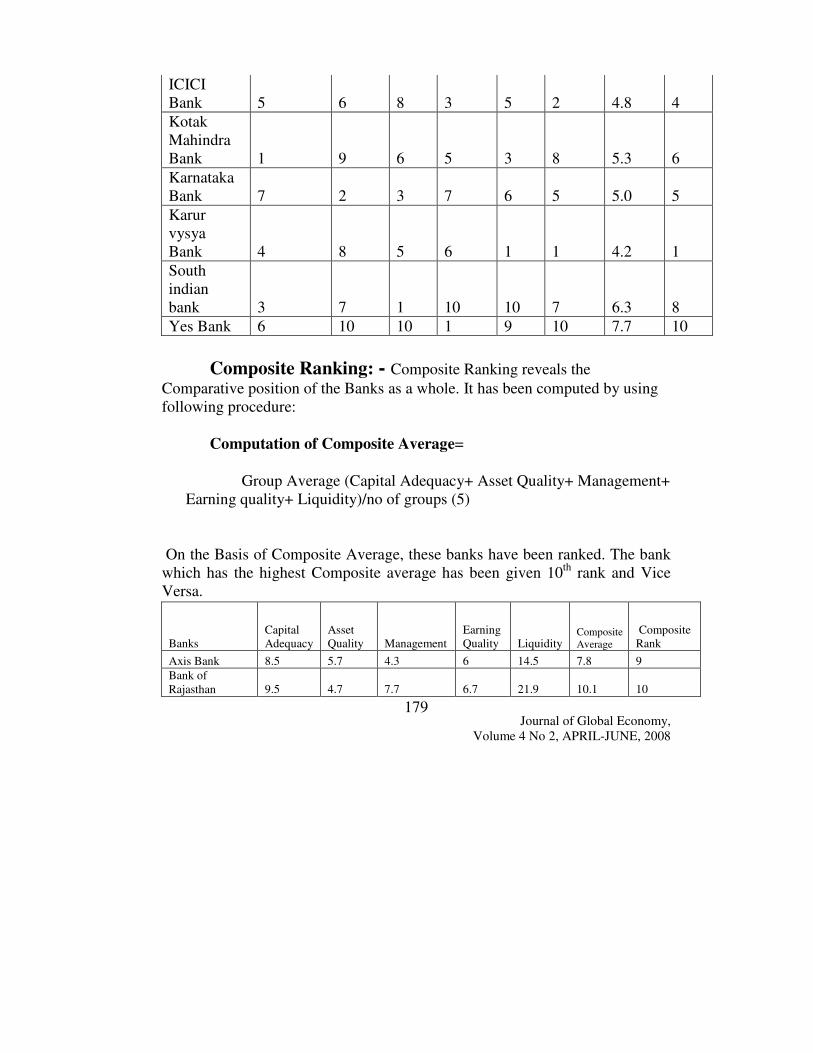
ICICI
Bank 5 6 8 3 5 2 4.8 4
Kotak
Mahindra
Bank 1 9 6 5 3 8 5.3 6
Karnataka
Bank 7 2 3 7 6 5 5.0 5
Karur
vysya
Bank 4 8 5 6 1 1 4.2 1
South
indian
bank 3 7 1 10 10 7 6.3 8
Yes Bank 6 10 10 1 9 10 7.7 10
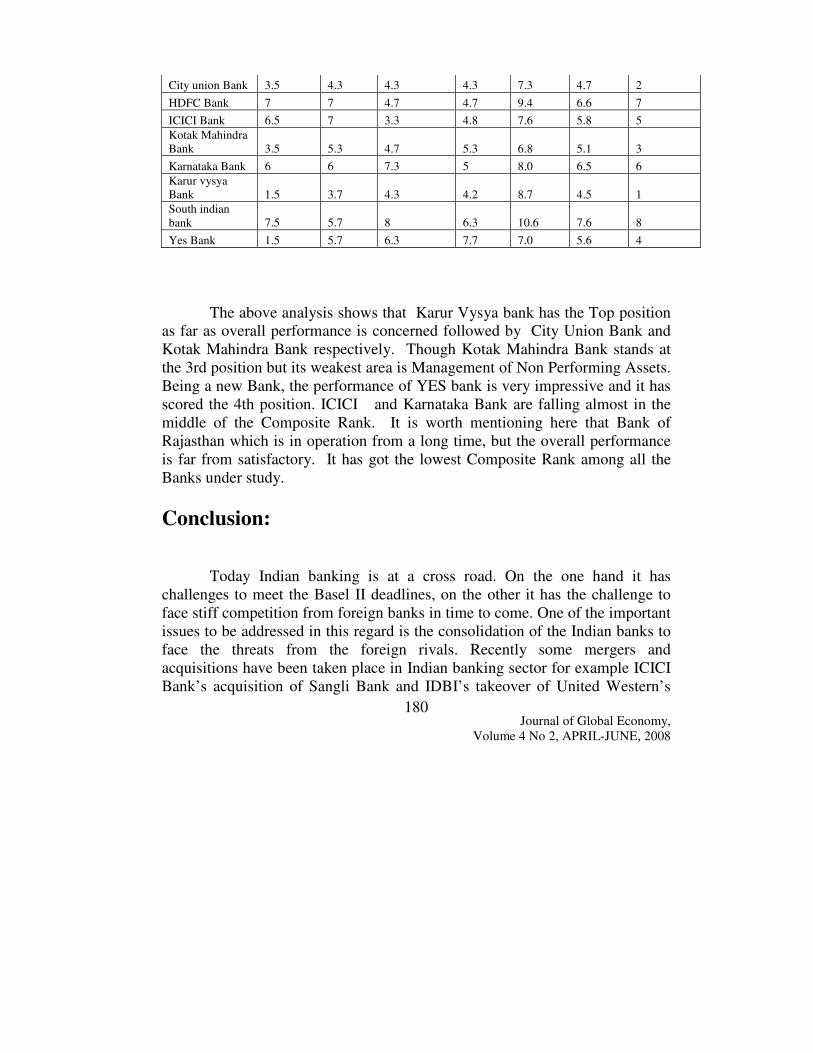
Composite Ranking: - Composite Ranking reveals the
Comparative position of the Banks as a whole. It has been computed by using
following procedure:
Computation of Composite Average=
Group Average (Capital Adequacy+ Asset Quality+ Management+
Earning quality+ Liquidity)/no of groups (5)
On the Basis of Composite Average, these banks have been ranked. The bank
which has the highest Composite average has been given 10th
rank and Vice
Versa.
Banks
Capital
Adequacy
Asset
Quality Management
Earning
Quality Liquidity Composite
Average
Composite
Rank
Axis Bank 8.5 5.7 4.3 6 14.5 7.8 9
Bank of
Rajasthan 9.5 4.7 7.7 6.7 21.9 10.1 10
Journal of Global Economy,
Volume 4 No 2, APRIL-JUNE, 2008
180
City union Bank 3.5 4.3 4.3 4.3 7.3 4.7 2
HDFC Bank 7 7 4.7 4.7 9.4 6.6 7
ICICI Bank 6.5 7 3.3 4.8 7.6 5.8 5
Kotak Mahindra
Bank 3.5 5.3 4.7 5.3 6.8 5.1 3
Karnataka Bank 6 6 7.3 5 8.0 6.5 6
Karur vysya
Bank 1.5 3.7 4.3 4.2 8.7 4.5 1
South indian
bank 7.5 5.7 8 6.3 10.6 7.6 8
Yes Bank 1.5 5.7 6.3 7.7 7.0 5.6 4
The above analysis shows that Karur Vysya bank has the Top position
as far as overall performance is concerned followed by City Union Bank and
Kotak Mahindra Bank respectively. Though Kotak Mahindra Bank stands at
the 3rd position but its weakest area is Management of Non Performing Assets.
Being a new Bank, the performance of YES bank is very impressive and it has
scored the 4th position. ICICI and Karnataka Bank are falling almost in the
middle of the Composite Rank. It is worth mentioning here that Bank of
Rajasthan which is in operation from a long time, but the overall performance
is far from satisfactory. It has got the lowest Composite Rank among all the
Banks under study.
Conclusion:
Today Indian banking is at a cross road. On the one hand it has
challenges to meet the Basel II deadlines, on the other it has the challenge to
face stiff competition from foreign banks in time to come. One of the important
issues to be addressed in this regard is the consolidation of the Indian banks to
face the threats from the foreign rivals. Recently some mergers and
acquisitions have been taken place in Indian banking sector for example ICICI
Bank’s acquisition of Sangli Bank and IDBI’s takeover of United Western’s
Journal of Global Economy,
Volume 4 No 2, APRIL-JUNE, 2008
181
Bank can be quoted here. Recently the consolidation of Ceturion Bank of
Punjab with HDFC Bank has become a debatable issue (CNBC News dated
21st Feb’2008.). Infact in most of the cases in past consolidation process has
been the result of problems related to weak capitalization and financial profile
rather than motive of gaining size and scale. To improve the financial
performance of the Banks; this issue has to be taken care of seriously. More
specifically Banks should expand their business in unbanked areas particularly
rural and remote areas. Management of Non Performing Assets and Risk
emanating from adverse events is the key to the higher profitability of the
Indian Banking. In nutshell it can be concluded that transparency and good
governance would work as principal guiding force in present scenario.
References:
Books
Agarwal B.P. “ Commercial Banking in India After Nationalization: A study of
their Policies and Progress”, Classical Publishing Company,
Anne O. Krueger and Sajjid Z. Chinoy,(ed.), “Reforming India’s External,
Financial and Fiscal Policies”, Oxford Univ. Press, New York, 2004,
Bhole L.M., “Financial Institutions and Markets Structure: Growth and
Innovation”, Tata McGraw Hill Publishing Company, New Delhi,
2005.
Desai Vasant, “Indian Banking-Nature and Problems”, Himalaya Publishing
House, Bombay, 1979,
Economic Research Division, Birla Institute of Scientific Research, “Banks
Since Nationalization”, Allied Publishers, Delhi, 1981.
Farmer Mayuri J., “An Accounting Evaluation of Performance of Indian Public
Sector Banks”, Shanti Prakashan, New Delhi, 2003,
Garg Subhash, “Emerging Issues in Financial Sector”, Arihant Publishing
House, Jaipur, 2001,
Journal of Global Economy,
Volume 4 No 2, APRIL-JUNE, 2008
182
Gupta A.K., Shroff M., “Rural Banking: An Action Research Enquiry”, Indian
Institute of management, Ahmedabad, Oxford & IBH Publishing Co.
Pvt. Ltd., New Delhi, 1990,
Hanson James A., Kathuria Sanjay, “India: A Financial Sector for the 21st
Century”, Oxford Univ. Press, New Delhi, 2002,
Jadhav Narendra, “Challenges to Indian Banking: Competition, Globalization
and financial Markets”, Union Bank of India, Macmillan India Ltd.,
New Delhi, 1996,
Mathur B.L., “Indian Banking: Performance, Problems and Challenges”,
National Publishing House, Jaipur, 1989,
Rangarajan C., “Indian Economy: Essays on Money and Finance”, UBS
Publisher’s Distributors Ltd., New Delhi, 2002,
Rangarajan C., “Innovations in Banking” Oxford and IBH Publishing Co., New
Delhi, 1982,
Reddy Y.V., “Monetary and Financial Sector Reforms in India: A Central
Banker’s Perspective”, UBS Publisher’s Distributors Ltd. New Delhi,
2002
Sharma Manoranjan, “Studies in Money, Finance and Banking”, Published by
Atlantic Publishers and Distributors, New Delhi, 2005,
Articles
Ahaluwalia M.S., “Economic Reforms in India Since 1991: Has
Gradualism Worked? The Journal of Economic Prospects, vol. 16 2002,
Ahuja Kanta, “The Banking Sector after Reforms”, the Indian Economic
Journal, April-June, 1997,
Chanda B.L., “Changing Phase of Indian Banking since 1969: Emerging
Scenario”, Pigmy Economic Review, Nov-Jan. 1994,
EPW Research Foundation, “Banking in India: A Statistical profile”,
Economic and Political Weekly, March 23, 1996,
Kurup N.P., “Banking Sector Reforms and Transparency”, Economic Political
Weekly, March 23,1996,
“Myth of non-Viability of Rural Branches”, Analyst, Economic Political
Weekly May 1, 1993,
Journal of Global Economy,
Volume 4 No 2, APRIL-JUNE, 2008
183
Rangarajan C., “Changing Phase of Banking in India”, Pigmy Economic
Review, M Journal, April-June, 1997arch, 1993,
Rangarajan C., “Competition in the Financial System: Issues and
Implications”, PNB Monthly Review, Dec. 1996,
Three Years of Economic Reforms in India: A Critical Assessment, EPW
Research Foundation, 1994,
Special Statistics-38: “Metamorphic Changes in the Financial System”, EPW
Research Foundation, Economic and Political Weekly, March 19-25,
2005,
Special Statistics-40: “Increasing Concentration of Banking Operation”, EPW
Research Foundation, Economic and Political Weekly, March 18-24,
2006,
Special Statistics-33: “Money, Banking and Finance”, EPW Research
Foundation, Economic and Political Weekly, Feb. 22-28, 2003,
Special Statistics-36: “Scheduled commercial Banks in India: A 30-Years
Data Base, EPW Research Foundation, Economic and Political Weekly,
March 20-26, 2004,
Structural Adjustment Programme: An Annotated Bibliography, Voluntary
Action Network India, New Delhi, 1997,
Magazines/Journals/Reports
Centre for Monitoring Indian Economy, Basic Statistics Related to Indian
Economy, Various Issues.
Economic and Political Weekly, Sameeksha Trust Publication, Several
Years
Economic Review, Government of India, Various issues,
Economic Survey, Government of India, Various Issues,
Handbook of Statistics on the Indian Economy, RBI, Various Issues,
RBI Bulletin, Various Issues,
Report on Currency and Finance, RBI, Mumbai, Various Issues,
Report on the Trend and Progress in Banking in India, RBI, Mumbai,
Various Issues,
Journal of Global Economy,
Volume 4 No 2, APRIL-JUNE, 2008
184
Selected Banking Indicators, (1947-1997), RBI,
Various Internet Websites.
Special Address by Smt. Shyamala Gopinath, Deputy Governor at the FICCI-
IBA Conference on "Global Banking: Paradigm Shift", September 27,
2006, Mumbai.
Credit Risk Modeling: The Federal Reserve Bank of Philadelphia's
Perspective" Anthony M. Santomero, President, Federal Reserve Bank
of Philadelphia
. Reforming India’s Financial Sector: Changing Dimensions and Emerging
Issues (by Dr. Y.V. Reddy, Governor, RBI at the
International Centre for Monetary and Banking Studies, Geneva on
May 9, 2006)
Related Documents