Josep Francesc Abril Ferrando Comparative Analysis of Eukaryotic Gene Sequence Features Anàlisi Comparativa d’Elements de Seqüència dels Gens Eucariotes PhD Thesis Barcelona, May 2005

Welcome message from author
This document is posted to help you gain knowledge. Please leave a comment to let me know what you think about it! Share it to your friends and learn new things together.
Transcript

Josep Francesc Abril Ferrando
Comparative Analysisof Eukaryotic
Gene Sequence FeaturesAnàlisi Comparativa d’Elements de Seqüència dels Gens Eucariotes
PhD ThesisBarcelona, May 2005

Dipòsit legal: B.47269-2005 ISBN: 978-84-691-1209-0

Comparative Analysisof Eukaryotic
Gene Sequence Features
Anàlisi Comparativa d’Elements de Seqüència dels Gens Eucariotes
Josep Francesc Abril FerrandoPhD Thesis
Barcelona, May 2005

CopyLeft 2005 by Josep Francesc Abril Ferrando.
First Edition, April 2005.
Printed at:
COPISTERIA MIRACLERector Ubach, 6–10 (Aribau corner)08021 — BarcelonaPhone: +034 93 200 85 44Fax: +034 93 209 17 82Email: miracle at miraclepro.com
Cover Figure:
An artistic representation of how Bioinformatics helped to decode the human ge-nome. Metaphasic chromosomes are lying on top of a changing backgroundwhere the DNA nucleic acids—A, C, G, and T, the language of life—, are con-verted into a binary code—0’s and 1’s, the language of computers—. A montageby J.F. Abril made with the Gimp (http://www.gimp.org/).

Comparative Analysisof Eukaryotic
Gene Sequence Features
Anàlisi Comparativa d’Elements de Seqüència dels Gens Eucariotes
Josep Francesc Abril FerrandoMemòria presentada per optar al grau de Doctor
en Biologia per la Universitat Pompeu Fabra.
Aquesta Tesi Doctoral ha estat realitzada sota la direcció delDr. Roderic Guigó i Serra al Departament de Ciències Experimentals
i de la Salut de la Universitat Pompeu Fabra.
Roderic Guigó i Serra Josep Francesc Abril Ferrando
Barcelona, May 2005

The research in this thesis has been carried out at the Genome BioInformatics Lab(GBIL) within the Grup de Recerca en Informàtica Biomèdica (GRIB) at the Parc de Re-cerca Biomèdica de Barcelona (PRBB), a consortium of the Institut Municipal d’InvestigacióMèdica (IMIM), the Universitat Pompeu Fabra (UPF) and the Centre de RegulacióGenòmica (CRG).
The research carried out in this thesis has been supported by predoctoral fellowshipsfrom Instituto de Salut Carlos III (Beca de Formación de personal Investigador, BEFI, 1999-2003) and from Fundació IMIM (2003-2004) to J. F. Abril, and grants from Ministerio deCiencia y Tecnología to R. Guigó.

To my wife Marta,for her ever lasting patiencewith me and computers...
To my daughter Ruth,for taking all those dark cloudsaway with her smiles...


Preface
During the last century biologists have been accumulating an overwhelming amount ofinformation, but it has been during the last decade when we have experienced an explosionof data acquisition. At all levels, living beings have become more and more complex thanthe reductionists would ever have expected. Never before it was possible to assert, asnowadays, that life is not only the sum of the constituent molecules, acting as the gears ofa clock, but also the raising network of interactions between them. Biology, starting as adescriptive subject, has evolved into an information-driven subject, taking biologists fromthe wet lab to the computer screens. Currently, quoting Lincoln Stein from his foreword toTisdall [2003], “if you can’t do Bioinformatics, you can’t do Biology”.
We, as humans, are prone to define sets, clustering elements with similar features intogroups, to face the complexity. Within this landscape, a bunch of “omics” terms have beencoined. We will focus on the analysis of genomic sequences, more precisely, the computa-tional approach to genome annotation. As it has been pointed by Stein [2001]: annotationis bridging the gap from sequence to the biology of the organism. All the steps requiredto improve the understanding of biological processes can be grouped into three categoriesto answer three complementary questions: where we can find the relevant informationencoded in the sequence (the gene-level annotation); what roles the products of the geneexpression play (the function-level annotation); and, how the genes and their products areintegrated into a network of interactions (the process-level annotation).
In the late eighties, obtaining the genome sequence of a single eukaryotic organism, thehuman genome of course, was seen as a giant enterprise, that could only be tackled by aninternational consortium of research centers in a coordinated long term project. Althoughinitially scheduled over fifteen years, as sequencing technology improved, faraway dead-lines became closer, specially because of process automation. But it was the introductionof shotgun methodology what really spurred the production of huge eukaryotic genomes.The method heavily relies on the computational assembly of a myriad of sequenced frag-ments. It was first applied to produce bacterial genomes after which the team at CeleraGenomics demonstrated its scalability to larger genomes by obtaining, in about a year, thegenome sequence of Drosophila melanogaster [Adams et al., 2000]. The competition betweenCelera and the Public Consortium yielded early results with the publication of the first draftversion of the human genome in 2001 [Venter et al., 2001; Lander et al., 2001]. Nowadays,several large eukaryotic genome projects are undergoing, with a rate of one per year beingpublished. The future will bring better sequences for more individuals and in less time.Examples of current developments for those forthcoming technologies were described byKling [2003].
vii

viii PREFACE
On the other hand, computational power has increased along with the availability ofnovel algorithms to analyze data. Traditional hypothesis testing is being more than com-plemented with the acquisition of large-scale data sets to which pattern recognition anddata mining techniques are applied. The patterns arising from such analyses suggest novelhypotheses to test, while hypotheses can be tested directly using databases. Another mile-stone that must be taken into account is the development of the internet technologies dur-ing the last decade. The widespread use of the web to share data, software to analyze itand knowledge, has caused a revolution in science, among other subjects of our lives. Ithas also changed the way collaborative projects among groups all around the world cantackle larger and deeper analyses.
I have been part of this incessant flow of knowledge, of this never-ending endeavour,in which the analysis of genomes has become a key element. Writing this dissertation waslike a stop in the road. Not only a break to rest, but also a time to think over, in order togain an insight of what has been done, what is going on around and what can be done inthe near future, before jumping again into the fast rivers of Genomics. In other words, Ihave tried to summarize my contribution to this field, grouping topics by their relationshiprather than chronologically.
It is amazing how the availability of each new species genome can enhance ourknowledge, not only of our own species, but also of life on Earth. I hope this grain of sandfrom the shores of Genomics will satisfy your scientific interest.
Josep Francesc Abril FerrandoBarcelona, May 2005

Contents
Preface vii
Contents xi
List of Tables xiii
List of Figures xvi
Acknowledgements xvii
Abstract xxiii
Resum xxv
Resumen xxvii
1 Introduction 11.1 Finding Genes in the Genomes . . . . . . . . . . . . . . . . . . . . . . . . . . 31.2 Eukaryotic Gene Structure . . . . . . . . . . . . . . . . . . . . . . . . . . . . . 41.3 Visualizing Genomic Features . . . . . . . . . . . . . . . . . . . . . . . . . . . 51.4 About This Thesis . . . . . . . . . . . . . . . . . . . . . . . . . . . . . . . . . . 7
2 Objectives 9
3 Comparative Gene Finding 113.1 Computational Gene Prediction . . . . . . . . . . . . . . . . . . . . . . . . . . 11
3.1.1 “Ab initio” developments . . . . . . . . . . . . . . . . . . . . . . . . . 123.1.2 Homology based gene-finding . . . . . . . . . . . . . . . . . . . . . . 133.1.3 Comparative genomics approach . . . . . . . . . . . . . . . . . . . . . 143.1.4 Analysis pipelines to automatize sequence annotation . . . . . . . . 16
3.2 SGP2: Syntenic Gene Prediction Tool . . . . . . . . . . . . . . . . . . . . . . . 183.2.1 Parra et al, Genome Research, 13(1):108–117, 2003 . . . . . . . . . . . . 203.2.2 IMGSC, Nature, 420(6915):520–562, 2002 . . . . . . . . . . . . . . . . . 31
3.3 Validation of Results from Gene Predictors . . . . . . . . . . . . . . . . . . . 51
ix

x CONTENTS
3.3.1 Measures of gene prediction accuracy . . . . . . . . . . . . . . . . . . 513.3.2 Evaluating computational gene-finding results . . . . . . . . . . . . . 523.3.3 Guigó et al, Genome Research, 10(10):1631–1642, 2000 . . . . . . . . . . 543.3.4 Reese et al, Genome Research, 10(4):483–501, 2000 . . . . . . . . . . . . 673.3.5 Guigó et al, Proc Nat Acad Sci,100(3):1140–1145, 2003 . . . . . . . . . . 88
4 Sequence features of Eukaryotic Genes 974.1 The Molecular Basis of Splicing . . . . . . . . . . . . . . . . . . . . . . . . . . 97
4.1.1 U2 versus U12 splice sites . . . . . . . . . . . . . . . . . . . . . . . . . 984.1.2 The splicing process . . . . . . . . . . . . . . . . . . . . . . . . . . . . 1004.1.3 Integrating splicing in the protein synthesis pathway . . . . . . . . . 1034.1.4 The conservation of exonic structure . . . . . . . . . . . . . . . . . . . 107
4.2 The Comparative Analysis of Mammalian Gene Structures . . . . . . . . . . 1094.2.1 Intron length and repeats . . . . . . . . . . . . . . . . . . . . . . . . . 1094.2.2 Sequence conservation at orthologous splice sites . . . . . . . . . . . 1114.2.3 RGSPC, Nature, 428(6982):493–521, 2004 . . . . . . . . . . . . . . . . . 113
4.3 The Comparative Analysis of Splice Sites in Vertebrates . . . . . . . . . . . . 1264.3.1 Conservation of mammals and chicken orthologous splice sites . . . 1264.3.2 Abril et al, Genome Research, 15(1):111–119, 2005 . . . . . . . . . . . . 1284.3.3 ICGSC, Nature, 432(7018):695–716, 2004 . . . . . . . . . . . . . . . . . 138
5 Visualization Tools 1495.1 A Review of Visualization Tools for Genomic Data . . . . . . . . . . . . . . . 149
5.1.1 Database browsers . . . . . . . . . . . . . . . . . . . . . . . . . . . . . 1505.1.2 Annotation workbenches . . . . . . . . . . . . . . . . . . . . . . . . . 1525.1.3 Tools for visualizing alignments . . . . . . . . . . . . . . . . . . . . . 1525.1.4 Tools for visualizing annotations . . . . . . . . . . . . . . . . . . . . . 155
5.2 gff2ps: Visualizing Genomic Features . . . . . . . . . . . . . . . . . . . . . 1565.2.1 Abril and Guigó, Bioinformatics, 16(8):743–744, 2000 . . . . . . . . . . 1585.2.2 Adams et al, Science, 287(5461):2185–2195, 2000 . . . . . . . . . . . . . 1615.2.3 Venter et al, Science, 291(5507):1304–1351, 2001 . . . . . . . . . . . . . 1655.2.4 Holt et al, Science, 298(5591):129–149, 2002 . . . . . . . . . . . . . . . . 169
5.3 Software Developed for Comparative Analyses . . . . . . . . . . . . . . . . . 1735.3.1 gff2aplot: visualizing pairwise homology . . . . . . . . . . . . . . 1735.3.2 Abril et al, Bioinformatics, 19(18):2477–2479, 2003 . . . . . . . . . . . . 1735.3.3 compi: Comparative pictograms . . . . . . . . . . . . . . . . . . . . . 1775.3.4 Other developments . . . . . . . . . . . . . . . . . . . . . . . . . . . . 179
6 Discussion 181
7 Conclusions 187

CONTENTS xi
Appendices
A Curriculum Vitae 191
B List of Publications 193
C Contact Information 197
D Miscellanea 199
E Abbreviations 203
F Glossary 207
G WebSite References 213
H Bibliography 217
I Index 239


List of Tables
3.1 Accuracy of gene-finding programs on human chromosome 22 . . . . . . . 273.2 Accuracy of gene prediction tools in a set of single gene sequences . . . . . 563.3 Accuracy of gene prediction tools in a set of semiartificial genomic sequences 593.4 Evaluation of gene finding systems on GASP . . . . . . . . . . . . . . . . . . 793.5 Predicted human/mouse gene sets and RT-PCR verification rates . . . . . . 92
4.1 Intron length and proportion of repetitive DNA in mammalian introns . . . 1104.2 Human/mouse/rat/chicken data sets and filtered orthologs . . . . . . . . . 1314.3 U2 and U12 intron class and subclass frequencies in mammals . . . . . . . . 1324.4 Observed cases of U2 subtype switching within mammals . . . . . . . . . . 132
E.1 Extended DNA / RNA alphabet . . . . . . . . . . . . . . . . . . . . . . . . . 205E.2 The standard genetic code . . . . . . . . . . . . . . . . . . . . . . . . . . . . . 206
xiii


List of Figures
1.1 The processing of RNA in the cell . . . . . . . . . . . . . . . . . . . . . . . . . 21.2 Common pitfalls among gene-finding approaches . . . . . . . . . . . . . . . 31.3 Consensus sequences of U2 and U12 splicing signals . . . . . . . . . . . . . 41.4 Browsing through genome annotations . . . . . . . . . . . . . . . . . . . . . 6
3.1 Overall flowchart of geneid . . . . . . . . . . . . . . . . . . . . . . . . . . . 143.2 SGP2-based analysis pipeline for pair-wise genome comparisons . . . . . . 183.3 Human-mouse pairwise comparison of an orthologous genomic sequence . 223.4 Rescoring of the geneid predicted exons in SGP2 . . . . . . . . . . . . . . . 243.5 Accuracy boxplots of the human and mouse SGP2and genscan predictions 283.6 A new homologue of dystrophin from human-mouse comparative analyses 393.7 Drosophila Genome Annotation Assessment Project . . . . . . . . . . . . . . 873.8 Examples of predicted gene structures with introns verified by RT-PCR . . . 913.9 Verification of gene predictions by RT-PCR . . . . . . . . . . . . . . . . . . . 913.10 A web server to display RT-PCR results over predicted genes . . . . . . . . . 95
4.1 The splicing reaction at the biochemical level . . . . . . . . . . . . . . . . . . 984.2 Predicted secondary structures of the human spliceosomal snRNAs . . . . . 994.3 Pathways of assembly and catalysis of U2 and U12 spliceosomes . . . . . . 1014.4 Working model of RNA and Prp8 interactions . . . . . . . . . . . . . . . . . 1024.5 The mRNA factory model . . . . . . . . . . . . . . . . . . . . . . . . . . . . . 1044.6 Exon definition model in vertebrates . . . . . . . . . . . . . . . . . . . . . . . 1064.7 Conservation of gene structure between human and mouse . . . . . . . . . . 1074.8 Human/mouse/rat scatterplots for orthologous GT-AG intron lengths . . . 1094.9 Human/mouse/rat sequence conservation at orthologous GT-AG ss . . . . 1124.10 Human/mouse/rat/chicken relative conservation over splice site consensi 1264.11 Human, mouse, rat and chicken orthologous U12 intron sets . . . . . . . . . 1274.12 Pictograms for U2 and U12 splice sites . . . . . . . . . . . . . . . . . . . . . . 1304.13 Comparative pictograms for donor and acceptor splice sites . . . . . . . . . 1344.14 Sequence conservation level of orthologous GT-AG splice sites . . . . . . . 135
5.1 Human GBF1 loci genomic region and its counterpart in mouse . . . . . . . 151
xv

xvi LIST OF FIGURES
5.2 A comparison of PiP-plots versus Smooth-plots . . . . . . . . . . . . . . . . 1535.3 Flow chart of internal main processes for gff2ps and gff2aplot . . . . . 1565.4 Examples of gff2ps output . . . . . . . . . . . . . . . . . . . . . . . . . . . . 1605.5 Coding Content of the Drosophila Genome . . . . . . . . . . . . . . . . . . . . 1645.6 Annotation of the Celera Human Genome Assembly . . . . . . . . . . . . . . 1685.7 Annotation of the Anopheles gambiae Genome Sequence . . . . . . . . . . . . 1725.8 Examples of gff2aplot output . . . . . . . . . . . . . . . . . . . . . . . . . 1755.9 Examples of comparative pictograms . . . . . . . . . . . . . . . . . . . . . . . 1775.10 Merging exonic structure with coding sequence alignments . . . . . . . . . . 179
6.1 Human gene number estimates in the genome era . . . . . . . . . . . . . . . 182

Acknowledgements
Gratitude is born in hearts that take time to count uppast mercies.
—Charles E. Jefferson
I am grateful to my wife Marta for her constant support to continue the unpredictableendeavour that scientific research is. Since we met, she has been helping me more thanshe probably will imagine. I hope she will ever forgive me for my dedication to work andcomputers if I ever failed to give her attention. To her not only my deepest love but alsomy most grateful acknowledgements. Thank you for bringing into this world the cutestand most precious little girl I have ever met, my daughter Ruth. She also helped her fatherin her own way, just by being herself, making me happy, raising my spirit and, of course,encouraging me to keep going on those days you feel truly blue or stressed-out. Manythanks to my parents, for encouraging me to study when I was young, for sharing in thedistance all our achievements, for their enthusiasm. Thanks also to my parents-in-law forall their support, for adopting me as a son, for the relaxing family Sunday dinners.
After several years working at a research institute it is not difficult to have met lots ofinteresting people, many of them really impressive. Therefore, I must first apologize foranybody who will think he or she has been left out. Those who know me, are alreadyaware that it is easier for me to remember a face than a name. So that, I have tried to makeup my mind and walk along my memories. I have to mention the long list of friends madein the Research Group in Biomedical Informatics (RGBI, or GRIB in Catalan). Not only forencouraging and helpful discussions; for the funny chitchats at coffee breaks; for sharingknowledge, code, data, and sometimes efforts too; for enjoying my jokes—although I haveto admit that those were quite often uncomprehensible to the point that they were sufferingrather than enjoying them—; for all the parties—and my apologies for attending less ofthem that I wanted to, thanks for understanding that I am a family man—.
I will begin with the old timers, they were already in the Research Group in BiomedicalInformatics, when I started. They introduced me to *nix, to networks, to free software, toBioinformatics. They also showed me what scientific research looks like. Juanjo Lozano,Moisès Burset and Jordi Rodrigo, I have to admit that it was a pleasure to meet you three,the most hilarious triplet I have ever seen. When I began, Roderic’s team was only him andMoisès, and few undergraduate students—me, Jesus Feliu and David Alarcón—. I alreadymet Jesus and David at the School of Biological Sciences of Universitat de Barcelona. Wewere part of a gang of computer maniacs that were regularly meeting to share tips andtricks, journals and programs. From the triplet, I was the only one who kept up doing
xvii
xviii ACKNOWLEDGEMENTS
research; so that it was a pleasing surprise when David Alarcón joined Baldo Oliva’s grouprecently. Specially thanks to Juanjo and Moisès for struggling to install Linux in a machinedespite the mistrust and arguments against such a system from the informatics supportteam of the center at that time.
I would like to thank Genís Parra, Sergi Castellano, Enrique Blanco, Charles Chapple,Nicolás Bellora, Francisco Câmara, Juan Antonio de los Cobos, Hugo Gutiérrez de Terán,Josep Pareja, Montserrat Barbany, Cristina Dezi, Fabien Fontaine, Elisabeth Gregori, RamónAragüés, Julio Bonis, Joan Planas, Adrián López, Alfons Nonell, Ruth Garriga, JorgeNaranjo, Lulla Opatowski, Cristina Herraiz, Pilar Noguerón, Claudio Silveira and NuriaBoada. Many, many thanks to Robert Castelo, Jan-Jaap Wesselink, Mar Albà, EduardoEyras, Jordi Villà, Baldomero Oliva, Nuria Centeno, Manolo Pastor, Jordi Mestres. Fur-ther thanks to Miguel Pignatelli, Alberto Roverato, Juan Valcárcel, Lluis Armengol, MónicaBayés, Xavier Estivill, Marta Soldevila, Aida Andrés, Jordi Clarimón, Jaume Bertranpetit,Viviana Belalcázar and Marta Tomàs. I do not also forget those who visited us, NouraDabbouseh, Marcos Rodrígues, Rachid Kara, Vanessa Adaui, David González, Juan CarlosSánchez and Diego Miranda.
Of course, I have a special mention to our system administrators, Alfons González,Xavier Fustero and Òscar González. Not only because of friendship, but also because ourwork depends in great manner on their task and they are always patient with our endlessrequirements. Thanks for their helpful hints for solving this or that installation problem,sometimes related to my computer at home.
My deepest gratitude to those people from our group who helped me to review andproof-read this document. I would like here to point out and acknowledge the timespent, the comments, the corrections and suggestions made by Jan-Jaap Wesselink, EnriqueBlanco, Charles Chapple, Òscar González and my wife, Marta, to this dissertation. Thanksagain to Jan-Jaap for his commitment and his exhaustive proof-reading of this work. Fur-ther thanks to Robert Castelo for providing us the LATEX files from his PhD thesis and forintroducing us to PDFlatex. His templates were extended by Sergi Castellano and GenísParra for their theses. The templates on which this document was built upon were derivedfrom them.
To the secretaries that have been working for the group or for the IMIM along the timeI have been there. Esther Román, Maite Cebrián, Yolanda Losada, Raquel Furió, EstherCallizo, Mireia Gusi, Nathalie Villahoz, and the veteran, Mercedes Fuertes. Thanks fortheir affection, for the chit-chats about our families, specially about our kids. To Eva Moleroand Carlos Díaz. Further thanks to Alba Valls, Cristina García and Teresa Duran for theirassistance in all the issues related with the PhD courses and, of course, the proceedings tosubmit and defend this thesis.
Thanks to the users of our software, especially those contributing with bug reportsand/or patches to fix them, that interaction made those tools more useful. We appreciatetheir patience when the responsibilities of our own research took precedence over improv-ing and maintaining the software. To those people who motivated and encouraged us todevelop gff2ps, specially to Elena Casacuberta and Ampar Monfort. To Martin Reese,Sussana Lewis and Michael Ashburner, for allowing us to contribute to the GASP tutorialat ISMB99 meeting. The three-panel poster summarizing the results of the gene-predictionassessment were the first big dataset in which we tested gff2ps. Further thanks to ThomasWiehe for initial suggestions for developing gff2aplot and latter involvement in its im-

ACKNOWLEDGEMENTS xix
plementation; to Steffi Gebauer-Jung for providing parsers for alignment tools other thanBLAST. To those people who motivated and encouraged us to continue improving it, spe-cially to Matthias Plattzer; to those who gave valuable comments regarding this tool, asWeb Miller.
I would like to thank Jim Fickett, for inviting Roderic and me, to SmithKline-Beecham(now Glaxo-Smithkline) research center in Philadelphia. It was my first trip to the States.There we met Pankaj Agarwal and I was able to see how a big pharmaceutical companylooks like. To the people at Institut für Molekulare Biotechnologie (IMB), Jena; speciallythanks to Matthias Plattzer, Gernot Glöckner, Karol Szafranski, Rüdiger Lehmann and Cor-nelia Baumgart. I wish to thank Thomas Wiehe and Steffi Gebauer-Jung for their friendli-ness and all the warm scientific collaborations with them, also for their hospitality whenvisiting them in Germany.
To the people at Celera Genomics at Rockville, Maryland, who got in contact with usto collaborate with the visualization of the fruit fly, the human and the mosquito genomes.Those collaborations allowed us to jump into the genomics field, moving from single genesequences to work with whole genomes, from individual work to big collaborative effortsto solve one of the most complex problems to date. On the personal side, the warm wel-come and all their attention, the opportunity to become part of such team of great minds,will be always in my heart. Thanks to Jennifer R. Wortman, Mark D. Adams, Patrick Dunn,Mark Yandell, William Majoros, Richard J. Mural, Robert A. Holt, George L. Gabor Mik-los, Catherine Nelson, Gangadharan Subramanian (Mani), and J. Craig Venter. Thanks alsoto the Drosophila melanogaster jamboree people, specially to Gerald M. Rubin and Nomi L.Harris.
To the people at the international consortia for the sequencing and analysis of themouse, rat and chicken genomes. For sharing preliminary data and knowledge, for thewillingness in solving problems, for the endless conference calls, and so on. The list of peo-ple involved in such large projects is too big, but few people stand out by their exceptionalorganizational effort, such as Kim Worley, Victoria Hagigi and Ladeana Hillier. To EwanBirney and Jim Kent, for ENSEMBL and GOLDEN PATH respectively, for replying to a mailas soon as it was sent, and for “wise” and funny discussions too. Further thanks to WebMiller, Peer Bork, Ivica Letunic, Chris Pontig, Donna Karolchik, Adam Siepel, David Haus-sler, Robert Baertsch, Ian Korf, Michael R. Brent, Chris Burge, Lior Pachter, Arian Smith,Emmanouil T. Dermitzakis, Alexandre Reymond, and Stylianos Antonarakis among oth-ers.
The publication of the first draft of the human genome had a tremendous impact onthe media. We already had a small contact with journalists because of our participation inthe fruit fly genome, reported just one year before. For the human genome that was notthe case. Despite our small contribution, our group was the only Spanish partner directlyinvolved in this huge project—unfortunately, boosting science in Spain was not one of thegovernment priorities for a long time—. We were overwhelmed by interviews for news-papers and for radio and television programs. Elvira López and Maite Cebrián helpedus to cope with them and to organize the appointments agenda for those “mad” weeks.This was when we met Marc Permanyer, from the Press department of Universitat Pom-peu Fabra. The experience served, at least, to get more organized in advance, preparingpress releases and concentrating interviews into press conferences. Thanks again to ElviraLópez, Marta Calsina and Marc Permanyer for organizing the press for the mouse, rat andchicken genomes. Further thanks to our group secretaries, for buffering all the incoming

xx ACKNOWLEDGEMENTS
visits and telephone calls. Having cameras, photographers and journalists interfered withthe work of many other members of our lab. Their patience and sense of humor must beacknowledged too. I would like to stress from this lines the contribution to the divulga-tion of scientific discovery in general, of our contributions in particular, made by manyjournalists. Among them, I would like to acknowledge Josep Corbella (“La Vanguardia”),Joaquim Elcacho (“Diari Avui”), Xavier Pujol Gebellí (“El Pais”), Antonio Madridejos (“ElPeriodico”) and Javier López Rejas (“El Mundo”).
To those great speakers that demonstrate their love for what they are doing, RodericGuigó, Alfonso Valencia, Antonio Marín, Modesto Orozco and so on. . . I specially recall,not without fear but also with laughter, the de-construction of Bioinformatics lecture byAlfonso Valencia. On the other hand, I wish to thank all those who invited me to givetalks about our work. To the Departmento de Biología y Geología of the Instituto de En-señanza Secundaria Sanje at Alcantarilla, Murcia, for their warm welcome and for the in-terest demonstrated by students and teachers; specially thanks to Eva Palacios and ÁngelMartínez. To Lola Andrade at the public library of Masnou, Barcelona, and the town coun-cil of Sant Carles de la Ràpita, Tarragona, particularly to Elvira Franquet i Tudó, MiguelAlonso Herrera and Josep Pere Geira, for inviting me to talk about the human genome too.I wish to thank also the organization committee of the meeting of the Sociedad Españolade Genética, specially to José L. Oliver, for inviting me to present our research in their an-nual meeting held in El Escorial in 2003. I would like to thank the people of Fundació “LaCaixa” for inviting us to organize the workshops on “Computational Analysis of DNA Se-quences”, held in Barcelona and Madrid; specially to Sílvia Maldonado, Sílvia Godó andGloria Trías. Further thanks to Residència d’Investigadors for inviting us to the great pre-mière of Verbum (“Genoma in musica”), a piece for piano composed by Joan Guinjoan.
I also have many things to be thankful for to Ferran Sanz; for starting up the ResearchGroup in Biomedical Informatics, which we have been part of; for his constant search ofthe excellence in science; for his wisdom and willingness to help, not only at scientific andacademic levels; for his capacity to take new projects; for the Viladrau group retreats.
I am grateful to my PhD advisor, Roderic Guigó, for pushing us far beyond and atthe same time for his patience when any analysis took longer than expected—and for hisfamous sentence, “that would take just five minutes, wouldn’t it?”—; for his insights in thefield and his dedication to science—I agree that science is not just a job but a way of life,although one needs to make a living too—; for introducing me to gawk, P OSTSCRIPT andLATEX. For his efforts to get funds for the research, as we all know how much it takes to fill inall the bureaucracy related to a project—and how this interferes with the “field” work. Forintroducing us to outstanding people in the field. For his deadline last minute questions.For a scholarship in 1998/1999, that permitted to devote myself full-time to research. Fora scholarship in 2003/2004, mainly because that allowed me to finalize my PhD thesis andwrite this dissertation.
I acknowledge the support from the Instituto de Salud Carlos III (ISCIII) for the Becade Formación de personal Investigador (BEFI, a PhD studentship) for the 1999/2003 fouryears period. Thanks to the ISMB’99 organizing committee for a travel scholarship to at-tend to the 1999 meeting held in Heidelberg (Germany). To a joint grant from the GermanAcademic Exchange Service (DAAD) to Thomas Wiehe and the Ministerio de Educación yCiencia (Spain) to Roderic Guigó, which made possible, among other things, our scientificstays in the Institut für Molekulare Biotechnologie (IMB) at Jena (Germany). I would alsomention all the people that, from the Federación de Jóvenes Investigadores and the Precar-

ACKNOWLEDGEMENTS xxi
ios association, are trying to improve the labor situation of research scholarships. Thanksto their efforts current and future generations of PhD students will have hopefully betterwork conditions than us. Special thanks to Sergi Castellano for getting so involved withPrecarios and getting us up to date with their activities and achievements.
Finally, I would like to thank Linus Torwalds (for developing the Linux kernel), theGNU Free-Software Foundation (for bash, gawk, make and a myriad of other useful *NIXtools, but also for the advocacy of free software), Larry Wall et al (for the perl program-ming language, its dynamic community and the useful modules from CPAN), Richard M.Stallman et al (for the arguably best programming text editor, emacs, and my apologies tovi advocators), Norman Ramsey (for the noweb literate programming tool), Donald Knuthand Lesslie Lamport (for the TEX and LATEX typesetting systems, respectively—and thanksto all the developers of a whole bunch of useful packages, such as PStricks, PDFLaTeX,natbib, makeidx, hyperref, and so on—), Sergie Brin and Larry Page (for devising thepage rank technology behind Google). To the efforts of all the people that have demon-strated that sharing will hopefully provide a better future. All the advances of humankindare the result of the accumulation of knowledge. All their contributions provided us withthe tools with which we have performed our analyses and developed our software.
To all of you, many, many thanks from the heart. . .


Abstract
The constantly increasing amount of available genome sequences, along with an increasingnumber of experimental techniques, will help to produce the complete catalog of cellularfunctions for different organisms, including humans. Such a catalog will define the basefrom which we will better understand how organisms work at the molecular level. At thesame time it will shed light on which changes are associated with disease. Therefore, theraw sequence from genome sequencing projects is worthless without the complete analysisand further annotation of the genomic features that define those functions. This disser-tation presents our contribution to three related aspects of gene annotation on eukaryoticgenomes.
First, a comparison at sequence level of human and mouse genomes was performed bydeveloping a semi-automatic analysis pipeline. The SGP2gene-finding tool was developedfrom procedures used in this pipeline. The concept behind SGP2is that similarity regionsobtained by TBLASTXare used to increase the score of exons predicted by geneid, in orderto produce a more accurate set of gene structures. SGP2provides a specificity that is highenough for its predictions to be experimentally verified by RT-PCR. The RT-PCR validationof predicted splice junctions also serves as example of how combined computational andexperimental approaches will yield the best results.
Then, we performed a descriptive analysis at sequence level of the splice site signalsfrom a reliable set of orthologous genes for human, mouse, rat and chicken. We haveexplored the differences at nucleotide sequence level between U2 and U12 for the set oforthologous introns derived from those genes. We found that orthologous splice signalsbetween human and rodents and within rodents are more conserved than unrelated splicesites. However, additional conservation can be explained mostly by background intronconservation. Additional conservation over background is detectable in orthologous mam-malian and chicken splice sites. Our results also indicate that the U2 and U12 intron classeshave evolved independently since the split of mammals and birds. We found neither con-vincing case of interconversion between these two classes in our sets of orthologous introns,nor any single case of switching between AT-AC and GT-AG subtypes within U12 introns.In contrast, switching between GT-AG and GC-AG U2 subtypes does not appear to beunusual.
Finally, we implemented visualization tools to integrate annotation features for gene-finding and comparative analyses. One of those tools, gff2ps, was used to draw thewhole genome maps for human, fruitfly and mosquito. gff2aplot and the accompanyingparsers facilitate the task of integrating sequence annotations with the output of homology-based tools, like BLAST. We have also adapted the concept of pictograms to the comparativeanalysis of orthologous splice sites, by developing compi.
xxiii


Resum
L’incessant augment del nombre de seqüències genòmiques, juntament amb l’increment del nombrede tècniques experimentals de les que es disposa, permetrà obtenir el catàleg complet de les funcionscel.lulars de diferents organismes, incloent-hi la nostra espècie. Aquest catàleg definirà els fonamentssobre els que es podrà entendre millor com els organismes funcionen a nivell molecular. Al mateixtemps es tindran més pistes sobre els canvis que estan associats amb les malalties. Per tant, la se-qüència en brut, tal i com s’obté dels projectes de seqüenciació de genomes, no té cap valor sense lesanàlisis i la subsegüent anotació de les característiques que defineixen aquestes funcions. Aquestatesi presenta la nostra contribució en tres aspectes relacionats de l’anotació dels gens en genomeseucariotes.
Primer, la comparació a nivell de seqüència entre els genomes humà i de ratolí es va dur a termemitjançant un protocol semi-automàtic. El programa de predicció de gens SGP2es va desenvolupara partir d’elements d’aquest protocol. El concepte al darrera de l’SGP2és que les regions de simi-laritat obtingudes amb el programa TBLASTX, es fan servir per augmentar la puntuació dels exonspredits pel programa geneid, amb el que s’obtenen conjunts d’anotacions més acurats d’estructuresgèniques. SGP2té una especificitat que és prou gran com per que es puguin validar experimental-ment via RT-PCR. La validació de llocs d’splicing emprant la tècnica de la RT-PCR és un bon exemplede com la combinació d’aproximacions computacionals i experimentals produeix millors resultatsque per separat.
S’ha dut a terme l’anàlisi descriptiva a nivell de seqüència dels llocs d’splicing obtinguts sobre unconjunt fiable de gens ortòlegs per humà, ratolí, rata i pollastre. S’han explorat les diferències a nivellde nucleòtid entre llocs U2 i U12, pel conjunt d’introns ortòlegs que se’n deriva d’aquests gens. S’hatrobat que els senyals d’splicing ortòlegs entre humà i rossegadors, així com entre rossegadors, estanmés conservats que els llocs no relacionats. Aquesta conservació addicional pot ser explicada peròa nivell de conservació basal dels introns. D’altra banda, s’ha detectat més conservació de l’espera-da entre llocs d’splicing ortòlegs entre mamífers i pollastre. Els resultats obtinguts també indiquenque les classes intròniques U2 i U12 han evolucionat independentment des de l’ancestre comú delsmamífers i les aus. Tampoc s’ha trobat cap cas convincent d’interconversió entre aquestes dues classesen el conjunt d’introns ortòlegs generat, ni cap cas de substitució entre els subtipus AT-AC i GT-AGd’introns U12. Al contrari, el pas de GT-AG a GC-AG, i viceversa, en introns U2 no sembla serinusual.
Finalment, s’han implementat una sèrie d’eines de visualització per integrar anotacions obtin-gudes pels programes de predicció de gens i per les anàlisis comparatives sobre genomes. Unad’aquestes eines, el gff2ps, s’ha emprat en la cartografia dels genomes humà, de la mosca del vina-gre i del mosquit de la malària, entre d’altres. El programa gff2aplot i els filtres associats, han fa-cilitat la tasca d’integrar anotacions de seqüència amb els resultats d’eines per la cerca d’homologia,com ara el BLAST. S’ha adaptat també el concepte de pictograma a l’anàlisi comparativa de llocsd’splicing ortòlegs, amb el desenvolupament del programa compi.
xxv


Resumen
El aumento incesante del número de secuencias genómicas, junto con el incremento del número detécnicas experimentales de las que se dispone, permitirá la obtención del catálogo completo de lasfunciones celulares de los diferentes organismos, incluida nuestra especie. Este catálogo definirá lasbases sobre las que se pueda entender mejor el funcionamiento de los organismos a nivel molecular.Al mismo tiempo, se obtendrán más pistas sobre los cambios asociados a enfermedades. Por tanto, lasecuencia en bruto, tal y como se obtiene en los proyectos de secuenciación masiva, no tiene ningúnvalor sin los análisis y la posterior anotación de las características que definen estas funciones. Es-ta tesis presenta nuestra contribución a tres aspectos relacionados de la anotación de los genes engenomas eucariotas.
Primero, la comparación a nivel de secuencia entre el genoma humano y el de ratón se llevó a cabomediante un protocolo semi-automático. El programa de predicción de genes SGP2se desarrolló apartir de elementos de dicho protocolo. El concepto sobre el que se fundamenta el SGP2es que las re-giones de similaridad obtenidas con el programa TBLASTX, se utilizan para aumentar la puntuaciónde los exones predichos por el programa geneid, con lo que se obtienen conjuntos más precisos deanotaciones de estructuras génicas. SGP2tiene una especificidad suficiente como para validar esasanotaciones experimentalmente vía RT-PCR. La validación de los sitios de splicing mediante el usode la técnica de la RT-PCR es un buen ejemplo de cómo la combinación de aproximaciones computa-cionales y experimentales produce mejores resultados que por separado.
Se ha llevado a cabo el análisis descriptivo a nivel de secuencia de los sitios de splicing obtenidossobre un conjunto fiable de genes ortólogos para humano, ratón, rata y pollo. Se han explorado lasdiferencias a nivel de nucleótido entre sitios U2 y U12 para el conjunto de intrones ortólogos deriva-do de esos genes. Se ha visto que las señales de splicing ortólogas entre humanos y roedores, asícomo entre roedores, están más conservadas que las no ortólogas. Esta conservación puede ser ex-plicada en parte a nivel de conservación basal de los intrones. Por otro lado, se ha detectado mayorconservación de la esperada entre sitios de splicing ortólogos entre mamíferos y pollo. Los resultadosobtenidos indican también que las clases intrónicas U2 y U12 han evolucionado independientementedesde el ancestro común de mamíferos y aves. Tampoco se ha hallado ningún caso convincente de in-terconversión entre estas dos clases en el conjunto de intrones ortólogos generado, ni ningún caso desubstitución entre los subtipos AT-AC y GT-AG en intrones U12. Por el contrario, el paso de GT-AGa GC-AG, y viceversa, en intrones U2 no parece ser inusual.
Finalmente, se han implementado una serie de herramientas de visualización para integrar ano-taciones obtenidas por los programas de predicción de genes y por los análisis comparativos sobregenomas. Una de estas herramientas, gff2ps, se ha utilizado para cartografiar los genomas humano,de la mosca del vinagre y del mosquito de la malaria. El programa gff2aplot y los filtros asocia-dos, han facilitado la tarea de integrar anotaciones a nivel de secuencia con los resultados obtenidospor herramientas de búsqueda de homología, como BLAST. Se ha adaptado también el concepto depictograma al análisis comparativo de los sitios de splicing ortólogos, con el desarrollo del programacompi.
xxvii


Chapter 1
Introduction
All our progress is an unfolding, like vegetable bud. Youhave first an instinct, then an opinion, then a knowledge
—Ralph Waldo Emerson, “Essays”
Genes encode all the information necessary for the cell to carry out all its functions. Al-though protein sequences are continuous1, the sequence of the genes defining them in theeukaryotic organisms appears in the DNA sequence interspersed in a sea of non-coding re-gions. Furthermore, evolution has made the problem of finding those genes in anonymousDNA sequences harder. Not only because of the intrinsic mutational changes of the DNAsequences, which makes homology finding more difficult; but also due to the variation ac-cumulated in the gene catalog of each species, which has been expanded—by duplications,for instance— or reduced—i.e., by deletions and lose of function (pseudogenes). In addi-tion to that, genes have been reordered, some of them have lost their function, becominguseless, and so on. On the other hand, to search for genes means that we have to look forthe features that characterize them, examining the raw DNA sequences for the signals thatdelineate them. Therefore, obtaining the genome sequence of an organism does not grantthat we will be able to find all the genes easily, as the real ones will be hidden in a forest offalse signals and real non-coding regions. The fact that in the human genome, made up ofthree billions2 of nucleic acids distributed in 23 chromosomes (the haploid set of course),there is only about 2% of sequence in coding regions, helps us to understand the magni-tude of the problem of finding the genes encoded in it [Guigó et al., 2000; Venter et al., 2001;Lander et al., 2001].
At the moment of transcription, the sequence containing a gene is copied from the DNAto RNA, the so called primary transcript. This undergoes a series of modifications beforebeing transported from the nucleus to the cytoplasm. Once there, the sequence of the RNA,known at this step as messenger RNA (mRNA), serves as a template to produce the cor-responding protein, the translation process. The pathway from DNA to protein synthesisbecame the central dogma of Biology. One of the most important changes performed on
1Genes that do not translate into proteins can still have a function, such as the transfer RNA (tRNA) genes andother non-coding RNAs (ncRNA). Whatever they are still coding for a cellular function, the term coding will beused along this document as protein-coding, as for protein-coding genes.
2US notation: 3× 10⁹, more intuitively 3,000,000,000bp.
1
2 Chapter 1. Introduction
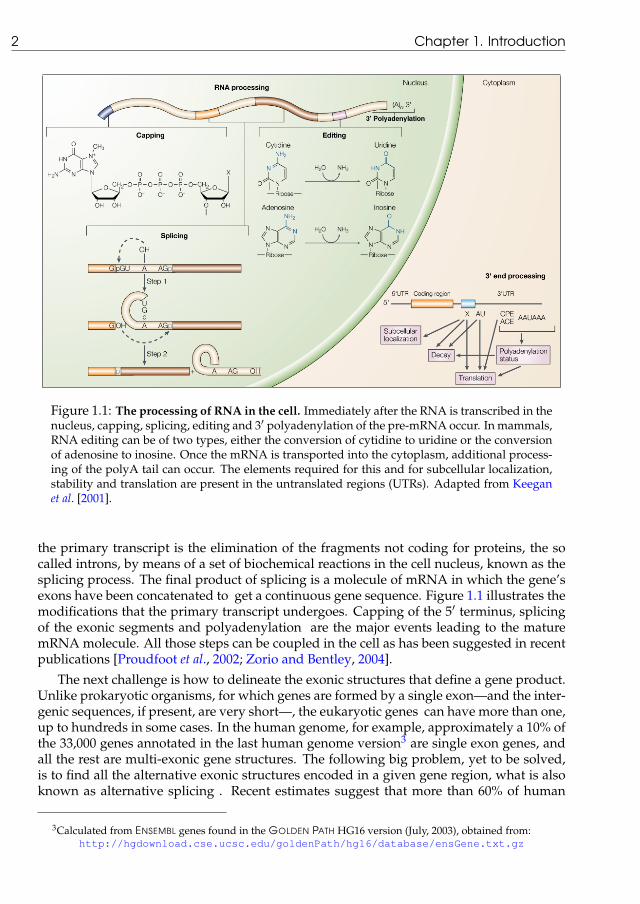
Figure 1.1: The processing of RNA in the cell. Immediately after the RNA is transcribed in thenucleus, capping, splicing, editing and 3′ polyadenylation of the pre-mRNA occur. In mammals,RNA editing can be of two types, either the conversion of cytidine to uridine or the conversionof adenosine to inosine. Once the mRNA is transported into the cytoplasm, additional process-ing of the polyA tail can occur. The elements required for this and for subcellular localization,stability and translation are present in the untranslated regions (UTRs). Adapted from Keeganet al. [2001].
the primary transcript is the elimination of the fragments not coding for proteins, the socalled introns, by means of a set of biochemical reactions in the cell nucleus, known as thesplicing process. The final product of splicing is a molecule of mRNA in which the gene’sexons have been concatenated to get a continuous gene sequence. Figure 1.1 illustrates themodifications that the primary transcript undergoes. Capping of the 5′ terminus, splicingof the exonic segments and polyadenylation are the major events leading to the maturemRNA molecule. All those steps can be coupled in the cell as has been suggested in recentpublications [Proudfoot et al., 2002; Zorio and Bentley, 2004].
The next challenge is how to delineate the exonic structures that define a gene product.Unlike prokaryotic organisms, for which genes are formed by a single exon—and the inter-genic sequences, if present, are very short—, the eukaryotic genes can have more than one,up to hundreds in some cases. In the human genome, for example, approximately a 10% ofthe 33,000 genes annotated in the last human genome version3 are single exon genes, andall the rest are multi-exonic gene structures. The following big problem, yet to be solved,is to find all the alternative exonic structures encoded in a given gene region, what is alsoknown as alternative splicing . Recent estimates suggest that more than 60% of human
3Calculated from ENSEMBL genes found in the GOLDEN PATH HG16 version (July, 2003), obtained from:http://hgdownload.cse.ucsc.edu/goldenPath/hg16/database/ensGene.txt.gz

1.1. Finding Genes in the Genomes 3
Figure 1.2: Common pitfalls among gene-finding approaches. No program is yet able tofind all genes in anonymous genomic sequences correctly. Some overpredict and report geneswhere there are none; some misspredict genes; in other cases they are not able to properly groupexons belonging to one or more genes, joining or splitting the corresponding gene structures.The upper track shows a putative set of real genes, the other tracks simulate the output of fourdifferent gene-finding tools. Adapted from Pennisi [2003].
genes show this phenomenon [Lander et al., 2001; Modrek et al., 2001]. Landscape becomesmore complex if one wants to take into account the regulation of gene expression [Zhang,2002] and the rules of the alternative splicing control [Woodley and Valcárcel, 2002].
1.1 Finding Genes in the Genomes
In the early eighties, DNA sequences under analysis were long enough to find initially openreading frames (ORFs), then exons. The first computational approaches focused then on thesearch for coding regions—see, for example, the pioneering works of Pustell and Kafatos[1982], Staden [ANALYSEQand the Staden package, 1984b; 1986 respectively], Devereuxet al. [GCGsuite, 1984], Keller et al. [1984], or Blattner and Schroeder [1984]. It was notuntil the nineties that programs able to assemble those exons into a complete gene weredeveloped [Uberbacher and Mural, 1991; Guigó et al., 1992; Burge and Karlin, 1997]. Al-though sequencing technology was improving, most of the available sequences containeda single gene, often incomplete. By that time, the number of sequences stored in databaseswas relatively small. Whole genome sequencing projects changed that scenario. Databasesstarted to grow exponentially and new problems had to be faced by the sequence analysisalgorithms. Speed was one of the main requirements of the new era, not only to look forgenes but also for the search of homologies between sequences of different species, map-ping repetitive sequences, and so on. Novel algorithms for homology search, less sensitivebut faster, were developed to screen an ever growing set of sequences. Models underlyingthe gene-finding software were developed from different approaches—for instance, neural

4 Chapter 1. Introduction
Figure 1.3: Consensus sequences of U2 and U12 splicing signals. The consensus sequences ofthe 5′ splice site, branch site and 3′ splice site are shown from left to right for minor-class introns(upper row) and for major-class introns (lower row). The letter heights at each position representthe frequency of occurrence of the corresponding nucleotides at that position. The positions thatare thought to be involved in intron recognition are shown in black; other positions are shownin blue. Adapted from Patel and Steitz [2003].
networks and hidden Markov models (HMMs). However, as the length of the sequencesincreased, it was evident that gene distribution along them and their structural complexitybecame a hard problem to solve. The reliability of the results obtained by computationalgene prediction tools has not improved so fast [Burset and Guigó, 1996; Guigó et al., 2000;Reese et al., 2000].
Gene prediction has changed substantially in the past few years. The sequencing of anincreasing number of eukaryotic genomes, and the distribution through centralized ge-nome browsers,—such as those at the University of California Santa Cruz (UCSC), theNational Center for Biotechnology Information (NCBI) and the European BioinformaticsInstitute (EBI)—of precomputed genome-wide annotations may often make it unnecessaryfor scientists to run gene prediction programs themselves. Gene prediction, however, isstill useful in these genomes, because researchers may want, for instance, to investigatein detail the pattern of alternative splicing of a given gene. On the other hand, gene pre-diction is still essential to analyze sequences from the many genomes that have not beencompletely characterized yet. The obvious conclusion is that gene prediction is still an openproblem. Figure 1.2 highlights some of the common failings that the current tools have yetto overcome.
Chapter 3 presents a brief overview of gene finding, both classical and comparativeapproaches, and the evaluation of the predictions, as well as a description of the semi-automatic protocols used for large genome-sized data sets.
1.2 Eukaryotic Gene Structure
The precise removal of pre-mRNA introns is a critical aspect of gene expression. The splic-ing machinery must recognize and remove introns to make the correct message for protein

1.3. Visualizing Genomic Features 5
production, but also, for many genes, alternative splicing mechanisms must be in place togenerate functionally diverse protein isoforms in a spatially and temporally regulated man-ner [Hastings and Krainer, 2001]. Paradoxically, in higher eukaryotes, the requirement foraccurate splicing is accompanied by exon-intron junctions that are defined, in most cases,by weakly conserved intronic cis-elements, the splice sites and the branch point [Cartegniet al., 2002]. These elements are necessary but by no means sufficient to define exon-intronboundaries. Sequences that match the consensus splice site signals as well as, or betterthan, natural splice sites are very common in introns. They define a set of pseudo-exonsthat greatly outnumber genuine exons and greatly complicate the task of assembling realgene structures by the computational gene-finding approaches.
The splicing reaction is mediated by two distinct yet analogous pools of small nuclearribonucleoprotein particles. The RNA component of such particles takes part in the recog-nition of sequence motifs at both ends of the introns, the 5′ and 3′ splice sites, and a regionwithin the intron known as the branch point [Patel and Steitz, 2003]. The works of Halland Padgett [1994] revealed a minor class of introns having unusual consensus splice sitesequences. Figure 1.3 shows, side by side, the sequence patterns for both the major and mi-nor intron classes and illustrates the fact that the minor-class sequence motifs are far moreconserved than those for the major-class [Sharp and Burge, 1997].
After a detailed description of the splicing biochemistry, we will focus on the sequencefeatures that define the boundaries between exons and introns in chapter 4. Our contri-bution to understanding the biological characteristics of such features, based on the com-parative analysis of introns from orthologous genes of several vertebrate genomes, is alsodescribed.
1.3 Visualizing Genomic Features
Despite substantial progress in computational gene finding, currently available methodsare not yet able to automatically provide accurate enough descriptions of the gene contentof eukaryotic genomes and a substantial amount of manual curation is required. This is atask in which visualization and integration tools play an essential role.
Any result in Bioinformatics, whether it is a sequence alignment, a structure prediction,or an analysis of gene expression patterns, should answer a biological question. For thisreason, it is up to the researchers to interpret their results in the context of such a question.This interpretation is the most important part of the scientific process and a number ofprograms are used to visualize the sort of data arising from Bioinformatics research. Theseprograms range from general-purpose plotting and statistical packages for the analysis ofnumerical data to programs dedicated to presenting sequence annotations in an integrated,intuitive and comprehensive fashion, such as the ENSEMBL genome browser examples fromFigure 1.4. Visualization tools exploit the abilities of the eye and brain to find patterns thatmay be interesting. After that, statistical and data mining tools restrict those searches tothe patterns that can be quantitatively and repeatedly shown to be significant [Gybas andJambeck, 2003].
In chapter 5, we provide an overview of visualization tools that have been applied to theanalysis of genome annotations and the inter-specific comparative analyses. Furthermore,we show a set of tools we have developed to visualize genomic annotations.

6 Chapter 1. Introduction
Figure 1.4: Browsing through genome annotations. A quick tour through the ENSEMBL ge-nome browser pinpoints the different information levels we can access via its web interface.From their home page located in the upper left corner, a researcher can jump into the desiredgenome, the human genome in this example. Specific queries can be performed by using thetext forms, but a very intuitive interface allows the user to zoom from the chromosome level(the Map View window placed in the center of this figure), to the sequence level (the ContigViewer on the lower left panel), and to the gene or transcript reports (middle lower panels).Integration with other species-specific genome databases is also possible by using the Syntenypanels (upper right panel). Comparative analyses at the genomic sequence level are shown inthe Multi-Contig View (lower right panel). Red arrows indicate only few of the possible paths aresearcher can follow through this browser.
1.4. About This Thesis 7
1.4 About This Thesis
None of the articles composing this thesis were collected in an appendix or as separatechapters. They appear as sections where links to the journal web references and supple-mentary material are provided, followed by the article itself. Presenting the publicationsthis way may break the storyline but it puts related subjects together which seems to bemore appropriate. In those papers in which we were part of an international consortium,the article is reproduced in part due to its size but also because we have atempted to focuson our specific contribution. This should not be a problem, since the link to retrieve thewhole article is provided as was already mentioned. Several figures and tables are referredto along the text via hyperlinks pointing directly to the page of the corresponding embed-ded article. Absolute page numbers relative to this document were used in all of thesehyperlinks and in the list of figures or tables. Nevertheless, the reader can find easily theoriginal paper page numbers just by following the hyperlinks.
The electronic version of this document has hyperlinks for the table of contents, forthe bibliographic references, but most important of all, also for the web addresses on theInternet—from now on, their Uniform Resource Locator (URL). This means that you canvisit the corresponding web page by clicking your pointer on them, in case that you haveyour PDF viewer properly customized. Many of the URLs presented in this book have beencollected in a web links reference index available on page 213. URLs within paragraphshave been moved into that web glossary in order to avoid unbalanced line breaks andfor a more pleasant reading. A reference to the corresponding page in the web referenceindex is provided instead. That does not include those URLs refering to the supplementarymaterials of the attached articles, which are put together in the corresponding article section(see Section 3.2.1 in page 20 for an example).
An attempt has been made to keep software names as provided by their authors. Thosenames appear in a monospaced serif font. Database names are typeset in a SMALL-CAPS SANS-SERIF FONT. A slanted sans-serif font was used for gene names, while a uprightsans-serif font was chosen for protein names.
The first time an acronym appears in the document, the full name will be provided andthe acronym itself will be shown in parentheses. From then on, the short form will be used.In order to help the reader, a list of abbreviations can be found on page 203. A glossary ofterms is also available on page 207.


Chapter 2
Objectives
Don’t bite my finger, look where it’s pointing.—Warren S. McCulloch
The research in this PhD thesis was initially targeted, in late 1998, to the goals enumera-ted below. In what follows, they are described and an account of their achievement statusgiven.
1. To analyze through bioinformatic means the exonic structures of homologous genes,in order to determine the extent of conservation at gene structure level.
2. To describe possible evolutive patterns for those exonic structures within mammalsand vertebrates.
3. To compare the conservation of the signals that delineate exons between differentspecies. Both, acceptor and donor, splice sites are the main players in the definitionof the exonic structure of eukaryotic genes.
4. To investigate the relationship between the conservation of exonic structures and al-ternative splicing patterns.
5. To develop visualization tools focusing specifically on the annotation of genomic se-quences (including output from gene finding tools) and the comparative analysis ofexonic structures.
6. To provide and distribute the results of our analyses and the bioinformatic tools tothe research community.
These objectives were established based on data and knowledge of that time. They wereintended to explore very basic questions about the exonic structure of eukaryotic genes andthe evolutionary fates of introns. These goals have been accomplished to different degreesas related further down. Therefore, several of these points should be considered as ongoingwork and yet many questions, both old and new, remain unanswered.
Some of the work presented in this dissertation has been done in collaboration withinternational genome sequencing consortia. These collaborations gave me the opportunity
9

10 Chapter 2. Objectives
to meet and work with specialists from all over the world, and made our work very rel-evant. However, those collaborations put a lot of pressure on us and a lot of effort hasbeen invested in such genome annotation projects. On the other hand, participating in theannotation of recently sequenced genomes has proven fruitful, as we have had to developmethodologies to analyze large amounts of data from different sources for each species.This means that we had to implement specific software to solve new problems, as well asto establish protocols to handle large sequence and annotation data sets. Such an effort wasdetrimental to some of the initial objectives and it made that this thesis took more time thanexpected.
The protocols and software we developed for finding genes by the comparison of thehuman and mouse genomes [Parra et al., 2003; Waterston et al., 2002], have been adaptedto produce gene annotations in a semi-automatic pipeline for each novel assembly versionof eukaryotic genomes. Annotations for several species, including human, chimpanzee,mouse, rat, chicken and the fruitfly, are available through a web repository (see page 214,on Web Glossary).
Despite the fact that we were able to undertake the analysis of the orthologous splicesites for four vertebrate species, we have not been able to investigate the conservation of ex-onic structures of alternatively spliced isoforms of orthologous genes. We could not tacklethe evolutionary analysis of exonic gene structure either. However, during the last year, ourgroup has joined the Alternative Splicing Database Project [Thanaraj et al., 2004], and hasbeen also chosen as a partner of the ENCODE project [ENCODE Project Consortium, 2004].ASD aims to analyze the mechanism of splicing on a genome-wide scale by creating both,human-curated and computer-generated databases containing alternatively spliced exonsfrom human and other model species. The main aims of the ENCODE project are both tovalidate known genes and to confirm reliable computational predictions experimentally.However, also to identify previously unknown genes and the characterization of a numberof splice variants of the genes found in the corresponding target regions. In both projects,there are people in our laboratory that will continue this promising research line.
For the last objective, all the programs and data sets have been made available throughour group’s web server. Most of our published papers have their own web page withsupplementary materials, as can be seen in the corresponding sections. Regarding the vi-sualization software developed, gff2ps and gff2aplot, both have several tutorials anda user’s reference manual. Furthermore, these tools are distributed under the GNU GeneralPublic License (GNU-GPL). The GNU-GPL is intended to guarantee the freedom to shareand change free software–to make sure the software is free for all its users. If our research ispublicly funded, the fruits of our work should be made publicly available. Both, the GNU-GPL and the Internet, are in our honest opinion most forthright approach to accomplishthat responsibility with the society. As stated in Jamison [2003], software security mea-sures which don’t allow for examination of original code or for reasonable mechanisms ofvalidity testing are in contrast with the open communication needed to do science properly.
Chapter 3
Comparative Gene Finding
When this circuit learns your job,what are you going to do ?
—Herbert Marshall McLuhan
Life processes, from the information flow from DNA to proteins to biochemical or re-gulatory pathways, have an intrinsic algorithmic nature. An algorithm can be defined as adetailed sequence of actions to perform to accomplish some task. The cells of living beingssteadily perform step-by-step chemical reactions. Interactions between molecules modu-late the flow of energy or information across the cell. The analogy works the other wayaround, as we attempt to emulate such biological processes by computational methods.The organization of a gene, as any other biological structure, is determined by functionaland evolutionary constraints. All computational methods are therefore based on our ex-perimental understanding of such constraints.
In this chapter we explore the computational modeling of protein-coding gene struc-tures. After that, we describe our contribution to the gene-finding using comparative ge-nomics approaches.
3.1 Computational Gene Prediction
After the genome of an organism is sequenced and assembled, comprehensive and ac-curate initial gene prediction and annotation by computational analysis have become thenecessary first step towards understanding the functional content of the genome [Guigóand Zhang, 2004]. Despite the fact that, in practice, there are tools that can be classified inmore than one of them, we can split the computational approaches to find genes in DNAsequences into three main categories.
• “Ab initio” methods are based on a search for those signals that specify the boun-daries of coding regions, as in the analysis of coding biases and regularities of theprotein-coding versus non-coding regions [Guigó, 1999]. The main handicap of suchapproaches is that the molecular mechanisms used by eukaryotic cells to define thesignals that determine the gene structure are not completely well understood.
11
12 Chapter 3. Comparative Gene Finding
• Homology-based methods use information related to the similarity of the query co-ding region with respect to a set of known sequences from databases. The majordrawback here is the bias towards known genes or proteins. Therefore novel familiesthat are under-represented or not found in the databases, will still be hard to retrieve[Guigó et al., 2000].
• The whole-genome sequencing projects allowed to extend the previous approach. In-stead of searching for sequences of known genes, the entire genomes of two or morespecies are compared. The idea behind this is that evolution tends to retain those re-gions that are important because they have a function, whatever it encodes: a proteinor structural or regulatory elements. When comparing genomes of closely relatedspecies, a set of genes emerges that is characteristic for the taxonomic group to whichthey belong. A good example of this has been the comparison between the human[Lander et al., 2001] and mouse [Waterston et al., 2002] genomes, during which ap-proximately 9,000 novel mouse and 1,000 novel human genes have been annotated[Guigó et al., 2003; Flicek et al., 2003; Parra et al., 2003]. However, comparative ge-nomics approaches are not only a useful tool to find novel genes, but they are also atool to improve the annotations of known genes [Reichwald et al., 2000] and to hy-pothesize about their functions [Wiehe et al., 2000].
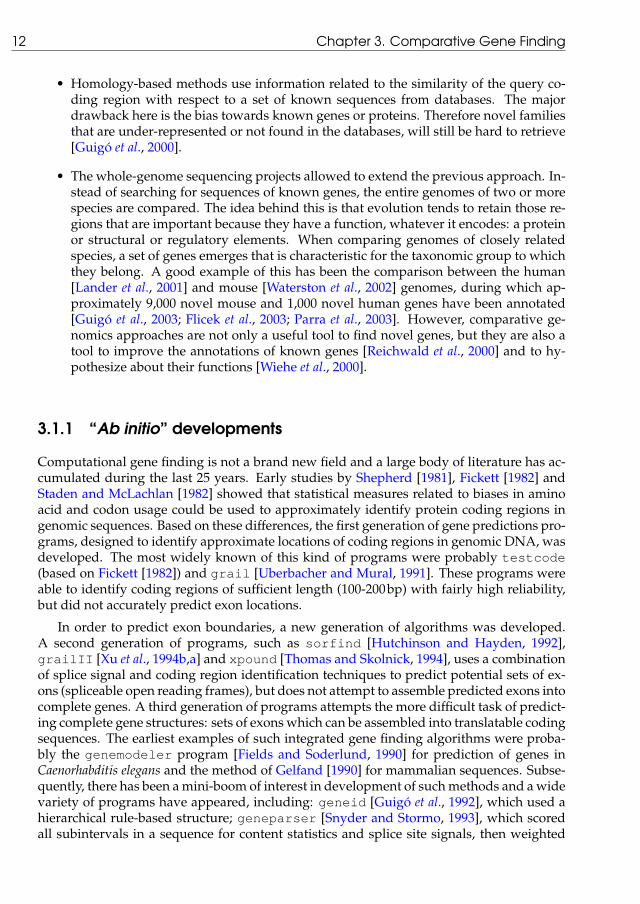
3.1.1 “Ab initio” developments
Computational gene finding is not a brand new field and a large body of literature has ac-cumulated during the last 25 years. Early studies by Shepherd [1981], Fickett [1982] andStaden and McLachlan [1982] showed that statistical measures related to biases in aminoacid and codon usage could be used to approximately identify protein coding regions ingenomic sequences. Based on these differences, the first generation of gene predictions pro-grams, designed to identify approximate locations of coding regions in genomic DNA, wasdeveloped. The most widely known of this kind of programs were probably testcode(based on Fickett [1982]) and grail [Uberbacher and Mural, 1991]. These programs wereable to identify coding regions of sufficient length (100-200bp) with fairly high reliability,but did not accurately predict exon locations.
In order to predict exon boundaries, a new generation of algorithms was developed.A second generation of programs, such as sorfind [Hutchinson and Hayden, 1992],grailII [Xu et al., 1994b,a] and xpound [Thomas and Skolnick, 1994], uses a combinationof splice signal and coding region identification techniques to predict potential sets of ex-ons (spliceable open reading frames), but does not attempt to assemble predicted exons intocomplete genes. A third generation of programs attempts the more difficult task of predict-ing complete gene structures: sets of exons which can be assembled into translatable codingsequences. The earliest examples of such integrated gene finding algorithms were proba-bly the genemodeler program [Fields and Soderlund, 1990] for prediction of genes inCaenorhabditis elegans and the method of Gelfand [1990] for mammalian sequences. Subse-quently, there has been a mini-boom of interest in development of such methods and a widevariety of programs have appeared, including: geneid [Guigó et al., 1992], which used ahierarchical rule-based structure; geneparser [Snyder and Stormo, 1993], which scoredall subintervals in a sequence for content statistics and splice site signals, then weighted

3.1. Computational Gene Prediction 13
them by a neural network and it chained the resulting features by dynamic programing;genemark [Borodovsky and McIninch, 1993] which combined the specific Markov modelsof coding and non-coding region together with Bayes’ decision making function; genlang[Dong and Searls, 1994], which treated the problem by linguistic methods describing agrammar and parser for eukaryotic protein-encoding genes; and fgenes [Solovyev et al.,1994] which used a discriminant analysis for identification of splice sites, exons and pro-moter elements.
At the end of the last decade, the introduction of the Generalized Hidden MarkovModels (GHMMs) produced a new generation of gene prediction programs. GHMMshave some advantages over the previous approaches. The main advantage is that allthe parameters of the model are probabilities and that, given a set of curated sequencesand defined states, the Viterbi algorithm can be used to compute the set of optimal pa-rameters. A great variety of programs appeared simultaneously exploring the capabili-ties of GHMMs: genie [Kulp et al., 1996], hmmgene [Krogh, 1997], veil [Hendersonet al., 1997], genscan [Burge and Karlin, 1997] and the GHMMs version of genemark(genemark.hmm, Lukashin and Borodovsky [1998]) and fgenes (fgenesh, Salamov andSolovyev [2000]).
Other gene prediction approaches have been appeared in the same period of time, forinstance: mzef [Zhang, 1997], which identified internal coding exons by quadratic discri-minant analysis; morgan [Salzberg et al., 1998], which was an integrated system for findinggenes in vertebrate DNA sequences by combining different methods with a decision treeclassifier; and Augustus [Stanke and Waack, 2003], which incorporated an intron model toan underlying HMM. However, genscan is still considered the standard gene predictionprogram (at least for human) and it is used in most of the genome annotation pipelines likeENSEMBL and the NCBI genome resources.
3.1.2 Homology based gene-finding
The backbone of similarity-aided or homology-based gene structure determination is cons-tituted by those methods that rely on comparison f the query sequence with protein orcDNA sequences. Database search software, such as BLAST[Altschul et al., 1990, 1997] andrelated tools, is not capable of automatically identifying start and stop codons or splicesites. Therefore, additional tools are required to define the exonic structures on the poten-tial targets found by the database search programs. Several tools, though, have been devel-oped to calculate spliced alignments, where large gaps—likely to correspond to introns—are only allowed at legal splice junctions, between the query sequence and the to databasematches. Among those one can cite SIM4 [Florea et al., 1998], EST_genome [Mott, 1997],Spidey [Wheelan et al., 2001] and exonerate [Slater and Birney, 2005].
Procrustes [Gelfand et al., 1996] and genewise [Birney and Durbin, 1997; Birneyet al., 2004b], both predict genes based on a comparison of a genomic query with proteintargets. GeneSeqer [Usuka and Brendel, 2000] is a similar spliced alignment program forplant genomes. Projector [Meyer and Durbin, 2004] makes explicit use of the conser-vation of the exon-intron structure between related genes, which outperforms other toolswhen the conservation at the amino acid level is weak. Other tools increase the score ofcandidate exons as a function of the similarity between these exons and known coding se-quences resulting of a database search. Examples of this approach are genomescan [Yeh

14 Chapter 3. Comparative Gene Finding
Figure 3.1:Overall flowchart of geneid.DNA sequences are scannedto find signals which are thenused to build exons. Ho-mology evidences can modifythe weights of exons in con-served regions before such ex-ons get filtered to retrieve thehigh scoring ones. This fea-ture is extensively exploited onSGP2 implementation [Parraet al., 2003]. Those exonsare assembled into gene struc-tures by GenAmic, a dynamicprogramming algorithm withlinear asymptotic cost [Guigo,1998], under a user-definedgene model. At this point, al-ready annotated features canbe integrated in the pool of pre-dicted exons. Redrawn fromgeneid manual figure kindlyprovided by Enrique Blanco.
et al., 2001], grailexp [Xu et al., 1997] and crasa [Chuang et al., 2003]; the first incorpo-rates similarity to known proteins, the later two use ESTs instead.
3.1.3 Comparative genomics approach
With the availability of many genomes from different species, a number of strategies havebeen developed to use genome comparisons to predict genes. The rationale behind com-parative genomic methods is that functional regions, protein coding regions among them,are more conserved than non-coding ones between genome sequences from different or-ganisms. See, for instance, Figure 3.3 on page 22 (Parra et al. 2003, page 109, figure 1) andFigure 5.2 on page 153. This characteristic conservation can be used to identify protein co-ding exons in the sequences. The approach taken by different programs to exploit this ideadiffer notably.
In one such approach [Blayo et al., 2002; Pedersen and Scharl, 2002], the problem is

3.1. Computational Gene Prediction 15
stated as a generalization of pairwise sequence alignment: given two genomic sequencescoding for homologous genes, the goal is to obtain the predicted exonic structure in eachsequence maximizing the score of the alignment of the resulting amino acid sequences.Both Blayo et al. [2002] and Pedersen and Scharl [2002] solve the problem through a com-plex extension of the classical dynamic programming algorithm for sequence alignment.Although very appropriate for short sequences, in practice, the time and memory require-ments of this algorithm limit its usefulness for very large genomic sequences. Although theapproach theoretically guarantees to produce the optimal amino acid sequence alignment,the fact that sequence conservation may also occur in regions other than protein coding,could lead to overprediction of coding regions, in particular when comparing large geno-mic sequences from homologous genes from closely related species.
To overcome this limitation, the programs doublescan [Meyer and Durbin, 2002] andSLAM[Alexandersson et al., 2003] rely on more sophisticated models of coding and non-coding DNA and splice signals, in addition to sequence similarity. Since sequence align-ment can be solved with Pair Hidden Markov Models [PHMMs, Durbin et al., 1998] andGHMMs have proven to be very useful to model the characteristics of eukaryotic genes[Burge and Karlin, 1997], SLAMand doublescan are built upon the so-called GeneralizedPair HMMs. In these, gene prediction is not the result of the sequence alignment, as in theprograms above, but both gene prediction and sequence alignment are obtained simulta-neously.
A third class of programs adopts a more heuristic approach, and separates gene pre-diction from sequence alignment. The programs rosetta[Batzoglou et al., 2000], SGP1[from Syntenic Gene Prediction, Wiehe et al., 2001], and cem [from the Conserved ExonMethod, Bafna and Huson, 2000] are representative of this approach. All these programsstart by aligning two syntenic regions (specifically human and mouse in rosetta, andcem; less species specific in SGP1), using some alignment tool (theglass program, spe-cifically developed in the case of rosetta, or generic ones, such as TBLASTX, orsim96in the case of cem and SGP1respectively) and then predict gene structures in which theexons are compatible with the alignment. This compatibility often requires conservationof exonic structure of the homologous genes encoded in the anonymous syntenic regions.Although conservation of exonic structure is an almost universal feature of orthologous hu-man/mouse genes [Waterston et al., 2002], it does not necessarily occur when comparinggenomic sequences of homologous genes from other species.
The programs described so far rely on the comparison of fully assembled (and whenfrom different organisms, syntenic) genomic regions. This limits their utility when ana-lyzing complete large eukaryotic genomes and in particular when the informant genomeis in non-assembled shotgun form. To overcome this limitation, the programs Twinscan[Korf et al., 2001] and SGP2[Parra et al., 2003] take a still different approach. The approachin these programs is reminiscent of that used in genomescan [Yeh et al., 2001] to incor-porate similarity to known proteins to modify the genscan scoring schema. Essentially,the query sequence from the target genome is compared against a collection of sequencesfrom the informant genome (which can be a single homologous sequence to the query se-quence, a whole assembled genome, or a collection of shotgun reads) and the results of thecomparison are used to modify the scores of the exons produced by “ab initio” gene pre-diction programs. In Twinscan, the genome sequences are compared using BLASTNandthe results serve to modify the underlying probability of the potential exons predicted bygenscan. In SGP2, the genome sequences are compared usingTBLASTX, and the results

16 Chapter 3. Comparative Gene Finding
used to modify the scores of the potential scores predicted by geneid; see methods sectionand Figure 3.4 on page 24 (page 110 and Figure 2 on page 111 of Parra et al. 2003).
As the number of available genome sequences of species at different evolutionary dis-tances increases, methods to predict genes based on the comparative analysis of multiplegenomes (and not only of two species) look promising. For instance, Dewey et al. [2004]combine pairwise predictions from SLAMin the human, mouse and rat genomes to si-multaneously predict genes with conserved exonic structure in all three species. In theso-called Phylogenetic Hidden Markov Models (phylo-HMMs) or Evolutionary HiddenMarkov Models (EHMMs), a gene prediction Hidden Markov Model is combined with aset of evolutionary models, based on phylogenetic trees. Phylo-HMMs take into accountthat the rate (and type) of evolutionary events differ in protein-coding and non-codingregions. Recently, phylo-HMMs have been applied to gene prediction with encouragingresults [Pedersen and Hein, 2003; Siepel and Haussler, 2004].
Phylo-HMMs also have been used in the context of phylogenetic shadowing [Boffelliet al., 2003]. Phylogenetic shadowing examines sequences of closely related species andtakes into account the phylogenetic relationship of the set of species analyzed. This ap-proach enables the localization of regions of collective variation and complementary re-gions of conservation, facilitating the identification of coding as well as non-coding func-tional regions. The likelihood ratio under a fast (versus slow) mutation regime can becomputed for each aligned nucleotide site across all the sequences being analyzed. Thisratio represents the relative likelihood that any given nucleotide site was subjected to afaster or slower rate of accumulation of variation and is related to functional constraintsimposed on each site. Exon containing sequences will display the least amount of crossspecies variation, in agreement with the constraint imposed by their function. Regionsfrom different parts of the genome, in which functional non-coding sequences appear, mayevolve at different rates [Ebersberger et al., 2002], reflected by differences in their absolutelikelihoods. Despite that, functional non-coding regions can be retrieved from stretches ofsequence having minimal variation similar to exonic ones.
3.1.4 Analysis pipelines to automatize sequence annotation
Gene prediction software is often integrated into analysis pipelines in order to produce an-notations on sets of genomic sequences, for instance a set of chromosome assemblies for agiven species or even a bunch of shotgun sequence reads. Here we will shift the focus to-wards the management of data on which the programs are run and the flow of annotationoutputs among different tools. Systems developed to summarize and visualize annota-tions, that can be incorporated as another step of the annotation process, are extensivelydescribed in Chapter 5.
Human annotators use their intuition and experience to synthesize the often contra-dictory evidence into a single gene structure. Pipelines generally use rules based on theintuition and experience of their designers [Brent and Guigó, 2004]. Human interpreta-tion of the results of these raw analysis by manual curators gives the highest-quality dataand most accurate gene structures. However, this process is slow by nature, and annotatorsmay produce conflicting interpretations of the analysis. Fully automated prediction of genestructures has the advantage of being fast, does not require a team of trained annotators,and will process the raw analysis results consistenly. Its major drawback, though, is that

3.1. Computational Gene Prediction 17
it can underpredict both the number of genes and the number of alternative transcripts[Potter et al., 2004].
Pise [Letondal, 2001], a web interface generator for molecular biology software, cancombine related programs in order to perform more complex analyses. The macros gen-erated by Pise constitute a procedure that will redo the same processing as that alreadyperformed, with another initial input. SEALS[Walker and Koonin, 1997] provides a suiteof programs designed to facilitate analysis projects involving large amounts of data. Thesystem is designed to provide modular elements which can be combined, modified andintegrated with other methods. Pise can be understood as a web interface to analysisprograms, while SEALScan be seen as a Unix command-line tool set. However, the firstis not meant for automated large-scale analysis, and the latter requires too much manualinteraction to be considered a true analysis pipeline.
The ENSEMBL gene-building system [Curwen et al., 2004] enables fast automated anno-tation of eukaryotic genomes. It annotates genes based on evidence derived from knownprotein, cDNA and EST sequences. The initial stage of computation is known as the ‘rawcompute’ and comprises various stand-alone analyses, including homology searches usingBLAST[Altschul et al., 1997]. Then, ENSEMBL takes these types of analyses one step furtherand provides a set of gene annotations based on them, to which extra biological informa-tion such as gene family, expression data and gene ontologies are linked. Similar systemshave been developed for other databases: FLYBASE uses BOP[Mungall et al., 2002], NCBIhas its own pipeline [Kitts, 2002] as does the UCSC group [Kent et al., 2002]. The ENSEMBLanalysis pipeline [Potter et al., 2004] is split into two parts. The first deals solely with therunning of the individual analyses and parsing the output. The second part deals with theautomated running, in the correct order, of the many analyses that constitute the pipeline.It keeps track of those that have run succesfully, while also coping with problems such asjob failures. In order to scale up the process for the analysis of whole genomes, the pipelineonly uses flat files locally on the execution nodes; input data are retrieved directly from adatabase, and the output data are written back the same way.
Large software systems usually consist of many independently developed parts, andthere is a need for data exchange mechanisms to move information among the compo-nents. Data integration is a related problem, but with the focus on combining informationin scientifically valid ways. Workflow management is the software technology used forkeeping track of tasks to be done in generating large datasets or in the automated analysisof such datasets [Goodman, 2002]. A classification of tasks in Bioinformatics emphasizesthat most bioinformatics requirements may be described in terms of filters, transformers,transformer-filters, forks and collections of data [Stevens et al., 2001]. Two themes are con-sistent in these requirements: the need for running analyses in a serial rule-dependent fash-ion (workflow) and the ability to run these tasks in parallel where possible (highthrough-put).
Biopipe [Hoon et al., 2003] is a generic system for large-scale bioinformatics analysis,that has been influenced by the ENSEMBL pipeline. Smaller pipeline systems also exist forannotation of ESTs or individual clones. These systems include Genescript [Hudek et al.,2003] and ASAP[Glasner et al., 2003]. PLAN[Chagoyen et al., 2004] is a simple XML-basedlanguage for the definition of executable workflows that simplifies data search and analysisby providing a uniform XMLview on both data sources and analytical applications.

18 Chapter 3. Comparative Gene Finding
Figure 3.2: SGP2-based analysis pipeline for pair-wise genome comparisons. Data is re-trieved from a remote server and it is reformatted in the local repository to suit the input for theprograms involved in the pipeline. Annotations of known features can be used to train programparameters and to evaluate the outputs for the whole process. In such a scenario, visualizingtools, like gff2ps and gff2aplot (see sections 5.2 and 5.3.1, respectively), can be integratedin the pipeline to summarize predicted genes and homology features.
3.2 SGP2: Syntenic Gene Prediction Tool
The computational approach to incorporate information from the comparison of twogenomes to geneid is described in the research article attached in the following subsection(see Section 3.2.1 on page 20), and it was briefly discussed on page 15 of Section 3.1.3. Here,we would like to discuss SGP2in the context of the genomic comparison between humanand mouse, which is reflected in Section 3.2.2, page 31. The results for those analyses aresummarized in Section “De novo gene prediction” on page 38 (page 539 of Waterston et al.2002).
Figure 3.2 on page 18 displays a general analysis protocol to produce a set of genepredictions in a set of sequences for different species. SGP2can be seen there as a procedurebased on TBLASTXand geneid. It also requires some programs to filter the similarityregions found by TBLASTX. In the figure, only theparseblast filter was drawn for thesake of simplicity, but there are a few other programs involved in the SGP2processing ofsimilarity data. The algorithms and the parameter settings for the software are detailed inmethods section and Figure 3.4 on page 24 (page 110 and Figure 2 on page 111 of Parra et al.

3.2. SGP2: Syntenic Gene Prediction Tool 19
2003)
A whole analysis pipeline was developed for the human and mouse genome compar-isons. It included preprocessing of the genome sequences and annotations from the UCSCFTP server; the search for homology between the sequences of the two genomes; the com-putational gene prediction approaches, both the “ab initio” (geneid and genscan) and thecomparative genomics approach (SGP2). Results from other groups were also integratedin the pipeline in order to perform the evaluation of the gene predictions against differentreference annotation sets (including REFSEQ and ENSEMBL genes). At that time there wereupdates of sequence sets for each genome version that was assembled for the human andmouse genomes. This required to run again the whole protocol on those new genomic se-quences. Another issue was the growing number of elements to be included in the analysispipeline. To face both problems, we developed a simple task manager in perl to con-trol the processes to be run on a given set of sequences, and to distribute the task amongdifferent machines of our lab. The perl program was provided with a set of unix shellscripts to be run in a given order and with a set of sequences. It scheduled all the jobs to berun for each sequence by using a simple execution queue. The task manager sent each jobscript to be executed on a sequence to a machine in the list of available computers of ourlab. This was achieved with rsh remote shell calls, while the sequence files and the resultswere shared among all the computers involved in the analysis via the Network File System(NFS). The task scheduler also kept a record of the execution status of each submitted job,reporting those cases in which the remote execution failed, without resubmitting them.
The major drawback of this simple approach was the bottleneck of using flat filesthrought the NFSon multiple computers when programs required intensive input/outputflow to the file system. This has been already stated in Potter et al. [2004], and was thereason for the development of the ENSEMBL analysis pipeline with a relational databasesystem. However, the modular design of the shell scripts defining each job warranted thatmany of the components of the semi-automated analysis pipeline described in this sectionwere recycled. They have been used to obtain predictions for new versions of the humanand mouse genomes, but also for other genomes of species such as rat and chicken. Theresults have been collected in a web repository (see the “Gene Predictions on Genomes”entry in the Web Glossary, on page 214).

20 Chapter 3. Comparative Gene Finding
3.2.1 Parra et al , Genome Research, 13(1):108–117, 2003
PubMed Accession:http://www.ncbi.nlm.nih.gov/entrez/query.fcgi?cmd=Retrieve&db=PubMed&list_uids=12529313&dopt=Abstract
Journal Abstract:
http://www.genome.org/cgi/content/abstract/13/1/108
Supplementary Materials:
http://genome.imim.es/datasets/sgp2002/
Program Home Page:
http://genome.imim.es/software/sgp2/
Parra G, Agarwal P, Abril JF, Wiehe T, Fickett JW, Guigo R.
Comparative gene prediction in human and mouseGenome Research.
2003 Jan;13(1):108-17.
http://www.genome.org/cgi/content/full/13/1/108
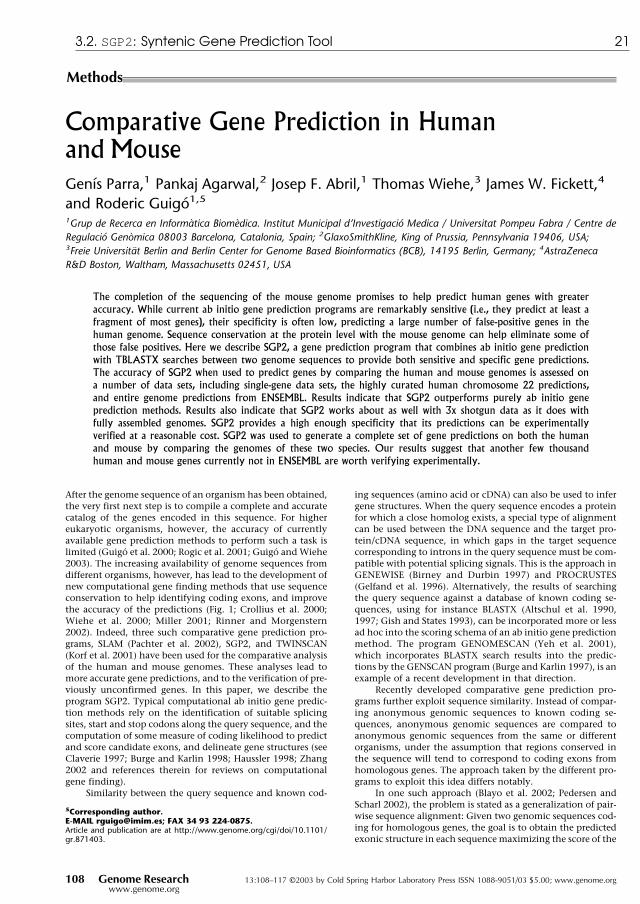
Comparative Gene Prediction in Humanand MouseGenıs Parra,1 Pankaj Agarwal,2 Josep F. Abril,1 Thomas Wiehe,3 James W. Fickett,4
and Roderic Guigo1,5
1Grup de Recerca en Informatica Biomedica. Institut Municipal d’Investigacio Medica / Universitat Pompeu Fabra / Centre deRegulacio Genomica 08003 Barcelona, Catalonia, Spain; 2GlaxoSmithKline, King of Prussia, Pennsylvania 19406, USA;3Freie Universitat Berlin and Berlin Center for Genome Based Bioinformatics (BCB), 14195 Berlin, Germany; 4AstraZenecaR&D Boston, Waltham, Massachusetts 02451, USA
The completion of the sequencing of the mouse genome promises to help predict human genes with greateraccuracy. While current ab initio gene prediction programs are remarkably sensitive (i.e., they predict at least afragment of most genes), their specificity is often low, predicting a large number of false-positive genes in thehuman genome. Sequence conservation at the protein level with the mouse genome can help eliminate some ofthose false positives. Here we describe SGP2, a gene prediction program that combines ab initio gene predictionwith TBLASTX searches between two genome sequences to provide both sensitive and specific gene predictions.The accuracy of SGP2 when used to predict genes by comparing the human and mouse genomes is assessed ona number of data sets, including single-gene data sets, the highly curated human chromosome 22 predictions,and entire genome predictions from ENSEMBL. Results indicate that SGP2 outperforms purely ab initio geneprediction methods. Results also indicate that SGP2 works about as well with 3x shotgun data as it does withfully assembled genomes. SGP2 provides a high enough specificity that its predictions can be experimentallyverified at a reasonable cost. SGP2 was used to generate a complete set of gene predictions on both the humanand mouse by comparing the genomes of these two species. Our results suggest that another few thousandhuman and mouse genes currently not in ENSEMBL are worth verifying experimentally.
After the genome sequence of an organism has been obtained,the very first next step is to compile a complete and accuratecatalog of the genes encoded in this sequence. For highereukaryotic organisms, however, the accuracy of currentlyavailable gene prediction methods to perform such a task islimited (Guigo et al. 2000; Rogic et al. 2001; Guigo andWiehe2003). The increasing availability of genome sequences fromdifferent organisms, however, has lead to the development ofnew computational gene finding methods that use sequenceconservation to help identifying coding exons, and improvethe accuracy of the predictions (Fig. 1; Crollius et al. 2000;Wiehe et al. 2000; Miller 2001; Rinner and Morgenstern2002). Indeed, three such comparative gene prediction pro-grams, SLAM (Pachter et al. 2002), SGP2, and TWINSCAN(Korf et al. 2001) have been used for the comparative analysisof the human and mouse genomes. These analyses lead tomore accurate gene predictions, and to the verification of pre-viously unconfirmed genes. In this paper, we describe theprogram SGP2. Typical computational ab initio gene predic-tion methods rely on the identification of suitable splicingsites, start and stop codons along the query sequence, and thecomputation of some measure of coding likelihood to predictand score candidate exons, and delineate gene structures (seeClaverie 1997; Burge and Karlin 1998; Haussler 1998; Zhang2002 and references therein for reviews on computationalgene finding).
Similarity between the query sequence and known cod-
ing sequences (amino acid or cDNA) can also be used to infergene structures. When the query sequence encodes a proteinfor which a close homolog exists, a special type of alignmentcan be used between the DNA sequence and the target pro-tein/cDNA sequence, in which gaps in the target sequencecorresponding to introns in the query sequence must be com-patible with potential splicing signals. This is the approach inGENEWISE (Birney and Durbin 1997) and PROCRUSTES(Gelfand et al. 1996). Alternatively, the results of searchingthe query sequence against a database of known coding se-quences, using for instance BLASTX (Altschul et al. 1990,1997; Gish and States 1993), can be incorporated more or lessad hoc into the scoring schema of an ab initio gene predictionmethod. The program GENOMESCAN (Yeh et al. 2001),which incorporates BLASTX search results into the predic-tions by the GENSCAN program (Burge and Karlin 1997), is anexample of a recent development in that direction.
Recently developed comparative gene prediction pro-grams further exploit sequence similarity. Instead of compar-ing anonymous genomic sequences to known coding se-quences, anonymous genomic sequences are compared toanonymous genomic sequences from the same or differentorganisms, under the assumption that regions conserved inthe sequence will tend to correspond to coding exons fromhomologous genes. The approach taken by the different pro-grams to exploit this idea differs notably.
In one such approach (Blayo et al. 2002; Pedersen andScharl 2002), the problem is stated as a generalization of pair-wise sequence alignment: Given two genomic sequences cod-ing for homologous genes, the goal is to obtain the predictedexonic structure in each sequence maximizing the score of the
5Corresponding author.E-MAIL [email protected]; FAX 34 93 224-0875.Article and publication are at http://www.genome.org/cgi/doi/10.1101/gr.871403.
Methods
108 Genome Research 13:108–117 ©2003 by Cold Spring Harbor Laboratory Press ISSN 1088-9051/03 $5.00; www.genome.orgwww.genome.org
3.2. SGP2: Syntenic Gene Prediction Tool 21

alignment of the resulting amino acid sequences. Both Blayoet al. (2002) and Pedersen and Scharl (2002) solve the problemthrough a complex extension of the classical dynamic pro-gramming algorithm for sequence alignment.
In a different approach, the programs SLAM (Pachter etal. 2002) and DOUBLESCAN (Meyer and Durbin 2002) com-
bine sequence alignment pair hid-den Markov Models (HMMs;Durbin et al. 1998) with gene pre-d i c t i on g en e r a l i z e d HMMs(GHMMs; Burge and Karlin 1997)into the so-called generalized pairHMMs. In these, gene prediction isnot the result of the sequence align-ment, as in the programs above;gene prediction and sequencealignment are obtained simulta-neously.
A third class of programs adopta more heuristic approach, andseparate clearly gene predictionfrom sequence alignment. The pro-grams ROSSETA (Batzoglou et al.2000), SGP1 (from ‘syntenic geneprediction’; Wiehe et al. 2001), andCEM (from ‘conserved exonmethod’; Bafna and Huson 2000)are representative of this approach.All these programs start by aligningtwo syntenic sequences and thenpredict gene structures in which theexons are compatible with thealignment. The programs describedthus far rely on the comparison offully assembled (and when fromdifferent organisms, syntenic) ge-nomic regions. This limits theirutility when analyzing completelarge eukaryotic genomes, and inparticular when the informant ge-nome is in nonassembled shotgunform. To overcome this limitation,the programs TWINSCAN (Korfet al. 2001) and SGP2 take stilla different approach. The approachis reminiscent of that used inGENOMESCAN (Yeh et al. 2001) toincorporate similarity to knownproteins to modify the GENSCANscoring schema. Essentially, thequery sequence from the target ge-nome is compared against a collec-tion of sequences from the infor-mant genome (which can be asingle homologous sequence to thequery sequence, a whole assembledgenome, or a collection of shotgunreads), and the results of the com-parison are used to modify thescores of the exons produced by abinitio gene prediction programs. InTWINSCAN, the genome sequencesare compared using BLASTN, andthe results serve to modify the un-
derlying probability of the potential exons predicted byGENSCAN. In SGP2, the genome sequences are compared us-ing TBLASTX (W. Gish, 1996–2002, http://blast.wustl.edu),and the results are used to modify the scores of the potentialscores predicted by GENEID. TWINSCAN and SGP2 have beensuccessfully applied to the annotation of the mouse genome
1000 2000 30001 3251
1000
2000
3000
4000
1
4271
Mouse orthologous gene
Hum
an H
LA
cla
ss I
I al
pha-
chai
n ge
ne
1000 2000 30001 3251
0
50
Figure 1 Pairwise comparison using TBLASTX of the human and mouse genomic sequences codingfor the HLA class II alpha chain. Black boxes indicate the coding exons, while black diagonals indicatethe conserved alignments. The score of the conserved alignments (divided by 10) is given in the lowerpanels. Although conserved regions between the human and mouse genomic sequences coding forthese genes fully include the coding exons, a substantial fraction of intronic regions is also conserved.The TBLASTX outptut was post-processed to show a continuous non-overlapping alignment.
Comparative Gene Prediction in Human and Mouse
Genome Research 109www.genome.org
22 Chapter 3. Comparative Gene Finding

(Mouse Genome Sequencing Consortium 2002), and havehelped to identify previously unconfirmed genes (Guigo etal. 2003).
In the next section, we describe the algorithmic details ofSGP2, and its implementation. We also describe the sequencesets used to benchmark SGP2 accuracy. Results based on thesedata sets indicate that SGP2 is an improvement over pure abinitio gene prediction programs, even when the informantgenome is only in shotgun form. We have found that 3xcoverage will generally suffice to achieve maximum accuracy.Finally, we describe the application of SGP2 to the compara-tive analysis of the human and mouse genomes.
METHODS
SGP2SGP2 is a method to predict genes in a target genome sequenceusing the sequence of a second informant or reference genome.Essentially, SGP2 is a framework to integrate the ab initiogene prediction program GENEID (Guigo et al. 1992; Parra etal. 2000) with the sequence similarity search programTBLASTX. The approach is conceptually similar to thatused in TWINSCAN to incorporate BLASTN searches intoGENSCAN.
GENEID is a genefinder that predicts and scores all po-tential coding exons along a query sequence. Scores of exonsare computed as log-likelihood ratios, which are a function ofthe splice sites defining the exon, and of the coding bias incomposition of the exon sequence as measured by a MarkovModel of order five (Borodovsky and McIninch 1993). Fromthe set of predicted exons, GENEID assembles the gene struc-ture (eventually multiple genes in both strands), maximizingthe sum of the scores of the assembled exons, using a dynamicprogramming chaining algorithm (Guigo 1998).
When using an informant genome sequence to predictgenes in a target genome sequence, ideally we would like toincorporate into the scores of the candidate exons predictedalong the target sequence, the score of the optimal alignmentat the amino acid level between the target exon sequence andthe counterpart homologous exon in the informant genomesequence. If a substitution matrix, for instance from theBLOSUM family, is used to score the alignment, the resultingscore can also be assumed to be a log-likelihood ratio: infor-mally, the ratio between the likelihood of the alignmentwhen the amino acid sequences code for functionally relatedproteins, and the likelihood of the alignment, otherwise. Inprinciple, this score could be added to the GENEID score forthe exon. TBLASTX provides an appropriate shortcut to oftenfind a good enough approximation to such an optimal align-ment, and infer the corresponding score: The optimal align-ment can be assumed to correspond to the maximal scoringhigh-scoring segment pairs (HSP) overlapping the exon. How-ever, when dealing in particular with the informant genomesequence in fragmentary shotgun form, often different re-gions of a candidate exon sequence will align optimally todifferent informant genome sequences. Thus, in the approachused here, we identify the optimal HSPs covering each frac-tion of the exon, and compute separately the contribution ofeach HSP into the score of the exon. In the next section, wedescribe in detail how this computation is performed.
Scoring of Candidate ExonsLet e be one of the candidate exons predicted by GENEIDalong the query DNA sequence S. In SGP2, the final score of e,s(e), is computed as
s�e� = sg �e� + wst �e�
where sg(e) is the score given by GENEID to the exon e, and
st(e) is the score derived from the HSPs found by a TBLASTXsearch overlapping the exon e. Both scores are log-likelihoodratios (and we compute both base two). Assuming that bothcomponents are independent, they can be summed up into asingle score. However, the assumption of independence is notrealistic, sg(e) depends on the probability of the sequence of e,assuming that e codes for a protein, while st(e) depends on theprobability of the optimal alignment of e with a sequencefragment of the mouse genome, assuming that both se-quences code for related proteins. Obviously, these two prob-abilities are not independent. Their joint distribution couldonly be investigated—at least empirically—if the MarkovModel of coding DNA used in GENEID, and the substitutionmatrix used by TBLASTX were inferred from the very same setof coding sequences. Since this is quite difficult, if not unfea-sible, we use an “ad hoc” coefficient, w, to weight the contri-bution of TBLASTX search, st(e) into the final exon score.
We compute st(e) in the following way. Let h1···hq be theset of HSPs found by TBLASTX after comparing the querysequence S against a database of DNA sequences (Fig. 2A).
First, we find the maximum scoring projection of the HSPsonto the query sequence. We simply register the maximumscore among the scores of all HSPs covering each position,and then partition the query sequence in equally maximallyscoring segments (bounded by dotted lines in Fig. 2A) x1···xr,with scores sp(x1)···sp(xr) (Fig. 2B).
Then, for each predicted exon e (Fig. 2C), we find Xe, theset of maximally scoring segments overlapping e
Xe = �xi : xi ∩ e � ��
where a ∩ b denotes the overlap between sequence segmentsa and b, and � means no overlap. We compute st(e)in thefollowing way:
st �e� = �x∈ Xe
sp�x�| x ∩ e |
| x|
where �a� denotes the length of sequence segment a.That is, each exon gets the score of the maximally scor-
ing HSPs along the exon sequence proportional to the frac-tion of the HSP covering the exon. In other words, st(e) is theintegral of the maximum scoring projection function withinthe exon interval.
Once the scores s have been computed for all predictedexons in the sequence S, gene prediction proceeds as usual inGENEID: The gene structure is assembled maximizing thesum of scores of the assembled exons.
Running SGP2In practice, we run SGP2 in the following way. Given a DNAquery sequence and a collection of DNA sequences, we com-pare the query sequence against the collection using TBLASTX2.0MP-WashU [23-Sep-2001]. The query sequence can be agenomic fragment of any size, including complete eukaryoticchromosomes, whereas the collection of sequences may bealmost anything from just a homologous region or a partialcollection of genomic sequences from the same or anotherspecies to the whole genome sequence of a second species,either completely assembled or in shotgun form at any degreeof coverage. In particular, two different regions of the samegenome coding for homologous genes can be used withinSGP2; in this case the same genome acts as target and infor-mant.
In all the analyses reported here, we used BLOSUM62 asthe amino acid substitution matrix, but changed the penaltyfor aligning any residue to a stop codon to �500. This helpsto get rid of a large fraction of HSPs in noncoding regions.Because of TBLASTX limitations, large query sequences mayneed to be split in fragments before the search, and the resultsreconstructed afterwards. Results of TBLASTX search are then
Parra et al.
110 Genome Researchwww.genome.org
3.2. SGP2: Syntenic Gene Prediction Tool 23

parsed to obtain the maximum scoring projection of the HSPsonto the query sequence. The parsing includes discarding allHSPs below a given bit score cutoff, subtracting this valuefrom the score of the remaining HSPs, weighting the resultingscore by w (see above), and collapsing the HSPs in to themaximum scoring projections. In all analyses described here,the bit score cutoff was set to 50, and w to 0.20. These valueswere chosen to optimize the gene predictions in sequence setsof known homologous human andmouse genomic sequences(see the Results section).
The maximum scoring projection is given to GENEID ingeneral feature format (GFF; R. Durbin and D. Haussler,http://www.sanger.ac.uk/Software/GFF/). GENEID uses it torescore the exons predicted along the query sequence as ex-plained, and assembles the corresponding optimal gene struc-ture. GENEID was already designed to incorporate externalinformation into the gene predictions, and no changes wererequired in the program to accommodate it into the SGP2context, only a small adjustment in the parameter file to copewith the change in scale of the exon scores.
We have written a simple PERL script which, given aquery DNA sequence and the results of the TBLASTX search,performs all the components of the SGP2 analysis transpar-ently: the parsing of the TBLASTX search results, and theGENEID predictions. In the case wherein both the query andthe informant sequence are single genomic fragments, thegene predictions can be obtained in both sequences (withoutthe need for a second TBLASTX search). The script, as well asthe individual components, can be found at http://www1.imim.es/software/sgp2/.
GENEID has essentially no limits to the length of theinput sequence, and deals well with chromosome size se-quences. Limits to the length of the input query sequence thatcan be analyzed by SGP2 are, thus, those imposed by
TBLASTX. GENEID is quite fast; given the parsed TBLASTXresults, it takes 6 h to reannotate the whole human genome ina MOSIX cluster containing four PCs (PentiumIII Dual 500Mhz processors).
Accelerating TBLASTX SearchesTBLASTX searches, although efficient, are much slower. Itsdefault usage may become computationally prohibitive whencomparing complete eukaryotic genomes. In the context ofSGP2, however, a number of TBLASTX options can bechanged to speed up the search, without significant loss ofsensitivity in the predictions (see the Results section). Thus,results in human chromosome 22 and whole-genome com-parisons have been performed using the following set of pa-rameters: W = 5, -nogap, -hspmax = 150,000, B = 200, V = 200,E = 0.01, E2 = 0.01, Z = 30,000,000, -filter = xnu + seg, andS2 = 80. In these cases, the query sequences have been brokenup in 5 MB fragments, and the database sequences in 10 MBfragments. In all cases, stop codons are heavily penalized(�500) in the alignments. After the search is completed, lo-cations of the resulting HSPs are recomputed in chromosomalcoordinates. Results in the single-gene sequence benchmarkdata sets were obtained with default TBLASTX parameters.
Sequence Data Sets
Benchmark Sequence SetsTo optimize some of the parameters in SGP2 and to test itsperformance, we used a set of known pairs of genomic se-quences coding for homologous human and rodent genes.The set is built after the set constructed by Jareborg et al.(1999). This is a set of 77 orthologous mouse and human genepairs. We considered only the 33 pairs of sequences in this set
Figure 2 Rescoring of the exons predicted by GENEID according to the results of a TBLASTX search. See the “SGP2” section for a detailedexplanation of the figure.
Genome Research 111www.genome.org
24 Chapter 3. Comparative Gene Finding

coding for single complete genes. In addition, we discardedsix additional pairs, when we suspected that one of the mem-bers could be wrongly annotated. Orthology in the Jareborg etal. (1999) data set is based on sequence conservation. Thiscould bias the set towards the more highly conserved human/mouse orthologous genes. To compensate for this bias, weobtained an additional set of pairs of human/rodent ortholo-gous genes through an approach which does not involve se-quence conservation: We obtained the set of pairs of human/mouse sequences from the SWISSPROT database sharing theprefix (indicating the gene) in their locus names. We keptonly those pairs for which it was possible to find the corre-sponding annotated genomic sequence—including the map-ping of the transcript, and not only of the coding regions—inthe EMBL database. Fifteen additional genes were found thisway. Three of them were discarded because we suspectedwrong annotation in at least one of the members of the pair.We believe that orthology in the remaining cases is highlylikely because of the absolute conservation of the exonicstructure (number and length of exons, and intron phases)that we observed. We will call the resulting concatenated setof 39 pairs of human/mouse homologous genes the SCIMOGdataset (from Sanger Center IMim Orthologous Genes). Thedata set and the detailed protocol used to obtain it can beaccessed at http://www1.imim.es/datasets/sgp2002/.
To test the accuracy of SGP2, we used the data set con-structed by Batzoglou et al. (2000) of 117 orthologous humanand mouse genes. We discarded those pairs in which in atleast one of the sequences contained multiple genes, andthose in which the coding region started in position 1 in oneof the sequences of the pair. This resulted in 110 genes. Wewill call this set the MIT data set. There is some overlap be-tween the SCIMOG and MIT data sets, and thus the lattercannot properly be called a test set. However, we decided notto eliminate the redundant entries, so that the results could becompared to those published for the ROSSETA program (Bat-zoglou et al. 2000).
Finally, we tested SGP2 in the complete sequence of hu-man chromosome 22 (Dunham et al. 1999). The masked se-quence was obtained from http://genome.cse.ucsc.edu/goldenPath/22dec2001/. Chromosome 22 is probably the bestannotated human chromosome. We used the gene annota-tions at http://www.cs.columbia.edu/∼vic/sanger2gbd/. TheCDS set contains 554 genes. This is a conservative set thatonly contains the coding region of genes and does not includepseudogenes. This may lead to an underestimation of thespecificity of the predictions.
Mouse and Human Genome SequencesWe used versions MGSCv3 of the mouse genome(2,726,995,854 bp, http://genome.cse.ucsc.edu/goldenPath/mmFeb2002/) and NCBI28 of the human genome(3,220,912,202 bp, http://genome.cse.ucsc.edu/goldenPath/22dec2001/). Both masked and unmasked sequences were ob-tained from these locations. ENSEMBL gene annotations forthese genomes were obtained from http://genome.cse.ucsc.edu/goldenPath/22dec2001/database/ensGene.txt.gz for
the human genome, and from http://genome.cse.ucsc.edu/goldenPath/mmFeb2002/database/ensGene.txt.gz for themouse genome. ENSEMBL predicts 23,005 and 22,076nonoverlapping transcripts genes on the human and mousegenome, respectively.
Evaluating AccuracyThe measures of accuracy used here are extensively discussedin Burset and Guigo (1996). We will restate them briefly. Ac-curacy is measured at three different levels: nucleotide, exon,and gene. At the nucleotide and exon levels, we computeessentially the proportion of actual coding nucleotides/exonsthat have been correctly predicted—which we call sensitivity—and the proportion of predicted coding nucleotides/exonsthat are actually coding nucleotides/exons—which we callspecificity. To compute these measures at the exon level, wewill assume that an exon has been correctly predicted onlywhen both its boundaries have been correctly predicted. Tosummarize both sensitivity and specificity, we compute the cor-relation coefficient at the nucleotide level, and the average ofsensitivity and specificity at the exon level. At the exon level,we also compute the missing exons, the proportion of actualexons that overlap no predicted exon, and the wrong exons,the proportion of predicted exons that overlap no real exons.
At the gene level, a gene is correctly predicted if all of thecoding exons are identified, every intron–exon boundary iscorrect, and all of the exons are included in the proper gene.In addition, we compute the missed genes (MGs), real genesfor which none of its exons are overlapped by a predictedgene, and the wrong genes (WGs), predictions for which noneof the exons are overlapped by a real gene. In general, genefinders predict the initial and terminal exons very poorly.This often leads to so-called chimeric predictions—one pre-dicted gene encompassing more than one real gene—or tosplit predictions—one real gene split in multiple predictedgenes. Reese et al. (2000) developed two measures, split genes(SG) and joined genes (JG), to account for these tendencies.SG is the total number of predicted genes overlapping realgenes divided by the number of genes that were split. Simi-larly, JG is the total number of real genes that overlap pre-dicted genes divided by the number of predicted genes thatwere joined.
RESULTS
Benchmarking SGP2We evaluated the accuracy of SGP2 using a number of differ-ent data sets. The lack of a gold standard of gene predictionmakes it difficult to get accurate assessments from any singledata set. We primarily used three data sets as described earlier.
To benchmark SGP2, we constructed BLAST databasesfrom the mouse and human sections of SCIMOG and MIT,and each mouse/human sequence to the entire human/mouse database, respectively. This enabled us to predict genesin both the mouse and human databases. The results from
Table 1. Gene Prediction in the SCIMOG Data Set
Program
Nucleotide Exon
Sn Sp CC Sn Sp (Sn+Sp)/2 ME WE
GENSCAN 0.98 0.86 0.92 0.84 0.75 0.79 0.04 0.14TBLASTX default 0.89 0.76 0.81 0.81 — — 0.19 0.11SGP2 (single complete genes) 0.97 0.98 0.97 0.89 0.89 0.89 0.03 0.03SGP2 (multiple genes) 0.94 0.97 0.95 0.80 0.87 0.83 0.10 0.02
Parra et al.
112 Genome Researchwww.genome.org
3.2. SGP2: Syntenic Gene Prediction Tool 25

comparing SGP2, GENSCAN, and ROSSETA accuracy values inthis case are taken from Batzoglou et al. (2000), and the resultsof a simple TBLASTX search on the MIT data set are in Table2 (below). For the TBLASTX searches, the maximum scoringprojection of the HSPs (see the above section titled “SGP2”) wasassumed to be the gene prediction. The score cutoff for theHSPs was chosen to maximize the correlation coefficient (CC)between the projected HSPs and the coding exons. In Table1,2, we report the accuracy of GENSCAN, SGP2, and TBLASTXon the SCIMOG dataset. The accuracy values for SGP2 arereported under two scenarios: assuming a single completegene and assuming multiple genes. Both GENEID and SGP2allow the external specification of a gene model (i.e., a smallnumber of rules specifying the legal assemblies of exons intogene structures). These rules can be used to force SGP2 topredict a single complete gene to make the results comparableto those of ROSSETA. Without such a restriction (i.e., makingno assumptions about the number and completeness of thegenes potentially encoded in the query sequence), the resultsare more directly comparable to those of GENSCAN (althoughGENSCAN also has a tendency to start a prediction in anysequence with an initial exon, and to terminate it with aterminal exon).
The accuracy of SGP2 is comparable to that of ROSSETA,and is significantly higher than that of GENSCAN. SGP2 alsoimproves substantially over a simple TBLASTX search. Therelative low specificity of the TBLASTX search—even after thelarge penalties for stop codons—reflects the fact that a sub-stantial fraction of the conservation between the human andmouse genomes extends into the noncoding regions (MouseGenome Sequencing Consortium 2002). At the nucleotidelevel, SGP2 accuracy is almost equal in the MIT data set andthe SCIMOG data set (even though the SGP2 was trained onSCIMOG). The accuracy at the exact exon level, however, de-creases, in particular when prediction of multiple genes isallowed. This is a problem inherited from GENEID, whichtends to replace short initial and terminal exons with longerinternal exons.
Accuracy of SGP2 as a Function of the Coverageof the Mouse GenomeTo investigate the utility of partial shotgun data as informantsequence in our approach based on TBLASTX, we simulatedshotgun mouse sequence data at different levels of coverage(1.5x, 3x, and 6x) from the mouse genes in the SCIMOG dataset, and used them to compare the human sequences inSCIMOG using TBLASTX. The mouse genomic sequences wasshredded with uniformly distributed length between 500 and600 bp with random starting points. No sequencing errorswere introduced. At each coverage, we measured the CC be-
tween the TBLASTX hits projected along the human genomesequence, and the coding exons (choosing the TBLASTX scorecutoff resulting in the optimal CC). With 1.5x coverage, asubstantial fraction of the human coding region is not iden-tified by TBLASTX, whereas with 3x, the results are quite simi-lar to those obtained with 6x, which are identical to thoseobtained with the fully assembled syntenic regions (Table 3).This indicates that even with 3x coverage of the informantgenome, our method will produce results nearly identical tothose obtained with fully assembled regions. Assembled ge-nomes, however, result in faster TBLASTX searches.
Accuracy of SGP2 in Human Chromosome 22Human chromosome 22 was the first human chromosomefully sequenced (Dunham et al. 1999), and it is quite the bestannotated thus far, due to a number of experimental fol-lowups (Das et al. 2001; Shoemaker et al. 2001). Therefore, itprovides an excellent data set to validate any gene predictiontechnology. Human chromosome 22 was searched usingTBLASTX against the masked whole-genome assembly fromthe mouse genome (MGSCv3). The HSPs in chromosomal co-ordinates resulting from the TBLASTX search were used inGENEID to perform SGP2 gene prediction. Although the HSPshad been computed on the masked sequence, in this case theSGP2 predictions were obtained on the unmasked one. SGP2predicted 729 genes on human chromosome 22. Table 4shows the comparative accuracy of the SGP2, GENSCAN,GENOMESCAN, and pure ab initio GENEID predictions (with-out TBLASTX data). GENSCAN predictions on the masked se-quence were taken from the USCS genome browser http://genome.cse.ucsc.edu/. GENOMESCAN predictions were ob-tained from ftp://ftp.ncbi.nih.gov/genomes/H_sapiens/build28_chr_genomescan.gtf.gz. Pure ab initio GENEIDpredictions were obtained on the masked sequence, andcan also be downloaded from http://www1.imim.es/genepredictions/.
Although SGP2 is not more sensitive than GENSCAN, itappears to be more specific (as it utilizes the mouse genome).
Table 2. Gene Prediction Accuracy in the MIT Data Set
Program
Nucleotide Exon
Sn Sp CC Sn Sp (Sn+Sp)/2 ME WE
GENSCAN 0.98 0.89 0.93 0.82 0.75 0.78 0.06 0.13ROSSETA 0.95 0.97 — — — — 0.02 0.03TBLASTX default 0.94 0.79 0.85 — — — 0.13 0.13SGP2 (single complete genes) 0.97 0.98 0.97 0.84 0.85 0.84 0.05 0.03SGP2 (multiple genes) 0.96 0.97 0.96 0.71 0.79 0.75 0.12 0.03
Table 3. Accuracy of TBLASTX Predictions as a Function ofthe Degree of Coverage in the SCIMOG Data Set
Coverage
Nucleotide Exon
Sn Sp CC ME WE
Simulated 1.5x 0.79 0.78 0.77 0.25 0.10Simulated 3x 0.86 0.76 0.80 0.21 0.11Simulated 6x 0.89 0.76 0.81 0.19 0.11Fully assembled 0.89 0.76 0.81 0.19 0.11
Comparative Gene Prediction in Human and Mouse
Genome Research 113www.genome.org
26 Chapter 3. Comparative Gene Finding

Fifty percent of the GENSCAN-predicted exons do not overlapannotated chromosome 22 exons; this number is only 31%for SGP2. Overall, SGP2 appears to be more accurate thanGENSCAN in human chromosome 22: GENSCAN’s CC at thenucleotide level is 0.64, whereas that of SGP2 is 0.73. Al-though accuracy decreases for both programs when goingfrom single-gene sequences (Tables 1, 2) to an entire chromo-some, SGP2 retains more accuracy. GENSCAN overall showshigher sensitivity than SGP2, but there were 45 real genes notpredicted by GENSCAN on human chromosome 22, andSGP2 was able to predict, at least partially, 15 of them. Thissuggests that SGP2 and GENSCAN may play complementaryroles. GENOMESCAN, on the other hand, did not appear to besuperior to GENSCAN in human chromosome 22.
Mouse matches (TBLASTX HSPs) covered 11% of the hu-man chromosome 22. Though they covered 85% of the cod-ing nucleotides, 74% of the HSPs fell outside annotated cod-ing regions. This illustrates the difficulties of using genomesequence conservation even at the protein level between hu-man and mouse genomes to infer coding genes.
Prediction of Genes in the Human andMouse GenomesWe used SGP2 to predict the entire complement of human(NCBI28) and mouse (MGSCv3) genes. The masked sequencesof these two genomes were compared using TBLASTX. TheTBLASTX HSPs were used within SGP2. SGP2 predicted 44,242genes in the human genome, and 44,777 genes in the mousegenome. Obviously, it is difficult to accurately assess thesepredictions. We used ENSEMBL genes as the set of referenceannotations and compared both GENSCAN and SGP2 predic-tions to it. Figure 3 shows summaries of the accuracy of SGP2at the chromosome level in the human and mouse genomes.When compared against ENSEMBL, SGP2 is more accuratethan GENSCAN.GENSCAN. It is more specific at the nucleo-tide level: the average SGP2 specificity is 0.60 for human and0.61 for mouse, whereas these values for GENSCAN are 0.43and 0.44. SGP2 is also equally sensitive at the nucleotide level:The average SGP2 sensitivity is 0.82 for human and 0.85 formouse; these values for GENSCAN are 0.82 and 0.84. Overall,the average SGP2 CCs are 0.70 for human and 0.72 for mouse,and for GENSCAN, the respective averages are 0.59 and 0.61.The accuracy of the SGP2 predictions, moreover, appears tobe more consistent across chromosomes than that of theGENSCAN predictions. Interestingly, human chromosome Yis an outlier, with genes in this chromosome being poorlypredicted. Genes in chromosome Y appear to be more difficultto predict than genes in other chromosomes for pure ab initiogene prediction programs, because chromosome Y is also an
outlier for GENSCAN. SGP2 suffers, in addition, on humanchromosome Y because the mouse chromosome Y has yet tobe sequenced, and thus there was no comparative informa-tion available.
Overall, 23,913 of the human predictions and 24,203 ofthe mouse predictions overlapped ENSEMBL genes, whereas95% of the mouse and 93% of the human ENSEMBL geneswere among the genes predicted by SGP2. Of the remainingputative novel 20,570 mouse SGP2 genes and 20,193 humanSGP2 genes, 10,456 mouse and 9,006 human predictions werefound to be similar at P < 10�6 to a prediction in the coun-terpart genome. Of these, 5,960 and 4,909 have multiple ex-ons and are longer than 300 bp. A significant fraction of theseputative homologous predictions are likely to correspond toreal genes (Guigo et al. 2003). The predictions are interac-tively accessible through the USCS genome browser (http://genome.cse.ucsc.edu/) and through the DAS server atENSEMBL (http://www.ensembl.org, under “DAS sources”).The complete set of prediction files is available at http://www1.imim.es/genepredictions/.
Speeding Up TBLASTX SearchesUsing TBLASTX to compare human and mouse whole-genome sequences, even in masked form, is quite expensivecomputationally because of the 6-frame translation on bothquery and target. To substantially reduce the search time, weused a word size of 5 and sacrificed some sensitivity (see thesection above titled “Accelerating TBLASTX Searches” for de-tails). We also penalized stop codons heavily and did not per-mit gaps. The computation took an estimated 500 CPU dayson a farm of Compaq Alphas.
Accuracy in Tables 1 and 2 was computed using defaultTBLASTX parameters. Table 5 shows the comparative accu-racy of TBLASTX and SGP2 predictions, under the default andthe speed-up configuration of TBLASTX parameters on theSCIMOG data set. The sensitivity of speed-up TBLASTXsearches drops from 0.89 to 0.72, but specificity increasesslightly. SGP2 is more robust, and it compensates for some ofthe sensitivity lost in the TBLASTX search. Overall accuracyfor SGP2, as measured by the CC, drops only from 0.95 to0.93.
Predictions on human chromosome 22 and the wholehuman and mouse genomes have been obtained with thisspeed-up configuration of parameters.
DISCUSSIONWe have described the program SGP2 for comparative genefinding, and presented the results of its application to thehuman and mouse genome sequences. Results in controlledbenchmark sequence data sets indicate that, by including in-
Table 4. Accuracy of Gene-finding Programs on Human Chromosome 22
Program
Nucleotide Exon Gene
Sn Sp CC Sn Sp (Sn+Sp)/2 ME WE Sn Sp (Sn+Sp)/2 MG WG JG SG
GENSCAN 0.86 0.50 0.64 0.70 0.40 0.55 0.13 0.50 0.06 0.04 0.05 0.11 0.45 1.24 1.07GENOMESCAN 0.87 0.44 0.59 0.72 0.36 0.54 0.10 0.55 0.11 0.06 0.08 0.12 0.52 1.07 1.14GENEID 0.80 0.63 0.69 0.66 0.53 0.59 0.19 0.35 0.09 0.07 0.08 0.14 0.39 1.20 1.08TBLASTX 0.84 0.39 0.54 — — — 0.12 0.74 — — — 0.11 — — —SGP2 0.83 0.67 0.73 0.68 0.56 0.62 0.16 0.31 0.13 0.10 0.11 0.14 0.36 1.14 1.13
Parra et al.
114 Genome Researchwww.genome.org
3.2. SGP2: Syntenic Gene Prediction Tool 27

formation from genome sequence conservation, predictionsby SGP2 appear to be more accurate than those obtained bypure ab initio programs, exemplified here by GENSCAN andGENEID. Although there is not a significant gain in sensitiv-ity, the specificity of the predictions appears to increase sub-stantially, and a smaller number of false positive exons arepredicted.
Indeed, one the major obstacles towards the completionof the catalog of human (mammalian) genes is our inability toassess the reliability of the large number of computationalgene predictions that have not been verified experimentally.Whereas the ENSEMBL pipeline produces about 25,000 hu-man and mouse genes, the NCBI annotation pipeline predictsalmost 50,000 genes inmouse, and the programGENOMESCANpredicts close to 55,000 genes in this species. Although a largefraction of the ENSEMBL genes correspond to computationalpredictions without experimental verification, the method is
quite conservative, and recent ex-periments suggest that essentiallyall ENSEMBL genes are indeed real(Guigo et al. 2003). The problemremains with the tens of thousandsof additional computational predic-tions that are not included inENSEMBL. A fraction of them arelikely to be real, but the question ishow large this fraction is. The re-sults obtained here in human chro-mosome 22 seem to indicate that itmay not be very large. Although theexistence of hundreds of unidenti-fied genes in this chromosome can-not be completely ruled out, the re-sults strongly suggest that a sub-stantial fraction of these additionalcomputational gene predictions arefalse positives.
In this regard, the results pre-sented here demonstrate thatthrough the comparison of the hu-man and mouse genomes usingSGP2 (or another available com-parative gene prediction tool), thefalse-positive rate can be reducedsignificantly, and the catalog ofmammalian genes better defined.SGP2 predicts a few thousand can-didate genes not in ENSEMBL thatwe believe are worth verifying ex-perimentally. Indeed, the experi-mental verification of a subset ofthese provides evidence of at least1000 previously nonconfirmedgenes (Guigo et al. 2003).
The predictions by SGP2 ob-tained here are, of course, still farfrom definitively setting this cata-log. For one thing, the mouse maybe too close a species to human: Alarge fraction of the sequence hasbeen conserved between the ge-nomes of these two species. Indeed,most sequence conservation be-tween human and mouse does not
correspond to coding exons (Mouse Genome Sequencing Con-sortium 2002), compounding gene prediction. This suggeststhat the genome of another vertebrate species evolutionarilylocated between fish and mammals could be of great utility to-wards closing in the vertebrate (and mammalian) gene catalog.
SGP2 is flexible enough so that it can be easily accom-modated to analyze species other than human and mouse.The fact that it can deal with shotgun data at any level ofcoverage means that as the sequence of a new genome startsbecoming available, it can be used to improve the annotationof other already existing genomes. Particularly relevant in thiscontext is a feature of SGP2 (and GENEID) that we have notexplored here. SGP2 can produce predictions on top of pre-existing annotations. For instance, we could have given toSGP2 the location and exonic coordinates (in GFF format) ofknown REFSEQ genes (or ENSEMBL), and SGP2 would havepredicted genes only outside the boundaries of these genes of
Figure 3 Accuracy of the human and mouse SGP2 and GENSCAN predictions. The accuracy wasmeasured in the entire chromosome sequences using the standard accuracy measures: SN, (sensitiv-ity); SP, (specificity); CC, (correlation coefficient); SNe, (exon sensitivity); SPe, (exon specificity); andSNSP, (average of sensitivity and specificity at exon level). Predictions from both programs werecompared against the human and mouse ENSEMBL annotations. Each dot corresponds to the accuracymeasure of one chromosome. Chromosome labels are shown for outlier values. The boxplots (Tukey1977) were obtained using the R-package (http://cran.r-project.org/).
Comparative Gene Prediction in Human and Mouse
Genome Research 115www.genome.org
28 Chapter 3. Comparative Gene Finding

already well known exonic structure. Preliminary results in-dicate that this approach improves gene prediction outside ofthe preassumed genes, and reduces the rate of chimeric pre-dictions (i.e., predictions encompassing multiple genes).Moreover, we believe that SGP2 can be substantially im-proved. The flexibility of the SGP2/GENEID framework makesit quite easy to integrate additional information that can con-tribute to the accuracy of the predictions: synonymous versusnonsynonymous substitution rates in the alignments byTBLASTX, conservation of the splice signals in the informantgenome, amino acid substitution matrices specific to the phy-logenetic distance between the species compared, etc.
In this regard, the reasons to use the default BLOSUM62matrix are not obvious. Given the expected sequence similar-ity between mouse–human orthologs, BLOSUM80 appears tobe a better choice. However, we intended to also detect diver-gent families. Towards that end, the superiority of BLOSUM80is less clear. We have compared TBLASTX search results onhuman chromosome 22 against the whole mouse genome.Whereas the HSPs resulting from the BLOSUM62 search cover84% of the chromosome 22 coding nucleotides, BLOSUM80HSPs cover 88% of them. However, BLOSUM80 is much lessspecific than BLOSUM62: 60% of the nucleotides in theBLOSUM62 HSPs fall outside coding regions, compared to88% for BLOSUM80. It is thus clear that the optimal matrix orcombination of matrices for comparative gene-finding usingTBLASTX requires further investigation.
Although a large fraction of the human genome se-quence has been known for more than a year, the exact num-ber of human genes and their precise definition remain un-known. Gene specification in higher eukaryotic sequences isthe result of the complex interplay of sequence signals en-coded in the primary DNA sequence, which is only partiallyunderstood. Without an exhaustive catalog of human genes,however, the promises of genome research in medicine andtechnology cannot be completely fulfilled. The work pre-sented here, in which it is shown that human–mouse com-parisons can contribute to the completion of the mammalian(human) gene catalog, underscores the importance of thecomparisons of the genomes of different organisms to fullyunderstand the phenomenon of life, and in particular to de-ciphering the mechanism, central to life, by means of whichthe genome DNA sequence specifies the amino acid sequenceof the proteins.
ACKNOWLEDGMENTSWe thank the Mouse Genome Sequencing Consortium forproviding the mouse genome sequence as well as supportthroughout the analysis process. We especially thank Fran-cisco Câmara for arranging the data listed in the gene-prediction page on our group Web site, and for setting up andtaking care of our DAS server. We also thank Ian Korf for
inspiring discussions regarding the parameters to use in theTBLASTX search. We thank Enrique Blanco, Sergi Castellano,and Moisés Burset for helpful discussions and constant en-couragement. This work was supported by a grant from PlanNacional de I+D (BIO2000-1358-C02-02), Ministerio de Cien-cia y Tecnologia (Spain), and from a fellowship to J.F.A. fromthe Instituto de Salud Carlos III (99/9345).
The publication costs of this article were defrayed in partby payment of page charges. This article must therefore behereby marked “advertisement” in accordance with 18 USCsection 1734 solely to indicate this fact.
REFERENCESAltschul, S.F., Gish, W., Miller, W., Myers, E.W., and Lipman, D.
1990. Basic local alignment search tool. J. Mol. Biol.215: 403–410.
Altschul, S.F., Madden, T., Schaffer, A., Zhang, J., Zhang, Z., Miller,W., and Lipman, D. 1997. Gapped BLAST and PSI-BLAST: A newgeneration of protein database search programs. Nucleic Acids Res.25: 3389–3402.
Bafna, V. and Huson, D.H. 2000. The conserved exon method. Proc.Int. Conf. Intell. Syst. Mol. Biol. 8: 3–12.
Batzoglou, S., Pachter, L., Mesirov, J.P., Berger, B., and Lander, E.S.2000. Human and mouse gene structure: Comparative analysisand application to exon prediction. Genome Res. 10: 950–958.
Birney, E. and Durbin, R. 1997. Dynamite: A flexible code generatinglanguage for dynamic programming methods used in sequencecomparison. Proc. Int. Conf. Intell. Syst. Mol. Biol. 5: 56–64.
Blayo, P., Rouzé, P., and Sagot, M.-F. 2002. Orphan genefinding—An exon assembly approach. Theoretical ComputerScience (in press).
Borodovsky, M. and McIninch, J. 1993. GenMark: Parallel generecognition for both DNA strands. Comput. Chem. 17: 123–134.
Burge, C.B. and Karlin, S. 1997. Prediction of complete genestructures in human genomic DNA. J. Mol. Biol. 268: 78–94.
Burge, C.B. and Karlin, S. 1998. Finding the genes in genomic DNA.Curr. Opin. Struct. Biol. 8: 346–354.
Burset, M. and Guigo, R. 1996. Evaluation of gene structureprediction programs. Genomics 34: 353–357.
Claverie, J.-M. 1997. Computational methods for the identificationof genes in vertebrate genomic sequences. Hum. Mol. Genet.6: 1735–1744.
Crollius, H.R., Jaillon, O., Bernot, A., Dasilva, C., Bouneau, L.,Fischer, C., Fizames, C., Wincker, P., Brottier, P., Quetier, F., etal. 2000. Estimate of human gene number provided bygenome-wide analysis using Tetraodon nigroviridis DNA sequence.Nat. Genet. 25: 235–238.
Das, M., Burge, C.B., Park, E., Colinas, J., and Pelletier, J. 2001.Assessment of the total number of human transcription units.Genomics 77: 71–78.
Dunham, I., Hunt, A.R., Collins, J.E., Bruskiewich, R., Beare, D.M.,Clamp, M., Smink, L.J., Ainscough, R., Almeida, J.P., Babbage, A.,et al. 1999. The DNA sequence of human chromosome 22.Nature 402: 489–495.
Durbin, R., Eddy, S., Crogh, A., and Mitchison, G. 1998. Biologicalsequence analysis: Probabilistic models of protein and nucleic acids.Cambridge University Press, Cambridge.
Gelfand, M.S., Mironov, A.A., and Pevzner, P.A. 1996. Generecognition via spliced alignment. Proc. Natl. Acad. Sci.93: 9061–9066.
Gish, W. and States, D. 1993. Identification of protein codingregions by database similarity search. Nat. Genet. 3: 266–272.
Table 5. Accuracy of TBLASTX and SGP2 Predictions Using “Default” versus Speed-Up Parameters
Nucleotide Exon
Sn Sp CC Sn Sp (Sn+Sp)/2 ME WE
Default TBLASTX 0.89 0.76 0.81 — — — 0.19 0.11SGP2 0.94 0.97 0.95 0.80 0.87 0.83 0.10 0.02
Speed-up TBLASTX 0.72 0.80 0.75 — — — 0.22 0.10SGP2 0.88 0.98 0.93 0.77 0.85 0.81 0.12 0.02
Parra et al.
116 Genome Researchwww.genome.org
3.2. SGP2: Syntenic Gene Prediction Tool 29
Guigo, R. 1998. Assembling genes from predicted exons in lineartime with dynamic programming. J. Comp. Biol. 5: 681–702.
Guigo, R. and Wiehe, T. 2003. Gene prediction accuracy in largeDNA sequences. In Frontiers in computational genomic (eds. M.Y.Galperin and E.V. Koonin), Caister Academic Press, Norfolk, UK.
Guigo, R., Knudsen, S., Drake, N., and Smith, T.F. 1992. Predictionof gene structure. J. Mol. Biol. 226: 141–157.
Guigo, R., Agarwal, P., Abril, J.F., Burset, M., and Fickett, J.W. 2000.Gene prediction accuracy in large DNA sequences. Genome Res.10: 1631–1642.
Guigó, R., Dermitzakis, E.T., Agarwal, P., Pontig, C.P., Parra, G.,Reymond, A., Abril, J.F., Keibler, E., Lyle, R., Ucla, C., et al. 2003.Comparison of mouse and human genomes followed byexperimental verification yields an estimated 1,019 additionalgenes. Proc. Natl. Acad. Sci. (in press).
Haussler, D. 1998. Computational genefinding. Trends in biochemicalsciences, supplementary guide to bioinformatics, pages 12–15.
Jareborg, N., Birney, E., and Durbin, R. 1999. Comparative analysisof noncoding regions of 77 orthologous mouse and human genepairs. Genome Res. 9: 815–824.
Korf, I., Flicek, P., Duan, D., and Brent, M.R. 2001. Integratinggenomic homology into gene structure prediction. Bioinformatics17 Suppl 1: 140–148.
Meyer, I.M. and Durbin, R. 2002. Comparative ab initio predictionof gene structures using pair HMMs. Bioinformatics18: 1309–1318.
Miller, W. 2001. Comparison of genomic DNA sequences: Solvedand unsolved problems. Bioinformatics 17: 391–397.
Mouse Genome Sequencing Consortium 2002. Initial sequencingand comparative analysis of the mouse genome. Nature 420:520–562.
Pachter, L., Alexandersson, M., and Cawley, S. 2002. Applications ofgeneralized pair hidden Markov models to alignment and genefinding problems. J. Comp. Biol. 9: 389–400.
Parra, G., Blanco, E., and Guigo, R. 2000. Geneid in Drosophila.Genome Res. 10: 511–515.
Pedersen, C. and Scharl, T. 2002. Comparative methods for genestructure prediction in homologous sequences. In Algorithms inBioinformatics (eds. R. Guigo, and D. Gusfield), Springer-Verlag,Berlin, Germany.
Reese, M.G., Hartzell, G., Harris, N.L., Ohler, U., Abril, J.F., andLewis, S.E. 2000. Genome annotation assessment in Drosophilamelanogaster. Genome Res. 10: 483–501.
Rinner, O. and Morgenstern, B. 2002. Agenda: Gene prediction bycomparative sequence analysis. In Silico Biol. 2: 0018.
Rogic, S., Mackworth, A.K., and Ouellette, F. 2001. Evaluation ofgene-finding programs on mammalian sequences. Genome Res.11: 817–832.
Shoemaker, D.D., Schadt, E.E., Armour, C.D., He, Y.D.,Garrett-Engele, P., McDonagh, P.D., Loerch, P.M., Leonardson,
A., Lum, P.Y., Cavet, G., et al. 2001. Experimental annotation ofthe human genome using microarray technology. Nature409: 922–927.
Tukey, J.W. 1977. Exploratory data analysis. pp. 39–41.Addison-Wesley, Boston, MA.
Wiehe, T., Guigo, R., and Miller, W. 2000. Genome sequencecomparisons: Hurdles in the fast lane to functional genomics.Brief. Bioinform. 1: 381–388.
Wiehe, T., Gebauer-Jung, S., Mitchell-Olds, T., and Guigo, R. 2001.SGP-1: Prediction and validation of homologous genes based onsequence alignments. Genome Res. 11: 1574–1583.
Yeh, R., Lim, L., and Burge, C. 2001. Computational inference ofhomologous gene structures in the human genome. Genome Res.11: 803–816.
Zhang, M.Q. 2002. Computational prediction of eukaryoticprotein-coding genes. Nat. Rev. Genet. 3: 698–709.
WEB SITE REFERENCEShttp://www.sanger.ac.uk/Software/formats/GFF/; GFF format
description page.http://genome.cse.ucsc.edu/goldenPath/22dec2001/; Human genome
sequence goldenpath from Dec. 22, 2001 (hg10) equivalent toNCBI28 build.
http://genome.cse.ucsc.edu/goldenPath/mmFeb2002/; Mousegenome sequence goldenpath from Feb. 2002 (mm2) equivalentto MGSCv3.
http://www.cs.columbia.edu/∼vic/sanger2gbd; Victoria Haghighi,Human chromosome 22 curated annotations.
ftp://ftp.ncbi.nih.gov/genomes/H_sapiens/build28_chr_genomescan.gtf.gz; Genomescan predictions from NCBI.
http://genome.cse.ucsc.edu/goldenPath/mmFeb2002/database/ensGene.txt.gz; Mouse ENSEMBL annotations file.
http://blast.wustl.edu; Washington University BLAST Archiveshttp://genome.cse.ucsc.edu/goldenPath/22dec2001/database/
ensGene.txt.gz; Human ENSEMBL annotations file.http://genome.cse.ucsc.edu; UCSC genome browser.http://www.ensembl.org; ENSEMBL genome browser.http://www1.imim.es/genepredictions/; GENEID and SGP2 full data
predictions.http://www1.imim.es/software/sgp2/; SGP2 home page.http://www1.imim.es/datasets/sgp2002/; SGP2 training data sets
page.
Received November 4, 2002; accepted in revised form November 15, 2002.
Comparative Gene Prediction in Human and Mouse
Genome Research 117www.genome.org
30 Chapter 3. Comparative Gene Finding

3.2. SGP2: Syntenic Gene Prediction Tool 31
3.2.2 IMGSC, Nature, 420(6915):520–562, 2002
PubMed Accession:http://www.ncbi.nlm.nih.gov/entrez/query.fcgi?cmd=Retrieve&db=PubMed&list_uids=12466850&dopt=Abstract
Journal Abstract:http://www.nature.com/cgi-taf/DynaPage.taf?file=/nature/journal/v420/n6915/abs/nature01262_fs.html
Supplementary Materials:http://www.nature.com/nature/journal/v420/n6915/suppinfo/nature01262.htmlhttp://genome.imim.es/datasets/mouse2002/
NOTE: Because of copyright restrictions, we cannot offer the article, please follow links for fulltext.

3.3. Validation of Results from Gene Predictors 51
3.3 Validation of Results from Gene Predictors
Annotations from computational gene-finding can be seen as hypotheses about given lociin a genomic sequence encoding cellular functions. Therefore, we initially need to test oneof such tools against a controlled data set of reliable annotations to determine its perfor-mance. On the other hand, evaluation of predicted genes will be part of the parametersestimation for such software. An iterative procedure may test different program settingsunder a fixed control set of training sequences in order to determine the parameters thatgive the best results.
3.3.1 Measures of gene prediction accuracy
To evaluate the accuracy of a gene prediction program, the gene structure predicted bythe program is compared with the structure of the actual gene encoded in the problemsequence. As extensively discussed in Burset and Guigó [1996], the accuracy can be eva-luated at three different levels of resolution: the nucleotide, exon, and gene levels. Theselevels offer complementary views of the accuracy of the program. At each level, there aretwo basic measures: sensitivity and specificity. Briefly, sensitivity (Sn) is the proportionof real elements (coding nucleotides, exons or genes) that have been correctly predicted,while specificity (Sp) is the proportion of predicted elements that are correct. More spe-cifically, if true positive (TP) is the total number of coding elements correctly predicted;true negative (TN), the number of correctly predicted non-coding elements; false positive(FP) the number of non-coding elements predicted as coding; and false negative (FN) thenumber of coding elements predicted as non-coding. Then, in the gene finding literature,Sn is defined as:
Sn =TP
TP + FN,
and Sp as:
Sp =TP
TP + FP.
Both Sn and Sp take values from 0 to 1, with perfect prediction when both measuresare equal to 1. Neither Sn nor Sp alone constitute good measures of global accuracy, sincehigh sensitivity can be reached with low specificity and vice versa. It is desirable to use asingle measure for accuracy. In gene finding literature, the preferred such measure at thenucleotide level is the Correlation Coefficient (CC), which is defined as:
CC =(TP × TN)− (FN × FP)√
(TP + FN)× (TN + FP)× (TP + FP)× (TN + FN),
and ranges from -1 to 1, with 1 corresponding to a perfect prediction, and -1 to a predictionin which each coding nucleotide is predicted as non-coding and vice versa.
At exon level, these measures determine if predictions correspond to real exons, withthe exon boundaries perfectly predicted. The prediction is considered incorrect if only a

52 Chapter 3. Comparative Gene Finding
single base does not correspond to the coordinates of the real exon. Therefore, Sn at exonlevel measures the proportion of actual exons that have been correctly predicted, and Spmeasures the proportion of predicted exons that correspond to actual exons. The averageexon prediction accuracy SnSp is computed as:
SnSp =Sn + Sp
2.
Apart from Sn, Sp and SnSp, two extra measures are used to determine the accuracyat exon level: the missed exons (ME) and the wrong exons (WE). ME measures howfrequently a predictor completely failed to identify exons (no prediction overlap at all)whereas WE identifies the ratio of exons that do not overlap with any exon of the trainingdata set.
At gene level Sn and Sp measure if a predictor is able to correctly identify and assembleall of the exons of a gene. For a prediction to be counted as TP, all coding exons mustbe identified, every intron-exon boundary must match exactly, and all the exons must beincluded in the right gene. In addition, missed genes (MG) and wrong genes (WG) can alsobe computed in the same way as at the exon level.
The exon level scores discussed above measure how well a predictor recognizes ex-ons and gets their boundaries exactly correct. The gene level scores measure how well apredictor can recognize exons and assemble them into complete genes. In general, genefinders predict the initial and terminal exons very poorly. This often leads to so-calledchimeric predictions—one predicted gene encompassing more than one real gene—or tosplit predictions—where one real gene split in multiple predicted genes. Reese et al. [2000]developed two measures to account for these tendencies: split genes (SG) and joined genes(JG). SG is the total number of predicted genes overlapping real genes divided by thenumber of genes that were split. Similarly, JG is the total number of real genes that overlappredicted genes divided by the number of predicted genes that were joined. A score of 1 isperfect and means that each of the genes from the real genes set overlaps exactly one genefrom the set of predicted genes.
3.3.2 Evaluating computational gene-finding results
The evaluations by Burset and Guigó [1996], Rogic et al. [2001], and others suffered fromthe same limitation: gene finders were tested in controlled data sets made of short genomicsequences encoding a single gene with a simple gene structure. These datasets are notrepresentative of the genome sequences that are currently being produced: large sequencesof low coding density, encoding several genes and/or incomplete genes, with complexgene structures. This was addressed in the acompanying research article in section 3.3.3,page 54. Table 3.2 on page 56 (Table 1 on page 1632 of Guigó et al. 2000) summarizes theresults of different gene finding tools in a set of single gene sequences.
The Genome Annotation Assessment Project (GASP) was the first attempt to test theavailable gene-prediction tools with a well annotated genomic sequence. The 2.9Mb Adhregion from Drosophila melanogaster was chosen to provide both curated training datasetsfor the programs and a set of curated annotations to evaluate predictions with them. Ta-ble 3.4 on page 79 (Table 3 on page 494 of Reese et al. 2000) sums up the results of thegene-finding tools that were evaluated in this experiment.

3.3. Validation of Results from Gene Predictors 53
Table 3.1 on page 27 (Table 4 on page 114 of Parra et al. 2003) reports the accuracy ofgene-finding programs, including geneid and SGP2, on human chromosome 22. For thehuman and mouse comparative analysis we ended up with lots of tables taking into ac-count results for each chromosome sequence and each program, and the evaluations weremade with different reference annotation sets. The box-plots shown on Figure 3.5, page 28(Figure 3 on page 115 of Parra et al. 2003), illustrate the differences between gene-findingtools better. This graphical representation provides a compact summary of the differentmeasures being compared, but also shows the dispersion distribution of the data and theoutliers. One of the most interesting outliers in the human-mouse analysis was chromo-some Y, for which the comparative gene-finding approaches were yielding results similarto those of the “ab initio” tools. Of course, this was a result of the lack of orthologous se-quences between human and mouse, because for the rodent only female DNA sampleswere used for sequencing.
In Guigó et al. [2003], a protocol for selecting computational predictions to be testedby experimental means, via RT-PCR in this case, is described. SGP2results from the geneprediction pipeline, detailed in section 3.2, were classified into three groups in functionof the homolgy between the human and mouse predictions and the conservation of theirexonic structures. Table 3.5 on page 92 (Table 1 on page 1143 of Guigó et al. 2003) sumarizesthe RT-PCR success rate within each of those groups. Figure 3.6 on page 39 (Figure 16 onpage 540 of Waterston et al. 2002) shows the structures, side by side, of a human and mousepredicted new homologue of dystrophin, for which an exon pair from the mouse gene wasverified by RT-PCR. Another example, a novel homolog to Drosophila melanogaster brain-specific homeobox protein, can be found on Figure 3.8, page 91, for which the primers andRT-PCR results are depicted on the same page in Figure 3.9 (Figures 2 and 3 on page 1142respectively, of Guigó et al. 2003). A database was built for the 476 gene structures thatwere tested by RT-PCR. It contains not only the sequences and coresponding annotationsfor those genes, but also the results yielded from each RT-PCR test done in 12 differentmouse tissues. Figure 3.10 on page 95 shows the web interface we have created for thatdatabase.
All results indicate that there is room for improvement in the computational gene pre-diction field. Efforts to provide more accurate gene-finding tools, as well as more reli-able annotations, are ongoing. The best example of such efforts is the ENCODE project[ENCODE Project Consortium, 2004]. During its pilot phase, the procedures that can beapplied cost-effectively and at high-throughput to accurately and comprehensively charac-terize large sequences, will be evaluated.

54 Chapter 3. Comparative Gene Finding
3.3.3 Guigó et al , Genome Research, 10(10):1631–1642, 2000
PubMed Accession:http://www.ncbi.nlm.nih.gov/entrez/query.fcgi?cmd=Retrieve&db=PubMed&list_uids=11042160&dopt=Abstract
Journal Abstract:
http://www.genome.org/cgi/content/abstract/10/10/1631
Supplementary Materials:
http://genome.imim.es/datasets/gpeval2000/

An Assessment of Gene Prediction Accuracy inLarge DNA SequencesRoderic Guigo,1,3 Pankaj Agarwal,2 Josep F. Abril,1 Moises Burset,1 andJames W. Fickett2
1Grup de Recerca en Informatica Medica, Institut Municipal d’Investigacio Medica, Universitat Pompeu Fabra, E-08003Barcelona, Spain; 2Department of Bioinformatics, SmithKline Beecham Pharmaceuticals Research and Development,King of Prussia, Pennsylvania 19406, USA
One of the first useful products from the human genome will be a set of predicted genes. Besides its intrinsicscientific interest, the accuracy and completeness of this data set is of considerable importance for human healthand medicine. Though progress has been made on computational gene identification in terms of both methodsand accuracy evaluation measures, most of the sequence sets in which the programs are tested are shortgenomic sequences, and there is concern that these accuracy measures may not extrapolate well to larger, morechallenging data sets. Given the absence of experimentally verified large genomic data sets, we constructed asemiartificial test set comprising a number of short single-gene genomic sequences with randomly generatedintergenic regions. This test set, which should still present an easier problem than real human genomic sequence,mimics the ∼200kb long BACs being sequenced. In our experiments with these longer genomic sequences, theaccuracy of GENSCAN, one of the most accurate ab initio gene prediction programs, dropped significantly,although its sensitivity remained high. Conversely, the accuracy of similarity-based programs, such asGENEWISE, PROCRUSTES, and BLASTX, was not affected significantly by the presence of random intergenicsequence, but depended on the strength of the similarity to the protein homolog. As expected, the accuracydropped if the models were built using more distant homologs, and we were able to quantitatively estimate thisdecline. However, the specificities of these techniques are still rather good even when the similarity is weak,which is a desirable characteristic for driving expensive follow-up experiments. Our experiments suggest thatthough gene prediction will improve with every new protein that is discovered and through improvements inthe current set of tools, we still have a long way to go before we can decipher the precise exonic structure ofevery gene in the human genome using purely computational methodology.
The nucleotide genomic sequence is the primary prod-uct of the Human Genome Project, but a major short-and mid-term interest will be the amino acid sequencesof the proteins encoded in the genome. Thus, methodsthat reliably predict the genes encoded in genomic se-quence are essential, and computational gene identifi-cation continues to be an active field of research (forreviews, see Fickett 1996; Claverie 1997; Guigo 1997a;Burge and Karlin 1998; Haussler 1998). A new genera-tion of gene prediction programs based on HiddenMarkov Models (Burge and Karlin 1997) have shownsignificantly greater accuracy than previous programsbased on other methodologies (Burset and Guigo1996). Conversely, as the databases of known codingsequences increase in size, gene prediction methodsbased on sequence similarity to coding sequences,mainly proteins and ESTs, are becoming increasinglyuseful and are routinely used to identify putative genesin genomic sequences (The C. elegans Sequencing Con-sortium 1998). We have recently published an evalua-
tion of sequence similarity-based gene predictionmethods, in particular of EST-based gene prediction(Guigo et al. 2000). The accuracy of gene identificationprograms, however, has usually been estimated oncontrolled data sets made of short genomic sequencesencoding a single and complete gene with a simplestructure. Moreover, these data sets are often similar ifnot overlapping, to the sets of sequences on which theprograms have been trained. Thus, these data sets arenot representative of the sequences being produced atthe genome centers, which are mostly large sequencesof low coding density, encoding several genes or in-complete genes with complex gene structure. It is thusdifficult to know how well the figures of accuracy es-timated in the controlled benchmark data sets extrapo-late to actual genomic sequences. Furthermore, pro-grams that combine both sequence similarity and abinitio gene finding approaches, and those that predictgenes by producing a splicing alignment between agenomic sequence and a candidate amino acid se-quence have become recently available, such as PRO-CRUSTES (Gelfand et al. 1996) and GENEWISE (Birneyand Durbin 1997), (http://www.sanger.ac.uk/Software/Wise2/). Programs that align genomic sequences with
3Corresponding author.E-MAIL [email protected]; FAX 3493-221-3237.Article and publication are at www.genome.org/cgi/doi/10.1101/gr.122800.
Methods
10:1631–1642 ©2000 by Cold Spring Harbor Laboratory Press ISSN 1088-9051/00 $5.00; www.genome.org Genome Research 1631www.genome.org
3.3. Validation of Results from Gene Predictors 55

EST sequences, such as EST GENOME (Mott 1997),could also be included in this category. These programspromise highly accurate predictions, but at the cost ofgreater computational time. However, this increase inaccuracy has not been well-quantified on challengingdata sets. The effects of the degree of similarity be-tween the candidate homolog and the genomic se-quence also deserve careful evaluation.
We believe a more realistic evaluation of the cur-rently available gene prediction tools on challengingdata sets would be useful. Ideally, one would like tobenchmark the computational gene identification pro-grams in real genomic sequences. The main problem isthat most real sequences the structure of the genes hasnot been verified exhaustively by experimental means,and thus it is impossible to calibrate the accuracy of thepredictions. Only recently, extensively annotated largegenomic sequences from higher eukaryotic organismshave become available from the human genome(http://www.hgmp.mrc.ac.uk/Genesafe) and from thefly genome (http://www.fruitfly.org/GASP1/). In spiteof the experimental analysis, the possibility of unde-tected genes in the sequence cannot be easily ruled out,which makes accuracy difficult to measure. Here, weattempt to overcome the lack of well-annotated largegenomic sequences by constructing semiartificial ones.In these semiartificial sequences, known genomic se-quences have been embedded in simulated intergenicDNA, and therefore, the location of all coding exons isknown. Although the approach may seem unrealistic,we believe that the results obtained are instructive withregard to the accuracy of currently available gene iden-tification tools.
We evaluate the accuracy of representatives of awide variety of computational gene identification ap-proaches: GENSCAN (Burge and Karlin 1997), an ab ini-tio genefinder; BLASTX (Altschul et al. 1990; Gish andStates 1993), a genefinding-oriented similarity searchprogram; and PROCRUSTES (Gelfand et al. 1996) andGENEWISE (Birney and Durbin 1997), genefindersbased on aligning a genomic DNA sequence fragmentto a homologous protein sequence. We evaluate theseprograms on two benchmark data sets: A set of well-
annotated single-gene DNA sequences, and a set ofsemiartificial genomic (SAG) sequences created by em-bedding the single-gene sequences from the first dataset in simulated intergenic DNA.
RESULTSWe investigated the accuracy of the gene predictiontools (GENSCAN, PROCRUSTES, GENEWISE, BLASTX) de-scribed in Methods on two benchmark sets. In all cases,sequences were masked previously for repeated regionsusing REPEATMASKER (A. Smit and P. Green, unpubl.).The gene predictions obtained using the different toolswere compared with the actual gene annotations usingthe accuracy measures described Methods.
Accuracy in Single Gene SequencesTable 1 shows the accuracy of the different gene pre-diction tools on h178, the set of single gene sequences.
GENSCAN’s accuracy is comparable to that reportedearlier (Burge and Karlin 1997). On average, 90% of thecoding nucleotides and 70% of the exons are predictedcorrectly by GENSCAN. Only 7% of the actual exons aremissed completely, and only 9% of the predicted exonsare wrong. We believe this is close to the maximumaccuracy that can be achieved using currently availableab initio gene prediction programs.
The quality of the gene models inferred fromBLASTX searches depends on the strategy used. Defaultusage of BLASTX produced poorer predictions thanmore sophisticated strategies. (Results for BLASTX de-fault correspond to those published in Guigo et al.2000.) Discrepancies between numbers in Table 1 andthose reported in Guiqoet al. (2000) are due to thedifferences in the way the accuracy measures are sum-marized. In Guigo et al. 2000, we computed the accu-racy measures on each test sequence, and averaged allof them. Here, we compute the accuracy measures glo-bally from the total number of prediction successesand failures (at the base or exon level) on all sequences.The default BLASTX strategy produces reasonably highsensitivity (0.91) by projecting all HSPs over a giventhreshold along the query DNA sequence, but the sen-sitivity rises to an amazing 0.97, if the topcomboN fea-
Table 1. Accuracy of Gene Prediction Tools in the Set of Single Gene Sequences (h178)
Program No.
Nucleotide
Exon
Sn SpSn � Sp
2 ME WESn Sp CC
GenScan 177 0.93 0.90 0.90 0.78 0.75 0.76 0.08 0.10Blastx default 175 0.91 0.79 0.82 0.04 0.04 0.04 0.12 0.05Blastx topcomboN 174 0.97 0.80 0.86 0.04 0.04 0.04 0.08 0.05Blastx 2 stages 175 0.90 0.92 0.90 0.10 0.12 0.11 0.19 0.02GeneWise 177 0.98 0.98 0.97 0.88 0.91 0.89 0.06 0.02Procrustes 177 0.93 0.95 0.93 0.76 0.82 0.79 0.11 0.04
Guigo et al.
1632 Genome Researchwww.genome.org
56 Chapter 3. Comparative Gene Finding

ture is used. The topcomboN feature eliminates theneed for low-complexity filters (seg + xnu), and forstrict secondary HSP cutoff (S2 threshold). Surpris-ingly, its use does not appear to hurt specificity. Thetwo-stage method (in which the top homolog withlow-complexity filtering is chosen to build the BLASTXmodel with topcomboN in the second stage) increasesspecificity from 0.79 to 0.92. Using a single protein tobuild a model improves specificity because the noisefrom the less significant hits is reduced. But the twostage method does have lower sensitivity from a lack ofinformation from the weaker secondary hits. However,this is still the best purely BLASTX-based strategy interms of either specificity or overall accuracy, and thenumbers are comparable to the accuracy of ab initiogene finders at the nucleotide level.
The proteins encoded by the sequences in h178are mostly included in the nonredundant database ofamino acid sequences (nr). However, BLASTX still doesnot produce perfect predictions. This certainly has anartefactual component: We have discovered a few an-notation errors in h178. However, perfect gene predic-tions from BLASTX searches are intrinsically impossiblebecause of the inability of BLASTX to predict the spliceboundaries when they occur within codons (this espe-cially affects its accuracy at the exon level, which isactually rather meaningless for BLASTX). In this regard,splicing alignment or sequence similarity-based geneprediction tools (SSBGP), such as GENEWISE and PRO-CRUSTES could, in principle, result in more accuratepredictions. Thus, the protein sequence with the low-est P value after the BLASTX search was given to PRO-CRUSTES and GENEWISE to model their gene predic-tions. SSBGP tools improved the accuracy of the genepredictions inferred directly from BLASTX searches,and also slightly outperform GENSCAN in this set.GENEWISE predictions with an overall accuracy of 0.97,in particular, were close to perfect given the intrinsicinaccuracy of the database annotation considered to bethe gold standard here. Of course, there is a price paidin computational time, and GENEWISE is expensivewith its linear-memory dynamic programming tech-nique.
GENSCAN accuracy, in theory, should be unaf-fected, whether the query sequence encodes genes forwhich a close homolog, remote homolog, or no homo-log exists. GENEWISE and PROCRUSTES accuracy, onthe other hand, should decrease as the homology be-comes distant, and these programs have little utility ifa homolog does not exist.
As we have already pointed out, nr database con-tains protein translations of most of the genes in ourdata set, which could be a significant drawback of thedata set. It is difficult (if not impossible) to come upwith criteria for eliminating just the translations.Mouse orthologs are often 100% identical at the pro-
tein level and variants of the same protein may behighly (98%–99%) identical. Thus, we chose to evalu-ate the effect of the similarity level (P value) of an avail-able homolog on the accuracy of GENEWISE and PRO-CRUSTES by considering a variety of P value bins. Con-ceptually, identical or close to identical proteins wouldfall in the most significant P value bin, and other binswould be devoid of identical hits.
A set of Blast-probability (P value) thresholds waschosen to provide bins with varying levels of similarity(10�120, 10�80, 10�60, 10�40, 10�30, 10�20, 10�10,and 10�5). For each of these P values (10�80, for in-stance), we performed the following experiment. Afterrunning BLASTX against nr for the DNA sequences inh178, we discarded for each DNA sequence all HSPScorresponding to all protein sequences with a P valuebelow cutoff (as if we were ignoring all known aminoacid sequences over a given level of similarity to theprotein encoded in the query DNA sequence). Then,the protein with the remaining top hit below the nexthigher P value threshold (10�60, in the case of theexample) was used, if it existed, as a candidate homo-log for the SSBGP tools. If there was no protein hit inthe bin (10�80 to 10�60 in the example) then this genewas discarded for the evaluation of this bin.
Thus, the BLASTX gene models are based on all theprotein homologs with probability higher than thethreshold considered. The P value thresholds were cho-sen so as to generate roughly equal numbers of datapoints (sequences from h178) for each set. The mini-mum number of data points in any set is 73, largeenough to avoid significant sampling bias.
The accuracy results as a function of P value of thehomologs are shown in Figure 1. GENSCAN perfor-mance is expected to be constant, and was for the mostpart; the minor variations are because of changes in thedata set. Only a fraction of the genes had homologs ineach of the bins, thus the data set changed a little frombin to bin. The overall performance of SSBGP toolssuffered substantially as the similarity decreased.Somewhat surprisingly, the performance of GENSCAN issuperior to that of SSBGP tools even at rather highlevels of similarity (P value between 10�80 and 10�60).When the similarity is strong, GENEWISE appears tooutperform PROCRUSTES in the h178 sequence set.However, when the similarity is weak the difference inperformance between the two tools at the nucleotidelevel is small, and for low levels of similarity PRO-CRUSTES seems to outperform GENEWISE, particularlyat the exon level. This is not unexpected consideringthe design of these programs: GENEWISE is primarily asequence alignment tool, and thus it performs verywell when there is strong sequence similarity. PRO-CRUSTES is more of a gene prediction program; it pos-sibly encodes a more sophisticated splice site and exonmodel, which allows for better exon prediction at low
Gene Prediction Accuracy
Genome Research 1633www.genome.org
3.3. Validation of Results from Gene Predictors 57

levels of similarity. As shown in Figure 3, a decrease inaccuracy for sequence similarity-based methods ismost likely a result of the decline in sensitivity, whilespecificity remains high, which is a very desirable fea-ture.
Interestingly, when the similarity is weak (Pvalue > 10�20), the advantage of sophisticated SSBGPtools as opposed to direct gene modeling from data-base searches such as those performed by BLASTX,seems to vanish. It is not unlikely that when the simi-larity is weak, the query DNA sequence and the topdatabase search homolog share only a conserved do-main. In such cases, SSBGP, relying on sequence simi-larity only to the top homolog, are only able to detectthe part of the gene exonic structure encoding these
domains. Direct gene modeling from BLASTX searchresults builds on all potential homologs (not only thetop one); thus, weak homologs that share differentconserved regions with the gene encoded in the DNAsequence may allow for better recovery of the overallexonic structure of the gene. In fairness to GENEWISEand PROCRUSTES, they can be used with multiple pro-tein homologs and complete gene models synthesized,but that is computationally expensive and analyticallyproblematic. Figure 1 illustrates an extreme example. Apossible solution (at least when using GENEWISE) is tobuild a profile or an HMM based on the top few ho-mologs and then align this profile with the target ge-nomic sequence.
Conversely, when the similarity with the top ho-
Figure 1 The accuracy of the gene prediction tools as a function of the similarity to the chosen homolog. For each P-value cutoff, thehomolog with the lowest P value above the cutoff was chosen to build the gene prediction models. The table indicates the different rangesconsidered, the log-average of the P values in each range, and the number of sequences with acceptable homologs in the range. Forexample, there were 99 sequences in h178 for which after discarding all hits with P value < 10�120, the top remaining hit had a Pvalue < 10�80. There were 73 sequences for which the top hit had a P value < 10�120, and 119 sequences for which the top hit had aP value > 10�5.
Guigo et al.
1634 Genome Researchwww.genome.org
58 Chapter 3. Comparative Gene Finding

molog is weak, the BLASTX search picks up only thestronger regions of similarity between the homologand the gene encoded in the query sequence, althoughlower levels of sequence similarity are shared in otherregions between the protein and the query DNA se-quences. These can be detected by the SSBGP tools (Fig.1). Finally, in other cases, both situations occur simul-taneously, and direct gene modeling from BLASTXsearch and SSBGP tools may complement each other toproduce a more accurate overall prediction (Fig. 1).
Examining the data in Table 1 and Figure 1, onemay be tempted to conclude that the gene identifica-tion problem is almost solved. When a strong homologexists, programs like GENEWISE and PROCRUSTES arelikely to pick up the correct exon structure; when sucha homolog does not exist, programs like GENSCAN willstill be able to recover most of this structure. This, webelieve, is rather optimistic, as the sequence set inwhich these programs have been tested is extremelyeasy. Although the results obtained are instructive ofthe comparative performance of the tools, they cannotnecessarily be extrapolated to the performance of thesetools in the large genomic sequences. In the next sec-tion, we present the results obtained on evaluating thetools on a set of simulated genomic sequences, whichwe believe provide a more realistic estimation of theactual accuracy of the gene prediction tools in largegenomic sequences.
Accuracy in Semiartificial Genomic SequencesA SAG data set containing known genes in randomintergenic context (as described in Methods) was con-structed to check if the accuracy measures from theprevious section extrapolate to larger, more difficultdata sets.
Because each SAG sequence contains multiplegenes, the choice of the set of protein homologs topredict all the genes was no longer trivial. For ease ofevaluation, we used the knowledge of the genes to pickthese homologs, but there are other techniques that
can be used to pick up a single candidate homolog foreach gene-like region. In short, the top-scoring proteinhomolog from the BLASTX search for each of the genicsequences was used by GENEWISE and PROCRUSTES topredict the gene based on sequence similarity. For in-stance, artificial sequence AGS01 was obtained by em-bedding EMBL sequences HS10116, HSDNAAMHI, andHSNUCLEO in artificial intergenic DNA, with BLASTXtop homologs being NCBI:gi 134635, 1136442, and128841, respectively. The GENEWISE and PROCRUSTESpredictions on the artificial sequence AGS01 were ob-tained by three independent executions of the pro-grams, with each of the above top homolog proteins inturn. The programs were executed to predict genes onboth strands and the model on the strand with thehigher score was used to assess accuracy. This approachisolated the issue of the accuracy of these programs ifthe genomic sequence is large and the gene is encodedonly in a small region of this sequence. There are otherfactors, such as the ability to choose the correct set ofhomologs that affect accuracy, but these factors weresimilar for all the programs, and other suboptimal (butperhaps more realistic) techniques would lead to loweraccuracy. Thus, the accuracy numbers for the semiar-tificial sequences are not underestimated.
Table 2 shows the accuracy of the gene identifica-tion tools in Gen178, the set of simulated genomicsequences. As expected from theoretical consider-ations, SSBGP tools were mostly unaffected by the in-clusion of genic sequences in the random intergenic-like DNA. PROCRUSTES appears to be less robust thanGENEWISE when analyzing large genomic sequences.In particular, there is a significant decrease in specific-ity at the exon level (from 0.82 to 0.75), the likelyresult of predicting a relatively large number of smallexons in otherwise noncoding DNA [wrong exons(WE) increasing from 0.04 to 0.16]. The comparativelylow decrease in specificity at the nucleotide level, from0.95 to 0.94, suggests that most of these false exons arerather short. Surprisingly, PROCRUSTES sensitivity at
Table 2. Accuracy of Gene Prediction Tools in the Set of Semiartificial Genomic (SAG)Sequences (Gen178)
Program No.
Nucleotide
Exon
Gene
Sn SpSn � Sp
2 ME WESn Sp CC MG WG
GenScan 43 0.89 0.64 0.76 0.64 0.44 0.54 0.14 0.41 0.03 0.280.92 0.92 0.91 0.76 0.76 0.76 0.09 0.09
GeneWise 43 0.98 0.98 0.97 0.88 0.91 0.89 0.06 0.020.98 0.98 0.97 0.88 0.91 0.89 0.06 0.02
Procrustes 43 0.93 0.94 0.93 0.80 0.75 0.77 0.10 0.160.93 0.95 0.93 0.76 0.82 0.79 0.11 0.04
(Italics) The accuracy values in the set of single gene sequences (from Table 1).
Gene Prediction Accuracy
Genome Research 1635www.genome.org
3.3. Validation of Results from Gene Predictors 59

the exon level is slightly higher in the set of artificialsequences than in the set of single gene sequences.
The accuracy of BLASTX was not affected by theintergenic context (data not shown) because no hitswith a P value more significant than 10�10 were foundin the simulated DNA.
Accuracy of ab initio gene finders suffered substan-tially in the set of artificial genomic sequences. Becauseof the tendency of gene finders to overpredict exons,one would expect that by placing the genic sequencesin the simulated-intergenic context, some loss of speci-ficity would be observed, with programs predictingperhaps a few extra exons in otherwise random DNA.On the other hand, one would expect the sensitivity toremain essentially constant as the exons predicted inthe genic sequences should still be predicted whenthese are included in simulated-intergenic DNA. How-ever, a significant decrease in specificity is observed(Table 2). For instance, GENSCAN specificity at the exonlevel drops to 0.64 from 0.92, and the proportion ofWEs climbs to 41% from 9% in the single gene se-quences. In addition, a significant decrease in sensitiv-ity is also observed, with programs failing to predictexons that were correctly identified in the single genesequences. For instance, the proportion of missing ex-ons increases for GENSCAN from 9% to 14%. Almost30% of the GENSCAN genes are predicted in the simu-lated-intergenic DNA. For ab initio gene finders, webelieve these accuracy values (on SAG sequences) aremore representative of their true accuracy on large ge-nomic sequences than those obtained in the typicalsingle gene benchmark experiments.
Figure 2 shows the predictions of the different pro-grams in one of the artificially generated genomic se-quences (∼157-kb long). As mentioned, SSBGPs predictthe genic structure of the artificial genomic sequencerather well. Performance of ab initio gene finders, onthe other hand, degrades substantially.
Although all genes predicted by GENSCAN overlapreal genes, it still predicts a large number of false posi-tive exons. In addition, even when predicting the ex-ons correctly, their assembly into genes is often incor-rect. For instance, in the sequence in Figure 2, GENSCANhas difficulty in predicting the correct gene bound-aries, and it expands the gene beyond its actual limits.In the lower portion of the Figure 2, we compare thepredictions in the region between positions 23,000 and41,000 from the SAG sequence to the predictions onjust the actual genic sequence (without the randomcontext). GENSCAN performance suffers substantiallyfrom this inclusion in pseudointergenic context. Oneexplanation is that GENSCAN uses the wrong isochoremodel for this sequence: the actual isochore structurebeing destroyed by the usage of artificial intergeniccontext. In such a case, decrease in performance wouldbe an artifact of our SAG sequences rather than a fea-
ture of GENSCAN. Experiments with gene finders otherthan GENSCAN (data not shown) indicate that such adecrease in performance is not specific to GENSCAN, butrather a general feature of ab initio gene finders.
As with the set of single gene sequences, the com-parison of GENSCAN with SSBGP tools is not strictlyfair. The SSBGPs are affected by the existence of closerhomologs, while GENSCAN is not affected. To study theeffects of the range of similarity on the accuracy ofgene prediction in the SAG data set, we extracted twodifferent sets of SAG sequences. In the first set, eachgene in each SAG sequence has a strong homolog(BLASTX P value < 10�50), and in the other set, eachgene in each sequence had a moderate homolog(BLASTX P value between 10�50 and 10�6). Some ofthe genes in the second set also had better homologswhich were ignored for this analysis. The results areshown in Table 3. If the similarity is strong, the se-quence similarity-based methods perform very well,outperforming ab initio tools (as in Table 2). However,if the average similarity between the genes encodedand the known proteins is only moderate (though per-haps, still better than expected for real genomic se-quences), the performance of these tools is similar tothe performance of GENSCAN. At the exon level, theoverall accuracy stays at ∼50%. A very similar accuracyhas also been observed independently on test sets onactual genomic sequences (http://predict.sanger.ac.uk/th/brca2/; see Discussion). We believe this is still anoverestimation of the actual accuracy of these tools inreal genomic sequences.
DISCUSSIONComputational genefinders produce acceptable predic-tions of the exonic structure of the genes when ana-lyzing single gene sequences with very little flankingintergenic sequence, but are unable to correctly inferthe exonic structure of multigene genomic sequences.In particular, ab initio genefinders predict and utilizeintergenic boundaries poorly. Conversely, as our re-sults indicate, sequence similarity searches on data-bases of known coding sequences are extremely helpfulin deciphering the exonic structure for the genes thathave known homologs. For very strong similarity,SSBGP tools appear to be the most useful. Surprisinglyeven for genes predicted based on homologs with amoderate degree of similarity (10�50 < P value < 10�6),GENSCAN performs comparably to SSBGP programs. Itappears that at such levels of similarity, potential splicesignals and statistical biases in the sequence composi-tion carry information comparable to sequence simi-larity for the purposes of identifying coding regions. Itis possible that the use of SAG sequences does not pro-vide a realistic scenario to test the accuracy of compu-tational gene finders. Ideally, one would like to uselarge genomic sequences with gene structure experi-
Guigo et al.
1636 Genome Researchwww.genome.org
60 Chapter 3. Comparative Gene Finding

mentally verified. However, experimentally verifyingeach and every gene along with alternative splice struc-tures in a large genomic sequence remains a difficultchallenge. Techniques such as exon-trapping (Churchet al. 1994) have high sensitivity but poor specificity,while RT–PCR or identifying a cDNA clone for every
transcript can be fairly specific (Hochgeschwender1992), but have less than perfect sensitivity and aredependent on finding a tissue in a developmental stageunder an environmental condition in which that gene(or alternative gene product) is expressed. In particular,proving that a piece of sequence (that appears coding
Figure 2 (AGS17, top) Gene predictions in one of the artificial genomic sequences. The row EMBL indicates the coordinates of the actualgenes. Exons corresponding to the same gene (or predicted to be in the same gene) are linked by a box. (AGS17, middle) Predictions ofGENSCAN finders in the region 23,000 to 41,000 from the semiartificial genomic sequence. (HSIL9RA, bottom) The predictions improveif GENSCAN is provided only the 18,000-bp long genic sequence that has been inserted in this region. This figure, as well as Fig. 1, hasbeen prepared using gff2ps. (Abril and Guigo 2000)
Gene Prediction Accuracy
Genome Research 1637www.genome.org
3.3. Validation of Results from Gene Predictors 61

to gene-prediction programs) is not coding is ex-tremely difficult. Thus, even though there are a num-ber of attempts to consolidate genomic gene predictiondata sets [Banbury Cross (http://igs-server.cnrs-mrs.fr/
igs/banbury), GeneSafe (http://www.hgmp.mrc.ac.uk/Genesafe), GASP (http://www.fruitfly.org/GASP1/)],the number of experimentally well-annotated large ge-nomic sequences remains small, and even in those
Guigo et al.
1638 Genome Researchwww.genome.org
62 Chapter 3. Comparative Gene Finding

cases, the reliability of the annotation is difficult toassess (Reese et al. 2000). To compensate for the lack ofthese verified data sets, we have built semiartificial datasets with known genes placed in the context of randomintergenic sequence. This ensures that all the genes inthese sequences are known. In fact, most of these geneshave fairly small genomic spread (i.e., none of the in-trons is very large), and a number of the ab initio geneprediction programs have been trained on them. Thisshould make this data set easy for most programs.However, our model for intergenic sequence is possiblyimperfect for at least two reasons: The genes are notnecessarily placed in the correct isochore context; andthe apparent codon composition in the simulated in-tergenic DNA may be different from that of actual in-tergenic sequence. These imperfections may conceiv-ably make gene prediction more difficult on this dataset for ab initio programs, but we think these are morethan offset at least in part by the small genes and thefact that the programs have partly trained on thesegenes. Overall, the sensitivity and specificity numbersare most instructive in the relative context. The sensi-tivity of most tools remains high even when con-fronted with large intergenic sequences, but the speci-ficity of the ab initio tools drops because of large in-tergenic regions.
Interestingly, the accuracy reported here for GEN-SCAN is very similar to the accuracy found in theBRCA2 region (Chruch et al. 1994; Couch et al. 1996);probably the best annotated human genomic regionfrom an experimental standpoint. BRCA2 region is alarge genomic tract with multiple genes, thus, a diffi-cult data set for most gene prediction programs. At theexon level, Tim Hubbard and Richard Bruskiewich(Sanger Center, UK) report for GENSCAN in this regiona sensitivity of 0.63 (termed coverage there) and a speci-ficity of 0.38 (termed accuracy there) (http://predict.sanger.ac.uk/th/brca2/). As anticipated, thesevalues are slightly worse than the ones we have foundhere in the SAG data set (0.64 and 0.44, respectively).This seems to indicate that the approach of buildingartificial genomic sequences is not too unrealistic, andthat it could be useful both for training and testinggene prediction programs. Results in these sequences,however, should be taken as an upper bound estimateof the accuracy of the programs in real genomic se-quences.
There is a growing class of gene identification pro-grams that combine both sequence similarity and tra-ditional coding potential measures, such as Genie(Kulp et al. 1996 1997), HMMgene (Krogh 1997), andGSA (Huang et al. 1997). Unfortunately, because of a
Table 3. Accuracy of Gene Prediction Tools in the Set of Semiartificial Genomic Sequences, When Either Strongly orModerately Similar Sequences are Used to Model the Genes
Program
Strong similarity P Value < 10�50
17 SAG sequencesModerate similarity 10�50 < P value < 10�6
26 SAG sequences
Nucleotide
Exon
Nucleotide
Exon
Sn SpSn � Sp
2 Sn SpSn � Sp
2Sn Sp CC Sn Sp CC
GenScan 0.91 0.66 0.77 0.67 0.46 0.56 0.91 0.61 0.74 0.67 0.43 0.55GeneWise 0.99 0.99 0.99 0.90 0.93 0.91 0.68 0.98 0.81 0.46 0.63 0.54Procrustes 0.92 0.96 0.94 0.80 0.75 0.77 0.66 0.79 0.72 0.48 0.32 0.40
The geometric mean of the P values of the strong similarity sequences was 10�135 and for the weaker similarity group it was 10�39.
Figure 3 If the candidate protein sequence is a remote homolog, direct gene modeling from BLAST-like database searches may havedifferent predictions compared to more sophisticated SSBGP tools. (A) EMBL DNA sequence HSCKBG was compared with the proteinsequences in the nr sequence database using BLASTX. Hits with P value < 10�20 were discarded, the top remaining corresponded to afragmentary protein sequence gi:553231. Not surprisingly, only a small fraction of the actual gene was recovered using this homolog byeither GENEWISE or PROCRUSTES. Other choices of homologs may have yielded different predictions but none of them by themselvesappears to be perfect. Conversely, the gene model derived directly from the BLASTX search reproduces the exonic structure of the genefairly well. Thus, even though upon discarding the close homologs, the remaining proteins individually showed only little overall similarityto the encoded protein product, as a collection they enable to walk its exonic structure. (B) If database protein sequences with hits belowP-value = 10�20 are discarded, BLASTX is able to detect significant similarity between only one of the encoded exons in EMBL sequenceHSPAC3G and the remaining protein sequences in the database. But with the top homolog among these, the SSBGP tools (GENEWISEin particular) are able to infer the correct exonic structure, picking up both the additional upstream exons. This is because the SSBGP toolsare able to detect more distant sequence relationships than BLASTXwith our choice of thresholds or because (as in this case) coding exonsoccur in low-complexity regions, which are usually masked when performing BLASTX searches to avoid large numbers of false positives.(C) In another case, direct gene modeling from BLASTX searches and SSBGP tools can complement each other to produce more accurategene predictions. As in A and B, HSP hits below P-value = 10�20 were ignored after comparing EMBL sequence HSFOLA with thenonredundant protein sequence database.
Gene Prediction Accuracy
Genome Research 1639www.genome.org
3.3. Validation of Results from Gene Predictors 63

lack of public availability at the time of the initiationof this study, their evaluation will have to await a fu-ture analysis.
EST similarity can also provide useful informationregarding gene structure for ∼85% of the commongenes (Guigo et al. 2000). A set of single gene se-quences in h178 was used to optimize a method forderiving exonic structures from EST matches. Whenusing the EST sequences in the public databases, themethod yielded an accuracy of Sn = 0.72, Sp = 0.87,and CC = 0.69 at the nucleotide level, when predictedgene structures were compared to the annotatedmRNA (not the coding) exonic structure. Other sec-ondary questions regarding EST-based gene predictionmay also be important, such as the extent to which ESTmatches help in delineating the gene boundaries.
Though there is considerable variation in the ac-curacy of various gene prediction programs dependingon data sets and the availability and choice of homo-log, we believe that a judicious use of these programs incombination can result in highly accurate gene struc-tures for genes with known homologs. There is, how-ever, still considerable progress to be made on predict-ing alternative spliced structures and genes with noknown homologs.
METHODS
Computational Gene Identification ToolsGene identification tools may be categorized into ab initiotools (those not utilizing sequence similarity and relying onintrinsic gene measures such as coding potential and splicesignals), and those based (at least partly) on sequence similar-ity.
Ab initio Gene Identification ToolsThe ab initio gene identification tools use information fromboth the gene signals in the genomic DNA (such as splicesites, start and stop codons, and promoter elements), and thestatistical biases in DNA composition that is characteristic ofcoding regions. There are a number of such programs (forreveiws, see Fickett 1996; Claverie 1997; Guigo 1997a; Burgeand Karlin 1998; Haussler 1998). GENSCAN (Burge and Karlin1997) is one of the most accurate and widely used programs inthis category, and we use it as a representative.
SSBGP ToolsA number of recent programs predict genes by aligning ge-nomic sequences with candidate homologous protein se-quences. These programs may include a splice site model, cod-ing potential, and sequence similarity to known proteins toinfer gene predictions. We evaluated two of these programs,PROCRUSTES (Gelfand et al. 1996), and GENEWISE (Birney andDurbin 1997) (http://www.sanger.ac.uk/Software/Wise2/).
These programs require as input a candidate homologousprotein sequence; therefore, in typical use, a sequence simi-larity database search with the query genomic sequence isperformed a priori and the top hit is used as the candidate (or
top hits are used as candidates, in the case of a query sequenceencoding multiple genes). The database similarity searcheswere performed against the nonredundant protein sequencedatabase from NCBI, nr, using BLASTX (Altschul et al. 1990;Gish and Sates 1993). BLASTX performs a translation of thequery sequence into the six frames, and searches for similari-ties between each of these translations and the protein se-quences in the database.
BLASTX was designed as a similarity-based gene predic-tion tool, and it is possible to model a gene directly from thedatabase search results. BLASTX, however, does not confineits similarity to exon;, thus the similarity region is not con-strained to begin or end on splice sites. Moreover, BLASTXdoes not explicitly predict genes in genomic sequences, andsome postprocessing of its output is required to infer genepredictions from the search results. Indeed, while computa-tional gene finders predict genes, that is pairs of positions(corresponding to exon starts and ends) along the query ge-nomic sequence, database searches only produce lists of se-quence database hits along the query sequence. Each hitabove a given similarity threshold may be assumed to be acoding exon. For different database entries, however the set ofhits may be different. The problem is then to infer a genemodel from the set of database hits. A simple solution is toproject the hits into a single axis along the genomic sequence,and to assume the union of these projections to be the codingexons.
In total, three strategies based on BLAST were tested:
(1) default — A procedure consisting of projecting the HSPsonto the genomic sequences was used (see Guigo et al.2000). BLASTX was run with E = 1e-10 � filter xnu + segS2 = 60, and all HSPs with identity <40% were discarded.The choices of S2 and percentage identity were influencedby the need to restrict false matches.
(2) topcomboN — BLASTX was used with default parametersexcept for �filter xnu + seg topcomboN = 1. HSPs with Pvalue > 10�20 were discarded, and the projections alongthe query sequence of the remaining HSPs assumed to bethe predicted coding exons. WashU–BLAST has a param-eter topcomboN that limits all HSPs generated to be inone consistent group. For example, for BLASTX searches,each region of the nucleotide sequence is only aligned toa single region on the protein sequence and the orderingof these HSPs has to be consistent along both the nucleo-tide and protein sequences. This restricts spuriousmatches arising from repetitive domains with query se-quences, and from low scoring hits in introns and flank-ing regions.
(3) two-stage — BLASTX was used in a two stage process thatfirst identifies one or more candidate protein sequences inthe presence of a low-complexity filter. In the secondstage, BLASTX is used to align the candidates individuallywith the genomic sequence, this time without the filterand with topcomboN = 1. This two pass technique iscloser to the strategy used with GENEWISE and PRO-CRUSTES, where a first BLASTX search pinpoints the pro-tein homolog to be used, and a subsequent GENEWISEuses this protein homolog.
Both GENEWISE and PROCRUSTES were run withmostly standard parameters: GENEWISE v2.1.16b -both-gff -pretty -para -cdna -genes -quiet and PROCRUSTES wasrun in the local mode with MIN EXN 20, MIN IVS
Guigo et al.
1640 Genome Researchwww.genome.org
64 Chapter 3. Comparative Gene Finding

50, GAP 2, INI GAP 10, MATRIX pam120.mtx. GEN-SCAN was run with default parameters.
Benchmark SetsTwo sets of sequences have been used to evaluate the pro-grams discussed above. First, a typical benchmark set made ofsequences from the EMBL database release 50 (1997) that in-cluded 178 human genomic sequences coding for single com-plete genes for which both the mRNA and the coding exonsare known. The procedure used to extract the sequences isdescribed in Burset and Guigo (1996) and Guigo (1997b). Wewill refer to this set here as h178. All the genes in this data setare on the forward strand. Other characteristics of h178 areprovided in Table 4.
For the reasons discussed in this paper, this does notappear to be a challenging benchmark set for estimating theaccuracy of gene identification programs in the larger ge-nomic sequences. Unfortunately, very few large genomic se-quences have been studied extensively to produce completeexperimental determinations of the exact structure of eachgene. To overcome this limitation, we generated a semiartifi-cial set of genomic sequences in which accurate gene anno-tation can be guaranteed.
In essence, a set of annotated genic sequences are placedrandomly in a background of random intergenic DNA. Thelength of the semiartificial sequence is generated randomlyaccording to a normal distribution. Genomic fragments con-taining genes and random-sized segments of intergenic se-quence are then concatenated until their combined lengthsexceed the target. The strands are also chosen at random foreach genic subsequence.
Table 4 shows the characteristics of the generated se-quences when the method is applied to the sequences in h178and the intergenic background is generated using a MarkovModel of order 5 as described in Guigo and Fickett (1995)assuming an average intergenic G + C content of 38%. The178 genic sequences were collapsed into 42 SAG sequences.Some of the resulting parameters, such as average G + C con-tent of 40%, a gene every 43 Kb, and a coding density of 2.3%are in agreement with that for the overall human genome.This data set has flaws and is not a perfect representative ofthe human genome. Some of the ignored characteristics in-clude the isochore organization of the human genome,known and unknown repeats in the intergenic regions, pres-ence of pseudogenes and other evolutionary remnants, geneswith huge introns, and tandem gene clusters. Most of themissing properties (pseudogenes, repeats, huge introns) makegene prediction much more difficult. Thus, we expect the ac-
curacy results on Gen178 to still be an overestimate of thetrue accuracy.
Evaluating AccuracyThe measures of accuracy used here are discussed extensivelyin Burset and Guigo (1996). We will restate them briefly. Ac-curacy is measured at three different levels: nucleotide, exon,and gene. At the nucleotide and exon levels, we essentiallycompute the proportion of actual coding nucleotides/exonsthat have been predicted correctly–(which we call Sensitivity)and the proportion of predicted coding nucleotides/exonsthat are actually coding nucleotides/exons (which we callSpecificity). To compute these measures at the exon level, wewill assume that an exon has been predicted correctly onlywhen both its boundaries have been predicted correctly. Tosummarize both Sensitivity and Specificity, we compute theCorrelation Coefficient at the nucleotide level, and the aver-age of Sensitivity and Specificity at the exon level. At the exonand gene level, we also compute the Missing Exons/Genes(the proportion of actual exons/genes that overlap no pre-dicted exon/gene) and the Wrong Exons/Genes (the propor-tion of predicted exons/genes that overlap no actual exon/gene).
The measures are computed globally from the total num-ber of prediction successes and failures (at the base and exonlevel) on all sequences. Accuracy in Table 1 is computed ig-noring predictions in the reverse (wrong) strand. The firstcolumn in Tables 1 and 2 indicates the number of sequencesfor which the progams produced predictions.
Data AvailabilityBoth the set of single gene sequences and the set of semiarti-ficially generated genomic sequences will be available fromhttp://www1.imim.es/databases/gpecal2000/.
ACKNOWLEDGMENTSWe thank Randall F. Smith, Ewan Birney, Chris Burge, andWarren Gish, and the anonymous referees (one in particularfor pointing out the topcomboN feature in WU-BLAST) foruseful comments. This work was partially supported by agrant from Plan Nacional de I + D, BIO98-0443-C02-01, andfrom the Ministerio de Educacion y Ciencia (Spain) to R.G.M.B. is supported by a Formacion de Personal Investigadorfellowship, FP95-38817943, from the Ministerio de Educaciony Ciencia (Spain), J.F.A. is supported by a predoctoral fellow-ship, 99/9345, from the Instituto de Salud Carlos III (Spain).
The publication costs of this article were defrayed in partby payment of page charges. This article must therefore be
Table 4. Characteristics of the Benchmark Sequence Sets
Set No. G + C
Sequence length Genes (average) CDS (average)
average min max no. length density no. exons length density
h178 178 50% 7169 622 86640 1 3657 53% 7169 5.1 968 21%Gen178 42 40% 177160 70037 282097 4.1 15136 8.6% 43000 21 4007 2.3%
The columns Genes (average) and CDS (average) provide values averaged over all the sequences (178 in h178 and 42 in Gen178).Gene density provides the percentage of nucleotides that occur in genic regions (exons, introns, and UTRs), and the number ofkilobases per gene. CDS no. exons is the average number of coding exons per sequence, and CDS density is the percentage ofnucleotides that occur in coding regions.
Gene Prediction Accuracy
Genome Research 1641www.genome.org
3.3. Validation of Results from Gene Predictors 65

hereby marked “advertisement” in accordance with 18 USCsection 1734 solely to indicate this fact.
REFERENCESAbril, J.F. and Guigo, R. 2000. gff2ps: A tool for visualizing genomic
annotations. Bioinformatics in press.Altschul, S.F., Gish, W., Miller, W., Myers, E.W., and Lipman, D.
1990. Basic local alignment search tool. J. Mol. Biol.215: 403–410.
Birney, E. and Durbin, R. 1997. Dynamite: A flexible code generatinglanguage for dynamic programming methods used in sequencecomparison. Ismb 5: 56–64.
Burge, C.B. and Karlin, S. 1997. Prediction of complete genestructures in human genomic DNA. J. Mol. Biol. 268: 78–94.
———. 1998. Finding the genes in genomic DNA. Curr. Opin. Struc.Biol. 8: 346–354.
Burset, M. and Guigo, R. 1996. Evaluation of gene structureprediction programs. Genomics 34: 353–357.
Church, D.M., Stotler, C.J., Rutter, J.L., Murrell, J.R., Trofatter, J.A.,and Buckler, A.J. 1994. Isolation of genes from complex sourcesof mammalian genomic DNA using exon amplification. Nat.Genet. 6: 98–105.
Claverie, J.-M. 1997. Computational methods for the identificationof genes in vertebrate genomic sequences. Hum. Mol. Genet.6: 1735–1744.
Couch, F.J., Rommens, J.M., Neuhausen, S.L., Couch, E.J., Rommens,J.M., Neuhausen, S.L., Belanger, C., Dumont, M., Abel, K., Bell,R., Berry, S., Bogden, R., Cannon-Albright, L. 1996. Generationof an integrated transcription map of the BRCA2 region onchromosome 13q12-q13. Genomics 36: 86–99.
Fickett, J.W. 1996. Finding genes by computer: the state of the art.Trends Genet. 12: 316–320.
Gelfand, M.S., Mironov, A.A., and Pevzner, P.A. 1996. Generecognition via spliced alignment. PNAS 93: 9061–9066.
Gish, W. and States, D. 1993. Identification of protein codingregions by database similarity search. Nat. Genet. 3: 266–272.
Guigo, R. 1997a. Computational gene identification. J. Mol. Med.75: 389–393.
———. 1997b. Computational gene identification: An openproblem. Comput. Chem. 21: 215–222.
Guigo, R. and Fickett, J.W. 1995. Distinctive sequence features inprotein coding, genic non-coding, and inter-genic human DNA.J. Mol. Biol. 253: 51–60.
Guigo, R., Burset, M., Agarwal, P., Abril, J.F., Smith, R.F., and Fickett,J.W. 2000. Sequence similarity based gene prediction. InGenomics and proteomics: Functional and computational aspects (ed.S. Suhai), pp. 95–105. Kluwer Academic / Plenum Publishing,New York, NY.
Haussler, D. 1998. Computational genefinding. In Trends Biochem.Sci., supplementary guide to bioinformatics, pp. 12–15.
Hochgeschwender, U. 1992. Toward a transcriptional map of thehuman genome. Trends Genet. 8: 41–44.
Huang, X., Adams, M.D., Zhou, H., and Kerlavage, A.R. 1997. A toolfor analyzing and annotating genomic sequences. Genomics46: 37–45.
Krogh, A. 1997. Two methods for improving performance of anHMM and their application for gene finding. ISMB 5: 179–186.
Kulp, D., Haussler, D., Reese, M.G., and Eeckman, F.H. 1996. Ageneralized hidden markov model for the recognition of humangenes in DNA. In Intelligent systems for molecular biology (eds. D.J.States, P. Agarwal, T. Gaasterland, L. Hunter, and R. Smith), pp.134–142. AAAI Press, Menlo Park, CA.
Kulp, D., Haussler, D., Reese, M.G., and Eeckman, F.H. 1997.Integrating database homology in a probabilistic gene structuremode. In Biocomputing: Proceedings of the 1997 Pacific Symposium(eds. R.B. Altman, A.K. Dunke, L. Hunter, and T.E. Klein), pp.232–244. World Scientific, New York, NY.
Mott, R. 1997. EST GENOME: A program to align spliced DNAsequences to unspliced genomic DNA. Comput. Appl. Biosci.13: 477–478.
Reese, M.G., Hartzell, G., Harris, N.L., Ohler, U., Abril, J.F., andLewis, S.E. 2000. Genome annotation assessment in Drosophilamelanogaster. Genome Res. 10: 483–501.
The C. elegans Sequencing Consortium. 1998. Genome sequence ofthe nematode C. elegans: A platform for investigating biology.Science 282: 2012–2018.
Received October 12, 1999; accepted in revised form August 11, 2000.
Guigo et al.
1642 Genome Researchwww.genome.org
66 Chapter 3. Comparative Gene Finding

3.3. Validation of Results from Gene Predictors 67
3.3.4 Reese et al , Genome Research, 10(4):483–501, 2000
PubMed Accession:http://www.ncbi.nlm.nih.gov/entrez/query.fcgi?cmd=Retrieve&db=PubMed&list_uids=10779488&dopt=Abstract
Journal Abstract:
http://www.genome.org/cgi/content/abstract/10/4/483
Supplementary Materials:http://www.fruitfly.org/GASP1/http://genome.imim.es/datasets/Dro_me/http://genome.imim.es/software/gfftools/GFF2PS-ADHposter.html
Companion Poster:See Figure 3.7 and the following URLs:http://www.genome.org/content/vol10/issue4/images/data/483/DC1/GR10n4_poster.ziphttp://genome.imim.es/references/genome_maps/2000_GenomeResearch_v10_i4_p483_poster_GASP.ps.gz
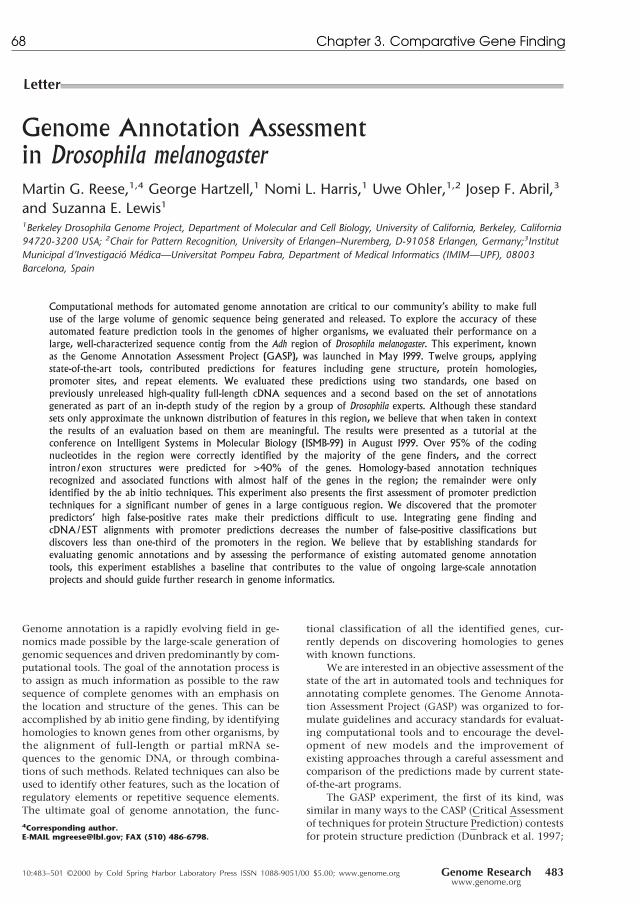
Genome Annotation Assessmentin Drosophila melanogasterMartin G. Reese,1,4 George Hartzell,1 Nomi L. Harris,1 Uwe Ohler,1,2 Josep F. Abril,3
and Suzanna E. Lewis1
1Berkeley Drosophila Genome Project, Department of Molecular and Cell Biology, University of California, Berkeley, California94720-3200 USA; 2Chair for Pattern Recognition, University of Erlangen–Nuremberg, D-91058 Erlangen, Germany;3InstitutMunicipal d’Investigacio Medica—Universitat Pompeu Fabra, Department of Medical Informatics (IMIM—UPF), 08003Barcelona, Spain
Computational methods for automated genome annotation are critical to our community’s ability to make fulluse of the large volume of genomic sequence being generated and released. To explore the accuracy of theseautomated feature prediction tools in the genomes of higher organisms, we evaluated their performance on alarge, well-characterized sequence contig from the Adh region of Drosophila melanogaster. This experiment, knownas the Genome Annotation Assessment Project (GASP), was launched in May 1999. Twelve groups, applyingstate-of-the-art tools, contributed predictions for features including gene structure, protein homologies,promoter sites, and repeat elements. We evaluated these predictions using two standards, one based onpreviously unreleased high-quality full-length cDNA sequences and a second based on the set of annotationsgenerated as part of an in-depth study of the region by a group of Drosophila experts. Although these standardsets only approximate the unknown distribution of features in this region, we believe that when taken in contextthe results of an evaluation based on them are meaningful. The results were presented as a tutorial at theconference on Intelligent Systems in Molecular Biology (ISMB-99) in August 1999. Over 95% of the codingnucleotides in the region were correctly identified by the majority of the gene finders, and the correctintron/exon structures were predicted for >40% of the genes. Homology-based annotation techniquesrecognized and associated functions with almost half of the genes in the region; the remainder were onlyidentified by the ab initio techniques. This experiment also presents the first assessment of promoter predictiontechniques for a significant number of genes in a large contiguous region. We discovered that the promoterpredictors’ high false-positive rates make their predictions difficult to use. Integrating gene finding andcDNA/EST alignments with promoter predictions decreases the number of false-positive classifications butdiscovers less than one-third of the promoters in the region. We believe that by establishing standards forevaluating genomic annotations and by assessing the performance of existing automated genome annotationtools, this experiment establishes a baseline that contributes to the value of ongoing large-scale annotationprojects and should guide further research in genome informatics.
Genome annotation is a rapidly evolving field in ge-nomics made possible by the large-scale generation ofgenomic sequences and driven predominantly by com-putational tools. The goal of the annotation process isto assign as much information as possible to the rawsequence of complete genomes with an emphasis onthe location and structure of the genes. This can beaccomplished by ab initio gene finding, by identifyinghomologies to known genes from other organisms, bythe alignment of full-length or partial mRNA se-quences to the genomic DNA, or through combina-tions of such methods. Related techniques can also beused to identify other features, such as the location ofregulatory elements or repetitive sequence elements.The ultimate goal of genome annotation, the func-
tional classification of all the identified genes, cur-rently depends on discovering homologies to geneswith known functions.
We are interested in an objective assessment of thestate of the art in automated tools and techniques forannotating complete genomes. The Genome Annota-tion Assessment Project (GASP) was organized to for-mulate guidelines and accuracy standards for evaluat-ing computational tools and to encourage the devel-opment of new models and the improvement ofexisting approaches through a careful assessment andcomparison of the predictions made by current state-of-the-art programs.
The GASP experiment, the first of its kind, wassimilar in many ways to the CASP (Critical Assessmentof techniques for protein Structure Prediction) contestsfor protein structure prediction (Dunbrack et al. 1997;
4Corresponding author.E-MAIL [email protected]; FAX (510) 486-6798.
Letter
10:483–501 ©2000 by Cold Spring Harbor Laboratory Press ISSN 1088-9051/00 $5.00; www.genome.org Genome Research 483www.genome.org
68 Chapter 3. Comparative Gene Finding

Levitt 1997; Moult et al. 1997, 1999; Sippl et al. 1999;Zemla et al. 1999), described at http://predictioncenter.lln-l.gov. However, unlike the CASP contest, GASP waspromoted as a collaboration to evaluate various tech-niques for genome annotation.
The GASP experiment consisted of the followingstages: (1) Training data for the Adh region, including2.9 Mb of Drosophila melanogaster genomic sequence,was collected by the organizers and provided to theparticipants; (2) a set of standards was developed toevaluate submissions while the participating groupsproduced and submitted their annotations for the re-gion; and (3) the participating groups’ predictions werecompared with the standards, a team of independentassessors evaluated the results of the comparison, andthe results were presented as a tutorial at ISMB-99(Reese et al. 1999).
Participants were given the finished sequence forthe Adh region and some related training data, but theydid not have access to the full-length cDNA sequencesthat were sequenced for the paper by Ashburner et al.(1999b) that describes the Adh region in depth. Theexperiment was widely announced and open to anyparticipants. Submitters were allowed to use any avail-able technologies and were encouraged to disclosetheir methods. Because we were fortunate to attract alarge group of participants who provided a wide varietyof annotations, we believe that our evaluation ad-dresses the state of art in genome annotation.
Twelve groups participated in GASP, submittingannotations in one or more of six categories: ab initiogene finding, promoter recognition, EST/cDNA align-
ment, protein similarity, repetitive sequence identifi-cation, and gene function. Table 1 lists each participat-ing group, the names of the programs or systems itused, and which of the six classes of annotations itsubmitted (see enclosed poster in this issue for agraphic overview of all the groups’ results). Additionalpapers in this issue are written by the participantsthemselves and describe their methods and results indetail.
It should be noted that the lack of a standard thatis absolutely correct makes evaluating predictionsproblematic. The expert annotations described by theDrosophila experts (Ashburner et al. 1999b) are our bestavailable resource, but their accuracy will certainly im-prove as more data becomes available. At best, the datawe had in hand is representative of the true situation,and our conclusions would be unchanged by using amore complete data set. At worst, there is a bias in theavailable data that makes our conclusions significantlymisleading. We believe that the data is not unreason-able and that conclusions based on it are correctenough to be valuable as the basis for discussion andfuture development. We do not believe that the valuesfor the various statistics introduced below are preciselywhat they would be using the extra information, andwe emphasize that they should always be considered inthe context of this particular annotated data set [for afurther detailed discussion of evaluating these predic-tions, see Birney and Durbin (2000)].
In the next section we describe the target genomicsequence and the auxiliary data, including a criticaldiscussion of our standard sets. Methods gives a short
Table 1. Participating Groups and Associated Annotation Categories
Programname
Genefinding
Promoterrecognition
EST/c DNAalignment
Proteinsimilarity Repeat
Genefunction
Mural et al.Oakridge, US GRAIL X X X
Parra et al.Barcelona, ES GeneID X
KroghCopenhagen, DK HMMGene X
Henikoff et al.Seattle, US BLOCKS X X
Solovyev et al.Sanger, UK FGenes X
Gaasterland et al.Rockefeller, US MAGPIE X X X X X
Benson et al.Mount Sinai, US TRF X
Werner et al.Munich, GER CoreInspector X
Ohler et al.Nuremberg, GER MCPromoter X
BirneySanger, UK GeneWise X X
Reese et al.Berkeley/Santa Cruz, US Genie X X
Reese et al.
484 Genome Researchwww.genome.org
3.3. Validation of Results from Gene Predictors 69

description of existing annotation methods thatcomplements other papers in this issue, including areview article of existing gene-finding methods byStormo (2000) and papers describing the methods usedby the individual participants. Results assesses the in-dividual annotation methods and the Conclusions dis-cusses what the experiment revealed about issues in-volved in annotating complete genomes. An article byAshburner (2000) provides a biological perspective onthe experiment.
Data: The Benchmark Sequence: The Adh Regionin D. melanogasterThe selection of a genomic target region for assessingthe accuracy of computational genome annotationmethods was a difficult task for several reasons: Thegenomic region had to be large enough, the organismhad to be well studied, and enough auxiliary data hadto be available to have a good experimentally verified“correct answer,” but the data should be anonymousso that a blind test would be possible. The Adh regionof the D. melanogaster genome met these criteria. D.melanogaster is one of the most important model or-ganisms, and although the Adh region had been exten-sively studied, the best gene annotations and cDNAsfor the region were not published until after the con-clusion of the GASP experiment. The 2.9 Mb Adh con-tig was large enough to be challenging, containedgenes with a variety of sizes and structures, and in-cluded regions of high and low gene density. It was nota completely blind test, however, because severalcDNA and genomic sequences for known genes in theregion were available prior to the experiment.
Genomic DNA SequenceThe contiguous genomic sequence of the Adh region inthe D. melanogaster genome spans nearly 3 Mb and hasbeen sequenced from a series of overlapping P1 andBAC clones as a part of the Berkeley Drosophila Ge-nome Project (BDGP; Rubin et al. 1999) and the Euro-pean Drosophila Genome Project (EDGP; Ashburner etal. 1999c). This sequence is believed to be of very highquality with an estimated error rate of <1 in 10,000bases, based on PHRAPquality scores. A detailed analy-sis of this region can be accessed through the BDGPWeb site (http://www.fruitfly.org/publications/Adh.html) as well as in Ashburner et al. (1999b).
Curated Training SequencesWe provided several D. melanogaster-specific data setsto the GASP participants. This enabled participants totune their tools for Drosophila and facilitated a com-parison of the various approaches that was unbiased byorganism-specific factors. The following curated se-quence sets, extracted from Flybase and EMBL (pro-vided by the EDGP at Cambridge and provided by theBDGP, were made available and can be found at http://
www.fruitfly.org/GASP/data/data.html): (1) A set ofcomplete coding sequences (start to stop codon), ex-cluding transposable elements, pseudogenes, noncod-ing RNAs, and mitochondrial and viral sequences(2122 entries); (2) nonredundant set of repetitive se-quences, not including transposable elements (96 en-tries); (3) transposon sequences, containing only thelongest sequence of each transposon family and ex-cluding defective transposable elements (44 entries);(4) genomic DNA data from 275 multi- and 141 single-exon nonredundant genes together with their start andstop codons and splice sites, taken from GenBank ver-sion 109; (5) a set of 256 unrelated promoter regions,taken from the Eukaryotic Promoter Database (EPD;Cavin Perier et al. 1999, 2000) and a collection madeby Arkhipova (1995); and (6) an uncurated set of cDNAand EST sequences from work in progress at the BDGP.Five of the 12 participating groups reported making useof these data sets.
Resources for Assessing Predictions: The “Correct” AnswerIn a comparative study, the gold standard used toevaluate solutions is the most important factor in de-termining the usefulness of the study’s results. For theresults to be meaningful, the standard must be appro-priate and correct in the eyes of the study’s audience.Because our goal was to evaluate tools that predictgenes and gene structure in complex eukaryotic organ-isms, we drew our standard from a complex eukaryoticmodel organism, choosing to work with a 2.9-Mb se-quence contig from the Adh region of D. melanogaster.Comparing predicted annotations in such a region isonly consequential if the standard is believed to becorrect, if that correctness has been established bytechniques that are independent of the approaches be-ing studied, and if the predictors had no prior knowl-edge of the standard. Ideally, it would contain the cor-rect structure of all the genes in the region without anyextraneous annotations. Unfortunately, such a set isimpossible to obtain because the underlying biology isincompletely understood. We built a two-part approxi-mation to the perfect data set, taking advantage of datafrom the BDGP cDNA sequencing project (http://www.fruitfly.org/EST) and a Drosophila community ef-fort to build a set of curated annotations for this region(Ashburner et al. 1999b). Our first component, knownas the std1 data set, used high-quality sequence from aset of 80 full-length cDNA clones from the Adh regionto provide a standard with annotations that are verylikely to be correct but certainly are not exhaustive.The second component, known as the std3 data set,was built from the annotations being developed forAshburner et al.(1999b) to give a standard with morecomplete coverage of the region, although with lessconfidence about the accuracy and independence ofthe annotations. We believe that this two-part approxi-
Genome Annotation Assessment in Drosophi la
Genome Research 485www.genome.org
70 Chapter 3. Comparative Gene Finding
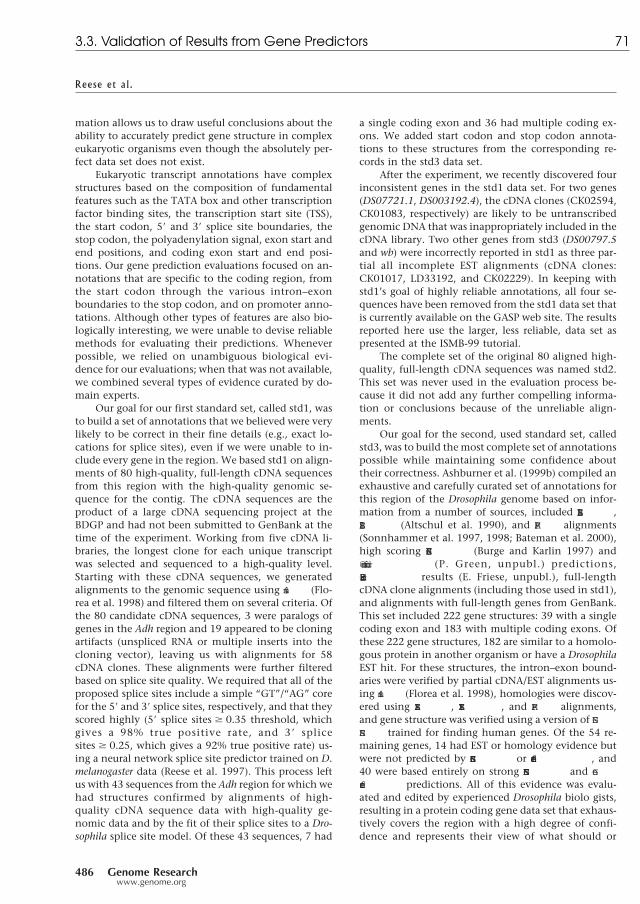
mation allows us to draw useful conclusions about theability to accurately predict gene structure in complexeukaryotic organisms even though the absolutely per-fect data set does not exist.
Eukaryotic transcript annotations have complexstructures based on the composition of fundamentalfeatures such as the TATA box and other transcriptionfactor binding sites, the transcription start site (TSS),the start codon, 58 and 38 splice site boundaries, thestop codon, the polyadenylation signal, exon start andend positions, and coding exon start and end posi-tions. Our gene prediction evaluations focused on an-notations that are specific to the coding region, fromthe start codon through the various intron–exonboundaries to the stop codon, and on promoter anno-tations. Although other types of features are also bio-logically interesting, we were unable to devise reliablemethods for evaluating their predictions. Wheneverpossible, we relied on unambiguous biological evi-dence for our evaluations; when that was not available,we combined several types of evidence curated by do-main experts.
Our goal for our first standard set, called std1, wasto build a set of annotations that we believed were verylikely to be correct in their fine details (e.g., exact lo-cations for splice sites), even if we were unable to in-clude every gene in the region. We based std1 on align-ments of 80 high-quality, full-length cDNA sequencesfrom this region with the high-quality genomic se-quence for the contig. The cDNA sequences are theproduct of a large cDNA sequencing project at theBDGP and had not been submitted to GenBank at thetime of the experiment. Working from five cDNA li-braries, the longest clone for each unique transcriptwas selected and sequenced to a high-quality level.Starting with these cDNA sequences, we generatedalignments to the genomic sequence using sim4 (Flo-rea et al. 1998) and filtered them on several criteria. Ofthe 80 candidate cDNA sequences, 3 were paralogs ofgenes in the Adh region and 19 appeared to be cloningartifacts (unspliced RNA or multiple inserts into thecloning vector), leaving us with alignments for 58cDNA clones. These alignments were further filteredbased on splice site quality. We required that all of theproposed splice sites include a simple “GT”/“AG” corefor the 58 and 38 splice sites, respectively, and that theyscored highly (58 splice sites $ 0.35 threshold, whichgives a 98% true positive rate, and 38 splicesites $ 0.25, which gives a 92% true positive rate) us-ing a neural network splice site predictor trained on D.melanogaster data (Reese et al. 1997). This process leftus with 43 sequences from the Adh region for which wehad structures confirmed by alignments of high-quality cDNA sequence data with high-quality ge-nomic data and by the fit of their splice sites to a Dro-sophila splice site model. Of these 43 sequences, 7 had
a single coding exon and 36 had multiple coding ex-ons. We added start codon and stop codon annota-tions to these structures from the corresponding re-cords in the std3 data set.
After the experiment, we recently discovered fourinconsistent genes in the std1 data set. For two genes(DS07721.1, DS003192.4), the cDNA clones (CK02594,CK01083, respectively) are likely to be untranscribedgenomic DNA that was inappropriately included in thecDNA library. Two other genes from std3 (DS00797.5and wb) were incorrectly reported in std1 as three par-tial all incomplete EST alignments (cDNA clones:CK01017, LD33192, and CK02229). In keeping withstd1’s goal of highly reliable annotations, all four se-quences have been removed from the std1 data set thatis currently available on the GASP web site. The resultsreported here use the larger, less reliable, data set aspresented at the ISMB-99 tutorial.
The complete set of the original 80 aligned high-quality, full-length cDNA sequences was named std2.This set was never used in the evaluation process be-cause it did not add any further compelling informa-tion or conclusions because of the unreliable align-ments.
Our goal for the second, used standard set, calledstd3, was to build the most complete set of annotationspossible while maintaining some confidence abouttheir correctness. Ashburner et al. (1999b) compiled anexhaustive and carefully curated set of annotations forthis region of the Drosophila genome based on infor-mation from a number of sources, included BLASTN,BLASTP (Altschul et al. 1990), and PFAMalignments(Sonnhammer et al. 1997, 1998; Bateman et al. 2000),high scoring GENSCAN(Burge and Karlin 1997) andGenefinder (P. Green, unpubl.) predictions,ORFFinder results (E. Friese, unpubl.), full-lengthcDNA clone alignments (including those used in std1),and alignments with full-length genes from GenBank.This set included 222 gene structures: 39 with a singlecoding exon and 183 with multiple coding exons. Ofthese 222 gene structures, 182 are similar to a homolo-gous protein in another organism or have a DrosophilaEST hit. For these structures, the intron–exon bound-aries were verified by partial cDNA/EST alignments us-ing sim4 (Florea et al. 1998), homologies were discov-ered using BLASTX, TBLASTX, and PFAMalignments,and gene structure was verified using a version of GEN-SCANtrained for finding human genes. Of the 54 re-maining genes, 14 had EST or homology evidence butwere not predicted by GENSCANor Genefinder , and40 were based entirely on strong GENSCANand Gen-efinder predictions. All of this evidence was evalu-ated and edited by experienced Drosophila biolo gists,resulting in a protein coding gene data set that exhaus-tively covers the region with a high degree of confi-dence and represents their view of what should or
Reese et al.
486 Genome Researchwww.genome.org
3.3. Validation of Results from Gene Predictors 71

should not be considered an annotated gene. Theirgene data set excluded the 17 found transposable ele-ments [6 LINE-like elements (G, F, Doc, and jockey) and11 retrotransposons with long terminal repeats (LTRs;copia, roo, 297, blood, mdg1-like, and yoyo)], which al-most all contain long ORFs. Some of these ORFs codefor known and some others for, so far, unknown pro-tein sequences.
Both of these data sets have shortcomings. Asmentioned above, std1 only includes a subset of thegenes in the region. It also includes a pair of transcriptsthat represent alternatively spliced products of a singlegene. Although this is not incorrect, it confounds ourscoring process. Because the cDNA alignments do notprovide any evidence for the location of the start andstop codons, we based those annotations in std1 oninformation from the std3 set. Many of the gene struc-tures in std3 are based on GENSCANand Genefinderpredictions without other supporting evidence, so it ispossible that the fine details are incorrect, that the en-tries are not entirely independent of the techniquesused by the predictors in the experiment, and that theset overestimates the number of genes in the region.
See Birney and Durbin (2000) and Henikoff andHenikoff (2000) for further discussion of the difficul-ties of evaluating these predictions especially in theprotein homology annotation category, in which, bytraining, these programs will recognize protein-like se-quences such as the ORFs in transposable elements asgenes. They and others (see other GASP publications inthis issue) have raised the issues of annotation over-sights, transposons, and pseudogenes. In cases whereGASP submissions suggest a missed annotation, thisinformation has been passed onto biologists for furtherresearch, including screening cDNA libraries. We be-lieve that it would have been biased to retroactivelychange the scoring scheme used at the GASP experi-ment based solely on missed annotations discoveredby the participant’s submissions. See Discussion for anexample of an annotation that may be missing in thestandard data sets. In the std3 data set we based ourstandard for what is or is not a Drosophila gene on theexpert annotations provided by Ashburner et al.(1999b). It is clear that both transposons and pseudo-genes are genuine features of the genome and thatgene-finding technologies might recognize them. Be-cause they were not included as coding genes in theexpert annotations, we decided against including themin the standard set.
Building a set for the evaluation of transcriptionstart site or, more generally, for promoter recognitionproved to be even more difficult. For the genes in theAdh region almost no experimentally confirmed anno-tation for the transcription start site exists. As the 58
UTR regions in Drosophila can extend up to several
kilobases, we could not simply use the region directlyupstream of the start codon. To obtain the best pos-sible approximation, we took the 58 ends of annota-tions from Ashburner et al. (1999b) where the up-stream region relied on experimental evidence (the 58
ends of full-length cDNAs) and for which the align-ment of the cDNA to the genomic sequence included agood ORF. The resulting set contained 92 genes of the222 annotations in the std3 set (Ashburner et al.1999b). This number is larger than the number of cD-NAs used for the construction of the std1 set describedabove because we included cDNAs that were alreadypublicly available. The 58 UTR of these 96 genes has anaverage length of 1860 bp, a minimum length of 0 bp(when the start codon was annotated at the beginning,due to the lack of any further cDNA alignment infor-mation; this is very likely to be only a partial 58 UTRand therefore an annotation error), and a maximumlength of 36,392 bp.
Data Exchange FormatOne of the challenges of a gene annotation study isfinding a common format in which to express the vari-ous groups’ predictions. The format must be simpleenough that all of the groups involved can adapt theirsoftware to use it and still be rich enough to express thevarious annotations.
We found that the General Feature Format(GFF) (formerly known as the Gene Feature Findingformat ) was an excellent fit to our needs. The GFFformat is an extension of a simple name, start, end re-cord that includes some additional information aboutthe sequence being annotated: the source of the fea-ture; the type of feature; the location of the feature inthe sequence; and a score, strand, and frame for thefeature. It has an optional ninth field that can be usedto group multiple predictions into single annotations.More information can be found at the GFF web site:http://www.sanger.ac.uk/Software/formats/GFF/. Ourevaluation tools used a GFF parser for the PERL pro-gramming language that is also available at the GFFweb site.
We found that it was necessary to specify a stan-dard set of feature names within the GFF format, forinstance, declaring that submitters should describecoding exons with the feature name CDS. We pro-duced a small set of example files (accessible from theGASP web site) that we distributed to the submittersand were pleased with how easily we were able to workwith their results.
METHODSGenome annotation is an ongoing effort to assign functionalfeatures to locations on the genomic DNA sequence. Tradi-tionally, most of these annotations record information aboutan organism’s genes, including protein-coding regions, RNAgenes, promoters, and other gene regulatory elements, as well
Genome Annotation Assessment in Drosophi la
Genome Research 487www.genome.org
72 Chapter 3. Comparative Gene Finding

as gene function. In addition to these gene features, the fol-lowing general genome structure features are also commonlyannotated: repetitive elements and general A, C, G, T contentmeasures (e.g., isochores).
Genome Annotation ClassesAlthough the GASP experiment invited and encouraged anyclass of annotations, most submissions were for gene-relatedfeatures, emphasizing ab initio gene predictions and pro-moter predictions. In addition, two groups submitted func-tional protein domain annotations, and two groups submit-ted repeat element annotations. In the sections that follow,we categorize and discuss the submitted predictions.
Gene FindingProtein coding region identification is a major focus of com-putational biology. A separate article in this issue (Stormo2000) discusses and compares current methods, whereas anearly paper by Fickett and Tung (1992) and a more recentreview of gene identification systems by Burge and Karlin(1998) give excellent overviews of the field. Table 2 lists thesix groups that predicted protein-coding regions with the cor-responding program names. It also categorizes the submis-sions based on the types of information used to build themodel for predictions. Although all groups used statistical in-formation for their models—predominantly coding bias, cod-ing preference, and consensus sequences for start codon,splice sites, and stop codons—only two groups used proteinsimilarity information or promoter information to predictgene structure. More than half of the groups incorporatedsequence information from cDNA sequences. In general,state-of-the-art gene prediction systems use complex modelsthat integrate multiple gene features into a unified model.
Promoter PredictionThe complicated nature of the transcription initiation processmakes computational promoter recognition a hard problem.We define promoter prediction as the identification of TSSs ofprotein coding genes that are transcribed by eukaryotic RNApolymerase II. A detailed description of the structure of pro-moter regions and existing promoter prediction systems isbeyond the scope of this paper. Fickett and Hatzigeorgiou(1997) provide an excellent review of the field.
We can broadly identify three different approaches topromoter prediction, with at least one GASP submission ineach category. The first class consists of “search by signal”
programs, which identify single binding sites of proteins in-volved in transcription initiation or combinations of sites toimprove the specificity. The program CoreInspector byWerner’s group (M. Scherf, A. Klingenhoff, and T. Werner, inprep.) belongs to this category and searches for co-occurrences of two common binding sites within the corepromoter (the core promoter usually denotes the regionwhere the direct contact between the transcription machin-ery, the holoenzyme of the transcription complex, and theDNA takes place). The second class is often termed “search bycontent,” as programs within this group do not rely on spe-cific signals but take the more general approach of identifyingthe promoter region as a whole, frequently based on statisticalmeasures. Sometimes the promoter is split into several regionsto obtain more accurate statistics. The MCPromoter program(Ohler et al. 1999) is a member of this second group. In com-parison with the signal-based group, the content-based sys-tems usually are more sensitive but less specific. The thirdclass can be described as “promoter prediction through genefinding.” Simply using the start of a gene prediction as a pu-tative TSS can be very successful if the 58 UTR region is not toolarge. This approach can be improved by including similarityto EST sequences and/or a promoter module in the statisticalsystems used for gene prediction. The TSS predictions submit-ted by the participants of the MAGPIEand the Genie groupsbelong to this last class.
The notorious difficulty of the problem itself is exacer-bated by the limited amount of existing reliably annotatedtraining material. The experimental mapping of a TSS is alaborious process and is therefore not routinely carried out,even if the gene itself is studied extensively. So, both trainingthe models and evaluating the results is a difficult task, andthe conclusions we draw from the results must be consideredwith much caution.
Repeat FindersDetecting repeated elements plays a very important role inmodeling the three-dimensional structure of a DNA molecule,specifically, the packing of the DNA in the cell nucleus. It isbelieved that the packing of the DNA around the nucleosomeis correlated with the global sequence structure produced pre-dominantly by repetitive elements. Repeats also play a majorrole in evolution (for review, see Jurka 1998). Two groups,Gary Benson [tandem repeats finder v. 2.02 (TRF; Benson1999)] and the MAGPIEteam using two programs Calypso (D.Field, unpubl.) and REPuter (Kurtz and Schleiermacher 1999)
submitted repetitive sequence an-notations. TRF (Benson 1999) lo-cates approximate tandem repeats(i.e., two or more contiguous, ap-proximate copies of a pattern ofnucleotides) where the pattern sizeis unspecified but falls within therange from 1 to 500 bases. The Ca-lypso program (D. Field, unpubl.)is an evolutionary genomics pro-gram. Its primary function is to findrepetitive regions in DNA and pro-tein sequences that have higherthan average mutation rates. TheREPuter program (Kurtz andSchleiermacher 1999) determinesrepeats of a fixed preselected lengthin complete genomes.
Table 2. Gene-Finding Submissions
Programname Statistics Promoter
EST/cDNAalignment
Proteinsimilarity
Mural et al.(Oakridge, US) GRAIL X X
Guigo et al.(Barcelona, ES) GeneID X
Krogh(Copenhagen, DK) HMMGene X X X
Solovyev et al.(Sanger, UK) FGenes X
Gaasterland et al.(Rockefeller, US) MAGPIE X X X
Reese et al.(Berkeley/Santa Cruz, US) Genie X X X X
Reese et al.
488 Genome Researchwww.genome.org
3.3. Validation of Results from Gene Predictors 73
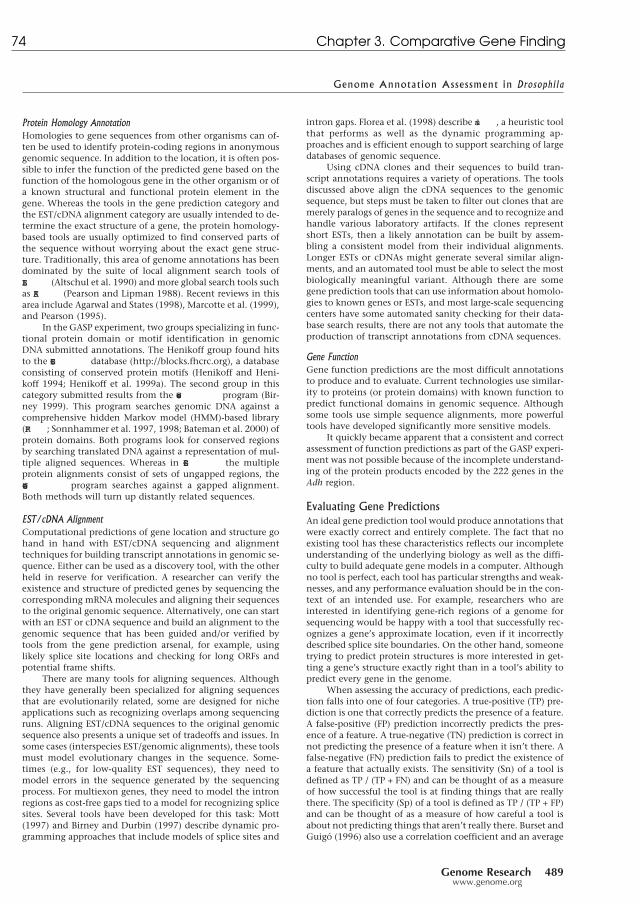
Protein Homology AnnotationHomologies to gene sequences from other organisms can of-ten be used to identify protein-coding regions in anonymousgenomic sequence. In addition to the location, it is often pos-sible to infer the function of the predicted gene based on thefunction of the homologous gene in the other organism or ofa known structural and functional protein element in thegene. Whereas the tools in the gene prediction category andthe EST/cDNA alignment category are usually intended to de-termine the exact structure of a gene, the protein homology-based tools are usually optimized to find conserved parts ofthe sequence without worrying about the exact gene struc-ture. Traditionally, this area of genome annotations has beendominated by the suite of local alignment search tools ofBLAST(Altschul et al. 1990) and more global search tools suchas FASTA (Pearson and Lipman 1988). Recent reviews in thisarea include Agarwal and States (1998), Marcotte et al. (1999),and Pearson (1995).
In the GASP experiment, two groups specializing in func-tional protein domain or motif identification in genomicDNA submitted annotations. The Henikoff group found hitsto the BLOCKS+database (http://blocks.fhcrc.org), a databaseconsisting of conserved protein motifs (Henikoff and Heni-koff 1994; Henikoff et al. 1999a). The second group in thiscategory submitted results from the GeneWise program (Bir-ney 1999). This program searches genomic DNA against acomprehensive hidden Markov model (HMM)-based library(PFAM; Sonnhammer et al. 1997, 1998; Bateman et al. 2000) ofprotein domains. Both programs look for conserved regionsby searching translated DNA against a representation of mul-tiple aligned sequences. Whereas in BLOCKS+the multipleprotein alignments consist of sets of ungapped regions, theGeneWise program searches against a gapped alignment.Both methods will turn up distantly related sequences.
EST/cDNA AlignmentComputational predictions of gene location and structure gohand in hand with EST/cDNA sequencing and alignmenttechniques for building transcript annotations in genomic se-quence. Either can be used as a discovery tool, with the otherheld in reserve for verification. A researcher can verify theexistence and structure of predicted genes by sequencing thecorresponding mRNA molecules and aligning their sequencesto the original genomic sequence. Alternatively, one can startwith an EST or cDNA sequence and build an alignment to thegenomic sequence that has been guided and/or verified bytools from the gene prediction arsenal, for example, usinglikely splice site locations and checking for long ORFs andpotential frame shifts.
There are many tools for aligning sequences. Althoughthey have generally been specialized for aligning sequencesthat are evolutionarily related, some are designed for nicheapplications such as recognizing overlaps among sequencingruns. Aligning EST/cDNA sequences to the original genomicsequence also presents a unique set of tradeoffs and issues. Insome cases (interspecies EST/genomic alignments), these toolsmust model evolutionary changes in the sequence. Some-times (e.g., for low-quality EST sequences), they need tomodel errors in the sequence generated by the sequencingprocess. For multiexon genes, they need to model the intronregions as cost-free gaps tied to a model for recognizing splicesites. Several tools have been developed for this task: Mott(1997) and Birney and Durbin (1997) describe dynamic pro-gramming approaches that include models of splice sites and
intron gaps. Florea et al. (1998) describe sim4 , a heuristic toolthat performs as well as the dynamic programming ap-proaches and is efficient enough to support searching of largedatabases of genomic sequence.
Using cDNA clones and their sequences to build tran-script annotations requires a variety of operations. The toolsdiscussed above align the cDNA sequences to the genomicsequence, but steps must be taken to filter out clones that aremerely paralogs of genes in the sequence and to recognize andhandle various laboratory artifacts. If the clones representshort ESTs, then a likely annotation can be built by assem-bling a consistent model from their individual alignments.Longer ESTs or cDNAs might generate several similar align-ments, and an automated tool must be able to select the mostbiologically meaningful variant. Although there are somegene prediction tools that can use information about homolo-gies to known genes or ESTs, and most large-scale sequencingcenters have some automated sanity checking for their data-base search results, there are not any tools that automate theproduction of transcript annotations from cDNA sequences.
Gene FunctionGene function predictions are the most difficult annotationsto produce and to evaluate. Current technologies use similar-ity to proteins (or protein domains) with known function topredict functional domains in genomic sequence. Althoughsome tools use simple sequence alignments, more powerfultools have developed significantly more sensitive models.
It quickly became apparent that a consistent and correctassessment of function predictions as part of the GASP experi-ment was not possible because of the incomplete understand-ing of the protein products encoded by the 222 genes in theAdh region.
Evaluating Gene PredictionsAn ideal gene prediction tool would produce annotations thatwere exactly correct and entirely complete. The fact that noexisting tool has these characteristics reflects our incompleteunderstanding of the underlying biology as well as the diffi-culty to build adequate gene models in a computer. Althoughno tool is perfect, each tool has particular strengths and weak-nesses, and any performance evaluation should be in the con-text of an intended use. For example, researchers who areinterested in identifying gene-rich regions of a genome forsequencing would be happy with a tool that successfully rec-ognizes a gene’s approximate location, even if it incorrectlydescribed splice site boundaries. On the other hand, someonetrying to predict protein structures is more interested in get-ting a gene’s structure exactly right than in a tool’s ability topredict every gene in the genome.
When assessing the accuracy of predictions, each predic-tion falls into one of four categories. A true-positive (TP) pre-diction is one that correctly predicts the presence of a feature.A false-positive (FP) prediction incorrectly predicts the pres-ence of a feature. A true-negative (TN) prediction is correct innot predicting the presence of a feature when it isn’t there. Afalse-negative (FN) prediction fails to predict the existence ofa feature that actually exists. The sensitivity (Sn) of a tool isdefined as TP / (TP + FN) and can be thought of as a measureof how successful the tool is at finding things that are reallythere. The specificity (Sp) of a tool is defined as TP / (TP + FP)and can be thought of as a measure of how careful a tool isabout not predicting things that aren’t really there. Burset andGuigo (1996) also use a correlation coefficient and an average
Genome Annotation Assessment in Drosophi la
Genome Research 489www.genome.org
74 Chapter 3. Comparative Gene Finding

correlation coefficient. We chose not to use these measuresbecause they depend on predictors’ TN information, and werecognize that our evaluation sets were constructed in such away that the TN information is not trustworthy. These Sn andSp metrics are used for evaluating the submissions in thegene-finding, promoter recognition, and gene identificationusing protein homology categories. In the gene finding cat-egory, they are used for all three levels: base level, exon level,and gene level. In the protein homology category, they areused for base level and gene level only.
In one of the first reviews of gene prediction accuracy,Fickett and Tung (1992) developed a method that measuredpredictors’ ability to correctly recognize coding regions in ge-nomic sequence. They used their method to compare pub-lished techniques and concluded that in-frame hexamercounts were the most accurate measure of a region’s codingpotential. Burset and Guigo (1996) recognized that there are awide variety of uses for gene predictions and developed mea-sures—including base level, exon level, and gene level Sp andSn—that describe a predictor’s suitability for a particular task.
Base LevelThe base level score measures whether a predictor is able tocorrectly label a base in the genomic sequence as being part ofsome gene. It rewards predictors that get the broad sweeps ofa gene correct, even if they don’t get the details such as thesplice site boundaries entirely correct. It penalizes predictorsthat miss a significant portion of the coding sequence, even ifthey get the details correct for the genes they do predict. Weused the Sn and Sp measures defined above as the measures ofsuccess in this category.
Exon LevelExon level scores measure whether a predictor is able to iden-tify exons and correctly recognize their boundaries. Being offby a single base at either end of the exon makes the predictionincorrect. Because we only considered coding exons in ourassessment, the first exon is bracketed by the start codon anda 58 splice site, the last exon is bracketed by a 38 splice site andthe stop codon, and the interior exons are bracketed by a pairof splice sites. As measures of success in this category, we usedtwo statistics in addition to Sn and Sp. The missed exon (ME)score is a measure of how frequently a predictor completelyfailed to identify an exon (no prediction overlap at all),whereas the wrong exon (WE) score is a measure of how fre-quently a predictor identifies an exon that has no overlapwith any exon in the standard sets. The ME score is the per-centage of exons in the standard set for which there were nooverlapping exons in the predicted set. Similarly, the WEscore is the percentage of exons in the predicted set for whichthere were no overlapping exons in the standard set.
Gene LevelGene level Sn and Sp measure whether a predictor is able tocorrectly identify and assemble all of a gene’s exons. For aprediction to be counted as a TP, all of the coding exons mustbe identified, every intron–exon boundary must be exactlycorrect, and all of the exons must be included in the propergene. This is a very strict measure that addresses a tool’s abilityto perfectly identify a gene. In addition to the Sn and Spmeasures based on absolute accuracy, we used the missedgenes (MG) score as a measure of how frequently a predictorcompletely missed a gene (a standard gene is consideredmissed if none of its exons are overlapped by a predicted
coding gene) and the wrong genes (WG) score as a measure ofhow frequently a predictor incorrectly identified a gene (aprediction is considered wrong if none of its exons are over-lapped by a gene from the standard set).
Split and Joined GenesThe exon level scores discussed above measure how well apredictor recognizes exons and gets their boundaries exactlycorrect. The gene level scores measure how well a predictorcan recognize exons and assemble them into complete genes.Neither of these scores directly measures a predictor’s ten-dency to incorrectly assemble a set of predicted exons intomore or fewer genes than it should. We developed two newmeasures, split genes (SG) and joined genes (JG), which de-scribe how frequently a predictor incorrectly splits a gene’sexons into multiple genes and how frequently a predictorincorrectly assembles multiple genes’ exons into a singlegene. Because the coverage of the std1 data set is so incom-plete, we have only included SG and JG scores from the com-parison with std3. A gene from the standard set is consideredsplit if it overlaps more than one predicted gene. Similarly, apredicted gene is considered joined if it overlaps more thanone gene in the standard set. The SG measure is defined as thesum of the number of predicted genes that overlap each stan-dard gene divided by the number of standard genes that weresplit. Similarly, the JG measure is the sum of the number ofstandard genes that overlap each predicted gene divided bythe number of predicted genes that were joined. A score of 1is perfect and means that all of the genes from one set overlapexactly one gene from the other set.
Application of These Measures to Correct Answer Data Sets std1/std3We built the std1 data set in such a way that we believe it iscorrect in the details of the genes that it describes, though weknow that it only includes a small portion of the genes in theregion. The std3 data set, on the other hand, is as complete aswas possible but does not have rigorous independent evi-dence for all of its annotations. For the std1 data set, we be-lieve that the TP count (it was predicted, and it exists in thestandard) and FN count (it was not predicted, but it does existin the standard) are reliable because of the confidence that wehave in the correctness of the predictions in the set. On theother hand, we do not believe that the TN count (it was notpredicted, and it is not in the standard set) and FP count (itwas predicted, but is not in the standard set) are reliable be-cause they both assume that the standard correctly describesthe absence of a feature and we know that there are genesmissing from std1. It follows that we believe that Sn is mean-ingful for std1 because it only depends on TP and FN but thatwe are less confident about the Sp score because it depends onTP and FP. A similar logic applies to the std3 data set, whereour confidence in the set’s completeness but not its fine de-tails suggests that the TP and FP scores are usable but that theTN and FN scores are not. This means that for std3, we believethat the Sp measure can be used to describe a predictor’s per-formance but that Sn is likely to be misleading.
Evaluation of Promoter PredictionsWe adopted the measures proposed by Fickett and Hatzigeor-giou (1997). They evaluated the success of promoter predic-tions by giving the percentage of correctly identified TSSs ver-sus the FP rate. A TSS is regarded as identified if a programmakes one or more predictions within a certain “likely” re-gion around the annotated site. The FP rate is defined as the
Reese et al.
490 Genome Researchwww.genome.org
3.3. Validation of Results from Gene Predictors 75

number of predictions within the “unlikely” regions outsidethe likely regions divided by the total number of bases con-tained in the unlikely set. As our annotation of the TSS is onlypreliminary and not experimentally confirmed, we chose arather large region of 500 bases upstream and 50 bases down-stream of the annotated TSS as the likely region. The upstreamregion is always taken as the likely region, even if it overlapswith a neighboring gene annotation on the same strand. Theunlikely region for each gene then consists of the rest of thegene annotation, from base 51 downstream of the TSS to theend of the final exon.
Visualization of the AnnotationsGenerating “good” annotations generally requires integratingmultiple sources of information, such as the results of varioussequence analysis tools plus supporting biological informa-tion. Visualization tools that display sequence annotations ina browsable graphical framework make this process muchmore efficient. In this experiment we found that visualizationtools are essential to evaluate the genome annotation submis-sions. When annotations are displayed visually, overall trendsbecome apparent, for example, gene-rich versus gene-poor re-gions, genes that were predicted by most participants versusthose that were predicted by few. Additionally, as we discussbelow, a visualization tool that is capable of displaying anno-tations at multiple levels of detail provides a way to examineindividual predictions in detail.
Building genome annotation visualization tools is adaunting task. Many such tools have been developed, startingwith ACeDB (Eeckman and Durbin 1995; Stein and Thierry-Mieg 1998). We were fortunate in that the BDGP has built aflexible suite of genome visualization tools (Helt et al. 1999)that could be extended to display the GASP submissions. Weadapted the BDGP’s annotated clone display and editing tool,CloneCurator (Harris et al. 1999), which is based on a ge-nomic visualization toolkit (Helt et al. 1999), to read the an-notation submissions in GFF format and display each team’spredictions in a unique color and location.
CloneCurator (see Fig. 1) displays features on a se-quence as colored rectangles. Features on the forward strandappear above the axis, whereas those on the reverse strandappear below the axis. The display can be zoomed andscrolled to view areas of interest in more detail. A configura-tion file identifies the feature types that are to be displayedand assigns colors and offsets to each one. For example, thestd1 and std3 exons appear in yellow and orange close to thecentral axis.
RESULTSThe results of an experiment such as GASP are onlymeaningful if enough groups participate. We were for-tunate to have 12 diverse groups involved, and we werevery grateful for the speed with which they were ableto submit their predictions. We believe that these 12groups provide a fair representation of the state of theart in annotation system technology. We collectedsubmissions by electronic mail and evaluated them us-ing the std1 and std3 data sets as described above. Be-fore releasing our results at the Intelligent Systems inMolecular Biology conference in August 1999 inHeidelberg, Germany, we assembled a team of inde-pendent assessors (Ashburner et al. 1999a) to review
our techniques and conclusions. As discussed in theintroduction, the accuracy of the various measures dis-cussed below depends heavily on how well our stan-dard sets capture the true set of features in the region.These values should only be considered in the contextof the standard data sets.
A detailed description of the results and the evalu-ation techniques we used can be accessed through theGASP homepage at http://www.fruitfly.org/GASP/.
Gene FindingTable 3 summarizes the performance of the gene-finding tools using the measures defined above. Threegroups submitted multiple submissions. The firstgroup, Fgenes1 , Fgenes2 , and Fgenes3 , submittedthree predictions at varying stringency (for details, seeSalamov and Solovyev 2000). For the GeneID program,two submitted versions are presented, version 1 (Ge-neID v1 ) being the original submission and version 2(GeneID v2 ) being a newer submission from a cor-rected version of the original program (for details, seeParra et al. 2000). The third group with multiple sub-missions used three versions of the Genie program:the first a pure statistical approach (Genie ), the secondincluding EST alignment information (GenieEST ), andthe third using protein homology information (Ge-nieESTHOM) (for details, see Reese et al. 2000). For allother groups from Table 2, only one submission wasevaluated. The following sections discuss the baselevel, exon level, and gene level performance of thesesubmissions.
Base Level ResultsSeveral gene prediction tools had a Sn of >0.95 at thebase level. This suggests that current technology is ableto correctly identify >95% of the D. melanogaster pro-teome. A few tools demonstrated a specificity of >0.90at the base level, only infrequently labeling a noncod-ing base as coding. Generally, the tools have a higherSn than Sp. Two programs, Fgenes2 and GeneID , weredesigned to be conservative about their predictionsand do not follow this trend.
Exon Level ResultsThere was a great deal of variability in the exon levelscores. Several tools had Sn scores ∼0.75, correctlyidentifying both exon boundaries ∼75% of the time.Their Sps were generally much lower (the highest was0.68), probably a reflection of the strict definition ofexon level scores both splice sites had to be predictedcorrectly and possible inaccuracies in the std3 data set.The low ME scores (several <0.05) combined with thefairly high Sn suggest that several tools were successfulat identifying exons but had trouble finding the cor-rect exon boundaries. Programs that incorporate ESTalignment information, such as GenieEST and HM-MGene, had sensitivity scores that were up to 10% bet-
Genome Annotation Assessment in Drosophi la
Genome Research 491www.genome.org
76 Chapter 3. Comparative Gene Finding

Fig
ure
1(S
eefa
cing
page
for
lege
nd.)
Reese et al.
492 Genome Researchwww.genome.org
3.3. Validation of Results from Gene Predictors 77

ter than the other tools. The high WE scores suggesteither that the tools are overpredicting or that there aregenes that are missing even from std3.
Gene Level ResultsAll of the predictors had considerable difficulty cor-rectly assembling complete genes. The best tools wereable to achieve Sns between 0.33 and 0.44, meaningthat they are incorrect over half of the time. This valueseems to be very similar in Drosophila and human se-quences, based on a recent analysis of the BRCA2 re-gion in human (T.J. Hubbard, pers. comm.). Even onthe more complete std3 data set, the programs tendedto incorrectly predict many genes. The very low MGscore (as low as 4.6%) is reassuring because it suggeststhat several tools are able to recognize a gene, even ifthey have difficulty figuring out the exact details of itsstructure. Comparing the WG and MG measures sug-gests that existing tools tend to predict genes that donot exist more often than they miss genes that do exist.Because it is almost certain that there are real genesthat are missing from both standard sets, this conclu-sion must be viewed with some skepticism. Althoughthere were several tools with good SG or JG scores,none of them performed well in both categories.
Promoter PredictionTable 4 shows the performance of the promoter pre-
diction systems, grouped by approach: search-by-signal, search-by-region, and gene prediction pro-grams.
Gene-finding programs that include a predictionof the TSS obtained the best results. The number offalse predictions made by the region-based programs isvery high (giving them a low Sp), and because the sig-nal-specific programs only identify one promoter, theirSn is very low. The high Sp of the gene finders is ob-viously due to the context information: All promoterpredictions within gene predictions are ruled out inadvance, and the location of the possible start codonprovides the system with a good initial guess of whereto look for a promoter. The MAGPIEsystem also usesEST alignments to obtain information on 58 UTRs,which mirrors the way the std sets were constructed:Roughly one-third of the putative TSS assignments relyon cDNAs that were publicly available in GenBank. Acloser look at the results reveals that the region-basedprograms have a Sn that is comparable with the genefinders and the signal based program had only a singleFP, showing that both types of tools can be used fordifferent applications.
Our data set, and the evaluation based on it, relieson the assumption that the 58 ends of the full-lengthcDNAs are reasonably close to the TSS. This makes itvery hard to draw strong conclusions from the pre-
Program identifier Color Reference
TRF seafoam Benson (1999)Calypso lightblue D. Field (unpubl.)std1 yellow unpublished conservative alignment of cDNAsstd3 orange Ashburner et al. (1999b)Grailexp red-orange Uberbacher and Mural (1991)GeneMarkHMM red Besemer and Borodovsky (1999)GeneID hotpink Guigo et al. (1992)FGenesCGG1 pink Solovyev et al. (1995)FGenesCGG2 magenta Solovyev et al. (1995)FGenesCGG3 purple Solovyev et al. (1995)HMMGene cornflower Krogh (1997)MAGPIEexon blue Gaasterland and Sensen (1996)MAGPIE turquoise Gaasterland and Sensen (1996)Genie seagreen Reese et al. (1997)GenieEST green Kupl et al. (1997)GenieESTHOM chartreuse Kulp et al. (1997)GeneWise red Birney (1999)BLOCKS pink Henikoff et al. (1999b)MAGPIEProm purple T. Gaasterland, (unpubl.)LMEIMC blue Ohler et al. (1999)LMESSM dark green Ohler et al. (2000)GeniePROM chartreuse Reese (2000)
Figure 1 (See facing page.) Screen shot from the CloneCurator program (Harris et al. 1999), featuring the genome annotationsof all 12 groups for the 2.9-Mb Adh region. The main panel shows the computational annotations on the forward (above axis) andreverse sequence strands (below axis). Genes located on the top half of each map are transcribed from distal to proximal (withrespect to the telomere of chromosome are 2L); those on the bottom are transcribed from proximal to distal. Right below the axisare the two repeat finding results displayed, followed by reference sets from Ashburner et al. (1999b; std1 and std3), followed bythe 12 submissions of gene-finding programs, followed by the two protein homology programs, and eventually, farthest away fromthe axis, the four promoter recognition programs. (Left) The color-coded legend for the program and the number of predictionsmade by the programs.
Genome Annotation Assessment in Drosophi la
Genome Research 493www.genome.org
78 Chapter 3. Comparative Gene Finding

sented results. Even the most sensitive systems couldidentify only roughly one third of the start sites. Thiscould of course be caused by the fact that the existingannotation is only an approximation and some of thetrue TSSs may be located further upstream. It also hintsat the diversity of promoter regions that mirrors thepossibilities for gene regulation and at the existing biastoward housekeeping genes in the current data setsused for the training of the models.
Gene Identification Using Protein HomologyGene-finding evaluation statistics, such as those de-scribed above, can be used to summarize the ability of
a program to identify complete and accurate genestructures in genomic DNA. In Table 5 we have appliedthe same evaluation statistics to the homology-basedsearch programs GeneWise and BLOCKS+. Becausethese programs are not optimized to deal with exactexon boundary assignments, Table 5 only shows theperformance for the base level and the MG and WG.
The very low Sns at the base level are not surpris-ing, because the programs identify only conserved pro-tein motifs or particular domains and make no effort topredict complete genes. Sp, which should be highgiven that only conserved protein motifs are scored,was lower than expected. Detailed studies of these pre-
Table 3. Evaluation of Gene-Finding Systems
FGenes1
FGenes2
FGenes3
GeneIDv1
GeneIDv2 Genie
GenieEST
GenieESTHOM HMMGene
MAGPIEexon GRAIL
Baselevel
Snstd1
0.89 0.49 0.93 0.48 0.86 0.96 0.97 0.97 0.97 0.96 0.81
Spstd3
0.77 0.86 0.60 0.84 0.83 0.92 0.91 0.83 0.91 0.63 0.86
Exonlevel
Snstd1
0.65 0.44 0.75 0.27 0.58 0.70 0.77 0.79 0.68 0.63 0.42
Spstd3
0.49 0.68 0.24 0.29 0.34 0.57 0.55 0.52 0.53 0.41 0.41
ME (%)std1
10.5 45.5 5.6 54.4 21.1 8.1 4.8 3.2 4.8 12.1 24.3
WE (%)std3
31.6 17.2 53.3 47.9 47.4 17.4 20.1 22.8 20.2 50.2 28.7
Genelevel
Snstd1
0.30 0.09 0.37 0.02 0.26 0.40 0.44 0.44 0.35 0.33 0.14
Spstd3
0.27 0.18 0.10 0.05 0.10 0.29 0.28 0.26 0.30 0.21 0.12
MG (%)std1
9.3 34.8 9.3 44.1 13.9 4.6 4.6 4.6 6.9 4.6 16.2
WG (%)std3
24.3 24.8 52.3 22.2 30.5 10.7 13.0 15.5 14.9 55.0 23.7
SG 1.10 1.10 2.11 1.06 1.06 1.17 1.15 1.16 1.04 1.22 1.23JG 1.06 1.09 1.08 1.62 1.11 1.08 1.09 1.09 1.12 1.06 1.08
The evaluation is divided into three categories: base level, exon level, and gene level. The different statistical features reported are Sn,Sp, ME, WE, MG, WG, SG, and JG. std1 and std3 indicate against which standard set the statistics are reported.
Table 4. Evaluation of Promoter Prediction Systems
System name Sensitivity
Rate of false-positivepredictions in regiona
(853,180 bases)
Rate of predictionsin regionb
(2,570,232 bases)
CoreInspector 1 (1%) 1/853,180 1/514,046MCPromoter v1.1 26 (28.2%) 1/2,633 1/2,537MCPromoter v2.0 31 (33.6%) 1/2,437 1/2,323GeniePROM 25 (27.1%) 1/14,710 1/28,879GenieESTPROM 30 (32.6%) 1/16,729 1/29,542MAGPIE 33 (35.8%) 1/14,968 1/16,370
We show the Sn for identified TSSs in comparison with the FP rate for non-TSS regions and general gene regions: athe unlikely regiondefined as the rest of the gene starting 51 bases downstream from its annotated TSS; bthe general gene region, spanning from halfthe distance to the previous and next annotated genes including the annotated TSS (taken from the std3 annotation).
Reese et al.
494 Genome Researchwww.genome.org
3.3. Validation of Results from Gene Predictors 79

dictions (see Birney and Durbin 2000; Henikoff andHenikoff 2000) show that most of the FP predictionswere hits to transposable elements or to possible genesthat are missing in the standard sets. Both programsuse a database of protein domains or conserved pro-tein motifs. Both databases are large and are believedto contain at least 50% of the existing protein do-mains. The high number of MG, 62.7% for BLOCKSand 69.7% for GeneWise , means that these programswill miss a significant number of Drosophila geneswhen used to search genomic DNA directly. The WGscores of 12.9% BLOCKSand 14.1% for GeneWise arelower than the gene finding programs discussed in theprevious section.
Gene Identification Using EST/cDNA AlignmentsIt is believed that some cDNA information exists forapproximately half of the genes in the D. melanogastergenome. This cDNA database (available as the ESTdata set at the GASP web site) was used as a basis forthe cDNA/EST alignment category. The Sn of 31% forMAGPIEESTand GrailSimilarity (Table 5) impliesthat the coding portion of the available EST data cur-rently covers one-third of the genome’s coding se-quence. The low Sp is very surprising and suggests thatthe EST/cDNA alignment problem is not a trivial one.The only program that tried to align complete cDNAsto genomic DNA, MAGPIEcDNA, could find completecDNAs for only 2.4% of the genes. EST alignments alsoresulted in high numbers of missed genes, suggestingthat the EST libraries are biased toward highly ex-pressed genes. The high WG scores suggest that somegenes are missing even from std3.
Selected Gene AnnotationsThe summary statistics discussed above only provide aglobal view of the predicting programs’ characteris-tics. A much better understanding of how the variousapproaches behave can be obtained by looking at in-dividual gene annotations. Such a detailed examina-tion can also help identify issues that are not ad-dressed by current systems.
In the following paragraphs we will discuss a few
interesting examples. Figure 1 shows the color codes ofthe participating groups that are used throughout thissection. Genes located on the top of each map are tran-scribed from distal to proximal (with respect to thetelomere of chromosome arm 2L); those on the bottomare transcribed from proximal to distal. std1 and std3are the expert annotations described in Ashburner etal.(1999b). Just below the axis, you can see the anno-tations for the two repeat finding programs. Thesehave no sequence orientation and are therefore onlyshown on one side. Farther away from the axis, afterstd1 and std3, we grouped all of the ab initio gene-finding programs together. Next to the gene finders arethe homology-based annotations. On the bottom andthe top of the figure we show the three promoter an-notations, but for clarity we did not include these an-notations in the subsequent figures. (On the front pageand in the legend of Fig. 1, you can see the full set ofannotations of all programs, which are also accessiblefrom the GASP web site.)
Our first example is a “busy” region with 12 com-plete genes and 1 partial gene in a stretch of only 40 kb(Fig. 2A). This region is located at the 38 end of the Adhregion from base 2,735,000 to base 2,775,000. Genesexist on both strands, and it is striking that in thisregion the genes tend to alternate between the forwardand the reverse strands. We selected this region for itsgene density and because it has characteristics that aretypical of the complete Adh region. Figure 2A vividlydemonstrates that all of the gene-finding programs’predictions are highly correlated with the annotatedgenes from std1/std3. In the past, gene finders had of-ten mistakenly predicted a gene on the noncodingstrand opposite of a real gene, leading to FP predictionsknown as “shadow exons.” Figure 2A makes it clearthat gene finders have overcome this problem, becausethere are almost no shadow exon predictions for any ofthe genes in std3. Another characteristic, captured inthe high base level sensitivity and the low missinggenes statistics, is that every gene in the std3 set waspredicted by at least a few groups and that most ofthese predictions agree with each other. Except for thesecond and third genes [DS02740.5, I(2)35Fb] on theforward strand (2,740,000–2,745,000), which seem to
Table 5. Evaluation of Similarity Searching
BLOCKS GeneWiseMAGPIE
cDNAMAGPIE
ESTGrail
Similarity
Base level Sn std1 0.04 0.12 0.02 0.31 0.31Sp std3 0.80 0.82 0.55 0.32 0.81
Gene level MG (%) std1 62.7 69.7 95.3 27.9 41.8WG (%) std3 12.9 14.1 0.0 44.3 7.4
Base and gene level statistics are shown. The base level is described using Sn and Sp, and the statistics for the gene level are given asMG and WG.
Genome Annotation Assessment in Drosophi la
Genome Research 495www.genome.org
80 Chapter 3. Comparative Gene Finding

be single exon genes, all of the genes in this region aremultiexon genes with between two and eight exons.The exon size varies widely. There are genes that con-sist of only two large exons, some that consist of a mixof large and small exons, and some that are made upexclusively of many small exons. The distributionseems to be almost random. Except for the long finalintron in the last gene on the reverse strand (cact), theregion consists exclusively of short introns.
Predictions on the reverse strand indicate a pos-sible gene from base 2,741,000 to base 2,745,000. Mostof the gene finders agree on this prediction, but neitherstd1 nor std3 describes a gene at this location. Thiscould be a real gene that was missed by the expertannotation pathway described in Ashburner et al
(1999b). Neither BLOCKS+nor GeneWise found anyhomologies in this region, but we can see from thetable in the previous section that many real genes donot have any homology annotations. Interestingly,this is the only area in the region where two gene find-ers predicted a possible gene that likely consists ofshadow exons.
The fifth gene on the forward strand (DS02740.10,bases 2,752,500–2,755,000) shows that long geneswith multiple exons are much harder to predict thansingle exon genes or genes with only a few exons. Inthis region splitting and joining genes does not seemto be a problem. Repeats occur sparsely and mostly innoncoding regions, predominantly in introns.
In contrast to the busy region in Figure 2A, Figure
Figure 2 (A) Annotations for the following known genes described in Ashburner et al. (1999b) are shown for the region from 2,735,000to 2,775,000 (from the left to the right of the map): crp (partial, reverse (r)), DS02740.4 (forward (f)), DS02740.5 (f), I(2)35Fb (f), heix (r),DS02740.8 (f), DS02740.9 (r), DS02740.10 (f), anon-35Fa (r), Sed5 (f), cni (r), fzy (f), cact (r). (B) Annotations for the following known genedescribed in Ashburner et al. (1999b) are shown for the region from 600,000 to 635,000 (left to right): DS01759.1 (r).
Reese et al.
496 Genome Researchwww.genome.org
3.3. Validation of Results from Gene Predictors 81
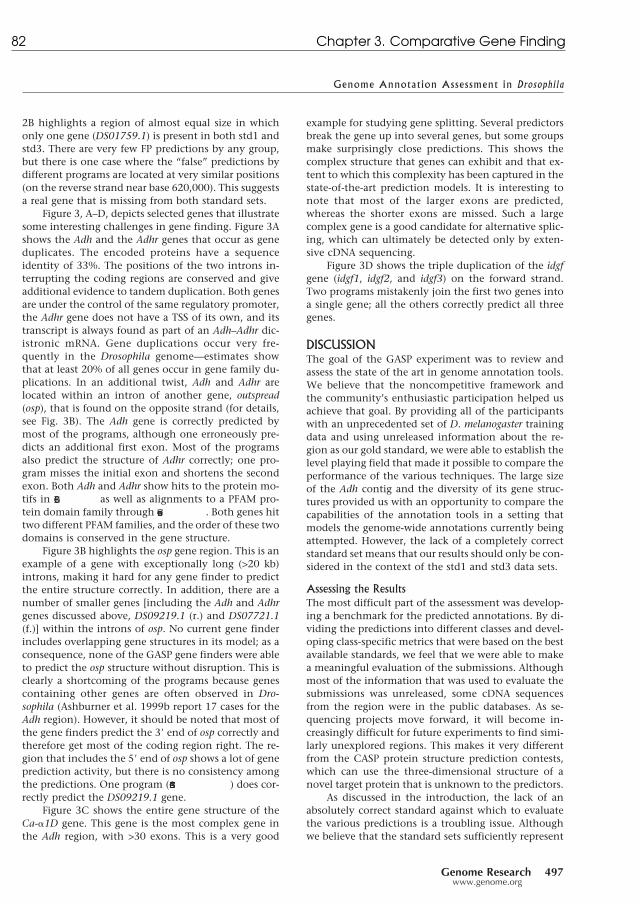
2B highlights a region of almost equal size in whichonly one gene (DS01759.1) is present in both std1 andstd3. There are very few FP predictions by any group,but there is one case where the “false” predictions bydifferent programs are located at very similar positions(on the reverse strand near base 620,000). This suggestsa real gene that is missing from both standard sets.
Figure 3, A–D, depicts selected genes that illustratesome interesting challenges in gene finding. Figure 3Ashows the Adh and the Adhr genes that occur as geneduplicates. The encoded proteins have a sequenceidentity of 33%. The positions of the two introns in-terrupting the coding regions are conserved and giveadditional evidence to tandem duplication. Both genesare under the control of the same regulatory promoter,the Adhr gene does not have a TSS of its own, and itstranscript is always found as part of an Adh–Adhr dic-istronic mRNA. Gene duplications occur very fre-quently in the Drosophila genome—estimates showthat at least 20% of all genes occur in gene family du-plications. In an additional twist, Adh and Adhr arelocated within an intron of another gene, outspread(osp), that is found on the opposite strand (for details,see Fig. 3B). The Adh gene is correctly predicted bymost of the programs, although one erroneously pre-dicts an additional first exon. Most of the programsalso predict the structure of Adhr correctly; one pro-gram misses the initial exon and shortens the secondexon. Both Adh and Adhr show hits to the protein mo-tifs in BLOCKS+as well as alignments to a PFAM pro-tein domain family through GeneWise . Both genes hittwo different PFAM families, and the order of these twodomains is conserved in the gene structure.
Figure 3B highlights the osp gene region. This is anexample of a gene with exceptionally long (>20 kb)introns, making it hard for any gene finder to predictthe entire structure correctly. In addition, there are anumber of smaller genes [including the Adh and Adhrgenes discussed above, DS09219.1 (r.) and DS07721.1(f.)] within the introns of osp. No current gene finderincludes overlapping gene structures in its model; as aconsequence, none of the GASP gene finders were ableto predict the osp structure without disruption. This isclearly a shortcoming of the programs because genescontaining other genes are often observed in Dro-sophila (Ashburner et al. 1999b report 17 cases for theAdh region). However, it should be noted that most ofthe gene finders predict the 38 end of osp correctly andtherefore get most of the coding region right. The re-gion that includes the 58 end of osp shows a lot of geneprediction activity, but there is no consistency amongthe predictions. One program (FGenesCCG3) does cor-rectly predict the DS09219.1 gene.
Figure 3C shows the entire gene structure of theCa-a1D gene. This gene is the most complex gene inthe Adh region, with >30 exons. This is a very good
example for studying gene splitting. Several predictorsbreak the gene up into several genes, but some groupsmake surprisingly close predictions. This shows thecomplex structure that genes can exhibit and that ex-tent to which this complexity has been captured in thestate-of-the-art prediction models. It is interesting tonote that most of the larger exons are predicted,whereas the shorter exons are missed. Such a largecomplex gene is a good candidate for alternative splic-ing, which can ultimately be detected only by exten-sive cDNA sequencing.
Figure 3D shows the triple duplication of the idgfgene (idgf1, idgf2, and idgf3) on the forward strand.Two programs mistakenly join the first two genes intoa single gene; all the others correctly predict all threegenes.
DISCUSSIONThe goal of the GASP experiment was to review andassess the state of the art in genome annotation tools.We believe that the noncompetitive framework andthe community’s enthusiastic participation helped usachieve that goal. By providing all of the participantswith an unprecedented set of D. melanogaster trainingdata and using unreleased information about the re-gion as our gold standard, we were able to establish thelevel playing field that made it possible to compare theperformance of the various techniques. The large sizeof the Adh contig and the diversity of its gene struc-tures provided us with an opportunity to compare thecapabilities of the annotation tools in a setting thatmodels the genome-wide annotations currently beingattempted. However, the lack of a completely correctstandard set means that our results should only be con-sidered in the context of the std1 and std3 data sets.
Assessing the ResultsThe most difficult part of the assessment was develop-ing a benchmark for the predicted annotations. By di-viding the predictions into different classes and devel-oping class-specific metrics that were based on the bestavailable standards, we feel that we were able to makea meaningful evaluation of the submissions. Althoughmost of the information that was used to evaluate thesubmissions was unreleased, some cDNA sequencesfrom the region were in the public databases. As se-quencing projects move forward, it will become in-creasingly difficult for future experiments to find simi-larly unexplored regions. This makes it very differentfrom the CASP protein structure prediction contests,which can use the three-dimensional structure of anovel target protein that is unknown to the predictors.
As discussed in the introduction, the lack of anabsolutely correct standard against which to evaluatethe various predictions is a troubling issue. Althoughwe believe that the standard sets sufficiently represent
Genome Annotation Assessment in Drosophi la
Genome Research 497www.genome.org
82 Chapter 3. Comparative Gene Finding

Figure 3 (A) Annotations for the following known genes described in Ashburner et al. (1999b) are shown for the region from 1,109,500to 1,112,500 (forward strand only) (left to right): Adh, Adhr. (B) Annotations for the following known genes described in Ashburner et al.(1999b) are shown for the region from 1,090,000 to 1,180,000 (left to right): osp (r), Adh (f), Adhr (f), DS09219.1 (r), DS07721.1 (f). (C)Annotations for the following known gene described in Ashburner et al. (1999b) are shown for the region from 2,617,500 to 2,640,000(forward strand only) (left to right): Ca-a1D. (D) Annotations for the following known genes described in Ashburner et al. (1999b) areshown for the region from 2,894,000 to 2,904,000 (forward strand only) (left to right): idgf1, idgf2, idgf3.
Reese et al.
498 Genome Researchwww.genome.org
3.3. Validation of Results from Gene Predictors 83

the true nature of the region and that conclusionsbased on them are interesting, it must be rememberedthat the various results can only be evaluated in thecontext of these incomplete data sets. This also makesGASP more difficult and less clear cut than CASP, wherethe three-dimensional protein structure is experimen-tally solved at least to some degree of resolution.
It should also be noted that the gene-finding toolswith the highest Sp have a great deal in common withGENSCAN, the gene prediction tool used in the devel-opment of the std3 data set. This suggests that std3’sorigins might have led to a bias favoring GENSCAN-likepredictors. Because std1 was exclusively created usingfull-length cDNA alignments, this set might be biasedtowards highly expressed genes, because the cDNA li-braries were not normalized.
Progress in Genome-Wide AnnotationThe rapid release of completed genomes, including theimminent release of the D. melanogaster and humangenomes, has driven significant developments in ge-nome annotation and gene-finding tools. Problemsthat have plagued gene-finding programs, such as pre-dicting shadow exons, restricting predictions to asingle strand, recognizing repeats, and accurately iden-tifying splice sites, have been overcome by the currentstate of the art. In this section, we discuss some of theremaining issues in genome annotation that the GASPexperiment highlighted.
Successful gene prediction programs use complexmodels that integrate information from statistical fea-tures that are driven by the three-dimensional protein–DNA/RNA interactions. They make integrated predic-tions on both strands and have been tuned to predictall the genes in gene-rich regions and avoid overpre-dicting genes in gene-poor regions (Fig. 2A,B). Al-though most of the programs identify almost all theexisting genes (as evidenced by the Sn and MG statis-tics), there is significant variation in their ability toaccurately predict precise gene structures (see the Spstatistics, particularly at the exon level). If any globalperformance conclusion can be drawn, it is that theprobabilistic gene finders (mostly HMM based) seem tobe more reliable. The integration of EST/cDNA se-quence information into the ab initio gene finders [seeHMMGene, GenieEST , and GRAIL (Fig. 2A,B and Fig.3A–D)] significantly improves gene predictions, par-ticularly the recognition of intron–exon boundaries.Some groups submitted multiple annotations of theAdh region using programs that were tuned for differ-ent tasks. The suite of Fgenes programs shows verynicely the results of such a three-part submission. Thefirst Fgenes submission (Fgenes1 ) is a version ad-justed to weight Sn and Sp equally. The second sub-mission (Fgenes2 ) is very conservative and only an-notates high-scoring genes. This results in a high Sp
but a low Sn. The third submission (Fgenes3 ) tries tomaximize Sn and to avoid missing any genes, at thecost of a loss in Sp. These differently tuned variantsmay be useful for different types of tasks.
A comparison (data not shown) to a gene-findingsystem that was trained on human data showed that itdid not perform as well as the programs that weretrained on Drosophila data.
None of the gene predictors screened for transpos-able elements, which have a protein-like structure. Asdescribed in Ashburner et al. (1999b), the Adh regionhas 17 transposable element sequences. Eliminatingtransposons from the predictions or adding them tothe standard sets would have reduced the FP counts,raising the Sp and lowering the WE and WG scores.Although this accounts for a portion of the high FPscores, we believe that there may also be additionalgenes in this region not annotated in std3. Future bio-logical experiments (Rubin 2000) to identify and se-quence the predicted genes that were not included instd3 should improve the completeness and accuracy ofthe final annotations.
There were fewer submissions of homology-basedannotations than those by ab initio gene finders, andtheir results were significantly affected by their FPrates. A significant portion of those FPs were matchesto transposable elements, some appear to be matchesto pseudogenes, and others are likely to be real, but asyet unannotated, genes. The homology-based ap-proaches seem to be the most promising techniques forinferring functions for newly predicted genes.
Even using EST/cDNA alignments to predict genestructures is not as simple as expected. Paralogs, lowsequence quality of mRNAs, and the difficulty of clon-ing infrequently expressed mRNAs make this methodof gene finding more complex than believed, and it isdifficult to guarantee completeness with this method.Normalized cDNA libraries and other more sophisti-cated technologies to purify genes with low expressionlevels, along with improved alignment and annotationtechnologies, should improve predictions based onEST/cDNA alignments.
Lessons for the FutureTo fully assess the submitted annotations, the correctanswer must be improved. Only extensive full-lengthcDNA sequencing can accomplish this. A possible ap-proach would be to design primers from predicted ex-ons and/or genes in the genomic sequence and thenuse hybridization technologies to fish out the corre-sponding cDNA from cDNA libraries. For promoterpredictions, another way to improve the correct an-swer is to make genome-to-genome alignments withthe DNA of related species (e.g., Caenorhabditis briggsaevs. Caenorhabditis elegans; D. melanogaster vs. D. virilis).More detailed guidelines, including how to handle am-
Genome Annotation Assessment in Drosophi la
Genome Research 499www.genome.org
84 Chapter 3. Comparative Gene Finding

biguous features such as pseudogenes and transposons,will make the results of future experiments even moreuseful.
A successful system to identify all genes in a ge-nome should consist of a combination of ab initio genefinding, EST/cDNA alignments, protein homologymethods, promoter recognition, and repeat finding.All of the various technologies have advantages anddisadvantages, and an automated method for integrat-ing their predictions seems ideal.
Beyond the identification of gene structure is thedetermination of gene functions. Most of the existingprototypes of such systems are based on sequence ho-mologies. Although this is a good starting point, it isdefinitely not sufficient. The state of the art for pre-dicting function in protein sequences uses the pro-tein’s three-dimensional structure, but the difficulty ofaccurately predicting three-dimensional structure fromprimary sequences makes applying these techniqueson complete genomes problematic. The new field ofstructural genomics will hopefully give more answersin these areas.
Another approach to function classification is theanalysis of gene expression data. Improvements in TSSannotations, along with correlation in expression pro-files, should be very helpful in identifying regulatoryregions.
ConclusionsThe GASP experiment succeeded in providing an objec-tive assessment of current approaches to gene prediction.The main conclusions from this experiment are that cur-rent methods of gene predictions are tremendously im-proved and that they are very useful for genome scaleannotations but that high-quality annotations also de-pend on a solid understanding of the organism in ques-tion (e.g., recognizing and handling transposons).
Experiments like GASP are essential for the contin-ued progress of automated annotation methods. Theyprovide benchmarks with which new technologies canbe evaluated and selected.
The predictions collected in GASP showed that formost of the genes, overlapping predictions from differ-ent programs existed. Whether or not a combinationof overlapping predictions would do better than thebest performing individual program was not explicitlytested in this experiment. For such a test, additionalexperiments such as cDNA library screening and sub-sequent full-length cDNA sequencing in this selectedAdh test bed region would be necessary. These experi-ments are currently under way, and it would be inter-esting to perform a second GASP experiment whenmore cDNAs have been sequenced.
We believe that existing automated annotationmethods are scalable and that the ultimate test willoccur when the complete sequence of the D. melano-
gaster genome becomes available. This experiment willset standards for the accuracy of genome-wide annota-tion and improve the credibility of the annotationsdone in other regions of the genome.
URLs
Gene FindingHMMGene, http://www.cbs.dtu.dk/services/HMMGene/;GRAIL, http://compbio/ornl.gov/droso; Fgenes , http://genomic/sanger.ac.uk/gf/gf.shtml; GeneID , http://www1/imim.es/∼rguigo/AnnotationExperiment/index.html; Genie ,http://www.neomorphic. com/genie.
Promoter PredictionMCPromoter , http://www5.informatik.uni-erlangen.de/HTML/English/Research/Promoter; CoreInspector , http://www.gsf.de/biodv.
Protein HomologyBLOCKS+, http://blocks.fhcrc.org and http:/blocks.fhcrc.org/blocks-bin/getblock.sh?<block name>; GeneWise , http://www.sanger.ac.uk/Software/Wise2/.
Repeat FindersTRF, http://c3.biomath.mssm.edu/trf.test.html.
ACKNOWLEDGMENTSWe thank all of the participants who submitted their anno-tations, without which the project would not have been sucha success, for their original contributions, their publication,and their patience with the organizers during this very in-tense project. We also thank the Drosophila Genome Se-quencing Center at LBNL, headed by Sue Celniker, for pro-viding such high-quality sequence; the annotation team atthe Berkeley Drosophila Genome Sequencing Center and es-pecially Sima Misra, Gerry Rubin, and Michael Ashburner;and the entire Drosophila community for producing such athoroughly studied genomic region. Special thanks go to theindependent assessor team, consisting of Michael Ashburner,Peer Bork, Richard Durbin, Roderic Guigo, and Tim Hubbard,who critiqued our evaluation. Thanks goes also to the orga-nizers of ISMB-99 Heidelberg, especially Thomas Lengauerand Reinhard Schneider, for encouraging our tutorial and thetremendous support in the preparation process and duringthe conference. We also thank Richard Durbin, David Haus-sler, Tim Hubbard, and Richard Bruskiewich for developingand maintaining the GFF format and their associated tools.Last but not least, a big thank you goes to Gerry Rubin formaking the Drosophila Genome Project such a success. Thiswork was supported by NIH grant HG00750.
The publication costs of this article were defrayed in partby payment of page charges. This article must therefore behereby marked “advertisement” in accordance with 18 USCsection 1734 solely to indicate this fact.
REFERENCESAgarwal, P. and D.J. States. 1998. Comparative accuracy of methods
for protein sequence similarity search. Bioinformatics 14: 40–47.Altschul, S.F., W. Gish, W. Miller, E.W. Myers and D.J. Lipman.
1990. Basic local alignment search tool. J. Mol. Biol.215: 403–410.
Arkhipova, I. R. 1995. Promoter elements in Drosophila melanogasterrevealed by sequence analysis. Genetics 139: 1359–1369.
Ashburner, M. 2000. A biologist’s view of the Drosophila genomeannotation assessment. Genome Res. (this issue).
Reese et al.
500 Genome Researchwww.genome.org
3.3. Validation of Results from Gene Predictors 85

Ashburner, M., P. Bork, R. Durbin, R. Guigo, and T.J. Hubbard.1999a. GASP1 assessment meeting, EMBL, Heidelberg, Germany.
Ashburner, M., S. Misra, J. Roote, S.E. Lewis, R. Blazej, T. Davis, C.Doyle, R. Galle, R. George, N. Harris et al. 1999b. An explorationof the sequence of a 2.9-Mb region of the genome of drosophilamelanogaster. The adh region. Genetics 153: 179–219.
Ashburner, M. et al. 1999c. European Drosophila Genome Project(EDGP). http://edgp.ebi.ac.uk/.
Bateman, A., E. Birney, R. Durbin, S.R. Eddy, K.L. Howe, and E.L.Sonnhammer. 2000. The Pfam Protein Families Database. NucleicAcids Res. 28: 263–266.
Benson, G. 1999. Tandem repeats finder: A program to analyze DNAsequences. Nucleic Acids Res. 27: 573–580.
Besemer, J. and M. Borodovsky. 1999. Heuristic approach to derivingmodels for gene finding. Nucleic Acids Res. 27: 3911–3920.
Birney, E. 1999. Wise2. http://www.sanger.ac.uk/Software/Wise2/.Birney, E. and R. Durbin. 1997. Dynamite: A flexible code generating
language for dynamic programming methods used in sequencecomparison. Intell. Syst. Mol. Biol. 5: 56–64.
———. 2000. Using GeneWise in the Drosophila annotationexperiment. Genome Res. (this issue).
Burge, C. and S. Karlin. 1997. Prediction of complete gene structuresin human genomic DNA. J. Mol. Biol. 268: 78–94.
———. 1998. Finding the genes in genomic DNA. Curr. Opin. Struct.Biol. 8: 346–354.
Burset, M. and R. Guigo. 1996. Evaluation of gene structureprediction programs. Genomics 34: 353–367.
Cavin Perier, R., T. Junier, C. Bonnard, and P. Bucher. 1999. TheEukaryotic Promoter Database (EPD): Recent developments.Nucleic Acids Res. 27: 307–309.
Cavin Perier, R., V. Praz, T. Junier, C. Bonnard, and P. Bucher. 2000.The Eukaryotic Promoter Database (EPD). Nucleic Acids Res.28: 302–303.
Dunbrack, R.L., Jr., D.L. Gerloff, M. Bower, X. Chen, O. Lichtarge,and F.E. Cohen. 1997. Meeting review: The Second meeting onthe critical assessment of techniques for protein structureprediction (CASP2), Asilomar, California, December 13–16, 1996.Folding Design 2: R27–R42.
Eeckman, F.H. and R. Durbin. 1995. ACeDB and macace. MethodsCell Biol. 48: 583–605.
Fickett, J.W. and C.S. Tung. 1992. Assessment of protein codingmeasures. Nucleic Acids Res. 20: 6441–6450.
Fickett, J.W. and A.G. Hatzigeorgiou. 1997. Eukaryotic promoterrecognition. Genome Res. 7: 861–878.
Florea, L., G. Hartzell, Z. Zhang, G.M. Rubin, and W. Miller. 1998. Acomputer program for aligning a cDNA sequence with a genomicDNA sequence. Genome Res. 8: 967–974.
Gaasterland, T. and C.W. Sensen. 1996. MAGPIE: Automatedgenome interpretation. Trends Genet. 12: 76–78.
Guigo, R., S. Knudsen, N. Drake, and T. Smith. 1992. Prediction ofgene structure. J. Mol. Biol. 226: 141–157.
Harris, N.L., G. Helt, S. Misra, and S.E. Lewis. 1999. CloneCurator.http://www.fruitfly.org/displays/CloneCurator.html.
Helt, G., E. Blossom, J. Morris, D. Fineman, S. Cherritz, S. Shaw, andC.L. Harmon. 1999. Neomorphic Genome Software DevelopmentToolkit (NGSDK). Neomorphic, Inc., Berkeley, CA.http://www.neomorphic.com.
Henikoff, S. and J.G. Henikoff. 1994. Protein family classificationbased on searching a database of blocks. Genomics 19: 97–107.
———. 2000. Genomic sequence annotation based on translatedsearching of the Blocks+ Database. Genome Res. (this issue).
Henikoff, J.G., S. Henikoff, and S. Pietrokovski. 1999a. New featuresof the Blocks Database servers. Nucleic Acids Res. 27: 226–228.
———. 1999b. Blocks+: A non-redundant database of proteinalignment blocks derived from multiple compilations.Bioinformatics 15: 471–479.
Jurka, J. 1998. Repeats in genomic DNA: Mining and meaning. Curr.Opin. Struct. Biol. 8: 333–337.
Krogh, A. 1997. Two methods for improving performance of anHMM and their application for gene finding. Ismb 5: 179–186.
Kulp, D., D. Haussler, M.G. Reese, and F.H. Eeckman. 1997.
Integrating database homology in a probabilistic gene structuremodel. Pac. Symp. Biocomput. 2: 232–244.
Kurtz, S. and C. Schleiermacher. 1999. REPuter: Fast computation ofmaximal repeats in complete genomes. Bioinformatics15: 426–427.
Levitt, M. 1997. Competitive assessment of protein fold recognitionand alignment accuracy. Proteins (Suppl.) 1: 92–104.
Marcotte, E.M., M. Pellegrini, M.J. Thompson, T.O. Yeates, and D.Eisenberg. 1999. A combined algorithm for genome-wideprediction of protein function. Nature 402: 83–86.
Mott, R. 1997. EST_GENOME: A program to align spliced DNAsequences to unspliced genomic DNA. Comp. Appl. Biosci.13: 477–478.
Moult, J., T. Hubbard, S.H. Bryant, K. Fidelis, and J.T. Pedersen.1997. Critical assessment of methods of protein structureprediction (CASP): Round II. Proteins (Suppl.) 1: 2–6.
Moult, J., T. Hubbard, K. Fidelis, and J.T. Pedersen. 1999. Criticalassessment of methods of protein structure prediction (CASP):Round III. Proteins (Suppl.) 3: 2–6.
Ohler, U., S. Harbeck, H. Niemann, E. Noth, and M.G. Reese. 1999.Interpolated markov chains for eukaryotic promoter recognition.Bioinformatics 15: 362–369.
Ohler, U., G. Stommer, and S. Harbeck. 2000. Stochastic segmentmodels of eukaroyotic promoter regions. Pac. Symp. Biocomput.5: 377–388.
Parra, G., E. Blanco, and R. Guigo. 2000. GeneID in Drosophila.Genome Res. (this issue).
Pearson, W.R. 1995. Comparison of methods for searching proteinsequence databases. Protein Sci. 4: 1145–1160.
Pearson, W.R. and D.J. Lipman. 1988. Improved tools for biologicalsequence comparison. Proc. Natl. Acad. Sci. 85: 2444–2448.
Reese, M.G. 2000. “Genome annotation in Drosophila melanogaster.”Ph.D. thesis, University of Hohenheim, Germany.
Reese, M.G., F.H. Eeckman, D. Kulp, and D. Haussler. 1997. Improvedsplice site detection in Genie. J. Comput. Biol. 4: 311–323.
Reese, M.G., N.L. Harris, G. Hartzell, and S.E. Lewis. 1999. The 7thconference on Intelligent Systems in Molecular Biology (ISMB’99),Heidelberg, Germany, http://www.fruitfly.org/GASP.
Reese, M.G., D. Kulp, H. Tammana, and D. Haussler. 2000. Genie–Genefinding in Drosophila melanogaster. Genome Res. (this issue).
Rubin, G.M. 2000. Full-length cDNA project.http://www.fruitfly.org/EST
Rubin, G.M. et al. 1999. Berkeley Drosophia Genome Project(BDGP). http://www.fruitfly.org.
Salamov, A.A. and V.V. Solovyev. 2000. Ab initio gene finding inDrosophila genomic DNA. Genome Res. (this issue).
Sippl, M.J., P. Lackner, F.S. Domingues, and W.A. Koppensteiner.1999. An attempt to analyse progress in fold recognition fromCASP1 to CASP3. Proteins (Suppl.) 3: 226–230.
Solovyev, V.V., A.A. Salamov, and C.B. Lawrence. 1995.Identification of human gene structure using linear discriminantfunctions and dynamic programming. Ismb 3: 367–375.
Sonnhammer, E.L., S.R. Eddy, and R. Durbin. 1997. Pfam: Acomprehensive database of protein domain families based onseed alignments. Proteins 28: 405–420.
Sonnhammer, E.L., S.R. Eddy, E. Birney, A. Bateman, and R. Durbin.1998. Pfam: Multiple sequence alignments and HMM-profiles ofprotein domains. Nucleic Acids Res. 26: 320–322.
Stein, L.D. and J. Thierry-Mieg. 1998. Scriptable access to theCaenorhabditis elegans genome sequence and other ACEDBdatabases. Genome Res. 8: 1308–1315.
Stormo, G.D. 2000. Gene-finding approaches for eukaryotes. GenomeRes. (this issue).
Uberbacher, E.C. and R.J. Mural. 1991. Locating protein-codingregions in human DNA sequences by a multiple sensor-neuralnetwork approach. Proc. Natl. Acad. Sci. 88: 11261–11265.
Zemla, A., C. Venclovas, J. Moult, and K. Fidelis. 1999. Processingand analysis of CASP3 protein structure predictions. Proteins(Suppl.) 3: 22–29.
Received February 9, 2000; accepted in revised form February 29, 2000.
Genome Annotation Assessment in Drosophi la
Genome Research 501www.genome.org
86 Chapter 3. Comparative Gene Finding
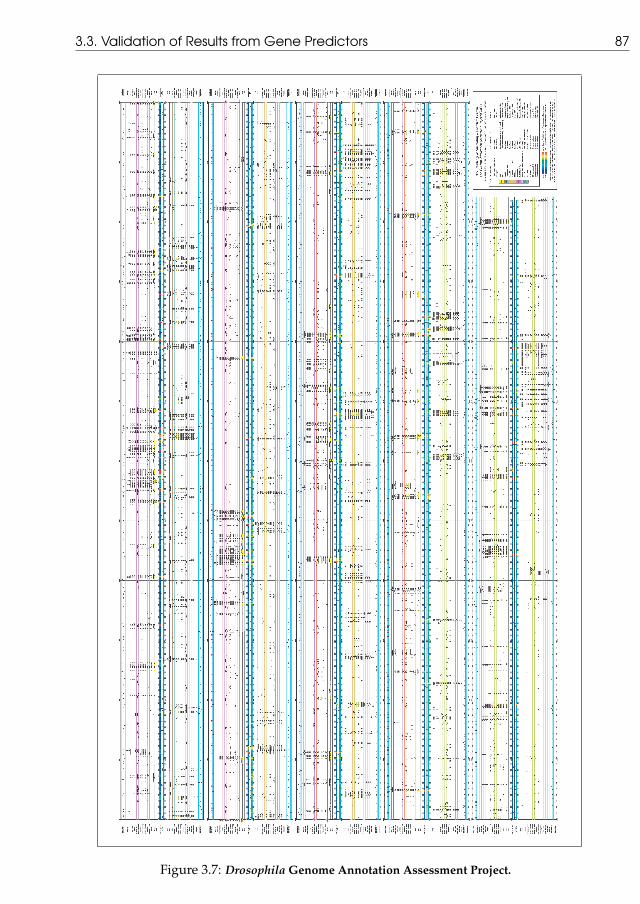
3.3. Validation of Results from Gene Predictors 87
Figure 3.7: Drosophila Genome Annotation Assessment Project.

88 Chapter 3. Comparative Gene Finding
3.3.5 Guigó et al , Proc Nat Acad Sci,100(3):1140–1145, 2003
PubMed Accession:http://www.ncbi.nlm.nih.gov/entrez/query.fcgi?cmd=Retrieve&db=PubMed&list_uids=12552088&dopt=Abstract
Journal Abstract:
http://www.pnas.org/cgi/content/abstract/100/3/1140
Supplementary Materials:
http://genome.imim.es/datasets/mouse2002/
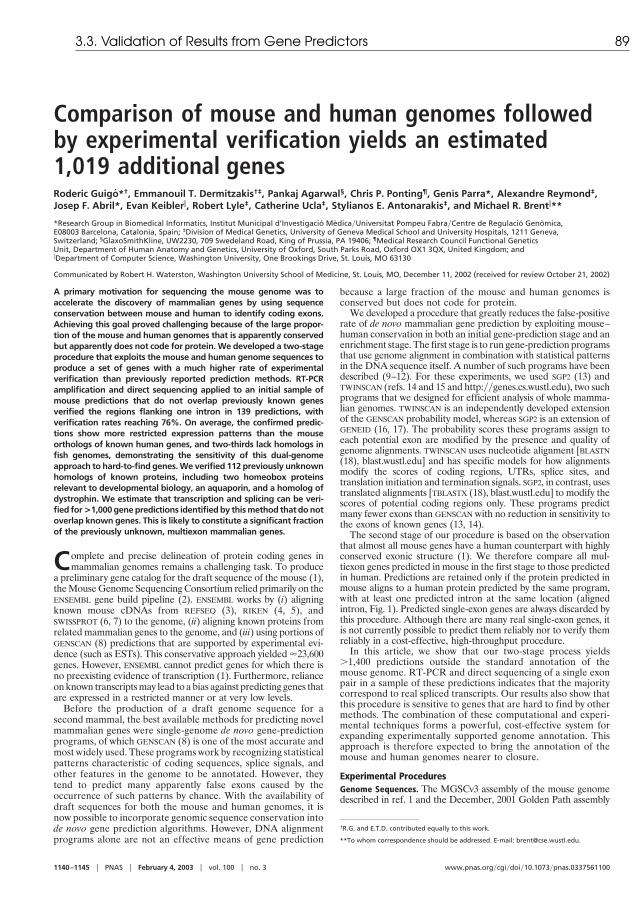
Comparison of mouse and human genomes followedby experimental verification yields an estimated1,019 additional genesRoderic Guigo*†, Emmanouil T. Dermitzakis†‡, Pankaj Agarwal§, Chris P. Ponting¶, Genıs Parra*, Alexandre Reymond‡,Josep F. Abril*, Evan Keibler�, Robert Lyle‡, Catherine Ucla‡, Stylianos E. Antonarakis‡, and Michael R. Brent�**
*Research Group in Biomedical Informatics, Institut Municipal d’Investigacio Medica�Universitat Pompeu Fabra�Centre de Regulacio Genomica,E08003 Barcelona, Catalonia, Spain; ‡Division of Medical Genetics, University of Geneva Medical School and University Hospitals, 1211 Geneva,Switzerland; §GlaxoSmithKline, UW2230, 709 Swedeland Road, King of Prussia, PA 19406; ¶Medical Research Council Functional GeneticsUnit, Department of Human Anatomy and Genetics, University of Oxford, South Parks Road, Oxford OX1 3QX, United Kingdom; and�Department of Computer Science, Washington University, One Brookings Drive, St. Louis, MO 63130
Communicated by Robert H. Waterston, Washington University School of Medicine, St. Louis, MO, December 11, 2002 (received for review October 21, 2002)
A primary motivation for sequencing the mouse genome was toaccelerate the discovery of mammalian genes by using sequenceconservation between mouse and human to identify coding exons.Achieving this goal proved challenging because of the large propor-tion of the mouse and human genomes that is apparently conservedbut apparently does not code for protein. We developed a two-stageprocedure that exploits the mouse and human genome sequences toproduce a set of genes with a much higher rate of experimentalverification than previously reported prediction methods. RT-PCRamplification and direct sequencing applied to an initial sample ofmouse predictions that do not overlap previously known genesverified the regions flanking one intron in 139 predictions, withverification rates reaching 76%. On average, the confirmed predic-tions show more restricted expression patterns than the mouseorthologs of known human genes, and two-thirds lack homologs infish genomes, demonstrating the sensitivity of this dual-genomeapproach to hard-to-find genes. We verified 112 previously unknownhomologs of known proteins, including two homeobox proteinsrelevant to developmental biology, an aquaporin, and a homolog ofdystrophin. We estimate that transcription and splicing can be veri-fied for >1,000 gene predictions identified by this method that do notoverlap known genes. This is likely to constitute a significant fractionof the previously unknown, multiexon mammalian genes.
Complete and precise delineation of protein coding genes inmammalian genomes remains a challenging task. To produce
a preliminary gene catalog for the draft sequence of the mouse (1),the Mouse Genome Sequencing Consortium relied primarily on theENSEMBL gene build pipeline (2). ENSEMBL works by (i) aligningknown mouse cDNAs from REFSEQ (3), RIKEN (4, 5), andSWISSPROT (6, 7) to the genome, (ii) aligning known proteins fromrelated mammalian genes to the genome, and (iii) using portions ofGENSCAN (8) predictions that are supported by experimental evi-dence (such as ESTs). This conservative approach yielded �23,600genes. However, ENSEMBL cannot predict genes for which there isno preexisting evidence of transcription (1). Furthermore, relianceon known transcripts may lead to a bias against predicting genes thatare expressed in a restricted manner or at very low levels.
Before the production of a draft genome sequence for asecond mammal, the best available methods for predicting novelmammalian genes were single-genome de novo gene-predictionprograms, of which GENSCAN (8) is one of the most accurate andmost widely used. These programs work by recognizing statisticalpatterns characteristic of coding sequences, splice signals, andother features in the genome to be annotated. However, theytend to predict many apparently false exons caused by theoccurrence of such patterns by chance. With the availability ofdraft sequences for both the mouse and human genomes, it isnow possible to incorporate genomic sequence conservation intode novo gene prediction algorithms. However, DNA alignmentprograms alone are not an effective means of gene prediction
because a large fraction of the mouse and human genomes isconserved but does not code for protein.
We developed a procedure that greatly reduces the false-positiverate of de novo mammalian gene prediction by exploiting mouse–human conservation in both an initial gene-prediction stage and anenrichment stage. The first stage is to run gene-prediction programsthat use genome alignment in combination with statistical patternsin the DNA sequence itself. A number of such programs have beendescribed (9–12). For these experiments, we used SGP2 (13) andTWINSCAN (refs. 14 and 15 and http:��genes.cs.wustl.edu), two suchprograms that we designed for efficient analysis of whole mamma-lian genomes. TWINSCAN is an independently developed extensionof the GENSCAN probability model, whereas SGP2 is an extension ofGENEID (16, 17). The probability scores these programs assign toeach potential exon are modified by the presence and quality ofgenome alignments. TWINSCAN uses nucleotide alignment [BLASTN(18), blast.wustl.edu] and has specific models for how alignmentsmodify the scores of coding regions, UTRs, splice sites, andtranslation initiation and termination signals. SGP2, in contrast, usestranslated alignments [TBLASTX (18), blast.wustl.edu] to modify thescores of potential coding regions only. These programs predictmany fewer exons than GENSCAN with no reduction in sensitivity tothe exons of known genes (13, 14).
The second stage of our procedure is based on the observationthat almost all mouse genes have a human counterpart with highlyconserved exonic structure (1). We therefore compare all mul-tiexon genes predicted in mouse in the first stage to those predictedin human. Predictions are retained only if the protein predicted inmouse aligns to a human protein predicted by the same program,with at least one predicted intron at the same location (alignedintron, Fig. 1). Predicted single-exon genes are always discarded bythis procedure. Although there are many real single-exon genes, itis not currently possible to predict them reliably nor to verify themreliably in a cost-effective, high-throughput procedure.
In this article, we show that our two-stage process yields�1,400 predictions outside the standard annotation of themouse genome. RT-PCR and direct sequencing of a single exonpair in a sample of these predictions indicates that the majoritycorrespond to real spliced transcripts. Our results also show thatthis procedure is sensitive to genes that are hard to find by othermethods. The combination of these computational and experi-mental techniques forms a powerful, cost-effective system forexpanding experimentally supported genome annotation. Thisapproach is therefore expected to bring the annotation of themouse and human genomes nearer to closure.
Experimental ProceduresGenome Sequences. The MGSCv3 assembly of the mouse genomedescribed in ref. 1 and the December, 2001 Golden Path assembly
†R.G. and E.T.D. contributed equally to this work.
**To whom correspondence should be addressed. E-mail: [email protected].
1140–1145 � PNAS � February 4, 2003 � vol. 100 � no. 3 www.pnas.org�cgi�doi�10.1073�pnas.0337561100
3.3. Validation of Results from Gene Predictors 89

of the human genome (National Center for Biotechnology Infor-mation Build 28) were downloaded from the University of Cali-fornia (Santa Cruz) genome browser (http:��genome.ucsc.edu).
Genome Alignments. TWINSCAN was run on the mouse genome byusing BLASTN alignments to the human genome (WU-BLAST,http:��blast.wustl.edu). Lowercase masking in the human se-quence was first converted to N masking. The result was furthermasked with NSEG by using default parameters, all Ns wereremoved, and the sequence was cut into 150-kb databasesegments. The mouse genome sequence was divided into1-mb query segments. BLASTN parameters were: M�1N��1Q�5 R�1 Z�3000000000 Y�3000000000 B�10000V�100 W�8 X�20 S�15 S2�15 gapS2�30 lcmaskwordmask�seg wordmask�dust topcomboN�3. TWINSCAN wasrun on the human genome by using separate BLASTN alignmentsto the mouse genome, which was prepared in the same way exceptthat Ns were not removed before creating the BLAST database.
SGP2 was run on the mouse and human genomes by using a singleset of alignments. The masked human genome was cut into 100-kbquery segments that were compared with a database of all 100-kbsegments of the mouse genome with TBLASTX (WU-BLAST,parameters: B�9000 V�9000 hspmax�500 topcom-boN�100 W�5 E�0.01 E2�0.01 Z�3000000000 nogapfilter�xnu�seg S2�80). The substitution matrix was BLOSUM62modified to penalize alignments with stop codons heavily (�500).
Initial Gene Predictions. TWINSCAN was run on 1-mb segments ofthe mouse and human genomes with target genome parametersidentical to the GENSCAN parameters and the 68-set-orthologconservation parameters (available on request). Note that theTWINSCAN results described in ref. 14 are based on a subse-quently developed set of target genome parameters that yieldsbetter results than those described here. SGP2 was run onunsegmented mouse and human chromosomes. The REFSEQgenes (which were not tested in the experiments reported here)were incorporated directly into the SGP2 predictions, whichimproved the predictions outside the REFSEQS slightly by pre-venting some gene fusion errors. Note that the REFSEQS were notused in generating the SGP2 results described in ref. 13.
Novelty Criteria. Mouse predictions were considered known ifthey overlapped ENSEMBL predictions or had 95% nucleotideidentity to a REFSEQ mRNA or an ENSEMBL-predicted mRNAover at least 100 bp. We used the most inclusive set of ENSEMBLpredictions available, based on the complete RIKEN cDNA setwithout further filtering (1).
Enrichment Procedure. The enrichment procedure was appliedseparately to predictions of TWINSCAN and SGP2. The proteinsequences predicted by each program in human and mouse werecompared by using BLASTP (19). For each predicted mouseprotein, all predicted human proteins with expect values �1 �
10�6 were called homologs. A global protein alignment wasproduced for the best scoring homologs (up to five) by usingT-COFFEE (ref. 39; http:��igs-server.cnrs-mrs.fr��cnotred�Projects�home�page�t�coffee�home�page.html) with default pa-rameters. Exonic structure was added to the alignments by usingEXSTRAL.PL (www1.imim.es��rcastelo�exstral.html). Whenboth members of an aligned pair contained an intron at the samecoordinate with at least 50% identity over 15 aa on both sides thecorresponding mouse prediction was assigned to the ‘‘enriched’’pool. Predictions with homologs but no aligned intron wereassigned to the ‘‘similar’’ pool.
RT-PCR. To test predictions, primers were designed in adjacentexons as described in Results and used in RT-PCR of total RNAfrom 12 normal mouse adult tissues. All procedures were asdescribed (20), except that JumpStart REDTaq ReadyMix(Sigma) and primers from Sigma-Genosys were used.
Additional Details. See supplementary information at www1.imim.es�datasets�mouse2002 for additional details of theseprocedures.
ResultsWe applied the two-stage procedure described above to theentire draft mouse and human genome sequences (see Experi-mental Procedures). TWINSCAN predicted 17,271 genes with atleast one aligned intron, whereas SGP2 predicted a largelyoverlapping set of 18,056 genes with at least one aligned intron.These predicted gene sets contain 145,734 exons and 168,492exons, respectively. Together the two sets overlapped 90% ofmultiexon ENSEMBL gene predictions.
To estimate a lower bound on the proportion of novel predictionsthat are transcribed and spliced, we performed a series of RT-PCRamplifications from 12 adult mouse tissues (20). We did not testgenes that overlap ENSEMBL predictions nor those that are 95%identical to ENSEMBL predictions or REFSEQ mRNAs over �100 bpor more. Because ENSEMBL was the standard for annotation of thedraft mouse genome, we refer to the non-ENSEMBL genes as‘‘novel.’’ A random sample of novel genes predicted by eachprogram and containing at least one aligned intron was tested.Primer pairs were designed in adjacent exons separated by analigned intron of at least 1,000 bp (Fig. 2). The exon pair to be testedwas chosen on the basis of intron length (minimum 1,000 bp),primer design requirements, and de novo gene prediction score,with no reference to protein, EST, or cDNA databases. Amplifi-cation followed by direct sequencing of the PCR product (Fig. 3)verified the exon pair in 133 unique predicted genes of 214 tested(62%, enriched pool, see Table 1 and www1.imim.es�datasets�mouse2002). Mouse genes predicted by both programs were veri-fied at a much higher rate than those predicted by just one program(76% vs. 27%). Extrapolating from the success rates in Table 1,testing the entire pool of 1,428 enriched predictions in this way is
Fig. 1. An example of predictions with aligned introns. RT-PCR positive predicted protein 3B1 (a novel homolog of Dystrophin) is aligned with its predicted humanortholog (N-terminal regions shown; Upper of each row: mouse, Lower of each row: human). Each color indicates one coding exon. Three of four predicted spliceboundaries (color boundaries) align perfectly. Any one of these three is sufficient for surviving the enrichment step. Gaps in the alignment (shown as dashes) mayindicate mispredicted regions.
Guigo et al. PNAS � February 4, 2003 � vol. 100 � no. 3 � 1141
GEN
ETIC
S
90 Chapter 3. Comparative Gene Finding

expected to yield a total of 788 (48) predictions with confirmedsplices, none of which overlap ENSEMBL predictions.
Considered in isolation, genes predicted by TWINSCAN had ahigher verification rate than those predicted by SGP2 (83% vs.
44%), but that difference is skewed by the fact that TWINSCANpredicted fewer exons per gene, and hence its predictions wereless likely to overlap ENSEMBL predictions. We corrected for thisby clustering overlapping TWINSCAN and SGP2 predictions toensure that both were counted as positive if either was verifiedexperimentally. For each program, the predictions belonging toa given cluster were counted only once, even if more than onewas RT-PCR positive. After this correction, the confirmationrates were much closer (76% for TWINSCAN vs. 62% for SGP2).The results shown in Table 1 include the correction. TheTWINSCAN verification rate is similar to the verification rate forgenes predicted by both programs because the exons predictedby TWINSCAN are largely a subset of those predicted by SGP2.
Before the enrichment procedure, the combined predictions ofSGP2 and TWINSCAN overlap 98% of multiexon ENSEMBL genes, ascompared with 90% for the enriched pool. This finding suggeststhat the enrichment procedure reduces sensitivity by a small butnoticeable degree. To investigate the potential loss of sensitivityfurther, we applied the same RT-PCR procedure to two samples ofgene predictions that were excluded by the enrichment criterion anddid not overlap ENSEMBL predictions. One sample had one or moreregions of strong similarity to a predicted human gene but did notsatisfy the aligned intron criterion (similar pool) whereas the otherlacked any strong similarity to a human prediction by the sameprogram (other pool). The verification rates for the similar andother pools were 25% and 20%, respectively, for genes predicted byboth programs, and 0% and 2%, respectively, for genes predictedby only one program (Table 1 and www1.imim.es�datasets�mouse2002). This finding shows that the enrichment procedureincreases specificity greatly and, consistent with the ENSEMBLoverlap analysis, reduces sensitivity only slightly. If all predictions inthe similar and other pools were tested the expected numbers ofsuccesses are 126 (105) and 105 (83), respectively, with the largestandard errors resulting from the small number of successfulamplifications in these pools.
As a control, we also tested 113 predictions from the enrichedpool that did overlap ENSEMBL predictions. In 66 of the predic-tions the splice boundary we tested was predicted identically inENSEMBL, and 64 of these tests (97%) were positive. In 47 of thepredictions the splice boundary we tested was not predictedidentically in ENSEMBL, and 21 of these tests (45%) were positive,
Fig. 2. Two examples of predicted gene structures (blue) with introns verified by RT-PCR from primers located in exons flanking the introns indicated in red.Mouse–human genomic alignments (orange) correlate with predicted exons but do not match them exactly. (A) Verified mouse prediction 6F5, a novel homologof Drosophila brain-specific homeobox protein (bsh), with matching human prediction. (B) Verified mouse prediction 11F6, a homolog of rat vanilloid receptortype 1-like protein 1. No matching human gene was predicted. A cDNA (GenBank accession no. AF510316) that matches the predicted protein over fourprotein-coding exons was deposited in GenBank subsequent to our analysis.
Fig. 3. Verification of gene predictions by RT-PCR analysis. (A and B) Test ofprediction 6F5, a homolog of Drosophila brain-specific homeobox protein (bsh).(C and D) Test of prediction 11F6, a homolog of rat vanilloid receptor type 1-likeprotein. Gel analysis of amplimers (*) with the source of the cDNA pool indicatedabove is shown in A and C. Primers (blue) and the region to which the amplimersequence aligned (underlining) are shown in B and D. The indicated forwardprimers were used to generate the amplimer sequences (brain amplimer, B; skinamplimer,D).Br,brain;Ey,eye;He,heart;Ki,kidney;Li, liver;Lu, lung;Mu,muscle;Ov, ovary; Sk, skin; St, stomach; Te, testis; Th, thymus.
1142 � www.pnas.org�cgi�doi�10.1073�pnas.0337561100 Guigo et al.
3.3. Validation of Results from Gene Predictors 91

despite the fact that ENSEMBL predictions are based on transcriptevidence. This verification rate may reflect alternative splicesidentified by our method but not by ENSEMBL.
To determine whether tissue-restricted expression could explainthe absence of the predictions we verified from the transcript-basedannotation, we compared the expression patterns of our RT-PCRpositive predictions to those of the complete set of mouse orthologsof genes mapping to human chromosome 21 (Hsa21). These geneswere chosen for comparison because they had been previouslysubjected to the same protocol with the same cDNA pools in thesame laboratory (20). Our verified novel gene predictions showeda significantly more restricted pattern of expression (Fig. 4A). Themean number of tissues for our positive predictions was 6.3, and33% of the positive predictions showed expression in three or fewertissues; the corresponding numbers for the mouse orthologs ofhuman chromosome 21 genes are 8.2 tissues on average and 14%showing expression in three or fewer tissues. This difference inexpression specificity was statistically significant (ANOVA, F �23.22, df � 1, P � 0.001).
To determine whether prediction of pseudogenes by our methodcould explain some of the RT-PCR negatives, we computed theratio of nonsynonymous to synonymous substitution rates (KA�KS)(21) for the subset of tested mouse predictions with unique putativehuman orthologs (Fig. 4B). The mean for PCR-positive predictionswas 0.29 whereas for PCR-negative predictions it was 0.72. Thedifference was statistically significant (ANOVA, F � 34.86, df � 1,P � 0.001), suggesting that (i) some of the negative predictions maybe pseudogenes, and (ii) KA�KS can be efficiently incorporated inthe enrichment protocol to increase specificity (22).
Among the predictions with confirmed splices, 112 had signifi-cant homology to known genes and�or domains. A few of thesegenes, which were not represented in databases at the beginning ofour gene survey, were submitted to databases and�or published inthe literature in the intervening months. For example, we correctlypredicted the first four protein coding exons of TRPV3, a heat-sensitive TRP channel in keratinocytes (23), and both exons ofRLN3 (preprorelaxin 3), an insulin-like prohormone (24). Theverified predictions with the most notable homologies are shown inTable 2, including a novel homolog of dystrophin that is discussedin the mouse genome paper (1). Table 2 includes two noncanonicalhomeobox genes, one that is most similar to fruitfly brain-specifichomeobox protein (Figs. 2 and 3 A and B) (25) and another that isa Not-class homeobox, likely to be involved in notochord develop-ment (26). Four predicted genes were found to be expressed in thebrain and are likely to have neuronal functions, including oneparalog each of: Nna1, which is expressed in regenerating motorneurons (27); an N-acetylated-�-linked-acidic dipeptidase, whichhydrolyses the neuropeptide N-acetyl-aspartyl-glutamate to termi-nate its neurotransmitter activity (28); a novel �-aminobutyric acid
type B receptor, which regulates neurotransmitter release (29); andan Ent2-like nucleoside transporter, which modulates neurotrans-mission by altering adenosine concentrations (30). Other verifiedgenes are likely to be important in muscle contraction (myosin lightchain kinase homolog), degradation of cell cycle proteins (fizzy�CDC20 homolog), Wnt-dependent vertebrate development(Dapper�frodo homolog), and solute and steroid transport in theliver (solute transporter �). Homologs of two further genes pre-dicted in our studies are associated with disease. ATP10C, anaminophospholipid translocase, is absent from Angelman syn-drome patients with imprinting mutations (31), and otoferlin, whichis mutated in a nonsyndromic form of deafness (32).
Fig. 4. Characteristics of verified predictions. (A) Expression specificity.Percentages of RT-PCR positive de novo predictions (red) and Hsa21 mouseorthologs (blue) expressed in 1–12 tissues, tested in the same cDNA pools. (B)Distributions of the ratio of nonsynonymous to synonymous substitution rate(KA�KS) in 83 RT-PCR positive (red) vs. 98 RT-PCR negative (blue) mousepredictions with reciprocal best BLAST matches among the human predictions.
Table 1. Predicted novel gene sets and RT-PCR verification rates
Pool Programs* No. of predictions No. tested No. positive Success rate, % Expected successes Standard error
Enriched† Both 827 154 117 75.97 628One 601 60 16 26.67 160Total 1,428 214 133 62.15 788 48
Similar‡ Both 505 16 4 25.00 126One 1,620 22 0 0.00 0Total 2,125 38 4 10.53 126 105
Other§ Both 234 5 1 20.00 46One 3,425 58 1 1.72 59Total 3,659 63 2 3.17 105 83
All Total 7,212 315 139 N�A 1,019
N�A, not applicable.*Both, Genes predicted at least partially by both TWINSCAN and SGP2 programs. One, Genes predicted by one program that are not overlapped by predictions ofthe other program. N�A, not applicable.
†Mouse gene predictions containing an intron whose flanking exonic regions align with flanking exonic regions predicted by the same program in human.‡Mouse gene predictions that fail the enrichment step but show regions of strong similarity to a gene predicted by the same program in human.§Mouse gene predictions without regions of strong similarity to any gene predicted by the same program in human.
Guigo et al. PNAS � February 4, 2003 � vol. 100 � no. 3 � 1143
GEN
ETIC
S
92 Chapter 3. Comparative Gene Finding
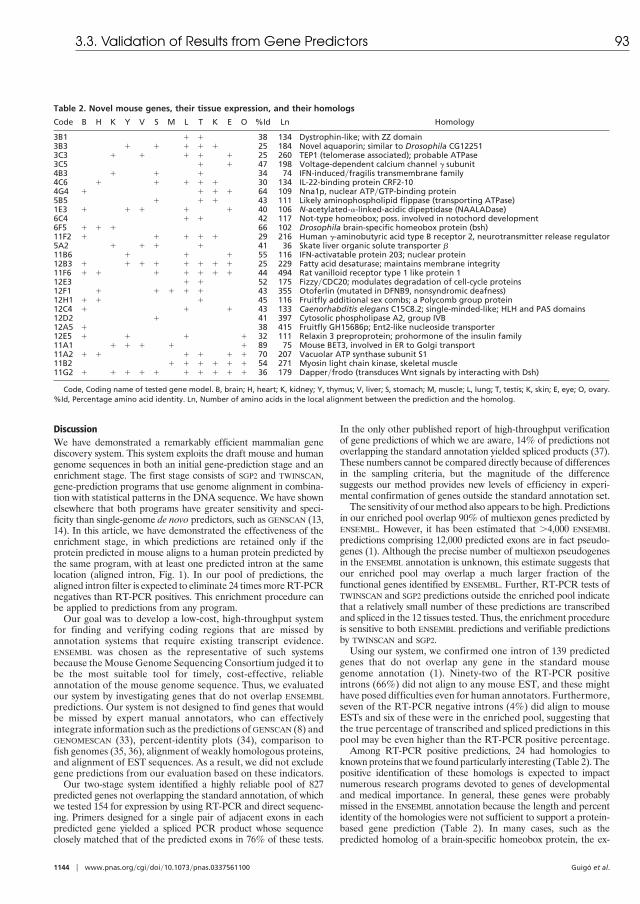
DiscussionWe have demonstrated a remarkably efficient mammalian genediscovery system. This system exploits the draft mouse and humangenome sequences in both an initial gene-prediction stage and anenrichment stage. The first stage consists of SGP2 and TWINSCAN,gene-prediction programs that use genome alignment in combina-tion with statistical patterns in the DNA sequence. We have shownelsewhere that both programs have greater sensitivity and speci-ficity than single-genome de novo predictors, such as GENSCAN (13,14). In this article, we have demonstrated the effectiveness of theenrichment stage, in which predictions are retained only if theprotein predicted in mouse aligns to a human protein predicted bythe same program, with at least one predicted intron at the samelocation (aligned intron, Fig. 1). In our pool of predictions, thealigned intron filter is expected to eliminate 24 times more RT-PCRnegatives than RT-PCR positives. This enrichment procedure canbe applied to predictions from any program.
Our goal was to develop a low-cost, high-throughput systemfor finding and verifying coding regions that are missed byannotation systems that require existing transcript evidence.ENSEMBL was chosen as the representative of such systemsbecause the Mouse Genome Sequencing Consortium judged it tobe the most suitable tool for timely, cost-effective, reliableannotation of the mouse genome sequence. Thus, we evaluatedour system by investigating genes that do not overlap ENSEMBLpredictions. Our system is not designed to find genes that wouldbe missed by expert manual annotators, who can effectivelyintegrate information such as the predictions of GENSCAN (8) andGENOMESCAN (33), percent-identity plots (34), comparison tofish genomes (35, 36), alignment of weakly homologous proteins,and alignment of EST sequences. As a result, we did not excludegene predictions from our evaluation based on these indicators.
Our two-stage system identified a highly reliable pool of 827predicted genes not overlapping the standard annotation, of whichwe tested 154 for expression by using RT-PCR and direct sequenc-ing. Primers designed for a single pair of adjacent exons in eachpredicted gene yielded a spliced PCR product whose sequenceclosely matched that of the predicted exons in 76% of these tests.
In the only other published report of high-throughput verificationof gene predictions of which we are aware, 14% of predictions notoverlapping the standard annotation yielded spliced products (37).These numbers cannot be compared directly because of differencesin the sampling criteria, but the magnitude of the differencesuggests our method provides new levels of efficiency in experi-mental confirmation of genes outside the standard annotation set.
The sensitivity of our method also appears to be high. Predictionsin our enriched pool overlap 90% of multiexon genes predicted byENSEMBL. However, it has been estimated that �4,000 ENSEMBLpredictions comprising 12,000 predicted exons are in fact pseudo-genes (1). Although the precise number of multiexon pseudogenesin the ENSEMBL annotation is unknown, this estimate suggests thatour enriched pool may overlap a much larger fraction of thefunctional genes identified by ENSEMBL. Further, RT-PCR tests ofTWINSCAN and SGP2 predictions outside the enriched pool indicatethat a relatively small number of these predictions are transcribedand spliced in the 12 tissues tested. Thus, the enrichment procedureis sensitive to both ENSEMBL predictions and verifiable predictionsby TWINSCAN and SGP2.
Using our system, we confirmed one intron of 139 predictedgenes that do not overlap any gene in the standard mousegenome annotation (1). Ninety-two of the RT-PCR positiveintrons (66%) did not align to any mouse EST, and these mighthave posed difficulties even for human annotators. Furthermore,seven of the RT-PCR negative introns (4%) did align to mouseESTs and six of these were in the enriched pool, suggesting thatthe true percentage of transcribed and spliced predictions in thispool may be even higher than the RT-PCR positive percentage.
Among RT-PCR positive predictions, 24 had homologies toknown proteins that we found particularly interesting (Table 2). Thepositive identification of these homologs is expected to impactnumerous research programs devoted to genes of developmentaland medical importance. In general, these genes were probablymissed in the ENSEMBL annotation because the length and percentidentity of the homologies were not sufficient to support a protein-based gene prediction (Table 2). In many cases, such as thepredicted homolog of a brain-specific homeobox protein, the ex-
Table 2. Novel mouse genes, their tissue expression, and their homologs
Code B H K Y V S M L T K E O %Id Ln Homology
3B1 � � 38 134 Dystrophin-like; with ZZ domain3B3 � � � � � 25 184 Novel aquaporin; similar to Drosophila CG122513C3 � � � � � 25 260 TEP1 (telomerase associated); probable ATPase3C5 � � 47 198 Voltage-dependent calcium channel � subunit4B3 � � � 34 74 IFN-induced�fragilis transmembrane family4C6 � � � � � 30 134 IL-22-binding protein CRF2-104G4 � � � � 64 109 Nna1p, nuclear ATP�GTP-binding protein5B5 � � � 43 111 Likely aminophospholipid flippase (transporting ATPase)1E3 � � � � � 40 106 N-acetylated-�-linked-acidic dipeptidase (NAALADase)6C4 � � 42 117 Not-type homeobox; poss. involved in notochord development6F5 � � � 66 102 Drosophila brain-specific homeobox protein (bsh)11F2 � � � � � 29 216 Human �-aminobutyric acid type B receptor 2, neurotransmitter release regulator5A2 � � � � 41 36 Skate liver organic solute transporter �11B6 � � � 55 116 IFN-activatable protein 203; nuclear protein12B3 � � � � � � � � 25 229 Fatty acid desaturase; maintains membrane integrity11F6 � � � � � � � 44 494 Rat vanilloid receptor type 1 like protein 112E3 � � 52 175 Fizzy�CDC20; modulates degradation of cell-cycle proteins12F1 � � � � � 43 355 Otoferlin (mutated in DFNB9, nonsyndromic deafness)12H1 � � � 45 116 Fruitfly additional sex combs; a Polycomb group protein12C4 � � � 43 133 Caenorhabditis elegans C15C8.2; single-minded-like; HLH and PAS domains12D2 � 41 397 Cytosolic phospholipase A2, group IVB12A5 � 38 415 Fruitfly GH15686p; Ent2-like nucleoside transporter12E5 � � � � 32 111 Relaxin 3 preproprotein; prohormone of the insulin family11A1 � � � � � 89 75 Mouse BET3, involved in ER to Golgi transport11A2 � � � � � � 70 207 Vacuolar ATP synthase subunit S111B2 � � � � � � 54 271 Myosin light chain kinase, skeletal muscle11G2 � � � � � � � � � � 36 179 Dapper�frodo (transduces Wnt signals by interacting with Dsh)
Code, Coding name of tested gene model. B, brain; H, heart; K, kidney; Y, thymus; V, liver; S, stomach; M, muscle; L, lung; T, testis; K, skin; E, eye; O, ovary.%Id, Percentage amino acid identity. Ln, Number of amino acids in the local alignment between the prediction and the homolog.
1144 � www.pnas.org�cgi�doi�10.1073�pnas.0337561100 Guigo et al.
3.3. Validation of Results from Gene Predictors 93

pression patterns we found were consistent with what would beexpected from the function of the known homolog (Fig. 3 A and B).
The confirmed 139 genes also showed a relatively restrictedexpression pattern, on average. Because all mouse orthologs ofgenes on human chromosome 21 had already been tested by usingthe same experimental protocol and the same cDNA pools, we wereable to directly compare expression patterns. To the extent that theknown genes on chromosome 21 are no more tissue specific thanthe complete set of known genes, the results (Fig. 4) suggest that oursystem may be particularly sensitive to genes with tissue-restrictedexpression. Qualitatively similar restricted expression patterns werereported for novel GENSCAN predictions on chromosome 22 (37),lending further support to the value of de novo prediction foridentifying genes with tissue-restricted expression.
Of the RT-PCR positive novel predictions, only 33% haveidentifiable homologs in the sequenced fish (Fugu�Tetraodon�zebrafish) genomes. Comparing this finding to the recent estimatethat three-quarters of all human genes can be recognized in theFugu genome (36) suggests that our system may be particularlysensitive to genes that are not ubiquitous in the vertebrate lineage.Genes with relatively restricted expression patterns and speciesdistribution can be difficult to find by using transcript-based meth-ods like GENEWISE (38) and compact-genome methods like EXO-FISH (35), but they appear to be tractable for our system.
Extrapolating from the success rates in all categories, the ex-pected total number of gene predictions that could be successfullyRT-PCR amplified in the cDNA pools we tested is 1,019 (Table 1),adding �5% to the number of functional mouse genes identified byENSEMBL (1). The number of distinct genes verifiable in this waymay be slightly smaller, because the effect of fragmentation inENSEMBL and in our predictions is not readily testable. However, thenumber of predictions that are transcribed and spliced is likely tobe �1,019, because (i) we tested only one exon pair from eachprediction and (ii) we used only 12 adult mouse tissues (20).
The relatively low success rate in the pools failing the enrichmentstep suggests that the number of real, multiexon genes whoseexistence has been predicted but not yet confirmed is in the rangeof 1,000–2,000 (including those predictions in the enriched pool thathave not been confirmed). Because we have used only two predic-tion programs, TWINSCAN and SGP2, it is possible that other pro-grams might yield a large additional set of predictions that pass theenrichment step. However, GENSCAN yields only 49 additionalpredictions that pass enrichment and novelty criteria and do not
overlap the 1,428 “aligned intron” novel predictions from TWIN-SCAN and SGP2 (3%). These 49 are worth testing, and adding moreprediction programs will yield at least a few more predictions withaligned introns. Nonetheless, the data presented here suggest thatthe 1,428 predictions in the enriched pool may overlap a significantfraction of the previously unannotated, multiexon mouse genes.
Using the draft sequences of the mouse and human genomes,we have developed a cost-effective, high-throughput system forpredicting genes and verifying the existence of correspondingspliced transcripts. Applying this system to the entire mousegenome, we showed that an automated system can produce alarge set of experimentally supported mammalian gene predic-tions outside the standard annotation. Further, the average costper verified exon pair is less than two primer pairs and sequenc-ing reactions. We expect that testing the remaining predictionsin the enriched pool will locate most multiexon mouse genes thatare currently unannotated, bringing us significantly closer toidentification of the complete mammalian gene set.
As more mammalian genomes are sequenced, the need forexperimentally validated high-throughput annotation will con-tinue to grow, as will the data available for methods such as ours.Using the sequences of more genomes, it may be possible toextend this approach to single-exon and lineage-specific genes.In combination with methods like ENSEMBL and refinement byexpert annotators, these developments may bring complete,experimentally supported genome annotation within reach.
We are grateful to the Mouse Genome Sequencing Consortium for pro-viding the mouse genome sequence as well as support throughout theanalysis process. We are particularly grateful to Eric Lander, RobertWaterston, Ewan Birney, Adam Felsenfeld, and Ross Hardison for adviceand encouragement. Thanks are also due to Marc Vidal, Lior Pachter,Kerstin Lindblad-Toh, and Gwen Acton for participation in pilot experi-ments and Tamara Doering for helpful comments on the manuscript.Research at Institut Municipal d’Investigacio Medica�Universitat PompeuFabra�Centre de Regulacio Genomica is supported by a grant from theSpanish Plan Nacional de Investigacion y Desarrollo. J.F.A. is supported bya fellowship from the Instituto de Salud Carlos III. The Division of MedicalGenetics is supported by the Swiss National Science Foundation, NationalCentres of Competence in Research Frontiers in Genetics, and the Child-care and J. Lejeune Foundations. Research at Washington University wassupported by Grant DBI-0091270 from the National Science Foundation(to M.R.B.) and Grant HG02278 from the National Institutes of Health(to M.R.B.).
1. Mouse Genome Sequencing Consortium (2002) Nature 420, 520–562.2. Hubbard, T., Barker, D., Birney, E., Cameron, G., Chen, Y., Clark, L., Cox, T., Cuff,
J., Curwen, V., Down, T., et al. (2002) Nucleic Acids Res. 30, 38–41.3. Pruitt, K. D. & Maglott, D. R. (2001) Nucleic Acids Res. 29, 137–140.4. Kawai, J., Shinagawa, A., Shibata, K., Yoshino, M., Itoh, M., Ishii, Y., Arakawa, T.,
Hara, A., Fukunishi, Y., Konno, H., et al. (2001) Nature 409, 685–690.5. The FANTOM Consortium and The RIKEN Genome Exploration Research Group
Phase II Team (2002) Nature 420, 563–571.6. Bairoch, A. & Apweiler, R. (2000) Nucleic Acids Res. 28, 45–48.7. Gasteiger, E., Jung, E. & Bairoch, A. (2001) Curr. Issues Mol. Biol. 3, 47–55.8. Burge, C. & Karlin, S. (1997) J. Mol. Biol. 268, 78–94.9. Wiehe, T., Gebauer-Jung, S., Mitchell-Olds, T. & Guigo, R. (2001) Genome Res. 11,
1574–1583.10. Pachter, L., Alexandersson, M. & Cawley, S. (2002) J. Comput. Biol. 9, 389–399.11. Batzoglou, S., Pachter, L., Mesirov, J. P., Berger, B. & Lander, E. S. (2000) Genome
Res. 10, 950–958.12. Bafna, V. & Huson, D. H. (2000) Proc. Int. Conf. Intell. Syst. Mol. Biol. 8, 3–12.13. Parra, G., Agarwal, P., Abril, J. F., Wiehe, T., Fickett, J. W. & Guigo, R. (2003)
Genome Res. 13, 108–117.14. Flicek, P., Keibler, E., Hu, P., Korf, I. & Brent, M. R. (2003) Genome Res. 13, 46–54.15. Korf, I., Flicek, P., Duan, D. & Brent, M. R. (2001) Bioinformatics 17, Suppl. 1.,
S140–S148.16. Parra, G., Blanco, E. & Guigo, R. (2000) Genome Res. 10, 511–515.17. Guigo, R., Knudsen, S., Drake, N. & Smith, T. (1992) J. Mol. Biol. 226, 141–157.18. Altschul, S. F., Gish, W., Miller, W., Myers, E. W. & Lipman, D. J. (1990) J. Mol. Biol.
215, 403–410.19. Altschul, S. F., Madden, T. L., Schaffer, A. A., Zhang, J., Zhang, Z., Miller, W. &
Lipman, D. J. (1997) Nucleic Acids Res. 25, 3389–3402.20. Reymond, A., Marigo, V., Yaylaoglu, M. B., Leoni, A., Ucla, C., Scamuffa, N.,
Caccioppoli, C., Dermitzakis, E. T., Lyle, R., Banfi, S., et al. (2002) Nature 420, 582–586.21. Hughes, A. L. & Nei, M. (1988) Nature 335, 167–170.
22. Nekrutenko, A., Makova, K. D. & Li, W. H. (2002) Genome Res. 12, 198–202.23. Peier, A. M., Reeve, A. J., Andersson, D. A., Moqrich, A., Earley, T. J., Hergarden,
A. C., Story, G. M., Colley, S., Hogenesch, J. B., McIntyre, P., et al. (2002) Science296, 2046–2049.
24. Bathgate, R. A., Samuel, C. S., Burazin, T. C., Layfield, S., Claasz, A. A., Reytomas, I. G.,Dawson, N. F., Zhao, C., Bond, C., Summers, R. J., et al. (2002) J. Biol. Chem. 277, 1148–1157.
25. Jones, B. & McGinnis, W. (1993) Development (Cambridge, U.K.) 117, 793–806.26. Talbot, W. S., Trevarrow, B., Halpern, M. E., Melby, A. E., Farr, G., Postlethwait,
J. H., Jowett, T., Kimmel, C. B. & Kimelman, D. (1995) Nature 378, 150–157.27. Harris, A., Morgan, J. I., Pecot, M., Soumare, A., Osborne, A. & Soares, H. D. (2000)
Mol. Cell. Neurosci. 16, 578–596.28. Pangalos, M. N., Neefs, J. M., Somers, M., Verhasselt, P., Bekkers, M., van der Helm,
L., Fraiponts, E., Ashton, D. & Gordon, R. D. (1999) J. Biol. Chem. 274, 8470–8483.29. Billinton, A., Ige, A. O., Bolam, J. P., White, J. H., Marshall, F. H. & Emson, P. C.
(2001) Trends Neurosci. 24, 277–282.30. Crawford, C. R., Patel, D. H., Naeve, C. & Belt, J. A. (1998) J. Biol. Chem. 273, 5288–5293.31. Meguro, M., Kashiwagi, A., Mitsuya, K., Nakao, M., Kondo, I., Saitoh, S. &
Oshimura, M. (2001) Nat. Genet. 28, 19–20.32. Yasunaga, S., Grati, M., Cohen-Salmon, M., El-Amraoui, A., Mustapha, M., Salem,
N., El-Zir, E., Loiselet, J. & Petit, C. (1999) Nat. Genet. 21, 363–369.33. Yeh, R. F., Lim, L. P. & Burge, C. B. (2001) Genome Res. 11, 803–816.34. Schwartz, S., Zhang, Z., Frazer, K. A., Smit, A., Riemer, C., Bouck, J., Gibbs, R.,
Hardison, R. & Miller, W. (2000) Genome Res. 10, 577–586.35. Roest Crollius, H., Jaillon, O., Bernot, A., Dasilva, C., Bouneau, L., Fischer, C., Fizames,
C., Wincker, P., Brottier, P., Quetier, F., et al. (2000) Nat. Genet. 25, 235–238.36. Aparicio, S., Chapman, J., Stupka, E., Putnam, N., Chia, J. M., Dehal, P., Christoffels,
A., Rash, S., Hoon, S., Smit, A., et al. (2002) Science 297, 1301–1310.37. Das, M., Burge, C. B., Park, E., Colinas, J. & Pelletier, J. (2001) Genomics 77, 71–78.38. Birney, E. & Durbin, R. (2000) Genome Res. 10, 547–548.39. Notre dame, C., Higgins, D. G. & Heringa, J. (2000) J. Mol. Biol. 302, 205–217.
Guigo et al. PNAS � February 4, 2003 � vol. 100 � no. 3 � 1145
GEN
ETIC
S
94 Chapter 3. Comparative Gene Finding

3.3. Validation of Results from Gene Predictors 95
Figure 3.10: A web server to display RT-PCR results over predicted genes. A small databasecontaining all the 476 genes that were submitted for the RT-PCR validation test was provided assupplementary materials for Guigó et al. [2003, see also page 215 on web glossary]. That pool ofgenes was filtered out from the gene predictions by SGP2and Twinscan on the mouse genomeby exploiting conservation in mouse-human exonic structure.


Chapter 4
Sequence features
of Eukaryotic Genes
The human mind has first to construct forms,independently, before we can find them in things.
—Albert Einstein
Most genes in higher eukaryotes are interrupted by non-coding sequences (introns) thatmust be precisely excised from pre-messenger RNA (pre-mRNA) molecules to yield ma-ture, functional mRNAs. In those organisms, splicing introduces an additional level ofdecoding on the sequence of the primary RNA transcript, prior to translation. The geneticcode is essentially deterministic. Within a given species, a given triplet in the mRNA se-quence results always in the same amino acid. In contrast, the splicing code is inherentlystochastic. The probability of a splicing sequence in the primary transcript to participatein the definition of an intron boundary ranges from zero to one, and is conditioned to verymany different factors.
The unexpected discovery in 1977 of split genes in the adenovirus 2 (Ad2) mRNAs[Berget et al., 1977; Chow et al., 1977], started an amazing scientific endeavour. In thischapter we start with an overview of the current knowledge about the splicing processat molecular level. Then we report a comparative computational analysis of orthologoussplice sites of four vertebrate genomes.
4.1 The Molecular Basis of Splicing
A typical mammalian gene contains nine introns and spans about 30kb. An average intronis over 3000bp long, while an average exon is only about 150bp [Lander et al., 2001]. Ithas been known for a long time that intron removal and the ligation of flanking sequences(exons) occurs through two sequential trans-esterification reactions that are carried out bya multicomponent complex that is known as the spliceosome (see Figure 4.1).
97
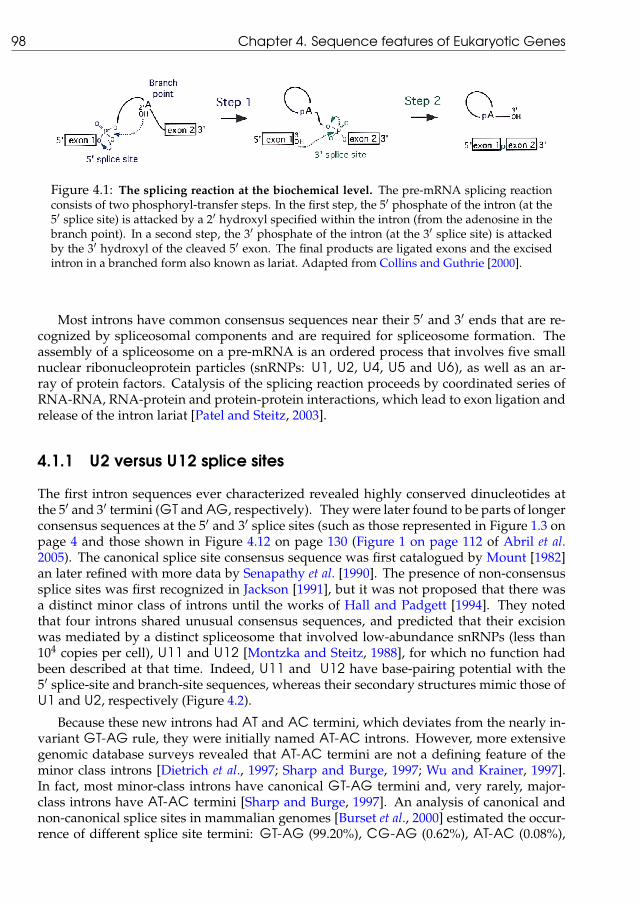
98 Chapter 4. Sequence features of Eukaryotic Genes
Figure 4.1: The splicing reaction at the biochemical level. The pre-mRNA splicing reactionconsists of two phosphoryl-transfer steps. In the first step, the 5′ phosphate of the intron (at the5′ splice site) is attacked by a 2′ hydroxyl specified within the intron (from the adenosine in thebranch point). In a second step, the 3′ phosphate of the intron (at the 3′ splice site) is attackedby the 3′ hydroxyl of the cleaved 5′ exon. The final products are ligated exons and the excisedintron in a branched form also known as lariat. Adapted from Collins and Guthrie [2000].
Most introns have common consensus sequences near their 5′ and 3′ ends that are re-cognized by spliceosomal components and are required for spliceosome formation. Theassembly of a spliceosome on a pre-mRNA is an ordered process that involves five smallnuclear ribonucleoprotein particles (snRNPs: U1, U2, U4, U5 and U6), as well as an ar-ray of protein factors. Catalysis of the splicing reaction proceeds by coordinated series ofRNA-RNA, RNA-protein and protein-protein interactions, which lead to exon ligation andrelease of the intron lariat [Patel and Steitz, 2003].
4.1.1 U2 versus U12 splice sites
The first intron sequences ever characterized revealed highly conserved dinucleotides atthe 5′ and 3′ termini (GT and AG, respectively). They were later found to be parts of longerconsensus sequences at the 5′ and 3′ splice sites (such as those represented in Figure 1.3 onpage 4 and those shown in Figure 4.12 on page 130 (Figure 1 on page 112 of Abril et al.2005). The canonical splice site consensus sequence was first catalogued by Mount [1982]an later refined with more data by Senapathy et al. [1990]. The presence of non-consensussplice sites was first recognized in Jackson [1991], but it was not proposed that there wasa distinct minor class of introns until the works of Hall and Padgett [1994]. They notedthat four introns shared unusual consensus sequences, and predicted that their excisionwas mediated by a distinct spliceosome that involved low-abundance snRNPs (less than104 copies per cell), U11 and U12 [Montzka and Steitz, 1988], for which no function hadbeen described at that time. Indeed, U11 and U12 have base-pairing potential with the5′ splice-site and branch-site sequences, whereas their secondary structures mimic those ofU1 and U2, respectively (Figure 4.2).
Because these new introns had AT and AC termini, which deviates from the nearly in-variant GT-AG rule, they were initially named AT-AC introns. However, more extensivegenomic database surveys revealed that AT-AC termini are not a defining feature of theminor class introns [Dietrich et al., 1997; Sharp and Burge, 1997; Wu and Krainer, 1997].In fact, most minor-class introns have canonical GT-AG termini and, very rarely, major-class introns have AT-AC termini [Sharp and Burge, 1997]. An analysis of canonical andnon-canonical splice sites in mammalian genomes [Burset et al., 2000] estimated the occur-rence of different splice site termini: GT-AG (99.20%), CG-AG (0.62%), AT-AC (0.08%),
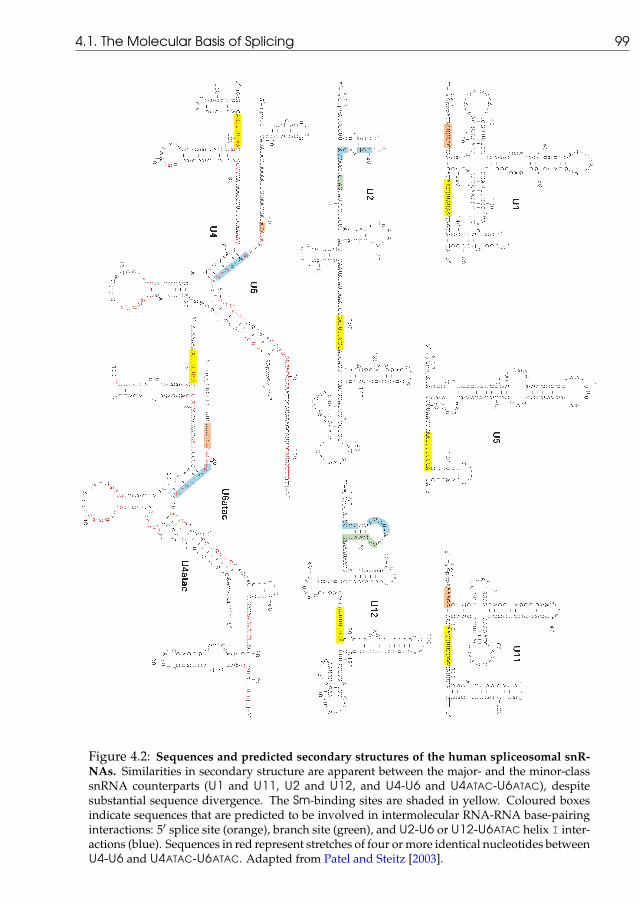
4.1. The Molecular Basis of Splicing 99
Figure 4.2: Sequences and predicted secondary structures of the human spliceosomal snR-NAs. Similarities in secondary structure are apparent between the major- and the minor-classsnRNA counterparts (U1 and U11, U2 and U12, and U4-U6 and U4ATAC-U6ATAC), despitesubstantial sequence divergence. The Sm-binding sites are shaded in yellow. Coloured boxesindicate sequences that are predicted to be involved in intermolecular RNA-RNA base-pairinginteractions: 5′ splice site (orange), branch site (green), and U2-U6 or U12-U6ATAC helix I inter-actions (blue). Sequences in red represent stretches of four or more identical nucleotides betweenU4-U6 and U4ATAC-U6ATAC. Adapted from Patel and Steitz [2003].

100 Chapter 4. Sequence features of Eukaryotic Genes
other non-canonical (0.03%) and errors (0.06%). A more recent analysis of such frequen-cies for human, mouse and rat splice sites can be found in Table 4.3 on page 132 (Table 2on page 114 of Abril et al. 2005). Biochemical studies showed that mutation of AT-AC toGT-AG termini did not interfere with splicing by the U12-dependent pathway. Instead,U12-dependent splicing is determined by the longer and more tightly constrained consen-sus sequences at the 5′ splice site and branch site of minor-class introns, as well as by thelack of a polypyrimidine tract upstream of the 3′ splice site [Dietrich et al., 1997; Sharp andBurge, 1997; Burge et al., 1998]. Therefore, the more suitable ’U12-type’ nomenclature wasadopted for this new class of introns.
4.1.2 The splicing process
For major-class introns, spliceosome assembly (see left pathway of Figure 4.3) is thoughtto begin with the association of the U1 and U2 snRNPs by base-pairing interactions withconserved sequences at the 5′ splice site (5′ss) and intron branch site, respectively [Reed,1996]. During the spliceosome assembly, the U1 snRNP binds to the 5′ss via base basepairing between the splice site and the U1 snRNA. The 3′ splice site (3′ss) elements arebound by a special set of protein factors, SF1 (a branch-point binding protein, also calledBBP in yeast), SF3, and a dimeric U2 snRNP auxiliary factor (U2AF). The 65kDa subunitof U2AF binds to the polypyrimidine track. In at least some cases, the 35kDa subunit ofU2AF binds to the AG at the intron/exon junction. In mammalian cells, selection of thebranch point is based primarily upon relative position, in the vast majority of cases theRNA branch forms 18–38 nucleotides upstream of the 3′ss. It is probable that this distanceconstraint reflects the requirement for the U2AF protein. The earliest defined complex inspliceosome assembly, called the commitment complex or E-complex (early), contains U1and U2AF bound at the two intron ends [Burge et al., 1999]. The E-complex is joined bythe U2 snRNP, whose snRNA base-pairs at the branch point, to form the A complex. TheU2 branch-site duplex protrudes outwards the adenosine residue, the 2′ hydroxyl group ofwhich participates in the first nucleophilic atack.
The tri-snRNP complex of U5 and the base-paired U4-U6 then stably joins the pre-spliceosome [Konarska and Sharp, 1987] to form the B-complex, although there is evidenceto suggest that U5 interacts upstream of the 5′ss at a much earlier stage [Wyatt et al., 1992].The B-complex undergoes a complicated rearrangement to form the activated spliceosome(B∗-complex). This rearrangement is promoted by ATP-hydrolyzing protein factors thatjuxtapose the 5′ and 3′ss and form the catalytic core. U4-U6 duplexes unwind [Lamondet al., 1988], and the U4 and U1 snRNPs are displaced, which allows U6 to form base-pairing interactions with the 5′ss [Wassarman and Steitz, 1992] and with a region of U2that is near the U2 branch-site duplex [Datta and Weiner, 1991; Hausner et al., 1990; Mad-hani and Guthrie, 1992; Wu and Manley, 1991]. The activated spliceosome catalyzes thefirst trans-esterification step of splicing and the C-complex is formed. The U5 snRNP hasbeen shown to base-pair with sequences in both the 5′ and 3′ exons (see Figure 4.4). U5 isalso believed to position the ends of the two exons for the second step of splicing [Wyattet al., 1992; Wassarman and Steitz, 1992; Newman and Norman, 1991, 1992; Sontheimer andSteitz, 1993]. After the second step has been completed, the ligated exons and a lariat in-tron are released, and the spliceosomal components dissociate and are recycled for furtherrounds of splicing.
Two general properties of the spliceosome are remarkable. First, it is conserved from

4.1. The Molecular Basis of Splicing 101
Figure 4.3: Pathways of assembly and catalysis of U2 and U12 spliceosomes. The major-class (left ) and the minor-class (right ) splicing pathways are shown side by side, highlightingtheir similarities and differences. The two pathways are mechanistically very similar. Theprimary differences occur during the early steps of spliceosome formation. The two trans-esterification reactions are indicated by red arrows. Each schematic snRNP is shown as a smallnuclear RNA (not drawn to scale, with the 5′ terminus denoted by a dot) with the surround-ing shaded area representing proteins. The polypyrimidine track of the major-class intron isshaded blue. Green bars represent interactions between the conserved loop of U5 and exontermini. Adapted from Patel and Steitz [2003].
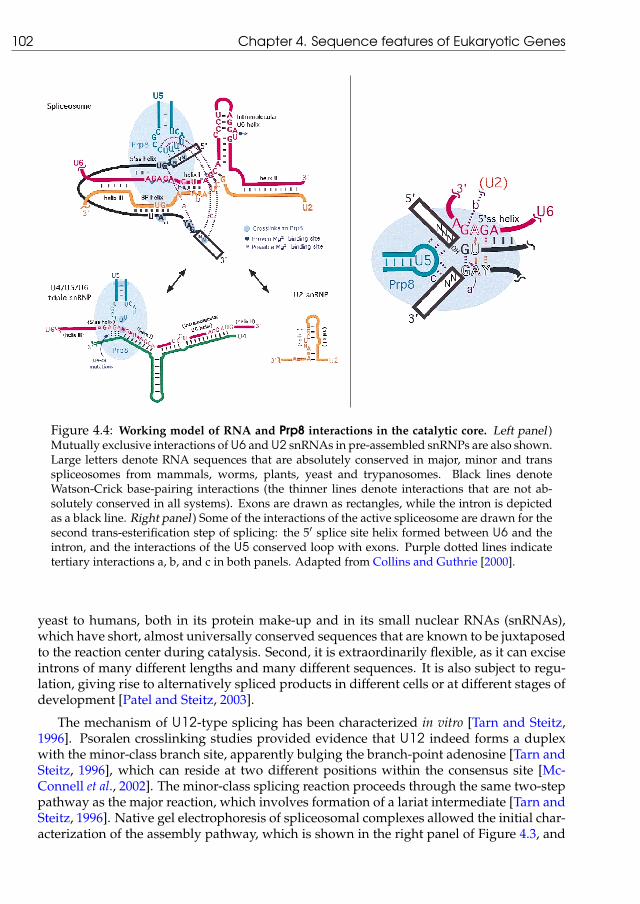
102 Chapter 4. Sequence features of Eukaryotic Genes
Figure 4.4: Working model of RNA and Prp8 interactions in the catalytic core. Left panel )Mutually exclusive interactions of U6 and U2 snRNAs in pre-assembled snRNPs are also shown.Large letters denote RNA sequences that are absolutely conserved in major, minor and transspliceosomes from mammals, worms, plants, yeast and trypanosomes. Black lines denoteWatson-Crick base-pairing interactions (the thinner lines denote interactions that are not ab-solutely conserved in all systems). Exons are drawn as rectangles, while the intron is depictedas a black line. Right panel ) Some of the interactions of the active spliceosome are drawn for thesecond trans-esterification step of splicing: the 5′ splice site helix formed between U6 and theintron, and the interactions of the U5 conserved loop with exons. Purple dotted lines indicatetertiary interactions a, b, and c in both panels. Adapted from Collins and Guthrie [2000].
yeast to humans, both in its protein make-up and in its small nuclear RNAs (snRNAs),which have short, almost universally conserved sequences that are known to be juxtaposedto the reaction center during catalysis. Second, it is extraordinarily flexible, as it can exciseintrons of many different lengths and many different sequences. It is also subject to regu-lation, giving rise to alternatively spliced products in different cells or at different stages ofdevelopment [Patel and Steitz, 2003].
The mechanism of U12-type splicing has been characterized in vitro [Tarn and Steitz,1996]. Psoralen crosslinking studies provided evidence that U12 indeed forms a duplexwith the minor-class branch site, apparently bulging the branch-point adenosine [Tarn andSteitz, 1996], which can reside at two different positions within the consensus site [Mc-Connell et al., 2002]. The minor-class splicing reaction proceeds through the same two-steppathway as the major reaction, which involves formation of a lariat intermediate [Tarn andSteitz, 1996]. Native gel electrophoresis of spliceosomal complexes allowed the initial char-acterization of the assembly pathway, which is shown in the right panel of Figure 4.3, and

4.1. The Molecular Basis of Splicing 103
indicated that U11, U12 and U5 were components of the minor-class spliceosome [Tarn andSteitz, 1996]. Interaction of U11 with the 5′ splice site was later confirmed by site-specificcrosslinking [Yu and Steitz, 1997].
U4ATAC and U6ATAC are two low-abundance snRNPs with copy numbers similar tothose of U11 and U12. Although their sequences diverge significantly from those of U4 andU6 (see Figure 4.2), they predict analogous secondary structures and interactions with thepre-mRNA and other snRNAs. Crosslinking studies confirmed the predicted interactionsbetween U4ATAC and U6ATAC [Yu and Steitz, 1997], between U6ATAC and the minor-class5′ss [Tarn and Steitz, 1996], and between U6ATAC and U12 [Yu and Steitz, 1997]. Thisshowed that the two spliceosomes undergo comparable dynamic rearrangements in whichthe snRNAs assume equivalent architectures, as shown in Figure 4.3.
In vivo evidence of the requirement of U12 minor-class splicing came from genetic sup-pression experiments, in which the deficient splicing of a minor-class intron containingtwo point mutations at the branch site was rescued by co-expression of a U12 snRNAwith compensatory mutations [Hall and Padgett, 1996]. Similar genetic suppression ex-periments provided evidence for the in vivo interaction between the minor-class 5′ss withU11 [Kolossova and Padgett, 1997], and U6ATAC [Incorvaia and Padgett, 1998]. Fruit-fliesthat are homozygous for disruptions in U12 or U6ATAC genes do not survive early devel-opment, which indicates that the minor-class spliceosome is essential for organisms thatharbour U12-type introns [Otake et al., 2002]. Indeed, the presence of U12-type intronswithin most metazoan genomes indicates that an active U12-type splicing system is indis-pensable for the cells of most multicellular organisms [Patel and Steitz, 2003].
Of the snRNAs employed in splicing, only U5 snRNA is shared between the twospliceosomes, whereas the vast majority of the spliceosomal proteins appear to be shared[Will et al., 1999, 2001; Schneider et al., 2002; Luo et al., 1999]. The U5 snRNP is unique inserving as a component of both spliceosomes, which indicates that it does not base-pairwith sequences that differ between the two intron types. Although its role in the major-class spliceosome can involve base-pairing [Wyatt et al., 1992; Wassarman and Steitz, 1992;Newman and Norman, 1991, 1992; Sontheimer and Steitz, 1993], proteins are known tosupport the juxtaposition of exons for the second step of splicing. Recent evidence thatthe protein components of U5 undergo marked remodeling during spliceosome activation[Makarov et al., 2002] indicates that U5 has a pivotal role in recruiting common proteinfactors to the two spliceosomes.
4.1.3 Integrating splicing in the protein synthesis pathway
Throughout their lifetimes mRNAs exists, in vivo, as mRNA-protein particles (mRNPs).The associated proteins control every aspect of mRNA metabolism, from subcellular trans-port to translational efficiency to their rate of decay. Exactly which proteins associate witha particular mRNA depends on its sequence, its subcellular localization and its synthetichistory. Furthermore, the complement of mRNA proteins evolves as the mRNA movesto different locations and is acted on by such processes as nuclear export and translation[Reichert et al., 2002].
On the other hand, many pre-mRNA processing events—including 5′ end capping,splicing exons together, and 3′ end maturation by cleavage or polyadenylation—occurwhile the nascent RNA chain is being synthesized by RNA polymerase II. The RNApolII
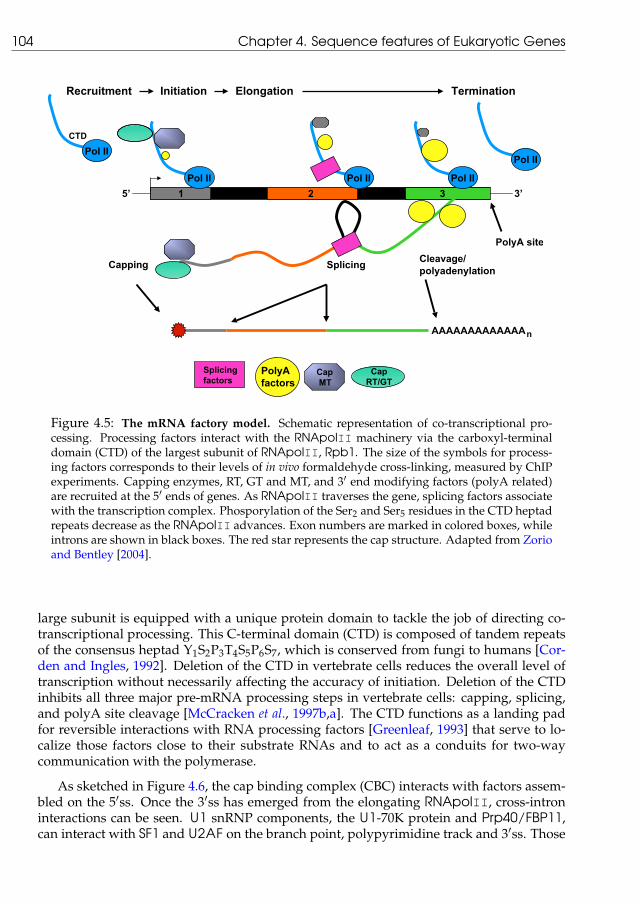
104 Chapter 4. Sequence features of Eukaryotic Genes
(Fig. 1). Excellent recent reviews of this area include
Refs. [18 – 24].
Capping: two-way commu nication between pol II and
processing enzymes
All pol II transcripts are marked at their 5V ends by the
addition of a methylated guanosine cap, when nascent RNA
is about 22 – 40 bases long [25 – 28]. The cap is a maj or
determinant of mRNA stability, which stimulate splicing, 3V
end processing, transport, and translation [29]. Capping is
carried out by three enzymes acting in the order: RNA
triphosphatase (RT), RNA guanylyltransferase (GT), and
RNA- (guanine-7) methyltransferase (MT). Metazoans have
a single bifunctional polypeptide with RT and GT domains,
whereas budding yeast has two polypeptides, Cet1 and
Ceg1, which form a heterotrimer [30]. Capping enzymes
are brought to the right place at the right time by binding to
the CTD when it becomes phosphorylated by TFIIH close to
the promoter in vivo [3,31 – 33] and in vitro [27]. In vitro,
there is a significant lag between guanylation and methyl-
ation of the cap [27,28].
Interaction of capping enzymes with elements of the
transcriptional machinery influences both capping and
transcription in the best example of two way signaling
between processing and transcription machines. One line
of communication is suggested by the intriguing observa-
tion that, at least in vitro, a transcription factor, the HIV1
Tat protein, binds to GT after it is recruited to the CTD
and stimulates capping [27]. It is not known whether
cellular transcription factors can also influence capping.
B inding of mammalian GT domain to CTD heptads
phosphorylated at Ser5 reduces its Km for GTP [34]
consistent with the crystal structure showing interaction
of a Ser5 phosphorylated CTD heptad near the nucleotide
binding pocket of Candida albicans GT [35]. This
structure and that of a phosphorylated CTD peptide bound
to the peptidyl prolyl isomerase Pin1 [36] show that (i)
key contacts are made with the Tyr1 and Ser5-PO4; (ii)
that up to three consecutive heptads can contribute to
binding interactions; and (iii) that different heptads of
identical sequence can assume different conformations
when they complex with partner proteins.
Phosphorylation of the CTD on Ser5 residues by the
TFIIH associated kinase Kin28 is required for recruitment
of the RT-GT complex and of the MT to the 5V ends of
yeast genes as determined by in vivo cross-linking.
Removal of Ser5 phosphates from the CTD during early
elongation is correlated with release of capping enzymes
Fig. 1. The mRNA factory model. Schematic representation of cotranscriptional processing. Processing factors interact with the pol II machinery via the
carboxyl-terminal domain (CTD) of the largest subunit of RNA pol II, Rpb1. Increased size of the symbols for processing factors corresponds to increased
levels of in vivo formaldehyde cross-linking, measured by ChIP experiments. Capping enzymes, RT, GT, and MT, and 3V end modifying factors (poly A) are
recruited at the 5V ends of genes. As Pol II traverses the gene, splicing factors associate with the transcription complex. Phosphorylation of Ser2 and Ser5
residues in the CTD heptad repeats is indicated in red. Exon numbers are marked in colored boxes. Introns are shown in black boxes. The red star represents the
cap structure.
D.A.R. Zorio, D.L. Bentley / Experimental Cell Research 296 (2004) 91–9792
Figure 4.5: The mRNA factory model. Schematic representation of co-transcriptional pro-cessing. Processing factors interact with the RNApolII machinery via the carboxyl-terminaldomain (CTD) of the largest subunit of RNApolII, Rpb1. The size of the symbols for process-ing factors corresponds to their levels of in vivo formaldehyde cross-linking, measured by ChIPexperiments. Capping enzymes, RT, GT and MT, and 3′ end modifying factors (polyA related)are recruited at the 5′ ends of genes. As RNApolII traverses the gene, splicing factors associatewith the transcription complex. Phosporylation of the Ser2 and Ser5 residues in the CTD heptadrepeats decrease as the RNApolII advances. Exon numbers are marked in colored boxes, whileintrons are shown in black boxes. The red star represents the cap structure. Adapted from Zorioand Bentley [2004].
large subunit is equipped with a unique protein domain to tackle the job of directing co-transcriptional processing. This C-terminal domain (CTD) is composed of tandem repeatsof the consensus heptad Y1S2P3T4S5P6S7, which is conserved from fungi to humans [Cor-den and Ingles, 1992]. Deletion of the CTD in vertebrate cells reduces the overall level oftranscription without necessarily affecting the accuracy of initiation. Deletion of the CTDinhibits all three major pre-mRNA processing steps in vertebrate cells: capping, splicing,and polyA site cleavage [McCracken et al., 1997b,a]. The CTD functions as a landing padfor reversible interactions with RNA processing factors [Greenleaf, 1993] that serve to lo-calize those factors close to their substrate RNAs and to act as a conduits for two-waycommunication with the polymerase.
As sketched in Figure 4.6, the cap binding complex (CBC) interacts with factors assem-bled on the 5′ss. Once the 3′ss has emerged from the elongating RNApolII, cross-introninteractions can be seen. U1 snRNP components, the U1-70K protein and Prp40/FBP11,can interact with SF1 and U2AF on the branch point, polypyrimidine track and 3′ss. Those

4.1. The Molecular Basis of Splicing 105
interactions can be facilitated by protein-protein interactions mediated by serine/arginine-rich proteins (SR), which can act as exonic splicing enhancers. After that, two scenarios arepossible: a new downstream 5′ss defining an internal exon or a downstream polyadenyla-tion signal defining a terminal exon Goldstrohm et al. [2001].
Several examples of intronic and exonic cis-acting elements that are important for cor-rect splice-site identification and that are distinct from the classical splicing signals havebeen described. These elements can act by stimulating (as do enhancers) or repressing (asdo silencers) splicing, and they seem to be especially relevant for regulating alternativesplicing [Cartegni et al., 2002]. Exonic splicing enhancers (ESEs), in particular, appear tobe very prevalent, and might be present in most, if not all, exons, including constitutiveones [Liu et al., 1998; Schaal and Maniatis, 1999]. The analysis of the distribution of exonicsplicing silencers (ESSs) revealed that ESSs appear more frequently in skipped exons, aswell as in alternative 5′ and 3′ exons, in comparison with constitutive exons [Zhang andChasin, 2004; Wang et al., 2004]. In addition to ESEs and ESSs, intronic splicing enhancers(ISEs) and silencers (ISSs) are also an important part of the regulatory program in manyalternative splicing events [Black, 2003]. ISEs and ISSs may also contribute to the definitionof constitutive exons. In the human genome, RNA binding proteins are almost as abundantas transcription factors and the majority of them are of unknown function. Assignment ofindividual ESEs and ESSs to specific mediators will be essential for deciphering regulatorynetworks. Together with the rules for potential co-variation of ESEs and ESSs in exons,and by integrating the information with gene expression profiles, a true splicing regulatorycode might be possible [Fu, 2004].
The spliceosome is believed to undergo some level of assembly and disassembly eachtime an intron is removed, but exactly how spliceosome recycling is achieved between suc-cessive introns in a given transcript remains a major unanswered question. It is not knownwhether a spliceosome is completely released from the transcription complex after two ex-ons are ligated or whether some components remain associated with RNApolII and reusedat downstream splice sites. Because the 5′ and 3′ splice sites are often quite distant from oneanother, splicing is the only processing event for which the RNA recognition sites are syn-thesized at different times. RNApolII elongates transcripts in a highly nonuniform way,punctuated by frequent pauses but with an average rate of 1 ∼ 2 kb/min [Conaway et al.,2000]. This means that the 3′ss of a 30kb intron would therefore be synthesized 15 ∼ 30minutes after the 5′ss, time enough for this to bind the U1 snRNP and get ready for splic-ing. A 5′ss may pair with the first 3′ss to appear as proposed by the “first come first served”model [Aebi et al., 1987]. Slow transcription would favor a proximal 3′ss over a distal sitethat only appears after a significant delay. Results, from tests on yeast and mammaliancells using RNApolII mutants and an inhibitor that slows down elongation [Howe et al.,2003; de la Mata et al., 2003], show that polymerases shifted the balance in favor of proximalover distal alternative 3′ss thereby reducing exon skipping. These results strongly supportthe idea that the effect of elongation rate on the lag time between the appearances of dif-ferent splice sites can modulate alternative splicing. These experiments, therefore, arguefor kinetic coupling of transcription and splicing. The effect of elongation rate on alterna-tive splicing may explain how different promoter sequences can alter alternative splice sitechoices [Cramer et al., 1997] since transcription factors bound to a promoter can influencethe efficiency of elongation [Yankulov et al., 1994].
Finally, nonsense-mediated mRNA decay (NMD) is an mRNA surveillance mechanismthat has been described in organisms ranging from yeast to humans and ensures mRNA

106 Chapter 4. Sequence features of Eukaryotic Genes
Figure 4.6: Exon definition model in vertebrates. Typically, exons are much shorter than in-trons in vertebrates. According to the exon-definition model, before introns are recognized andspliced-out, each exon is initially recognized by the protein factors that form a bridge across it. Inthis way, each exon, together with its flanking sequences, forms a molecular recognition mod-ule (arrows indicate molecular interactions). Adapted from Zhang [2002]. CBC, cap-bindingprotein; CFI/II, cleavage factor I/II; CPSF, cleavage and polyadenylation specificity factor;CstF, cleavage stimulation factor; PAP, poly(A) polymerase.
quality by selectively targeting mRNAs that harbour premature termination codons (PTCs)for rapid degradation [Hentze and Kulozik, 1999; Maquat, 1995, 2000]. PTCs that are intro-duced as a consequence of DNA rearrangements, frame shifts or nonsense mutations, or arecaused by errors during transcription or splicing, can lead to non-functional or deleteriousproteins. PTCs in higher eukaryotes are only recognized as such when they occur upstreamof a boundary on the spliced mRNA that is situated approximately 55 nucleotides upstreamof the last exon-exon junction [Maquat, 2000]. The prevalent view of the NMD mechanismis that the splicing process leaves a mark about 20 nucleotides upstream of each exon-exonboundary, in the form of an exon-junction complex (EJC), which in turn provides an an-chor for up-frameshift suppressor proteins [Maquat, 2000; Hir et al., 2000]. EJCs are formedby splicing-specific mRNP proteins, which associate with spliced mRNAs in a sequence-independent manner at a fixed distance upstream of exon-exon junctions [Hir et al., 2000].During the first round of translation, also known as pioneer round, of a normal mRNA, thestop codon is located downstream of the last mark, and all EJCs are displaced by elongatingribosomes [Ishigaki et al., 2001]. During subsequent rounds of translation, the cap-bindingcomplex is replaced by the eukaryotic initiation factor 4E (eIF4E) and the poly(A)-bindingprotein II (PABPII) is replaced by PABPI. New ribosomes no longer encounter EJCs andthe mRNA is immune to NMD. However, when a PTC is present, ribosomes stop and fail todisplace the downstream EJCs from the transcript. Then, interactions between the markingfactors and components of the post-termination complex trigger mRNA decay. Moreover,intron containing genes are generally expressed at a significantly higher level in humancells than the same genes lacking introns [Buchman and Berg, 1988; Ryu and Mertz, 1989;Lu and Cullen, 2003; Nott et al., 2003]. There is evidence that EJCs may be also responsiblefor the positive effect of splicing on gene expression [Wiegand et al., 2003].

4.1. The Molecular Basis of Splicing 107ROM1: HSROD1X vs MMROM1X
2000/03/2819:28:29
Page 1 of 1
0 250 500 750 1000 1250 1500 1750 1900-50
0 250 500 750 1000 1250 1500 1750 1900-50
Donors
HSROD1X
Acceptors
Donors
MMROM1X
Acceptors
Figure 4.7: Conservation of gene structure between human and mouse. Human rod outersegment membrane protein 1 (Rom1, GENBANK locus HUMROD1X) exonic structure is plotted ontop, the orthologous gene structure in mouse (GENBANK locus MUSROM1X) is shown below. Bothgenes have three coding exons. Exon and intron lengths are quite similar. A position-specificscoring matrix was used to calculate all potential splice sites along the sequence. Donors areshown as blue spikes and acceptors as orange ones, where the height of each spike represents thescore for the corresponding site. A similar sites distribution is observed when comparing bothgenes. Although real splice sites have good scores, they are often not better than the surroundingpredicted signals.
4.1.4 The conservation of exonic structure
Numerous regions that are conserved between human and mouse are found in introns[Hardison et al., 1997]. Comparison of human chromosome 21 and the corresponding ge-nomic sequences in mouse revealed that only one-third of the conserved blocks are ex-ons, the other two-thirds being intronic and intergenic sequences [Dermitzakis et al., 2002].Hare and Palumbi [2003] describe that moderate rates of substitution rate heterogeneity,expected to result in part from mutational processes, can explain much of the conserved se-quence observed in pairwise and three taxon comparisons, under a strictly neutral modelof sequence evolution without indels. As a result, blocks of non-coding sequence con-served over long divergence times do not necessarily indicate selective constraints, evenwhen observed across more than two taxa. However, they have found that half of the in-tron conservation observed cannot be explained by the typical levels of substitution rateheterogeneity in non-coding sequences. This strongly suggested that intronic sequencescan play a larger functional role than previously realized.

108 Chapter 4. Sequence features of Eukaryotic Genes
After multiple complete sequences of eukaryotic genomes became available, compa-rative analyses revealed numerous introns that occupy the same position in orthologousgenes from distant species [Fedorov et al., 2002; Rogozin and Pavlov, 2003]. The great ma-jority (>90%) of intron positions that are shared by phylogenetically distant eukaryotes—for example plants, fungi and metazoans—seem to reflect bona fide evolutionary conser-vation [Sverdlov et al., 2005]. This is supported, for instance, by the observed dramaticdifferences between intron distributions in animal genomes. Those differences dependon non-local features of gene organization, such as the avoidance of short exons and thenon-uniform distribution of introns accross the length of genes, for example preferentiallocation of introns in the 5′ portions of genes in many species [Smith, 1988; Stoltzfus et al.,1997; Mourier and Jeffares, 2003; Sverdlov et al., 2004]. Therefore, it seems unlikely thatthose features had a substantial impact on the long-term evolution of introns [Sverdlovet al., 2005].
Recent large scale comparative analyses have reported extraordinary conservation ofthe exonic structure between human and mouse orthologous genes [Roy, 2003]. Almost allof the protein-coding genes (99%) in human align with homologs in mouse, and over 80%are clear 1:1 orthologs. In most cases, the intron-exon structures are highly conserved [Wa-terston et al., 2002], as can be seen, for instance, in Figure 4.7. Estimates of the proportionof 1:1 orthologs between mouse and rat lie between 86 and 94%. Surprisingly, a similarproportion, 89 to 90% of rat genes possessed a single orthologue in the human genome[Gibbs et al., 2004]. About 60% of the chicken protein-coding genes have a single humanorthologue [Hillier et al., 2004]. Furthermore, the extent of conservation of alternative splic-ing between human and mouse is high. It has been suggested that patterns of alternativesplicing are conserved at similar levels to genes and gene structures, with overall conserva-tion estimates of 61% of alternative and 74% of constitutive splice junctions [Thanaraj et al.,2003]. Sorek and Ast [2003] have reported that 77% of the conserved alternative splicedexons between human and mouse were flanked on both sides by long conserved intronicsequences. In comparison, only 17% of the conserved constitutively spliced exons wereflanked by such conserved sequences. These results suggest that the function of many ofthe intronic sequence blocks that are conserved between human and mouse is the regula-tion of alternative splicing [Arian Smith, pers. communic.].

4.2. The Comparative Analysis of Mammalian Gene Structures 109
Figure 4.8: Human/mouse/rat scatterplots for orthologous GT-AG intron lengths. Upperpanels show pair-wise comparisons of orthologous intron lengths. Repeat lengths have beenremoved from the corresponding total intron lengths in the pair-wise comparison in the lowerpanels (N = 6, 261 orthologous introns).
4.2 The Comparative Analysis of Mammalian GeneStructures
Preliminary comparative analyses of the human and mouse gene structures for a set of1,506 pais of orthologous genes are shown in the section entitled “Conservation of genestructure” on page 43 (page 551 of Waterston et al. 2002). In what follows, we describe ourmajor contributions to the understanding of the exonic structures and the splice signals ofthe orthologous genes of human, mouse and rat.
4.2.1 Intron length and repeats
Of a set of 6261 human/mouse/rat orthologous introns we have computed the averageintron length for each species. Results are shown in table 4.1. On average, introns arelonger in human than in rodent and rat introns appear to be longer than those of mouse.Our numbers for human and mouse intron lengths are comparable to those reported inWaterston et al. [2002]. There is strong correlation, however, between the length of orthol-ogous introns in different species (the correlation coefficient is about 0.90 between humanand rodent, and 0.94 between mouse and rat. The correlation coefficient between length oforthologous exons is in all cases larger than 0.99).

110 Chapter 4. Sequence features of Eukaryotic Genes
Intron Length Percentage of Intron Length
Species with repeats without repeats in all repeats in ancient repeats in other repeats
human 4,765 2,747 42.57 15.70 26.87
mouse 3,770 2,558 32.60 4.72 27.88
rat 4,102 2,872 30.38 4.63 26.69
Table 4.1: Intron length and proportion of repetitive DNA in mammalian introns.
Differences in length between human and mouse orthologous introns are attributableto a larger fraction of repetitive DNA in human than in rodent introns: while DNA inrepeats accounts for 43% of the human intron sequences, it accounts for only around 30%in rodent introns (see table 4.1). Therefore, when subtracting the number of bases maskedby the program RepeatMasker [see page 215, on Web Glossary; Smit et al., 1996–2004]differences in length between human and rodents reduce notably (see table 4.1), with ratintrons having the highest proportion of non-repetitive DNA.
Since it may be argued that the orthologous intron dataset is a too small and biasedsample of all introns in these organisms, we have computed intron length for all genesin the REFSEQ collection [Pruitt and Maglott, 2001; Pruitt et al., 2005], before applying thefiltering protocol; see the corresponding methods section on page 135 (page 117 of Abrilet al. 2005). Average intron lengths, including and excluding masked nucleotides are, re-spectively, 5,632 and 3,247 in human (177,931 introns), 4,423 and 2,996 in mouse (104,591introns), and 4,933 and 3,451 in rat (37,043 introns). Therefore, even though our data set oforthologous introns appears to be biased towards shorter introns, the bias is similar in allorganisms and does not affect the fraction of intronic DNA in repeats.
Interestingly, longer human introns do not appear to be the result of repeat expansionin the human lineage, but rather of the selective loss of ancient repeats in rodents. We havecomputed the fraction of intron sequence in repetitive DNA separately for ancient and re-cent repeats. As can be seen in table 4.1, the fraction of intronic DNA in recent repeats isessentially identical in the three species, suggesting that the dynamics of new repeat gener-ation have not changed after the divergence of the lineages leading to rodent and human.However, ancient repeats are much more abundant in human introns (16% of the sequence)than in rodent introns (5% of the sequence), indicating that repeated sequences are elim-inated much faster in rodents than in human. Although repeats appear to be generatedslightly faster and to be lost slightly slower in the rat than in the mouse genome, repeatabundance does not account for the notable difference in intron length observed betweenthese two rodent species. We have to take into account that due to a higher substitutionlevel in the rodent lineage, RepeatMasker results can be biased to find human ancientrepeats. At any rate, the youngest ancient repeats in mouse and rat have a 35–40% sub-stitution level, which is on the border of what RepeatMasker can detect, while in thehuman genome these repeats have about 15% substitution and are reocgnized very easily[Waterston et al., 2002]. BLASTNresults from cross-matching the repeats found in all theorthologous introns against the intronic sequences of each other species, were supportingour hypothesis.
We did not continue the analyses reported in this section as a broader analysis of re-peats, whole genome based, was presented for the mouse and the rat genomes [Waterston

4.2. The Comparative Analysis of Mammalian Gene Structures 111
et al., 2002; Gibbs et al., 2004]. The large scale deletion level of non-essential DNA in rodentswas much larger than in the human lineage. This results further in a reduced number ofancient repeats in the current rodent genomes; for instance, approximately 50% of the an-cestral junk DNA, as it was at the human-mouse split, has been lost in mouse and onlyabout 25% in human.
4.2.2 Sequence conservation at orthologous splice sites
See section entitled “Conservation of intronic splice signals” on page 119 (page 505 of Gibbset al. 2004).

112 Chapter 4. Sequence features of Eukaryotic Genes
−60 −40 −20 0 20 40 60
020
4060
8010
0Sequence Conservation at Orthologous ’GT−AG’ Donor Splice Sites (aligned introns)
Nucleotide Position Relative to Donor Splice Site (in bp)
% o
f Ide
ntic
al N
ucle
otid
es
−70 −60 −50 −40 −30 −20 −10 0 10 20 30 40 50 60 70
020
4060
8010
0
GT
Hsap/Mmus/Rnor N= 6261Hsap/Mmus + HMR N= 29974Hsap/Rnor + HMR N= 9993Mmus/Rnor + HMR N= 7556
−60 −40 −20 0 20 40 60
020
4060
8010
0
Sequence Conservation at Orthologous ’GT−AG’ Acceptor Splice Sites (aligned introns)
Nucleotide Position Relative to Acceptor Splice Site (in bp)
% o
f Ide
ntic
al N
ucle
otid
es
−70 −60 −50 −40 −30 −20 −10 0 10 20 30 40 50 60 70
020
4060
8010
0
AG
Hsap/Mmus/Rnor N= 6261Hsap/Mmus + HMR N= 29974Hsap/Rnor + HMR N= 9993Mmus/Rnor + HMR N= 7556
Figure 4.9: Human/mouse/rat sequence conservation at orthologous GT-AG splice sites. Se-quence conservation for donor sites [supplementary materials Figure 8 of Gibbs et al. 2004] andacceptor sites [supplementary materials Figure 7 of Gibbs et al. 2004] are shown in upper andlower panels respectively.
4.2. The Comparative Analysis of Mammalian Gene Structures 113
4.2.3 RGSPC, Nature, 428(6982):493–521, 2004
PubMed Accession:http://www.ncbi.nlm.nih.gov/entrez/query.fcgi?cmd=Retrieve&db=PubMed&list_uids=15057822&dopt=Abstract
Journal Abstract:http://www.nature.com/cgi-taf/DynaPage.taf?file=/nature/journal/v428/n6982/abs/nature02426_fs.html
Supplementary Materials:See Section 4.3.2 and the following URL:http://www.nature.com/nature/journal/v428/n6982/suppinfo/nature02426.html
NOTE: Because of copyright restrictions, we cannot offer the article, please followlinks for fulltext.

126 Chapter 4. Sequence features of Eukaryotic Genes
−25 −20 −15 −10 −5 5 10
0
20
40
60
80
AG
% o
f Ide
ntic
al N
ucle
otid
es −
Bac
kgro
und
cons
erva
tion
−10 −5 5 10 15
0
20
40
60
80
GT
% of Identical N
ucleotides − Background conservation
Hsap/Ggal Ggal/Mmus Ggal/Rnor Hsap/Mmus Hsap/Rnor Mmus/Rnor
Figure 4.10: Human/mouse/rat/chicken relative conservation over GT-AG splice site con-sensi. The x-axis shows idealized base position from intron through exon to intron. The grayareas show the regions where expected conservation from the presence of splice site consensiwas removed. Unlike inter-mammal comparisons, the chicken-mammal comparison shows ahigher relative conservation rate at the splice sites than in the introns. Included as supplemen-tary materials Figure 1 on Hillier et al. [2004].
4.3 The Comparative Analysis of Splice Sites in Verte-brates
4.3.1 Conservation of mammals and chicken orthologous splicesites
See section entitled “Evolutionary conservation of gene components” on page 142(page 698 of Hillier et al. 2004).
Only the orthologous U12 introns of the four species were displayed in Figure 4.11.Further orthologous sets, including pair-wise and triads, are available at the supplemen-tary materials web page (see page 213 on Web Glossary). It is worth to note that in thefourth example, the 16th intron of mouse gene NM_007459 does not seem to be conform-ing to the U12 donor pattern. But it is not a case of conversion between U2 and U12 splicesites, just displacing the splice sites two nucleotides upstream we recover the U12 donorpattern and the overall alignment of the exonic regions improves.

4.3. The Comparative Analysis of Splice Sites in Vertebrates 127
1111.003
1111.3
ATCAAGGGCAGTATCCTTCCCAGTGC � � � � � � AAGCAGCCAGCCCTCCTTGATGAGCCCCAGATATCGACAA Hsap NM_001287 i05 11 1 1 OKATCAAGGACAGTATCCTCCAAAGACA � � � � � � CTGCAGTACCTGTCCTTGACCATCCCTGAGACATTGACAA Mmus NM_011930 i05 11 1 0 OKATCAAGGACAGTATCCTCCAAAGACA � � � � � � CATCGGTGTCTGTCCTTGACCATCCCTGAGACATCGACAA Rnor NM_031568 i05 11 1 0 OKGTGAAGGACAGTATCCTTGCATGCAG � � � � � � TAGCAGCCTTTCCTTGATCCTCCTCCACAGACATCGACAA Ggal chr14_6468177_6468705 11 3 1 OK
1111.006
1111.6
GAGAAGCTGTGTATCCTTTGCGTGGT � � � � � � TTTACACTTCCTTAACTGCACGATATTCAGATTTCGGCCT Hsap NM_002613 i04 11 1 0 OKGAAAAGCTGTGTATCCTTTGCATGGT � � � � � � TCCATTCTTCCTTAACCACAAAACATTCAGATTTTGGCCT Mmus NM_011062 i04 11 1 0 OKGAAAAGCTGTGTATCCTTTGCATGGT � � � � � � TCCACTCTTCCTTAACCACAAAATATTCAGATTTTGGCCT Rnor NM_031081 i04 11 1 0 OKGAAAAGCTGTGTATCCTTCGAATTCT � � � � � � AATACTAGACCTTAACTTCTTAACATTCAGATTTTGGGCT Ggal chr14_9378542_9379313 11 3 1 OK
1111.010
1111.10
AAATCCAACAGTATCCTTTGGTTGTT � � � � � � TTGAAACCAGAGTCCTTAACAAGCATTGAGATATATTTCT Hsap NM_002880 i13 11 1 0 OKAAATCCAACAGTATCCTTTGGTATTG � � � � � � AAACTGTCAGTCTCCTTAACAAGCATCGAGATATATTTCT Mmus NM_029780 i13 11 1 0 OKAAATCCAACAGTATCCTTTGGTATTG � � � � � � GAACTGTCAGTCTCCTTAACAAGCATTGAGATATATTTCT Rnor NM_012639 i12 11 1 0 OKAAATCCAATAGTATCCTTTCCTAACT � � � � � � TTCTATAGAATTTCTTTAACAGCTGTTTAGATATATTTCT Ggal chr12_14813831_14814715 11 1 1 OK
1111.021
1111.21
CTTCAGCCTAATATCCTTGGCTTCAT � � � � � � TTGCTCAGCTGGATTCCTTAACGCACGCACACCTGAACCT Hsap NM_012305 i17 11 1 0 OKTCAAACTAATATCCTTGCTTAGAGGC � � � � � � GTCTGCCTGGACTCCTTAATGCACTCACATCTGAACCTGC Mmus NM_007459 i16 01 3 1 OKCTTCAGACTAATATCCTTGCTTACCT � � � � � � CTGTCTGCCTGTATTCCTTAATGCACTCACATCTGAACCT Rnor NM_031008 i17 11 2 1 OKCTTCAACCAAATATCCTTAAAGGCAG � � � � � � CGTTGATCGGTTTCCTTAGCTACTTTTCATGCCTGAATCT Ggal chr5_43721038_43722042 11 3 1 OK
1111.024
1111.24
TATGAGCGATATATCCTTTGGACGAG � � � � � � TTGCCTGGGATTTCCTTAATTCCCTTGCACTTGTCCTCGT Hsap NM_016652 i06 11 1 1 OKTATGAACGCTATATCCTTTGAATAAG � � � � � � CCTGCTCTTTCCTTCACTCCCTGCCCGTACTTGTGCTCGT Mmus NM_025820 i05 11 2 1 OKTATGAACGCTATATCCTTTGAATGAG � � � � � � GGTGCCTGCTCTTTCCTTCACTCCCCGCACTTGTGCTCGT Rnor NM_053797 i05 11 1 1 OKTATGAAAGATATATCCTTTTTTAGTG � � � � � � ACTGCTACTGTTTCTTTAACATAGCTCTACTCGTTATTGT Ggal chr3_3794338_3795173 11 1 1 OKTATGAAAGATATATCCTTTTTTAGTG � � � � � � ACTGCTACTGTTTCTTTAACATAGCTCTACTCGTTATTGT Ggal chr3_3794338_3795173 11 1 1 OK
1111.030
1111.30
GGAAGAGACTGTATCCTTCACAGGGG � � � � � � CAGTTGTATTTTCCTCAAGAAACTCCTTAGATATTGATCA Hsap NM_139069 i06 11 1 2 OKGGCACTGACCGTATCCTTCCCCGCGA � � � � � � CAGTTGTATTTTCCTCAAGAAACTCCTTAGATATTGATCA Hsap NM_002752 i06 11 1 2 OKGGAAGAGACTGTATCCTTCACAGGGA � � � � � � TAGTTGTATTTTCCTCAAGAGAATCCTTAGATATTGATCA Mmus NM_016961 i07 11 2 2 OKGGTACTGACCGTATCCTTCCCCAGAA � � � � � � TAGCTGTGTTTTCCTCAAGAGAATCCTTAGATATTGATCA Rnor NM_017322 i06 11 1 2 OKGGCACCGATCGTATCCTTCCTCACGG � � � � � � GTTGGATTTTCCTTAACTCCCAATGTCCAGATATTGACCA Ggal chr4_44097240_44104143 11 1 0 OK
1111.097
1111.97
GACGAGAACTGTATCCTTTCTTGCAG � � � � � � CAGCTGTGGCCTTAACTCTGTTGACCACAGACATGGAGTT Hsap NM_006598 i23 11 1 1 OKGACGAGAACTGTATCCTTTTCCAATG � � � � � � AGATTGGTATGGCCTTAACTATCAACCCAGACATGGAGTT Mmus NM_011390 i23 11 3 1 OKGATGAGAACTGTATCCTTTCAGTCAA � � � � � � ATTTCTTTGTCCTTGACTTCACTGAAACAGACATGGAGTT Ggal chr11_3397409_3399238 11 2 0 OKGATGAAAACTGTATCCTTCCCACTGC � � � � � � ACGTCTCGTTCCTCCTTGACGGCCGCACAGACATGGAGTT Ggal chr20_10116442_10116901 11 1 0 OK
1
Figure 4.11: Human, mouse, rat and chicken orthologous U12 intron sets. Ungapped align-ments of the donor (-10 to +16 around the 5′ splice sites) and the acceptor (-30 to +10 around the3′ splice sites) sequences for all the orthologous U12 intron sets were drawn using TeXshade[Beitz, 2000]. Splice sites core signals are highlighted in a black box, the conserved U12 donorsequence (+3 to +8) is marked in green, sequence hits to the U12 branch point are colored in red,while conserved nucleotides at a given position are shown with a blue background.

128 Chapter 4. Sequence features of Eukaryotic Genes
4.3.2 Abril et al , Genome Research, 15(1):111–119, 2005
PubMed Accession:http://www.ncbi.nlm.nih.gov/entrez/query.fcgi?cmd=Retrieve&db=PubMed&list_uids=15590946&dopt=Abstract
Journal Abstract:
http://www.genome.org/cgi/content/abstract/15/1/111
Supplementary Materials:
http://genome.imim.es/datasets/hmrg2004/

Comparison of splice sites in mammals and chickenJosep F. Abril, Robert Castelo, and Roderic Guigo1
Grup de Recerca en Informatica Biomedica, Institut Municipal d’Investigacio Medica, Universitat Pompeu Fabra, and Programa deBioinformatica i Genomica, Centre de Regulacio Genomica, C/ Dr. Aiguader 80, E-08003 Barcelona, Catalonia, Spain
We have carried out an initial analysis of the dynamics of the recent evolution of the splice-sites sequences on alarge collection of human, rodent (mouse and rat), and chicken introns. Our results indicate that the sequences ofsplice sites are largely homogeneous within tetrapoda. We have also found that orthologous splice signals betweenhuman and rodents and within rodents are more conserved than unrelated splice sites, but the additionalconservation can be explained mostly by background intron conservation. In contrast, additional conservation overbackground is detectable in orthologous mammalian and chicken splice sites. Our results also indicate that the U2and U12 intron classes seem to have evolved independently since the split of mammals and birds; we have not beenable to find a convincing case of interconversion between these two classes in our collections of orthologous introns.Similarly, we have not found a single case of switching between AT-AC and GT-AG subtypes within U12 introns,suggesting that this event has been a rare occurrence in recent evolutionary times. Switching between GT-AG andthe noncanonical GC-AG U2 subtypes, on the contrary, does not appear to be unusual; in particular, T to Cmutations appear to be relatively well tolerated in GT-AG introns with very strong donor sites.
[Supplemental material is available online at www.genome.org. The following individuals kindly provided reagents,samples, or unpublished information as indicated in the paper: P. Bork and I. Letunic.]
Protein-coding genes are characteristically interrupted by intronsin the genome of higher eukaryotic organisms. While intronfunction and origin has been debated at length (de Souza 2003;Fedorova and Fedorov 2003; Roy et al. 2003), recent comparativeanalyses show an abundance of conserved elements in intronicsequences (for instance, see Dermitzakis et al. 2002; Hare andPalumbi 2003). This strongly suggests that introns are rich inelements playing functional, probably regulatory, roles (Mattick2001). Splicing of introns is found in all main branches of eu-karyotes, that is, animals, plants, fungi, and protozoa, indicatingan early origin of splicing within eukaryotes, or the existence, inthe pre-eukaryotic world, of a precursor of splicing. Indeed, thetwo major molecular mechanisms by means of which splicing isproduced, U2- and U12-dependent, seem to have evolved inde-pendently prior to the divergence of the animal and plant king-doms (Burge et al. 1998; Zhu and Brendel 2003).
Within each of these two classes of splicing, sequence fea-tures involved in intron specification are essentially conservedacross eukaryotes. In both classes, the sequence informationneeded to specify the 5� and 3� splice sites—hereafter also de-scribed as donor and acceptor sites respectively—is largely con-fined to their surrounding region (see Fig. 1). Conserved se-quences in these regions interact with the splicing machinery topromote the assembly of the spliceosome and activate the bio-chemical pathway that leads to the production of the splicedmRNA (for review, see Burge et al. 1999). Despite the strong con-servation, the sequence of splicing signals does not carry enoughinformation to unequivocally specify introns in the large se-quence of the pre-mRNA transcripts, occasionally hundreds ofthousands of nucleotides long; and recent research suggests thatsignals other than those in the region of the splice sites play arole in the definition of the intron boundaries (for review, seeCaceres and Kornblihtt 2002; Cartegni et al. 2002; Black 2003).
Thus, in eukaryotic organisms, splicing introduces an addi-tional level of decoding—prior to translation—on the sequenceof the primary RNA transcript. There is a fundamental difference,however, between the genetic code—the mapping of nucleotidesequences (triplets) into 20 (or more) amino acids—and the splic-ing code—the mapping of nucleotide sequences into 3� and 5�
intron boundaries. The genetic code is essentially deterministic;within a given species, a given triplet in the mRNA sequenceresults always in the same amino acid—the dual role in seleno-proteins of the TGA triplet as stop and selenocysteine codonprobably the most notable of all exceptions (for instance, seeKryukov et al. 2003). The splicing code, in contrast, is inher-ently stochastic; the probability of a splicing sequence in theprimary transcript to participate in the definition of an intronboundary ranges from zero to one, and it is conditioned to verymany different factors (which could be other sequences—maybedistant). The tissue-specific distribution of relative abundances ofalternative splicing products (Xu et al. 2002; Yeo et al. 2004), forinstance, reflects this nondeterministic nature of the splicingcode.
The stochasticity of the splicing code offers opportunitiesfor evolution that are absent in the highly deterministic geneticcode. The availability of an increasing number of eukaryotic ge-nomes makes it possible to investigate such an evolutionary pro-cess. Here, we report on findings obtained by comparing a largecollection of orthologous introns (introns occurring at equiva-lent locations in orthologous genes) and their defining splicesites in human, mouse, rat, and chicken. Our results provideinsights into the dynamics of the evolution of splice-site se-quences during the most recent period of the history of life onearth.
ResultsIn this section, we first report results concerning interconversionbetween the two major classes of introns, U2 and U12, and sub-type switching within each class. Then, we report on the com-
1Corresponding author.E-mail [email protected]; fax 34-93-221-32-37.Article and publication are at http://www.genome.org/cgi/doi/10.1101/gr.3108805. Article published online before print in December 2004.
Chicken Special/Letter
15:111–119 ©2005 by Cold Spring Harbor Laboratory Press; ISSN 1088-9051/05; www.genome.org Genome Research 111www.genome.org
4.3. The Comparative Analysis of Splice Sites in Vertebrates 129

Fig
ure
1.
Don
oran
dac
cept
orsi
tes’
pict
ogra
ms.
Pict
ogra
ms
ofth
edo
nor
(left
)an
dth
eac
cept
or(r
ight
)si
tese
quen
ces
for
the
U2
(top
)an
dU
12(b
otto
m)
splic
esi
tes.
The
sequ
ence
plot
sfo
rG
T-A
Gan
dG
C-A
GU
2in
tron
sar
egi
ven
sepa
rate
ly.
The
cons
erve
dse
quen
ceof
the
U12
bran
chpo
int
isal
sosh
own.
From
hum
an,
mou
se,
rat,
and
chic
ken
RefS
eqge
nes,
ato
taln
umbe
rof
337,
336,
2506
,and
935
splic
e-si
tese
quen
ces
from
CD
Sin
tron
sfr
omEn
sem
blw
ere
incl
uded
inG
T-A
G,G
C-A
G,a
ndU
12sp
lice
site
sets
,res
pect
ivel
y,to
prod
uce
the
corr
espo
ndin
gpi
ctog
ram
s.
Abril et al.
112 Genome Researchwww.genome.org
130 Chapter 4. Sequence features of Eukaryotic Genes
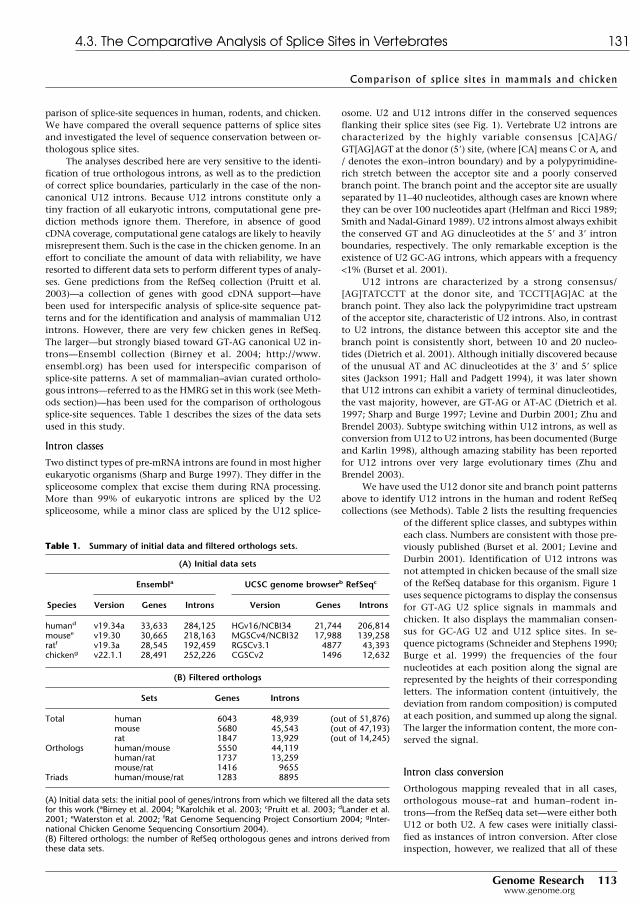
parison of splice-site sequences in human, rodents, and chicken.We have compared the overall sequence patterns of splice sitesand investigated the level of sequence conservation between or-thologous splice sites.
The analyses described here are very sensitive to the identi-fication of true orthologous introns, as well as to the predictionof correct splice boundaries, particularly in the case of the non-canonical U12 introns. Because U12 introns constitute only atiny fraction of all eukaryotic introns, computational gene pre-diction methods ignore them. Therefore, in absence of goodcDNA coverage, computational gene catalogs are likely to heavilymisrepresent them. Such is the case in the chicken genome. In aneffort to conciliate the amount of data with reliability, we haveresorted to different data sets to perform different types of analy-ses. Gene predictions from the RefSeq collection (Pruitt et al.2003)—a collection of genes with good cDNA support—havebeen used for interspecific analysis of splice-site sequence pat-terns and for the identification and analysis of mammalian U12introns. However, there are very few chicken genes in RefSeq.The larger—but strongly biased toward GT-AG canonical U2 in-trons—Ensembl collection (Birney et al. 2004; http://www.ensembl.org) has been used for interspecific comparison ofsplice-site patterns. A set of mammalian–avian curated ortholo-gous introns—referred to as the HMRG set in this work (see Meth-ods section)—has been used for the comparison of orthologoussplice-site sequences. Table 1 describes the sizes of the data setsused in this study.
Intron classes
Two distinct types of pre-mRNA introns are found in most highereukaryotic organisms (Sharp and Burge 1997). They differ in thespliceosome complex that excise them during RNA processing.More than 99% of eukaryotic introns are spliced by the U2spliceosome, while a minor class are spliced by the U12 splice-
osome. U2 and U12 introns differ in the conserved sequencesflanking their splice sites (see Fig. 1). Vertebrate U2 introns arecharacterized by the highly variable consensus [CA]AG/GT[AG]AGT at the donor (5�) site, (where [CA] means C or A, and/ denotes the exon–intron boundary) and by a polypyrimidine-rich stretch between the acceptor site and a poorly conservedbranch point. The branch point and the acceptor site are usuallyseparated by 11–40 nucleotides, although cases are known wherethey can be over 100 nucleotides apart (Helfman and Ricci 1989;Smith and Nadal-Ginard 1989). U2 introns almost always exhibitthe conserved GT and AG dinucleotides at the 5� and 3� intronboundaries, respectively. The only remarkable exception is theexistence of U2 GC-AG introns, which appears with a frequency<1% (Burset et al. 2001).
U12 introns are characterized by a strong consensus/[AG]TATCCTT at the donor site, and TCCTT[AG]AC at thebranch point. They also lack the polypyrimidine tract upstreamof the acceptor site, characteristic of U2 introns. Also, in contrastto U2 introns, the distance between this acceptor site and thebranch point is consistently short, between 10 and 20 nucleo-tides (Dietrich et al. 2001). Although initially discovered becauseof the unusual AT and AC dinucleotides at the 3� and 5� splicesites (Jackson 1991; Hall and Padgett 1994), it was later shownthat U12 introns can exhibit a variety of terminal dinucleotides,the vast majority, however, are GT-AG or AT-AC (Dietrich et al.1997; Sharp and Burge 1997; Levine and Durbin 2001; Zhu andBrendel 2003). Subtype switching within U12 introns, as well asconversion from U12 to U2 introns, has been documented (Burgeand Karlin 1998), although amazing stability has been reportedfor U12 introns over very large evolutionary times (Zhu andBrendel 2003).
We have used the U12 donor site and branch point patternsabove to identify U12 introns in the human and rodent RefSeqcollections (see Methods). Table 2 lists the resulting frequencies
of the different splice classes, and subtypes withineach class. Numbers are consistent with those pre-viously published (Burset et al. 2001; Levine andDurbin 2001). Identification of U12 introns wasnot attempted in chicken because of the small sizeof the RefSeq database for this organism. Figure 1uses sequence pictograms to display the consensusfor GT-AG U2 splice signals in mammals andchicken. It also displays the mammalian consen-sus for GC-AG U2 and U12 splice sites. In se-quence pictograms (Schneider and Stephens 1990;Burge et al. 1999) the frequencies of the fournucleotides at each position along the signal arerepresented by the heights of their correspondingletters. The information content (intuitively, thedeviation from random composition) is computedat each position, and summed up along the signal.The larger the information content, the more con-served the signal.
Intron class conversion
Orthologous mapping revealed that in all cases,orthologous mouse–rat and human–rodent in-trons—from the RefSeq data set—were either bothU12 or both U2. A few cases were initially classi-fied as instances of intron conversion. After closeinspection, however, we realized that all of these
Table 1. Summary of initial data and filtered orthologs sets.
(A) Initial data sets
Species
Ensembla UCSC genome browserb RefSeqc
Version Genes Introns Version Genes Introns
humand v19.34a 33,633 284,125 HGv16/NCBI34 21,744 206,814mousee v19.30 30,665 218,163 MGSCv4/NCBI32 17,988 139,258ratf v19.3a 28,545 192,459 RGSCv3.1 4877 43,393chickeng v22.1.1 28,491 252,226 CGSCv2 1496 12,632
(B) Filtered orthologs
Sets Genes Introns
Total human 6043 48,939 (out of 51,876)mouse 5680 45,543 (out of 47,193)rat 1847 13,929 (out of 14,245)
Orthologs human/mouse 5550 44,119human/rat 1737 13,259mouse/rat 1416 9655
Triads human/mouse/rat 1283 8895
(A) Initial data sets: the initial pool of genes/introns from which we filtered all the data setsfor this work (aBirney et al. 2004; bKarolchik et al. 2003; cPruitt et al. 2003; dLander et al.2001; eWaterston et al. 2002; fRat Genome Sequencing Project Consortium 2004; gInter-national Chicken Genome Sequencing Consortium 2004).(B) Filtered orthologs: the number of RefSeq orthologous genes and introns derived fromthese data sets.
Comparison of splice sites in mammals and chicken
Genome Research 113www.genome.org
4.3. The Comparative Analysis of Splice Sites in Vertebrates 131

cases could be explained either by misprediction of the intronboundaries or by splice sequence patterns slightly off consensus.(See Supplemental materials for the cross-species alignments atthe intron boundaries of all predicted U12 introns). Remarkably,therefore, not one single convincing case of U12 to U2 conver-sion or vice-versa has occurred since the divergence of the hu-man and rodent lineages. To investigate whether conservation ofintron class extends beyond the mammalian lineage, we havemapped the 412 human, mouse, and rat U12 introns from Table2, which correspond to 202 unique orthologs, into the chickengenome. The mapping was obtained by comparing, using exon-erate (G. Slater, unpubl.), the two exons harboring the intronagainst the chicken genome sequence (see Methods). A total of38 mammalian U12 introns were unequivocally mapped into thechicken genome. (See Supplemental material for cross-speciesalignments at the intron boundaries of the mammalian U12 in-trons mapped into the chicken genome). The 38 chicken intronshad the typical donor-site sequence of U12 introns, and 36 hadthe typical U12 branch point. In the other two cases, sequencesreminiscent of the U12 branch point could still be found, al-though departing clearly from the consensus. Since these twocases are both of the GT-AG U12 subtype, it is tempting to specu-late that they may correspond to intermediates in the intercon-version pathway between U12 and U2 introns. Against this hy-pothesis, however, is the fact that no strong polypyrimidinetract, suggestive of U2 function, can be found upstream of theacceptor site. With the exception of these two cases, the branch-point sequence was extremely conserved between mammals andchicken, showing no more than two mismatches, but often beingidentical. The position of the branch point has also been con-served; with only one exception, the larger displacement ob-served was of 4 nucleotides. These results strongly argue that U2and U12 introns have evolved independently, at least since thesplit of mammals and birds.
Subtype switching
Although subtype switching between GT-AG and AT-AC U12 in-trons has been documented (Burge et al. 1998), we have notfound any such case within rodents, between human and ro-dents, or between mammals and chicken in our set of U12 or-thologous introns. It appears that this phenomenon occurs at avery slow rate over evolutionary time (see cross-species align-ments of orthologous U12 introns in the Supplemental material).
Within U2 introns, on the contrary, switching between GC-AG and GT-AG subclasses, and vice-versa, is not unusual. Table3A lists the pairwise frequency of subtype switching within U2introns, and subtype distribution within orthologous mamma-lian triads. Because of the limited number of cases available inthe RefSeq collection, we have ignored chicken genes in thisanalysis. A total of 190 of the 290 human (66%) and 289 mouse
(66%) GC-AG introns are conserved in both species. Similar pro-portions are observed between human and rat. Within rodents,60 of the 68 mouse (88%) and 67 rat (90%) GC-AG introns areconserved in both species. The availability of orthologous intronsfrom three organisms allows the investigation of the dynamics ofsubtype switching within U2 introns (see Table 3B). We havedivided GC-AG introns’ orthologous triads into (1) “ancient”; theintron is GC-AG subtype in the three species, and thus it is likelyto predate the split of human and rodents; (2) “modern”; theintron is GC-AG subtype in either human or rodents. Because ofthe lack of a reference out-group, however, we cannot distinguishhere those ancient GC-AG introns that have reverted to GT-AGin one of the two lineages from those modern GC-AG intronsthat have arisen in one of the lineages; and (3) “recent”; theintron is of GC-AG subtype only in one of the rodent species. Themost parsimonious hypothesis is that the switch to GC-AG hasoccurred after the split of mice and rats.
According to this classification, 47% (45) of the GC-AG in-trons are ancient, 36% (34) are modern, and 14% (13) are recent.Because human introns act as a reference out-group, we can es-tablish (under the most parsimonious hypothesis) the directionof the GT/GC switch between mouse and rat orthologous in-trons. Although the numbers are too small to draw definitiveconclusions, we observe more GT to GC than GC to GT substi-tutions (13 vs. 3). This is obviously mostly due to the overwhelm-ingly larger number of GT-AG than GC-AG introns, but indicatesthat switching from GT to GC in the donor site of U2 introns isnot completely unfavorable. In this regard, it is interesting tonote that GC-AG introns’ exhibit a stronger and less variable do-
Table 3. Observed cases of U2 subtype switchingwithin mammals
(A) Orthologous pairs
GT, GT GC, GC GC, GT GT, GC
human/mouse 38,922 190 100 99human/rat 11,693 61 33 23mouse/rat 8441 60 8 7
(B) Orthologous triads
Human Mouse Rat Occurrences
“ancient” GT-AGGT GT GT 7784
“ancient” GC-AGGC GC GC 45
“moderate” GC-AGGC GT GT 23GT GC GC 11
“recent” GC-AGGT GT GC 8GT GC GT 5
“ancient” GC-AG, “recent” GC → GTGC GC GT 2GC GT GC 1
Total 95
(A) Orthologous pairs: occurrence of donor site dinucleotide pairs atintron boundaries of orthologous intron pairs. For instance, we havefound 65 instances in which the orthologous donor site is GC in humanand GT in mouse.(B) Orthologous triads: occurrence of donor site dinucleotides at intronboundaries in orthologous intron triads. For instance, we have found 23cases in which the donor site is GC in human, but GT in both mouse andrat.
Table 2. Intron class and subclass frequencies in mammals
Human Mouse Rat
U2 GT-AG 48,212 (98.9%) 44,817 (98.8%) 13,707 (98.7%)GC-AG 355 (0.7%) 330 (0.7%) 96 (0.7%)Other 184 (0.4%) 218 (0.5%) 80 (0.6%)Total 48,751 45,365 13,883
U12 GT-AG 131 (69.7%) 128 (71.9%) 36 (78.3%)AT-AC 51 (27.1%) 47 (26.4%) 9 (19.6%)Other 6 (3.2%) 3 (1.7%) 1 (2.2%)Total 188 178 46
Abril et al.
114 Genome Researchwww.genome.org
132 Chapter 4. Sequence features of Eukaryotic Genes

nor-site sequence than GT-AG introns (Fig. 1). Indeed, the infor-mation content of GC-AG donor sites is 12.4, while that of GT-AG donor sites is only 8.2. Probably, the substitution GT→GC,less favorable energetically, needs to be compensated by strongercomplementarity in the rest of the site. Indeed, while GC-AGintrons make up only 0.7% of all U2 introns (see Table 2), whenconsidering only those U2 introns whose donor-site sequenceis the perfect complement to the U1 snRNA 5� end sequence([AGC]AG/G[CT]AAGT), then, the percentage of GC-AG intronsrises to 11.35% (317 of 2792).
Comparison of splice site sequence patterns
We have investigated here whether the splice-site sequence pat-terns have changed appreciably since the mammalian and aviansplit. One way to investigate the variation is to visually comparepictograms or logos (Fig. 1) obtained from collections of sitesfrom different species, derived from the Ensembl database. Tofacilitate this task, we have extended sequence pictograms intocomparative pictograms. In these, the nucleotide distributions ofthe two species at each position are represented side by side, andthe ratio of the nucleotide proportions indexes a range of colorsfrom green to red, indicating nucleotide overrepresentation inone of the two species (see Methods and Supplemental material).Figure 2 shows the comparative pictograms for mouse and rat,human and mouse, and human and chicken. For reference, wehave also computed them for human and zebrafish and humanand fly. As it is possible to see, comparative pictograms suggestthat splice sequence patterns are largely homogeneous withintetrapoda (the pictograms are mostly yellowish), but noticeablydistinct from those of other vertebrate and invertebrate taxa.Statistical analysis in which we have explicitly computed thedistances between splice-site sequence patterns, using a variety ofmethods, supports this interpretation (see Supplemental material).
Sequence conservation of orthologous U2 splice sites
In this section, we investigate sequence conservation at ortholo-gous splice sites. Here, we have used the HMRG set of curatedmammalian–avian orthologous introns (Methods). In two ways,Figure 3 displays comparisons of orthologous splice sites, thepercentage of sequence identity at each nucleotide position inthe splice sites and at an intronic region 10 nucleotides longadjacent to the sites. Identity has been computed after aligningthe orthologous splice-site sequences at the intron boundaries.Because these alignments are ungapped, the characteristic geo-metric decay of conservation within the intron observed formouse–rat and for human–rodent comparisons is suggestive ofsignificant sequence conservation between orthologous intronsat this phylogenetic distance. In contrast, for mammalian andchicken comparisons, the ungapped alignment shows an almostabrupt decay right after the splice site—very similar to that ob-served when comparing unrelated sites.
To investigate what fraction of sequence conservation insplice sites is due to splicing function, we computed backgroundsequence conservation between pairs of (randomly chosen) non-orthologous sites. As expected, background identity is ∼25% out-side of the splice signals. Within the splice signals, backgroundconservation at each position roughly correlates with the infor-mation content at that position. Interestingly, at the acceptorsite, it exhibits a bimodal shape—consistent with the polypyrimi-dine tract appearing at two different preferential locations. Thereis also a slow decay of background conservation upstream of the
acceptor site—suggesting that the boundaries of this site are notprecisely defined.
As shown in Figure 3, orthologous splice-site sequences aremore conserved than expected solely from their role in splicing.Interestingly, this additional conservation is larger than that ob-tained at adjacent intronic sites for mammalian–chicken com-parisons, but not for human–rodent and mouse–rat comparisons(Fig. 3, bottom). The abrupt decay of background conservationright after the donor site allows us to quantify this observation atthese sites. This is less obvious in acceptor sites, because theirboundaries are not as sharply defined. Indeed, we have computedthe average sequence identity in the four rightmost intronic po-sitions of the donor site (positions +3 to +6 in Fig. 1), and at fouradjacent positions outside of the site (+7 to +10). The values ofbackground conservation in these two regions are ∼50% and26%–27%, respectively, for all pairs of species. For mouse–ratorthologous comparisons, the values are 89% and 76%, respec-tively, for human–mouse, 78% and 53%, respectively, and forhuman–chicken, 62% and 31%, respectively. That is, conserva-tion due to nonsaturation is smaller at the donor site than atadjacent positions (89 � 50 = 39% vs. 74 � 26 = 48%) for com-parisons within rodents, similar for human–rodent comparisons(27% vs. 26%) and larger for human–chicken comparisons (12%vs. 4%). While it cannot be ruled out that this additional con-servation reflects the existence of a small class of donor sitesconserved beyond the generic consensus, a simpler explanationis that the reaching of saturation (understood here as the level ofconservation at which orthologous sites are as conserved as un-related sites, 27% identity at intronic sites, 50% at donor sites) isslower at sites under functional constraints. In the case of splic-ing, nucleotide substitutions at the splice sites may impair splicefunction. Thus, while the substitution process since the diver-gence of the mammalian and avian lineages has lead to almostcomplete saturation in proximal intronic sites (31% identity),donor sites (62% identity) are still far from saturation.
DiscussionThanks to the availability of genome sequences for a number ofmammalian and one avian species, we have been able to inves
tigate the dynamics of the evolution of splice-site sequences inrecent evolutionary times. Our results confirm that the splicingcode is under evolution, albeit very slow. Indeed, while differ-ences between overall splice-site sequence patterns correlate wellwith phylogenetic distance, they have remained largely homo-geneous within tetrapoda, showing noticeable differences only atlarger phylogenetic distances—such as those separating tetra-poda from fish.
Even though the splicing code appears to have remainedquite constant within tetrapoda, our results also indicate thatspecific splice-site sequences may suffer significant changes dur-ing evolution and remain functional. Figure 3 displays the per-centage of sequence identity at each nucleotide position acrossorthologous splice sites within rodents, between human and ro-dents, and within mammals and chicken. At all distances, or-thologous splice-site sequences are more conserved than unre-lated splice sites, but they have significantly diverged, showingan intermediate level of conservation between that of exon andintron sequences. The existence of additional sequences enhanc-ing or repressing the recognition of the splice sites (for instance,see Caceres and Kornblihtt 2002; Cartegni et al. 2002; Black
Comparison of splice sites in mammals and chicken
Genome Research 115www.genome.org
4.3. The Comparative Analysis of Splice Sites in Vertebrates 133

Figure 2. Comparative pictograms for donor and acceptor splice sites. Comparative pictograms of donor and acceptor sites for pairwise comparisonsbetween species at different phylogenetic distances. At each position, the nucleotide distribution of the two species is displayed, the height of the letterscorresponding to their relative frequency at the position. The color in the background of the letters indicates the underrepresentation (green) oroverrepresentation (red) of a given nucleotide in the second species (right) with respect to the first (left).
Abril et al.
116 Genome Researchwww.genome.org
134 Chapter 4. Sequence features of Eukaryotic Genes

2003) may partially explain the robustness of the exonic struc-ture in front of changes in the splice-site sequences.
The greater conservation observed in mammalian chickenorthologous splice sites than in unrelated sites indicates thatnucleotide substitution since the mammalian avian split has notyet reached saturation at these sites (estimated at ∼50% identityat donor sites). At this phylogenetic distance, however, satura-tion has been reached at intronic sites, showing a level of con-servation similar to that of unrelated sequences. This is the mostlikely explanation for the excess conservation over backgroundobserved in splice sites for comparisons between mammals andchicken, but absent in comparisons within mammals—wheresaturation has not been reached either at intronic sites.
In any case, the characteristic conservation of orthologoussplice sites suggests that comparative prediction of splicing—through the modeling of the conservation in orthologous sites—could improve over methods based on the analysis of a singlegenome. Comparative prediction of splice sites could be particu-larly relevant to the prediction of alternative splicing—a problemstill poorly solved—since it appears that a large fraction of alter-native splicing events are conserved between related species,such as human and mouse (Thanaraj et al. 2003).
The availability of a large collection of orthologous intronsequences has also allowed us to investigate the evolutionaryrelationship between the minor U12 splicing class, and the majorU2 class. Our results seem to indicate that U12 and U2 in-trons have evolved independently after the split of mammalsand birds, since we have not been able to document a singleconvincing case of conversion between these two types of in-trons in our data sets. Certainly, because we have used a ratherstringent criteria of U12 membership, it cannot be com-pletely ruled out that such cases exist—maybe associated with
dramatic changes in exonic structure, which our analysis cannotdetect. On the other hand, although subtype switching betweenGT-AG and AT-AC U12 introns has been documented (Burge etal. 1998), we have not found any such case in our sets of U12orthologous introns. In contrast, switching between the minorGC-AG and the major GT-AG subtypes within U2 introns is notunusual, and appears to be relatively well tolerated in intronswith very strong donor sites. Comparison of orthologous intronshas also allowed us to refine the sequences involved in thespecification of the U12 introns (see Methods and Fig. 1). Thesesequences, while more conserved than signals involved in U2intron specification, are more degenerate that previouslythought.
Splicing remains an intriguing phenomenon. The resultspresented here, however, indicate that the increasing availabilityof sequences from genomes at different evolutionary distanceswill greatly contribute to the understanding of splicing, in par-ticular, to understanding its history and its fundamental codingcharacteristics.
Methods
All of the statistical analyses were performed with the R package(Ihaka and Gentleman 1996; http://www.r-project.org/) using adhoc scripts for the preparation of exploratory data analysis plots.
RefSeq genes and intronsAssembled chromosomal sequences and their associated annota-tions were downloaded from the UCSC Genome Browser (Kent etal. 2002; Karolchik et al. 2003; http://genome.cse.ucsc.edu/). Theresults described in this work were obtained on the assemblieslisted in Table 1.
Figure 3. Sequence conservation level of orthologous GT-AG splice sites. Shaded gray areas correspond to the typical sequence span of splice-sitesignals. The average identity between the orthologous sequences is plotted across the splice signals (see Discussion). Background identity has beenestimated from pairs of nonorthologous sites. (Bottom) The result of subtracting background conservation from total conservation.
Comparison of splice sites in mammals and chicken
Genome Research 117www.genome.org
4.3. The Comparative Analysis of Splice Sites in Vertebrates 135

RefSeq genes interrupted with stop codons, or for which theamino acid sequence derived from the genomic coordinates hada difference of more than three amino acids in length or morethan five gaps in the alignment when compared with the originalamino acid sequence, were discarded. After this filtering step,16,803 genes from the 21,744 annotated genes of the humanHGv16 data set, 9734 genes from the 17,988 of the mouseMGSCv4, and 2783 genes from the 4877 of the rat RGSCv3.1were retained.
Orthologous mammalian RefSeq introns
Gene setsThe set of homologous gene pairs was downloaded from theNCBI’s HomoloGene database (Zhang et al. 2000; http://www.ncbi.nlm.nih.gov/HomoloGene/). From 369,338 homologpairs, there were 46,522 pairs corresponding to human–mouse,human–rat, or mouse–rat orthologous genes. Redundancy wasremoved in order to keep only unique putative ortholog pairs.Only those gene pairs in which the two members were in thefinal gene set resulting after the filtering process above weretaken into account. Ternaries of human, mouse, and rat geneswere built when possible. Otherwise, the gene pairs were consid-ered.
This process yielded 1283 human–mouse–rat triads. In ad-dition, 4267 human–mouse ortholog pairs, 454 human–rat pairs,and 133 mouse–rat pairs were obtained. These numbers corre-spond to 6043, 5680, and 1847 unique RefSeq genes for human,mouse, and rat, respectively. When performing pairwise com-parisons, the corresponding genes in the triads were included inthe set of pairs. Thus, the resulting extended pair-wise sets con-tained 5550 human–mouse, 1737 human–rat, and 1416 mouse–rat pairs. All data sets, as well as graphical displays of sequencecomparisons of the orthologous sequences are available fromhttp://genome.imim.es/datasets/hmrg2004/.
Introns setsWe devised a protocol to extract orthologous intron pairs andtriads from the above set of orthologous genes. First, all of thepairs of consecutive exons for each gene were aligned with t_coffee(Notredame et al. 2000; http://igs-server.cnrs-mrs.fr/cnotred/Projectshomepage/tcoffeehomepage.html) using default param-eters against all of the exonic pairs from the corresponding or-thologous genes. This step ensured that we were working withthe most accurate set of orthologous introns, despite changes inthe exonic structure of orthologous genes (such as missing exonsdue to misannotations or gaps in the assemblies). Second, theexonic structure of the gene was projected onto the alignments.Third, from orthologous gene pairs or ternaries, only those exonpairs in which all intron positions occurred at conserved posi-tions in the alignment and the intron phases were conserved andretained. Plots on which the exonic structures have been pro-jected onto the alignments can be accessed at http://genome.imim.es/datasets/hmrg2004/.
Orthologous HMRG intronsA set of human, mouse, rat, and chicken 1:1:1:1 confident or-thologous introns was taken from International Chicken Ge-nome Sequence Consortium (2004) (P. Bork and I. Letunic, pers.comm.). The set consisted of 1041 orthologous genes, totalizing9110 orthologous introns. After mapping those genes into theannotations for the newer assemblies used in this analysis, 863genes and 6524 introns remained in the four species orthologousset. The sequences 75 bp upstream and downstream of the signal
core nucleotides (GT and AG for instance) were used in the or-thologous splice-sites’ sequence conservation analysis.
Intron classU12 introns were searched, relying on the conserved donor-sitesequence and the acceptor-site branch point. Mammalian in-trons were initially considered to be U12 if (1) they matched themotif [AG]TATCCTT (where [AG] means A or G) from position +1at the donor splice site; and (2) they matched the motif TCCTT[AG]A[CT] at the region from �5 to �20 upstream the acceptorsplice site. When looking for the U12 branch point, up to twomismatches were allowed, and the hit was accepted if at least oneadenine was found in position 6 or 7 of the motif—to avoidbranch point hits without biological sense. Visual inspection ofintrons orthologous to U12 introns, but which initially failed tomeet this criteria, suggested that this initial definition is toostringent. Therefore, we searched only for the presence of astrong branch point signal at the appropriate location in ortholo-gous introns. After inspection of all of those cases in which thetwo orthologous introns contain such a signal, we found a fewadditional cases in which the donor-site sequences strongly re-semble the characteristic U12 donor site sequence, but failed tomatch the consensus above. Indeed, we have found that only thenucleotides at positions +2 (T), +3 (A), +4 (T), and +5 (C) withinthe intron are absolutely conserved in U12 donor-site sequences(TATC). Position +6, thought to be an invariable C (Burge et al.1999), may also be a T, and positions +7 and +8 can actually beoccupied by any nucleotide. This more degenerate pattern wasthe one used to identify chicken U12 introns, where, at most, agap (in addition to one mismatch) was also allowed to match thebranch-point consensus. These results, which help to character-ize the sequences that define U12 introns, illustrate the power ofcomparative genomics to refine our knowledge of the functionalsequences encoded in eukaryotic genomes.
Mapping of mammalian U12 introns into the chicken genomeDNA sequences of the exon-pairs delimiting each U12 intronwere mapped into chicken genomic sequences using exonerate(http://www.ebi.ac.uk/guy/exonerate/). Only those alignmentsthat preserved the mammalian splice site were taken into ac-count. Introns obtained in that way were classified into U2/U12classes following the same criteria as in the above section.
Comparison of splice site sequence patternsWe have quantified the different use of nucleotides in splice sitesby different species and represent it by comparative pictograms.A comparative pictogram is a graphical representation of thenucleotide proportions observed in two different sets of alignedsequences. In this article, these sets are splice sites of differentspecies and the proportions are calculated for every positionalong the splice site. As in sequence pictograms, the sizes ofnucleotides scale with their observed proportions, but here thenucleotides of the two sets are put side by side to ease theircomparison. Moreover, the background occupied by eachnucleotide is colored with the ratio of the proportions (the rela-tive risk). Further details are given in the Supplemental material.
We have further analyzed the different nucleotide usage insplice sites of different species by two kinds of comparisons asfollows: (1) by building confidence intervals for the relative risksand counting how many of them include a ratio value of 1 (i.e.,no difference of nucleotide usage), and (2) by assessing the sitespecies dependence, that is, the extent to what the occurrences ofthe observed splice sites depend, statistically speaking, on the
Abril et al.
118 Genome Researchwww.genome.org
136 Chapter 4. Sequence features of Eukaryotic Genes

species to which they belong to. Further details are given in theSupplemental material also.
Acknowledgments
We thank the International Chicken Genome Sequencing Con-sortium for providing the genomic sequences, as well as the Ratand Mouse Consortia from past collaborations. We are particu-larly grateful to Ivica Letunic and Peer Bork for providing the setof HMRG orthologous introns with which some of the analyseswere performed. Juan Valcárcel, Genís Parra, Eduardo Eyras,Webb Miller, David Haussler, Robert Baertsch, Chris Ponting,Alberto Roverato, Kim Worley, and two anonymous referees aregratefully acknowledged for advice and helpful comments. Wealso thank Òscar González for keeping the database mirrors up todate. Special thanks to Jan-Jaap Wesselink and Charles Chapplefor their suggestions when proofreading this document. J.F.A. issupported by a predoctoral fellowship from the “Fundacio IMIM”(Spain). This research is supported by grant BIO2000-1358-C02-02 from “Plan Nacional de I+D” (Spain), and grant ASD from theEuropean Commission.
References
Birney, E., Andrews, T.D., Bevan, P., Caccamo, M., Chen, Y., Clarke, L.,Coates, G., Cuff, J., Curwen, V., Cutts, T., et al. 2004. An overviewof Ensembl. Genome Res. 14: 925–928.
Black, D.L. 2003. Mechanisms of alternative pre-messenger RNAsplicing. Annu. Rev. Biochem. 72: 291–336.
Burge, C.B. and Karlin, S. 1998. Finding the genes in genomic DNA.Curr. Opin. Struct. Biol. 8: 346–354.
Burge, C.B., Padgett, R.A., and Sharp, P.A. 1998. Evolutionary fates andorigins of U12-type introns. Mol. Cell 2: 773–785.
Burge, C.B., Tuschl, T., and Sharp, P.S. 1999. Splicing precursors tomRNAs by the spliceosomes. In The RNA world (eds. R.F. Gestelandet al.), pp. 525–560. Cold Spring Harbor Laboratory Press, ColdSpring Harbor, New York.
Burset, M., Seledtsov, I., and Solovyev, V. 2001. SpliceDB: Database ofcanonical and noncanonical mammalian splice sites. Nucleic AcidsRes. 29: 255–259.
Caceres, J.F. and Kornblihtt, A.R. 2002. Alternative splicing: Multiplecontrol mechanisms and involvement in human disease. TrendsGenet. 18: 186–193.
Cartegni, L., Chew, S.L., and Krainer, A.R. 2002. Listening to silence andunderstanding nonsense: Exonic mutations that affect splicing. Nat.Rev. Genet. 3: 285–298.
de Souza, S.J. 2003. The emergence of a synthetic theory of intronevolution. Genetica 118: 117–121.
Dermitzakis, E.T., Reymond, A., Lyle, R., Scamuffa, N., Ucla, C.,Deutsch, S., Stevenson, B.J., Flegel, V., Bucher, P., Jongeneel, C.V., etal. 2002. Numerous potentially functional but non-genic conservedsequences on human chromosome 21. Nature 420: 578–582.
Dietrich, R.C., Incorvaia, R., and Padgett, R.A. 1997. Terminal introndinucleotide sequences do not distinguish between U2- andU12-dependent introns. Mol. Cell 1: 151–160.
Dietrich, R.C., Peris, M.J., Seyboldt, A.S., and Padgett, R.A. 2001. Role ofthe 3� splice site in U12-dependent intron splicing. Mol. Cell. Biol.21: 1942–1952.
Fedorova, L. and Fedorov, A. 2003. Introns in gene evolution. Genetica118: 123–131.
Hall, S.L. and Padgett, R.A. 1994. Conserved sequences in a class of rareeukaryotic nuclear introns with non-consensus splice sites. J. Mol.Biol. 239: 357–365.
Hare, M.P. and Palumbi, S.R. 2003. High intron sequence conservationacross three mammalian orders suggests functional constraints. Mol.Biol. Evol. 20: 969–978.
Helfman, D.M. and Ricci, W.M. 1989. Branch point selection inalternative splicing of tropomyosin pre-mRNAs. Nucleic Acids Res.17: 5633–5650.
Ihaka, R. and Gentleman, R. 1996. R: A language for data analysis andgraphics. J. Computat. Graph. Stat. 5: 299–314.
International Chicken Genome Sequencing Consortium. 2004. Sequenceand comparative analysis of the chicken genome provide uniqueperspectives on vertebrate evolution. Nature (in press).
Jackson, I.J. 1991. A reappraisal of non-consensus mRNA splice sites.Nucleic Acids Res. 19: 3795–3798.
Karolchik, D., Baertsch, R., Diekhans, M., Furey, T.S., Hinrichs, A., Lu,Y.T., Roskin, K.M., Schwartz, M., Sugnet, C.W., Thomas, D.J., et al.2003. The UCSC genome browser database. Nucleic Acids Res.31: 51–54.
Kent, W.J., Sugnet, C.W., Furey, T.S., Roskin, K.M., Pringle, T.H., Zahler,A.M., and Haussler, D. 2002. The human genome browser at UCSC.Genome Res. 12: 996–1006.
Kryukov, G., Castellano, S., Novoselov, S., Lobanov, A., Zehtab, O.,Guigo;, R., and Gladyshev, V. 2003. Characterization of mammalianselenoproteomes. Science 300: 1439–1443.
Lander, E.S., Linton, L.M., Birren, B., Nusbaum, C., Zody, M.C.,Baldwin, J., Devon, K., Dewar, K., Doyle, M., FitzHugh, W., et al.2001. Initial sequencing and analysis of the human genome. Nature409: 860–921.
Levine, A. and Durbin, R. 2001. A computational scan forU12-dependent introns in the human genome sequence. NucleicAcids Res. 29: 4006–4013.
Mattick, J.S. 2001. Non-coding RNAs: The architects of eukaryoticcomplexity. EMBO Rep. 2: 986–991.
Notredame, C., Higgins, D.G., and Heringa, J. 2000. T-Coffee: A novelmethod for fast and accurate multiple sequence alignment. J. Mol.Biol. 302: 205–217.
Pruitt, K.D., Tatusova, T., and Maglott, D.R. 2003. NCBI referencesequence project: Update and current status. Nucleic Acids Res.31: 34–37.
Rat Genome Sequencing Project Consortium. 2004. Genome sequenceof the brown Norway rat yields insights into mammalian evolution.Nature 428: 493–521.
Roy, S.W., Fedorov, A., and Gilbert, W. 2003. Large-scale comparison ofintron positions in mammalian genes shows intron loss but no gain.Proc. Natl. Acad. Sci. 100: 7158–7162.
Schneider, T. and Stephens, R. 1990. Sequence logos: A new way todisplay consensus sequences. Nucleic Acids Res. 18: 6097–6100.
Sharp, P. and Burge, C. 1997. Classification of introns: U2-Type andU12-Type. Cell 91: 875–879.
Smith, C.W. and Nadal-Ginard, B. 1989. Mutually exclusive splicing of�-tropomyosin exons enforced by an unusual lariat branch pointlocation: Implications for constitutive splicing. Cell 56: 749–758.
Thanaraj, T., Clark, F., and Muilu, J. 2003. Conservation of humanalternative splice events in mouse. Nucleic Acids Res. 31: 2544–2552.
Waterston, R.H., Lindblad-Toh, K., Birney, E., Rogers, J., Abril, J.F.,Agarwal, P., Agarwala, R., Ainscough, R., Alexandersson, M., An, P.,et al. 2002. Initial sequencing and comparative analysis of themouse genome. Nature 420: 520–562.
Xu, Q., Modrek, B., and Lee, C. 2002. Genome-wide detection oftissue-specific alternative splicing in the human transcriptome.Nucleic Acids Res. 30: 3754–3766.
Yeo, G., Holste, D., Kreiman, G., and Burge, C. 2004. Variation inalternative splicing across human tissues. Genome Biol. 5: R74.
Zhang, Z., Schwartz, S., Wagner, L., and Miller, W. 2000. A greedyalgorithm for aligning DNA sequences. J. Comput. Biol. 7: 203–214.
Zhu, W. and Brendel, V. 2003. Identification, characterization andmolecular phylogeny of U12-dependent introns in the Arabidopsisthaliana genome. Nucleic Acids Res. 31: 4561–4572.
Web site references
http://genome.imim.es/datasets/hmrg2004/; further supplementalmaterials for this study.
http://genome.cse.ucsc.edu/; UCSC Genome Browser, from which thehuman, mouse, rat and chicken feature annotations and genomeassemblies used in this study were downloaded.
http://www.ensembl.org/; Ensembl Genome Browser, from which alarger set of human, mouse, rat and chicken gene annotation setswere retrieved.
http://www.ncbi.nlm.nih.gov/HomoloGene/; NCBI’s HomoloGenedatabase, from where initial RefSeq orthologous pairs were obtained.
http://igs-server.cnrs-mrs.fr/cnotred/Projectshomepage/tcoffeehomepage.html; a multiplesequence alignment package.
http://www.ebi.ac.uk/guy/exonerate/; a generic tool for sequencecomparison.
http://www.r-project.org/; the R project for statistical computing.
Received August 4, 2004; accepted in revised form November 11, 2004.
Comparison of splice sites in mammals and chicken
Genome Research 119www.genome.org
4.3. The Comparative Analysis of Splice Sites in Vertebrates 137

138 Chapter 4. Sequence features of Eukaryotic Genes
4.3.3 ICGSC, Nature, 432(7018):695–716, 2004
PubMed Accession:http://www.ncbi.nlm.nih.gov/entrez/query.fcgi?cmd=Retrieve&db=PubMed&list_uids=15592404&dopt=Abstract
Journal Abstract:http://www.nature.com/cgi-taf/DynaPage.taf?file=/nature/journal/v432/n7018/abs/nature03154_fs.html
Supplementary Materials:See Section 4.3.2 and the following URL:http://www.nature.com/nature/journal/v432/n7018/suppinfo/nature03154.html
NOTE: Because of copyright restrictions, we cannot offer the article, please followlinks for fulltext.

Chapter 5
Visualization Tools
If a picture is not worth a 1000 words,to hell with it !
—Ad Reinhardt (note this is from the original Chinese quotethat “a picture is worth 10,000 words”)
In this chapter the focus will shift towards the annotation and visualization process,describing those tools that permit to integrate data from different sources, including gene-prediction results, to present them to biologists in a comprehensive and comprehendiblemanner. These programs are intended to provide an overall view of our knowledge of agenomic region in a user-friendly interface, either static or interactive.
Before reporting our contribution to this field, we will place it in context with respectto other software. Therefore, a review of visualization tools provides the best frame topresent our developments later. In the case of gff2ps, we have also participated in thecartography of the human, the fruit-fly and the mosquito genomes, and a special mentionis deserved in the corresponding section.
5.1 A Review of Visualization Tools for Genomic Data
This section is not an in depth review, but an attempt to enumerate a broad spectrumof such software —ranging from the fully automated genome pipelines to the simplecommand-line programs—, and to highlight their application to comparative genome anal-yses. Programs are classified into three types: a) the database browsers, b) the annotationworkbenches, that can be also used as browsers; and c) specific tools to visualize resultsfrom different sequence analysis, pointing the attention on those developed on top of align-ment algorithms. We will not deal here with the libraries of code that contain programs orfunctions to plot data in any of the aforementioned classes, because they are of interestmostly to advanced users and computer specialists —for instance, bioTk [Searls, 1995],bioWidgets [Fischer et al., 1999], the Bioperl Toolkit [Stajich et al., 2002] or the GenericModel Organism Project (GMOD, see page214, on Web Glossary).
149

150 Chapter 5. Visualization Tools
5.1.1 Database browsers
A first entry point to the visualization of genomic analyses can be any of the web front-endsdeveloped to publish genome annotations. For example, the ones offered by databases ofspecies- specific genome projects, such as the Saccharomyces cerevisiae SGD [Christie et al.,2004], the Caenorhabditis elegans WORMBASE [Harris et al., 2004], the Drosophila melanogasterFLYBASE [The FlyBase Consortium, 2003], the mouse MGD [Bult et al., 2004], the Arabidop-sis thaliana TAIR [Rhee et al., 2003], and so on. The expected evolution of these of interfaceswas to summarize all the information under a unified graphical schema as the number ofspecies being sequenced increased —as done in the euGenes [Gilbert, 2002], the GenericGenome Browser (Gbrowse, Stein et al. 2002) and the GeneDB[Hertz-Fowler et al., 2004]systems.
The best example of such evolution is ACEDB [see page 213, on Web Glossary; Durbinand Thierry-Mieg, 1993; Eeckman and Durbin, 1995], a seminal genome database systemdeveloped since 1989 and originally tailored for the C. elegans genome project. The tools init have been generalized and are now used in a variety of organism-specific databases asdiverse as bacteria and eukaryotes [Walsh et al., 1998]. Specialized displays for managingand publishing genomic data are available through its well-set-up graphical user interface.Two remarkable implementations are the AceBrowser [Stein and Thierry-Mieg, 1998] andJade [Stein et al., 1998] programs.
There has already been a worldwide effort to centralize all the information aboutsequenced genomes. The best examples are the three fully established whole-genomebrowsers: the NCBI MAP VIEWER [see page 215, on Web Glossary; Wheeler et al., 2005],the UCSC GENOME BROWSER [see page 216, on Web Glossary; Karolchik et al., 2004] andthe ENSEMBL system at the Sanger Institute and the EBI [see page 213, on Web Glossary;Birney et al., 2004a]. All three browsers present by default a set of "in-house" and/or con-tributed gene- finding predictions from different programs. This is an on-going effort andpredictions are recomputed for each newly released assembly. However, only the UCSCand ENSEMBL systems distribute predictions fully-based on the comparative genomics ap-proaches. In what follows, we briefly review these three main genome gates.
The NCBI MAP VIEWER shows ab initio gene models generated by Gnomon [NCBI,2003], a heuristic tool able to find the maximal self-consistent set of transcript and proteinalignments to genomic data. Other programs like, for instance, GenomeScan [Yeh et al.,2001], use this information to parameterize the constraints for an underlying HMM-basedgene prediction model. The browser is focused to display genome assemblies using setsof synchronized chromosomal maps, but also features tables of genetic loci in homologoussegments of DNA between human and mouse —the so called Human-Mouse HomologyMaps—, and has links to HOMOLOGENE, a database of curated and calculated gene homo-logues.
The ENSEMBL system can display simultaneously different sets of annotated featuresand predictions from several gene-prediction tools embedded in the ENSEMBL annotationpipeline (see for instance, Figures 1.4 and 5.1). An interesting feature of the ENSEMBL sys-tem is the inclusion of external data through a Distributed Annotation System (DAS,Dowellet al. 2001) server, which, on user demand, dynamically links third-party annotations to thegenomic sequence under study. The SGP2[Parra et al., 2003], Twinscan [Korf et al., 2001],and SLAM[Alexandersson et al., 2003] gene annotation tracks, for instance, can be easilyincluded in the current view by switching on the corresponding check box in the ‘DAS

5.1. A Review of Visualization Tools for Genomic Data 151
Figure 5.1: Human GBF1 loci genomic region and its counterpart in mouse. Detailed viewof the human/mouse homology block at the GBF1 loci (human chromosome 10, between103963970bp and 104163968bp) as shown by the MultiContig View page on ENSEMBL. Ortholo-gous genes are connected by a blue line. Pink boxes represent the homologous regions betweenboth species projected into each sequence. Those homology hits are connected by green shadedregions. Differences at sequence level, such as insertions/deletions and inversions, are easilyspotted with that green shading.
sources’ drop-down menu. A syntenic regions navigation tool is available at ENSEMBL (seeupper right panel from Figure 1.4 and Clamp et al. 2003). It was initially developed forhuman-mouse comparisons but it has been extended to include further species compar-isons, i.e. rat, chicken, fruit-fly and so on. An example of the MultiContig viewer is shownin Figure 5.1.
Finally, gene-predictions can also be retrieved from the UCSC browser by switching onthe appropriate options in the drop-down menus from the navigation form. In addition,the UCSC GENOME BROWSER features a novel database named ZOO, on which analysesmade over a set of homologous targeted genomic sequences from 12 species [Thomas et al.,2003] are published. Furthermore, depending on which genome is being browsed, theannotated gene features can be combined with the results of a mixture of whole-genomeprecomputed alignments from BLAT [Kent, 2002], BLASTZ [Schwartz et al., 2003b], WABA[Kent and Zahler, 2000], and/or Exofish ecores [Jaillon et al., 2003].
Current genome browsers, however, lack the ability to clearly represent informationacross genomes. A multiple species genome browser system should be able to representmany-to-many genomic alignments as an alignment among genomes. Moreover, it is dif-ficult for most systems to develop a representation that natively compares whole-genomesand not only targeted regions. In this regard, the K-Browser [Chakrabarti and Pachter,2004] has been designed around two principles: genome symmetry —every genome con-
152 Chapter 5. Visualization Tools
tains useful information, thus a browsing solution should not limit the ability to navigatewithin or across genomes—; and genome homology —related genomes have evolved froma common ancestor and these evolutionary relationships should be accurately reflected inboth the representation and the visualization of information. The K-Browser takes asinput a specific region in a specific genome and produces a set of images that succinctlyrepresents the requested region and all orthologous regions. It can also provide the under-lying multiple alignments.
5.1.2 Annotation workbenches
A myriad of sequence annotation workbenches have been developed during the lastdecade, but only a few have taken into account the comparative genomics perspectiveinto their design. In this regard, it is worthwhile to cite Alfresco [Jareborg and Durbin,2000], genomeSCOUT[Suter-Crazzolara and Kurapkat, 2000], ERGO[Overbeek et al., 2003],Theatre [Edwards et al., 2003], and FamilyJewels [Brown et al., 2002]. Developed sincethe mid-nineties, these workbenches established the basis of modern annotation tools suchas Artemis [Rutherford et al., 2000] and Apollo [Lewis et al., 2002]. The latter providesa human-mouse synteny panel that allows the user to compare and edit annotations forthese two species. The Artemis Comparison Tool (ACT), based on theArtemis imple-mentation, displays the results of a BLASTN/TBLASTXsearch along the sequence with thecorresponding annotations. These tools are mainly employed by human curators for the re-annotation labour necessary to improve the raw annotations from automated pipelines. Inthis regard, the Otter annotation system [Searle et al., 2004] extends the ENSEMBL databaseschema to integrate manual annotations by exchanging data in XMLformat between ma-chines and allowing multiuser annotation. Two annotation tools have Otter client sup-port, Apollo and Otter/Lace. Otter/Lace is a perl wrapper round the AceDB anno-tation editor, and it is currently used by the Human and Vertebrate Annotation (HAVANA)group curators at the Sanger Center. A review of several annotation browsers from theend-user viewpoint can be found in Fortna and Gardiner [2001].
5.1.3 Tools for visualizing alignments
Despite the trend to move from the pair-wise sequence comparison tools (two species) tothe comparison of multiple sequences (many species) [Miller, 2001], there is still a niche forpair-wise comparison tools. The main reason is that such one-to-one alignments providean informative comparison, but with the lowest complexity of interpretation.
Pair-wise comparisons can be done in several ways. A dot-plot or comparison matrixsimultaneously displays all the structures in common between two sequences [Fitch, 1966;Gibbs and McIntyre, 1970]. In this, the conserved, repeated or inverted repeated segmentsare clearly visualized. Accordingly, dot-plot like diagrams have been extensively used todefine the conserved segments of large genomic sequences, and also to explore the repeat-rich regions [Waterston et al., 2002]. These conserved segments can be further analyzedwith, for instance, the PiP-like tools described below. Among the pair-wise tools, onecan cite DIAGON[Staden, 1982], LFASTA[Pearson and Lipman, 1988], Lav [Schwartz et al.,1991], Blixem [Sonnhammer and Durbin, 1994], Dotter [Sonnhammer and Durbin, 1995],Laj [Wilson et al., 2001], GenoPix2D [Cannon et al., 2003], or NOPTALIGN[Smoot et al.,

5.1. A Review of Visualization Tools for Genomic Data 153
Figure 5.2: A comparison of PiP-plots versus Smooth-plots. Sequence between 95992kb and96028kb from chromosome 8 was compared against its homologous mouse genomic sequenceusing the zPicture web server [Ovcharenko et al., 2004a]. The same underlying alignment,computed with BLASTZ [Schwartz et al., 2003b], is visualized as a pip-plot in the upper paneland as a smooth-plot in the bottom one, emulating the output from PipMaker [Schwartz et al.,2000] and VISTA [Mayor et al., 2000] respectively. Pip-plots display all the short ungapped align-ments as black horizontal lines, while smooth-plots are constructed using, for each nucleotide,a 100bp sliding window in which sequence identity is averaged. Boxes along the 100% identitybaseline represent evolutionary conserved regions (ECRs), while those on the 50% baseline pin-point the masked regions in which repetitive elements were found. NM152416 gene structure(human hypothetical protein MGC40214) is depicted above the identity plots in both panels.
2004]. The EMBOSSsuite [Olson, 2002; Rice et al., 2000] provides several programs of thiskind (dottup, dotmatcher, dotpath and polydot). The gff2aplot [Abril et al., 2003]program falls within this software family. See Figure 5.8 on page 175 (Figure 1 on page 2478of Abril et al. 2003), for examples of its output. Its major strength is to be independent ofany alignment algorithm, as far as the input can be translated into the General FeatureFormat (GFF, see page214, on Web Glossary). TriCross [Ray et al., 2001], which extendsthe dot-plot concept to the simultaneous analysis of three sequences, renders the resultsin a three-dimensional Virtual Reality Modeling Language (VRML) representation.
Then again, those sequence comparisons can be represented in a more compact lin-ear fashion. Several tools can be grouped here: LAPS (Local Alignment to POSTSCRIPT,Schwartz et al. 1991), LalnView [Duret et al., 1996], and GenomePixelizer [Kozik et al.,2002]. The latter has been applied to visualize inter- and intra-chromosomal segmentalduplications in genomic sequences [Cheung et al., 2003; Estivill et al., 2002].
Another class of programs, so called PiP-like because they produce Percentage IdentityPlots, were designed to represent data from underlying sequence alignment algorithms.Basically, they consist in a compact display of the results of aligning one sequence to oneor more sequences, where the positions (in the first sequence) and the score of the align-ment segments are plotted, along with icons for features in the first sequence. MUMmer[Delcher et al., 1999; Kurtz et al., 2004], PipMaker [Schwartz et al., 2000], Multi-PipMaker[Schwartz et al., 2003a], VISTA [Mayor et al., 2000], CGAT[Lund et al., 2000], and SynPlot[Göttgens et al., 2001], are among these tools. They do not fit into the gene-predictionparadigm sensu strictu; in any case, they have proven their potential in finding and/or re-

154 Chapter 5. Visualization Tools
fining protein-coding regions [Jang et al., 1999; Pennacchio et al., 2001; Reisman et al., 2001;Tompa, 2001; Toyoda et al., 2002; Wilson et al., 2001], as well as the conserved non-codingsequences around them which may play a role in gene expression [Dubchak et al., 2000;Gilligan et al., 2002; Göttgens et al., 2000, 2001; Hardison, 2000; Hardison et al., 1997; Lootset al., 2000; Oeltjen et al., 1997; Ovcharenko and Loots, 2003b]. They even have been founduseful in the analysis of the distribution of repetitive sequences [Chiaromonte et al., 2001;Yuhki et al., 2003]. See Figure 5.2 for an example of what can be done with these tools.
These programs have been reviewed in a number of occasions [Frazer et al., 2003; Pen-nacchio and Rubin, 2001; Pennacchio, 2003; Pennacchio and Rubin, 2003; Thomas andTouchman, 2002; Ureta-Vidal et al., 2003]. In Frazer et al. [2003], there is a good exampleof what can be achieved using those tools; it can be taken as a complete protocol describ-ing how to retrieve the data sets, to prepare the sequences and complementary files, tocompare them through the corresponding web browsers, and finally how to interpret theirgraphical outcomes. Two web servers have been deployed in an attempt to make thosetools more interactive for the average user: the ECR-Browser (a navigation tool for Evo-lutionary Conserved Regions: Ovcharenko and Loots 2003a; Ovcharenko et al. 2004b) andzPicture (Ovcharenko et al. 2004a, and Figure 5.2). On the other hand, a comparison ofthe different alignment algorithm approaches behind some of those programs can be foundin Ureta-Vidal et al. [2003]. EnteriX [Florea et al., 2003] takes advantage of those princi-ples to compare complete genomes of enteric bacteria. Nevertheless, the application of thisalgorithm to larger eukaryotic sequences, for instance to apply them in a whole-genomeanalysis, requires a large amount of computational resources. One drawback of these toolsis that their input often needs to be defined within conserved genomic segments, for in-stance, regions of synteny between chromosomes, because sequence rearrangements candramatically distort the corresponding alignments.
Some tools have been specifically devised for the analysis of regulatory regions, al-though they can use a similar approach that the one described above for programs suchas PipMaker or VISTA. ReguloGram visualizes the density of co-occurring cis-elementtranscription factor binding sites measured within a 200bp moving window through phy-logenetically conserved regions. Within a high-scoring region, the relative arrangement ofshared cis-elements within compositionally similar binding site clusters can be depictedthen with TraFacGram [both, ReguloGram and TraFacGram, were described in Jeggaet al. 2002]. ConSite [Lenhard et al., 2003; Sandelin et al., 2004] is a graphical web applica-tion that takes advantage of the phylogenetic footprinting to report putative transcriptionfactor binding sites situated in conserved regions and located as pairs of sites in equivalentpositions in alignments between two orthologous sequences.
Apart from raw sequence genomic comparisons, one might be interested in examiningthe gene distribution among two or more species. One of the first approaches to this was theOxford Grid [Edwards, 1991]. Coordinates for successive chromosomes of two specieswere drawn along two axes as in a dot-plot, homologous loci were then depicted as dots.Pair-wise similarity scores have also been used to estimate closer neighbour relationshipswhen analyzing many genomes as a whole. Those results have been commonly representedas pie charts or Venn diagrams [Blaxter et al., 2002; Wood et al., 2002], but this leads toan static view of the sequence relationships. A more dynamic view is the one offered bythe SimiTri tool [Parkinson and Blaxter, 2003], in which the simultaneous display andanalysis of the similarity relationships of the dataset of interest, in example the completeproteome of an organism, relative to three other databases can be achieved.
5.1. A Review of Visualization Tools for Genomic Data 155
5.1.4 Tools for visualizing annotations
One of the first graphic programs devoted to determine the function of nucleic acid se-quences was ANALYSEQ[Staden, 1984b], and its focus on finding coding-exons. In thiscontext it is also worth mentioning, the RSVPpackage [Searls, 1993]—in which sequenceanalysis algorithms were encoded using the POSTSCRIPT language, and thus, could in prin-ciple be performed by the printer.
Although not necessarily comparative based, several gene-prediction tools displaygraphical output either through a web server or as a standalone software. This graphi-cal output generally consists in colored shapes corresponding to coding exons or otherfunctional elements along the genomic axis. This approach was notably pioneered in X-windows systems by GeneModeler [Fields and Soderlund, 1990] as an standalone plat-form, and by XGRAIL [Uberbacher and Mural, 1991] as a network-based client-server archi-tecture. In all these cases, the visualization capabilities are strongly tied to a particular genefinding algorithm. More general and algorithm independent visualization tools have beenalso developed. This task has been facilitated by the general acceptance of GFFformat, andits derivatives (see page 214 from Web Glossary), as a standard for genomic features an-notations. gff2ps [Abril and Guigó, 2000], for instance, displays GFFfiles assuming thatthe file itself carries enough formatting information. Additional flexibility comes from thecustomization files defined by the user, and also because of the POSTSCRIPT output and theability to handle multiple page formats. Examples of its output can be seen on Figure 5.4on page 160 (Figure 1 on page 744 of Abril and Guigó 2000). Those people looking foran interactive and extensible visualization program, should take a look to the GUPPYsys-tem [Ueno et al., 2003], implemented over the Lua scripting language [Ierusalimschy et al.,1996]. Finally, it is worth to cite Sockeye [Montgomery et al., 2004], a three-dimensionalJava-based application that has been developed recently to compactly display compara-tive analyses.
Initial developments of circular maps were devoted to draw restriction maps over plas-mid sequences, then were applied to represent bacterial circular chromosomes. How-ever, linear maps are more appropriate for visualizing genomic features, and for compa-rative studies in particular —as Tufte [2001] claims, any distortion when plotting data thatwill lead to misinterpretation should be avoided. Among the tools developed to visual-ize genetic maps one can cite gRanch [Wada et al., 1997], mapmerge [Nadkarni, 1998],mapplet [Jungfer and Rodriguez-Tome, 1998], FitMaps+ShowMap [Graziano and Arus,2002], NCBI’s MapViewer [Wheeler et al., 2002], or cMap [Fang et al., 2003]. Applicationsto produce circular or linear representations of genomic features were provided by severalsoftware packages; such as GCG[Devereux et al., 1984], Staden [Staden et al., 2000], SRS[Etzold and Argos, 1993], SEALS[Walker and Koonin, 1997], or EMBOSS[Olson, 2002; Riceet al., 2000]. Further examples of this kind of tools are GenomePlot [Gibson and Smith,2003], GenoMap[Sato and Ehira, 2003], and ZoomMap+MappetShow [Barillot et al., 1999].
Finally, it is worth to mention a set of visualization tools that are useful in a more specificanalysis context. For instance, graph-based display using exons as nodes produces morecompact pictures of alternative splicing exonic structures. This approach has been imple-mented in SpliceNest [Coward et al., 2002; Krause et al., 2002], and SplicingGraphs[Heber et al., 2002]. Software that analyses the repeats distribution and composition ongenomic sequences often includes a graphical interface, in which repetitive regions arelinked by using straight lines or arcs. In this category one can find MiroPEATS [Parsons,

156 Chapter 5. Visualization Tools
Figure 5.3: Flow chart of internal main processes for gff2ps and gff2aplot. Both toolswere devised as standard Unix programs, they work as filters that process an input stream, inGFF, to produce an output stream, in POSTSCRIPT. Customization is provided by user-definedfiles or through command-line switches. Those settings are integrated with the input data to seta variables defining block and to bring forth the corresponding feature function calls in the pagesection of a POSTSCRIPT document. Such file is able to render the annotation plots thanks to spe-cific POSTSCRIPT functions defined in its code section. The output document is self-contained,it has the data to plot and the commands to draw it.
1995], REPUS[Babenko et al., 1999], REPuter [Kurtz and Schleiermacher, 1999], Genomecryptographer [Cleaver et al., 2003], Exact Match Annotator [Healy et al., 2003],FORRepeats [Lefebvre et al., 2003], GenomeComp[Yang et al., 2003], or ADplot [Taneda,2004].
5.2 gff2ps: Visualizing Genomic Features
There are two major systems for representing graphic information on computers: rasterand vector graphics. In raster graphics, an image is represented as a rectangular array ofpicture elements or pixels. Each pixel is represented either by its RGB color values or asan index into a list of colors. This series of pixels, also called a bitmap, is often storedin a compressed format. Since most display devices are also raster devices, displayingsuch a bitmap requires a viewer program to do little more than uncompress and transferthat bitmap to the screen. In a vector graphic system, an image is described as a series ofgeometric shapes. Rather than receiving a finished set of pixels, a vector viewing program,often also known as the interpreter, receives commands to draw shapes at specified sets ofcoordinates. In other words, it translates graphical objects into a virtual grid that is thenprojected in the corresponding raster device at a given fixed resolution. Although theyare not as popular as raster graphics, vector graphics have one feature that makes theminvaluable in many applications, they can be scaled without loss of image quality in thefinal rendering. This also means that once you generated an image you can zoom intoany region of it to observe further details, which is done by the interpreter. To achievethe same with bitmaps requires to generate each zoom separately. This may not involveas much CPU time as needed by the vector graphics interpreter, but it is not efficient instorage space. Most of those arguments lead us to opt for a vector graphics programminglanguage when developing most of our visualization tools, despite such systems do nothave the same acceptance or support than a bitmap one. In any case, a vector graphic canbe converted into a bitmap without loosing information while the other way around is not

5.2. gff2ps: Visualizing Genomic Features 157
always true.
Introduced in 1985, POSTSCRIPT is the name of a computer programming languagedeveloped originally by Adobe Systems Incorporated to communicate high-level graphic in-formation to digital laser printers [Adobe S.I., 1999]. It is a flexible, compact, and powerfullanguage both for expressing graphic images in a device-independent manner and for per-forming general programming tasks. The three most important aspects of the POSTSCRIPTprogramming language are that it is interpreted, that it is stack-based, and that it uses aunique data structure called a dictionary. The dictionary mechanism gives the POSTSCRIPTlanguage a flexible, extensible base, and the fact that the language is interpreted and usesa stack model means that programs can be of arbitrary length and complexity. Since verylittle overhead is necessary to execute the programs, they can be interpreted directly fromthe input stream, which means that no memory restriction is placed on a POSTSCRIPT pro-gram other than memory allocated by the program itself [Reid, 1996]. Those programmingfeatures make the POSTSCRIPT language suitable for developing visualization tools in thegenomic annotation field.
The combination of specific purpose POSTSCRIPT-generating scripts previously imple-mented by me, along with the establishment of annotation interchange formats by the ge-nome annotation community, such as GFF, led to the definition of the initialgff2ps draft.gff2ps was initially conceived in 1999 as a general drawing tool to represent gene-findingannotations from different sources. The program assumes that the GFFinput itself carriesenough formatting information. Genomic annotations have a hierarchical structure inher-ent to the biological features represented by them. For instance, a sequence may containseveral genes, which are made of one or more exons, which are delimited by different sig-nals, such splice sites and initiation or stop codons. Such structure is encoded in the GFFrecords by settling a fixed feature attribute on each field, i.e. the initial and terminal coordi-nates, a score, the group belonging to, and so on (see an example of the GFFrecord structureon page 214 from Web Glossary). gff2ps internal flow chart is depicted in Figure 5.3. Twomain code blocks define this program: the gawk input filter and the POSTSCRIPT drawingfunctions. The gawk code block is in charge of processing the GFFinput records and the as-sociated customization parameters, to produce specific POSTSCRIPT-function calls for thatdata. Then, it embeds that piece of code in the POSTSCRIPT document, which is by itselfanother code block.
Notable applications of gff2ps include the whole-genome annotation maps for severalspecies —Drosophila melanogaster (Adams et al. 2000; see section 5.2.2 on page 161 and Fig-ure 5.5), human (Venter et al. 2001; see section 5.2.3 on page 165 and Figure 5.6), the mousechromosome 16 [Mural et al., 2002], Anopheles gambiae (Holt et al. 2002; see section 5.2.4 onpage 169 and Figure 5.7), and Blochmannia floridanus [Gil et al., 2003]. Figure 3.8 on page 91(Figure 2 on page 1142 of Guigó et al. [2003]) and bottom panel of Figure 5.10 are examplesof using gff2ps in the comparative genomics context.

158 Chapter 5. Visualization Tools
5.2.1 Abril and Guigó, Bioinformatics, 16(8):743–744, 2000
PubMed Accession:http://www.ncbi.nlm.nih.gov/entrez/query.fcgi?cmd=Retrieve&db=PubMed&list_uids=11099262&dopt=Abstract
Journal Abstract:
http://bioinformatics.oupjournals.org/cgi/content/abstract/16/8/743
Program Home Page:
http://genome.imim.es/software/gfftools/GFF2PS.html
NOTE: Because of copyright restrictions, we cannot offer the article,
please follow links for fulltext.

5.2. gff2ps: Visualizing Genomic Features 161
5.2.2 Adams et al , Science, 287(5461):2185–2195, 2000
PubMed Accession:http://www.ncbi.nlm.nih.gov/entrez/query.fcgi?cmd=Retrieve&db=PubMed&list_uids=10731132&dopt=Abstract
Journal Abstract:
http://www.sciencemag.org/cgi/content/abstract/287/5461/2185
Companion Poster:See Figure 5.5 and the following URLs:http://www.sciencemag.org/feature/data/genomes/2000/drosophila.shlhttp://genome.imim.es/references/genome_maps/2000_Science_v287_i5461_p2185_fig4_FlyGenome.ps.gz
NOTE: Because of copyright restrictions, we cannot offer the article,please follow links for fulltext.

5.2. gff2ps: Visualizing Genomic Features 165
5.2.3 Venter et al, Science, 291(5507):1304–1351, 2001
PubMed Accession:http://www.ncbi.nlm.nih.gov/entrez/query.fcgi?cmd=Retrieve&db=PubMed&list_uids=11181995&dopt=Abstract
Journal Abstract:
http://www.sciencemag.org/cgi/content/abstract/291/5507/1304
Companion Poster:See Figure 5.6 and the following URLs:http://www.sciencemag.org/cgi/content/full/291/5507/1304/DC2http://genome.imim.es/references/genome_maps/2001_Science_v291_i5507_p1304_fig1_HumanGenome.ps.gz
NOTE: Because of copyright restrictions, we cannot offer the article, please follow links for fulltext.

5.2. gff2ps: Visualizing Genomic Features 169
5.2.4 Holt et al , Science, 298(5591):129–149, 2002
PubMed Accession:http://www.ncbi.nlm.nih.gov/entrez/query.fcgi?cmd=Retrieve&db=PubMed&list_uids=12364791&dopt=Abstract
Journal Abstract:
http://www.sciencemag.org/cgi/content/abstract/298/5591/129
Companion Poster:See Figure 5.7 and the following URLs:http://www.sciencemag.org/cgi/content/full/298/5591/129/DC2http://genome.imim.es/references/genome_maps/2002_Science_v298_i5591_p129_fig1_MosquitoGenome.ps.gz
NOTE: Because of copyright restrictions, we cannot offer the article, please follow links for fulltext.

5.3. Software Developed for Comparative Analyses 173
5.3 Software Developed for Comparative Analyses
5.3.1 gff2aplot: visualizing pairwise homology
gff2aplot was designed following the same principles as for gff2ps. Figure 5.3 illus-trates the main internal processes flow chart for both tools. The problem to solve herewas to integrate annotation information of two sequences being compared along with thepair-wise alignments obtained by other programs.
Due to the fact that each alignment software outputs alignments in their own format,it was decided to provide different filters to convert those alignment formats into a singleinterchange format. Such format was initially derived from GFF version 1, the so calledaplot format. However, GFF version 2 provides enough flexibility to encode the align-ment records into a more standardized way. Both alignment input formats, the aplot andthe GFFv2, have been kept for backward compatibility in newer releases ofgff2aplot.Use of an standardized input format permits to combine data from different alignmenttools, or from different analyses made with the same tool—see for instance, right panelfrom Figure 5.8 on page 175 (Figure 1 on page 2478 of Abril et al. 2003)—, in order tocompare them. An additional advantage of working with such filters to produce GFF-like records was the capability of visualizing that kind of data using gff2ps (as shown inFigure 5.10 lower panel).
Having that in mind, four programs have been implemented to date to complementgff2aplot, three perl scripts and another written in the C language. parseblast isa parser for the standard output from four of the BLAST program flavours available, sayhere NCBI-Blast [Altschul et al., 1990, 1997], WU-Blast [Gish, 1996–2004], WebBlast[Ferlanti et al., 1999] and MegaBlast [Zhang et al., 2000]. blat2gff converts BLAT [Kent,2002] output into GFF, while sim2gff does the same for SIM [Huang and Miller, 1991]output. The Cprogram, ali2gff, processes SIM or Mummer[Delcher et al., 1999] output toproduce the GFFrecords for the alignment.
5.3.2 Abril et al, Bioinformatics, 19(18):2477–2479, 2003
PubMed Accession:http://www.ncbi.nlm.nih.gov/entrez/query.fcgi?cmd=Retrieve&db=PubMed&list_uids=14668236&dopt=Abstract
Journal Abstract:
http://bioinformatics.oupjournals.org/cgi/content/abstract/19/18/2477
Program Home Page:
http://genome.imim.es/software/gfftools/GFF2APLOT.html
NOTE: Because of copyright restrictions, we cannot offer the article,
please follow links for fulltext.
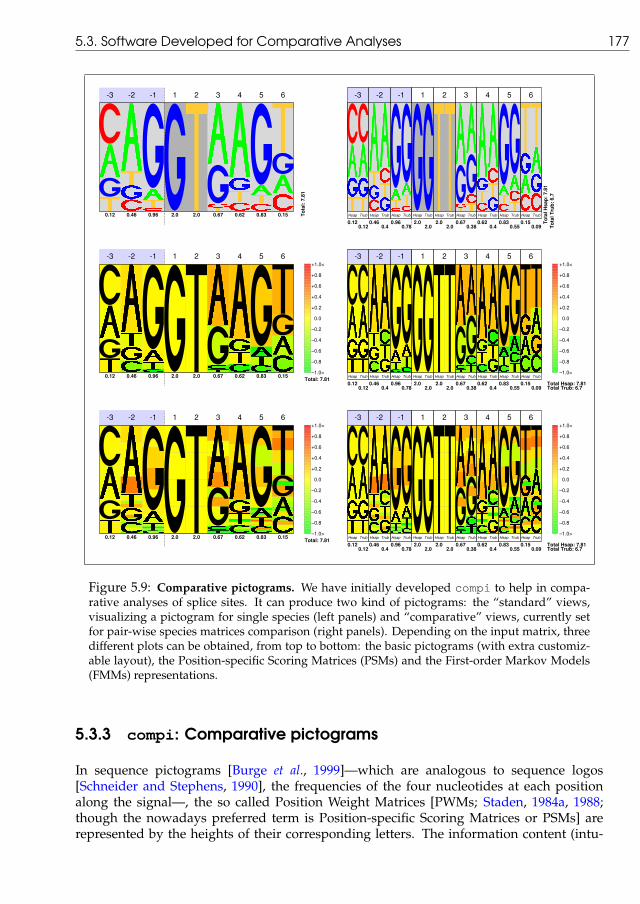
5.3. Software Developed for Comparative Analyses 177
-3
�
-2
���
-1
���
1 2 3
��
4
�
5
��
6
�0.12 0.46 0.96 2.0 2.0 0.67 0.62 0.83 0.15 To
tal:
7.81
-3
Hsap
��Trub
��
-2
Hsap
���
Trub���
-1
Hsap
���Trub
���
1
Hsap Trub
2
Hsap Trub
3
Hsap
��Trub
��
4
Hsap
���
Trub���
5
Hsap
� !Trub
"#$
6
Hsap
%&'
Trub
(�)
0.12 0.46 0.96 2.0 2.0 0.67 0.62 0.83 0.15 Tota
l Hsa
p: 7
.81
0.12 0.4 0.78 2.0 2.0 0.38 0.4 0.55 0.09 Tota
l Tru
b: 6
.7
-3
*
-2
+,*
-1
-./
1 2 3
01
4
234
5
567
6
8–1.0>
–0.8
–0.6
–0.4
–0.2
0.0
+0.2
+0.4
+0.6
+0.8
+1.0<
0.12 0.46 0.96 2.0 2.0 0.67 0.62 0.83 0.15 Total: 7.81
-3
Hsap
9:Trub
9:
-2
Hsap
;<9
Trub<9=
-1
Hsap
>?@Trub
AB@
1
Hsap Trub
2
Hsap Trub
3
Hsap
CDTrub
?E
4
Hsap
FGHTrub
<9=
5
Hsap
IJKTrub
LMN
6
Hsap
OPQ
Trub
R:S
–1.0>
–0.8
–0.6
–0.4
–0.2
0.0
+0.2
+0.4
+0.6
+0.8
+1.0<
0.12 0.46 0.96 2.0 2.0 0.67 0.62 0.83 0.15 Total Hsap: 7.810.12 0.4 0.78 2.0 2.0 0.38 0.4 0.55 0.09 Total Trub: 6.7
-3
T
-2
UVT
-1
WXY
1 2 3
Z[
4
\]^
5
_`a
6
b–1.0>
–0.8
–0.6
–0.4
–0.2
0.0
+0.2
+0.4
+0.6
+0.8
+1.0<
0.12 0.46 0.96 2.0 2.0 0.67 0.62 0.83 0.15 Total: 7.81
-3
Hsap
cdTrub
cd
-2
Hsap
efc
Trubfcg
-1
Hsap
hijTrub
klj
1
Hsap Trub
2
Hsap Trub
3
Hsap
mnTrub
io
4
Hsap
pqrTrub
fcg
5
Hsap
stuTrub
vwx
6
Hsap
yz{
Trub
|d}
–1.0>
–0.8
–0.6
–0.4
–0.2
0.0
+0.2
+0.4
+0.6
+0.8
+1.0<
0.12 0.46 0.96 2.0 2.0 0.67 0.62 0.83 0.15 Total Hsap: 7.810.12 0.4 0.78 2.0 2.0 0.38 0.4 0.55 0.09 Total Trub: 6.7
Figure 5.9: Comparative pictograms. We have initially developed compi to help in compa-rative analyses of splice sites. It can produce two kind of pictograms: the “standard” views,visualizing a pictogram for single species (left panels) and “comparative” views, currently setfor pair-wise species matrices comparison (right panels). Depending on the input matrix, threedifferent plots can be obtained, from top to bottom: the basic pictograms (with extra customiz-able layout), the Position-specific Scoring Matrices (PSMs) and the First-order Markov Models(FMMs) representations.
5.3.3 compi: Comparative pictograms
In sequence pictograms [Burge et al., 1999]—which are analogous to sequence logos[Schneider and Stephens, 1990], the frequencies of the four nucleotides at each positionalong the signal—, the so called Position Weight Matrices [PWMs; Staden, 1984a, 1988;though the nowadays preferred term is Position-specific Scoring Matrices or PSMs] arerepresented by the heights of their corresponding letters. The information content (intu-

178 Chapter 5. Visualization Tools
itively, the deviation from random composition) is computed at each position. It rangesfrom zero to two, with zero indicating random composition, and two indicating fixation ofone nucleotide. The information content of the signal is the sum of the information contentat each position. The larger the information content, the more conserved the signal (and,thus, more “informative”: the smaller is the probability of finding it by chance). The rela-tive entropy formula (also known as the Kullback-Leiber distance; Burge et al. 1999) is usedto calculate the information content of the signal, as follows:
Hsignal =N
∑j=1
∑i,j
Pi,j log2Pi,j
Qi.
Where N = length(signal), and i ∈ {A, C, G, T}. Pi,j is the probability of finding nu-cleotide i ∈ {A, C, G, T} in the jth nucleotide of the signal, and Qi is the probability ofthat nucleotide under the background distribution. By default, compi assumes the ran-dom distribution as background (so that, each Qi = 1
4 ), although other distributions can beprovided by the user.
By inspecting the pictograms for two or more species, one tries to spot the differentuse, made by each of the species, of the nucleotides along the signal. This inspection,however, can become a difficult task for the following reasons. First, the differences inthe size of each nucleotide can be difficult to observe as the two nucleotides are located indifferent pictures. Second, these differences are not quantified and thus we cannot assesswith precision when a nucleotide is used more frequently in one of the species. Third,the assumption of marginal independence among the positions of the signal—implicit inPWMs—can hide relevant differences between species with regard to the dependenciesbetween nearest neighbour positions along the splice signal.
We have tackled all three problems. First we have placed the nucleotides that occur inthe same position, in the two species being compared, next to each other. Second we havecalculated the ratio of the two relative frequencies (the odds) of each nucleotide in eachposition and represent the log2 of this ratio with a color code from green (log2
12 = −1) to
red (log2 2 = 1), where yellow is a ratio of 1 (0 in log-scale). The log-odds values of -1 and1 work as saturation values and therefore, odds smaller than 0.5 or larger than 2 take greenand red color, respectively. This color fills the rectangle defined by the nucleotide characterand allows easy spotting of which nucleotides show a different occurrence between species.Third, we have extended the pictogram idea to represent first order dependencies betweenadjacent positions of the splice site—the so called First-order Markov Model (FMM). Wehave computed and represented the ratios of occurrence of each nucleotide with respect tothe occurrence of every nucleotide in the previous positions. The representation has beenimplemented by splitting the rectangle defined by a nucleotide character in four equal rect-angles, and filling out each of them with the color that corresponds to each of the ratiosfollowing a fixed order of A,C,G, and T. We shall refer to this representation as a compa-rative pictogram (compi). When rendering FMMs, the relative entropy at each position foreach nucleotide is also weighted with respect to the occurrence of every nucleotide in theprevious positions.
We split the task of producing the comparative pictograms in two, using separate perlscripts for each part. The first one computes nucleotide frequencies, ratios and First-orderMarkov dependencies from a set of sequences of fixed length. Then the matrices obtained
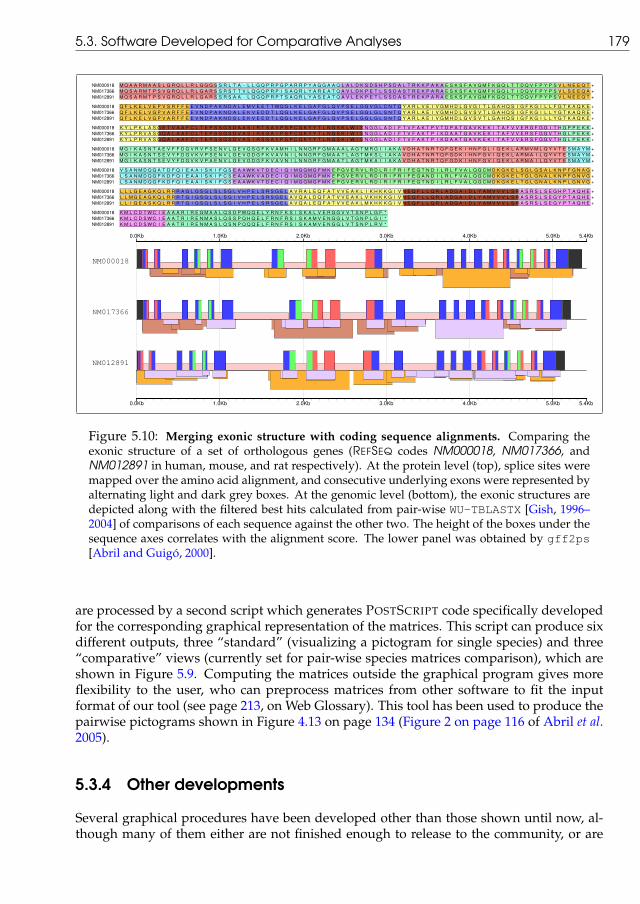
5.3. Software Developed for Comparative Analyses 179NM_000018.01-NM_017366.01-NM_012891.01
NM000018 M Q A A R M A A S L G R Q L L R L G G G S S R L T A - L L G Q P R P G P A R R P Y A G G A A Q L A L D K S D S H P S D A L T R K K P A K A E S K S F A V G M F K G Q L T T D Q V F P Y P S V L N E E Q T +NM017366 M Q S A R M T P S V G R Q L L R L G A R S S R S T T V L Q G Q P R P I S A Q R L Y A R E A T Q A V L D K P E T L S S D A S T R E K P A R A E S K S F A V G M F K G Q L T I D Q V F P Y P S V L S E E Q A +NM012891 M Q S A R M T P S V G R Q L L R L G A R S S R S A A - L Q G Q P R P T S A Q R L Y A S E A T Q A V L E K P E T L S S D A S T R E K P A R A E S K S F A V G M F K G Q L T T D Q V F P Y P S V L N E E Q T +
NM000018 Q F L K E L V E P V S R F F E E V N D P A K N D A L E M V E E T T W Q G L K E L G A F G L Q V P S E L G G V G L C N T Q Y A R L V E I V G M H D L G V G I T L G A H Q S I G F K G I L L F G T K A Q K E +NM017366 Q F L K E L V G P V A R F F E E V N D P A K N D A L E K V E D D T L Q G L K E L G A F G L Q V P S E L G G L G L S N T Q Y A R L A E I V G M H D L G V S V T L G A H Q S I G F K G I L L Y G T K A Q R E +NM012891 Q F L K E L V G P V A R F F E E V N D P A K N D S L E K V E E D T L Q G L K E L G A F G L Q V P S E L G G L G L S N T Q Y A R L A E I V G M H D L G V S V T L G A H Q S I G F K G I L L Y G T K A Q K E +
NM000018 K Y L P K L A S G E T V A A F C L T E P S S G S D A A S I R T S A V P S P C G K Y Y T L N G S K L W I S N G G L A D I F T V F A K T P V T D P A T G A V K E K I T A F V V E R G F G G I T H G P P E K K +NM017366 K Y L P R V A S G Q A L A A F C L T E P S S G S D V A S I R S S A I P S P C G K Y Y T L N G S K I W I S N G G L A D I F T V F A K T P I K D A A T G A V K E K I T A F V V E R S F G G V T H G L P E K K +NM012891 K Y L P R V A S G Q A L A A F C L T E P S S G S D V A S I R S S A V P S P C G K Y Y T L N G S K I W I S N G G L A D I F T V F A K T P I K D A A T G A V K E K I T A F V V E R S F G G V T H G L P E K K +
NM000018 M G I K A S N T A E V F F D G V R V P S E N V L G E V G S G F K V A M H I L N N G R F G M A A A L A G T M R G I I A K A V D H A T N R T Q F G E K I H N F G L I Q E K L A R M V M L Q Y V T E S M A Y M +NM017366 M G I K A S N T S E V Y F D G V K V P S E N V L G E V G D G F K V A V N I L N N G R F G M A A T L A G T M K S L I A K A V D H A T N R T Q F G D K I H N F G V I Q E K L A R M A I L Q Y V T E S M A Y M +NM012891 M G I K A S N T S E V Y F D G V K V P A E N V L G E V G D G F K V A V N I L N N G R F G M A A T L A G T M K A I I A K A V D H A T N R T Q F G D K I H N F G V I Q E K L A R M A I L Q Y V T E S M A Y M +
NM000018 V S A N M D Q G A T D F Q I E A A I S K I F G S E A A W K V T D E C I Q I M G G M G F M K E P G V E R V L R D L R I F R I F E G T N D I L R L F V A L Q G C M D K G K E L S G L G S A L K N P F G N A G +NM017366 L S A N M D Q G F K D F Q I E A A I S K I F C S E A A W K V A D E C I Q I M G G M G F M K E P G V E R V L R D I R I F R I F E G A N D I L R L F V A L Q G C M D K G K E L T G L G N A L K N P F G N V G +NM012891 L S A N M D Q G F K D F Q I E A A I S K I F G S E A A W K V T D E C I Q I M G G M G F M K E P G V E R V L R D I R I F R I F E G T N D I L R L F V A L Q G C M D K G K E L T G L G N A L K N P L G N V G +
NM000018 L L L G E A G K Q L R R R A G L G S G L S L S G L V H P E L S R S G E L A V R A L E Q F A T V V E A K L I K H K K G I V N E Q F L L Q R L A D G A I D L Y A M V V V L S R A S R S L S E G H P T A Q H E +NM017366 L L M G E A G K Q L R R R T G I G S G L S L S G I V H P E L S R S G E L A V Q A L D Q F A T V V E A K L V K H K K G I V N E Q F L L Q R L A D G A I D L Y A M V V V L S R A S R S L S E G Y P T A Q H E +NM012891 L L I G E A S K Q L R R R T G I G S G L S L S G I V H P E L S R S G E L A V Q A L E Q F A T V V E A K L M K H K K G I V N E Q F L L Q R L A D G A I D L Y A M V V V L S R A S R S L S E G Y P T A Q H E +
NM000018 K M L C D T W C I E A A A R I R E G M A A L Q S D P W Q Q E L Y R N F K S I S K A L V E R G G V V T S N P L G F *NM017366 K M L C D S W C I E A A T R I R E N M A S L Q S S P Q H Q E L F R N F R S I S K A M V E N G G L V T G N P L G I *NM012891 K M L C D S W C I E A A T R I R E N M A S L Q S N P Q Q Q E L F R N F R S I S K A M V E N G G L V T S N P L R V *
0.0Kb 1.0Kb 2.0Kb 3.0Kb 4.0Kb 5.0Kb 5.4Kb
0.0Kb 1.0Kb 2.0Kb 3.0Kb 4.0Kb 5.0Kb 5.4Kb
NM000018
NM017366
NM012891
Figure 5.10: Merging exonic structure with coding sequence alignments. Comparing theexonic structure of a set of orthologous genes (REFSEQ codes NM000018, NM017366, andNM012891 in human, mouse, and rat respectively). At the protein level (top), splice sites weremapped over the amino acid alignment, and consecutive underlying exons were represented byalternating light and dark grey boxes. At the genomic level (bottom), the exonic structures aredepicted along with the filtered best hits calculated from pair-wise WU-TBLASTX[Gish, 1996–2004] of comparisons of each sequence against the other two. The height of the boxes under thesequence axes correlates with the alignment score. The lower panel was obtained by gff2ps[Abril and Guigó, 2000].
are processed by a second script which generates POSTSCRIPT code specifically developedfor the corresponding graphical representation of the matrices. This script can produce sixdifferent outputs, three “standard” (visualizing a pictogram for single species) and three“comparative” views (currently set for pair-wise species matrices comparison), which areshown in Figure 5.9. Computing the matrices outside the graphical program gives moreflexibility to the user, who can preprocess matrices from other software to fit the inputformat of our tool (see page 213, on Web Glossary). This tool has been used to produce thepairwise pictograms shown in Figure 4.13 on page 134 (Figure 2 on page 116 of Abril et al.2005).
5.3.4 Other developments
Several graphical procedures have been developed other than those shown until now, al-though many of them either are not finished enough to release to the community, or are

180 Chapter 5. Visualization Tools
quite specific for a given analysis to be really useful in another context. We are going topoint out few of them in this section.
The need to combine the exonic structures along with sequence alignments at nu-cleotide or amino acid level, led to the development of the boxed alignments script forwhich an example is shown in Figure 5.10 upper panel. A more elaborated program devel-oped in our group, named exstral (EXon STRucture over an ALignment, Castelo et al.2004), produces a more quantitative output. However, its current text-based output lacksthe integration achieved with the boxed alignments—for instance, to highlight subtle frameshifts in the exonic structure. The boxed alignments script generates a POSTSCRIPT plot. Itwill be interesting in the future to implement such kind of output into exstral.
As much important as writing procedures to analyze genomic data sets, is to choose anappropriate way to visualize the final results. The customization flexibility characteristicof gff2ps makes this tool useful to draw annotation features from different kind of anal-yses. Given a properly formatted input set of GFF records and taking the time to define anassociated customization file or files, a researcher can obtain simple or complex represen-tations of his annotations. It is then easy to apply those settings to a set of annotations fordifferent sequences. Lower panel from Figure 5.10 shows an example of using gff2ps ina comparative genomics approach.

Chapter 6
Discussion
So easy it seamed once found, which yet unfoundmost would have thought impossible
—John Milton
A central goal of genome analysis is the identification of all human genes. This taskremains challenging, but is greatly aided by the near-complete sequence of the human ge-nome [International Human Genome Sequencing Consortium, IHGSC, 2004], together withother improved resources (such as expanded cDNA collections, genome sequence fromother organisms and better computational methods). The inventory of the best-definedfunctional components in the human genome—the protein coding sequences—is still in-complete for a number of reasons, including the fragmented nature of eukaryotic genes.The human gene number estimates, though, are coming closer to the real number of genes,as can be seen in Figure 6.1. To this end, there are several ongoing projects focusing on thedefinition of the precise catalog of human genes. One of those projects is the VertebrateGenome Annotation (VEGA) database, a central repository for high quality, frequently up-dated, manual annotations of vertebrate finished genome sequences [Ashurst et al., 2005].The comparative sequencing program at the NIH Intramural Sequencing Center (NISC)aims to sequence and to analyze targeted genomic regions in multiple vertebrates [Thomaset al., 2003]. The initial target of this project was a genomic segment of about 1.8Mb onhuman chromosome 7q31.3 containing the gene encoding the cystic fibrosis transmem-brane conductance regulator (CFTR) and nine other genes. Sequence clones for the orthol-ogous genomic segments in multiple other vertebrates were obtained in order to performan exhaustive comparative analysis of that region. The American National Human Ge-nome Research Institute (NHGRI) launched a public research consortium, the ENCyclope-dia Of DNA Elements (ENCODE) project [ENCODE Project Consortium, 2004], in Septem-ber 2003, to carry out a project to identify all functional elements in the human genomesequence. The project is currently in its pilot phase, the evaluation of the procedures thatcan be applied cost-effectively and at high-throughput to accurately and comprehensivelycharacterize large sequences. A set of 44 discrete regions—ranging in size from 0.5 to 2Mb,that together constitute ∼1% of the human genome (30Mb)—was chosen to represent arange of genomic features.
The unexpectedly low number of genes identified in the human genome raises again the
181
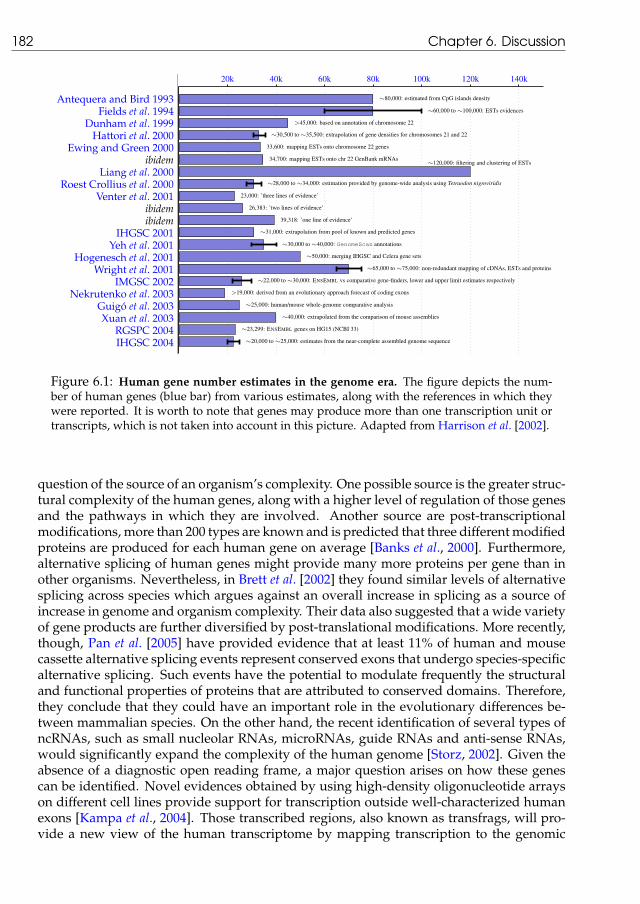
182 Chapter 6. Discussion
Antequera and Bird 1993Fields et al. 1994
Dunham et al. 1999Hattori et al. 2000
Ewing and Green 2000ibidem
Liang et al. 2000Roest Crollius et al. 2000
Venter et al. 2001ibidemibidem
IHGSC 2001Yeh et al. 2001
Hogenesch et al. 2001Wright et al. 2001
IMGSC 2002Nekrutenko et al. 2003
Guigó et al. 2003Xuan et al. 2003
RGSPC 2004IHGSC 2004
20k 40k 60k 80k 100k 120k 140k
∼80,000: estimated from CpG islands density
∼60,000 to∼100,000: ESTs evidences
>45,000: based on annotation of chromosome 22
∼30,500 to∼35,500: extrapolation of gene densities for chromosomes 21 and 22
33,600: mapping ESTs onto chromosome 22 genes
34,700: mapping ESTs onto chr 22 GenBank mRNAs∼120,000: filtering and clustering of ESTs
∼28,000 to∼34,000: estimation provided by genome-wide analysis using Tetraodon nigroviridis
23,000: ’three lines of evidence’
26,383: ’two lines of evidence’
39,318: ’one line of evidence’
∼31,000: extrapolation from pool of known and predicted genes
∼30,000 to∼40,000: GenomeScan annotations
∼50,000: merging IHGSC and Celera gene sets
∼65,000 to∼75,000: non-redundant mapping of cDNAs, ESTs and proteins
∼22,000 to∼30,000: ENSEMBL vs comparative gene-finders, lower and upper limit estimates respectively
>19,000: derived from an evolutionary approach forecast of coding exons
∼25,000: human/mouse whole-genome comparative analysis
∼40,000: extrapolated from the comparison of mouse assemblies
∼23,299: ENSEMBL genes on HG15 (NCBI 33)
∼20,000 to∼25,000: estimates from the near-complete assembled genome sequence
Figure 6.1: Human gene number estimates in the genome era. The figure depicts the num-ber of human genes (blue bar) from various estimates, along with the references in which theywere reported. It is worth to note that genes may produce more than one transcription unit ortranscripts, which is not taken into account in this picture. Adapted from Harrison et al. [2002].
question of the source of an organism’s complexity. One possible source is the greater struc-tural complexity of the human genes, along with a higher level of regulation of those genesand the pathways in which they are involved. Another source are post-transcriptionalmodifications, more than 200 types are known and is predicted that three different modifiedproteins are produced for each human gene on average [Banks et al., 2000]. Furthermore,alternative splicing of human genes might provide many more proteins per gene than inother organisms. Nevertheless, in Brett et al. [2002] they found similar levels of alternativesplicing across species which argues against an overall increase in splicing as a source ofincrease in genome and organism complexity. Their data also suggested that a wide varietyof gene products are further diversified by post-translational modifications. More recently,though, Pan et al. [2005] have provided evidence that at least 11% of human and mousecassette alternative splicing events represent conserved exons that undergo species-specificalternative splicing. Such events have the potential to modulate frequently the structuraland functional properties of proteins that are attributed to conserved domains. Therefore,they conclude that they could have an important role in the evolutionary differences be-tween mammalian species. On the other hand, the recent identification of several types ofncRNAs, such as small nucleolar RNAs, microRNAs, guide RNAs and anti-sense RNAs,would significantly expand the complexity of the human genome [Storz, 2002]. Given theabsence of a diagnostic open reading frame, a major question arises on how these genescan be identified. Novel evidences obtained by using high-density oligonucleotide arrayson different cell lines provide support for transcription outside well-characterized humanexons [Kampa et al., 2004]. Those transcribed regions, also known as transfrags, will pro-vide a new view of the human transcriptome by mapping transcription to the genomic

183
sequences.
One of the major obstacles towards the completion of the catalog of human genes isour inability to assess the reliability of the large number of computational gene predic-tions that have yet to be verified experimentally. Results described in Parra et al. [2003]demonstrate that through the comparison of related genomes, human and mouse in thatexample, and using the available comparative gene-finding tools, the false-positive ratecan be reduced significantly, resulting in an improved catalog of vertebrate genes. Indeed,the experimental verification of a subset of those predictions provided evidence for at least1000 previously non-confirmed genes [Guigó et al., 2003]. The availability of another ver-tebrate species whose evolutionary position lies between mammals and fish would be ofgreat utility to complete the vertebrates gene catalog. The success of these studies, suggestsa new paradigm in high throughput genome annotation, in which gene predictions serveas the hypothesis that drives experimental determination of intron-exon structures. There-fore, it is clear that with the accumulation of genomic data from other species and a betterunderstanding of the mechanisms and the signals involved in the transfer of informationfrom sequence to function, more accurate computational models will be available. Thosemodels have to face not only the complexity inherent to the biological processes and theirregulatory pathways, but also the complexity of the inter- and intra-specific variability dueto evolutionary events that led to the actual genomes of individuals and populations.
Existing gene finding programs, although significantly advanced over those that wereavailable a few years ago, still have several important limitations. Almost without excep-tion, computational gene finders predict only the coding fraction of a single spliced form ofnon-overlapping, canonical protein-coding genes. Annotation pipelines are currently ableto extend those annotations by incorporating other biological features of clear interest forthe research community, including non-coding mRNAs, pseudogenes, regulatory elementsand transcription start sites, anti-sense transcripts, but also other genome-scale data collec-tions such as gene expression profiles, protein interaction and genetic variation. However,a better understanding of the molecular mechanisms involved in gene expression and theintegration of this knowledge into the theoretical models underlying the gene predictionsoftware, may lead to systems that will be accurate enough to render both experimentalverification and manual curation largely unnecessary [Brent and Guigó, 2004]. As moreanimal genomes are sequenced, deeper sequence alignments will contribute further to thedefinition of signals such as regulatory elements. The application of comparative genomicsto study gene regulation has focused largely on the identification of shared regulatory se-quences to explain similar patterns of gene expression between species. By contrast, thedifferences in gene regulation between organisms, and the role of these differences in spe-ciation, have only just begun to be examined [Pennacchio and Rubin, 2001].
As more evidence of the conservation of exonic structures between orthologous genesand the sequence features that define such exons are accumulated [Waterston et al., 2002;Gibbs et al., 2004; Hillier et al., 2004; Abril et al., 2005], the analysis of the extent of thatconservation becomes relevant to the prediction of alternative splicing events. Further ev-idence suggests that a large fraction of alternative splicing events is conserved betweenrelated species, such as human and mouse [Thanaraj et al., 2003]. The analysis of the con-served sequence features involved in splice site definition, as well as in the regulation ofsplicing, will shed light on the code that determines the final pool of eukaryotic genesproducts. Alternative splicing remains, however, as a poorly solved problem. On the otherhand, a comparison of the structural and mechanistic features of the major-class and minor-

184 Chapter 6. Discussion
class, U2- and U12-types respectively, spliceosomes has provided many valuable insightsinto the essential catalytic elements of the splicing reaction. The rate-limiting excision ofU12-type introns and their use in alternative expression of proteins in vivo indicates thatthey might be potential targets of gene regulation. Assessing gene expression patterns intransgenic organisms with U12 to U2 intron mutations should provide vital evidence andhelp to rationalize the continued presence of these rare introns in metazoan genomes [Pa-tel and Steitz, 2003]. The existence of a second spliceosome raises the possibility that athird or fourth might be awaiting discovery. The degeneracy of the consensus sequencesdefining those signals would make yet another class of introns difficult to detect. Indeed,the GT-AG U12-type introns might well have been ignored for the initial focus on AT-ACintrons.
Another promising research area involves the analysis of the polymorphisms that fallwithin the sequences defining splice sites or in the splicing regulatory sequences. Muta-tions in exonic or intronic regulatory elements that cause severe splicing defects might justbe the tip of the iceberg. There might be also many genomic variants, including small in-dels and single nucleotide polymorphisms (SNPs), that cause partial splicing defects thatare only pathogenic in specific tissues under the influence of a set of specific regulatorysplicing factors. Similar to splicing, all those processes are rarely considered when assess-ing the clinical significance of genomic variants [Pagani and Baralle, 2004]. In this regard,we have gathered a database, to be explored in future analyses, which integrates gene struc-tures for reference human genes [REFSEQ; Pruitt et al. 2005], the conservation scores fromphylo-HMM based multiple alignments (for human, chimpanzee, mouse, rat, and chicken,and downloaded from the UCSC GENOME BROWSER; Karolchik et al. 2003) and a largecollection of human SNPs from NCBI DBSNP [Sherry et al., 2001].
Visualization tools will continue to play a key role in the integration of the genomicannotation data sets, in order to extract biological meaning from that flood of information.Due to the intrinsic dynamic nature of the annotation data sets, database browsers havebecome standard tools at the laboratory to retrieve the latest updates on genomic annota-tions and to navigate through the many different databases available. All public genomebrowsers have their particular strengths: the UCSC GENOME BROWSER exemplifies speed;NCBI MAP VIEWER is integrated into a larger site and is linked to the impressive rangeof databases that NCBI curates; GBrowse is a sophisticated toolkit designed to simplifybuilding data browsers to display custom data; ENSEMBL provides flexibility and a broadrange of data displays [Stalker et al., 2004]. Notwithstanding, command-line flexible vi-sualization tools still have their niche, as it is the case for gff2ps, gff2aplot, compiand similar tools. Although raster graphics are more popular and are currently best sup-ported by web browsers, we still advocate the use of vector graphics to visualize genomicannotations. Vector graphics have one feature that makes them invaluable for many appli-cations: they can be scaled without loss of image quality. For a long time, POSTSCRIPT hasbeen the de facto standard of the graphics industry, and it has been well supported on *nixsystems which provided not only interpreters, such as ghostscript, but also graphicalinterfaces for those interpreters, such as ghostview. With the advent of XMLtechnolo-gies, an emerging new graphics standard, the Scalable Vector Graphics format (SVG) willbecome the successor of POSTSCRIPT, at least for distributing vector graphics on the In-ternet. However, POSTSCRIPT is by itself a programming language. When self-containeddocuments are created, the data and the code to visualize such data share a single file, ashappens for instance with gff2ps output.

185
In conclusion, finding all functional elements of genome sequences and using this in-formation to improve the health of individuals and society, are the focus of the next phaseof the Human Genome Project [Collins et al., 2003]. Comparative analyses from multiplespecies at varying evolutionary distances are a powerful approach for identifying codingand functional non-coding sequences, as well as sequences that are unique for a given or-ganism. Those techniques will continue to play a major role in the accurate annotationprocedures required to understand the puzzling patchworks that are our genomes.


Chapter 7
Conclusions
Errors, like straws, upon surface flow;he who would search for pearls must dive below...
—John Dryden, “All for love”
In short, the research presented here has contributed to:
1. The development of a semi-automatic computational pipeline to perform whole ge-nome analyses when comparing the human and mouse genomes. The main resultsare described hereunder:
(a) The analyses included the production of gene predictions by geneid, an “abinitio” gene-finding software, and SGP2, initially a wrapper forTBLASTXandgeneid to perform pair-wise comparative gene-finding.
(b) Moreover, the evaluation of the predictions using a reference set of annotationsand the visualization of the results, were among the steps of this pipeline.
(c) The results from this pipeline, together with those provided by the people fromthe Twinscan project, were filtered by Genís Parra. Using an enrichment pro-tocol based on the conservation of exonic structure between orthologous pre-dictions between human and mouse, he supplied gene candidates for RT-PCRamplification to validate such predictions.
(d) Several programs from this analysis pipeline have been adapted by FranciscoCâmara. Currently, they are routinely used to predict genes on each new as-sembly version of several eukaryotic genomes. These species include human,mouse, rat, chicken, fruitfly, and the list keeps growing.
2. Describing the signals delimiting the boundaries between exons and introns. Takingadvantage of the conservation of the exonic structures of orthologous genes in ver-tebrates, we have been able to tackle the comparative analysis of splice sites fromorthologous introns. This research yielded the following results:
(a) Human introns are on average larger than their respective orthologs in rodents.This can be explained by an increase in the repetitive sequences within those
187

188 Chapter 7. Conclusions
introns in the human lineage or by a loss of such repeats in the rodents lineage.The analysis of the distribution of ancient repeats, predating the split betweenhuman and rodents, supports the latter.
(b) We provide insights into the dynamics of the evolution of splice site sequenceswithin four vertebrate genomes: human, mouse, rat and chicken. Our resultsconfirm that the splicing code is under evolution, albeit very slow, remaininglargely homogeneous within tetrapoda and showing noticeable differences onlyat larger phylogenetic distances.
(c) The greater conservation observed in mammalian/chicken orthologous splicesites compared to unrelated sites indicates that nucleotide substitution since themammalian/avian split has not yet reached saturation at these sites. Saturationhas been reached at intronic sites, which show a conservation level similar tothat of unrelated sequences.
(d) The characteristic conservation of orthologous splice sites suggests that compa-rative prediction of splicing could improve methods based on the analysis of asingle genome. Comparative prediction of splice sites could be particularly rel-evant to the prediction of alternative splicing features, a problem far from beingsolved.
(e) Our results seem to indicate that U2 and U12 introns have evolved indepen-dently after the split of mammals and birds, since we have not been able todocument a single convincing case of conversion between these two types ofintrons.
(f) Furthermore, comparison of orthologous introns has also allowed us to definebetter the sequences involved in the specification of U12 introns. These se-quences, while more conserved than signals involved in U2 intron specification,are more degenerate than previously thought.
3. The implementation of visualization tools for annotations obtained by gene-findingtools on genomic sequences, such as gff2ps, and to summarize the outcomes ofcomparative analyses, such as gff2aplot and compi. The main results are listedbelow:
(a) gff2ps was devised to provide scalability and a flexible customization of theannotation feature attributes.
(b) We have applied gff2ps to the “cartography” of sequence features for wholegenomes of human, the fruitfly and the malaria mosquito. In those cases we hadto implement specific software to integrate the large annotation data sets fromthese genomes and to provide specific customization parameters.
(c) gff2aplot produces pair-wise alignment plots along with the annotation fea-tures of the sequences.
(d) compi extends pictograms to compare the nucleotide frequencies of sequencepatterns side-by-side. We used this tool in our orthologous splice sites signalcomparison.
(e) Several of the tools we have developed, including gff2ps and gff2aplot,have been made publicly available at our web site. They have been used withsuccess by other groups to visualize the results of their own research.

APPENDICES
There and back again...—Bilbo Baggins, “The Hobbit”


Curriculum Vitae
Josep F. Abril graduated on 1998 in Biology (Bachelor’s degree) by Universitat deBarcelona (UB). He spent his last years as undergraduate collaborating with the laboratoryof genome analysis at the Grup de Recerca en Informàtica Biomèdica (GRIB), under Dr.Roderic Guigó supervision. He obtained the Research competence and Advanced StudiesDiploma (“Diploma d’Estudis Avançats”, DEA) on 2002 by Department of ExperimentalSciences and Health of Universitat Pompeu Fabra (UPF). From late 1998 till early 2005 hestayed as a PhD student, under supervision of Dr. Roderic Guigó within the GRIB.
Since 2000, he has been in charge of the Genome Bioinformatics Lab web site1. Amongdifferent software developments, it is worth to mention his contributions to visualizationof genomic annotations, gff2ps and gff2aplot. gff2ps was used to visualize differentwhole genome maps, including those for human, the fruitfly and the malaria mosquito.
He has been teaching assistant for the practicals of the Bioinformatics course taught bythe the Genome Bioinformatics Laboratory at Universitat Pompeu Fabra, between 2001and 2005. Additionally, he has taught an introductory perl course for the MSc on Bioin-formatics for Health Sciences, co-directed by Universitat Pompeu Fabra and Universitatde Barcelona, in 2004. He participated in the organization and presentation of the Bioinfor-matics stand for the “Fira Viu la Ciència Contemporània” (FVCC’03, a popular science fair)organized by the Societat Catalana de Biologia, in Barcelona in May 2003. He was alsoone of the organizers and lecturers of the workshops on “Computational Analysis of DNASequences” by La Caixa, held in Barcelona in November 2003 and 2004, and in Madridin June 2004. He was invited speaker on the 4th meeting of the Sociedad Española deGenética held in El Escorial on October 2003.
He is currently involved in the management of paper contributions to the 4th EuropeanConference on Computational Biology (ECCB’052), to be held in Madrid, Spain (Septem-ber 28–October 1, 2005). He is also participating in the organization of the ENCODE Ge-nome Annotation Assessment Project (EGASP’053) workshop, to be held at the WellcomeTrust Sanger Institute (May 6–7, 2005).
His main research interest focuses on the computational analysis of the exonic structureof eukaryotic genes, its definition, evolution and association with genetic disorders. Gene-finding and the visualization of genomic annotations are also within those interests.
1GBL @ GRIB[IMIM-UPF-CRG] at: http://genome.imim.es/2ECCB’05 at: http://www.eccb05.org/3EGASP’05 at: http://genome.imim.es/gencode/workshop2005.html
191


List of Publications
Articles
J.F. Abril, R. Castelo and R. Guigó.“Comparison of splice sites in mammals and chicken.”Genome Research, 15(1):111–119, 2005.
International Chicken Genome Sequencing Consortium (including J.F. Abril).“Sequence and comparative analysis of the chicken genome provide unique per-spectives on vertebrate evolution.”Nature, 432(7018):695–716, 2004.
Rat Genome Sequencing Project Consortium (including J.F. Abril).“Genome sequence of the brown Norway rat yields insights into mammalian evo-lution.”Nature, 428(6982):493–521, 2004.
J.F. Abril, R. Guigó and T. Wiehe.“gff2aplot: Plotting sequence comparisons.”Bioinformatics, 19(18):2477–2479, 2003.
R. Guigó, E.T. Dermitzakis, P. Agarwal, C.P. Ponting, G. Parra, A. Reymond, J.F.Abril, E. Keibler, R. Lyle, C. Ucla, S.E. Antonarakis and M.R. Brent.“Comparison of mouse and human genomes followed by experimental verifica-tion yields an estimated 1,019 additional genes.”Proc. Nat. Acad. Sci., 100(3):1140–1145, 2003.
G. Parra, P. Agarwal, J.F. Abril, T. Wiehe, J.W. Fickett and R. Guigó.“Comparative gene prediction in human and mouse.”Genome Research, 13(1):108–117, 2003.
193

194 APPENDIX B. LIST OF PUBLICATIONS
Mouse Genome Sequencing Consortium (including J.F. Abril).“Initial sequencing and comparative analysis of the mouse genome.”Nature, 420(6915):520–562, 2002
R.A. Holt et al (including J.F. Abril).“The Genome Sequence of the Malaria Mosquito Anopheles gambiae.”Science, 298(5591):129–149, 2002.
G. Glökner, L. Eichinger, K. Szafranski, J.A. Pachebat, A.T. Bankier, P.H. Dear, R.Lehmann, C. Baumgart, G. Parra, J.F. Abril, R. Guigó, K. Kumpf, B. Tunggal, theDictyostelium Genome Sequencing Consortium, E. Cox, M.A. Quail, M. Platzer,A. Rosenthal and A.A. Noegel.“Sequence and Analysis of Chromosome 2 of Dictyostelium discoideum.”Nature, 418(6893):79–85, 2002.
J.C. Venter et al (including J.F. Abril).“The Sequence of the Human Genome.”Science, 291(5507):1304–1351, 2001.
T. Thomson, J.J. Lozano, R. Carrió, F. Serras, N. Loukili, M. Valeri, B. Cormand,M.P. del Río, J.F. Abril, M. Burset, E. Sancho, J. Merino, A. Macaya, M. Corominasand R. Guigó.“Fusion of the human gene for the polyubiquitination co-effector uev-1 with kua,a newly identified gene.”Genome Research, 10(11):1743–1756, 2000.
J.F. Abril and R. Guigó.“gff2ps: visualizing genomic annotations.”Bioinformatics, 16(8):743–744, 2000.
R. Guigó, P. Agarwal, J.F. Abril, M. Burset and J.W. Fickett.“An Assessment of Gene Prediction Accuracy in Large DNA Sequences.”Genome Research, 10(10):1631–1642, 2000.
M.G. Reese, G. Hartzell, N.L. Harris, U. Ohler, J.F. Abril and S.E. Lewis.“Genome Annotation Assesment in Drosophila melanogaster.”Genome Research, 10(4):483–501, 2000.
APPENDIX B. LIST OF PUBLICATIONS 195
M.D. Adams et al (including J.F. Abril).“The Genome Sequence of Drosophila melanogaster.”Science, 287(5461):2185–2195, 2000.
Book Chapters
J.F. Abril, S. Castellano and R. Guigó.“Comparative gene prediction.”In M.D. Adams editor:
Comparative Genomics: A Guide to the Analysis of Eukaryotic Genomes.Humana Press, 2004 (in press).
R. Guigó, M. Burset, P. Agarwal, J.F. Abril, R.F. Smith and J.W. Fickett.“Sequence Similarity Based Gene Prediction.”In S. Suhai editor:
Genomics and Proteomics: Functional and Computational Aspects.Plenum Publishing Corporation, 2000. ISBN: 0–306–46312–1.
Posters
J. Lagarde, J.F. Abril, F. Denoeud, R. Guigó and the GENCODE Consortium.“ENr334: Computational Gene Predictions, VEGA Annotations and GENCODE Experi-mental Validations.”CSHL - Genomics Workshop "Identification of Functional Elements in MammalianGenomes", New York, USA (2004)
J.F. Abril, M. Albà, E. Blanco, M. Burset, F. Câmara, S. Castellano, R. Castelo, O. Gonzalez,G. Parra and R. Guigó.“Understanding the Eukaryotic Genome Sequence.”Inaugural Symposium of the Center for Genomic Regulation, Barcelona, Spain (2002)
E. Blanco, G. Parra, S. Castellano, J.F. Abril, M. Burset, X. Fustero, X. Messeguer and R.Guigó.“Gene Prediction in the Post-Genomic Era.”IXth ISMB, Copenhagen, Denmark (2001)
G. Glöckner, L. Eichinger, K. Szafranski, P. Dear, J. Pachebat, K. Kumpf, R. Lehmann, J.F.Abril, G. Parra, R. Guigó, B. Tunggal, E. Cox, M.A. Quail, M. Platzer, A. Rosenthal, A.A.Noegel and the Dictyostelium Genome Sequencing Consortium.“Sequence and Analysis of Chromosome 2 from the Model Organism Dictyostelium dis-coideum.”CSHL - Genome Sequencing & Biology, New York, USA (2001)
196 APPENDIX B. LIST OF PUBLICATIONS
J.F. Abril, E. Blanco, M. Burset, S. Castellano, X. Fustero, G. Parra and R. Guigó.“Genome Informatics Research Laboratory: Main Research Topics.”Ist Jornadas de Bioinformática, Cartagena, Spain (2000)
T. Wiehe, J.F. Abril, M. Burset, S. Gebauer-Jung and R. Guigó.“Comparative Genomics: At the Crossroads of Evolutionary Biology and Genome Se-quence Analysis.”VIIth ESEB, Barcelona, Spain (1999)
T. Wiehe, J.F. Abril, M. Burset, S. Gebauer-Jung and R. Guigó.“Gene Prediction and Validation Based on Homologous Genomic Sequences.”VIIth ISMB, Heidelberg, Germany (1999)
J.F. Abril, T. Wiehe, M. Burset and R. Guigó.“Tools to Visualize Genome Annotations.”IIIrd RECOMB, Lyon, France (1999)
M. Burset, J.F. Abril and R. Guigó.“GeneID-3, from DNA Sequence to Protein Function.”Vth ISMB, Halkidiki, Greece (1997)

Contact Information
Find below, in alphabetical order, the contact information of some of the authors of theresearch presented here:
Josep F. Abril Ferrando — PhD ResearcherGenome Bioinformatics Research LabResearch Group in Biomedical InformaticsInstitut Municipal d’Investigació MèdicaDr. Aiguader, 80, 08003 Barcelona (Spain)Phone: +34 93 224 0890 ‖ Fax: +34 93 224 0875E-mail: jabril at imim.esWeb: http://genome.imim.es/~jabril/
Mark D. Adams — Associate ProfessorDepartment of GeneticsCase Western Reserve University10900 Euclid Avenue, Cleveland, OH 44106 (USA)Phone: +01 216 368 2791E-mail: mda13 at cwru.eduWeb: http://genomics.case.edu/people_adams.html
Pankaj Agarwal — InvestigatorDepartment of BioinformaticsGlaxoSmithKline Pharmaceuticals R&D709 Swedeland Road, UW2230, King of Prussia, PA 19406-0939 (USA)E-mail: pankaj.agarwal at gsk.com
Ewan Birney — Research Group LeaderEMBL Outstation - HinxtonEuropean Bioinformatics InstituteWellcome Trust Genome CampusHinxton, Cambridge, CB10 1SD (United Kingdom)Phone: +44 (0)1223 494 420 ‖ Fax: +44 (0)1223 494 468E-mail: birney at ebi.ac.ukWeb: http://www.ebi.ac.uk/~birney/
Robert Castelo Valdueza — Senior ResearcherGenome Bioinformatics Research Lab
197
198 APPENDIX C. CONTACT INFORMATION
Research Group in Biomedical InformaticsInstitut Municipal d’Investigació MèdicaDr. Aiguader, 80, 08003 Barcelona (Spain)Phone: +34 93 224 0884 ‖ Fax: +34 93 224 0875E-mail: rcastelo at imim.esWeb: http://genome.imim.es/~rcastelo/
Roderic Guigó i Serra — Research Group LeaderGenome Bioinformatics Research LabResearch Group in Biomedical InformaticsInstitut Municipal d’Investigació MèdicaDr. Aiguader, 80, 08003 Barcelona (Spain)Phone: +34 93 224 0877 ‖ Fax: +34 93 224 0875E-mail: rguigo at imim.esWeb: http://genome.imim.es/~rguigo/
Robert Holt — Research HeadSequencing GroupGenome Sciences CentreBC Cancer Research CentreSuite 100, 570 West 7th Ave, Vancouver, BC, V5Z 4S6 (Canada)Phone: +01 604 877 6276Email: rholt at bcgsc.caWeb: http://www.bcgsc.ca/about/faculty/person?pid=rholt
Genís Parra Farré — PhD ResearcherGenome Bioinformatics Research LabResearch Group in Biomedical InformaticsInstitut Municipal d’Investigació MèdicaDr. Aiguader, 80, 08003 Barcelona (Spain)Phone: +34 93 224 0884 ‖ Fax: +34 93 224 0875E-mail: gparra at imim.esWeb: http://genome.imim.es/~gparra/
Martin G. Reese — InvestigatorOmicia Inc.5980 Horton Street, Suite 235, Emeryville, CA 94608 (USA)Phone: +01 510 595 0800 ‖ Fax: +01 510 588 4523E-mail: mreese at omicia.com
Thomas Wiehe — Research Group LeaderInstitut fuer Molekularbiologie und BiochemieFreie Universität BerlinBerlin Center for Genome Based BioinformaticsArnimallee 22, 14195 Berlin (Germany)Phone: +49 30 8445 1504 ‖ Fax: +49 30 8445 1504E-mail: twiehe at zedat.fu-berlin.deWeb: http://www.bcbio.de/jrg_wiehe/

Miscellanea
This thesis layout is largely derived from the LATEX template created by Robert Castelo in20021. His templates were extended by Sergi Castellano and Genís Parra for their theses(see the corresponding references in page 254). The templates on which this documentwas built were derived from them. Here, some comments on it and the source code fordownload are provided.
Technical comments
This book was typeset with GNU emacs 21.3.1 in LATEX mode and converted to PDF withpdflatex 3.14159-1.10b (Web2C 7.4.5). All running on a linux box with Red Hat FedoraCore 2 and kernel 2.6.9-1.6. LATEX is a document preparation system, powerful, robust andable to achieve professional results [Lamport, 1994]. However, the learning curve may bestiff. Therefore, a link to an initial template is given at the end of this chapter for yourconvenience.
The main document, thesis.tex, depends on several L ATEX files—including eachchapter, the tables and few POSTSCRIPT figures—, but it also depends on other files—suchas style files, hacked LATEX packages, several bitmaps and the PDF files for the attachedpapers—. Furthermore, pdflatex had to be run several times, together with BIBTEX (toproduce the bibliography chapter), makeindex (to build the index, the glossaries and theacronyms list), thumbpdf (to generate the main PDF document thumbnails), and few perlscripts. A Makefile was written to automatize the compilation process of the whole doc-ument. In fact, the Makefile was extended to produce four versions of the main docu-ment. The “draft” version does not include figures and the PDF files for the papers, andit displays crop marks and boxes around several elements (such as the area reserved forthe pictures). The “proofs”, where everything is included but crop marks and boxes arekept, and different hyperlink types use different colors. The “pdf” version is the electronicversion in which all the hyperlinks are marked in blue color, crop marks are disabled. Fi-nally, the “press” version is very similar to the “pdf” one, currently the only differenceis that all the hyperlinks are black (to save some money when printing the hardcopy, ofcourse). The Makefile also includes a rule to build the final book “cover”, which recycles
1R. Castelo, April 2002.”The Discrete Acyclic Digraph Markov Model in Data Mining”Faculteit Wiskunde en Informatica, Universiteit Utrecht
199

200 APPENDIX D. MISCELLANEA
the abstract.tex file and takes some customization from the same style file as the mainthesis.tex file.
The compilation of a complete version of this document takes about 600seconds—ofcourse, the “draft” version takes much less—with an AMD Athlon 64 processor 3200+,with 512KB of RAM. This is mainly due to the several steps required to ensure that ev-ery reference, index and so on, is in place. The basic build series of commands is thefollowing: an initial pdflatex, a B IBTEX run to produce the bibliography, a second runof pdflatex to include it, three calls to makeindex (one for the Acronyms Glossary, an-other for the Web Glossary and the last for the standard Glossary of terms), a third runof pdflatex to include the glossaries, another call to makeindex (to generate the finalindex) and to pdflatex, then makeindex and pdflatex are run again, an extra run ofpdflatex is followed by thumbpdf, and a final pdflatex to obtain the finished docu-ment. If any problem was found, like missing references, an extra round of pdflatex,BIBTEX and pdflatex is performed by the Makefile.
Here you can find the version of some of the programs refereed above: BIBTEX version0.99c (Web2C 7.4.5), thumbpdf version 3.2 (2002/05/26), and makeindex version 2.14(2002/10/02).
LATEX Packages
As there are four versions of the document, the ifthen package was used to define versionspecific parameters, as well as to include different files. The package geometry facilitatesthe definition of the page layout. The current document original dimensions for both, theelectronic and printed versions, are 170mm width by 240mm height. The “cover” requirescalc to calculate automatically the total width for the page layout, which includes thefront and the back covers and the spine width. The main document basic font size is thedefault value for the “book” document class, 10pt.
The crop package is usefull to define the trimming marks for the “draft” and “proofs”versions of this document. It distinguishes between the logical page, the page sizes definedby the user, and the physical page, the page size for the hardcopy. The layout package isused in the “draft” version to show on the first page the LATEX variable settings controllingthe page layout. Another useful package has been nextpage, which provides additional“clear...page” commands that ensure to get empty even pages at the end of chapters—and of course, to ensure that all chapters begin at odd pages—, even with automaticallygenerated sections like the Bibliography and the Index.
The babel package provides a set of options that allow the user to choose the lan-guage(s) in which the document will be typeset, for instance language-specific hyphenationpatterns. The default language was set to “english”, while “catalan” and “spanish”were also loaded for using them for the corresponding translations of the ABSTRACT (seepages xxv and xxvii respectively).
When working with pdflatex there are three unvaluable packages: pdfpages, whichmakes it easy to embed external PDF documents, such as the attached publications (seefor instance page 158); thumbpdf, it must be included in files for which a user wants togenerate thumbnails (which are created by the thumbpdf program); and hyperref, whichextends the functionality of all the LATEX cross-referencing commands to produce special
APPENDIX D. MISCELLANEA 201
commands which a driver can turn into hypertext links. To protect URL characters we mustload the url package, unless we have already provided hyperref. This package has itsown version of the url macro, enhanced to provide clickable URLs.
To include POSTSCRIPT figures one needs graphics and/or graphicx, those pack-ages are modified by pdflatex so that they are able to include bitmaps (PNGs, JPEGs,and so on) and PDF files into the document. color facilitates the specification of user-defined colors (such as the cover green shades). Figures generated with LATEX can use anyof the following packages: pstricks, pstcol, multido.
The bibliography was produced with BIBTEX. The package natbib (NATural sciencesBIBliography) provides both author-year and numerical citations; and it makes possibleto define different citation styles. We have set the following options: “square”, to putcitations within square brackets; “colon”, to separate multiple citations with colons; and“authoryear” to show author and year citations (instead of numerical citations). Thestyle “plainnat” was then applied to format the bibliography.
makeidx provides the macros required to make a subject index. To show the capitalletter section headings, few variables were redefined on an auxiliary file (header.ist).Three glossaries were generated for this document: the acronyms (see page 203), the webreferences (see page 213) and the glossary of terms (see page 207). The package glossaryallowed us to customize the format of these three sections.
We also defined a style file named mythesis.sty. It loads the following font packages:fontenc (with “T1” option), to set extended font encoding (accents and so on); textcomp,to include some extra symbols, such as the Euro symbol for instance; pifont, for S YMBOLand ZAPF DINGBATS fonts; mathpazo, with which roman family and formulas are set toPALATINO; avant, with which sans-serif family is set to A VANT GARDE; and courier, toset typewriter family to COURIER. Accessory documents, such as LATEX-generated figures,can use the following font packages: times, t1enc, and helvet.
Other packages that were loaded are: fancyhdr, to produce nice headings; fancyvrb,to extend the verbatim environment; comment, to hide parts of the original LATEX files;rotating, to rotate boxes of text; and multirow, to get multirow cells within thetabular environment.
Getting the template files
You are free to copy, modify and distribute the template files of this thesis, under the termsof the GNU Free Documentation License as published by the Free Software Foundation.Any script bundled in this distribution, including the Makefile, is under the terms of theGNU General Public License. The template for this document and all related files will beavailable from:
http://genome.imim.es/~jabril/thesis/


Abbreviations
3′ss 3′ Splice Site (intronic, acceptor site)
5′ss 5′ Splice Site (intronic, donor site)
aa Amino Acids (protein sequence length unit)
ACT Artemis Comparison Tool
ASD Alternative Splicing Database
BLAST Basic Local Alignment Search Tool
BLAT BLAST-Like Alignment Tool
bp Base Pairs (nucleotide sequence length unit)
CDS CoDing Sequence (protein-coding)
CTD Carboxy-Terminal Domain (of RNApolII)
DAS Distributed Annotation System
DNA DeoxyriboNucleic Acid
EBI European Bioinformatics Institute
ECR Evolutionary Conserved Regions
EHMM Evolutionary Hidden Markov Model
EJC Exon-Junction Complex
ENCODE ENCyclopedia Of DNA Elements
ESE Exonic Splicing Enhancer
ESS Exonic Splicing Silencer
FMM First-order Markov Model
FTP File Transfer Protocol
203

204 APPENDIX E. ABBREVIATIONS
GASP Genome Annotation Assessment Project
GFF General Feature Format
GHMM Generalized Hidden Markov Model
GNU-GPL GNU General Public License
GPHMM Generalized Pair HMM
HAVANA Human And Vertebrate Analysis aNd Annotation
HMM Hidden Markov Model
ICGSC International Chicken Genome Sequencing Consortium
IHGSC International Human Genome Sequencing Consortium
IMGSC International Mouse Genome Sequencing Consortium
ISE Intronic Splicing Enhancer
ISS Intronic Splicing Silencer
mRNA Messenger RNA
mRNP mRNA-protein Particle
NCBI National Center for Biotechnology Information
ncRNA Non-Coding RNA
NIH National Institutes of Health
NISC NIH Intramural Sequencing Center
NMD Nonsense-Mediated mRNA Decay
ORF Open Reading Frame
PHMM Pair Hidden Markov Model
phylo-HMM Phylogenetic Hidden Markov Model
PiPs Percentage Identity Plots
PSM Position-specific Scoring Matrix
PTC Premature Termination Codon
PWM Position Weight Matrix
RGSPC Rat Genome Sequencing Project Consortium
RNA RiboNucleic Acid
rRNA Ribosomal RNA

APPENDIX E. ABBREVIATIONS 205
Symbol Meaning Origin of designation
A A AdenineC C CytosineG G GuanineT T ThymineU U Uracil
R A or G puRineY C or T pYrimidine
M A or C aMinoK G or T Ketone
W A or T Weak interaction (2 H bonds)S C or G Strong interaction (2 H bonds)
B C or G or T not-A, B follows A in the alphabetD A or G or T not-C, D follows CH A or C or T not-G, H follows GV A or C or G not-T (not-U), V follows U
N G or A or T or C aNy (unspecified)X G or A or T or C aNy (often meaning unknown)
Table E.1: Extended DNA / RNA alphabet. It includes symbols coding for nucleotide ambigu-ity. Adapted from IUPAC-IUB for nucleotide nomenclature [Cornish-Bowden, 1985].
SNP Single Nucleotide Polymorphism
snRNP Small Nuclear RiboNucleoprotein Particle
SVG Scalable Vector Graphics
tRNA Transfer RNA
U2AF U2 Auxiliary Factor
UCSC University of California, Santa Cruz
URL Uniform Resource Locator
UTR UnTRanslated sequence
VEGA VErtebrate Genome Annotation
VRML Virtual Reality Modeling Language
WABA Wobble Aware Bulk Aligner

206 APPENDIX E. ABBREVIATIONS
Symbols Amino Acid Codons
A Ala Alanine GCA GCC GCG GCU
C Cys Cysteine UGC UGU
D|B Asp Aspartic acid GAC GAU
E|Z Glu Glutamic acid GAA GAG
F Phe Phenylalanine UUC UUU
G Gly Glycine GGA GGC GGG GGU
H His Histidine CAC CAU
I Ile Isoleucine AUA AUC AUUK Lys Lysine AAA AAG
L Leu Leucine UUA UUG CUA CUC CUG CUU
M Met Metionine AUGN|B Asn Asparagine AAC AAU
P Pro Proline CCA CCC CCG CCU
Q|Z Gln Glutamine CAA CAG
R Arg Arginine AGA AGG CGA CGC CGG CGU
S Ser Serine AGC AGU UCA UCC UCG UCU
T Thr Threonine ACA ACC ACG ACU
V Val Valine GUA GUC GUG GUU
W Trp Tryptophan UGGY Tyr Tyrosine UAC UAU
X Any Unknown aa NNN
* (!) Stop codon: ocre UAA* (#) Stop codon: amber UAG* (@) Stop codon: opal UGAU Sec Selenocysteine UGA
Table E.2: The standard genetic code. Synonymous codons are alternatively boldfaced to easetheir distinction. Single letter notation follows IUPAC-IUB for amino acid symbols [IUPAC-IUBJCBN, 1984, 1993]. Termination codons are listed separately and their extended symbol codesare shown in brackets. This extended notation was devised in our laboratory to distinguish eachstop codon on translated sequences; i.e., when analyzing those sequences to look for selenocys-teine amino acid codon corresponding to UGA termination codon [Hatfield and Gladyshev,2002].

Glossary
Acceptor Splice Site
The binding site of the spliceosome on the 3′ side of an intron and the 5′ side of anexon. This term is preferred over 3′ site because there can be multiple acceptor sites,in which case 3′ site is ambiguous. Also, one would have to refer to the 3′ site on the5′ side of an exon, which is confusing. Mechanistically, an acceptor site defines thebeginning of the exon, not the other way around.
Algorithm
A systematic procedure for solving a problem in a finite number of steps, typicallyinvolving a repetition of operations. Once specified, an algorithm can be written ina computer language and run as a program. Named after an Iranian mathematician,Al-Khawarizmi.
Alignment
The procedure of comparing two or more sequences by looking for a series of individ-ual characters or character patterns that are in the same order in the sequences. Thereare two type of alignments: local, which attempts to align regions of sequences withthe highest density of matches (one or more islands of subalignments are created indoing so); and global, which attempts to match as many characters as possible, fromend to end, in the set of sequences.
Annotation
The elucidation and description of biologically relevant features in the sequence isessential in order for genome data to be useful. The quality with which annotationis done will have direct impact on the value of the sequence. At a minimum, thedata must be annotated to indicate the existence of gene coding regions and controlregions. Further annotation activities that add value to a genome include findingsimple and complex repeats, characterizing the organization of promoters and genefamilies, the distribution of G+C content, tying together evidence for functional mo-tifs and homologs and so forth.
Capping
The process by which eukaryotic mRNA is modified by the addition at the 5′ terminusof an m7G(5′)ppp(5′)N structure. Capping is essential for several important steps ofgene expression, for instance, mRNA stabilization, splicing, mRNA export from thenucleus and initiation of translation.
207
208 APPENDIX F. GLOSSARY
Consensus Sequence (consensus)
The simplest form of a consensus sequence is created by picking the most frequentbase at some position in a set of aligned DNA, RNA or protein sequences. The processof creating a consensus destroys the frequency information and leads to many errorsin interpreting sequences. It is one of the worst pitfalls in molecular biology. Supposea position in a binding site had 75% A. The consensus would be A. Later, after havingforgotten the origin of the consensus while trying to make a prediction, one would bewrong 25% of the time.
Conserved
Derived from a common ancestor and retained in contemporary related species. Con-served features may or may not be under selection.
Conserved Segments
Also known as Conserved Linkages, is a special case of the conserved synteny inwhich the order of multiple orthologous genes is the same in the compared species.
Distributed Annotation System
The distributed annotation system [DAS, Dowell et al. 2001] is a client-server sys-tem in which a single client integrates information from multiple servers. It allowsa single machine to gather up genome annotation information from multiple distantweb sites, collate the information, and display it to the user in a single view. Littlecoordination is needed among the various information providers.
Donor Splice Site
The binding site of the spliceosome on the 5′ side of an intron and the 3′ side of anexon. This term is preferred over 5′ site because there can be multiple donor sites, inwhich case 5′ site is ambiguous. Also, one would have to refer to the 5′ site on the 3′
side of an exon, which is confusing. Mechanistically, a donor site defines the end ofthe exon, not the other way around.
Dot-Plot
A graphical representation of the regions of similarity between two sequences. Thetwo sequences are placed on the axes of a rectangular matrix and (in the simplestforms of dotplot) wherever there is a similarity between the sequences a dot is placedon that matrix. A dot-plot gives an overview of all possible alignments between twosequences, where each diagonal corresponds to a possible (ungapped) alignment.
Enhancer
Control element that elevates the levels of transcription from a promoter, indepen-dent of orientation or distance. Those intronic and exonic cis-acting elements stimu-lating splicing and that are important for correct splice-site identification.
Eukaryote
Organisms with intracellular membranous organelles such as the nucleus and mito-chondria.

APPENDIX F. GLOSSARY 209
Exon
The segment of a pre-mRNA that contains protein-coding sequence and/or the 5′
or 3′ untranslated sequences, which must be spliced together with other exons toproduce a mature mRNA.
Exon-definition model
A model in which exon units, rather than intron units, are initially defined by pairingsof spliceosomal components across exons.
Gene
A functional unit of the genome. When not specifically stated, “gene” is usuallyconsidered a “protein-coding” gene, but many genes do not contain the instructionsfor proteins (see non-coding RNA).
Genome
The complete genetic material for an organism. All the DNA contained in an organ-ism or a cell, which includes both the chromosomes within the nucleus and the DNAin mitochondria.
Genome Browser
A web-based or standalone software that serves as a front-end to navigate through adatabase of genomic annotations for one or more species. A genome browser stacksannotation tracks beneath genome coordinate positions, allowing rapid visual corre-lation of different types of information. The genome browser itself does not drawconclusions; rather, it collates all relevant information in one location, leaving theexploration and interpretation to the researcher.
Hidden Markov models
Probability models that were first developed in the speech-recognition field and laterapplied to protein- and DNA-sequence pattern recognition. Hidden Markov mod-els (HMMs) represent a system as a set of discrete states and as transitions betweenthose states. Each transition has an associated probability. Markov models are hid-den when one or more of the states cannot be observed directly. HMMs are valuablein bioinformatics because they allow a search or alignment algorithm to be built onfirm probability bases, and it is straightforward to train the parameters (transitionprobabilities) with known data.
Homologs
Features in species being compared that are similar because they are ancestrally re-lated.
Homology Blocks
Also defined as Conserved Synteny, occurs when the orthologs of genes that areon the same chromosome in one species are also on the same chromosome in thecomparison species.
210 APPENDIX F. GLOSSARY
IntronAn intervening non-coding sequence that interrupts two exons and that must be ex-cised from pre-mRNA transcripts before translation.
Intron Branch PointThe adenosine residue near the 3′ end of an intron the 2′ hydroxyl group of whichbecomes linked to the 5′ end of the intron during the first step of splicing.
Intron-definition modelprotect A model that proposes the initial pairwise interaction of spliceosomal com-ponents across introns, defining introns units that subsequently interact to promotespliceosome assembly and catalysis.
LariatAn RNA, the 5′ end of which is joined by a phospodiester linkage to the 2′ hydroxylof an internal nucleotide, thereby creating a lasso-shaped molecule.
Neural NetworksA collection of mathematical models that emulate some of the observed properties ofbiological nervous systems and draw on the analogies of adaptative biological learn-ing. Many highly interconnected processing elements that are analogous to neurons,are tied together with weighted connections that are analogous to synapses. Once itis trained on known exon or intron sample sequences, it will be able to predict exonsor introns in a query sequence automatically.
Non-Coding RNASome RNAs, like tRNAs or rRNAs, do not contain information for protein sequences.The RNA molecule for those genes defines a function by itself and does not need toget translated into protein.
Open Reading FrameEach strand of DNA has three frames. Any subsequence that does not contain stopcodons in a particular frame is an open reading frame.
OrthologsHomologous features that separated because of a speciation event, they derive fromthe same gene in the last common ancestor. See Jensen [2001] for more informationon this item.
ParalogsHomologous features that separated because of duplication events.
Phylogenetic DistancesMeasures of the degree of separation between two organisms or their genomes, ex-pressed in various terms such as the number of accumulated sequence changes, num-ber of years or number of generations. The distances are often placed on phylogenetictrees, which show the deduced relationships among the organisms.

APPENDIX F. GLOSSARY 211
Pip-Plot
Pip-plots display all the ungapped alignments between two sequences as black hori-zontal lines. The length of the line corresponds to the length of the alignment, whileits height corresponds to the percent identity of the alignment. An example of a toolproducing this output is PipMaker [Schwartz et al., 2000].
Prokaryote
Organisms that do not contain intracellular membranous organelles. All bacteria areprokaryotes.
Promoter Element
A region of DNA extending 150-300bp upstream from the transcription start site thatcontains binding sites for RNA polymerase and a number of proteins that regulatethe rate of transcription of the adjacent gene. In RNA synthesis, promoters are ameans to demarcate which genes should be used for messenger RNA creation—and,by extension, control which proteins the cell manufactures.
Proteome
The complete set of all proteins produced by a particular organism. Many proteinsundergo post-translational modifications that add or subtract features from a protein.Therefore, a particular mRNA might have many different protein isoforms.
Pseudogene
A DNA sequence that was derived originally from a functional protein-coding genethat has lost its function, owing to the presence of one or more inactivating mutations.
Regulatory Element
A cis-acting DNA sequence that is required for a gene to be transcribed, or to be tran-scribed in the proper cell type(s) and developmental stage(s). These sequences arerecognized by different transcription factors which modulate the binding or the ac-tivity of the RNA polimerase. These sequences comprise promoter regions, enhancersand
Sequence Pattern
A sequence pattern is defined by a set of aligned nucleotide or amino acid sequences(i.e. binding sites, splicing signals, and so on), or by a common protein structure. Incontrast, consensus sequences, regular expressions, sequence logos and pictogramsare only models of the patterns found experimentally or in nature. Models do notcapture everything in nature. For example, there might be correlations between twodifferent positions in a binding site. A more sophisticated model might capture thesebut still not capture three-way correlations. It is impossible to make the more detailedmodel if there is not enough data.
Silencer
Control element that supresses gene expression independent of orientation or dis-tance. Those intronic and exonic cis-acting elements repressing splicing and that areimportant for correct splice-site identification.

212 APPENDIX F. GLOSSARY
Small Nuclear Ribonucleoprotein Particle
A particle that is found in the cell nucleus and consist of a tight complex between ashort RNA molecule (up to 300 nucleotides) and one or more proteins. SnRNPs areinvolved in pre-mRNA processing and transfer RNA biogenesis.
Smooth-Plot
Smooth-plots are constructed using, for each nucleotide, a 100bp sliding window inwhich sequence identity between two sequences is averaged. Such a window cen-tered at every nucleotide in the base sequence is used to calculate the number ofmatches inside of this window. Percent identity counts in a sliding window are uti-lized to calculate the height of the smooth conservation graph at each point. Basically,smooth-graph is a smooth average of the Pip-plot. Smooth-graphs present a simpli-fied and clearer view in the conservation profile but loses information regarding gapdistribution in the alignment. An example of a tool producing this output is VISTA[Mayor et al., 2000].
Spliceosome
A large complex that consist of five splicing small nuclear ribonucleoprotein particlesas well as numerous protein factors. It mediates the excision of introns from pre-mRNA transcripts and ligates exon ends to produce mature mRNA.
Synteny
The property of being on the same chromosome sensu strictu [Passarge et al., 1999].Nowadays is often used as synonymous of Homology Blocks, specially within thegene-finding terminology.
Training Data Set
The known examples of an object (for example, an exon) that are used to train pre-diction algorithms, so that they learn the rules for predicting an object. They can bepositive training sets (consisting of true objects, such as exons) or negative trainingsets (consisting of false objects, such as pseudogenes).
Transcriptome
The complete set of transcripts for a particular genome. This term is often used tomean the mRNAs of protein coding genes and their alternatively spliced variants.

WebSite References
ACEDB genome database
ACEDB is a genome database designed specifically for handling bioinformatic dataflexibly. It includes tools designed to manipulate genomic data, but is increasinglyalso used for non-biological data.
http://www.acedb.org/
Analysis of mammalian and chicken splice sites
This web page summarizes the supplementary materials for Abril et al. [2005].
http://genome.imim.es/datasets/hmrg2004/
Assessment of gene prediction accuracy in large DNA sequences
Given the absence of experimentally verified large genomic data sets, a semi-artificialtest set comprising a number of short single-gene genomic sequences with randomlygenerated intergenic regions was built in order to analyze gene-prediction programsaccuracy [Guigó et al., 2000].
http://genome.imim.es/datasets/gpeval2000/
compi home page
compi is a perl script to produce comparative pictograms, a graphical representationof nucleotide frequencies at each position of a sequence motif or a pair-wise com-parison between two sequence patterns. Latest version, as well as examples, of thisprogram will be available from the URL below:
http://genome.imim.es/software/compi/
ENSEMBL Genome Browser
ENSEMBL is a joint project between EMBL - EBI and the Sanger Institute to develop asoftware system which produces and maintains automatic annotation on metazoangenomes. The following URL corresponds to the project main page:
http://www.ensembl.org/
213

214 APPENDIX G. WEBSITE REFERENCES
Gene Predictions on GenomesA repository of gene predictions on eukaryotic genomes. It contains the results fromgeneid and SGP2when applied on each novel genome assembly. Annotations forseveral species, including human, chimp, mouse, rat, chicken and the fruitfly, can beretrieved from:
http://genome.imim.es/genepredictions/
geneid predictions submitted to GASP1A set of training sequences (exons/introns) and the resulting parameters required torun geneid on Drosophila melanogaster genome.
http://genome.imim.es/datasets/Dro_me/
General Feature Format (GFF)Initially proposed at Sanger Center by Richard Durbin and David Haussler in 1997,it was proposed as a protocol for the transfer of annotation features information.It has undergone two major reviews, each one defining a new version (GFF v1, v2and v3). It also inspired a derivated format known as Gene Transfer Format (GTF,http://genes.cs.wustl.edu/GTF2.html), which has additional structure thatwarrants a separate definition and format name. Main fields of the GFFformat are:seqname source feature start end score strand frame [attributes] [# comments]
Further information is available at:
http://www.sanger.ac.uk/Software/formats/GFF/GFF_Spec.shtml
Generic Model Organism ProjectThe home page of a joint effort by the model organism system databases WORMBASE,FLYBASE, MGI, SGD, GRAMENE, RAT GENOME DATABASE, ECOCYC, and TAIR todevelop reusable components suitable for creating new community databases ofbiology.
http://www.gmod.org/
Genome Annotation Assessment Project (GASP1)Community wide experiment to assess gene prediction on long eukaryotic genomicsequences: The Adh region (2.9Mb) in Drosophila melanogaster.
http://www.fruitfly.org/GASP1/
gff2aplot home pagegff2aplot is a tool for generating pair-wise alignment-plots for genomic sequencesin POSTSCRIPT [Abril et al., 2003]. Latest version of this program can be retrievedfrom this URL, as well as examples and tutorials on how to use it.
http://genome.imim.es/software/gfftools/GFF2APLOT.html

APPENDIX G. WEBSITE REFERENCES 215
gff2ps home page
This is the home page for gff2ps, a program for visualizing annotations of genomicsequences [Abril and Guigó, 2000]. The program takes as input the annotatedfeatures on a genomic sequence in GFF format, and produces a visual output inPOSTSCRIPT. It has been successfully used to generate the whole genome maps ofdifferent eukaryotic organisms, including human. Latest version of this program canbe retrieved from this URL, as well as examples and tutorials on how to use it.
http://genome.imim.es/software/gfftools/GFF2PS.html
Making the three panels poster for the ISMB99 GASP1 tutorial
The posters made for the GASP1 tutorial and shown at ISMB’99 meeting are anexample of what can be done with the gff2ps visualization tool. There you will findthree examples of what can be generated from the same data-set, applying a slightlymodified customization file and few command-line options.
http://genome.imim.es/software/gfftools/GFF2PS-ADHposter.html
Mouse genome supplementary materials
Description of the software and data presented in Guigó et al. [2003] and Waterstonet al. [2002]. In that paper it was estimated that near a thousand novel human genesthat do not overlap known proteins can be verified experimentally. The method isbased in the comparison of human and mouse genomes to enhance the resultinggene-predictions, plus a filtering step from which a sample of mouse predictionswere tested by RT-PCR amplification and direct sequencing.
http://genome.imim.es/datasets/mouse2002/
NCBI MAP VIEWER
The NCBI MAP VIEWER provides special browsing capabilities for a subset oforganisms in ENTREZ Genomes (http://www.ncbi.nlm.nih.gov/entrez/query.fcgi?db=Genome ). Available organism genomes are listed on the NCBIMAP VIEWER Home Page. This browser allows the visitor to view and search an or-ganism’s complete genome, display chromosome maps, and zoom into progressivelygreater levels of detail, down to the sequence data for a region of interest.
http://www.ncbi.nlm.nih.gov/mapview/
RepeatMasker
RepeatMasker is a program that screens DNA sequences for interspersed repeatsand low complexity DNA sequences. The output of the program is a detailedannotation of the repeats that are present in the query sequence as well as a modifiedversion of the query sequence in which all the annotated repeats have been masked(by default replaced by Ns).
http://www.repeatmasker.org/
216 APPENDIX G. WEBSITE REFERENCES
SGP2home page
SGP2 is a program to predict genes by comparing anonymous genomic se-quences from two different species. It combines TBLASTX, a sequence sim-ilarity search program, with geneid, an “ab initio” gene prediction pro-gram. The latest version of SGP2 is downloadable from this site. A webserver has been developed recently by Genís Parra, and it is available athttp://genome.imim.es/software/sgp2/sgp2.html
http://genome.imim.es/software/sgp2/
SGP2supplementary materials
Supplementary materials for the SGP2paper [Parra et al., 2003] are available fromthis section. SGP2 is a gene prediction program that combines “ab initio” geneprediction with TBLASTXsearches between two genome sequences to provide bothsensitive and specific gene predictions.
http://genome.imim.es/datasets/sgp2002/
UCSC GENOME BROWSER
This site contains the reference sequence and working draft assemblies for a largecollection of genomes. It also shows the CFTR (cystic fibrosis) region in 13 speciesand provides a portal to the ENCODE project. The UCSC GENOME BROWSER zoomsand scrolls over chromosomes, showing the work of annotators worldwide.
http://genome.ucsc.edu/
Bibliography
J.F. Abril, R. Castelo, and R. Guigó. Comparison of splice sites in mammals and chicken. Genome Res,15(1):111–119, Jan 3 2005. Published online before print in Dec 8, 2004.
J.F. Abril and R. Guigó. gff2ps: visualizing genomic annotations. Bioinformatics, 16(8):743–4, Aug2000.
J.F. Abril, R. Guigó, and T. Wiehe. gff2aplot: Plotting sequence comparisons. Bioinformatics, 19(18):2477–2479, Dec 12 2003.
M.D. Adams, S.E. Celniker, R.A. Holt, C.A. Evans, J.D. Gocayne, P.G. Amanatides, S.E. Scherer, P.W.Li, R.A. Hoskins, R.F. Galle, R.A. George, S.E. Lewis, S. Richards, M. Ashburner, S.N. Henderson,and others (including J.F. Abril). The genome sequence of Drosophila melanogaster. Science, 287(5461):2185–95, Mar 24 2000.
Adobe Systems Inc. PostScript Language Reference Manual. Addison-Wesley Publishing Company,Inc., third edition, March 1999. ISBN 0-201-37922-8.
M. Aebi, H. Hornig, and C. Weissmann. 5’ cleavage site in eukaryotic pre-mRNA splicing is deter-mined by the overall 5’ splice region, not by the conserved 5’ GU.Cell, 50(2):237–46, Jul 17 1987.
M. Alexandersson, S. Cawley, and L. Pachter. SLAM: cross-species gene finding and alignment with ageneralized pair hidden Markov model. Genome Res, 13(3):496–502, Mar 2003.
S.F. Altschul, W. Gish, W. Miller, E.W. Myers, and D.J. Lipman. Basic local alignment search tool. JMol Biol, 215(3):403–10, Oct 5 1990.
S.F. Altschul, T.L. Madden, A.A. Schaffer, J. Zhang, Z. Zhang, W. Miller, and D.J. Lipman. GappedBLASTand PSI-BLAST: a new generation of protein database search programs. Nucleic Acids Res,25(17):3389–402, Sep 1 1997.
F. Antequera and A. Bird. Number of CpG islands and genes in human and mouse. Proc Natl AcadSci U S A, 90(24):11995–9, Dec 15 1993.
J.L. Ashurst, C.K. Chen, J.G. Gilbert, K. Jekosch, S. Keenan, P. Meidl, S.M. Searle, J. Stalker, R. Storey,S. Trevanion, L. Wilming, and T. Hubbard. The VErtebrate Genome Annotation (VEGA) database.Nucleic Acids Res, 33 Database Issue:D459–65, Jan 1 2005.
V.N. Babenko, P.S. Kosarev, O.V. Vishnevsky, V.G. Levitsky, V.V. Basin, and A.S. Frolov. Investigatingextended regulatory regions of genomic DNA sequences. Bioinformatics, 15(7-8):644–53, Jul-Aug1999.
V. Bafna and D.H. Huson. “The conserved exon method for gene finding.”. In Proc Int Conf Intell SystMol Biol, volume 8, pages 3–12, 2000.
217

218 BIBLIOGRAPHY
R.E. Banks, M.J. Dunn, D.F. Hochstrasser, J.C. Sanchez, W. Blackstock, D.J. Pappin, and P.J. Selby.Proteomics: new perspectives, new biomedical opportunities. Lancet, 356(9243):1749–56, Nov 182000.
E. Barillot, S. Pook, F. Guyon, C. Cussat-Blanc, E. Viara, and G. Vaysseix. The HUGEMAP Database:interconnection and visualization of human genome maps. Nucleic Acids Res, 27(1):119–22, Jan 11999.
S. Batzoglou, L. Pachter, J.P. Mesirov, B. Berger, and E.S. Lander. Human and mouse gene structure:comparative analysis and application to exon prediction. Genome Res, 10(7):950–8, Jul 2000.
E. Beitz. TEXshade: shading and labeling of multiple sequence alignments using LATEX 2ε. Bioinfor-matics, 16(2):135–9, Feb 2000.
S.M. Berget, C. Moore, and P.A. Sharp. Spliced segments at the 5’ terminus of adenovirus 2 latemRNA. Proc Natl Acad Sci U S A, 74(8):3171–5, Aug 1977.
E. Birney, D. Andrews, P. Bevan, M. Caccamo, G. Cameron, Y. Chen, L. Clarke, G. Coates, T. Cox,J. Cuff, V. Curwen, T. Cutts, T. Down, R. Durbin, E. Eyras, et al. ENSEMBL 2004. Nucleic Acids Res,32(1):D468–70, Jan 1 2004a.
E. Birney, M. Clamp, and R. Durbin. GeneWise and Genomewise. Genome Res, 14(5):988–95, May2004b.
E. Birney and R. Durbin. Dynamite: a flexible code generating language for dynamic programmingmethods used in sequence comparison. Proc Int Conf Intell Syst Mol Biol, 5:56–64, 1997.
D.L. Black. Mechanisms of alternative pre-messenger RNA splicing. Annu Rev Biochem, 72:291–336,2003.
F.R. Blattner and J.L. Schroeder. A computer package for DNA sequence analysis. Nucleic Acids Res,12(1 Pt 2):615–7, Jan 11 1984.
M. Blaxter, J. Daub, D. Guiliano, J. Parkinson, and C. Whitton. The Brugia malayi genome project:expressed sequence tags and gene discovery. Trans R Soc Trop Med Hyg, 96(1):7–17, Jan-Feb 2002.
P. Blayo, P. Rouzé, and M.-F. Sagot. Orphan gene finding - An exon assembly approach. TheoreticalComputer Science, 290(3):1407–1431, 2002.
D. Boffelli, J. McAuliffe, D. Ovcharenko, K.D. Lewis, I. Ovcharenko, L. Pachter, and E.M. Rubin.Phylogenetic shadowing of primate sequences to find functional regions of the human genome.Science, 299(5611):1391–4, Feb 28 2003.
M. Borodovsky and J. McIninch. GeneMark: Parallel gene recognition for both DNA strands. Com-puter and Chemistry, 17:123–134, 1993.
M.R. Brent and R. Guigó. Recent advances in gene structure prediction. Curr Opin Struct Biol, 14(3):264–72, Jun 2004.
D. Brett, H. Pospisil, J. Valcarcel, J. Reich, and P. Bork. Alternative splicing and genome complexity.Nat Genet, 30(1):29–30, Jan 2002.
C.T. Brown, A.G. Rust, P.J. Clarke, Z. Pan, M.J. Schilstra, T. De Buysscher, G. Griffin, B.J. Wold, R.A.Cameron, E.H. Davidson, and H. Bolouri. New computational approaches for analysis of cis-regulatory networks. Dev Biol, 246(1):86–102, Jun 1 2002.
A.R. Buchman and P. Berg. Comparison of intron-dependent and intron-independent gene expres-sion. Mol Cell Biol, 8(10):4395–405, Oct 1988.

BIBLIOGRAPHY 219
C.J. Bult, J.A. Blake, J.E. Richardson, J.A. Kadin, J.T. Eppig, R.M. Baldarelli, K. Barsanti, M. Baya, J.S.Beal, W.J. Boddy, D.W. Bradt, D.L. Burkart, N.E. Butler, J. Campbell, R. Corey, et al. The MouseGenome Database (MGD): integrating biology with the genome.Nucleic Acids Res, 32 Database issue:D476–81, Jan 1 2004.
C. Burge and S. Karlin. Prediction of complete gene structures in human genomic DNA. J Mol Biol,268(1):78–94, Apr 25 1997.
C. B. Burge, T. Tuschl, and P. S. Sharp. The RNA world, volume 37 of Cold Spring Harbor MonographSeries, chapter “Splicing Precursors to mRNAs by the Spliceosomes.”, pages 525–560. Cold SpringHarbor Laboratory Press, Cold Spring Harbor, New York, USA, 2nd edition, 1999. ISBN 0-87969-589-7.
C.B. Burge, R.A. Padgett, and P.A. Sharp. Evolutionary fates and origins of U12-type introns. MolCell, 2(6):773–85, Dec 1998.
M. Burset and R. Guigó. Evaluation of gene structure prediction programs. Genomics, 34(3):353–67,Jun 15 1996.
M. Burset, I.A. Seledtsov, and V.V. Solovyev. Analysis of canonical and non-canonical splice sites inmammalian genomes. Nucleic Acids Res, 28(21):4364–75, Nov 1 2000.
S.B. Cannon, A. Kozik, B. Chan, R. Michelmore, and N.D. Young. DiagHunter and GenoPix2D:programs for genomic comparisons, large-scale homology discovery and visualization. GenomeBiol, 4(10):R68, 2003.
L. Cartegni, S.L. Chew, and A.R. Krainer. Listening to silence and understanding nonsense: exonicmutations that affect splicing. Nat Rev Genet, 3(4):285–98, Apr 2002.
R. Castelo, G. Parra, and R. Guigó. exstral: EXon STRucture over an ALignment. unpublished 2004.
M. Chagoyen, M.E. Kurul, P.A. De-Alarcon, J.M. Carazo, and A. Gupta. Designing and executingscientific workflows with a programmable integrator. Bioinformatics, 20(13):2092–100, Sep 1 2004.
K. Chakrabarti and L. Pachter. Visualization of multiple genome annotations and alignments withthe K-BROWSER.Genome Res, 14(4):716–20, Apr 2004.
J. Cheung, X. Estivill, R. Khaja, J.R. MacDonald, K. Lau, L.C. Tsui, and S.W. Scherer. Genome-widedetection of segmental duplications and potential assembly errors in the human genome sequence.Genome Biol, 4(4):R25, 2003.
F. Chiaromonte, S. Yang, L. Elnitski, V.B. Yap, W. Miller, and R.C. Hardison. Association betweendivergence and interspersed repeats in mammalian noncoding genomic DNA. Proc Natl Acad SciU S A, 98(25):14503–8, Dec 4 2001.
L.T. Chow, R.E. Gelinas, T.R. Broker, and R.J. Roberts. An amazing sequence arrangement at the 5’ends of adenovirus 2 messenger RNA. Cell, 12(1):1–8, Sep 1977.
K.R. Christie, S. Weng, R. Balakrishnan, M.C. Costanzo, K. Dolinski, S.S. Dwight, S.R. Engel, B. Feier-bach, D.G. Fisk, J.E. Hirschman, E.L. Hong, L. Issel-Tarver, R. Nash, A. Sethuraman, B. Starr, et al.Saccharomyces Genome Database (SGD) provides tools to identify and analyze sequences fromSac-charomyces cerevisiae and related sequences from other organisms. Nucleic Acids Res, 32(1):D311–4,Jan 1 2004.
T.J. Chuang, W.C. Lin, H.C. Lee, C.W. Wang, K.L. Hsiao, Z.H. Wang, D. Shieh, S.C. Lin, and L.Y.Ch’ang. A complexity reduction algorithm for analysis and annotation of large genomic sequences.Genome Res, 13(2):313–22, Feb 2003.

220 BIBLIOGRAPHY
M. Clamp, D. Andrews, D. Barker, P. Bevan, G. Cameron, Y. Chen, L. Clark, T. Cox, J. Cuff, V. Curwen,T. Down, R. Durbin, E. Eyras, J. Gilbert, M. Hammond, et al. ENSEMBL 2002: accommodatingcomparative genomics. Nucleic Acids Res, 31(1):38–42, Jan 1 2003.
J.E. Cleaver, C. Collins, J. Ellis, and S. Volik. Genome sequence and splice site analysis of low-fidelityDNA polymerases H and I involved in replication of damaged DNA. Genomics, 82(5):561–70, Nov2003.
C.A. Collins and C. Guthrie. The question remains: is the spliceosome a ribozyme? Nat Struct Biol, 7(10):850–4, Oct 2000.
F.S. Collins, E.D. Green, A.E. Guttmacher, and M.S. Guyer. A vision for the future of genomics re-search. Nature, 422(6934):835–47, Apr 24 2003.
J.W. Conaway, A. Shilatifard, A. Dvir, and R.C. Conaway. Control of elongation by RNA polymeraseII. Trends Biochem Sci, 25(8):375–80, Aug 2000.
J. Corden and C. Ingles. Transccriptional Regulation, chapter “Carboxy-terminal domain of the largestsubunit of eukaryotic RNA polymerase II”, pages 81–108. Cold Spring Harbor Laboratory Press,Cold Spring Harbor, NY (USA), 1992.
A. Cornish-Bowden. Nomenclature for incompletely specified bases in nucleic acid sequences: rec-ommendations 1984. Nucleic Acids Res, 13(9):3021–30, May 10 1985.
E. Coward, S.A. Haas, and M. Vingron. SpliceNest: visualizing gene structure and alternativesplicing based on EST clusters. Trends Genetics, 18(1):53–55, 2002.
P. Cramer, C.G. Pesce, F.E. Baralle, and A.R. Kornblihtt. Functional association between promoterstructure and transcript alternative splicing. Proc Natl Acad Sci U S A, 94(21):11456–60, Oct 14 1997.
V. Curwen, E. Eyras, T.D. Andrews, L. Clarke, E. Mongin, S.M. Searle, and M. Clamp. The ENSEMBLautomatic gene annotation system. Genome Res, 14(5):942–50, May 2004.
B. Datta and A.M. Weiner. Genetic evidence for base pairing between U2 and U6 snRNA in mam-malian mRNA splicing. Nature, 352(6338):821–4, Aug 29 1991.
M. de la Mata, C.R. Alonso, S. Kadener, J.P. Fededa, M. Blaustein, F. Pelisch, P. Cramer, D. Bentley,and A.R. Kornblihtt. A slow RNA polymerase II affects alternative splicing in vivo. Mol Cell, 12(2):525–32, Aug 2003.
A.L. Delcher, S. Kasif, R.D. Fleischmann, J. Peterson, O. White, and S.L. Salzberg. Alignment of wholegenomes. Nucleic Acids Res, 27(11):2369–76, Jun 1 1999.
E.T. Dermitzakis, A. Reymond, R. Lyle, N. Scamuffa, C. Ucla, S. Deutsch, B.J. Stevenson, V. Flegel,P. Bucher, C.V. Jongeneel, and S.E. Antonarakis. Numerous potentially functional but non-genicconserved sequences on human chromosome 21. Nature, 420(6915):578–82, Dec 5 2002.
J. Devereux, P. Haeberli, and O. Smithies. A comprehensive set of sequence analysis programs forthe VAX. Nucleic Acids Res, 12(1 Pt 1):387–95, Jan 11 1984.
C. Dewey, J.Q. Wu, S. Cawley, M. Alexandersson, R. Gibbs, and L. Pachter. Accurate identification ofnovel human genes through simultaneous gene prediction in human, mouse, and rat. Genome Res,14(4):661–4, Apr 2004.
R.C. Dietrich, R. Incorvaia, and R.A. Padgett. Terminal intron dinucleotide sequences do not distin-guish between U2- and U12-dependent introns. Mol Cell, 1(1):151–60, Dec 1997.

BIBLIOGRAPHY 221
S. Dong and D.B. Searls. Gene structure prediction by linguistic methods. Genomics, 23(3):540–51, Oct1994.
R.D. Dowell, R.M. Jokerst, A. Day, S.R. Eddy, and L. Stein. The distributed annotation system. BMCBioinformatics, 2(1):7, 2001.
I. Dubchak, M. Brudno, G.G. Loots, L. Pachter, C. Mayor, E.M. Rubin, and K.A. Frazer. Active con-servation of noncoding sequences revealed by three-way species comparisons. Genome Res, 10(9):1304–6, Sep 2000.
I. Dunham, N. Shimizu, B.A. Roe, S. Chissoe, A.R. Hunt, J.E. Collins, R. Bruskiewich, D.M. Beare,M. Clamp, L.J. Smink, R. Ainscough, J.P. Almeida, A. Babbage, C. Bagguley, J. Bailey, et al. TheDNA sequence of human chromosome 22. Nature, 402(6761):489–95, Dec 2 1999.
R. Durbin, S. Eddy, A. Crogh, and G. Mitchison. Biological Sequence Analysis: Probabilistic Models ofProtein and Nucleic Acids. Cambridge University Press, first edition, 1998. ISBN 0-521-62971-3.
R. Durbin and J. Thierry-Mieg. The ACEDB genome database. URL http://www.acedb.org/.unpublished 1993.
L. Duret, E. Gasteiger, and G. Perriere. LALNVIEW: a graphical viewer for pairwise sequence align-ments. Comput Appl Biosci, 12(6):507–10, Dec 1996.
I. Ebersberger, D. Metzler, C. Schwarz, and S. Paabo. Genomewide comparison of DNA sequencesbetween humans and chimpanzees. Am J Hum Genet, 70(6):1490–7, Jun 2002.
J.H. Edwards. The Oxford Grid. Ann Hum Genet, 55 ( Pt 1):17–31, Jan 1991.
Y.J. Edwards, T.J. Carver, T. Vavouri, M. Frith, M.J. Bishop, and G. Elgar. Theatre: A software toolfor detailed comparative analysis and visualization of genomic sequence. Nucleic Acids Res, 31(13):3510–7, Jul 1 2003.
F.H. Eeckman and R. Durbin. ACeDBand macace. Methods Cell Biol, 48:583–605, 1995.
ENCODE Project Consortium. The ENCODE (ENCyclopedia Of DNA Elements) Project. Science, 306(5696):636–40, Oct 22 2004.
X. Estivill, J. Cheung, M.A. Pujana, K. Nakabayashi, S.W. Scherer, and L.C. Tsui. Chromosomalregions containing high-density and ambiguously mapped putative single nucleotide polymor-phisms (SNPs) correlate with segmental duplications in the human genome. Hum Mol Genet, 11(17):1987–95, Aug 15 2002.
T. Etzold and P. Argos. SRS—an indexing and retrieval tool for flat file data libraries. Comput ApplBiosci, 9(1):49–57, Feb 1993.
B. Ewing and P. Green. Analysis of expressed sequence tags indicates 35,000 human genes. Nat Genet,25(2):232–4, Jun 2000.
Z. Fang, M. Polacco, S. Chen, S. Schroeder, D. Hancock, H. Sanchez, and E. Coe. cMap: the compara-tive genetic map viewer. Bioinformatics, 19(3):416–7, Feb 12 2003.
A. Fedorov, A.F. Merican, and W. Gilbert. Large-scale comparison of intron positions among animal,plant, and fungal genes. Proc Natl Acad Sci U S A, 99(25):16128–33, Dec 10 2002.
E.S. Ferlanti, J.F. Ryan, I. Makalowska, and A.D. Baxevanis. WebBLAST2.0: an integrated solution fororganizing and analyzing sequence data. Bioinformatics, 15(5):422–3, May 1999.

222 BIBLIOGRAPHY
J.W. Fickett. Recognition of protein coding regions in DNA sequences. Nucleic Acids Res, 10(17):5303–18, Sep 11 1982.
C. Fields, M.D. Adams, O. White, and J.C. Venter. How many genes in the human genome? NatGenet, 7(3):345–6, Jul 1994.
C.A. Fields and C.A. Soderlund. gm: a practical tool for automating DNA sequence analysis. ComputAppl Biosci, 6(3):263–70, Jul 1990.
S. Fischer, J. Crabtree, B. Brunk, M. Gibson, and G.C. Overton. bioWidgets: data interaction com-ponents for genomics. Bioinformatics, 15(10):837–46, Oct 1999.
W.M. Fitch. An improved method of testing for evolutionary homology. J Mol Biol, 16(1):9–16, Mar1966.
P. Flicek, E. Keibler, P. Hu, I. Korf, and M.R. Brent. Leveraging the mouse genome for gene predictionin human: from whole-genome shotgun reads to a global synteny map. Genome Res, 13(1):46–54,Jan 2003.
L. Florea, G. Hartzell, Z. Zhang, G.M. Rubin, and W. Miller. A computer program for aligning acDNA sequence with a genomic DNA sequence. Genome Res, 8(9):967–74, Sep 1998.
L. Florea, M. McClelland, C. Riemer, S. Schwartz, and W. Miller. EnteriX 2003: Visualization toolsfor genome alignments of Enterobacteriaceae. Nucleic Acids Res, 31(13):3527–32, Jul 1 2003.
A. Fortna and K. Gardiner. Genomic sequence analysis tools: a user’s guide. Trends Genet, 17(3):158–64, Mar 2001.
K.A. Frazer, L. Elnitski, D.M. Church, I. Dubchak, and R.C. Hardison. Cross-species sequence com-parisons: a review of methods and available resources. Genome Res, 13(1):1–12, Jan 2003.
X.D. Fu. Towards a splicing code. Cell, 119(6):736–8, Dec 17 2004.
M.S. Gelfand. Computer prediction of the exon-intron structure of mammalian pre-mRNAs. NucleicAcids Res, 18(19):5865–9, Oct 11 1990.
M.S. Gelfand, A.A. Mironov, and P.A. Pevzner. Gene recognition via spliced sequence alignment.Proc Natl Acad Sci U S A, 93(17):9061–6, Aug 20 1996.
A.J. Gibbs and G.A. McIntyre. The diagram, a method for comparing sequences. Its use with aminoacid and nucleotide sequences. Eur J Biochem, 16(1):1–11, Sep 1970.
R.A. Gibbs, G.M. Weinstock, M.L. Metzker, D.M. Muzny, E.J. Sodergren, S. Scherer, G. Scott, D. Stef-fen, K.C. Worley, P.E. Burch, G. Okwuonu, S. Hines, L. Lewis, C. DeRamo, O. Delgado, and others(Rat Genome Sequencing Project Consortium, RGSPC; including J.F. Abril). Genome sequence ofthe Brown Norway rat yields insights into mammalian evolution. Nature, 428(6982):493–521, Apr1 2004.
R. Gibson and D.R. Smith. Genome visualization made fast and simple. Bioinformatics, 19(11):1449–50,Jul 22 2003.
R. Gil, F.J. Silva, E. Zientz, F. Delmotte, F. Gonzalez-Candelas, A. Latorre, C. Rausell, J. Kamerbeek,J. Gadau, B. Holldobler, R.C. van Ham, R. Gross, and A. Moya. The genome sequence of Blochman-nia floridanus: comparative analysis of reduced genomes. Proc Natl Acad Sci U S A, 100(16):9388–93,Aug 5 2003.
D.G. Gilbert. euGenes: a eukaryote genome information system. Nucleic Acids Res, 30(1):145–8, Jan1 2002.

BIBLIOGRAPHY 223
P. Gilligan, S. Brenner, and B. Venkatesh. Fugu and human sequence comparison identifies novelhuman genes and conserved non-coding sequences. Gene, 294(1-2):35–44, Jul 10 2002.
W. Gish. Washington University BLAST. URLhttp://blast.wustl.edu . unpublished 1996–2004.
J.D. Glasner, P. Liss, 3.r.d. Plunkett G, A. Darling, T. Prasad, M. Rusch, A. Byrnes, M. Gilson, B. Biehl,F.R. Blattner, and N.T. Perna. ASAP, a systematic annotation package for community analysis ofgenomes. Nucleic Acids Res, 31(1):147–51, Jan 1 2003.
A.C. Goldstrohm, A.L. Greenleaf, and M.A. Garcia-Blanco. Co-transcriptional splicing of pre-messenger RNAs: considerations for the mechanism of alternative splicing. Gene, 277(1-2):31–47,Oct 17 2001.
N. Goodman. Biological data becomes computer literate: new advances in bioinformatics. Curr OpinBiotechnol, 13(1):68–71, Feb 2002.
B. Göttgens, L.M. Barton, J.G. Gilbert, A.J. Bench, M.J. Sanchez, S. Bahn, S. Mistry, D. Grafham, A. Mc-Murray, M. Vaudin, E. Amaya, D.R. Bentley, A.R. Green, and A.M. Sinclair. Analysis of vertebrateSCL loci identifies conserved enhancers. Nat Biotechnol, 18(2):181–6, Feb 2000.
B. Göttgens, J.G. Gilbert, L.M. Barton, D. Grafham, J. Rogers, D.R. Bentley, and A.R. Green. Long-range comparison of human and mouse SCL loci: localized regions of sensitivity to restrictionendonucleases correspond precisely with peaks of conserved noncoding sequences. Genome Res,11(1):87–97, Jan 2001.
E. Graziano and P. Arus. FITMAPSand SHOWMAP: two programs for graphical comparison and plot-ting of genetic maps. J Hered, 93(3):225–7, May-Jun 2002.
A.L. Greenleaf. Positive patches and negative noodles: linking RNA processing to transcription?Trends Biochem Sci, 18(4):117–9, Apr 1993.
R. Guigo. Assembling genes from predicted exons in linear time with dynamic programming. JComput Biol, 5(4):681–702, Winter 1998.
R. Guigó. Genetic Databases., chapter “DNA Composition, Codon Usage and Exon Prediction.”, pages53–80. Academic Press, San Diego, California, USA, 1999. ISBN 0-12-101625-0.
R. Guigó, P. Agarwal, J.F. Abril, M. Burset, and J.W. Fickett. An assessment of gene prediction accu-racy in large DNA sequences. Genome Res, 10(10):1631–42, Oct 2000.
R. Guigó, E.T. Dermitzakis, P. Agarwal, C.P. Ponting, G. Parra, A. Reymond, J.F. Abril, E. Keibler,R. Lyle, C. Ucla, S.E. Antonarakis, and M.R. Brent. Comparison of mouse and human genomesfollowed by experimental verification yields an estimated 1,019 additional genes. Proc Natl AcadSci U S A, 100(3):1140–5, Feb 4 2003.
R. Guigó, S. Knudsen, N. Drake, and T. Smith. Prediction of gene structure. J Mol Biol, 226(1):141–57,Jul 5 1992.
R. Guigó and M.Q. Zhang. Mammalian Genomics., chapter “Gene predictions and Annotations.”, page(in press). CAB International, 2004. ISBN 0-851-99910-7.
C. Gybas and P. Jambeck. Developing Bioinformatics Computer Skills. O’Reilly & Associates, Inc., firstedition, April 2003. ISBN 1-56592-664-1.
S.L. Hall and R.A. Padgett. Conserved sequences in a class of rare eukaryotic nuclear introns withnon-consensus splice sites. J Mol Biol, 239(3):357–65, Jun 10 1994.

224 BIBLIOGRAPHY
S.L. Hall and R.A. Padgett. Requirement of U12 snRNA for in vivo splicing of a minor class ofeukaryotic nuclear pre-mRNA introns. Science, 271(5256):1716–8, Mar 22 1996.
R.C. Hardison. Conserved noncoding sequences are reliable guides to regulatory elements. TrendsGenet, 16(9):369–72, Sep 2000.
R.C. Hardison, J. Oeltjen, and W. Miller. Long human-mouse sequence alignments reveal novel regu-latory elements: a reason to sequence the mouse genome. Genome Res, 7(10):959–66, Oct 1997.
M.P. Hare and S.R. Palumbi. High intron sequence conservation across three mammalian orderssuggests functional constraints. Mol Biol Evol, 20(6):969–78, Jun 2003.
T.W. Harris, N. Chen, F. Cunningham, M. Tello-Ruiz, I. Antoshechkin, C. Bastiani, T. Bieri, D. Blasiar,K. Bradnam, J. Chan, C.K. Chen, W.J. Chen, P. Davis, E. Kenny, R. Kishore, et al. WormBase: amulti-species resource for nematode biology and genomics. Nucleic Acids Res, 32(1):D411–7, Jan 12004.
P.M. Harrison, A. Kumar, N. Lang, M. Snyder, and M. Gerstein. A question of size: the eukaryoticproteome and the problems in defining it. Nucleic Acids Res, 30(5):1083–90, Mar 1 2002.
M.L. Hastings and A.R. Krainer. Pre-mRNA splicing in the new millennium. Curr Opin Cell Biol, 13(3):302–9, Jun 2001.
D.L. Hatfield and V.N. Gladyshev. How selenium has altered our understanding of the genetic code.Mol Cell Biol, 22(11):3565–76, Jun 2002.
M. Hattori, A. Fujiyama, T.D. Taylor, H. Watanabe, T. Yada, H.S. Park, A. Toyoda, K. Ishii, Y. Totoki,D.K. Choi, Y. Groner, E. Soeda, M. Ohki, T. Takagi, Y. Sakaki, et al. The DNA sequence of humanchromosome 21. Nature, 405(6784):311–9, May 18 2000.
T.P. Hausner, L.M. Giglio, and A.M. Weiner. Evidence for base-pairing between mammalian U2 andU6 small nuclear ribonucleoprotein particles. Genes Dev, 4(12A):2146–56, Dec 1990.
J. Healy, E.E. Thomas, J.T. Schwartz, and M. Wigler. Annotating large genomes with exact wordmatches. Genome Res, 13(10):2306–15, Oct 2003.
S. Heber, M. Alekseyev, S.H. Sze, H. Tang, and P.A. Pevzner. Splicing graphs and EST assemblyproblem. Bioinformatics, 18 Suppl 1:S181–8, Jul 2002.
J. Henderson, S. Salzberg, and K.H. Fasman. Finding genes in DNA with a Hidden Markov Model. JComput Biol, 4(2):127–41, Summer 1997.
M.W. Hentze and A.E. Kulozik. A perfect message: RNA surveillance and nonsense-mediated decay.Cell, 96(3):307–10, Feb 5 1999.
C. Hertz-Fowler, C.S. Peacock, V. Wood, M. Aslett, A. Kerhornou, P. Mooney, A. Tivey, M. Berriman,N. Hall, K. Rutherford, J. Parkhill, A.C. Ivens, M.A. Rajandream, and B. Barrell. GeneDB: a resourcefor prokaryotic and eukaryotic organisms. Nucleic Acids Res, 32 Database issue:D339–43, Jan 1 2004.
L.W. Hillier, W. Miller, E. Birney, W. Warren, R.C. Hardison, C.P. Ponting, P. Bork, D.W. Burt, M.A.Groenen, M.E. Delany, J.B. Dodgson, G. Fingerprint Map Sequence, Assembly, A.T. Chinwalla, P.F.Cliften, S.W. Clifton, and others (International Chicken Genome Sequencing Consortium, ICGSC;including J.F. Abril). Sequence and comparative analysis of the chicken genome provide uniqueperspectives on vertebrate evolution. Nature, 432(7018):695–716, Dec 9 2004.
H. Le Hir, E. Izaurralde, L.E. Maquat, and M.J. Moore. The spliceosome deposits multiple proteins20-24 nucleotides upstream of mRNA exon-exon junctions. EMBO J, 19(24):6860–9, Dec 15 2000.

BIBLIOGRAPHY 225
J.B. Hogenesch, K.A. Ching, S. Batalov, A.I. Su, J.R. Walker, Y. Zhou, S.A. Kay, P.G. Schultz, and M.P.Cooke. A comparison of the CELERA and ENSEMBL predicted gene sets reveals little overlap innovel genes. Cell, 106(4):413–5, Aug 24 2001.
R.A. Holt, G.M. Subramanian, A. Halpern, G.G. Sutton, R. Charlab, D.R. Nusskern, P. Wincker, A.G.Clark, J.M. Ribeiro, R. Wides, S.L. Salzberg, B. Loftus, M. Yandell, W.H. Majoros, D.B. Rusch, andothers (including J.F. Abril). The genome sequence of the malaria mosquito Anopheles gambiae.Science, 298(5591):129–49, Oct 4 2002.
S. Hoon, K.K. Ratnapu, J.M. Chia, B. Kumarasamy, X. Juguang, M. Clamp, A. Stabenau, S. Potter,L. Clarke, and E. Stupka. Biopipe: a flexible framework for protocol-based bioinformatics analy-sis. Genome Res, 13(8):1904–15, Aug 2003.
K.J. Howe, C.M. Kane, and J.r. Ares M. Perturbation of transcription elongation influences the fidelityof internal exon inclusion in Saccharomyces cerevisiae. RNA, 9(8):993–1006, Aug 2003.
X. Huang and W. Miller. A time-efficient, linear-space local similarity algorithm. Adv. Appl. Math.,12:337–357, 1991.
A.K. Hudek, J. Cheung, A.P. Boright, and S.W. Scherer. Genescript: DNA sequence annotationpipeline. Bioinformatics, 19(9):1177–8, Jun 12 2003.
G.B. Hutchinson and M.R. Hayden. The prediction of exons through an analysis of spliceable openreading frames. Nucleic Acids Res, 20(13):3453–62, Jul 11 1992.
R. Ierusalimschy, L. H. de Figueiredo, and W. Celes Filho. Lua—an extensible extension language.Softw. Pract. Exper., 26(6):635–652, 1996.
R. Incorvaia and R.A. Padgett. Base pairing with U6atac snRNA is required for 5’ splice site activa-tion of U12-dependent introns in vivo. RNA, 4(6):709–18, Jun 1998.
International Human Genome Sequencing Consortium, IHGSC. Finishing the euchromatic sequenceof the human genome. Nature, 431(7011):931–45, Oct 21 2004.
Y. Ishigaki, X. Li, G. Serin, and L.E. Maquat. Evidence for a pioneer round of mRNA translation:mRNAs subject to nonsense-mediated decay in mammalian cells are bound by CBP80 and CBP20.Cell, 106(5):607–17, Sep 7 2001.
IUPAC-IUB JCBN. IUPAC-IUB Joint Commission on Biochemical Nomenclature (JCBN). Nomen-clature and symbolism for amino acids and peptides. Recommendations 1983. Biochem J, 219(2):345–73, Apr 15 1984.
IUPAC-IUB JCBN. IUPAC-IUB Joint Commission on Biochemical Nomenclature (JCBN). Nomencla-ture and symbolism for amino acids and peptides. Corrections to recommendations 1983. Eur JBiochem, 213(1):2, Apr 1 1993.
I.J. Jackson. A reappraisal of non-consensus mRNA splice sites. Nucleic Acids Res, 19(14):3795–8, Jul25 1991.
O. Jaillon, C. Dossat, R. Eckenberg, K. Eiglmeier, B. Segurens, J.M. Aury, C.W. Roth, C. Scarpelli, P.T.Brey, J. Weissenbach, and P. Wincker. Assessing the Drosophila melanogaster and Anopheles gambiaegenome annotations using genome-wide sequence comparisons. Genome Res, 13(7):1595–9, Jul2003.
D.C. Jamison. Open bioinformatics. Bioinformatics, 19(6):679–80, Apr 12 2003.

226 BIBLIOGRAPHY
W. Jang, A. Hua, S.V. Spilson, W. Miller, B.A. Roe, and M.H. Meisler. Comparative sequence of humanand mouse BAC clones from the mnd2 region of chromosome 2p13. Genome Res, 9(1):53–61, Jan1999.
N. Jareborg and R. Durbin. Alfresco–a workbench for comparative genomic sequence analysis.Genome Res, 10(8):1148–57, Aug 2000.
A.G. Jegga, S.P. Sherwood, J.W. Carman, A.T. Pinski, J.L. Phillips, J.P. Pestian, and B.J. Aronow. De-tection and visualization of compositionally similar cis-regulatory element clusters in orthologousand coordinately controlled genes. Genome Res, 12(9):1408–17, Sep 2002.
R.A. Jensen. Orthologs and paralogs - we need to get it right. Genome Biol, 2(8):INTERACTIONS1002,2001.
K. Jungfer and P. Rodriguez-Tome. Mapplet: a CORBA-based genome map viewer.Bioinformatics, 14(8):734–8, 1998.
D. Kampa, J. Cheng, P. Kapranov, M. Yamanaka, S. Brubaker, S. Cawley, J. Drenkow, A. Piccolboni,S. Bekiranov, G. Helt, H. Tammana, and T.R. Gingeras. Novel RNAs identified from an in-depthanalysis of the transcriptome of human chromosomes 21 and 22. Genome Res, 14(3):331–42, Mar2004.
D. Karolchik, R. Baertsch, M. Diekhans, T.S. Furey, A. Hinrichs, Y.T. Lu, K.M. Roskin, M. Schwartz,C.W. Sugnet, D.J. Thomas, R.J. Weber, D. Haussler, and W.J. Kent. The UCSC GENOME BROWSERDatabase. Nucleic Acids Res, 31(1):51–4, Jan 1 2003.
D. Karolchik, A.S. Hinrichs, T.S. Furey, K.M. Roskin, C.W. Sugnet, D. Haussler, and W.J. Kent. TheUCSC TABLE BROWSER data retrieval tool. Nucleic Acids Res, 32(1):D493–6, Jan 1 2004.
L.P. Keegan, A. Gallo, and M.A. O’Connell. The many roles of an RNA editor. Nat Rev Genet, 2(11):869–78, Nov 2001.
C. Keller, M. Corcoran, and R.J. Roberts. Computer programs for handling nucleic acid sequences.Nucleic Acids Res, 12(1 Pt 1):379–86, Jan 11 1984.
W.J. Kent. BLAT—the BLAST-like alignment tool. Genome Res, 12(4):656–64, Apr 2002.
W.J. Kent, C.W. Sugnet, T.S. Furey, K.M. Roskin, T.H. Pringle, A.M. Zahler, and D. Haussler. Thehuman genome browser at UCSC. Genome Res, 12(6):996–1006, Jun 2002.
W.J. Kent and A.M. Zahler. Conservation, regulation, synteny, and introns in a large-scale C. briggsae-C. elegans genomic alignment. Genome Res, 10(8):1115–25, Aug 2000.
Paul Kitts. The NCBI handbook [Internet], chapter Genome Assembly and Annotation Process. NationalLibrary of Medicine (US), National Center for Biotechnology Information, Bethesda (MD), October2002. URL http://www.ncbi.nlm.nih.gov/books/bv.fcgi?rid=handbook.chapter.1440.
J. Kling. Ultrafast DNA sequencing. Nat Biotechnol, 21(12):1425–7, Dec 2003.
I. Kolossova and R.A. Padgett. U11 snRNA interacts in vivo with the 5’ splice site of U12-dependent(AU-AC) pre-mRNA introns. RNA, 3(3):227–33, Mar 1997.
M.M. Konarska and P.A. Sharp. Interactions between small nuclear ribonucleoprotein particles information of spliceosomes. Cell, 49(6):763–74, Jun 19 1987.
I. Korf, P. Flicek, D. Duan, and M.R. Brent. Integrating genomic homology into gene structure pre-diction. Bioinformatics, 17 Suppl 1:S140–8, 2001.
BIBLIOGRAPHY 227
A. Kozik, E. Kochetkova, and R. Michelmore. GenomePixelizer—a visualization program forcomparative genomics within and between species. Bioinformatics, 18(2):335–6, Feb 2002.
A. Krause, S.A. Haas, E. Coward, and M. Vingron. SYSTERS, GeneNest, SpliceNest: exploring se-quence space from genome to protein. Nucleic Acids Res, 30(1):299–300, Jan 1 2002.
A. Krogh. Two methods for improving performance of an HMM and their application for genefinding. Proc Int Conf Intell Syst Mol Biol, 5:179–86, 1997.
D. Kulp, D. Haussler, M. G. Reese, and F. H. Eeckman. “A Generalized Hidden Markov Model for theRecognition of Human Genes in DNA.”. In D. J. States, P. Agarwal, T. Gaasterland, L. Hunter, andR. Smith, editors, Proc Int Conf Intell Syst Mol Biol, volume 4, pages 134–142, Menlo Park, California,1996. AAAI press.
S. Kurtz, A. Phillippy, A.L. Delcher, M. Smoot, M. Shumway, C. Antonescu, and S.L. Salzberg. Versa-tile and open software for comparing large genomes. Genome Biol, 5(2):R12, 2004.
S. Kurtz and C. Schleiermacher. REPuter: fast computation of maximal repeats in complete genomes.Bioinformatics, 15(5):426–7, May 1999.
A.I. Lamond, M.M. Konarska, P.J. Grabowski, and P.A. Sharp. Spliceosome assembly involves thebinding and release of U4 small nuclear ribonucleoprotein. Proc Natl Acad Sci U S A, 85(2):411–5,Jan 1988.
L. Lamport. LATEX A Document Preparation System. Addison Wesley, second edition, 1994.
E.S. Lander, L.M. Linton, B. Birren, C. Nusbaum, M.C. Zody, J. Baldwin, K. Devon, K. Dewar,M. Doyle, W. FitzHugh, R. Funke, D. Gage, K. Harris, A. Heaford, J. Howland, and others (In-ternational Human Genome Sequencing Consortium, IHGSC). Initial sequencing and analysis ofthe human genome. Nature, 409(6822):860–921, Feb 15 2001.
A. Lefebvre, T. Lecroq, H. Dauchel, and J. Alexandre. FORRepeats: detects repeats on entire chro-mosomes and between genomes. Bioinformatics, 19(3):319–26, Feb 12 2003.
B. Lenhard, A. Sandelin, L. Mendoza, P. Engstrom, N. Jareborg, and W.W. Wasserman. Identificationof conserved regulatory elements by comparative genome analysis. J Biol, 2(2):13, 2003.
C. Letondal. A Web interface generator for molecular biology programs in Unix. Bioinformatics, 17(1):73–82, Jan 2001.
S.E. Lewis, S.M. Searle, N. Harris, M. Gibson, V. Lyer, J. Richter, C. Wiel, L. Bayraktaroglir, E. Birney,M.A. Crosby, J.S. Kaminker, B.B. Matthews, S.E. Prochnik, C.D. Smithy, J.L. Tupy, et al. Apollo: asequence annotation editor. Genome Biol, 3(12):RESEARCH0082, 2002.
F. Liang, I. Holt, G. Pertea, S. Karamycheva, S.L. Salzberg, and J. Quackenbush. Gene index analysisof the human genome estimates approximately 120,000 genes. Nat Genet, 25(2):239–40, Jun 2000.
H.X. Liu, M. Zhang, and A.R. Krainer. Identification of functional exonic splicing enhancer motifsrecognized by individual SR proteins. Genes Dev, 12(13):1998–2012, Jul 1 1998.
G.G. Loots, R.M. Locksley, C.M. Blankespoor, Z.E. Wang, W. Miller, E.M. Rubin, and K.A. Frazer.Identification of a coordinate regulator of interleukins 4, 13, and 5 by cross-species sequence com-parisons. Science, 288(5463):136–40, Apr 7 2000.
S. Lu and B.R. Cullen. Analysis of the stimulatory effect of splicing on mRNA production and uti-lization in mammalian cells. RNA, 9(5):618–30, May 2003.
228 BIBLIOGRAPHY
A.V. Lukashin and M. Borodovsky. GeneMark.hmm: new solutions for gene finding. Nucleic AcidsRes, 26(4):1107–15, Feb 15 1998.
J. Lund, F. Chen, A. Hua, B. Roe, M. Budarf, B.S. Emanuel, and R.H. Reeves. Comparative sequenceanalysis of 634 kb of the mouse chromosome 16 region of conserved synteny with the humanvelocardiofacial syndrome region on chromosome 22q11.2. Genomics, 63(3):374–83, Feb 1 2000.
H.R. Luo, G.A. Moreau, N. Levin, and M.J. Moore. The human Prp8 protein is a component of bothU2- and U12-dependent spliceosomes. RNA, 5(7):893–908, Jul 1999.
H.D. Madhani and C. Guthrie. A novel base-pairing interaction between U2 and U6 snRNAs suggestsa mechanism for the catalytic activation of the spliceosome. Cell, 71(5):803–17, Nov 27 1992.
E.M. Makarov, O.V. Makarova, H. Urlaub, M. Gentzel, C.L. Will, M. Wilm, and R. Luhrmann. Smallnuclear ribonucleoprotein remodeling during catalytic activation of the spliceosome. Science, 298(5601):2205–8, Dec 13 2002.
L. E. Maquat. Translational Control of Gene Expression, volume 39 of Cold Spring Harbor MonographSeries, chapter “Nonsense-mediated RNA decay in mammalian cells: a splicing-dependent meansto down-regulate the levels of mRNAs that premature terminate translation.”, pages 849–868. ColdSpring Harbor Laboratory Press, Cold Spring Harbor, NY (USA), 2000. ISBN 0-87969-618-4.
L.E. Maquat. When cells stop making sense: effects of nonsense codons on RNA metabolism invertebrate cells. RNA, 1(5):453–65, Jul 1995.
C. Mayor, M. Brudno, J.R. Schwartz, A. Poliakov, E.M. Rubin, K.A. Frazer, L.S. Pachter, andI. Dubchak. VISTA: visualizing global DNA sequence alignments of arbitrary length. Bioinfor-matics, 16(11):1046–7, Nov 2000.
T.S. McConnell, S.J. Cho, M.J. Frilander, and J.A. Steitz. Branchpoint selection in the splicing of U12-dependent introns in vitro. RNA, 8(5):579–86, May 2002.
S. McCracken, N. Fong, E. Rosonina, K. Yankulov, G. Brothers, D. Siderovski, A. Hessel, S. Foster,S. Shuman, and D.L. Bentley. 5’-Capping enzymes are targeted to pre-mRNA by binding to thephosphorylated carboxy-terminal domain of RNA polymerase II. Genes Dev, 11(24):3306–18, Dec15 1997a.
S. McCracken, N. Fong, K. Yankulov, S. Ballantyne, G. Pan, J. Greenblatt, S.D. Patterson, M. Wickens,and D.L. Bentley. The C-terminal domain of RNA polymerase II couples mRNA processing totranscription. Nature, 385(6614):357–61, Jan 23 1997b.
I.M. Meyer and R. Durbin. Comparative ab initio prediction of gene structures using pair HMMs.Bioinformatics, 18(10):1309–18, Oct 2002.
I.M. Meyer and R. Durbin. Gene structure conservation aids similarity based gene prediction. NucleicAcids Res, 32(2):776–83, 2004.
W. Miller. Comparison of genomic DNA sequences: solved and unsolved problems. Bioinformatics,17(5):391–7, May 2001.
B. Modrek, A. Resch, C. Grasso, and C. Lee. Genome-wide detection of alternative splicing in ex-pressed sequences of human genes. Nucleic Acids Res, 29(13):2850–9, Jul 1 2001.
S.B. Montgomery, T. Astakhova, M. Bilenky, E. Birney, T. Fu, M. Hassel, C. Melsopp, M. Rak, A.G.Robertson, M. Sleumer, A.S. Siddiqui, and S.J. Jones. Sockeye: a 3D environment for comparativegenomics. Genome Res, 14(5):956–62, May 2004.
BIBLIOGRAPHY 229
K.A. Montzka and J.A. Steitz. Additional low-abundance human small nuclear ribonucleoproteins:U11, U12, etc. Proc Natl Acad Sci U S A, 85(23):8885–9, Dec 1988.
R. Mott. EST_GENOME: a program to align spliced DNA sequences to unspliced genomic DNA.Comput Appl Biosci, 13(4):477–8, Aug 1997.
S.M. Mount. A catalogue of splice junction sequences. Nucleic Acids Res, 10(2):459–72, Jan 22 1982.
T. Mourier and D.C. Jeffares. Eukaryotic intron loss. Science, 300(5624):1393, May 30 2003.
C.J. Mungall, S. Misra, B.P. Berman, J. Carlson, E. Frise, N. Harris, B. Marshall, S. Shu, J.S. Kaminker,S.E. Prochnik, C.D. Smith, E. Smith, J.L. Tupy, C. Wiel, G.M. Rubin, et al. An integrated compu-tational pipeline and database to support whole-genome sequence annotation. Genome Biol, 3(12):RESEARCH0081, 2002.
R.J. Mural, M.D. Adams, E.W. Myers, H.O. Smith, G.L. Miklos, R. Wides, A. Halpern, P.W. Li, G.G.Sutton, J. Nadeau, S.L. Salzberg, R.A. Holt, C.D. Kodira, F. Lu, L. Chen, et al. A comparisonof whole-genome shotgun-derived mouse chromosome 16 and the human genome. Science, 296(5573):1661–71, May 31 2002.
P. Nadkarni. Mapmerge: merge genomic maps. Bioinformatics, 14(4):310–6, 1998.
NCBI. Gnomon, predicting gene structures in genomic DNA. URLhttp://www.ncbi.nlm.nih.gov/genome/guide/gnomon.html. unpublished 2003.
A. Nekrutenko, W.Y. Chung, and W.H. Li. An evolutionary approach reveals a high protein-codingcapacity of the human genome. Trends Genet, 19(6):306–10, Jun 2003.
A. Newman and C. Norman. Mutations in yeast U5 snRNA alter the specificity of 5’ splice-sitecleavage. Cell, 65(1):115–23, Apr 5 1991.
A.J. Newman and C. Norman. U5 snRNA interacts with exon sequences at 5’ and 3’ splice sites. Cell,68(4):743–54, Feb 21 1992.
A. Nott, S.H. Meislin, and M.J. Moore. A quantitative analysis of intron effects on mammalian geneexpression. RNA, 9(5):607–17, May 2003.
J.C. Oeltjen, T.M. Malley, D.M. Muzny, W. Miller, R.A. Gibbs, and J.W. Belmont. Large-scale compa-rative sequence analysis of the human and murine Bruton’s tyrosine kinase loci reveals conservedregulatory domains. Genome Res, 7(4):315–29, Apr 1997.
S.A. Olson. EMBOSSopens up sequence analysis. European Molecular Biology Open Software Suite.Brief Bioinform, 3(1):87–91, Mar 2002.
L.R. Otake, P. Scamborova, C. Hashimoto, and J.A. Steitz. The divergent U12-type spliceosome isrequired for pre-mRNA splicing and is essential for development in Drosophila. Mol Cell, 9(2):439–46, Feb 2002.
I. Ovcharenko and G.G. Loots. Comparative genomic tools for exploring the human genome. ColdSpring Harb Symp Quant Biol, 68:283–91, 2003a.
I. Ovcharenko and G.G. Loots. Finding the Needle in the Haystack: Computational Strategies forDiscovering Regulatory Sequences in Genomes. Current Genomics, 4(7):557–568, 2003b.
I. Ovcharenko, G.G. Loots, R.C. Hardison, W. Miller, and L. Stubbs. zPicture: dynamic alignmentand visualization tool for analyzing conservation profiles. Genome Res, 14(3):472–7, Mar 2004a.
230 BIBLIOGRAPHY
I. Ovcharenko, M.A. Nobrega, G.G. Loots, and L. Stubbs. ECR Browser: a tool for visualizing andaccessing data from comparisons of multiple vertebrate genomes. Nucleic Acids Res, 32(Web Serverissue):W280–6, Jul 1 2004b.
R. Overbeek, N. Larsen, T. Walunas, M. D’Souza, G. Pusch, J.r. Selkov E, K. Liolios, V. Joukov, D. Kaz-nadzey, I. Anderson, A. Bhattacharyya, H. Burd, W. Gardner, P. Hanke, V. Kapatral, et al. The ERGOgenome analysis and discovery system. Nucleic Acids Res, 31(1):164–71, Jan 1 2003.
F. Pagani and F.E. Baralle. Genomic variants in exons and introns: identifying the splicing spoilers.Nat Rev Genet, 5(5):389–96, May 2004.
Q. Pan, M.A. Bakowski, Q. Morris, W. Zhang, B.J. Frey, T.R. Hughes, and B.J. Blencowe. Alternativesplicing of conserved exons is frequently species-specific in human and mouse. Trends Genet, 21(2):73–7, Feb 2005.
J. Parkinson and M. Blaxter. SimiTri—visualizing similarity relationships for groups of sequences.Bioinformatics, 19(3):390–5, Feb 12 2003.
G. Parra, P. Agarwal, J.F. Abril, T. Wiehe, J.W. Fickett, and R. Guigó. Comparative gene prediction inhuman and mouse. Genome Res, 13(1):108–17, Jan 2003.
J.D. Parsons. Miropeats: graphical DNA sequence comparisons. Comput Appl Biosci, 11(6):615–9,Dec 1995.
E. Passarge, B. Horsthemke, and R.A. Farber. Incorrect use of the term synteny. Nat Genet, 23(4):387,Dec 1999.
A.A. Patel and J.A. Steitz. Splicing double: insights from the second spliceosome. Nat Rev Mol CellBiol, 4(12):960–70, Dec 2003.
W.R. Pearson and D.J. Lipman. Improved tools for biological sequence comparison. Proc Natl AcadSci U S A, 85(8):2444–8, Apr 1988.
C.N.S. Pedersen and T. Scharl. “Comparative Methods for Gene Structure Prediction in HomologousSequences.”. In R. Guigó and D. Gusfield, editors, “Algorithms in Bioinformatics”: Proceedings of theSecond International Workshop, WABI 2002, volume 2452 of Lecture Notes in Computer Science, pages220–234. Springer-Verlag, Berlin Heidelberg, 2002. ISBN 3-540-44211-1.
J.S. Pedersen and J. Hein. Gene finding with a hidden Markov model of genome structure and evo-lution. Bioinformatics, 19(2):219–27, Jan 22 2003.
L.A. Pennacchio. Insights from human/mouse genome comparisons. Mamm Genome, 14(7):429–36,Jul 2003.
L.A. Pennacchio, M. Olivier, J.A. Hubacek, J.C. Cohen, D.R. Cox, J.C. Fruchart, R.M. Krauss, and E.M.Rubin. An apolipoprotein influencing triglycerides in humans and mice revealed by comparativesequencing. Science, 294(5540):169–73, Oct 5 2001.
L.A. Pennacchio and E.M. Rubin. Genomic strategies to identify mammalian regulatory sequences.Nat Rev Genet, 2(2):100–9, Feb 2001.
L.A. Pennacchio and E.M. Rubin. Comparative genomic tools and databases: providing insights intothe human genome. J Clin Invest, 111(8):1099–106, Apr 2003.
E. Pennisi. Bioinformatics. Gene counters struggle to get the right answer. Science, 301(5636):1040–1,Aug 22 2003.

BIBLIOGRAPHY 231
S.C. Potter, L. Clarke, V. Curwen, S. Keenan, E. Mongin, S.M. Searle, A. Stabenau, R. Storey, andM. Clamp. The Ensembl analysis pipeline. Genome Res, 14(5):934–41, May 2004.
N.J. Proudfoot, A. Furger, and M.J. Dye. Integrating mRNA processing with transcription. Cell, 108(4):501–12, Feb 22 2002.
K.D. Pruitt and D.R. Maglott. REFSEQ and LOCUSLINK: NCBI gene-centered resources. Nucleic AcidsRes, 29(1):137–40, Jan 1 2001.
K.D. Pruitt, T. Tatusova, and D.R. Maglott. NCBI Reference Sequence (REFSEQ): a curated non-redundant sequence database of genomes, transcripts and proteins. Nucleic Acids Res, 33 DatabaseIssue:D501–4, Jan 1 2005.
J. Pustell and F.C. Kafatos. A convenient and adaptable package of DNA sequence analysis programsfor microcomputers. Nucleic Acids Res, 10(1):51–9, Jan 11 1982.
W.C. Ray, J.r. Munson RS, and C.J. Daniels. Tricross: using dot-plots in sequence-id space to detectuncataloged intergenic features. Bioinformatics, 17(12):1105–12, Dec 2001.
R. Reed. Initial splice-site recognition and pairing during pre-mRNA splicing. Curr Opin Genet Dev,6(2):215–20, Apr 1996.
M.G. Reese, G. Hartzell, N.L. Harris, U. Ohler, J.F. Abril, and S.E. Lewis. Genome annotation assess-ment in Drosophila melanogaster. Genome Res, 10(4):483–501, Apr 2000.
V.L. Reichert, H. Le Hir, M.S. Jurica, and M.J. Moore. 5’ exon interactions within the human spliceo-some establish a framework for exon junction complex structure and assembly. Genes Dev, 16(21):2778–91, Nov 1 2002.
K. Reichwald, J. Thiesen, T. Wiehe, J. Weitzel, W.A. Poustka, A. Rosenthal, M. Platzer, W.H. Stratling,and P. Kioschis. Comparative sequence analysis of the MECP2 -locus in human and mouse revealsnew transcribed regions. Mamm Genome, 11(3):182–90, Mar 2000.
Glenn C. Reid. PostScript Language Program Design. Addison-Wesley Publishing Company, Inc.,twelfth edition, March 1996. ISBN 0-201-14396-8.
D. Reisman, E. Eaton, D. McMillin, N.A. Doudican, and K. Boggs. Cloning and characterization ofmurine p53 upstream sequences reveals additional positive transcriptional regulatory elements.Gene, 274(1-2):129–37, Aug 22 2001.
S.Y. Rhee, W. Beavis, T.Z. Berardini, G. Chen, D. Dixon, A. Doyle, M. Garcia-Hernandez, E. Huala,G. Lander, M. Montoya, N. Miller, L.A. Mueller, S. Mundodi, L. Reiser, J. Tacklind, et al. The Ara-bidopsis Information Resource (TAIR): a model organism database providing a centralized, curatedgateway to Arabidopsis biology, research materials and community. Nucleic Acids Res, 31(1):224–8,Jan 1 2003.
P. Rice, I. Longden, and A. Bleasby. EMBOSS: the European Molecular Biology Open Software Suite.Trends Genet, 16(6):276–7, Jun 2000.
H. Roest Crollius, O. Jaillon, A. Bernot, C. Dasilva, L. Bouneau, C. Fischer, C. Fizames, P. Wincker,P. Brottier, F. Quetier, W. Saurin, and J. Weissenbach. Estimate of human gene number providedby genome-wide analysis using Tetraodon nigroviridis DNA sequence. Nat Genet, 25(2):235–8, Jun2000.
S. Rogic, A.K. Mackworth, and F.B. Ouellette. Evaluation of gene-finding programs on mammaliansequences. Genome Res, 11(5):817–32, May 2001.
232 BIBLIOGRAPHY
I.B. Rogozin and Y.I. Pavlov. Theoretical analysis of mutation hotspots and their DNA sequencecontext specificity. Mutat Res, 544(1):65–85, Sep 2003.
S.W. Roy. Recent evidence for the exon theory of genes. Genetica, 118(2-3):251–66, Jul 2003.
K. Rutherford, J. Parkhill, J. Crook, T. Horsnell, P. Rice, M.A. Rajandream, and B. Barrell. Artemis:sequence visualization and annotation. Bioinformatics, 16(10):944–5, Oct 2000.
W.S. Ryu and J.E. Mertz. Simian virus 40 late transcripts lacking excisable intervening sequences aredefective in both stability in the nucleus and transport to the cytoplasm. J Virol, 63(10):4386–94,Oct 1989.
A.A. Salamov and V.V. Solovyev. Ab initio gene finding in Drosophila genomic DNA. Genome Res, 10(4):516–22, Apr 2000.
S. Salzberg, A.L. Delcher, K.H. Fasman, and J. Henderson. A decision tree system for finding genesin DNA. J Comput Biol, 5(4):667–80, Winter 1998.
A. Sandelin, W.W. Wasserman, and B. Lenhard. ConSite: web-based prediction of regulatory el-ements using cross-species comparison. Nucleic Acids Res, 32(Web Server issue):W249–52, Jul 12004.
N. Sato and S. Ehira. GenoMap, a circular genome data viewer. Bioinformatics, 19(12):1583–4, Aug 122003.
T.D. Schaal and T. Maniatis. Multiple distinct splicing enhancers in the protein-coding sequences ofa constitutively spliced pre-mRNA. Mol Cell Biol, 19(1):261–73, Jan 1999.
C. Schneider, C.L. Will, O.V. Makarova, E.M. Makarov, and R. Luhrmann. Human U4/U6.U5 andU4atac/U6atac.U5 tri-snRNPs exhibit similar protein compositions. Mol Cell Biol, 22(10):3219–29, May 2002.
T.D. Schneider and R.M. Stephens. Sequence logos: a new way to display consensus sequences.Nucleic Acids Res, 18(20):6097–100, Oct 25 1990.
S. Schwartz, L. Elnitski, M. Li, M. Weirauch, C. Riemer, A. Smit, E.D. Green, R.C. Hardison, andW. Miller. MultiPipMaker and supporting tools: Alignments and analysis of multiple genomicDNA sequences. Nucleic Acids Res, 31(13):3518–24, Jul 1 2003a.
S. Schwartz, W.J. Kent, A. Smit, Z. Zhang, R. Baertsch, R.C. Hardison, D. Haussler, and W. Miller.Human-mouse alignments with BLASTZ. Genome Res, 13(1):103–7, Jan 2003b.
S. Schwartz, W. Miller, C.M. Yang, and R.C. Hardison. Software tools for analyzing pairwise align-ments of long sequences. Nucleic Acids Res, 19(17):4663–7, Sep 11 1991.
S. Schwartz, Z. Zhang, K.A. Frazer, A. Smit, C. Riemer, J. Bouck, R. Gibbs, R. Hardison, and W. Miller.PipMaker—a web server for aligning two genomic DNA sequences. Genome Res, 10(4):577–86,Apr 2000.
S.M. Searle, J. Gilbert, V. Iyer, and M. Clamp. The otter annotation system. Genome Res, 14(5):963–70, May 2004.
D.B. Searls. Doing sequence analysis with your printer. Comput Appl Biosci, 9(4):421–6, Aug 1993.
D.B. Searls. bioTk: componentry for genome informatics graphical user interfaces. Gene, 163(2):GC1–16, Oct 3 1995.

BIBLIOGRAPHY 233
P. Senapathy, M.B. Shapiro, and N.L. Harris. Splice junctions, branch point sites, and exons: sequencestatistics, identification, and applications to genome project. Methods Enzymol, 183:252–78, 1990.
P.A. Sharp and C.B. Burge. Classification of introns: U2-type or U12-type. Cell, 91(7):875–9, Dec 261997.
J.C. Shepherd. Method to determine the reading frame of a protein from the purine/pyrimidinegenome sequence and its possible evolutionary justification. Proc Natl Acad Sci U S A, 78(3):1596–600, Mar 1981.
S.T. Sherry, M.H. Ward, M. Kholodov, J. Baker, L. Phan, E.M. Smigielski, and K. Sirotkin. DBSNP: theNCBI database of genetic variation. Nucleic Acids Res, 29(1):308–11, Jan 1 2001.
A. Siepel and D. Haussler. Phylogenetic estimation of context-dependent substitution rates by maxi-mum likelihood. Mol Biol Evol, 21(3):468–88, Mar 2004.
G.S. Slater and E. Birney. Automated generation of heuristics for biological sequence comparison.BMC Bioinformatics, 6(1):31, Feb 15 2005.
A.F.A. Smit, R. Hubley, and P. Green. RepeatMasker. URL http://www.repeatmasker.org/.unpublished 1996–2004.
M.W. Smith. Structure of vertebrate genes: a statistical analysis implicating selection. J Mol Evol, 27(1):45–55, 1988.
M.E. Smoot, S.A. Guerlain, and W.R. Pearson. Visualization of near optimal sequence alignments.Bioinformatics, Jan 29 2004.
E.E. Snyder and G.D. Stormo. Identification of coding regions in genomic DNA sequences: an ap-plication of dynamic programming and neural networks. Nucleic Acids Res, 21(3):607–13, Feb 111993.
V.V. Solovyev, A.A. Salamov, and C.B. Lawrence. Predicting internal exons by oligonucleotide com-position and discriminant analysis of spliceable open reading frames. Nucleic Acids Res, 22(24):5156–63, Dec 11 1994.
E.L. Sonnhammer and R. Durbin. A workbench for large-scale sequence homology analysis. ComputAppl Biosci, 10(3):301–7, Jun 1994.
E.L. Sonnhammer and R. Durbin. A dot-matrix program with dynamic threshold control suited forgenomic DNA and protein sequence analysis. Gene, 167(1-2):GC1–10, Dec 29 1995.
E.J. Sontheimer and J.A. Steitz. The U5 and U6 small nuclear RNAs as active site components of thespliceosome. Science, 262(5142):1989–96, Dec 24 1993.
R. Sorek and G. Ast. Intronic sequences flanking alternatively spliced exons are conserved betweenhuman and mouse. Genome Res, 13(7):1631–7, Jul 2003.
R. Staden. An interactive graphics program for comparing and aligning nucleic acid and amino acidsequences. Nucleic Acids Res, 10(9):2951–61, May 11 1982.
R. Staden. Computer methods to locate signals in nucleic acid sequences. Nucleic Acids Res, 12(1 Pt2):505–19, Jan 11 1984a.
R. Staden. Graphic methods to determine the function of nucleic acid sequences. Nucleic Acids Res,12(1 Pt 2):521–38, Jan 11 1984b.
234 BIBLIOGRAPHY
R. Staden. The current status and portability of our sequence handling software. Nucleic Acids Res,14(1):217–31, Jan 10 1986.
R. Staden. Methods to define and locate patterns of motifs in sequences. Comput Appl Biosci, 4(1):53–60, Mar 1988.
R. Staden, K.F. Beal, and J.K. Bonfield. The Staden package, 1998. Methods Mol Biol, 132:115–30, 2000.
R. Staden and A.D. McLachlan. Codon preference and its use in identifying protein coding regionsin long DNA sequences. Nucleic Acids Res, 10(1):141–56, Jan 11 1982.
J.E. Stajich, D. Block, K. Boulez, S.E. Brenner, S.A. Chervitz, C. Dagdigian, G. Fuellen, J.G. Gilbert,I. Korf, H. Lapp, H. Lehvaslaiho, C. Matsalla, C.J. Mungall, B.I. Osborne, M.R. Pocock, et al. TheBioperl toolkit: Perl modules for the life sciences. Genome Res, 12(10):1611–8, Oct 2002.
J. Stalker, B. Gibbins, P. Meidl, J. Smith, W. Spooner, H.R. Hotz, and A.V. Cox. The ENSEMBL Web site:mechanics of a genome browser. Genome Res, 14(5):951–5, May 2004.
M. Stanke and S. Waack. Gene prediction with a hidden Markov model and a new intron submodel.Bioinformatics, 19 Suppl 2:II215–II225, Oct 2003.
L. Stein. Genome annotation: from sequence to biology. Nat Rev Genet, 2(7):493–503, Jul 2001.
L.D. Stein, S. Cartinhour, D. Thierry-Mieg, and J. Thierry-Mieg. JADE: an approach for interconnect-ing bioinformatics databases. Gene, 209(1-2):GC39–GC43, Mar 16 1998.
L.D. Stein, C. Mungall, S. Shu, M. Caudy, M. Mangone, A. Day, E. Nickerson, J.E. Stajich, T.W. Harris,A. Arva, and S. Lewis. The generic genome browser : a building block for a model organismsystem database. Genome Res, 12(10):1599–610, Oct 2002.
L.D. Stein and J. Thierry-Mieg. Scriptable access to the Caenorhabditis elegans genome sequence andother ACEDBdatabases. Genome Res, 8(12):1308–15, Dec 1998.
R. Stevens, C. Goble, P. Baker, and A. Brass. A classification of tasks in bioinformatics. Bioinformatics,17(2):180–8, Feb 2001.
A. Stoltzfus, J.r. Logsdon JM, J.D. Palmer, and W.F. Doolittle. Intron “sliding” and the diversity ofintron positions. Proc Natl Acad Sci U S A, 94(20):10739–44, Sep 30 1997.
G. Storz. An expanding universe of noncoding RNAs. Science, 296(5571):1260–3, May 17 2002.
C. Suter-Crazzolara and G. Kurapkat. An infrastructure for comparative genomics to functionallycharacterize genes and proteins. Genome Inform Ser Workshop Genome Inform, 11:24–32, 2000.
A.V. Sverdlov, V.N. Babenko, I.B. Rogozin, and E.V. Koonin. Preferential loss and gain of introns in3′ portions of genes suggests a reverse-transcription mechanism of intron insertion. Gene, 338(1):85–91, Aug 18 2004.
A.V. Sverdlov, I.B. Rogozin, V.N. Babenko, and E.V. Koonin. Conservation versus parallel gains inintron evolution. Nucleic Acids Res, 33(6):1741–8, 2005.
A. Taneda. ADplot: detection and visualization of repetitive patterns in complete genomes. Bioin-formatics, 20(5):701–8, Mar 22 2004.
W.Y. Tarn and J.A. Steitz. A novel spliceosome containing U11, U12, and U5 snRNPs excises a minorclass (AT-AC) intron in vitro. Cell, 84(5):801–11, Mar 8 1996.

BIBLIOGRAPHY 235
T.A. Thanaraj, F. Clark, and J. Muilu. Conservation of human alternative splice events in mouse.Nucleic Acids Res, 31(10):2544–52, May 15 2003.
T.A. Thanaraj, S. Stamm, F. Clark, J.J. Riethoven, V. Le Texier, and J. Muilu. ASD: the AlternativeSplicing Database. Nucleic Acids Res, 32 Database issue:D64–9, Jan 1 2004.
The FlyBase Consortium. The FlyBase database of the Drosophila genome projects and communityliterature. Nucleic Acids Res, 31(1):172–5, Jan 1 2003.
A. Thomas and M.H. Skolnick. A probabilistic model for detecting coding regions in DNA sequences.IMA J Math Appl Med Biol, 11(3):149–60, 1994.
J.W. Thomas and J.W. Touchman. Vertebrate genome sequencing: building a backbone for compara-tive genomics. Trends Genet, 18(2):104–8, Feb 2002.
J.W. Thomas, J.W. Touchman, R.W. Blakesley, G.G. Bouffard, S.M. Beckstrom-Sternberg, E.H. Mar-gulies, M. Blanchette, A.C. Siepel, P.J. Thomas, J.C. McDowell, B. Maskeri, N.F. Hansen, M.S.Schwartz, R.J. Weber, W.J. Kent, et al. Comparative analyses of multi-species sequences from tar-geted genomic regions. Nature, 424(6950):788–93, Aug 14 2003.
J.D. Tisdall. Mastering Perl for Bioinformatics. O’Reilly & Associates, Inc., first edition, September 2003.ISBN 0-596-00307-2.
M. Tompa. Identifying functional elements by comparative DNA sequence analysis. Genome Res, 11(7):1143–4, Jul 2001.
A. Toyoda, H. Noguchi, T.D. Taylor, T. Ito, M.T. Pletcher, Y. Sakaki, R.H. Reeves, and M. Hattori.Comparative genomic sequence analysis of the human chromosome 21 Down syndrome criticalregion. Genome Res, 12(9):1323–32, Sep 2002.
E.R. Tufte. The Visual Display of Quantitative Information. Graphics Press USA, second edition, January2001. ISBN 0-961-39214-2.
E.C. Uberbacher and R.J. Mural. Locating protein-coding regions in human DNA sequences by amultiple sensor-neural network approach. Proc Natl Acad Sci U S A, 88(24):11261–5, Dec 15 1991.
Y. Ueno, M. Arita, T. Kumagai, and K. Asai. Processing sequence annotation data using the Luaprogramming language. Genome Inform Ser Workshop Genome Inform, 14:154–63, 2003.
A. Ureta-Vidal, L. Ettwiller, and E. Birney. Comparative genomics: genome-wide analysis in meta-zoan eukaryotes. Nat Rev Genet, 4(4):251–62, Apr 2003.
J. Usuka and V. Brendel. Gene structure prediction by spliced alignment of genomic DNA withprotein sequences: increased accuracy by differential splice site scoring. J Mol Biol, 297(5):1075–85,Apr 14 2000.
J.C. Venter, M.D. Adams, E.W. Myers, P.W. Li, R.J. Mural, G.G. Sutton, H.O. Smith, M. Yandell, C.A.Evans, R.A. Holt, J.D. Gocayne, P. Amanatides, R.M. Ballew, D.H. Huson, J.R. Wortman, and others(including J.F. Abril). The sequence of the human genome. Science, 291(5507):1304–51, Feb 16 2001.
Y. Wada, K. Inoue, K. Ohga, and H. Yasue. Software tool for gene mapping: gRanch. Comput ApplBiosci, 13(3):323–4, Jun 1997.
D.R. Walker and E.V. Koonin. SEALS: a system for easy analysis of lots of sequences. Proc Int ConfIntell Syst Mol Biol, 5:333–9, 1997.
S. Walsh, M. Anderson, and S.W. Cartinhour. ACEDB: a database for genome information.MethodsBiochem Anal, 39:299–318, 1998.

236 BIBLIOGRAPHY
Z. Wang, M.E. Rolish, G. Yeo, V. Tung, M. Mawson, and C.B. Burge. Systematic identification andanalysis of exonic splicing silencers. Cell, 119(6):831–45, Dec 17 2004.
D.A. Wassarman and J.A. Steitz. Interactions of small nuclear RNA’s with precursor messenger RNAduring in vitro splicing. Science, 257(5078):1918–25, Sep 25 1992.
R.H. Waterston, K. Lindblad-Toh, E. Birney, J. Rogers, J.F. Abril, P. Agarwal, R. Agarwala, R. Ain-scough, M. Alexandersson, P. An, S.E. Antonarakis, J. Attwood, R. Baertsch, J. Bailey, K. Barlow,and others (International Mouse Genome Sequencing Consortium, IMGSC). Initial sequencing andcomparative analysis of the mouse genome. Nature, 420(6915):520–62, Dec 5 2002.
S.J. Wheelan, D.M. Church, and J.M. Ostell. Spidey: a tool for mRNA-to-genomic alignments. Ge-nome Res, 11(11):1952–7, Nov 2001.
D.L. Wheeler, T. Barrett, D.A. Benson, S.H. Bryant, K. Canese, D.M. Church, M. DiCuccio, R. Edgar,S. Federhen, W. Helmberg, D.L. Kenton, O. Khovayko, D.J. Lipman, T.L. Madden, D.R. Maglott,et al. Database resources of the National Center for Biotechnology Information. Nucleic Acids Res,33 Database Issue:D39–45, Jan 1 2005.
D.L. Wheeler, D.M. Church, A.E. Lash, D.D. Leipe, T.L. Madden, J.U. Pontius, G.D. Schuler, L.M.Schriml, T.A. Tatusova, L. Wagner, and B.A. Rapp. Database resources of the National Center forBiotechnology Information: 2002 update. Nucleic Acids Res, 30(1):13–6, Jan 1 2002.
H.L. Wiegand, S. Lu, and B.R. Cullen. Exon junction complexes mediate the enhancing effect ofsplicing on mRNA expression. Proc Natl Acad Sci U S A, 100(20):11327–32, Sep 30 2003.
T. Wiehe, S. Gebauer-Jung, T. Mitchell-Olds, and R. Guigo. SGP-1: prediction and validation ofhomologous genes based on sequence alignments. Genome Res, 11(9):1574–83, Sep 2001.
T. Wiehe, R. Guigó, and W. Miller. Genome sequence comparisons: hurdles in the fast lane to func-tional genomics. Brief Bioinform, 1(4):381–8, Nov 2000.
C.L. Will, C. Schneider, A.M. MacMillan, N.F. Katopodis, G. Neubauer, M. Wilm, R. Luhrmann, andC.C. Query. A novel U2 and U11/U12 snRNP protein that associates with the pre-mRNA branchsite. EMBO J, 20(16):4536–46, Aug 15 2001.
C.L. Will, C. Schneider, R. Reed, and R. Luhrmann. Identification of both shared and distinct proteinsin the major and minor spliceosomes. Science, 284(5422):2003–5, Jun 18 1999.
M.D. Wilson, C. Riemer, D.W. Martindale, P. Schnupf, A.P. Boright, T.L. Cheung, D.M. Hardy,S. Schwartz, S.W. Scherer, L.C. Tsui, W. Miller, and B.F. Koop. Comparative analysis of the gene-dense ACHE/TFR2 region on human chromosome 7q22 with the orthologous region on mousechromosome 5. Nucleic Acids Res, 29(6):1352–65, Mar 15 2001.
V. Wood, R. Gwilliam, M.A. Rajandream, M. Lyne, R. Lyne, A. Stewart, J. Sgouros, N. Peat, J. Hayles,S. Baker, D. Basham, S. Bowman, K. Brooks, D. Brown, S. Brown, et al. The genome sequence ofSchizosaccharomyces pombe. Nature, 415(6874):871–80, Feb 21 2002.
L. Woodley and J. Valcárcel. Regulation of alternative pre-mRNA splicing. Briefings in FunctionalGenomics and Proteomics, 1(3):266–77, Oct 2002.
F.A. Wright, W.J. Lemon, W.D. Zhao, R. Sears, D. Zhuo, J.P. Wang, H.Y. Yang, T. Baer, D. Stredney,J. Spitzner, A. Stutz, R. Krahe, and B. Yuan. A draft annotation and overview of the human genome.Genome Biol, 2(7):RESEARCH0025, 2001.
J.A. Wu and J.L. Manley. Base pairing between U2 and U6 snRNAs is necessary for splicing of amammalian pre-mRNA. Nature, 352(6338):818–21, Aug 29 1991.

BIBLIOGRAPHY 237
Q. Wu and A.R. Krainer. Splicing of a divergent subclass of AT-AC introns requires the major spliceo-somal snRNAs. RNA, 3(6):586–601, Jun 1997.
J.R. Wyatt, E.J. Sontheimer, and J.A. Steitz. Site-specific cross-linking of mammalian U5 snRNP to the5’ splice site before the first step of pre-mRNA splicing. Genes Dev, 6(12B):2542–53, Dec 1992.
Y. Xu, J.R. Einstein, R.J. Mural, M. Shah, and E.C. Uberbacher. An improved system for exon recog-nition and gene modeling in human DNA sequences. Proc Int Conf Intell Syst Mol Biol, 2:376–84,1994a.
Y. Xu, R.J. Mural, and E.C. Uberbacher. Constructing gene models from accurately predicted exons:an application of dynamic programming. Comput Appl Biosci, 10(6):613–23, Dec 1994b.
Y. Xu, R.J. Mural, and E.C. Uberbacher. Inferring gene structures in genomic sequences using patternrecognition and expressed sequence tags. Proc Int Conf Intell Syst Mol Biol, 5:344–53, 1997.
Z. Xuan, J. Wang, and M.Q. Zhang. Computational comparison of two mouse draft genomes and thehuman golden path. Genome Biol, 4(1):R1, 2003.
J. Yang, J. Wang, Z.J. Yao, Q. Jin, Y. Shen, and R. Chen. GenomeComp: a visualization tool for microbialgenome comparison. J Microbiol Methods, 54(3):423–6, Sep 2003.
K. Yankulov, J. Blau, T. Purton, S. Roberts, and D.L. Bentley. Transcriptional elongation by RNApolymerase II is stimulated by transactivators. Cell, 77(5):749–59, Jun 3 1994.
R.F. Yeh, L.P. Lim, and C.B. Burge. Computational inference of homologous gene structures in thehuman genome. Genome Res, 11(5):803–16, May 2001.
Y.T. Yu and J.A. Steitz. Site-specific crosslinking of mammalian U11 and U6atac to the 5’ splice siteof an AT-AC intron. Proc Natl Acad Sci U S A, 94(12):6030–5, Jun 10 1997.
N. Yuhki, T. Beck, R.M. Stephens, Y. Nishigaki, K. Newmann, and S.J. O’Brien. Comparative genomeorganization of human, murine, and feline MHC class II region. Genome Res, 13(6A):1169–79, Jun2003.
M.Q. Zhang. Identification of protein coding regions in the human genome by quadratic discriminantanalysis. Proc Natl Acad Sci U S A, 94(2):565–8, Jan 21 1997.
M.Q. Zhang. Computational prediction of eukaryotic protein-coding genes. Nat Rev Genet, 3(9):698–709, Sep 2002.
X.H. Zhang and L.A. Chasin. Computational definition of sequence motifs governing constitutiveexon splicing. Genes Dev, 18(11):1241–50, Jun 1 2004.
Z. Zhang, S. Schwartz, L. Wagner, and W. Miller. A greedy algorithm for aligning DNA sequences. JComput Biol, 7(1-2):203–14, Feb-Apr 2000.
D.A. Zorio and D.L. Bentley. The link between mRNA processing and transcription: communicationworks both ways. Exp Cell Res, 296(1):91–7, May 15 2004.


Index
Aab initio
gene finding, see gene findingacceptor site, 4, 9, 107, 207algorithm, 3, 11, 12, 207
alignment, 149, 153comparison, 154
dynamic programming, 14, 15gene finding, 155Viterbi, 13
alignment, 154boxed, 180score, 179ungapped, see ungapped alignment
alternative splicing, 2, 4, 5, 9, 105, 108, 182database, see ASD
amino acid, 97, 203, 206level, 180selenocysteine, 206usage bias, 12
analysispipeline, see annotation, pipelineprotocol, 154
ancient repeat, see repeat, ancientannotation, vii, 11, 207
browser, 149, 152ibid, see genome browser
see also softwaredataset, 10feature, 214genomic sequence, 9manual, see manual curationpipeline, 10, 16–17, 19, 152, 183, 187
ASAP,17Biopipe, 17BOP,17ENSEMBL, 13, 17, 150, 182Genescript, 17NCBI, 13
Pise, 17PLAN,17SEALS,17SGP2-based,18, 19
repeats, 215visualizing,
see software, visualization toolworkbench, see annotation browser
Anopheles gambiae, see mosquitoArabidopsis thaliana, 150ASD, 10AT-AC intron, see U12 intron
Bbackground distribution, 178bacteria, 211
chromosome, 155binding site, 211Bioinformatics, vii, 5bioinformatic tool, see softwareBiology, viibitmap, 156Blochmannia floridanus, 157box-plot, 53branch point, 4, 5, 98, 99, 210
CCaenorhabditis elegans, 150canonical, 98carboxyl-terminal domain, 104cDNA, 181CDS, see coding sequencecell
membranous organelles, 211mitochondria, 208, 209nucleus, 1, 2, 207–209
cellular function, 1chicken, 10, 19, 108
genome, 187
239

240 INDEX
splice site, 188chromosome, 1, 6, 154, 209, 212
assembly, 16bacterial,
see bacteria, chromosomemap, 150, 215
circularchromosome,
see bacteria, chromosomemap, 155
codingdensity, 52exon, 155, 182
codonsynonymous, 206termination, see stop codonusage, 12
command-line, 17, 149, 215comparative
analysis, 6, 9, 149, 155, 177human-mouse, 215
genomics, 157, 180gene finding,
see gene findingsplicing prediction, 188
computer program, see softwareconsensus
sequence, 4, 98, 100, 184, 208splice site signal, 5
conservedblock, 107exonic structure, 16, 183linkages, 208non-coding region, 154splice site, 188
constitutive exon, 105, 108constraint, 150correlation, 211
coefficient, 51CpG island, 182cross species variation, 16customization parameter, 188cytoplasm, 1
Ddata
acquisition, viimining, viii, 5
database, viii, 3, 10, 12, 19, 95ACEDB, 150, 213browser, 149–150, 152, 184
ibid, see genome browsersee also software
ENSEMBL, see ENSEMBLDBSNP, 184EBI, 4ENTREZ, 215FLYBASE, 17, 150, 214GENBANK, 182GRAMENE, 214HOMOLOGENE, 150MGD, 150MGI, 214NCBI, 4RGD, 214SGD, 150, 214TAIR, 150, 214UCSC, 4WORMBASE, 150, 214ZOO, 151
dataset, 10, 51, 52, 154, 213annotation, see annotation, datasettraining, see training dataset
deterministic, 97device-independent, 157distributed annotation system, 150, 208divergence, 107DNA, 11, 203, 209
alphabet, 205sequence, 1
donor site, 4, 9, 107, 208dot-plot, 152–153, 208Drosophila melanogaster, see fruitflydynamic programing, 13
Eelongation
efficiency, 105rate, 105
ENCODE project, 10, 53, 181, 216enhancer, 211ENSEMBL, 4–6, 150, 151, 184, 213EST
evidence, 182eukaryote, 1, 5, 97, 208eukaryotic

INDEX 241
gene, 2, 9, 97genome, 108, 187, 214
evaluation, see gene finding, evaluationevolution, 12evolutionary
conserved region, 153constraint, 11Hidden Markov Model,
see gene finding, EHMMmodel, 16
exon, 2, 209, 212average prediction accuracy, 52boundaries, 51coding, see coding, exonconstitutive, see constitutive exonreal, 51skipped, 105UTR, see untranslated region
exon-definition model, 106, 209exon-intron junction, see splice siteexon-junction complex, 106exonic
signal, 9structure, 2, 9, 10, 15, 108, 179, 180
conservation, 187
Ffilter, 17first-order markov model, 177, 178free software, 10fruitfly, vii, 10, 150
GASP, 52, 67–88, 215poster, 87
genome, 161–165, 187database, see FLYBASEmap, 157, 164, 188
functionalcoding region, 16constraint, 11, 16element, 155, 181non-coding region, 16
fungi, 108
GG+C content, 207Gallus gallus, see chickengene, 1, 209
annotation track, 150
catalog, 181, 183eukaryotic, see eukaryotic, geneexpression, 3–5, 106, 154, 183function, 12homolog, 9, 15, 53, 150, 207, 209known, 10, 12, 182multi-exonic, 2novel, 12ortholog, 151, 210orthologous, 5, 10, 15, 108, 179, 187paralog, 210predicted, 52, 182prediction, see gene findingpredictions, 10, 214prokaryotic, 2protein-coding, 1, 108, 183, 212real, 52single exon, 2, 52, 106structure, 9, 11, 12, 16, 52
geneid, 12, 16, 19, 53, 187, 214, 216flowchart, 14
generalizedHidden Markov Model,
see gene finding, GHMMPair Hidden Markov Model,
see gene finding, GPHMMgeneral feature format, 153, 155–157, 214genetic
code, 97, 206gene finding, 1, 153
ab initio, 11–13, 19, 53comparative genomics, 12, 14–16, 53,
150evaluation, 51, 187
accuracy, 51, 213CC, see correlation coefficientexon level, 51, 52gene level, 51JG, see joined geneME, see missing exonMG, see missing genenucleotide level, 51SG, see split geneSn, see sensitivitySnSp, see exon,
average prediction accuracySp, see specificityWE, see wrong exon

242 INDEX
WG, see wrong genehomology-based, 12–14linguistic method, 13Markov model
EHMM, 16GHMM, 13, 15GPHMM, 15HMM, 4, 150, 209PHMM, 15phylo-HMM, 16, 184
neural network, 13neural networks, 4, 210
gene transfer format, 214genome, 11, 209
annotation, 10assembly, 150browser, 4, 5, 149–209cartography, 149chicken, see chicken genomecomplexity, 182eukaryotic, see eukaryotic genomehuman, see human genomemouse, see mouse genomepipeline, see annotation, pipelineproject, vii, 12rat, see rat genomesequence, 1, 16, 181
annotation, see annotation,genomic sequence
sequencing consortium, 9chicken (ICGSC), 138, 182human (IHGSC), vii, 1, 182mouse (IMGSC), 31, 182rat (RGSPC), 113
genomicannotation, 157feature annotation, 155, 188sequence, 12
single-exon gene, 213variant, 184
GFF, see general feature formatgff2aplot, 10, 18, 153, 173–177, 188, 214
flowchart, 156gff2aplot, 184gff2ps, 10, 18, 149, 155, 157–161, 179,
188, 215flowchart, 156
gff2ps, 184
GNU-GPL, 10, 201GTF, see gene transfer format
HHidden Markov Model,
see gene finding, HMMhierarchical structure, 157highthroughput, 17homolog
gene, see gene, homologhomology
evidence, 14region, 151search, 1, 3, 17
homology-basedgene finding, see gene finding
humancell, 106chromosome
7, 1818, 15310, 15121, 107, 18222, 53, 182Y, 53
gene, 3, 181number, 2, 181, 182
genome, vii, 1, 2, 6, 10, 16, 105, 165–169, 187
map, 157, 168, 188project, 185
intron, 109, 188novel gene, 12, 215repeats, 110splice site, 100
human-mousecomparative analysis, 19, 53, 182conserved exonic structure, 95, 187homology maps, 150synteny, 151, 152
hydroxyl, 98, 210
Iinformation, vii, 208
content, 177intergenic region, 107, 213internet, viii, 10intron, 2, 4, 97, 210, 212

INDEX 243
AT-AC, see U12 intronconservation, 107length, 109major class, see U2 intronminor class, see U12 intronorthologous, 109specification, 188
intron-definition model, 210in vitro, 102in vivo, 103, 104, 184
Jjoined gene, 52
Kkinetic coupling, 105known gene, see gene, knownKullback-Leiber distance,
see relative entropy
Llariat, 98, 210likelihood ratio, 16linear map, 155log-odds, 178low complexity sequence,
see sequence, low complexity
Mmammal, 2, 9, 102mammalian
cell, 105gene, 97genome, 98splice site, 188
manual curation, 5, 16Markov Model,
see gene finding, Markov modelmetazoan, 108, 184
genome, 213missing
exon, 52gene, 52
missprediction, 3mitochondria, see cellmosquito, 157
genome, 169–173map, 157, 172, 188
mouse, 10, 19, 108, 150
chromosome16, 157Y, 53
genome, 10, 16, 187assembly, 182database, see MGD
intron, 109novel gene, 12repeats, 110splice site, 100
mRNA, see RNA, messengerMus musculus, see mouse
NNetwork File System, 19NMD, see nonsense-mediated mRNA de-
caynonsense-mediated mRNA decay, 105nucleic acid, 1nucleotide, 4, 203, 205, 210
adenosine, 2, 98, 210alignment, 16, 179coding, 51cytidine, 2frequency, 177, 178, 213inosine, 2level, 180substitution, 188uridine, 2
nucleus, see cell
Oopen reading frame, 3, 12, 210ORF, see open reading frameoverprediction, 3, 15
Ppair-wise
alignment, 173alignment plot, 188matrices comparison, 177sequence comparison, 152similarity, 154
Pair Hidden Markov Model,see gene finding, PHMM
percentage identity plot, 153–154, 211perl, 19, 173, 178, 213phosphate, 98
244 INDEX
phospodiester linkage, 210phylo-HMM,
see gene finding, phylo-HMMphylogenetic
distance, 188, 210shadowing, 16tree, 16, 210
Pip-plot, see percentage identity plotplasmid, 155polyadenylation,
see RNA polyadenylationpolypyrimidine track, 100polypyrimidine tract, 100position-specific scoring matrix, 107, 177position weight matrix, 177post-transcriptional modification, 182POSTSCRIPT, 155, 156prediction
gene, see gene predictionspremature termination codon,
see stop codon, PTCprimary transcript, see RNA pre-mRNAprokaryote, 211promoter, 207
element, 13, 211sequence, 105
protein, 1, 11coding
exon, 14gene, see gene, protein codingregion, 12, 14sequence, 181
evidence, 182factor, 98isoform, 5, 211
proteome, 154, 211pseudogene, 1, 183, 211, 212
Qquery, 6
sequence, 215
Rrandom
composition, 178distribution, 178
rasterdevice, 156
graphics, 156rat, 10, 19, 108
genome, 16, 187intron, 109splice site, 100
Rattus norvegicus, see ratrecord structure, 157regulatory element, 12, 183, 211relative entropy, 178repeat, 153, 188, 207, 215
ancient, 188distribution analysis, 154
repetitive element, see repeatrestriction map, 155ribonucleoprotein particle, 98ribosome, 106RNA, 204, 210
alphabet, 205binding protein, 105capping, 2, 207editing, 2mature mRNA, 209messenger (mRNA), 1, 2, 182, 207messenger mRNA, 212microRNA, 182non-coding (ncRNA), 1, 182, 209RNApolII, 104, 105
CTD, see carboxyl-terminal do-main
polyadenylation, 2pre-mRNA, 2, 97, 210, 212processing, 2ribosomal (rRNA), 210snRNA, 5, 99, 182, 212
secondary structure, 99splicing, see splicingtransfer (tRNA), 1, 210
rodent, 109intron, 188
RT-PCR, 53amplification, 95, 187, 215primers, 53
SSaccharomyces cerevisiae, 150
ibid, see also yeastsecondary structure, 98, 99segmental duplication, 153

INDEX 245
selectiveconstraint, 107
sensitivity, 51sequence
alignment, 5, 15, 153, 180, 207analysis, 155assembly, 150, 187coding region, 1, 3, 11, 16, 181consensus, see consensus, sequenceconservation, 14deletion, 151direct sequencing, 215DNA, see DNA sequencedraft, viigenome, see genome sequenceidentity, 153insertion, 151inversions, 151low complexity, 215masked, 110, 215motif, 5, 207, 213non-coding region, 1, 16, 97, 107, 154nucleotide, 203pattern, viii, 211protein, 1, 203rearrangement, 154shotgun reads, 16shotgun sequencing, viisignal, 1, 178, 187similarity, 216
sequencing consortium,see genome, sequencing consor-tium
SGP2,14, 15, 18, 53, 95, 150, 187, 214, 216signal, 11silencers, 211similarity, 12single nucleotide polymorphisms, 184sliding window, 212Sm-binding site, 99small nuclear ribonucleoprotein particle,
see splicing, snRNPsmooth plot, 153, 212software, 10
ab initio gene finding,see gene finding
Augustus, 13fgenes, 13
geneid, see geneidgenemark, 13genemodeler, 12genie, 13GenomeScan, 182genscan, 13, 19grail, 12hmmgene,13mzef, 13sorfind, 12testcode, 12xpound, 12
alignment toolExofish, 151exstral, 180glass, 15WABA,151
annotation browser,see annotation browsersee also genome browser
ACT,152Alfresco, 152Apollo, 152Artemis, 152ERGO,152FamilyJewels, 152genomeSCOUT,152Otter/Lace, 152Theatre, 152
annotation workbench,see annotation browsersee also genome browser
code library, 149Bioperl, 149bioTk, 149bioWidgets, 149GMOD,149
comparative genomics,see gene finding
SLAM,150cem, 15doublescan, 15rosetta, 15SGP1,15SGP2,see SGP2SLAM,15Twinscan, 15, 95, 150, 187

246 INDEX
database browser,see database browsersee also genome browser
AceBrowser, 150AceDB, 150euGenes, 150Gbrowse, 150, 184GeneDB,150Jade, 150
dot-plotBlixem, 152DIAGON,152Dotter, 152GenoPix2D, 152gff2aplot, see gff2aplotLaj, 152Lav, 152LFASTA,152NOPTALIGN,153TriCross, 153
genetic mapscMap, 155FitMaps, 155GenoMap,155GenomePlot, 155gRanch, 155mapmerge, 155MappetShow, 155mapplet, 155NCBI’s MapViewer, 155ShowMap,155ZoomMap,155
genome browser,see genome browser
ENSEMBL, see ENSEMBLK-Browser, 151NCBI MAP VIEWER, 150, 184, 215UCSC GENOME BROWSER, 150,
184, 216homology-based gene finding,
see gene findingGnomon,150
homology searchBLAST,13, 17BLASTN,15, 152BLASTZ,151, 153BLAT, 151MegaBlast, 173
Mummer,173NCBI-Blast, 173sim96, 15, 173TBLASTX,15, 18, 152, 187, 216WebBlast, 173WU-Blast, 173, 179
linear dot-plotGenomePixelizer, 153LalnView, 153LAPS,153
parserali2gff, 173parseblast, 18, 173sim2gff, 173
pictogram, 177, 188compi, 177–179, 184, 188, 213pictogram, 177–178
pip-plotCGAT,153ECR-Browser, 154Multi-PipMaker, 153MUMmer,153PipMaker, 153PipMaker, 211SynPlot, 153VISTA, 153VISTA, 212zPicture, 153, 154
promoter analysisConSite, 154GenomeComp,156ReguloGram, 154TraFacGram, 154
repeat analysisADplot, 156Exact Match Annotator, 156FORRepeats, 156MiroPEATS, 156REPUS,156REPuter, 156
sequence analysis,see sequence analysis
ANALYSEQ,3, 155EMBOSS,153, 155GCG,3, 155Oxford Grid, 154RepeatMasker, 110, 215RSVP,155

INDEX 247
SEALS,155SimiTri, 154SpliceNest, 155SplicingGraphs, 155SRS,155Staden, 3, 155
sequence logo, 177typesetting
BIBTEX, 199LATEX, 199–201pdflatex, 199thumbpdf, 199
visualization tool, 5, 9, 149, 188GeneModeler, 155gff2aplot, see gff2aplotgff2ps, see gff2psGUPPY,155Sockeye, 155XGRAIL, 155
specificity, 51splice
isoform, 10signal, 12, 15, 178variant, see splice, isoform, 212
spliceosome, 97, 105, 184, 207, 208, 212activated, 100assembly, 100commitment complex, 100
splice site, 5, 107, 157, 177–179AC, 98AG, 98alternative, 105AT, 98branch site, see branch pointevolution, 188exonic 3’, see donor siteexonic 5’, see acceptor siteGT, 98intronic 3’, see acceptor siteintronic 5’, see donor siteorthologous, 10, 97, 188signal, see splicing signal
splicing, 2, 105, 207, 210alternative, see alternative splicingcode, 97, 188enhancer
exonic (ESE), 105intronic (ISE), 105
machinery, 4mechanism, 10reaction, 5regulatory code, 105signal, 187silencer
exonic (ESS), 105intronic (ISS), 105
snRNP, 5, 98, 212U1, 98, 99U11, 98, 99U2, 98, 99U12, 98, 99U4, 98, 99U4ATAC, 99, 103U5, 98, 99, 103U6, 98, 99U6ATAC, 99, 103
U2AF, 100split gene, 52stochastic, 97stop codon, 157, 206, 210
amber, 206ocre, 206opal, 206PTC, 106UGA (opal), 206
substitution rate heterogeneity, 107SVG, 184syntenic region, 15synteny, 6, 154, 208, 212
Ttask manager, 19termination codon, see stop codon
premature, see stop codon, PTCTetraodon nigroviridis, 182tetrapoda, 188training dataset, 51, 212trans-esterification, 97transcription, 1, 105
complex, 105factor, 105start site, 183unit, 182
transcriptome, 212transfrags, 182translation, 1, 210

248 INDEX
triplet, 97trypanosomes, 102
UU12 intron, 4, 5, 98, 184, 188U2 auxiliary factor,
see splicing, U2AFU2 intron, 4, 5, 184, 188ungapped alignment, 153untranslated region, 2user interface, 149UTR, see untranslated region
Vvector graphics, 156VEGA, 181Venn diagram, 154vertebrate, 9
cell, 104exon-definition model, 106gene, 183gene finding, 13genome, 5, 97, 188
annotation database,see VEGA
orthologous gene, 187splice site, 10, 126
visualization tool,see software, visualization tool
VRML, 153
Wweb
browser, 154interface, 6, 17, 53server, 10, 153, 155, 208site, 188, 208
workflow, 17worm, 102wrong
exon, 52gene, 52
XXML, 17, 152, 184
Yyeast, 100, 102, 105
cell, 105

Notes
249

250 NOTES

NOTES 251

252 NOTES

NOTES 253

Titles in the GBL Dissertation Series
2002-01 M. Burset.Estudi computacional de l’especificacio’ dels llocs d’splicing.[Computational analysis of the splice sites definition.]Departament de Genètica, Universitat de Barcelona.
2004-01 Sergi Castellano.Towards the characterization of the eukaryotic selenoproteome: a computational approach.Departament de Ciències Experimentals i de la Salut, Universitat Pompeu Fabra.
2004-02 Genís Parra.Computational identification of genes: “ab initio” and comparative approaches.Departament de Ciències Experimentals i de la Salut, Universitat Pompeu Fabra.
2005-01 Josep F. Abril.Comparative Analysis of Eukaryotic Gene Sequence Features.Departament de Ciències Experimentals i de la Salut, Universitat Pompeu Fabra.


Josep Francesc Abril Ferrando
Comparative Analysis of EukaryoticGene Sequence Features
Anàlisi Comparativa d’Elements de Seqüència dels Gens Eucariotes
The constantly increasing amount of available genome sequences, along withan increasing number of experimental techniques, will help to produce the com-plete catalog of cellular functions for different organisms, including humans. Sucha catalog will define the base from which we will better understand how organismswork at the molecular level. At the same time it will shed light on which changesare associated with disease. Therefore, the raw sequence from genome sequenc-ing projects is worthless without the complete analysis and further annotation of thegenomic features that define those functions. This dissertation presents our contri-bution to three related aspects of gene annotation on eukaryotic genomes.
First, a comparison at sequence level of human and mouse genomes was per-formed by developing a semi-automatic analysis pipeline. The SGP2gene-findingtool was developed from procedures used in this pipeline. The concept behindSGP2is that similarity regions obtained by TBLASTXare used to increase the scoreof exons predicted by geneid, in order to produce a more accurate set of genestructures. SGP2provides a specificity that is high enough for its predictions to beexperimentally verified by RT-PCR. The RT-PCR validation of predicted splice junc-tions also serves as example of how combined computational and experimentalapproaches will yield the best results.
Then, we performed a descriptive analysis at sequence level of the splice sitesignals from a reliable set of orthologous genes for human, mouse, rat and chicken.We have explored the differences at nucleotide sequence level between U2 andU12 for the set of orthologous introns derived from those genes. We found that or-thologous splice signals between human and rodents and within rodents are moreconserved than unrelated splice sites. However, additional conservation can beexplained mostly by background intron conservation. Additional conservation overbackground is detectable in orthologous mammalian and chicken splice sites. Ourresults also indicate that the U2 and U12 intron classes have evolved independentlysince the split of mammals and birds. We found neither convincing case of inter-conversion between these two classes in our sets of orthologous introns, nor anysingle case of switching between AT-AC and GT-AG subtypes within U12 introns. Incontrast, switching between GT-AG and GC-AG U2 subtypes does not appear tobe unusual.
Finally, we implemented visualization tools to integrate annotation features forgene-finding and comparative analyses. One of those tools, gff2ps, was used todraw the whole genome maps for human, fruitfly and mosquito. gff2aplot andthe accompanying parsers facilitate the task of integrating sequence annotationswith the output of homology-based tools, like BLAST. We have also adapted theconcept of pictograms to the comparative analysis of orthologous splice sites, bydeveloping compi.
GBL Dissertation SeriesUniversitat Pompeu Fabra
ISBN XX-XXX-XXXX-X
Related Documents


