Welcome message from author
This document is posted to help you gain knowledge. Please leave a comment to let me know what you think about it! Share it to your friends and learn new things together.
Transcript


Comparability of Paper-and-Pencil and Computer Adaptive Test Scores on the GRE” General Test
Gary A. Schaeffer, Brent Bridgeman, Marna L. Golub-Smith, Charles Lewis, Maria T. Potenza, and Manfred Steffen
GRE Board Report No. 9%08P
August 1998
This report presents the findings of a research project funded by and carried out under the auspices of the Graduate
Record Examinations Board.
Educational Testing Service, Princeton, NJ 0854 1

********************
Researchers are encouraged to express freely their professional judgment. Therefore, points of view or opinions stated in Graduate
Record Examinations Board Reports do not necessarily represent official Graduate Record Examinations Board position or policy
********************
The Graduate Record Examinations Board and Educational Testing Swice are dedicated to the principle of equal opportunity. and their programs,
sexices, and employment policies are guided by that principle.
EDUCATIONAL TESTING SERVICE. ETS, the ETS logo, GRADUATE RECORD EXAMINATIONS, and GRE are registered trademarks of Educational Testing Senice.
Copyright c 1998 by Educational Testing Service. All rights resen-ed.

Abstract
This report summarizes a study conducted to assess the comparability of paper-and-
pencil (P&P) and computer adaptive test (CAT) scores on the GRE@ General Test. Volunteer examinees from around the country were randomly assigned to take the test in either CAT mode or P&P mode. Results indicated that for each measure (verbal, quantitative, analytical), mean scores on the CAT were higher than mean scores on P&P. It was hypothesized that CAT examinee test-taking behavior with regard to the CAT scoring method that was in place at the time of the study (allowing student to receive a score by answering only 80% or more of the questions) may have affected CAT scores. Investigation of this hypothesis indicated that CAT examinees who did not complete their CATS obtained higher mean scores than would be predicted. However, mean scores for examinees who completed their CATS were similar to mean scores for P&P examinees. A new psychometrically-defensible CAT scoring method, called proportional scoring, was developed in which it is to the examinees’ advantage, in terms of maximizing their scores, to carefully consider and answer as many items as they can. The proportional scoring method has been implemented in the operational GRE CAT program, and it is believed that this scoring method will result in CAT scores that are comparable to P&P scores. GRE CAT scores will continue to be closely monitored.

Comparability of Paper-and-Pencil and Computer Adaptive Test Scores on the GRE General Test
Introduction
The purpose of this study was to provide a direct assessment of the comparability of scores from the GRE General computer adaptive test (CAT) and the GRE General paper-and- pencil (P&P) test. Comparability is important because the GRE program offers the General test (verbal, quantitative, and analytical measures) in both modes, and it is intended that score users treat CAT and P&P scores interchangeably. This is the third in a series of studies designed to assess the comparability of GRE computer-based and P&P scores. The earlier studies were conducted at different stages of the development of the GRE CAT.
The development of the GRE CAT was conducted in two phases because it was recognized that the development of a CAT involves two distinct changes in the presentation of the test. First, the mode of testing is changed. That is, instead of paper and pencil, a computer is used to present items and record examinee responses. Second, the testing paradigm is changed from a linear test, where all examinees are administered the same set of items, to an adaptive one where examinees are administered items that are tailored to their abilities. Therefore, the first phase compared a linear P&P test to its linear computer-based test (CBT) counterpart. This comparison addressed effects due to mode of testing. The second phase compared a CAT to a linear CBT. This second comparison addressed testing paradigm effects.
As part of the first phase, a field test was conducted in the fall of 1991 in which a CBT form was compared to its P&P version. It was concluded that the psychometric characteristics of the linear CBT form were similar to its P&P counterpart (Schaeffer, Reese, Steffen, McKinley, & Mills, 1993). The scores obtained in the P&P and CBT testing modes were considered to be comparable.
The second major phase of this project was to introduce CAT versions of the three GRE measures. Beginning in March 1993, a verbal, quantitative, or analytical CAT was administered in the seventh (final) section of an examinee’s CBT session. The primary purpose of this data collection effort was to verify that the scores derived from a CAT measure had similar characteristics to scores derived from a linear CBT (and thus by inference similar to P&P). The verbal and quantitative scores in the CBT and CAT modes were judged to be sufficiently similar so as to not to require an adjustment. The analytical CAT scores, however, were sufficiently higher than the analytical CBT scores so as to require an adjustment, and an equating adjustment was implemented (Schaeffer, Steffen, Golub-Smith, Mills, & Durso, 1995). Based on the results of these two phases of study, the GRE General CAT was introduced operationally in November 1993.
Although earlier comparability studies indicated that CAT and P&P scores were comparable, there were several reasons why the present study was conducted. First, the P&P program will continue until 1999, which is longer than originally planned. Second, the 1993 CAT/linear-CBT comparability study was conducted when the CAT was new and examinee behavior may have changed since then. Third, some operational data on test takers who took both a P&P test and a CAT were not consistent with comparability (Bridgeman & Schaeffer, 1995).

The present study was designed to provide a direct assessment of the comparability of GRE CAT and P&P scores. Comparability in this study was defined in terms of similar CAT and P&P score distributions. Examinees were randomly assigned to take all three measures in either CAT or P&P mode. This design allowed for the direct comparison of score distributions from the two modes.
Methods
Design and Recruitment
A random-groups design was employed: volunteer examinees were recruited and randomly assigned to take the GRE General Test in either CAT mode or P&P mode. With this design, differences in summary score statistics could be attributed to mode effects and not to the characteristics of the different samples of examinees. A within-persons design was considered but rejected because of possible asymmetric practice effects; that is, the score gain from taking a CAT first and then the P&P test may not be the same as the gain from taking a P&P test and then a CAT. The random groups design avoided the problem of practice effects and also allowed for an equating adjustment if it was determined that one was needed.
In August and September 1995, students from a total of 30 college campuses from around the country were invited to participate in a special administration of the GRE in which they would be randomly assigned to take the test in either CAT or P&P mode. Flyers were posted on each campus. These campuses were located near at least one P&P and CBT test center. Several of these campuses had large proportions of minority students which enabled oversampling of minority participants. Appendix A lists the states where CBT and P&P test centers were located. The incentives for participation in this study included (a) a free GRE test administration, (b) the option to cancel their GRE test scores after seeing them, and (c) faster score reporting (an immediate “unofficial” score for the CAT group; and a score report in approximately two weeks for the P&P group). Volunteers registered for this special administration by calling an ETS@ 800 phone number. At the time of the phone call, registrants who met the selection criteria were told to which group they had been randomly assigned’ either CAT or P&P. In order to meet the selection criteria, potential participants were required to state when they called that (a) they had not taken the GRE previously, and (b) they had attended high school in the United States (this criterion was intended to ensure - to the extent possible - that study participants spoke English as their primary language).
Testing of all participants occurred in October 1995. CAT examinees took the test throughout the month at specified CBT centers (located at Sylvan Technology Centers, ETS Field Service Offices, and college and university campuses). P&P examinees took the exam at specified colleges and institutional sites on October 21.

CAT Pools and P&P Forms
Three CAT item pools and three P&P test forms were used in the study. These pools and forms were not chosen to be as similar as possible; rather, they reflect the variability found among operational pools and forms. In the CAT condition, examinees were randomly assigned to a CAT pool (labeled in this report as pool 1, pool 2, pool 3). In the P&P condition, examinees were randomly assigned to a P&P form (labeled in this report as form A, form B, form C). Each examinee took the same pool or form designation (e.g., pool 1) for all three measures (verbal, quantitative, analytical). The purpose of using multiple pools and forms was to use within-mode variability of results as a baseline in assessing the magnitudes of the between-mode results. Each pool and form contained items that were not shared by any of the other pools and forms used in this study.
Summary statistics of examinee performance by pool and form indicated that there was more variability among pools than expected (this issue is discussed more fully under Conclusions and Next Steps). For almost all analyses summarized in this report, the CAT data were combined across pools, and the P&P data were combined across forms.
80% Scoring Method
Since 1993 (when the GRE CAT became operational) and continuing through the time this study was conducted, GRE CAT scores were obtained using what was called the 80% scoring method. The GRE CAT 80% scoring method required that in order to have a score reported for a section, an examinee must either: (a) answer all of the items in the section, or (b) answer at least 80% of the items in the section and have section time expire. The score was based on the IRT maximum likelihood ability estimate computed after the last item answered. If neither of these conditions were met, then a No Score (NS) was reported for that section.
There were several reasons why the 80% threshold was adopted rather than either requiring examinees to answer all items or allowing examinees to answer as few as one item to get a score. Based on linear CBT timing data, it was believed that almost all examinees would be able to answer 100% of the items in the specified time limits. The initial motivation for not requiring examinees to answer all items, however, was equity. It was believed that examinees who naturally work more slowly than others (and therefore may not finish the test in the allocated time) should be allowed to receive a score. On the other hand, some minimum threshold was required because with maximum likelihood scoring, it would othewise be possible to get a very high score by answering as few as one item correct and not answering any other items. The threshold of 80% was selected because simulation results indicated that 80% length CATS produced scores that were psychometrically adequate.
Description of Participants
The numbers of study participants are shown in Table 1. A total of 6,472 volunteers were registered for the study, about half to test in each mode. About 67% of the CAT registrants and about 77% of the P&P registrants actually tested; the remainder were absent.

Examinees who indicated on the background questionnaire that English was not their best language were excluded from the analyses (about 8% of those who tested).
Because of the magnitude of the absentee rates, the assumption could not automatically be made that the CAT and P&P groups that did test were randomly equivalent in terms of ability. Therefore, additional analyses were conducted to ascertain the similarity of the groups that did test. These analyses were required before the score distributions of the two groups could be meaningfully compared. Table 2 shows the percent distributions of responses to the background questions asked of the CAT and P&P groups. (A follow-up telephone survey was conducted to obtain background information from examinees who initially did not provide the information.) Percent distributions on the background variables of gender, ethnicity, school-year level, age, undergraduate major, undergraduate grade point average and parents’ educational level indicate that examinees in the CAT and P&P groups that did test were very similar. Note that the oversampling of minority participants was successful, resulting in a sample that was one-quarter African American examinees.
It also was important to ascertain the reasons why absentees did not test. This information could also be used to help determine whether the CAT and P&P groups that did test could be treated as randomly equivalent. For example, if a large proportion of absentees did not test because they were not assigned to the test mode that they prefer, then the groups that did test could not be considered as equivalent because this kind of systematic dropout would likely have affected the score distributions. Phone calls were made to absentees to ascertain why they did not test. About 70% of absentees who had registered for each mode were contacted. Table 3 shows the percentage of respondents stating each of several reasons for not testing. The majority of absentees reported that their reason for not testing was some “unscheduled conflict.” The higher percentage of conflicts for the P&P registrants is reasonable given that there was only one preassigned day for P&P testing and CAT registrants could select a day of their choice. Only a very small percentage of absentees reported that they did not test because they were assigned to a mode different from the one that they actually preferred. Based on the answers to these questions and the background information results, it was concluded that the groups were sufficiently similar to allow for a comparison of CAT and P&P score distributions.
Analyses and Results
Scorn Summary Sfafisfics
Table 4 shows means and standard deviations of scores for the CAT and P&P examinees; also included are differences, standardized differences (difference expressed in standard deviation units), and significance tests (z for means and F for standard deviations) comparing the two testing modes. Mean CAT scores were higher than the mean P&P scores for all three measures, with especially large differences for the quantitative and analytical scores. The standard deviations did not differ significantly for any of the scores. The magnitude of the differences in means was unexpected because it was believed that CAT and P&P scores were comparable and that the CAT and P&P groups in this study were very similar in ability. For comparison of the study sample with the general GRE population, Table 4 also includes operational means and operational standard deviations for all U. S. citizens who took the GRE during the 1994-95 testing year and responded to the citizenship question in the background questionnaire. All but 18% of these operational scores were based on P&P tests.
4

Given the intentional oversampling of minority examinees in the experimental sample, and the fact that some minority groups had lower mean scores than white examinees, it is not surprising that the P&P means for the experimental sample are slightly below the operational means. However, despite the oversampling, the study sample means for CAT quantitative and CAT analytical scores were higher than the means for these scores in the operational (primarily P&P) group.
The mean difference between CAT and P&P scores found for the analytical measure was particularly troubling because the analytical CAT was equated to the analytical CBT in the 1993 CAT/CBT comparability study (Schaeffer, et. al., 1995). This equating resulted from the finding that the analytical CAT mean score was 20 points higher than the analytical CBT mean score. The current study indicated a 30-point difference in the same direction. Adding that to the previous 20-point difference indicates an overall 50-point difference between the two modes. This is a very large difference.
Table 5 shows means and standard deviations for the CAT and P&P examinees separately by gender and ethnic subgroups. Compared with P&P scores, the mean CAT scores were higher for all subgroups on each measure. The pattern of differences is interesting. Note in particular the relatively large differences on the quantitative and analytical scores for the Asian examinees and the relatively small difference on the verbal score for White examinees.
Table 6 shows the correlations among the measures for CAT and P&P examinees. Although the CAT correlations were slightly lower than the P&P correlations, the patterns and magnitudes of the correlations suggest that the relationships among the measures are approximately the same in the two modes. Also, the correlations from three recent years of operational data were somewhat lower than the correlations obtained from this study, particularly for the correlations between the verbal and quantitative measures. This may have been a result of sample differences due to the oversampling of minority examinees for this study.
Table 7 shows the distributions of numbers of items answered for the total group and for subgroups. Rather large proportions of examinees who received scores did not answer all of the items. For example, for the total analysis sample, the percentages of examinees answering all items were: verbal, 73%; quantitative, 76%; analytical, 50%. For all three measures, African American examinees had the highest completion rates, and the percent of women completing each measure was slightly higher than the percent of men completing each measure. These completion rates are somewhat surprising given that mean scores for African American examinees are lower than the mean scores for other groups, that mean scores for women are lower than mean scores for men, and that the usual expectation is that lower- scoring groups should have greater difficulty completing a test within the specified time limit. This suggests that not completing the test may have been a deliberate strategy in the higher- scoring groups.
Posttest Questionnaire
A paper-and-pencil questionnaire was given to all examinees after they completed testing. A copy of the questionnaire and the percent of CAT and P&P respondents selecting each option is provided in Appendix B. Some of the notable results were that (a) most respondents in both groups, particularly P&P examinees, would have chosen to take an
5

operational GRE paper-and-pencil test (as opposed to a CBT) if they had not been randomly assigned; (b) about half of respondents in both groups thought that if they had taken both a P&P and CAT test, that their scores would be higher on a paper-and-pencil test (about 9 percent thought they would be higher on a CBT - the remainder thought their scores would be about the same in the two modes); (c) a smaller proportion of P&P respondents completed all of the test questions without feeling rushed.
Examinee Test-Taking Beha vior
Factors were investigated to try to explain the large mean score differences found between the CAT and P&P groups. One of these factors was the effect on scores of the interaction of examinee test-taking behavior and the 80% scoring method that was in effect during this study. It was hypothesized that examinee test-taking behavior with regard to the 80% scoring method may have affected the CAT scores in this study. In particular, it was hypothesized that many examinees may have paced themselves to intentionally not answer all items in order to maximize time spent per item and to increase their scores. By answering fewer items and using all of the allocated time, examinees would increase the average time they have to answer each item. It was further hypothesized that this increased average time spent per item may have led to higher scores.
To investigate these hypotheses, data were analyzed separately for examinees who answered all CAT items and for examinees who did not answer all CAT items (but still received a score based on the 80% scoring method). Before score summary statistics for these groups could be meaningfully compared to each other, however, the ability distributions of the groups that did and did not complete the CAT must be assumed to be similar; that is, the groups must be assumed to be at least nearly randomly equivalent. To investigate the reasonableness of this assumption, Table 8 shows the background question percent distributions for the groups that did and did not answer all CAT items. These data suggest that for the quantitative and analytical measures, the answer-all-items group may have been of similar or slightly lower ability than the not-answer-all group (e.g., refer to the lower percent of high undergraduate grade point averages for the answer-all group). For verbal, the groups appear to be quite similar. Recall also that the background question percents indicated that the entire CAT and P&P groups were quite similar. In addition to the greater tendency for women and African American examinees to complete each section noted above, a larger percentage of social science majors and a smaller percentage of natural science majors are in the answer-all groups.
Because the answer-all and not-answer-all groups appeared to be reasonably similar in terms of background characteristics, it was assumed that the ability distributions of these groups also would be reasonably similar. Summary statistics for four groups of examinees are provided in Table 9: (a) examinees who answered all CAT items, (b) examinees who did not answer all CAT items, (c) all P&P examinees, and (d) all CAT examinees. Notable findings included the following:
l For each measure 8 the summary statistics for examinees who were similar to the summary statistics for all P&P examinees.
answered all CAT items
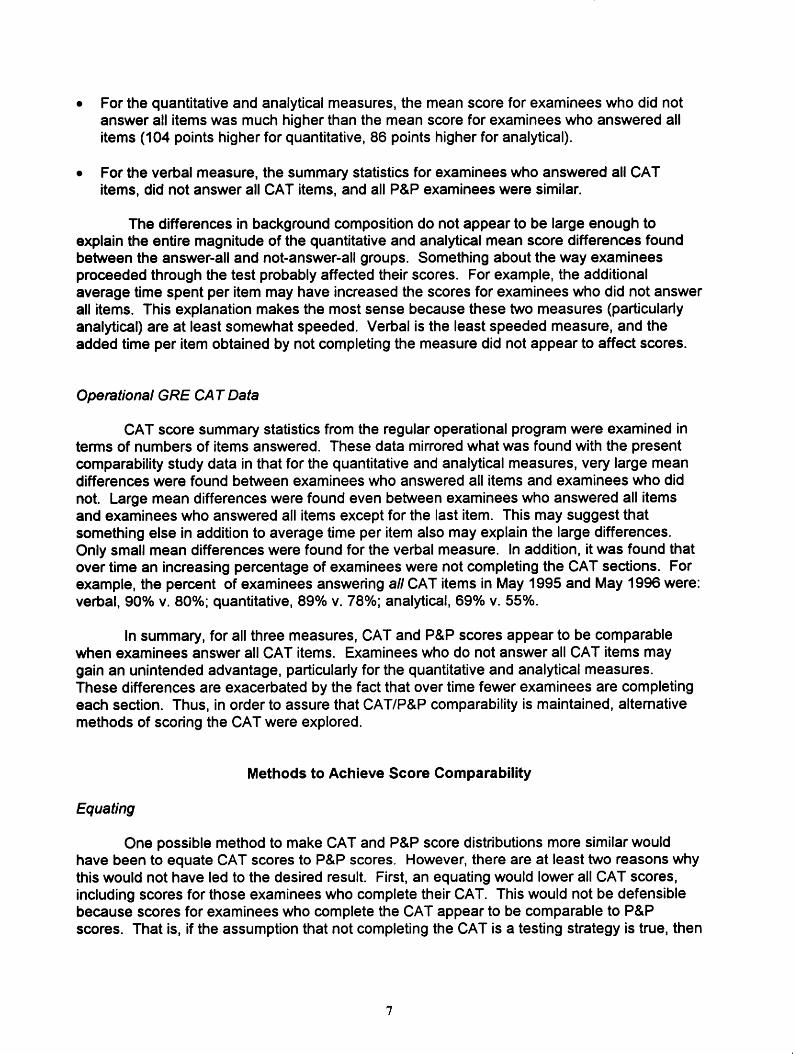
l For the quantitative and analytical measures, the mean score for examinees who did not answer all items was much higher than the mean score for examinees who answered all items (104 points higher for quantitative, 86 points higher for analytical).
l For the verbal measure, the summary statistics for examinees who answered all CAT items, did not answer all CAT items, and all P&P examinees were similar.
The differences in background composition do not appear to be large enough to explain the entire magnitude of the quantitative and analytical mean score differences found between the answer-all and not-answer-all groups. Something about the way examinees proceeded through the test probably affected their scores. For example, the additional average time spent per item may have increased the scores for examinees who did not answer all items. This explanation makes the most sense because these two measures (particularly analytical) are at least somewhat speeded. Verbal is the least speeded measure, and the added time per item obtained by not completing the measure did not appear to affect scores.
Operational GRE CAT Data
CAT score summary statistics from the regular operational program were examined in terms of numbers of items answered. These data mirrored what was found with the present comparability study data in that for the quantitative and analytical measures, very large mean differences were found between examinees who answered all items and examinees who did not. Large mean differences were found even between examinees who answered all items and examinees who answered all items except for the last item. This may suggest that something else in addition to average time per item also may explain the large differences. Only small mean differences were found for the verbal measure. In addition, it was found that over time an increasing percentage of examinees were not completing the CAT sections. For example, the percent of examinees answering a// CAT items in May 1995 and May 1996 were: verbal, 90% v. 80%; quantitative, 89% v. 78%; analytical, 69% v. 55%.
In summary, for all three measures, CAT and P&P scores appear to be comparable when examinees answer all CAT items. Examinees who do not answer all CAT items may gain an unintended advantage, particularly for the quantitative and analytical measures. These differences are exacerbated by the fact that over time fewer examinees are completing each section. Thus, in order to assure that CAT/P&P comparability is maintained, alternative methods of scoring the CAT were explored.
Methods to Achieve Score Comparability
Equating
One possible method to make CAT and P&P score distributions more similar would have been to equate CAT scores to P&P scores. However, there are at least two reasons why this would not have led to the desired result. First, an equating would lower all CAT scores, including scores for those examinees who complete their CAT. This would not be defensible because scores for examinees who complete the CAT appear to be comparable to P&P scores. That is, if the assumption that not completing the CAT is a testing strategy is true, then

adjusting everyone may be unfair. Second, operational data indicated that CAT test-taking behavior regarding completing the CAT was changing. Fewer examinees were completing the CAT, and there was no reason to expect that this decrease in the test completion rate would not continue. Therefore, an equating adjustment based on these data may not be appropriate in the future.
Proportional Scoring Method
An alternative method for scoring CATS has been developed by Charles Lewis. This method, called “proportional scoring,” provides a psychometrically defensible means for reporting scores for all CAT examinees, regardless of the number of items they answered. Proportional scoring incorporates the number of items answered into the calculation of the score. The higher (lower) the proportion of items answered, the higher (lower) the reported score may be. The scoring method is such that examinees almost always receive higher scores if they carefully consider and answer all items rather than leave some items unanswered. In order to get a very high score, essentially all items must be answered.
The proportional scoring method can be summarized as follows. Currently, in the GRE CAT, an examinee’s ability estimate (called theta) is based on the statistical characteristics of the items answered and on the right/wrong responses to those items. Theta is then converted to an estimated number-right score on a P&P reference form. This number- right score is then converted to the GRE 200-800 scale by use of a raw-to-scale conversion table. With proportional scoring, a step is added to the procedure. Theta and estimated number-right score are obtained in the same way. Then, the number-right score is multiplied by the proportion of items answered (the higher the proportion of items answered, the higher the revised number-right score). This revised estimated number-right score is then converted to the GRE scale using the original raw-to-scale conversion table.
There are several desirable features of the proportional scoring method. It precludes a need to report “No Scores” because a score can be derived regardless of the number of items answered. Also, because the proportional scoring method takes into account the number of items answered, it is to the examinee’s advantage to carefully consider and answer as many items as they can in order to obtain the highest score possible. It is desirable for examinees to answer all items because the evidence suggests that CAT and P&P scores will have the highest degree of comparability when examinees answer all CAT items. In addition, by answering all items examinees will have provided the maximum information about their ability level.
Based on the combined results from the present study and from the operational testing program, the GRE program replaced the 80% scoring method with the proportional scoring method described above beginning in October 1996. All available data suggest that CAT and P&P scores will be comparable if essentially all examinees complete their CAT. Also, for examinees who do not complete their CAT, they generally will receive lower scores under proportional scoring than they would have under the 80% method. The proportional scoring methodology is considered an interim procedure for the GRE program, and results are being monitored closely.
Conclusions and Next Steps
The comparability data obtained in the present study, coupled with operational GRE CAT data, indicate that, under the 80% scoring method, examinees who do not complete their tests are, on average, receiving higher scores than expected. It is hypothesized that the increased average time per item may be one of the factors that leads to the higher scores. It does appear, however, that CAT and P&P scores are comparable when CAT examinees answer all of the items in the test. Proportional scoring is one method of trying to get everyone to answer all items.
Since it was deemed that test-taking strategy was likely the primary cause of mean score differences between the modes, the method of proportional scoring was implemented in October 1996 for GRE CATS and has replaced the 80% scoring method. In addition, the proportional scoring method provides a means for reporting scores to all examinees (and eliminating the need for reporting “No Scores”). Under proportional scoring, it is to the examinee’s advantage to carefully consider and answer as many items as possible. Examinees who do not finish the test generally receive lower scores under proportional scoring than if they had the identical test and item response vector under the 80% method. These outcomes from proportional scoring should help ensure that CAT and P&P scores are comparable.
The effects of proportional scoring on CAT score distributions need to be closely monitored. First, the issue of test speededness will be monitored in terms of the number of items examinees answer under the proportional scoring method. For example, items presently are delivered in GRE CATS without regard to the expected time it should take the examinee to answer the individual items. Therefore, it is possible that a subset of examinees are delivered tests that would be extremely difficult to complete in the allotted time. These examinees would be less likely to complete their tests, and therefore they may not obtain very high scores. (Note: In the future, when the majority of CAT items will have been pretested on the computer and item times can be obtained, then controls can be put into place to ensure that it is reasonable to assume that examinees have enough time to complete their individual CATS.) The shapes of the overall score distributions and of the score distributions conditioned on examinee background characteristics such as gender and ethnic subgroups also need to be monitored.
Another issue that should be evaluated is the effect of proportional scoring on the psychology of the examinee. Under proportional scoring, examinees will feel that they must complete the test in order to obtain the highest possible score, whereas under the 80% method they did not need to feel this way. Even if they did complete the test under the 80% method, they did so without feeling compelled to do so. This different test-taking strategy could have psychological effects on the examinees as they proceed through the test, and these effects could affect scores and ultimately CAT/P&P comparability.
The issue of CAT/P&P score comparability has not been completely resolved by this study. Another comparability study in which the CAT is scored with the proportional scoring method may be desirable. Such a study would allow for a more direct comparison of scores from the two modes under proportional scoring conditions. However, given that the P&P program will be phased out by the year 1999, it may not be feasible to conduct another comparability study.
9

Finally, the issue of within-mode effects needs further investigation. Given that randomly equivalent groups took each form and each pool, large score differences are most likely due to the individual forms and pools and not to the sample characteristics of examinees taking each pool or form. Appendix C shows separate summary statistics for each pool and form. These data indicate that, generally for all three measures, performance across the three P&P forms was more similar than performance across the three CAT pools. For example, for the analytical measure there was a 20-point mean difference between CAT pools 2 and 3. The largest analytical mean difference between P&P forms was 5 points. This dissimilarity of performance among the different pools by randomly equivalent groups needs further investigation.

References
Bridgeman, B. and Schaeffer, G. A. (1995). A compatison ofgenderdiflerences on paper- and-pencil and computer-adaptive versions of the Graduate Record Examination. Poster session presented at the annual meeting of the American Educational Research Association, San Francisco, April, 1995.
Schaeffer, G. A., Reese, C. M., Steffen, M., McKinley, R. L., & Mills, C. N. (1993). Field test of a computer-based GRE Geneml Test (Research Report No. RR-93-07). Princeton, NJ: Educational Testing Service.
Schaeffer, G. A., Steffen, M., Golub-Smith, M. L., Mills, C. N., & Durso, R. (1995). The introduction and comparability of the computer-adaptive GRE General Test (Research Report No. RR-9520). Princeton, NJ: Educational Testing Service.
11

Table 1 NUMBERS OF PARTICIPANTS
1 CAT 1 P&P 1 Total 1 Number of registrants 3230 3242 6472 Number tested 2163 2498 4661 Number in analvsis samDIe 1998 2309 4307
12

Table 2 BACKGROUND INFORMATION IN PERCENTS*
* Number of CAT examinees was 1,998. Number of P&P examinees was 2,309.
13

Table 2 (continued...) BACKGROUND INFORMATION IN PERCENTS*
I UNDERGRADUATE GPA
No Response
I ~~~ MOTHER’S EDUCATIONAL LEVEL
Grade School or less
Some High School
I High School Diploma or Equivalent
Business or Trade
Some College
Associate Degree
l Number of CAT examinees was 1,998. Number of P&P examinees was 2,309.
CAT 1 P&P
8 I 6
17 18
*
6 5
19 16
3 I 8
5 I 6
6 I 5
18 18
*
5 5
13 12
15 17
*
6 4
26 24
3 I 8
14

Table 3 REASONS REGISTRANTS DID NOT TAKE TEST IN PERCENTS
Reason I CAT I P&P
1. Mode Preference I 2 I o+
2. Registration Problem I 6 I 6
3. Sylvan Problem I 7 I 1
4. Unscheduled Conflict I 55 I 67
5. Not Ready To Test I 17 I 12
6. Other I 12 I 12
7. Not Willing to Answer I 1 I o+
8. Do you plan to take or have you taken the GRE since October?
YES 79 76 NO 16 20 Blank 5 4
9. If yes to 8, what mode do you plan to test in (or already tested in)?
15
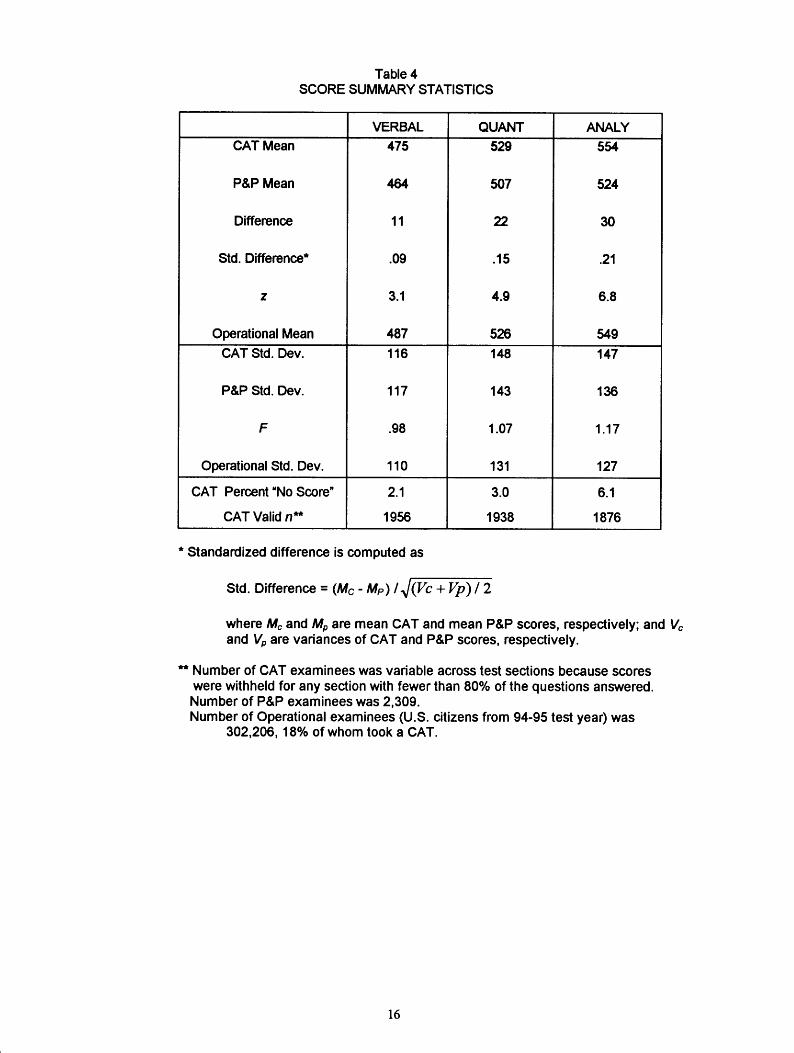
Table 4 SCORE SUMMARY STATISTICS
VERBAL WANT ANALY
CAT Mean 475 529 554
P&P Mean 507 524
Difference 11 22 30
Std. Difference* .OQ .15 .21
Z 3.1 4.9 6.8
Operational Mean 487 526 549
CAT Std. Dev. 116 148 147
P&P Std. Dev. 117 143 136
F .98 1.07 1.17
Operational Std. Dev. 110 131 127
CAT Percent ‘No Score” 2.1 3.0 6.1
CAT Valid II*+ 1956 1938 1876
* Standardized difference is computed as
Std. Difference = (M c - Mp) I.&k + &?I) / 2
where MC and A$ are mean CAT and mean P&P scores, respectively; and Vc and VP are variances of CAT and P&P scores, respectively.
** Number of CAT examinees was variable across test sections because scores were withheld for any section with fewer than 80% of the questions answered. Number of P&P examinees was 2,309. Number of Operational examinees (U.S. citizens from 94-95 test year) was
302,206, 18% of whom took a CAT.
16

Table 5 SUMMARY STATISTICS FOR GENDER AND ETHNIC SUBGROUPS
I Verbal I Quantitative I Analvtical Mean
Female 1 CAT 462 I P&P I 450
Hispanic CAT 454 P&P 447
S.D. N Mean S.D. N Mean SD. N 115 1295 503 144 1283 540 145 1250 115 1488 477 135 1487 510 135 1488
113 645 584 141 638 583 147 611
108 I 190 I 599 I 121 I 190 I 570 I 119 I 190
108 118 510 144 114 514 144 112 I
95 132 481 131 132 482 118 132
107 1080 563 130 1067 599 128 1032 106 1172 547 128 1171 573 118 1172

Table 6 SCORE CORRELATIONS
* Top correlation in each cell is for CAT comparability study examinees. Middle correlation in each cell is for P&P comparability study examinees. Bottom correlation in each cell is for operational examinees who tested between 1992-95.
18
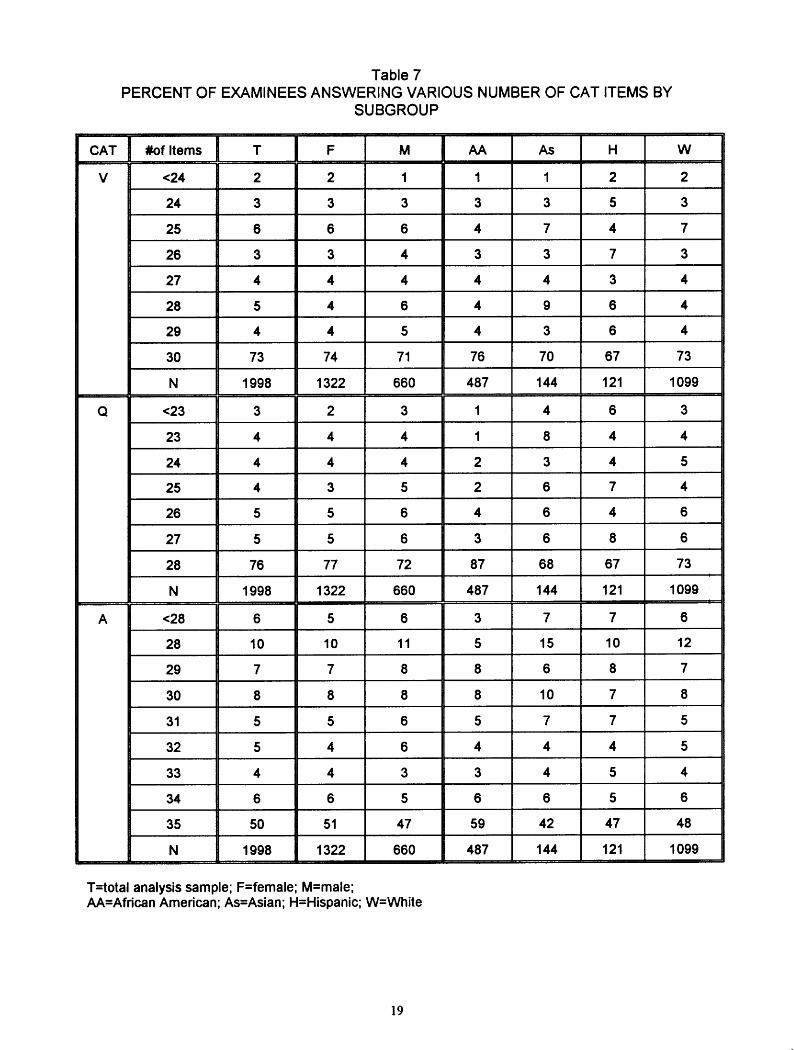
Table 7 PERCENT OF EXAMINEES ANSWERING VARIOUS NUMBER OF CAT ITEMS BY
SUBGROUP
T=total analysis sample; F=female; M=male; AA=African American; As=Asian; H=Hispanic; W=White
19

Table 8 BACKGROUND INFORMATION IN PERCENTS -ANSWER ALL CAT ITEMS?

Table 8 (continued) BACKGROUND INFORMATION IN PERCENTS- ANSWER ALL CAT ITEMS?
21

Table 9 SUMMARY STATISTICS FOR
EXAMINEES WHO ANSWERED AU ITEMS AND EXAMINEES WHO DID NOT ANSWER AU ITEMS
V answer all
Q answer all
Q not answer all
A answer all
A not answer all

Appendix A
STATES WHERE CAT AND P&P TEST CENTERS WERE LOCATED
Arizona Arkansas California
Florida Georgia Illinois Indiana
Massachusetts Michigan
Minnesota Mississippi Nebraska
New Jersey New York
North Carolina Pennsylvania
Texas Virginia
Washington Wisconsin
23

Appendix B POSTTEST QUESTIONNAIRE AND RESULTS
1. which type of GRE would you have taken if you had not participated in this special administration?
CAT P&P 59% 76% A. paper-and-pencil test
24Or6 9Or6 B. computer-based test
17% 45% C. not sure
2. How do you think your scores would compare if you were to take both types of tests?
P&P CAT 40% 51°r6 A. Scores would be higher on the paper-and-pencil test.
9% 9% B. Scores would be higher on the computer-based test.
44% 39% C. Scores would be about the same.
3. Which statement best reflects your feelings about the amount of time you had to complete the test?
CAT P&P 31% 12% A. I completed all of the questions without feeling rushed.
34% 40% B. I answered all of the questions but felt rushed to do so.
32% 47% C. I did not have sufficient time to answer all of the questions.
3% 1% D. I intentionally did not answer all of the questions.
4. Did you try your best on all sections of this test?
P&P CAT 86% 09% A. Yes
14% 11% B. No
5. Please mark the single most important reason why you participated in this special administration.
CAT P&P -- 57% 56%
33% 45O/6
10% 5%
A. It was free.
B. I could cancel my scores after seeing them.
C. Faster official score reporting.
CAT N = 1,253 (63% of analysis sample)
P&P N = 2,022 (88% of analysis sample)
24

Appendix C SCORE SUMMARY STATISTICS FOR EACH POOL AND FORM*
Verbal
CAT Mean P&P Mean
CAT Std. Dev. P&P Std. Dev.
Quantitative
CAT Std. Dev. P&P Std. Dev.
Analytical
CAT Pool P&P Form
CAT Mean P&P Mean
551 521 524 526
CAT Std. Dev. 149 146 145 P&P Std. Dev. 131 139 137
CAT %NS I 6.2 6.0 6.0
554 524
147 136
6.1
l Note: There is no correspondence in CAT pools and P&P forms in the same column (e.g., CAT pool 1 and P&P form A); they are listed this way for convenience.
25
Related Documents