A Work Project, presented as part of the requirements for the Award of a Masters Degree in Finance from the NOVA – School of Business and Economics. Equity Report Adidas AG Ludwig Schwarzmayr (646) A Project carried out on the field lab course, under the supervision of: Prof. Rosario André 07.01.2015

Welcome message from author
This document is posted to help you gain knowledge. Please leave a comment to let me know what you think about it! Share it to your friends and learn new things together.
Transcript
A Work Project, presented as part of the requirements for the Award of a Masters Degree in Finance from the NOVA – School of Business and Economics.
Equity Report Adidas AG
Ludwig Schwarzmayr (646)
A Project carried out on the field lab course, under the supervision of:
Prof. Rosario André
07.01.2015

THIS REPORT WAS PREPARED BY LUDWIG SCHWARZMAYR, A MASTERS IN FINANCE STUDENT OF THE NOVA SCHOOL OF BUSINESS
AND ECONOMICS, EXCLUSIVELY FOR ACADEMIC PURPOSES. THIS REPORT WAS SUPERVISED BY ROSÁRIO ANDRÉ WHO REVIEWED THE VALUATION METHODOLOGY AND THE FINANCIAL MODEL. (SEE DISCLOSURES AND DISCLAIMERS AT END OF DOCUMENT)
See more information at WWW.NOVASBE.PT Page 1/27
MASTERS IN FINANCE
EQUITY RESEARCH
! We confirm our previous buy recommendation with a
lower target price for the financial year 2015 of EUR 61.81. The
stock currently trades at a P/E ratio of 16.2x – a 24.3% discount
over its peers’ median. According to our analysis this is
exaggerated given Adidas’ strong cash flows and ability to
generate value to its shareholders.
! Adidas’ profits and cashflows come from the disposable
income of the people in the markets it serves. As a result, regions
with high disposable income, measured by GNI levels, and GDP
growth offer growth opportunities for the company. Adidas’ core
markets suffered strongly from the financial crisis. The company’s
inability to compete with Nike in the US market comes costly. The
slide of the Rubel additionally puts pressure on the revenues.
! Management announced to increase marketing initiatives
especially in the US, to gain much-needed market share. Also it
will lower the investment exposure on the Russian market by
closing more shops than re-opening them. On top a share buy
back program with a volume of EUR 1.5 billion was announced in
the second half of 2014
! Our YE15 target price is based on a DCF analysis. The
target price of EUR 61.81 implies an upside of 9.7% and a total
expected shareholder return of 15.4% on the current stock price.
Company description
Adidas AG is a German manufacturer of sports equipment, comprising the brands adidas, Reebok, TaylorMade, Rockport and CCM. The company was founded in 1949 by Adolf Dassler and has been listed on the Frankfurt Stock Exchange (Frankfurter Wertpapierbörse) since 1995. Adidas is listed in the German stock market index DAX (Deutscher Aktienindex).
ADIDAS AG COMPANY REPORT SPORTS APPAREL 07 JANUARY 2015
STUDENT: LUDWIG SCHWARZMAYR [email protected]
Regaining strength, slowly
Strong player in a weak macro environment
Recommendation: BUY
Vs Previous Recommendation BUY
Price Target FY15: 61.81 €
Vs Previous Price Target 66.64 €
Price (as of 3-Jan-15) 56.36 €
Reuters: ADSGn.DE, Bloomberg: ADS:GR
52-week range (€) 52.94-94.10
Market Cap (€m) 11,789.33
Outstanding Shares (m) 209.22
30-Day average volume 1,632,921
Source: Bloomberg
Source: S&P Capital IQ
(Values in € millions) 2013 2014E 2015F
Revenues 14,492 13,619 13,511
EBITDA 1,542 1,226 1,087
EBITDA growth 6.5% -20.5% -11.3%
Net Profit 790 614 512
EPS 3.76 3.01 2.59
Payout ratio 36% 37% 38%
Dividends per Share 1.35 1.50 1.14
Net Debt / EBITDA 0.07 0.13 0.39
Net Debt to Equity 2.1% 3.2% 8.8%
Source: Adidas AG Annual Report 2013, Analyst’s Estimates
-20% 0% 20% 40% 60% 80% 100%
02.01.12 02.01.13 02.01.14
MSCI World DAX Adidas AG
speralta
Rectangle
ADIDAS AG COMPANY REPORT
PAGE 2/27
Table of Contents
I. INVESTMENT CASE ............................................................................... 3!II. UNDERSTANDING THE BUSINESS ..................................................... 4!
A) BUSINESS OVERVIEW ........................................................................................ 4!B) ECONOMIC OVERVIEW ...................................................................................... 6!
Economic Development ........................................................................ 6!Peer Companies .................................................................................... 8!
C) BRAND OVERVIEW .......................................................................................... 10!adidas .................................................................................................. 11!Reebok ................................................................................................. 11!TaylorMade-adidas Golf .................................................................... 12!Rockport & Reebok-CCM Hockey ...................................................... 12!
D) DISTRIBUTION CHANNELS .............................................................................. 12!Wholesale ............................................................................................ 13!Retail ................................................................................................... 13!
III. FORECASTS ....................................................................................... 15!A) ECONOMIC FORECASTS ................................................................................... 15!B) SEGMENTAL FORECASTS ................................................................................. 16!
Wholesale ............................................................................................ 16!Retail ................................................................................................... 17!Other businesses ................................................................................. 18!
C) BUSINESS FORECASTS ..................................................................................... 18!Strategic Focus ................................................................................... 18!
IV. VALUATION ........................................................................................ 19!A) COMPARABLES ................................................................................................ 19!B) DISCOUNTED CASH FLOW ANALYSIS .............................................................. 20!
WACC ................................................................................................. 20!Perpetual Growth ............................................................................... 21!Sum of Parts ........................................................................................ 21!Sensitivity Analysis ............................................................................. 21!
V. APPENDIX ........................................................................................... 22!APPENDIX 1: FINANCIAL STATEMENT & CF MAP ............................................... 22!APPENDIX 2: VALUATION .................................................................................... 24!APPENDIX 3: SENSITIVITY ANALYSIS .................................................................. 25!APPENDIX 4: APPAREL AND FOOTWEAR INDUSTRY ............................................ 26!
VI.! DISCLOSURES AND DISCLAIMER ................................................ 27!
ADIDAS AG COMPANY REPORT
PAGE 3/27
I. INVESTMENT CASE Adidas is the second largest player in the sports apparel industry with total
revenues of EUR 14.5 billion and operations in Europe, Asia and Americas. Its
product range covers the entire spectrum of apparel goods ranging from sportive
fashion to high-performance apparel for competitive athletes. The goods are sold
through wholesale (63%), retail (24%) and eCommerce.
The company’s biggest competitor is Nike. The US firm leads the industry in
terms of sales. This is mainly due to its dominant market position in the US, the
industry’s most lucrative and important region. Adidas tried to buy market share
in this region by acquiring Reebok in 2006. However, so far, it failed to improve
its market position but lost share to Nike. Only EUR 3.1 billion revenues were
generated in 2013 compared to EUR 10.5 billion US revenues from Nike.
During the financial year 2014 the golfing sector got under strong pressure. Due
to stagnating player numbers in the US and Europe, sales plummeted, leaving
companies in this sector with high amounts of inventories. Revenues are
estimated to decrease double-digit in 2014. Adidas’ CEO announced to reduce
the company’s golfing inventory and to restructure the division in order to align it
to the industry’s lower future growth expectations.
The year 2014 was also affected by the Ukraine crisis and the following sanctions
against Russia. As a high prospect emerging country, Russia is amongst Adidas’
most important growth regions. Therefore the company has a high exposure in
this region. The fall of the Rubel towards the end of 2014 is expected to have a
destructive influence on Adidas’ revenues generated in this region. The total net
profit of 2014 is expected to be about EUR 600 million, in line with the
management’s prediction.
Management had to issue already three profit warnings within the last year. The
weak macroeconomic situation seems to punish Adidas for not having sufficient
market share in the stable US market. Management therefore announced to
increase marketing budgets, trying to gain market share in the US. Also it is
trying to lower the investment exposure to the Russian market by increasing the
retail shop closings and decreasing the openings. Additionally management
announced a share buy back program of about EUR 1.5 billion.
We therefore issue a buy recommendation and a target price of EUR 61.81 for
the shares of Adidas, representing an upside of 9.7% on the current stock price
and a total expected shareholder return of 15.4%.
Second largest player in the sports apparel industry
Biggest competitor is Nike, dominating the US market
Golfing sector sales decrease double-digit
Russian Rubel in free-fall
Management announced share buy back program
BUY recommendation with EUR 61.81 target price

ADIDAS AG COMPANY REPORT
PAGE 4/27
II. UNDERSTANDING THE BUSINESS Adidas AG is a German manufacturer of sports equipment, comprising the
brands adidas, Reebok, TaylorMade, Rockport and CCM. The company was
founded in 1949 by Adolf Dassler and has been listed on the Frankfurt Stock
Exchange (Frankfurter Wertpapierbörse) since 1995. Adidas is listed in the
German stock market index DAX (Deutscher Aktienindex), which is composed of
30 local stocks, whereof Adidas currently constitutes approximately 1.9% of it.
Valued by the market, Adidas has a market cap of about EUR 12 billion. This
makes the company only second biggest globally far behind its competitor Nike
Inc (Market cap of USD 82 billion) and quite ahead of Puma (Market cap of EUR
2.6 billion). In terms of stock performance Nike clearly outperformed Adidas and
Puma in 2014 with +25% over –36% and –26% respectively (see figure 1).
Adidas’ stock however managed to outperform its index, the DAX, steadily from
2009 to 2013. In 2014, due to reasons elaborated later in more detail, the stock
clearly underperformed the index, but still leaving investors, who invested in early
2010, with the same approximate stock performance as the index (see figure 2).
The company’s dividend policy aims to payout a 20%-40% dividend of annual net
income to its shareholders. In the last years Adidas managed to steadily increase
the payout ratio, reaching 36% (EUR 1.35 per share) in 2013 (see figure 3).
No investor in the company is holding a majority of the voting rights of the
company. As biggest single investor Société Générale S.A. can be considered
with a share of 5.09% as per year-end 2014. The global spread of shareholders
shows a strong focus on North America (see figure 4). Current CEO of the
company is Herbert Hainer.
Growth of the company was made through major acquisitions in the past and
through organic growth from thereon. In 2006 Adidas acquired its British rival
Reebok for USD 3.8 billion, giving it direct access to the North American market.
In 2011 the company acquired outdoor specialist Five Ten for USD 25 million.
Through acquisitions of Ashworth in 2009, TaylorMade in 2011 and Adams Golf
in 2012, Adidas gained access to the golfing market.
a) BUSINESS OVERVIEW
Adidas is the largest European sportswear manufacturer and second largest in
the world. It typically outsources manufacturing of its products to Asia and
focuses on innovation and design of products. The company separates its
business by its brands in order to tackle different markets and different clienteles
at the same time. As can be seen from figure 5, the company’s original brand
Figure 2: Adidas vs DAX
Adidas DAX
Source: Yahoo Finance
37%
32%
14%
10% 5% 2%
Figure 4: Shareholder structure
Rest of Europe North America Other
Germany Rest of World Management
Source: Adidas AG
Source: Adidas AG, Annual Reports
17% 18% 15% 30% 29% 34% 36%
0,42 0,50 0,50
0,35
0,80
1,00
1,35
Figure 3: Dividends
% Payout Ratio EUR Dividend
Source: Yahoo Finance
Figure 1: Peer comparison
Adidas Puma SE Nike Inc

ADIDAS AG COMPANY REPORT
PAGE 5/27
adidas adds the most to the group’s revenues. In 2013 it accounted for about
76% (EUR 10,961 million) of total revenues.
The distribution channels used to generate these revenues are either via
wholesale, having one or more intermediates between the producer and the end
customer, or via retail, directly selling its own products. The biggest part of
revenues is generated through wholesale (see figure 6), contributing roughly
63% (EUR 9,100 million) in 2013. The retail channel, which contributed about
24% in 2013, can further be subdivided into concept stores, factory outlets,
eCommerce and concession corners, contributing 46%, 44%, 7% and 3% of
retail sales in 2013 respectively.
As per the regional distribution of the sales, the company generates most of its
sales within its core market Western Europe, the rest mainly within the industry’s
most important market North America and the biggest growth opportunity Asia
(see figure 7). However, Adidas still has only a minor share in the total North
American market compared to Nike, which generates about quadruple of Adidas’
revenues in America (EUR 10.5 billion compared to EUR 3.1 billion in 2013).
On a total sales basis Nike was able to generate about EUR 23.9 billion in 2013.
This is only slightly below double of what Adidas generated (EUR 14.5 billion)
and about eightfold of Puma’s 2013 revenues of about EUR 2.9 billion. The total
apparel, footwear and accessories industry is estimated to have total revenues of
about EUR 260 billion in 2014 according to Bloomberg1. Nike is estimated to
have about 8.5% of market share, while Adidas only has 4.5%.
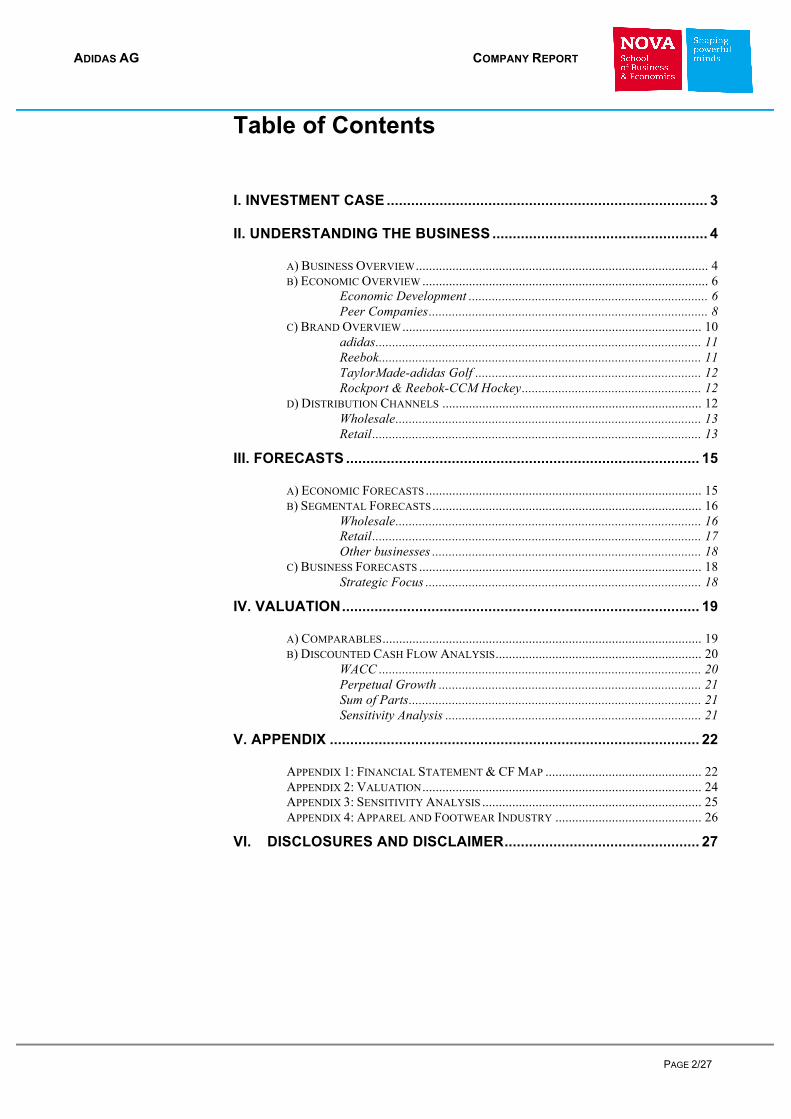
Vietnam, China and Indonesia account for the majority of the production volume
for footwear, apparel and hardware. The group operates a limited number (10) of
own production and assembly sites in Germany, Finland, USA and Canada. While Vietnam is the most important sourcing country for footwear production
with 35% of the total volume, China dominates the apparel and hardware
production with 33% and 40% respectively (see figure 8).
Through sponsorships of teams and individual athletes, Adidas is trying to
establish a brand awareness and preference for the customer. The marketing
working budget accounts for about 24% of total operating expenses and
therefore is a material component. As an example, Adidas sponsored the 2012
Olympic Games in London and is currently holding the official ball supplier rights
for the FIFA and UEFA tournaments. Recently it acquired the sponsorship rights
for Manchester United for the next ten years for roughly GBP 750 million. The
company hopes to return sales of about GBP 1.5 billion through this deal over the
1 Bloomberg. 2014. “Industry Market Leaders.” Retrieved from: http://www.bloomberg.com/visual-data/industries/detail/apparel,-footwear,-acc-design
7498 8639 9767 11186 10961
2009 2010 2011 2012 2013
Figure 5: Revenue by brand
adidas Reebok adidas Golf
Rockport Reebok-CCM other
Source: Adidas AG, Annual Reports
7174 8181 8949 9533 9100
1906 2389 2793 3373 3446
1283 1420
1580 1977 1946
2009 2010 2011 2012 2013
Figure 6: Revenue by distribution channel
Wholesale Retail Other
Source: Adidas AG, Annual Reports
Nike is the distinct market leader…
Source: Adidas AG, Annual Report 2013
26%
13%
23%
11%
15%
11%
Figure 7: Revenue by region
Europe European EM North america
Greater china Other asia Latin america
ADIDAS AG COMPANY REPORT
PAGE 6/27
next decade2. However, with a gross margin of slightly below 50% for the
company’s total sales and a 50% marketing expenditure on the sales predicted
by this investment we see a high risk of value destruction for the shareholders.
Adidas sees technological innovation as essential for sustainable leadership in
the industry. The R&D focus for its products is on cushioning and energy
solutions, lightweight and digital sports technologies as well as sustainable
product innovation. But also on new means of manufacturing processes and
advanced materials, such as machine knitting and 3-D printing. However, R&D
expenses in 2013 were only 2% of operating expenses.
b) ECONOMIC OVERVIEW
As a proxy for market size we use the Bloomberg estimation for the global
apparel, footwear and accessories industry of about EUR 260 billion, previously
mentioned. In order to estimate the potential growth of the overall sporting goods
market, we use metrics like GDP growth and GNI per capita. While the gross
domestic product growth rate gives us a reasonable estimate of the economic
growth of a region, the gross national income per capita and its performance over
time gives us a reasonable estimate of the disposable income within a region and
whether or not the region might be or become a potential market for the sporting
goods industry. As additional indirect market potential sign we will use the
percentage of people at the age of 15-64 years within a region, since people
within this group are assumed to potentially spend the most money on fitness
products.
ECONOMIC DEVELOPMENT
GDP growth
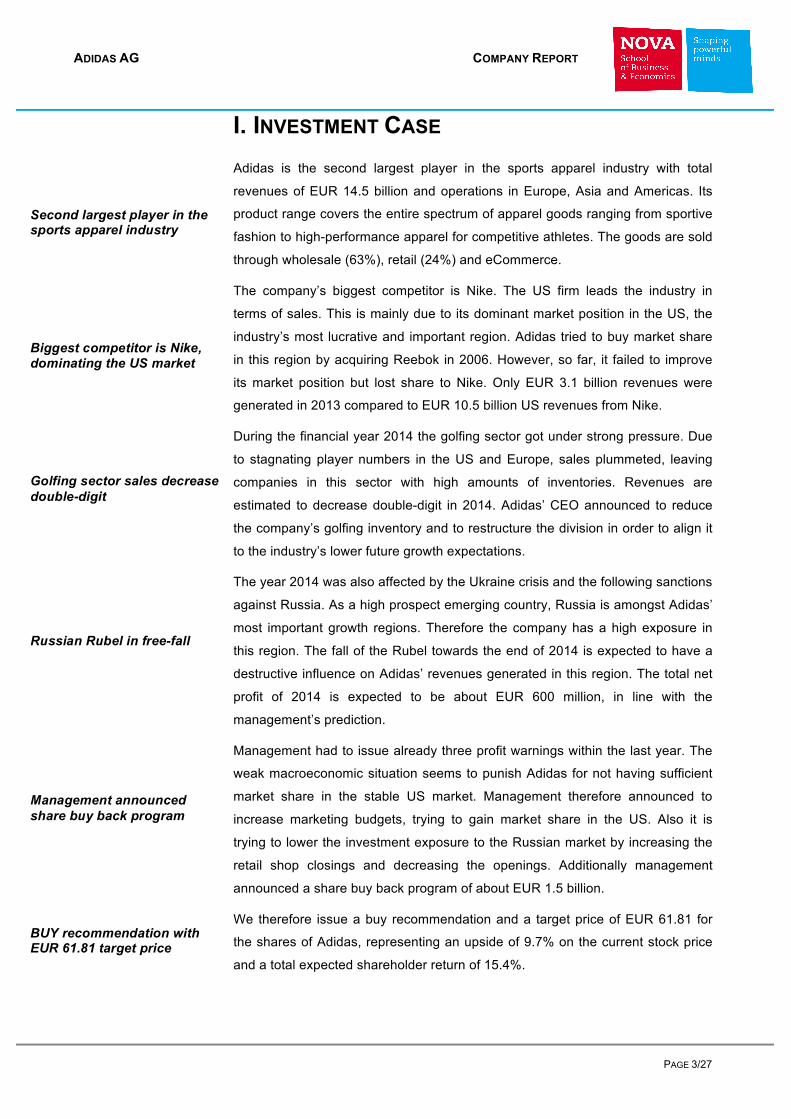
Over the past 40 years, global markets developed quite differently in terms of
GDP growth. While the Asian markets were able to grow 5% on average, the
Latin American markets grew 4% on average and European and North American
markets grew 3% on average. Against expectations, the difference in volatility
over the same period is only minor for those regions, with only 0.5% higher
standard deviation of Asian markets than European and North American markets
(see figure 9). African markets grew from an average of 3.5% in the sub-
Saharan region to 4.9% in the Middle East and North Africa. Due to the high
political risks in this region the volatility was significantly higher. The German
market in special was only able to grow at an average rate of 2% annually with a
standard deviation of 2%, while the world in total had an average GDP growth of
2 Robinson, D., Ross, A. 2014. “Man Utd seal £750m Adidas tie-up.” Financial Times, 14 July 2014.
78%
14%
7% 1%
Figure 8: Suppliers by region
Asia Americas Europe Africa
Source: Adidas AG, Annual Reports
EUR 260 billion industry revenues in 2014…
Source: World Bank national accounts data, and OECD National Accounts data files
-5,0%
0,0%
5,0%
10,0%
1960 1970 1980 1990 2000 2010
Figure 9: GDP growth
Europe Asia
North America Latin America
ADIDAS AG COMPANY REPORT
PAGE 7/27
3.5% with a standard deviation of 1.7%3. As a result we see real economic
growth on a global basis with emphasis on Asia, Africa and Latin America.
GNI per capita
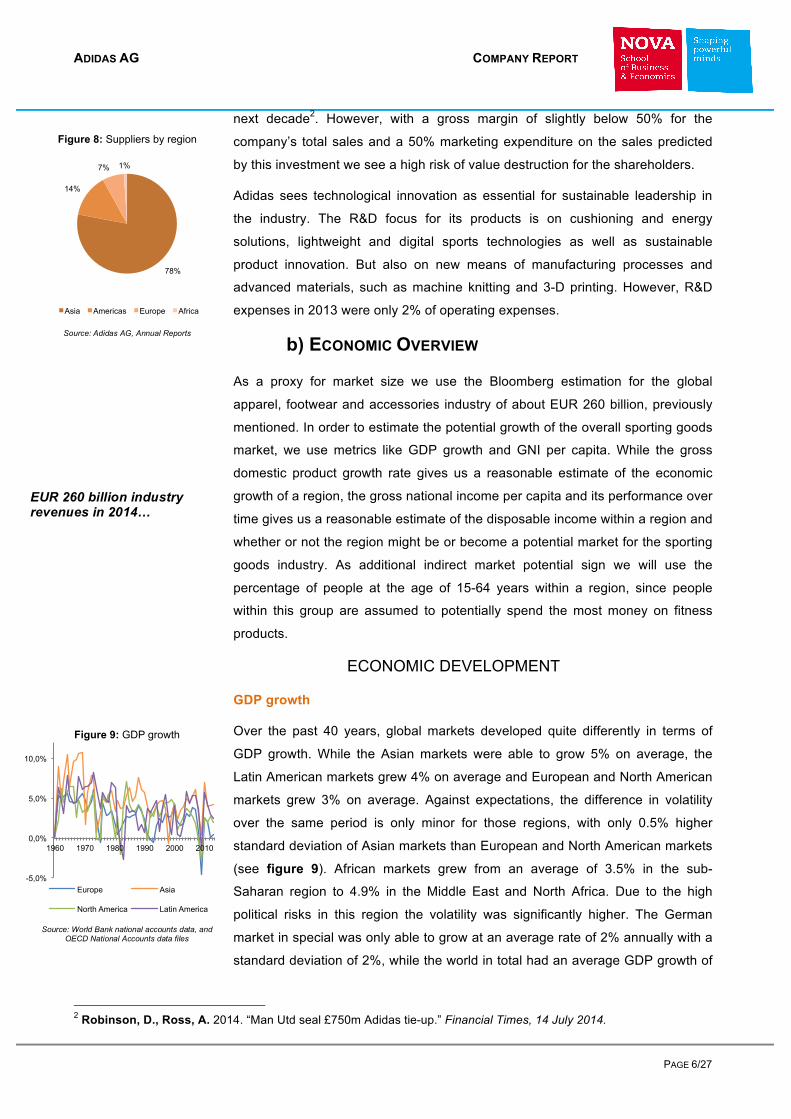
With increasing growth in the previous mentioned growth regions, Asia, Africa
and Latin America, new markets are establishing fast, while existing markets are
growing consistently. Figure 10 shows the current levels of GNI per capita, a
measure we use as a proxy for disposable income, in Adidas’ currently marketed
regions, while figure 11 shows the GNI per capita in Africa and China in more
detail. From these charts one can easily see that the North American market is
by far the biggest and most important market for the sporting goods industry,
while China and North Africa are the fastest growing markets (also see appendix
2). It is followed by Europe and Central Asia, where the European Union is
especially important. Since the mid 90s Latin America, East Asia and North Africa
are constantly and steeply increasing their per capita GNI. While in North Africa
this is mainly based on the existence of crude oil, Latin America and East Asia
benefit from production facilities being shifted into these regions due to the low
costs of labor. In East Asia, growth is mainly driven by China. Therefore we
consider these markets and especially China to be important for future above
average growth opportunities.
Indirect market potential signs
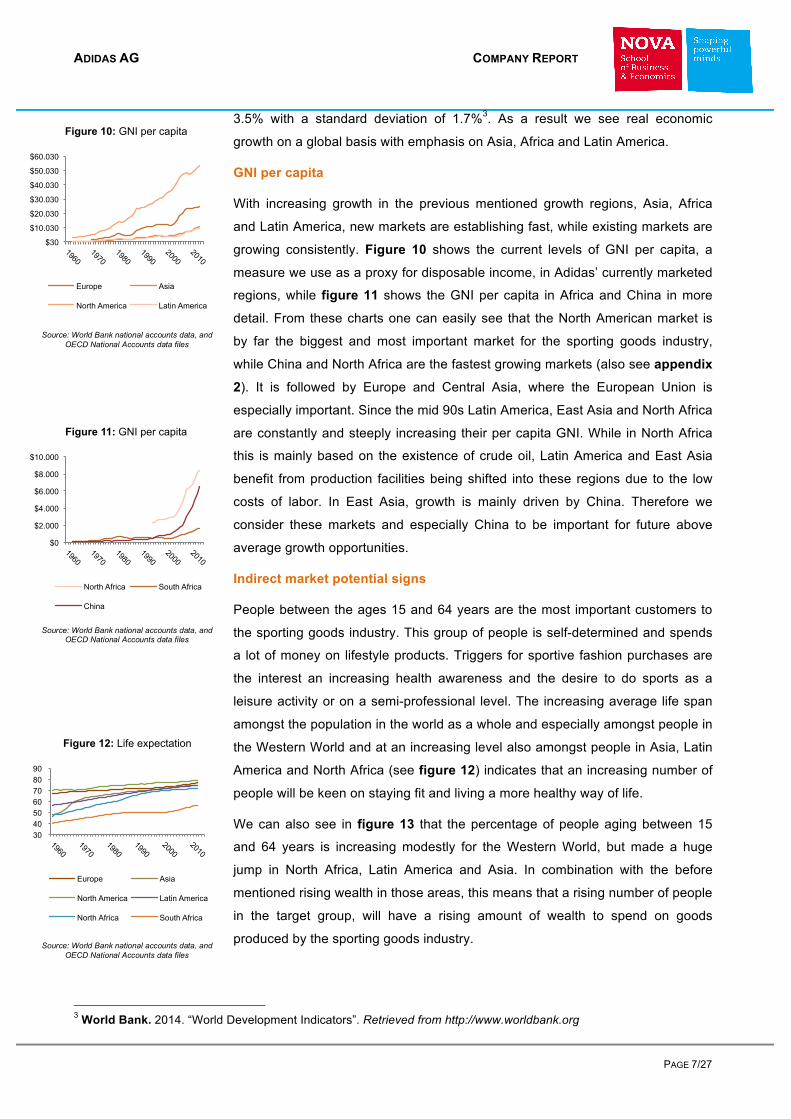
People between the ages 15 and 64 years are the most important customers to
the sporting goods industry. This group of people is self-determined and spends
a lot of money on lifestyle products. Triggers for sportive fashion purchases are
the interest an increasing health awareness and the desire to do sports as a
leisure activity or on a semi-professional level. The increasing average life span
amongst the population in the world as a whole and especially amongst people in
the Western World and at an increasing level also amongst people in Asia, Latin
America and North Africa (see figure 12) indicates that an increasing number of
people will be keen on staying fit and living a more healthy way of life.
We can also see in figure 13 that the percentage of people aging between 15
and 64 years is increasing modestly for the Western World, but made a huge
jump in North Africa, Latin America and Asia. In combination with the before
mentioned rising wealth in those areas, this means that a rising number of people
in the target group, will have a rising amount of wealth to spend on goods
produced by the sporting goods industry.
3 World Bank. 2014. “World Development Indicators”. Retrieved from http://www.worldbank.org
Source: World Bank national accounts data, and OECD National Accounts data files
$0
$2.000
$4.000
$6.000
$8.000
$10.000
Figure 11: GNI per capita
North Africa South Africa
China
Source: World Bank national accounts data, and OECD National Accounts data files
$30
$10.030
$20.030
$30.030
$40.030
$50.030
$60.030
Figure 10: GNI per capita
Europe Asia
North America Latin America
30 40 50 60 70 80 90
Figure 12: Life expectation
Europe Asia
North America Latin America
North Africa South Africa
Source: World Bank national accounts data, and OECD National Accounts data files
ADIDAS AG COMPANY REPORT
PAGE 8/27
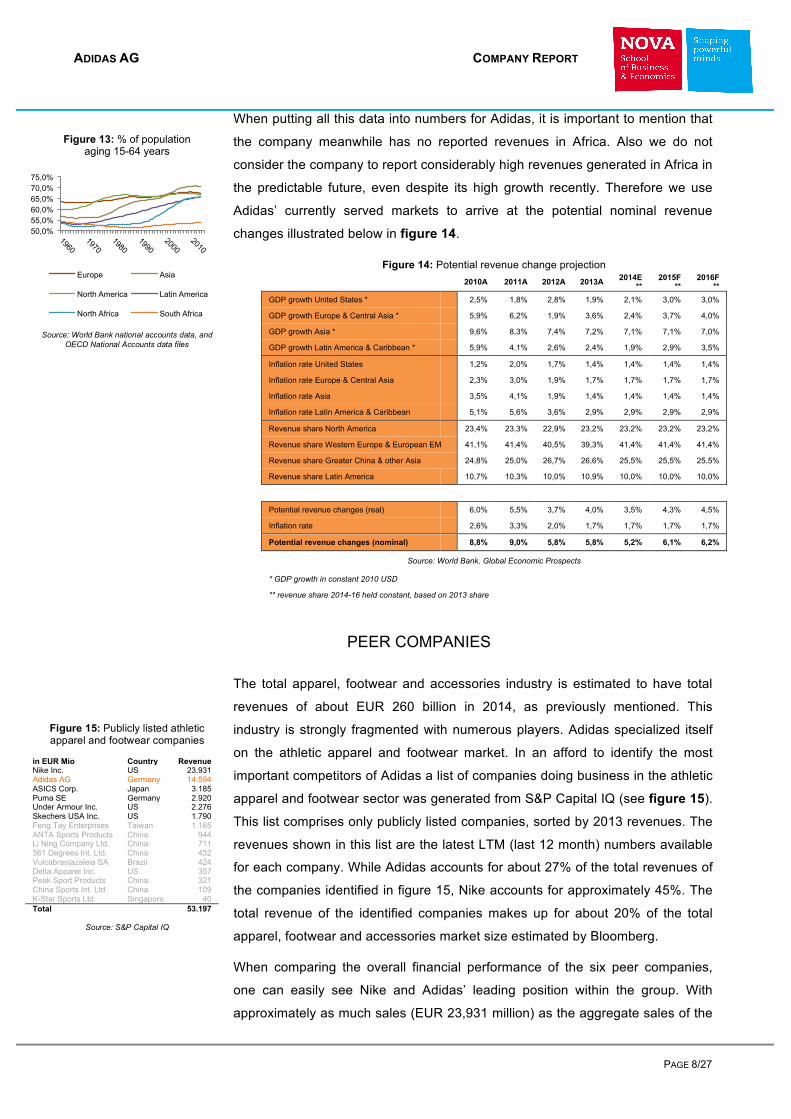
When putting all this data into numbers for Adidas, it is important to mention that
the company meanwhile has no reported revenues in Africa. Also we do not
consider the company to report considerably high revenues generated in Africa in
the predictable future, even despite its high growth recently. Therefore we use
Adidas’ currently served markets to arrive at the potential nominal revenue
changes illustrated below in figure 14.
Figure 14: Potential revenue change projection
2010A 2011A 2012A 2013A 2014E **
2015F **
2016F **
GDP growth United States * 2,5% 1,8% 2,8% 1,9% 2,1% 3,0% 3,0%
GDP growth Europe & Central Asia * 5,9% 6,2% 1,9% 3,6% 2,4% 3,7% 4,0%
GDP growth Asia * 9,6% 8,3% 7,4% 7,2% 7,1% 7,1% 7,0%
GDP growth Latin America & Caribbean * 5,9% 4,1% 2,6% 2,4% 1,9% 2,9% 3,5%
Inflation rate United States 1,2% 2,0% 1,7% 1,4% 1,4% 1,4% 1,4%
Inflation rate Europe & Central Asia 2,3% 3,0% 1,9% 1,7% 1,7% 1,7% 1,7%
Inflation rate Asia 3,5% 4,1% 1,9% 1,4% 1,4% 1,4% 1,4%
Inflation rate Latin America & Caribbean 5,1% 5,6% 3,6% 2,9% 2,9% 2,9% 2,9%
Revenue share North America 23,4% 23,3% 22,9% 23,2% 23,2% 23,2% 23,2%
Revenue share Western Europe & European EM 41,1% 41,4% 40,5% 39,3% 41,4% 41,4% 41,4%
Revenue share Greater China & other Asia 24,8% 25,0% 26,7% 26,6% 25,5% 25,5% 25,5%
Revenue share Latin America 10,7% 10,3% 10,0% 10,9% 10,0% 10,0% 10,0%
Potential revenue changes (real) 6,0% 5,5% 3,7% 4,0% 3,5% 4,3% 4,5%
Inflation rate 2,6% 3,3% 2,0% 1,7% 1,7% 1,7% 1,7%
Potential revenue changes (nominal) 8,8% 9,0% 5,8% 5,8% 5,2% 6,1% 6,2%
Source: World Bank, Global Economic Prospects
* GDP growth in constant 2010 USD
** revenue share 2014-16 held constant, based on 2013 share
PEER COMPANIES
The total apparel, footwear and accessories industry is estimated to have total
revenues of about EUR 260 billion in 2014, as previously mentioned. This
industry is strongly fragmented with numerous players. Adidas specialized itself
on the athletic apparel and footwear market. In an afford to identify the most
important competitors of Adidas a list of companies doing business in the athletic
apparel and footwear sector was generated from S&P Capital IQ (see figure 15).
This list comprises only publicly listed companies, sorted by 2013 revenues. The
revenues shown in this list are the latest LTM (last 12 month) numbers available
for each company. While Adidas accounts for about 27% of the total revenues of
the companies identified in figure 15, Nike accounts for approximately 45%. The
total revenue of the identified companies makes up for about 20% of the total
apparel, footwear and accessories market size estimated by Bloomberg.
When comparing the overall financial performance of the six peer companies,
one can easily see Nike and Adidas’ leading position within the group. With
approximately as much sales (EUR 23,931 million) as the aggregate sales of the
in EUR Mio Country Revenue Nike Inc. US 23.931 Adidas AG Germany 14.594 ASICS Corp. Japan 3.185 Puma SE Germany 2.920 Under Armour Inc. US 2.276 Skechers USA Inc. US 1.790 Feng Tay Enterprises Taiwan 1.165 ANTA Sports Products China 944 Li Ning Company Ltd. China 711 361 Degrees Int. Ltd. China 432 Vulcabras|azaleia SA Brazil 424 Delta Apparel Inc. US 357 Peak Sport Products China 321 China Sports Int. Ltd. China 109 K-Star Sports Ltd. Singapore 40 Total 53.197
50,0% 55,0% 60,0% 65,0% 70,0% 75,0%
Figure 13: % of population aging 15-64 years
Europe Asia
North America Latin America
North Africa South Africa
Source: World Bank national accounts data, and OECD National Accounts data files
Figure 15: Publicly listed athletic apparel and footwear companies
Source: S&P Capital IQ

ADIDAS AG COMPANY REPORT
PAGE 9/27
other companies, Nike is the biggest company in the peer group. Nike is also the
leading company when it comes to EBITDA margin (15%) and income margin
(10%) (see figure 16).
As one can easily see, the most important area for the peer group identified is
North America, accounting for roughly 39% of sales generated, followed by the
European area, in which about 29% of total sales were earned. The biggest
player in North America is without doubt Nike, earning more revenues than the
aggregated other five companies shown (see figure 17). The distinct market
leadership in terms of revenues in the industry’s most important market America
and the stalemate in Europe gives Nike a very strong competitive advantage over
Adidas. Within the American market there are also local players who emerged in
recent years, like Under Armour, which managed to quadruple revenues in the
past 5 years to about EUR 2,275 million currently.
45% 48% 44% 46% 49%
45%
15% 8%
12%
1%
13% 11% 10% 4% 7% 6% 6%
0%
10%
20%
30%
40%
50%
60%
€ 0
€ 5.000
€ 10.000
€ 15.000
€ 20.000
€ 25.000
Nike Inc. Adidas AG ASICS Corp. Puma SE Under Armour Inc. Skechers USA Inc.
Figure 16: Financial performance in Mio EUR and margins in % (2013)
Revenue Gross Profit EBITDA Net Income
% Gross Margin % EBITDA Margin % Income Margin
Nike Inc. Adidas AG ASICS Corp. Puma SE Under Armour Inc.
Skechers USA Inc.
others 1.547 - -13 331 189 543
Japan 613 - 866 - - -
China 2.281 1.733 259 - - -
Emerging Markets 3.238 3.762 152 562 - -
North America 10.548 3.100 997 919 2.086 1.246
Europe 5.705 5.999 924 1.108 - -
€ 0
€ 5.000
€ 10.000
€ 15.000
€ 20.000
€ 25.000
€ 30.000
Figure 17: revenues per region in EUR Mio (2013)
Source: S&P Capital IQ
Source: S&P Capital IQ
Adidas has comparably low EBITDA and income margins but high gross margin…
North America accounts for 39% of sales generated by peer group…
Local players emerged and rose in recent years…
Nike has distinct market leadership in North America…

ADIDAS AG COMPANY REPORT
PAGE 10/27
Adidas stated in its latest Q3 report that regaining share in the North American
market is the top priority, carrying out significant changes in Management and
investing in NBA athletes and the NFL. The marketing working budget
expenditures increased by 8% overall, 11% for adidas and 8% for Reebok. As
can be seen in figure 16, while Nike has about 60% higher revenues, the
marketing budgets for both companies are almost the same (see figure 18). This
affects the EBITDA margin of Adidas negatively and explains why Adidas has a
significantly lower EBITDA margin than Nike (8% vs 15%), despite having a
higher gross margin (48% vs 45%).
Nike
Nike can by far be considered Adidas’ main competitor. The company is currently
holding the market leadership and was leading the market in terms of revenues
for the past 10 years (see figure 19). Although in past years, Adidas was able to
lessen the gap, since 2011 Nike is again starting to increase its lead. Using the
latest numbers, while Adidas was able to be more efficient when it comes to
gross margin, Nike was able to achieve a higher EBITDA and profit margin (see
figure 16). As previously mentioned this is mainly due to the increasing
marketing effort of Adidas.
Nike’s dominant position in the North American market, which is considered the
most important in the sporting goods industry, gives the company a big
advantage. The extent can be seen in figure 17. Nike is able to generate more
than triple the revenues of Adidas in the North American market. These revenues
alone are about 2/3 of Adidas’ total revenues. The equity markets also tend to
value Nike’s earnings with a higher P/E ratio. While one can see from figure 1
that an investment in Adidas and Nike would have approximately yielded the
same returns until 2013, it becomes obvious from figure 20 that the equity
market tends to value revenues generated by Nike at a higher P/E ratio than the
ones generated by Adidas.
Nike faces not only competition by Adidas, its closest competitor, but also from
companies such as Under Armour. This company specialized itself in some niche
markets in North America, like martial arts apparel and thermo underwear.
However, despite its high sales growth (400% within the last 5 years), the
company is not considered as a major threat for Nike or Adidas in the near future.
c) BRAND OVERVIEW
Adidas AG separates its business by its brands. The original brand, adidas, is
separated into adidas Sport Performance, adidas Sport Style and adidas
Originals. All three of them generated EUR 11 billion worth of sales in 2013. As
2.223 1.882
186
978
179 86
11% 13% 8%
33%
11% 6%
0% 5% 10% 15% 20% 25% 30% 35%
€ 0
€ 500
€ 1.000
€ 1.500
€ 2.000
€ 2.500
Figure 18: marketing expenses in Mio EUR and % sales (2013)
Marketing exp. Marketing % sales
Source: S&P Capital IQ
€ 20.416
€ 14.492
€ 0
€ 5.000
€ 10.000
€ 15.000
€ 20.000
€ 25.000
Figure 19: Adidas vs Nike revenue historical EUR Mio
Nike Adidas
Source: Adidas Annual Reports, Nike Annual Reports
16.0
24.9
10 12 14 16 18 20 22 24 26 28
2009 2010 2011 2012 2013
Figure 20: Adidas vs Nike Forward P/E ratio
Adidas Nike
Source: S&P Capital IQ
ADIDAS AG COMPANY REPORT
PAGE 11/27
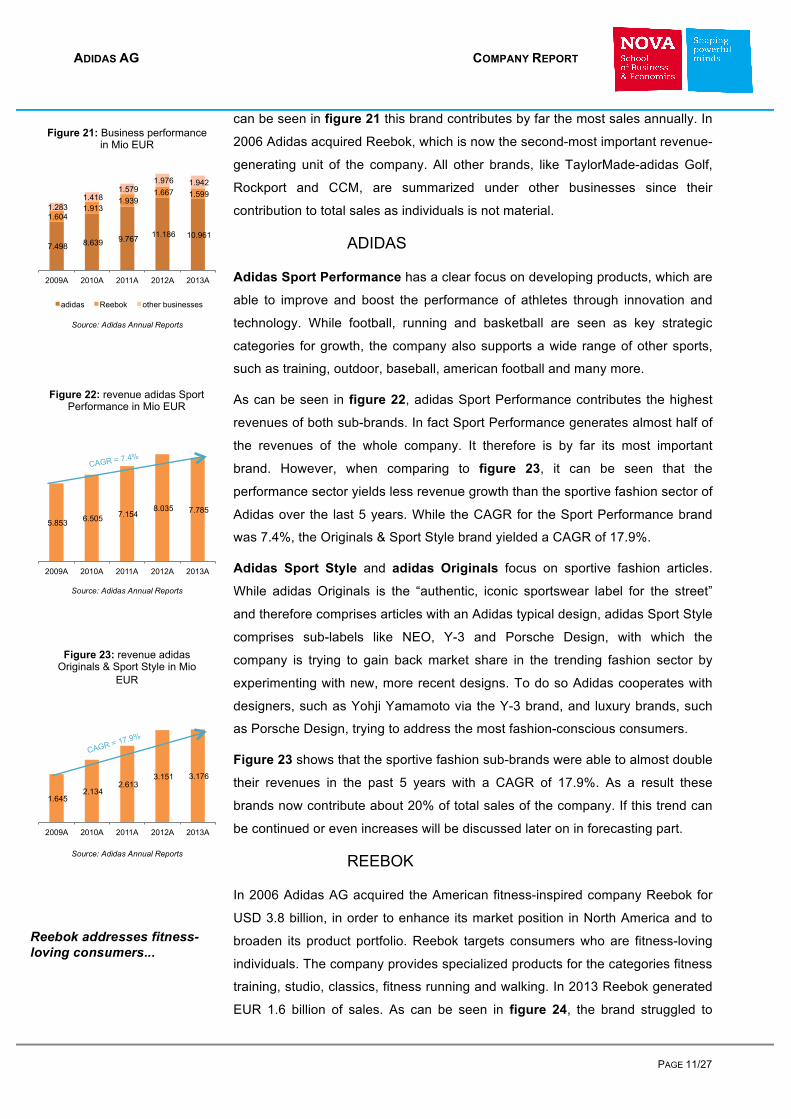
can be seen in figure 21 this brand contributes by far the most sales annually. In
2006 Adidas acquired Reebok, which is now the second-most important revenue-
generating unit of the company. All other brands, like TaylorMade-adidas Golf,
Rockport and CCM, are summarized under other businesses since their
contribution to total sales as individuals is not material.
ADIDAS
Adidas Sport Performance has a clear focus on developing products, which are
able to improve and boost the performance of athletes through innovation and
technology. While football, running and basketball are seen as key strategic
categories for growth, the company also supports a wide range of other sports,
such as training, outdoor, baseball, american football and many more.
As can be seen in figure 22, adidas Sport Performance contributes the highest
revenues of both sub-brands. In fact Sport Performance generates almost half of
the revenues of the whole company. It therefore is by far its most important
brand. However, when comparing to figure 23, it can be seen that the
performance sector yields less revenue growth than the sportive fashion sector of
Adidas over the last 5 years. While the CAGR for the Sport Performance brand
was 7.4%, the Originals & Sport Style brand yielded a CAGR of 17.9%.
Adidas Sport Style and adidas Originals focus on sportive fashion articles.
While adidas Originals is the “authentic, iconic sportswear label for the street”
and therefore comprises articles with an Adidas typical design, adidas Sport Style
comprises sub-labels like NEO, Y-3 and Porsche Design, with which the
company is trying to gain back market share in the trending fashion sector by
experimenting with new, more recent designs. To do so Adidas cooperates with
designers, such as Yohji Yamamoto via the Y-3 brand, and luxury brands, such
as Porsche Design, trying to address the most fashion-conscious consumers.
Figure 23 shows that the sportive fashion sub-brands were able to almost double
their revenues in the past 5 years with a CAGR of 17.9%. As a result these
brands now contribute about 20% of total sales of the company. If this trend can
be continued or even increases will be discussed later on in forecasting part.
REEBOK
In 2006 Adidas AG acquired the American fitness-inspired company Reebok for
USD 3.8 billion, in order to enhance its market position in North America and to
broaden its product portfolio. Reebok targets consumers who are fitness-loving
individuals. The company provides specialized products for the categories fitness
training, studio, classics, fitness running and walking. In 2013 Reebok generated
EUR 1.6 billion of sales. As can be seen in figure 24, the brand struggled to
Reebok addresses fitness-loving consumers...
7.498 8.639 9.767 11.186 10.961
1.604 1.913
1.939 1.667 1.599
1.283 1.418
1.579 1.976 1.942
2009A 2010A 2011A 2012A 2013A
Figure 21: Business performance in Mio EUR
adidas Reebok other businesses
Source: Adidas Annual Reports
5.853 6.505 7.154 8.035 7.785
2009A 2010A 2011A 2012A 2013A
Figure 22: revenue adidas Sport Performance in Mio EUR
Source: Adidas Annual Reports
CAGR = 7.4%
1.645 2.134
2.613 3.151 3.176
2009A 2010A 2011A 2012A 2013A
Figure 23: revenue adidas Originals & Sport Style in Mio
EUR
Source: Adidas Annual Reports
CAGR = 17.9%
ADIDAS AG COMPANY REPORT
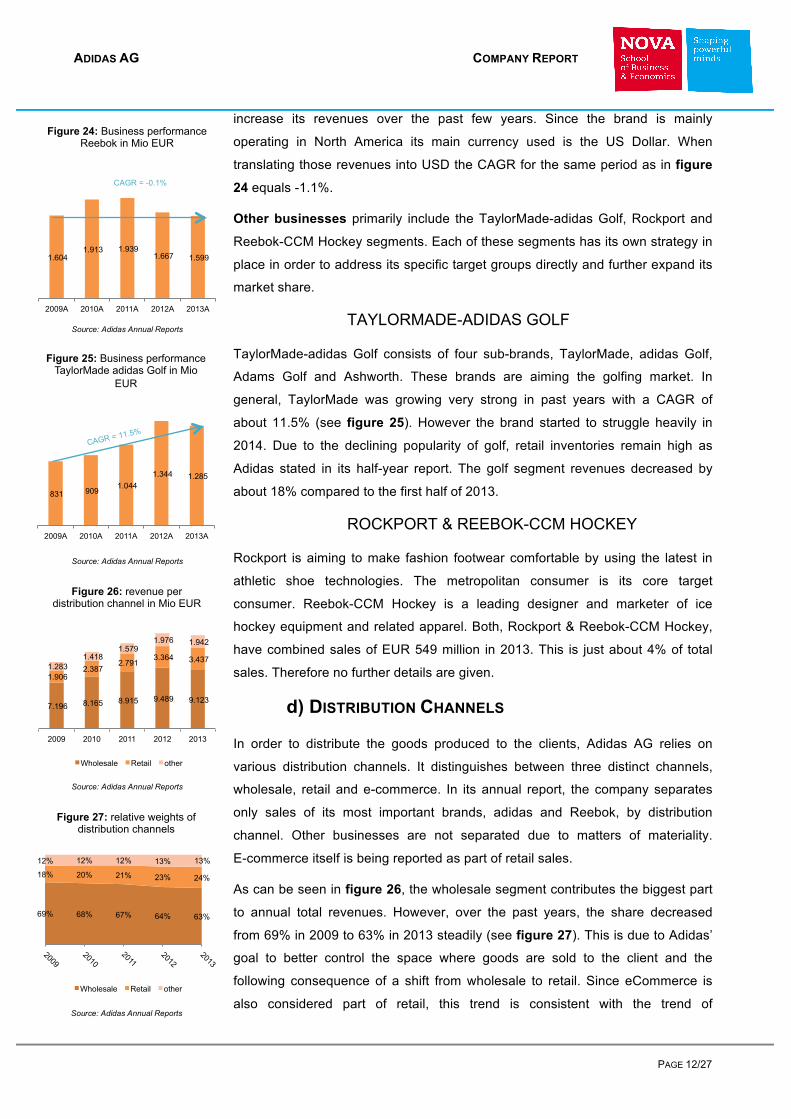
PAGE 12/27
increase its revenues over the past few years. Since the brand is mainly
operating in North America its main currency used is the US Dollar. When
translating those revenues into USD the CAGR for the same period as in figure
24 equals -1.1%.
Other businesses primarily include the TaylorMade-adidas Golf, Rockport and
Reebok-CCM Hockey segments. Each of these segments has its own strategy in
place in order to address its specific target groups directly and further expand its
market share.
TAYLORMADE-ADIDAS GOLF
TaylorMade-adidas Golf consists of four sub-brands, TaylorMade, adidas Golf,
Adams Golf and Ashworth. These brands are aiming the golfing market. In
general, TaylorMade was growing very strong in past years with a CAGR of
about 11.5% (see figure 25). However the brand started to struggle heavily in
2014. Due to the declining popularity of golf, retail inventories remain high as
Adidas stated in its half-year report. The golf segment revenues decreased by
about 18% compared to the first half of 2013.
ROCKPORT & REEBOK-CCM HOCKEY
Rockport is aiming to make fashion footwear comfortable by using the latest in
athletic shoe technologies. The metropolitan consumer is its core target
consumer. Reebok-CCM Hockey is a leading designer and marketer of ice
hockey equipment and related apparel. Both, Rockport & Reebok-CCM Hockey,
have combined sales of EUR 549 million in 2013. This is just about 4% of total
sales. Therefore no further details are given.
d) DISTRIBUTION CHANNELS
In order to distribute the goods produced to the clients, Adidas AG relies on
various distribution channels. It distinguishes between three distinct channels,
wholesale, retail and e-commerce. In its annual report, the company separates
only sales of its most important brands, adidas and Reebok, by distribution
channel. Other businesses are not separated due to matters of materiality.
E-commerce itself is being reported as part of retail sales.
As can be seen in figure 26, the wholesale segment contributes the biggest part
to annual total revenues. However, over the past years, the share decreased
from 69% in 2009 to 63% in 2013 steadily (see figure 27). This is due to Adidas’
goal to better control the space where goods are sold to the client and the
following consequence of a shift from wholesale to retail. Since eCommerce is
also considered part of retail, this trend is consistent with the trend of
1.604 1.913 1.939
1.667 1.599
2009A 2010A 2011A 2012A 2013A
Figure 24: Business performance Reebok in Mio EUR
Source: Adidas Annual Reports
CAGR = -0.1%
831 909 1.044 1.344 1.285
2009A 2010A 2011A 2012A 2013A
Figure 25: Business performance TaylorMade adidas Golf in Mio
EUR
Source: Adidas Annual Reports
CAGR = 11.5%
7.196 8.165 8.915 9.489 9.123
1.906 2.387
2.791 3.364 3.437
1.283 1.418
1.579 1.976 1.942
2009 2010 2011 2012 2013
Figure 26: revenue per distribution channel in Mio EUR
Wholesale Retail other
Source: Adidas Annual Reports
Source: Adidas Annual Reports
69% 68% 67% 64% 63%
18% 20% 21% 23% 24%
12% 12% 12% 13% 13%
Figure 27: relative weights of distribution channels
Wholesale Retail other
ADIDAS AG COMPANY REPORT
PAGE 13/27
Source: Adidas Annual Reports
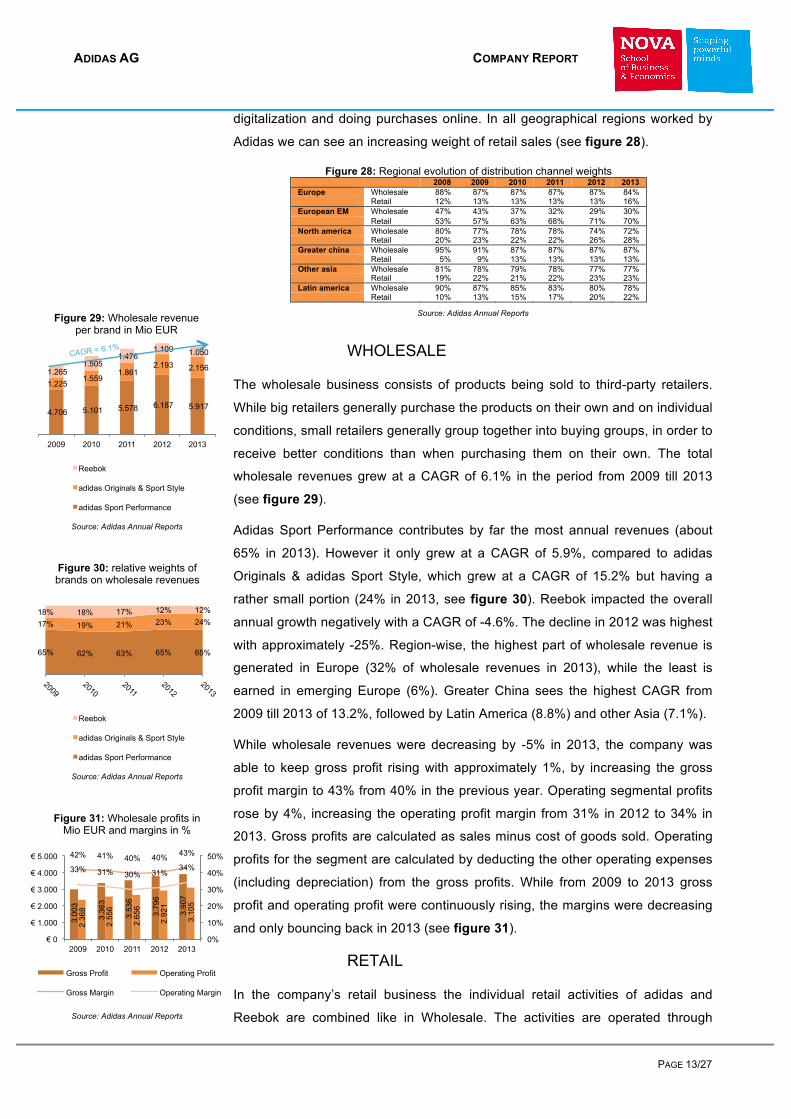
digitalization and doing purchases online. In all geographical regions worked by
Adidas we can see an increasing weight of retail sales (see figure 28).
Figure 28: Regional evolution of distribution channel weights 2008 2009 2010 2011 2012 2013 Europe Wholesale 88% 87% 87% 87% 87% 84% Retail 12% 13% 13% 13% 13% 16% European EM Wholesale 47% 43% 37% 32% 29% 30% Retail 53% 57% 63% 68% 71% 70% North america Wholesale 80% 77% 78% 78% 74% 72% Retail 20% 23% 22% 22% 26% 28% Greater china Wholesale 95% 91% 87% 87% 87% 87% Retail 5% 9% 13% 13% 13% 13% Other asia Wholesale 81% 78% 79% 78% 77% 77% Retail 19% 22% 21% 22% 23% 23% Latin america Wholesale 90% 87% 85% 83% 80% 78% Retail 10% 13% 15% 17% 20% 22%
WHOLESALE
The wholesale business consists of products being sold to third-party retailers.
While big retailers generally purchase the products on their own and on individual
conditions, small retailers generally group together into buying groups, in order to
receive better conditions than when purchasing them on their own. The total
wholesale revenues grew at a CAGR of 6.1% in the period from 2009 till 2013
(see figure 29).
Adidas Sport Performance contributes by far the most annual revenues (about
65% in 2013). However it only grew at a CAGR of 5.9%, compared to adidas
Originals & adidas Sport Style, which grew at a CAGR of 15.2% but having a
rather small portion (24% in 2013, see figure 30). Reebok impacted the overall
annual growth negatively with a CAGR of -4.6%. The decline in 2012 was highest
with approximately -25%. Region-wise, the highest part of wholesale revenue is
generated in Europe (32% of wholesale revenues in 2013), while the least is
earned in emerging Europe (6%). Greater China sees the highest CAGR from
2009 till 2013 of 13.2%, followed by Latin America (8.8%) and other Asia (7.1%).
While wholesale revenues were decreasing by -5% in 2013, the company was
able to keep gross profit rising with approximately 1%, by increasing the gross
profit margin to 43% from 40% in the previous year. Operating segmental profits
rose by 4%, increasing the operating profit margin from 31% in 2012 to 34% in
2013. Gross profits are calculated as sales minus cost of goods sold. Operating
profits for the segment are calculated by deducting the other operating expenses
(including depreciation) from the gross profits. While from 2009 to 2013 gross
profit and operating profit were continuously rising, the margins were decreasing
and only bouncing back in 2013 (see figure 31).
RETAIL
In the company’s retail business the individual retail activities of adidas and
Reebok are combined like in Wholesale. The activities are operated through
65% 62% 63% 65% 65%
17% 19% 21% 23% 24% 18% 18% 17% 12% 12%
Figure 30: relative weights of brands on wholesale revenues
Reebok
adidas Originals & Sport Style
adidas Sport Performance
Source: Adidas Annual Reports
4.706 5.101 5.578 6.187 5.917
1.225 1.559
1.861 2.193 2.156 1.265
1.505 1.476
1.109 1.050
2009 2010 2011 2012 2013
Figure 29: Wholesale revenue per brand in Mio EUR
Reebok
adidas Originals & Sport Style
adidas Sport Performance
Source: Adidas Annual Reports
CAGR = 6.1%
3.0
03
3.3
63
3.5
36
3.7
96
3.9
07
2.3
68
2.5
56
2.6
56
2.9
21
3.1
05
42% 41% 40% 40% 43%
33% 31% 30% 31% 34%
0%
10%
20%
30%
40%
50%
€ 0
€ 1.000
€ 2.000
€ 3.000
€ 4.000
€ 5.000
2009 2010 2011 2012 2013
Figure 31: Wholesale profits in Mio EUR and margins in %
Gross Profit Operating Profit
Gross Margin Operating Margin
Source: Adidas Annual Reports
1.1
16
1.4
74
1.7
47
2.0
46
2.1
34
267
450
591
715
669
59% 62% 63% 61% 62%
14% 19% 21% 21% 19%
0% 10% 20% 30% 40% 50% 60% 70%
€ 0
€ 500
€ 1.000
€ 1.500
€ 2.000
€ 2.500
2009 2010 2011 2012 2013
Figure 34: Retail profits in Mio EUR and margins in %
Gross Profit Operating Profit
Gross Margin Operating Margin
ADIDAS AG COMPANY REPORT
PAGE 14/27
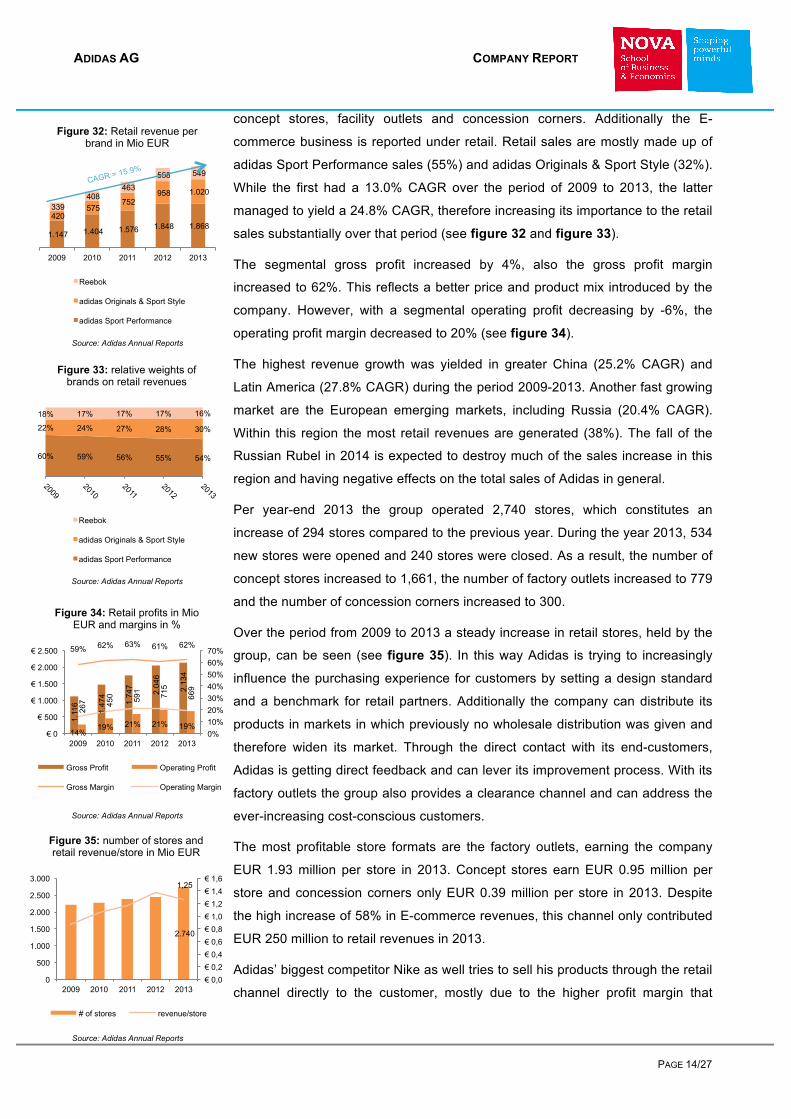
concept stores, facility outlets and concession corners. Additionally the E-
commerce business is reported under retail. Retail sales are mostly made up of
adidas Sport Performance sales (55%) and adidas Originals & Sport Style (32%).
While the first had a 13.0% CAGR over the period of 2009 to 2013, the latter
managed to yield a 24.8% CAGR, therefore increasing its importance to the retail
sales substantially over that period (see figure 32 and figure 33).
The segmental gross profit increased by 4%, also the gross profit margin
increased to 62%. This reflects a better price and product mix introduced by the
company. However, with a segmental operating profit decreasing by -6%, the
operating profit margin decreased to 20% (see figure 34).
The highest revenue growth was yielded in greater China (25.2% CAGR) and
Latin America (27.8% CAGR) during the period 2009-2013. Another fast growing
market are the European emerging markets, including Russia (20.4% CAGR).
Within this region the most retail revenues are generated (38%). The fall of the
Russian Rubel in 2014 is expected to destroy much of the sales increase in this
region and having negative effects on the total sales of Adidas in general.
Per year-end 2013 the group operated 2,740 stores, which constitutes an
increase of 294 stores compared to the previous year. During the year 2013, 534
new stores were opened and 240 stores were closed. As a result, the number of
concept stores increased to 1,661, the number of factory outlets increased to 779
and the number of concession corners increased to 300.
Over the period from 2009 to 2013 a steady increase in retail stores, held by the
group, can be seen (see figure 35). In this way Adidas is trying to increasingly
influence the purchasing experience for customers by setting a design standard
and a benchmark for retail partners. Additionally the company can distribute its
products in markets in which previously no wholesale distribution was given and
therefore widen its market. Through the direct contact with its end-customers,
Adidas is getting direct feedback and can lever its improvement process. With its
factory outlets the group also provides a clearance channel and can address the
ever-increasing cost-conscious customers.
The most profitable store formats are the factory outlets, earning the company
EUR 1.93 million per store in 2013. Concept stores earn EUR 0.95 million per
store and concession corners only EUR 0.39 million per store in 2013. Despite
the high increase of 58% in E-commerce revenues, this channel only contributed
EUR 250 million to retail revenues in 2013.
Adidas’ biggest competitor Nike as well tries to sell his products through the retail
channel directly to the customer, mostly due to the higher profit margin that
1.147 1.404 1.576 1.848 1.868 420
575 752
958 1.020
339 408
463 558 549
2009 2010 2011 2012 2013
Figure 32: Retail revenue per brand in Mio EUR
Reebok
adidas Originals & Sport Style
adidas Sport Performance
Source: Adidas Annual Reports
CAGR = 15.9%
60% 59% 56% 55% 54%
22% 24% 27% 28% 30%
18% 17% 17% 17% 16%
Figure 33: relative weights of brands on retail revenues
Reebok
adidas Originals & Sport Style
adidas Sport Performance
Source: Adidas Annual Reports
1.1
16
1.4
74
1.7
47
2.0
46
2.1
34
267
450
591
715
669
59% 62% 63% 61% 62%
14% 19% 21% 21% 19%
0% 10% 20% 30% 40% 50% 60% 70%
€ 0
€ 500
€ 1.000
€ 1.500
€ 2.000
€ 2.500
2009 2010 2011 2012 2013
Figure 34: Retail profits in Mio EUR and margins in %
Gross Profit Operating Profit
Gross Margin Operating Margin
Source: Adidas Annual Reports
Source: Adidas Annual Reports
2.740
1,25
€ 0,0 € 0,2 € 0,4 € 0,6 € 0,8 € 1,0 € 1,2 € 1,4 € 1,6
0
500
1.000
1.500
2.000
2.500
3.000
2009 2010 2011 2012 2013
Figure 35: number of stores and retail revenue/store in Mio EUR
# of stores revenue/store
ADIDAS AG COMPANY REPORT
PAGE 15/27
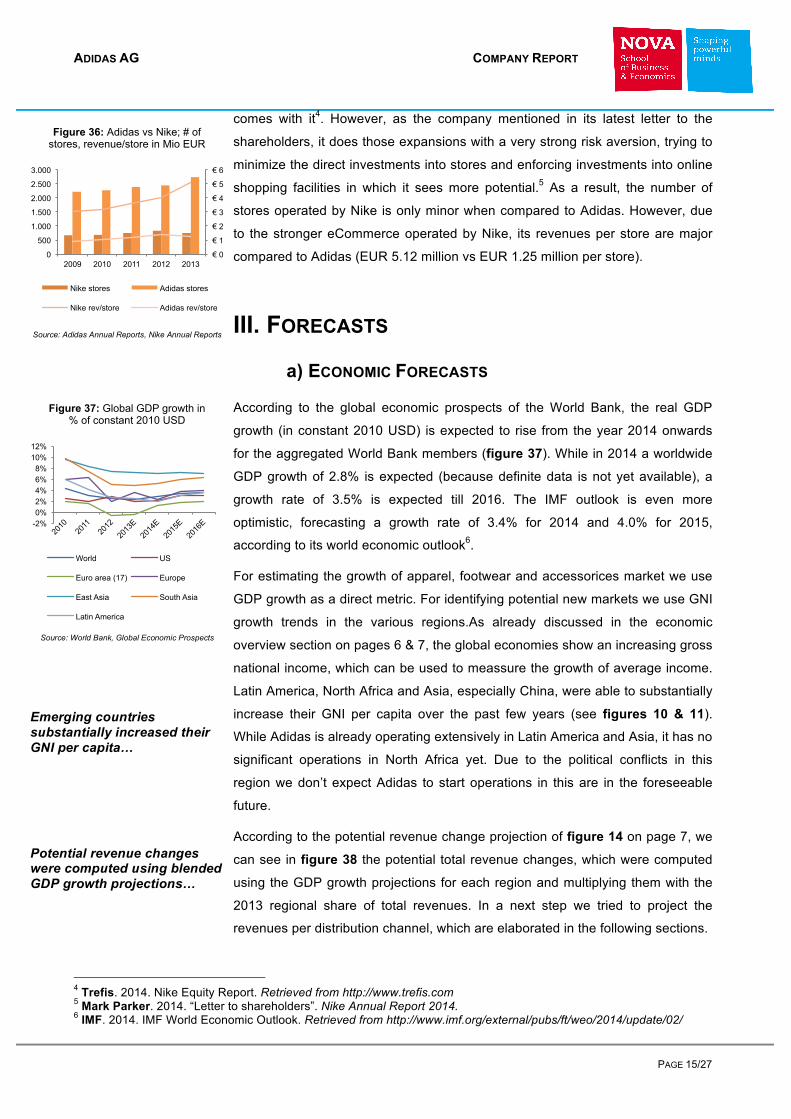
comes with it4. However, as the company mentioned in its latest letter to the
shareholders, it does those expansions with a very strong risk aversion, trying to
minimize the direct investments into stores and enforcing investments into online
shopping facilities in which it sees more potential.5 As a result, the number of
stores operated by Nike is only minor when compared to Adidas. However, due
to the stronger eCommerce operated by Nike, its revenues per store are major
compared to Adidas (EUR 5.12 million vs EUR 1.25 million per store).
III. FORECASTS
a) ECONOMIC FORECASTS
According to the global economic prospects of the World Bank, the real GDP
growth (in constant 2010 USD) is expected to rise from the year 2014 onwards
for the aggregated World Bank members (figure 37). While in 2014 a worldwide
GDP growth of 2.8% is expected (because definite data is not yet available), a
growth rate of 3.5% is expected till 2016. The IMF outlook is even more
optimistic, forecasting a growth rate of 3.4% for 2014 and 4.0% for 2015,
according to its world economic outlook6.
For estimating the growth of apparel, footwear and accessorices market we use
GDP growth as a direct metric. For identifying potential new markets we use GNI
growth trends in the various regions.As already discussed in the economic
overview section on pages 6 & 7, the global economies show an increasing gross
national income, which can be used to meassure the growth of average income.
Latin America, North Africa and Asia, especially China, were able to substantially
increase their GNI per capita over the past few years (see figures 10 & 11).
While Adidas is already operating extensively in Latin America and Asia, it has no
significant operations in North Africa yet. Due to the political conflicts in this
region we don’t expect Adidas to start operations in this are in the foreseeable
future.
According to the potential revenue change projection of figure 14 on page 7, we
can see in figure 38 the potential total revenue changes, which were computed
using the GDP growth projections for each region and multiplying them with the
2013 regional share of total revenues. In a next step we tried to project the
revenues per distribution channel, which are elaborated in the following sections.
4 Trefis. 2014. Nike Equity Report. Retrieved from http://www.trefis.com 5 Mark Parker. 2014. “Letter to shareholders”. Nike Annual Report 2014. 6 IMF. 2014. IMF World Economic Outlook. Retrieved from http://www.imf.org/external/pubs/ft/weo/2014/update/02/
-2% 0% 2% 4% 6% 8%
10% 12%
Figure 37: Global GDP growth in % of constant 2010 USD
World US
Euro area (17) Europe
East Asia South Asia
Latin America
Source: World Bank, Global Economic Prospects
Emerging countries substantially increased their GNI per capita…
Potential revenue changes were computed using blended GDP growth projections…
Source: Adidas Annual Reports, Nike Annual Reports
€ 0
€ 1
€ 2
€ 3
€ 4
€ 5
€ 6
0
500
1.000
1.500
2.000
2.500
3.000
2009 2010 2011 2012 2013
Figure 36: Adidas vs Nike; # of stores, revenue/store in Mio EUR
Nike stores Adidas stores
Nike rev/store Adidas rev/store

ADIDAS AG COMPANY REPORT
PAGE 16/27
The result is the projected currency neutral revenue changes line in figure 38. In
line with our sentiment, that Adidas will not achieve to grow above the GDP
growth of the areas it is operating in, we can see a lower than potential currency
neutral nominal revenue change.
We see the reason for this in the fact that Adidas still lacks the outstanding
products and technology to get one up on Nike, its most severe competitor. Also
the rise of small niche suppliers in the industry, such as Under Armour is
expected to cost the established market leaders market share. In 2014 we
additionally expect negative forex effects of -7% (-6% in 2013) on total sales,
mostly due to the steep fall of the Russian Rubel and the comparably strong Euro
at the beginning of the year. However these effects are expected to decline
significantly in 2015 (-5%) and 2016 (-2%).
Figure 38: Potential revenue change projection
2010A 2011A 2012A 2013A 2014E **
2015F **
2016F **
Potential revenue changes (real) 6,0% 5,5% 3,7% 4,0% 3,5% 4,3% 4,5%
Inflation rate 2,6% 3,3% 2,0% 1,7% 1,7% 1,7% 1,7%
Potential revenue changes (nominal) 8,8% 9,0% 5,8% 5,8% 5,2% 6,1% 6,2%
Actual / projected currency neutral revenue changes 8,9% 13,1% 7,8% 3,3% 1,5% 4,3% 4,8%
Source: World Bank, Global Economic Prospects, Analysts estimates
* GDP growth in constant 2010 USD
** revenue share 2014-16 held constant, based on 2013 share
b) SEGMENTAL FORECASTS
WHOLESALE
For the wholesale segment we estimate relatively slow growth. Adidas Sport
Performance and adidas Originals & Sport Style are projected by us to rise at an
average currency neutral nominal growth of 2% and 4% respectively over the
upcoming periods due to increasing competition from specialists in the sport
performance industry, as well as slowing growth expectations in Adidas’ most
important wholesale growth markets Latin America and Asia (see figure 37).
Additionally, in our opinion, Adidas still lacks the outstanding products and
technology to get one up on Nike and become market leader in any sector. Even
though CEO Herbert Hainer announced to tackle the issue of a lacking
competitiveness and revitalization of the North American business in the course
of a restructuring, it is estimated that the effects will not have any noticeable
impact in the near future, also due to the homogeneity of the products. The
restructuring process itself aims on stabilizing performance in the weaker
business areas such as golf, enhancing the process flow in the marketing
organization and increasing marketing expenditures in mature markets. Reebok
Source: Analst’s estimates
5.917 5.562 5.395 5.395 5.503 5.613
2.156 2.048 2.028 2.068 2.151 2.237 1.050 982 952 962 991 1.020
2013A 2014E 2015F 2016F 2017F 2018F
Figure 39: Estimated wholesale revenues in Mio EUR
Reebok
adidas Originals & Sport Style
adidas Sport Performance
Source: Analst’s estimates
9.100 8.592 8.375 8.425 8.645 8.871
3.884 3.609 3.518 3.539 3.631 3.726
3.082 2.895 2.806 2.806 2.861 2.927
2013A 2014E 2015F 2016F 2017F 2018F
Figure 40: Estimated wholesale profits in Mio EUR
Sales Operating Profit Gross Profit
Adidas is expected to grow below GDP growth…
Negative forex effects of -7% are expected in 2014…

ADIDAS AG COMPANY REPORT
PAGE 17/27
is expected by us to recover slowly and grow to an average currency neutral
nominal change of 3%, starting in 2017. Our estimations for wholesale revenues
can be seen in figure 39.
We expect the gross margin7 to be constant at an historic average rate of 42%.
This is due to the relative predictability of cost of sales. Because of the
announced marketing initiative and increases in sizeable sponsoring contracts
the operating margin is expected to decrease slightly to its historic average of
33%. From our point of view, incremental cost of restructuring activities will also
put pressure on the operating margin. For the estimated operating and gross
profits see figure 40.
RETAIL
We expect the retail segment to grow the largest among all segments. The
currency neutral annual revenue nominal growth rate for adidas Sport
Performance is expected to rise at a constant rate of 8% from 2015 onwards.
Adidas Originals & Sport Style is expected to rise on average at a nominal 14%
on a currency neutral basis from 2015 onwards (figure 41). We justify this by the
fact that the retail business still gives the company the chance to open up
markets, which are not yet fully covered by the wholesale business. Also the
increasing marketing activities are expected to increase sales mainly in directly
owned retail shops. For the Russian market however, the company plans to
decrease exposure by lowering the number of shops. This will prevent the
potential higher growth to become effective, however at the same time it limits
the risk in this currently volatile region.
The gross margin is expected to stay at approximately 62%. The operating
margin is expected to increase from 20% in 2014 to 22% by 2016 and onwards.
The increasing marketing budget will put pressure on the operating margin,
however we expect this effect to be mainly offset by increased efficiencies on the
management of global brands and global sales. Our estimations for retail gross
and operating profit can be found in figure 42.
Due to the announced adoption of future investments to the current market risks,
especially in Russia, and the also announced enhanced closing of Russian retail
stores, we expect fewer net store openings, i.e. store opening minus store
closings, in 2014 and 2015. However, we expect the openings to rise again to
come up to the expansionary strategy of the company (see figure 43).
7 Gross margin = gross profit / sales ; gross profit = sales – COGS ; operating profit = gross profit – OPEX
Source: Analst’s estimates
1.868 1.868 1.924 2.039 2.203 2.379
1.020 1.051 1.124 1.259 1.448 1.665 549 522 516 537 575 615
2013A 2014E 2015F 2016F 2017F 2018F
Figure 41: Estimated retail revenues in Mio EUR
Reebok
adidas Originals & Sport Style
adidas Sport Performance
Source: Analst’s estimates
3.446 3.440 3.565 3.836 4.225 4.659
2.143 2.133 2.210 2.378 2.620 2.888
678 688 731 805 908 1.025
2013A 2014E 2015F 2016F 2017F 2018F
Figure 42: Estimated retail profits in Mio EUR
Sales Operating Profit Gross Profit
Source: Analst’s estimates
3.068 3.316 3.462 3.587 3.860 4.252
369 124 103 248 365
407 294
103 84
203
296 328
- 50 100 150 200 250 300 350
€ 0
€ 1.000
€ 2.000
€ 3.000
€ 4.000
€ 5.000
Figure 43: Estimated store openings and incremental sales in Mio EUR
Incremental Sales
Like-for-like sales
Store Openings
ADIDAS AG COMPANY REPORT
PAGE 18/27
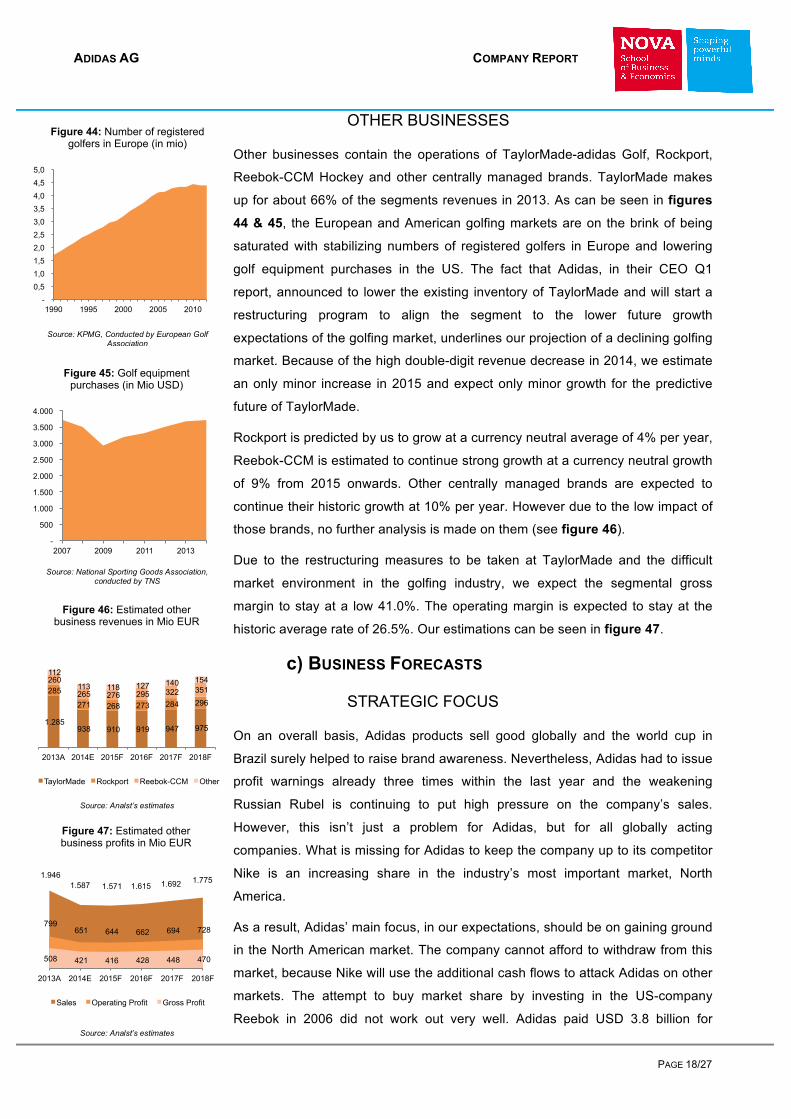
OTHER BUSINESSES
Other businesses contain the operations of TaylorMade-adidas Golf, Rockport,
Reebok-CCM Hockey and other centrally managed brands. TaylorMade makes
up for about 66% of the segments revenues in 2013. As can be seen in figures
44 & 45, the European and American golfing markets are on the brink of being
saturated with stabilizing numbers of registered golfers in Europe and lowering
golf equipment purchases in the US. The fact that Adidas, in their CEO Q1
report, announced to lower the existing inventory of TaylorMade and will start a
restructuring program to align the segment to the lower future growth
expectations of the golfing market, underlines our projection of a declining golfing
market. Because of the high double-digit revenue decrease in 2014, we estimate
an only minor increase in 2015 and expect only minor growth for the predictive
future of TaylorMade.
Rockport is predicted by us to grow at a currency neutral average of 4% per year,
Reebok-CCM is estimated to continue strong growth at a currency neutral growth
of 9% from 2015 onwards. Other centrally managed brands are expected to
continue their historic growth at 10% per year. However due to the low impact of
those brands, no further analysis is made on them (see figure 46).
Due to the restructuring measures to be taken at TaylorMade and the difficult
market environment in the golfing industry, we expect the segmental gross
margin to stay at a low 41.0%. The operating margin is expected to stay at the
historic average rate of 26.5%. Our estimations can be seen in figure 47.
c) BUSINESS FORECASTS
STRATEGIC FOCUS
On an overall basis, Adidas products sell good globally and the world cup in
Brazil surely helped to raise brand awareness. Nevertheless, Adidas had to issue
profit warnings already three times within the last year and the weakening
Russian Rubel is continuing to put high pressure on the company’s sales.
However, this isn’t just a problem for Adidas, but for all globally acting
companies. What is missing for Adidas to keep the company up to its competitor
Nike is an increasing share in the industry’s most important market, North
America.
As a result, Adidas’ main focus, in our expectations, should be on gaining ground
in the North American market. The company cannot afford to withdraw from this
market, because Nike will use the additional cash flows to attack Adidas on other
markets. The attempt to buy market share by investing in the US-company
Reebok in 2006 did not work out very well. Adidas paid USD 3.8 billion for
- 0,5 1,0 1,5 2,0 2,5 3,0 3,5 4,0 4,5 5,0
1990 1995 2000 2005 2010
Figure 44: Number of registered golfers in Europe (in mio)
Source: KPMG, Conducted by European Golf Association
-
500
1.000
1.500
2.000
2.500
3.000
3.500
4.000
2007 2009 2011 2013
Figure 45: Golf equipment purchases (in Mio USD)
Source: National Sporting Goods Association, conducted by TNS
Source: Analst’s estimates
1.285 938 910 919 947 975
285
271 268 273 284 296
260
265 276 295 322 351
112
113 118 127 140 154
2013A 2014E 2015F 2016F 2017F 2018F
Figure 46: Estimated other business revenues in Mio EUR
TaylorMade Rockport Reebok-CCM Other
Source: Analst’s estimates
1.946 1.587 1.571 1.615 1.692 1.775
799 651 644 662 694 728
508 421 416 428 448 470
2013A 2014E 2015F 2016F 2017F 2018F
Figure 47: Estimated other business profits in Mio EUR
Sales Operating Profit Gross Profit

ADIDAS AG COMPANY REPORT
PAGE 19/27
Reebok in 2006. Reebok’s revenues decreased from that time on till now with a
CAGR of -2.2%. The new strategy will be to enforce marketing and sponsorships
in order to raise awareness.
In addition TaylorMade-adidas Golf’s business has come under pressure with a
saturated market and high amounts of products still on stock. The strategy will be
to build off these stocks in order to avoid heavy losses. Smaller growth
opportunities should be expected from this sector in the coming years in our
opinion. However, the impact on total results is expected to be small due to the
small share on total revenues of about 8% in the past.
Due to the conflicts in Ukraine and the sanctions imposed on Russia, Adidas will
try to lower its exposure to the Russian market in the foreseeable future. The
sales generated in Russia in 2013 are estimated to exceed EUR 1 billion.8
However, with the Rubel getting under more and more pressure (see figure 48),
sales generated in this region loose their value to the company. The CEO of
Adidas already announced to heavily decrease the number of shop openings and
increase the number of closings in this area. The upcoming years will show,
whether this is the right long-term strategy for growth in this important region. In
order to gain shareholders trust, the company announced a share repurchase
program in 2014. Through it, the company will re-purchase 25 million shares until
the end of 2017. By December 2014 the company already repurchased 4.9
million shares for an average price of EUR 61 per share, therefore a volume of
EUR 300 million. We expect the remaining 20.1 million shares to be repurchased
evenly spread from 2015 to 2017.
IV. VALUATION We used a discounted cash flow model to derive a target price of EUR 61.81,
which is above the market price as per 02.01.2015 and below our initial target
from the Q3 review. All companies in which Adidas has a share are majority held
and therefore consolidated. In the forecast, as mentioned before, the wholesale,
retail and other business sectors were separated in order to increase the
predictability of cash flows in the future. In addition to the scenario predicted by
us we also incorporated a sensitivity analysis.
a) COMPARABLES
As per beginning of January, the Adidas AG stock is trading at a price-earnings
multiple of 16.24, while the median of the identified peer group equals 21.51. This
8 Aaron Ricadela. 2014. “Adidas plunges after reducing forecasts on Russia, Golf”. Bloomberg.com.
72,55
30,00
35,00
40,00
45,00
50,00
55,00
60,00
65,00
70,00
75,00
Figure 48: historical EUR/RUB chart
Source: Investing.com
Using a DCF model we derive a target price of EUR 61.81…
Share re-purchase program announced in 2014…
ADIDAS AG COMPANY REPORT
PAGE 20/27
means a discount of 24.5%. The same is true for the equity value over EBITDA
multiple, which currently equals 9.02, a 13.6% discount over its peer group
median. In our opinion this discount is unjustified because of the company’s
competiveness and ability to generate sustainable cash flows. We expect Adidas’
stock price to increase to the outlined price target over the upcoming year.
b) DISCOUNTED CASH FLOW ANALYSIS
WACC
For estimating the cost of capital of both segments we used the capital asset
pricing model (CAPM). The relevant equity risk premium was estimated to be
5.3%9, based on the historical performance of the German equity index DAX
versus German 10-Year bonds in the respective timeframe. The current risk free
rate, symbolized by the yield of German 10-Year bonds equals 1.48%10.
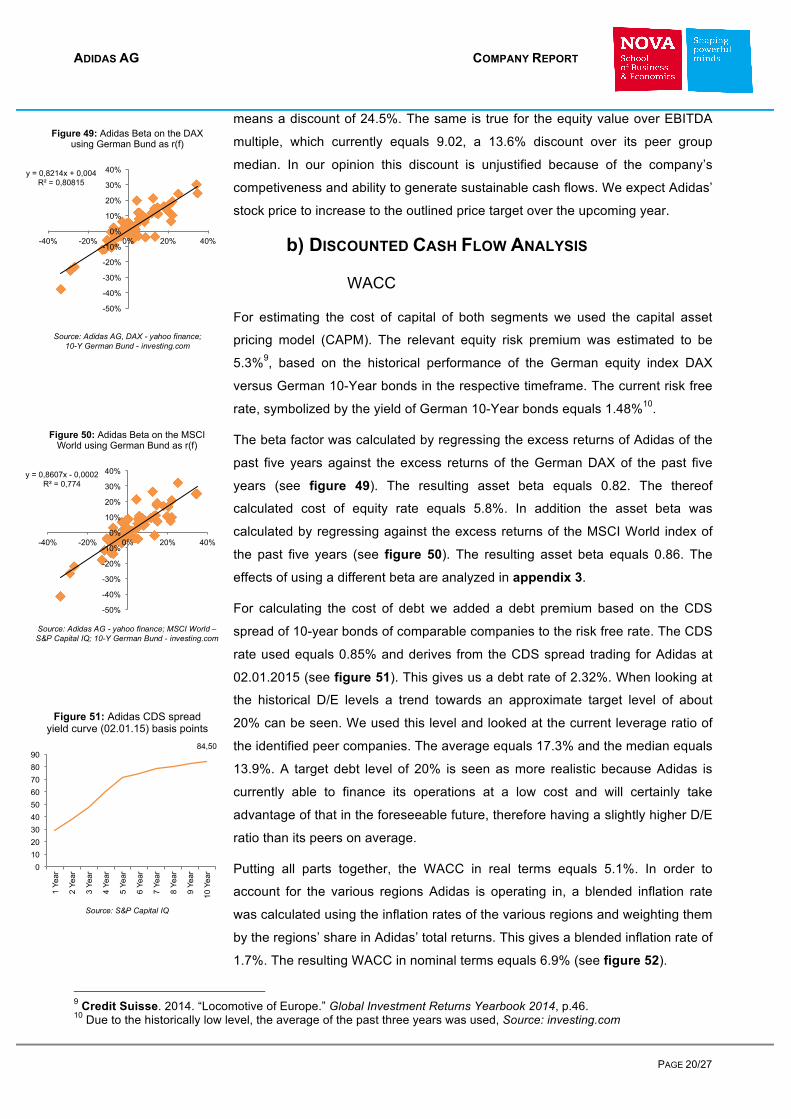
The beta factor was calculated by regressing the excess returns of Adidas of the
past five years against the excess returns of the German DAX of the past five
years (see figure 49). The resulting asset beta equals 0.82. The thereof
calculated cost of equity rate equals 5.8%. In addition the asset beta was
calculated by regressing against the excess returns of the MSCI World index of
the past five years (see figure 50). The resulting asset beta equals 0.86. The
effects of using a different beta are analyzed in appendix 3.
For calculating the cost of debt we added a debt premium based on the CDS
spread of 10-year bonds of comparable companies to the risk free rate. The CDS
rate used equals 0.85% and derives from the CDS spread trading for Adidas at
02.01.2015 (see figure 51). This gives us a debt rate of 2.32%. When looking at
the historical D/E levels a trend towards an approximate target level of about
20% can be seen. We used this level and looked at the current leverage ratio of
the identified peer companies. The average equals 17.3% and the median equals
13.9%. A target debt level of 20% is seen as more realistic because Adidas is
currently able to finance its operations at a low cost and will certainly take
advantage of that in the foreseeable future, therefore having a slightly higher D/E
ratio than its peers on average.
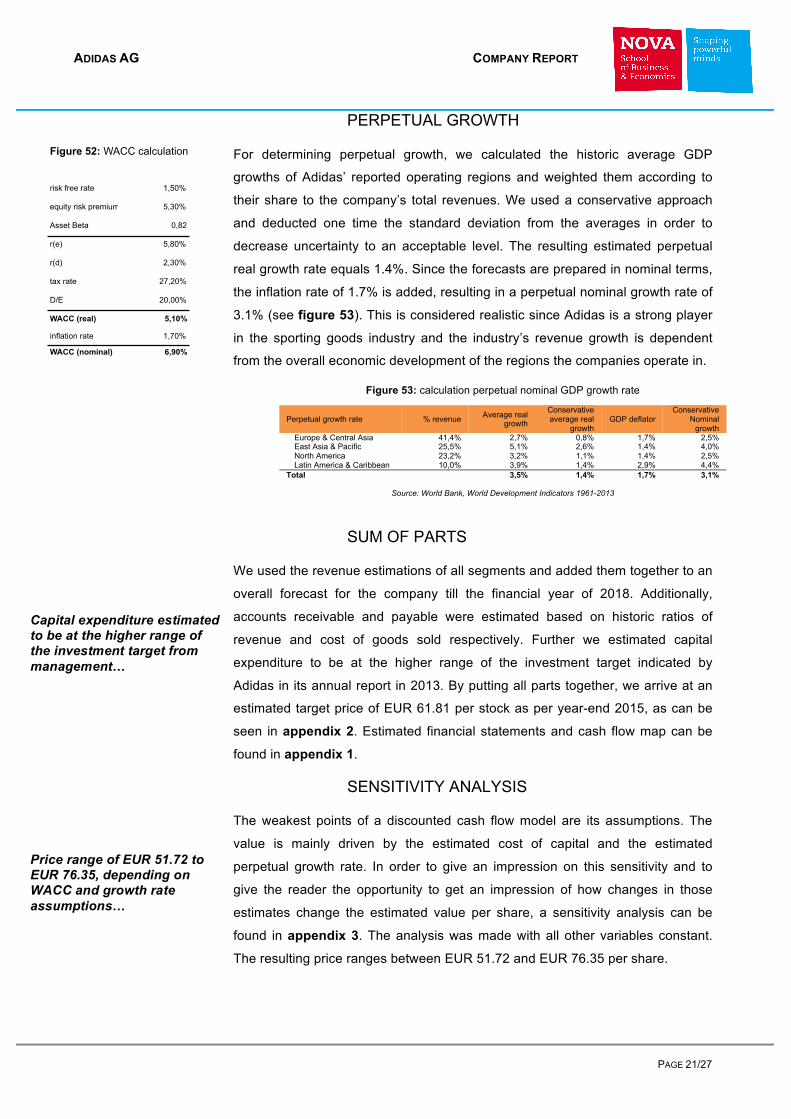
Putting all parts together, the WACC in real terms equals 5.1%. In order to
account for the various regions Adidas is operating in, a blended inflation rate
was calculated using the inflation rates of the various regions and weighting them
by the regions’ share in Adidas’ total returns. This gives a blended inflation rate of
1.7%. The resulting WACC in nominal terms equals 6.9% (see figure 52).
9 Credit Suisse. 2014. “Locomotive of Europe.” Global Investment Returns Yearbook 2014, p.46. 10 Due to the historically low level, the average of the past three years was used, Source: investing.com
y = 0,8214x + 0,004 R² = 0,80815
-50%
-40%
-30%
-20%
-10%
0%
10%
20%
30%
40%
-40% -20% 0% 20% 40%
Figure 49: Adidas Beta on the DAX using German Bund as r(f)
Source: Adidas AG, DAX - yahoo finance; 10-Y German Bund - investing.com
y = 0,8607x - 0,0002 R² = 0,774
-50%
-40%
-30%
-20%
-10%
0%
10%
20%
30%
40%
-40% -20% 0% 20% 40%
Figure 50: Adidas Beta on the MSCI World using German Bund as r(f)
Source: Adidas AG - yahoo finance; MSCI World – S&P Capital IQ; 10-Y German Bund - investing.com
84,50
0 10 20 30 40 50 60 70 80 90
1 Ye
ar
2 Ye
ar
3 Ye
ar
4 Ye
ar
5 Ye
ar
6 Ye
ar
7 Ye
ar
8 Ye
ar
9 Ye
ar
10 Y
ear
Figure 51: Adidas CDS spread yield curve (02.01.15) basis points
Source: S&P Capital IQ
ADIDAS AG COMPANY REPORT
PAGE 21/27
PERPETUAL GROWTH
For determining perpetual growth, we calculated the historic average GDP
growths of Adidas’ reported operating regions and weighted them according to
their share to the company’s total revenues. We used a conservative approach
and deducted one time the standard deviation from the averages in order to
decrease uncertainty to an acceptable level. The resulting estimated perpetual
real growth rate equals 1.4%. Since the forecasts are prepared in nominal terms,
the inflation rate of 1.7% is added, resulting in a perpetual nominal growth rate of
3.1% (see figure 53). This is considered realistic since Adidas is a strong player
in the sporting goods industry and the industry’s revenue growth is dependent
from the overall economic development of the regions the companies operate in.
Figure 53: calculation perpetual nominal GDP growth rate
Perpetual growth rate % revenue Average real growth
Conservative average real
growth GDP deflator
Conservative Nominal
growth Europe & Central Asia 41,4% 2,7% 0,8% 1,7% 2,5% East Asia & Pacific 25,5% 5,1% 2,6% 1,4% 4,0% North America 23,2% 3,2% 1,1% 1,4% 2,5% Latin America & Caribbean 10,0% 3,9% 1,4% 2,9% 4,4%
Total 3,5% 1,4% 1,7% 3,1%
Source: World Bank, World Development Indicators 1961-2013
SUM OF PARTS
We used the revenue estimations of all segments and added them together to an
overall forecast for the company till the financial year of 2018. Additionally,
accounts receivable and payable were estimated based on historic ratios of
revenue and cost of goods sold respectively. Further we estimated capital
expenditure to be at the higher range of the investment target indicated by
Adidas in its annual report in 2013. By putting all parts together, we arrive at an
estimated target price of EUR 61.81 per stock as per year-end 2015, as can be
seen in appendix 2. Estimated financial statements and cash flow map can be
found in appendix 1.
SENSITIVITY ANALYSIS
The weakest points of a discounted cash flow model are its assumptions. The
value is mainly driven by the estimated cost of capital and the estimated
perpetual growth rate. In order to give an impression on this sensitivity and to
give the reader the opportunity to get an impression of how changes in those
estimates change the estimated value per share, a sensitivity analysis can be
found in appendix 3. The analysis was made with all other variables constant.
The resulting price ranges between EUR 51.72 and EUR 76.35 per share.
Price range of EUR 51.72 to EUR 76.35, depending on WACC and growth rate assumptions…
Capital expenditure estimated to be at the higher range of the investment target from management…
risk free rate 1,50%
equity risk premium 5,30%
Asset Beta 0,82
r(e) 5,80%
r(d) 2,30%
tax rate 27,20%
D/E 20,00%
WACC (real) 5,10%
inflation rate 1,70%
WACC (nominal) 6,90%
Figure 52: WACC calculation
ADIDAS AG COMPANY REPORT
PAGE 22/27
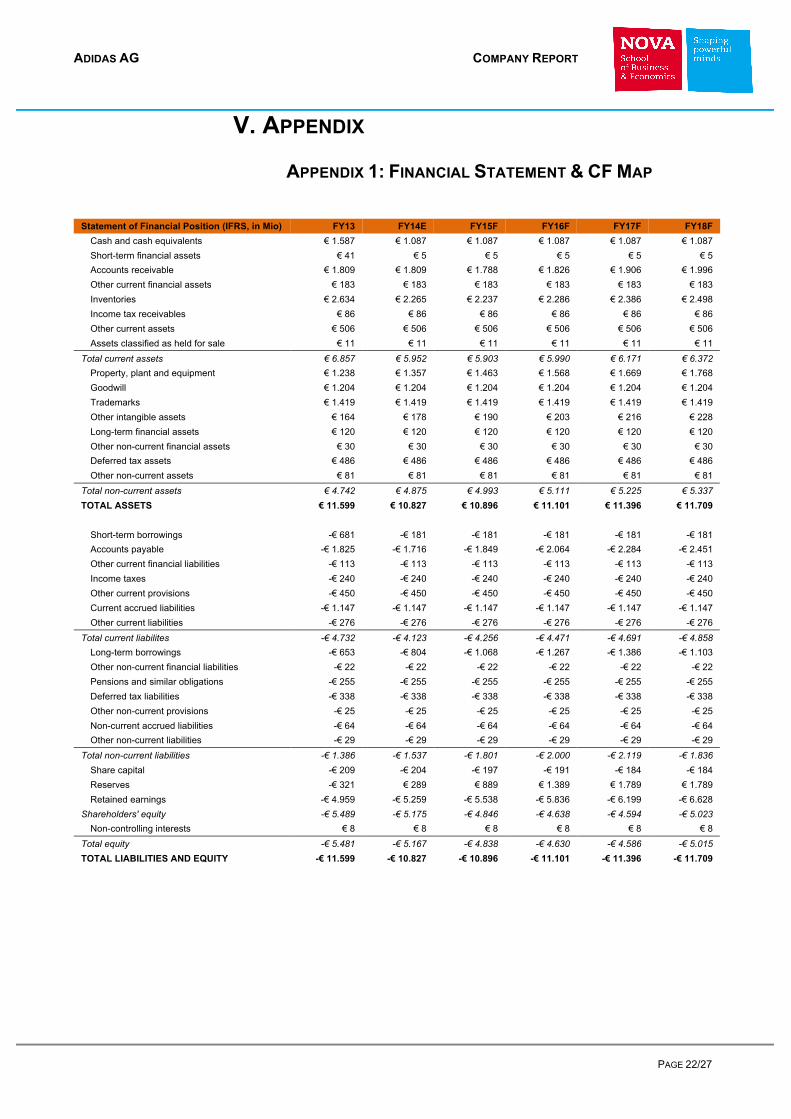
V. APPENDIX
APPENDIX 1: FINANCIAL STATEMENT & CF MAP
Statement of Financial Position (IFRS, in Mio) FY13 FY14E FY15F FY16F FY17F FY18F
Cash and cash equivalents € 1.587 € 1.087 € 1.087 € 1.087 € 1.087 € 1.087 Short-term financial assets € 41 € 5 € 5 € 5 € 5 € 5 Accounts receivable € 1.809 € 1.809 € 1.788 € 1.826 € 1.906 € 1.996 Other current financial assets € 183 € 183 € 183 € 183 € 183 € 183 Inventories € 2.634 € 2.265 € 2.237 € 2.286 € 2.386 € 2.498 Income tax receivables € 86 € 86 € 86 € 86 € 86 € 86 Other current assets € 506 € 506 € 506 € 506 € 506 € 506 Assets classified as held for sale € 11 € 11 € 11 € 11 € 11 € 11
Total current assets € 6.857 € 5.952 € 5.903 € 5.990 € 6.171 € 6.372 Property, plant and equipment € 1.238 € 1.357 € 1.463 € 1.568 € 1.669 € 1.768 Goodwill € 1.204 € 1.204 € 1.204 € 1.204 € 1.204 € 1.204 Trademarks € 1.419 € 1.419 € 1.419 € 1.419 € 1.419 € 1.419 Other intangible assets € 164 € 178 € 190 € 203 € 216 € 228 Long-term financial assets € 120 € 120 € 120 € 120 € 120 € 120 Other non-current financial assets € 30 € 30 € 30 € 30 € 30 € 30 Deferred tax assets € 486 € 486 € 486 € 486 € 486 € 486 Other non-current assets € 81 € 81 € 81 € 81 € 81 € 81
Total non-current assets € 4.742 € 4.875 € 4.993 € 5.111 € 5.225 € 5.337 TOTAL ASSETS € 11.599 € 10.827 € 10.896 € 11.101 € 11.396 € 11.709
Short-term borrowings -€ 681 -€ 181 -€ 181 -€ 181 -€ 181 -€ 181
Accounts payable -€ 1.825 -€ 1.716 -€ 1.849 -€ 2.064 -€ 2.284 -€ 2.451 Other current financial liabilities -€ 113 -€ 113 -€ 113 -€ 113 -€ 113 -€ 113 Income taxes -€ 240 -€ 240 -€ 240 -€ 240 -€ 240 -€ 240 Other current provisions -€ 450 -€ 450 -€ 450 -€ 450 -€ 450 -€ 450 Current accrued liabilities -€ 1.147 -€ 1.147 -€ 1.147 -€ 1.147 -€ 1.147 -€ 1.147 Other current liabilities -€ 276 -€ 276 -€ 276 -€ 276 -€ 276 -€ 276
Total current liabilites -€ 4.732 -€ 4.123 -€ 4.256 -€ 4.471 -€ 4.691 -€ 4.858 Long-term borrowings -€ 653 -€ 804 -€ 1.068 -€ 1.267 -€ 1.386 -€ 1.103 Other non-current financial liabilities -€ 22 -€ 22 -€ 22 -€ 22 -€ 22 -€ 22 Pensions and similar obligations -€ 255 -€ 255 -€ 255 -€ 255 -€ 255 -€ 255 Deferred tax liabilities -€ 338 -€ 338 -€ 338 -€ 338 -€ 338 -€ 338 Other non-current provisions -€ 25 -€ 25 -€ 25 -€ 25 -€ 25 -€ 25 Non-current accrued liabilities -€ 64 -€ 64 -€ 64 -€ 64 -€ 64 -€ 64 Other non-current liabilities -€ 29 -€ 29 -€ 29 -€ 29 -€ 29 -€ 29
Total non-current liabilities -€ 1.386 -€ 1.537 -€ 1.801 -€ 2.000 -€ 2.119 -€ 1.836 Share capital -€ 209 -€ 204 -€ 197 -€ 191 -€ 184 -€ 184 Reserves -€ 321 € 289 € 889 € 1.389 € 1.789 € 1.789 Retained earnings -€ 4.959 -€ 5.259 -€ 5.538 -€ 5.836 -€ 6.199 -€ 6.628
Shareholders' equity -€ 5.489 -€ 5.175 -€ 4.846 -€ 4.638 -€ 4.594 -€ 5.023 Non-controlling interests € 8 € 8 € 8 € 8 € 8 € 8
Total equity -€ 5.481 -€ 5.167 -€ 4.838 -€ 4.630 -€ 4.586 -€ 5.015 TOTAL LIABILITIES AND EQUITY -€ 11.599 -€ 10.827 -€ 10.896 -€ 11.101 -€ 11.396 -€ 11.709

ADIDAS AG COMPANY REPORT
PAGE 23/27
Statement of Financial Position (IFRS, in Mio) FY13 FY14E FY15F FY16F FY17F FY18F Net Sales € 14.492 € 13.619 € 13.511 € 13.875 € 14.562 € 15.304 Cost of sales -€ 7.352 -€ 7.227 -€ 7.139 -€ 7.297 -€ 7.618 -€ 7.963
Gross profit € 7.140 € 6.392 € 6.372 € 6.579 € 6.944 € 7.342 Royalty and commission income € 104 € 108 € 112 € 116 € 120 € 124 Other operating income € 143 € 0 € 0 € 0 € 0 € 0 Other operating expenses -€ 6.133 -€ 5.574 -€ 5.722 -€ 5.948 -€ 6.225 -€ 6.494 Goodwill impairment losses -€ 52 € 0 € 0 € 0 € 0 € 0
Operating profit € 1.202 € 926 € 761 € 746 € 839 € 971 Financial income € 26 € 25 € 25 € 25 € 25 € 25 Financial expense -€ 94 -€ 68 -€ 51 -€ 64 -€ 74 -€ 80
Net Income before taxes € 1.134 € 882 € 735 € 707 € 790 € 917 Income taxes -€ 344 -€ 268 -€ 223 -€ 215 -€ 240 -€ 278
Net income € 790 € 614 € 512 € 493 € 550 € 639
Cashflow Map (in Mio) FY13 FY14E FY15F FY16F FY17F FY18F
Net Sales € 14.492 € 13.619 € 13.511 € 13.875 € 14.562 € 15.304 Cost of sales -€ 7.352 -€ 7.227 -€ 7.139 -€ 7.297 -€ 7.618 -€ 7.963
Gross profit € 7.140 € 6.392 € 6.372 € 6.579 € 6.944 € 7.342 Other operating income & expense -€ 5.886 -€ 5.467 -€ 5.611 -€ 5.832 -€ 6.105 -€ 6.370
EBIT € 1.254 € 926 € 761 € 746 € 839 € 971 Notional income taxes -€ 341 -€ 252 -€ 207 -€ 203 -€ 228 -€ 264 Tax adjustment -€ 35 -€ 27 -€ 23 -€ 22 -€ 25 -€ 29
NOPLAT € 877 € 646 € 531 € 521 € 586 € 678 Depreciation € 288 € 300 € 326 € 351 € 377 € 404
Operating gross cash flow € 1.165 € 946 € 857 € 872 € 963 € 1.083 - Change in CAPEX (@ acquisition cost) -€ 338 -€ 433 -€ 444 -€ 469 -€ 492 -€ 516 - Change in NWC -€ 213 € 360 € 182 € 128 € 39 -€ 34 - Change in non-current assets & liabilities € 22 € 0 € 0 € 0 € 0 € 0 FX Adjustments -€ 309 -€ 310 -€ 200 -€ 100 € 0 € 0
Operating Free Cash Flow € 327 € 563 € 396 € 431 € 511 € 532 Financial income € 26 € 25 € 25 € 25 € 25 € 25 Non-operating notional tax € 7 -€ 7 -€ 7 -€ 7 -€ 7 -€ 7 - Change in non-operating capital € 86 € 36 € 0 € 0 € 0 € 0
Non-operating Free Cash Flow € 119 € 54 € 18 € 18 € 18 € 18
Total Free Cash Flow € 446 € 617 € 414 € 449 € 529 € 550
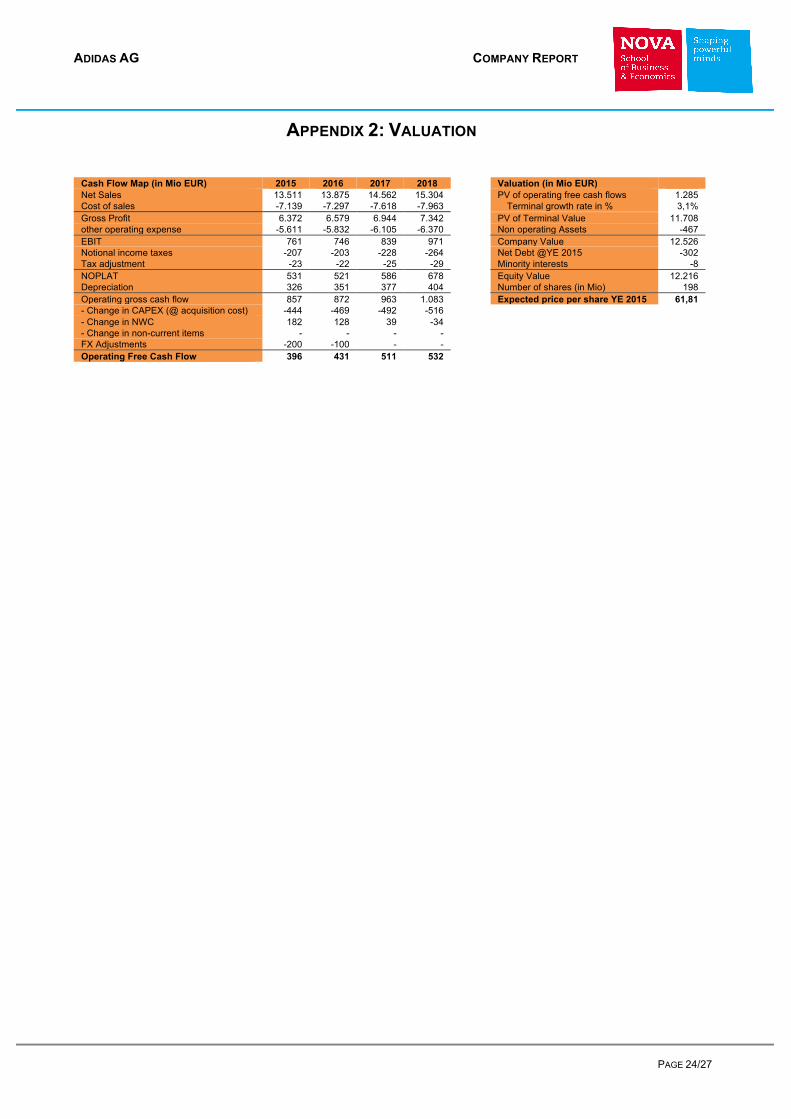
ADIDAS AG COMPANY REPORT
PAGE 24/27
APPENDIX 2: VALUATION
Cash Flow Map (in Mio EUR) 2015 2016 2017 2018
Valuation (in Mio EUR)
Net Sales 13.511 13.875 14.562 15.304
PV of operating free cash flows 1.285 Cost of sales -7.139 -7.297 -7.618 -7.963
Terminal growth rate in % 3,1%
Gross Profit 6.372 6.579 6.944 7.342
PV of Terminal Value 11.708 other operating expense -5.611 -5.832 -6.105 -6.370
Non operating Assets -467
EBIT 761 746 839 971
Company Value 12.526 Notional income taxes -207 -203 -228 -264
Net Debt @YE 2015 -302
Tax adjustment -23 -22 -25 -29
Minority interests -8 NOPLAT 531 521 586 678
Equity Value 12.216
Depreciation 326 351 377 404
Number of shares (in Mio) 198 Operating gross cash flow 857 872 963 1.083
Expected price per share YE 2015 61,81
- Change in CAPEX (@ acquisition cost) -444 -469 -492 -516 - Change in NWC 182 128 39 -34 - Change in non-current items - - - - FX Adjustments -200 -100 - - Operating Free Cash Flow 396 431 511 532

ADIDAS AG COMPANY REPORT
PAGE 25/27
In our sensitivity analysis we try to
estimate a reasonable price range based
on the changes of critical values to the
valuation model. To make the
visualization easier for the reader all
graphs on the left hand side have the
same x-axis label. The middle value is
the value used in the model; the labels on
the left and right hand side are
percentage changes, not basis points
added.
Figure 54 shows the sensitivity of the
price target to changes in the beta factor.
As mentioned on page 18, using the beta
of Adidas on the MSCI World would
change the target price to EUR 58.78.
The WACC sensitivity in figure 55 is the
highest of all variables analyzed.
However, at the extreme, a WACC of
7.59% (6.9% * (1+10%)) would result in a
target price of EUR 51.72 and therefore a
sell recommendation.
Wholesale and retail sales growth
sensitivities were calculated in order to
affirm that both business units are adding
value to the shareholders in the course of
their operations. Figure 57 & 58 confirm
these expectations.
When using the most extreme price
changes, deriving from changes in the
WACC variable, we would end up with a
price range of EUR 51.72 to EUR 76.35.
APPENDIX 3: SENSITIVITY ANALYSIS
56,01 58,78
61,81
68,85
55
60
65
70
+10%
+9
%
+8%
+7
%
+6%
+5
%
+4%
+3
%
+2%
+1
%
0,82
-1
%
-2%
-3
%
-4%
-5
%
-6%
-7
%
-8%
-9
%
-10%
Figure 54: Beta sensitivity
51,72
61,81
76,35
50 55 60 65 70 75 80
+10%
+9
%
+8%
+7
%
+6%
+5
%
+4%
+3
%
+2%
+1
%
6,9%
-1
%
-2%
-3
%
-4%
-5
%
-6%
-7
%
-8%
-9
%
-10%
Figure 55: WACC sensitivity
67,18
61,81
57,24
56 58 60 62 64 66 68
+10%
+9
%
+8%
+7
%
+6%
+5
%
+4%
+3
%
+2%
+1
%
3,1%
-1
%
-2%
-3
%
-4%
-5
%
-6%
-7
%
-8%
-9
%
-10%
Figure 56: Growth rate sensitivity
61,86
61,77
61,85
61,78 61,82
61,81 61,80
62 62 62 62 62 62 62
Figure 57: Wholesale sales growth sensitivity
adidas Sport Performance adidas Originals & SportStyle Reebok
61,87 61,75
61,89
61,74
61,83
61,81 61,80
62
62
62
62
62
Figure 58: Retail sales growth sensitivity
adidas Sport Performance adidas Originals & SportStyle Reebok

ADIDAS AG COMPANY REPORT
PAGE 26/27
APPENDIX 4: APPAREL AND FOOTWEAR INDUSTRY
Source: Euromonitor International. 2014. “Chinas unquenchable thirst for fashion set to continue”. Datagraphic Apparel and Footwear.
China’s Unquenchable Thirst for Fashion Set to ContinueDATAGRAPHIC APPAREL AND FOOT WE AR
© 2014 Euromonitor International
China Pushing Ahead of the PackApparel and Footwear Size and Forecast Growth retail value RSP, US$ million
0 50,000 150,000 250,000100,000 200,00 300,000 350,000 400,000
1,000
3,000
9,000
27,000
81,000
243,000
USA
Retail value 2013 Note: The Y–axis in the chart above uses a logarithmic scale with a base of 3.
Value growth 2013–18
China
DevelopedDeveloping
JapanGermany
Russia
United Kingdom
Italy
Brazil
France
India
Canada
Spain
Mexico
S Korea
Turkey
Argentina
Australia
S AfricaSaudi ArabiaUAE
Venezuela
Sweden
Ukraine
Apparel and Footwear: Top 10 MarketsGlobal Ranking 2013/2018based on US$ sales
2013
2018
7
10
4
1
2
3
5
6
8
9
USA
China
Japan
Germany
Russia
United Kingdom
Italy
Brazil
France
India
5.1%APPAREL AND FOOTWEAR
total value growth globally in 2013

ADIDAS AG COMPANY REPORT
PAGE 27/27
VI. DISCLOSURES AND DISCLAIMER
Research Recommendations
Buy Expected total return (including dividends) of more than 15% over a 12-month period.
Hold Expected total return (including dividends) between 0% and 15% over a 12-month period.
Sell Expected negative total return (including dividends) over a 12-month period.
This report was prepared by “Student’s Name”, a student of the NOVA School of Business and Economics, following the Masters in Finance Equity Research – Field Lab Work Project, exclusively for academic purposes. Thus, the author, which is a Masters in Finance student, is the sole responsible for the information and estimates contained herein and for the opinions expressed, which reflect exclusively his/her own personal judgement. This report was supervised by professor Rosário André (registered with Comissão do Mercado de Valores Mobiliários as financial analyst) who revised the valuation methodology and the financial model. All opinions and estimates are subject to change without notice. NOVA SBE or its faculty accepts no responsibility whatsoever for the content of this report nor for any consequences of its use. The information contained herein has been compiled by students from public sources believed to be reliable, but NOVA SBE or the students make no representation that it is accurate or complete, and accept no liability whatsoever for any direct or indirect loss resulting from the use of this report or its content. The author hereby certifies that the views expressed in this report accurately reflect his/her personal opinion about the subject company and its securities. He/she has not received or been promised any direct or indirect compensation for expressing the opinions or recommendation included in this report. The author of this report may have a position, or otherwise be interested, in transactions in securities which are directly or indirectly the subject of this report. NOVA SBE may have received compensation from the subject company during the last 12 months related to its fund raising program. Nevertheless, no compensation eventually received by NOVA SBE is in any way related to or dependent on the opinions expressed in this report. The Nova School of Business and Economics, though registered with Comissão do Mercado de Valores Mobiliários, does not deal for or otherwise offers any investment or intermediation services to market counterparties, private or intermediate customers. This report may not be reproduced, distributed or published without the explicit previous consent of its author, unless when used by NOVA SBE for academic purposes only. At any time, NOVA SBE may decide to suspend this report reproduction or distribution without further notice.
Related Documents