Company Presentation September 2016

Welcome message from author
This document is posted to help you gain knowledge. Please leave a comment to let me know what you think about it! Share it to your friends and learn new things together.
Transcript
Company Presentation
September 2016
September 2016 2
Legal Disclaimer
This presentation contains forward-looking statements within the meaning of the federal securities laws. All statements other than statements of historical facts contained in this
presentation, including statements regarding our future results of operations and financial position, business strategy and plans and objectives of management for future
operations, are forward-looking statements. In many cases, you can identify forward-looking statements by terms such as “may,” “should,” “expects,” “plans,” “anticipates,” “could,”
“intends,” “target,” “projects,” “contemplates,” “believes,” “estimates,” “predicts,” “potential” or “continue” or the negative of these terms or other similar words. Forward-looking
statements contained in this presentation include, but are not limited to, statements about (i) growth of the wind energy market and our addressable market; (ii) our future financial
and operating performance, including our net sales, total billings, cost of goods sold, gross profit or gross margin, operating expenses, sets, estimated megawatts, dedicated
manufacturing lines, lines installed, lines in startup, lines in transition, ability to generate positive cash flow, and ability to achieve or maintain profitability; (iii) the sufficiency of our
cash and cash equivalents to meet our liquidity needs; (iv) our ability to attract and retain customers for our products, and to optimize product pricing; (v) competition from other
wind blade manufacturers; (vi) the discovery of defects in our products; (vii) our ability to successfully expand in our existing markets and into new international markets; (viii)
worldwide economic conditions and their impact on customer demand; (ix) our ability to effectively manage our growth strategy and future expenses; (x) our ability to maintain,
protect and enhance our intellectual property; (xi) our ability to comply with existing, modified or new laws and regulations applying to our business; and (xii) the attraction and
retention of qualified employees and key personnel.
These forward-looking statements are only predictions. These statements relate to future events or our future financial performance and involve known and unknown risks,
uncertainties and other important factors that may cause our actual results, levels of activity, performance or achievements to materially differ from any future results, levels of
activity, performance or achievements expressed or implied by these forward-looking statements. Because forward-looking statements are inherently subject to risks and
uncertainties, some of which cannot be predicted or quantified, you should not rely on these forward-looking statements as guarantees of future events. Further information on
the factors, risks and uncertainties that could affect our financial results and the forward-looking statements in this presentation are included in our filings with the Securities and
Exchange Commission and will be included in subsequent periodic and current reports we make with the Securities and Exchange Commission from time to time.
The forward-looking statements in this presentation represent our views as of the date of this presentation. We anticipate that subsequent events and developments will cause
our views to change. However, while we may elect to update these forward-looking statements at some point in the future, we undertake no obligation to update any forward-
looking statement to reflect events or developments after the date on which the statement is made or to reflect the occurrence of unanticipated events except to the extent
required by applicable law. You should, therefore, not rely on these forward-looking statements as representing our views as of any date after the date of this presentation. Our
forward-looking statements do not reflect the potential impact of any future acquisitions, mergers, dispositions, joint ventures, or investments we may make.
This presentation includes unaudited non-GAAP financial measures including total billings, EBITDA, adjusted EBITDA, net debt and free cash flow. We define total billings as the
total amounts we have invoiced our customers for products and services for which we are entitled to payment under the terms of our long term supply agreements or other
contractual agreements. We define EBITDA as net income (loss) attributable to the Company plus interest expense (net of interest income), income taxes, and depreciation and
amortization. We define adjusted EBITDA as EBITDA plus any share-based compensation expense, plus or minus any gains or losses from foreign currency remeasurement plus
any losses on extinguishment of debt. We define net debt as the total principal amount of debt outstanding less unrestricted cash and equivalents. We define free cash flow as
net cash flow generated from operating activities less capital expenditures. We present non-GAAP measures when we believe that the additional information is useful and
meaningful to investors. Non-GAAP financial measures do not have any standardized meaning and are therefore unlikely to be comparable to similar measures presented by
other companies. The presentation of non-GAAP financial measures is not intended to be a substitute for, and should not be considered in isolation from, the financial measures
reported in accordance with GAAP. See the appendix for the reconciliations of certain non-GAAP financial measures to the comparable GAAP measures.
This presentation also contains estimates and other information concerning our industry that are based on industry publications, surveys and forecasts. This information involves
a number of assumptions and limitations, and we have not independently verified the accuracy or completeness of the information.

September 2016 3
Key Investment Highlights
Capitalizing on Strong Wind Industry Growth,
Blade Outsourcing Trends and Market Share
Gains
TPI’s reputation as a reliable, global wind blade
manufacturer and its focus on developing
replicable and scalable manufacturing facilities
allow it to capture opportunities in the large and
growing wind energy markets
Adoption of new mobile
technologies
Government and regulatory support
Industry Leader with Strategic Global
Footprint
Advanced Composite Technology and
Production Expertise Provides Barrier to
Entry
Largest U.S.-based independent
manufacturer of composite wind blades
with a global footprint serving the growing
wind energy market worldwide
Global presence enables even existing
customers to expand into new markets
Significant expertise in advanced
composite technology and production
enables TPI to manufacture lightweight and
durable wind blades with near-aerospace
grade precision at an industrial cost
Unique Collaborative Dedicated
Supplier Model
Long-Term Supply Agreements Provide
Significant Revenue Visibility
Compelling Return on Invested Capital
Seasoned Management Team with
Significant High Growth Experience
Senior management team with significant
experience managing high growth,
world-class international operations
TPI’s highly efficient manufacturing
processes and joint capital investment
with customers drives compelling returns
on invested capital
Strong track record in successfully
ramping up and operating new facilities
minimizes execution risk
Deeply integrated collaborative model where
TPI dedicates capacity to build our customers’
unique blades which engenders stable,
long-term relationships with customers,
driving capital efficiency and insulation
from potential short-term fluctuations
Long-term supply agreements that provide
up to $3.1 billion(1) in revenue and contain
significant incentives for our customers
to maximize the volume of wind blades
purchased through shared capital
investments and increased pricing at lower
volumes that contribute to profitability at
minimum volume levels
(1) As of August 12, 2016
3
September 2016 4
$215
$321
$586
$96 $176 $150
$194
$0
$200
$400
$600
2013 2014 2015 Q1'15 Q1'16 Q2'15 Q2'16
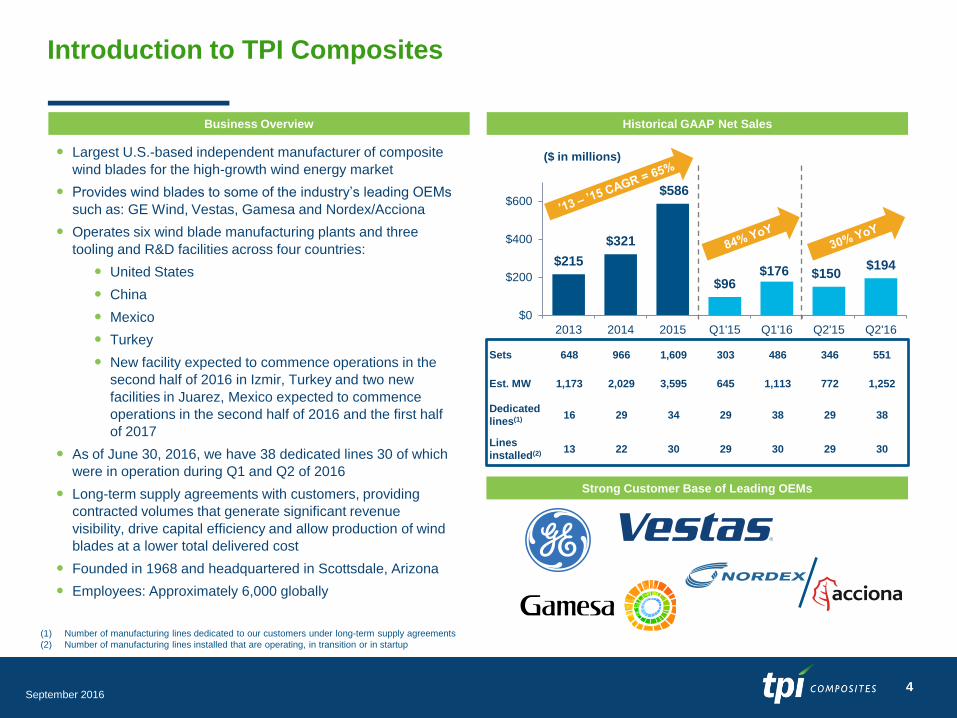
Introduction to TPI Composites
Strong Customer Base of Leading OEMs
Business Overview Historical GAAP Net Sales
($ in millions) Largest U.S.-based independent manufacturer of composite
wind blades for the high-growth wind energy market
Provides wind blades to some of the industry’s leading OEMs
such as: GE Wind, Vestas, Gamesa and Nordex/Acciona
Operates six wind blade manufacturing plants and three
tooling and R&D facilities across four countries:
United States
China
Mexico
Turkey
New facility expected to commence operations in the
second half of 2016 in Izmir, Turkey and two new
facilities in Juarez, Mexico expected to commence
operations in the second half of 2016 and the first half
of 2017
As of June 30, 2016, we have 38 dedicated lines 30 of which
were in operation during Q1 and Q2 of 2016
Long-term supply agreements with customers, providing
contracted volumes that generate significant revenue
visibility, drive capital efficiency and allow production of wind
blades at a lower total delivered cost
Founded in 1968 and headquartered in Scottsdale, Arizona
Employees: Approximately 6,000 globally
Sets 648 966 1,609 303 486 346 551
Est. MW 1,173 2,029 3,595 645 1,113 772 1,252
Dedicated
lines(1) 16 29 34 29 38 29 38
Lines
installed(2) 13 22 30 29 30 29 30
(1) Number of manufacturing lines dedicated to our customers under long-term supply agreements
(2) Number of manufacturing lines installed that are operating, in transition or in startup
September 2016 5
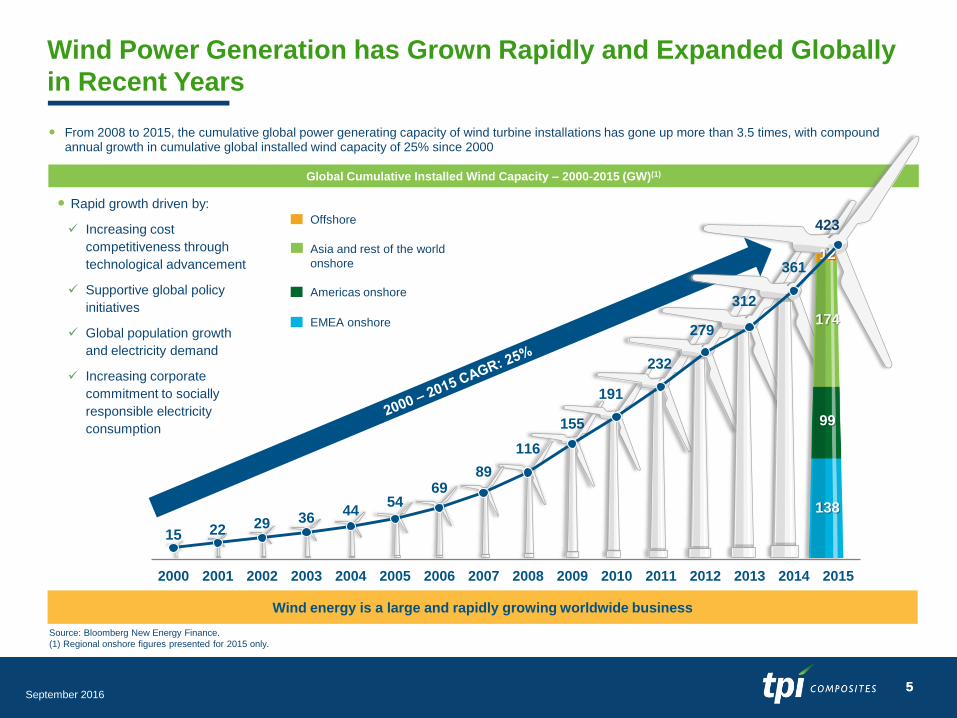
Global Cumulative Installed Wind Capacity – 2000-2015 (GW)(1)
Rapid growth driven by:
Increasing cost
competitiveness through
technological advancement
Supportive global policy
initiatives
Global population growth
and electricity demand
Increasing corporate
commitment to socially
responsible electricity
consumption
From 2008 to 2015, the cumulative global power generating capacity of wind turbine installations has gone up more than 3.5 times, with compound annual growth in cumulative global installed wind capacity of 25% since 2000
Wind Power Generation has Grown Rapidly and Expanded Globally
in Recent Years
5
Wind energy is a large and rapidly growing worldwide business
Source: Bloomberg New Energy Finance.
(1) Regional onshore figures presented for 2015 only.
EMEA onshore
Americas onshore
Asia and rest of the world
onshore
Offshore 423
138
99
174
12
15 22 29 36 44
54 69
89
116
155
191
232
279
312
361
2000 2001 2002 2003 2004 2005 2006 2007 2008 2009 2010 2011 2012 2013 2014 2015
September 2016 6
138
423
198
99
60
180 174
81 336
12
162
40 28
Global installed capacity by end of
2015 (GW)
Global projected installed capacity btwn
2016-2020 (GW)
Global projected installed capacity by end of 2020 (GW)
423
331 754
EMEA onshore
Americas onshore
Asia and rest of the
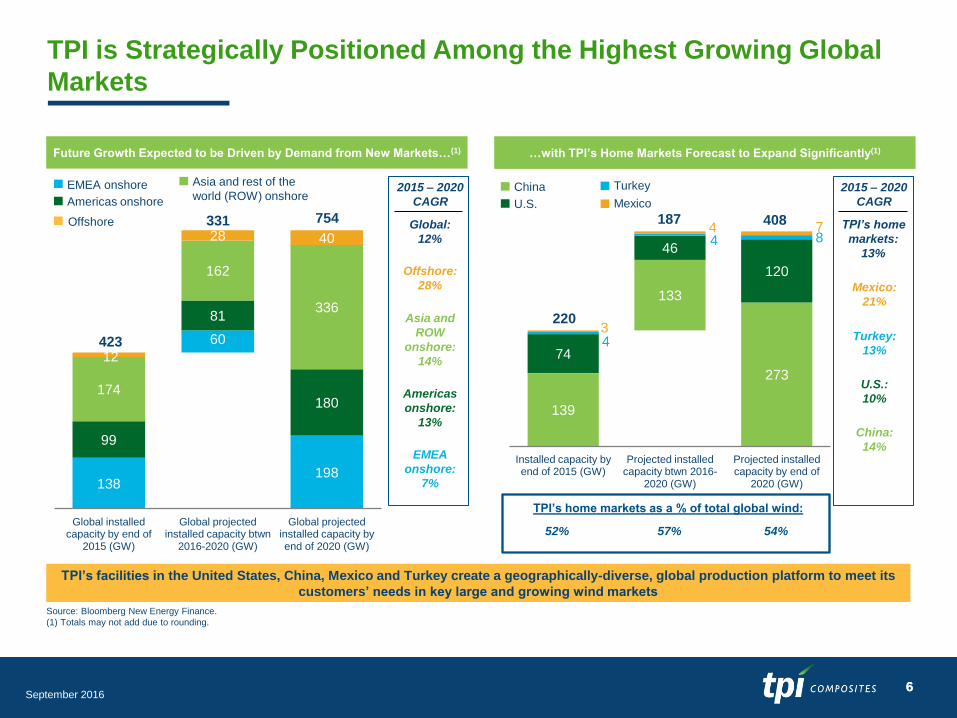
world (ROW) onshore 2015 – 2020
CAGR
Asia and
ROW
onshore:
14%
Americas
onshore:
13%
EMEA
onshore:
7%
Future Growth Expected to be Driven by Demand from New Markets…(1) …with TPI’s Home Markets Forecast to Expand Significantly(1)
TPI is Strategically Positioned Among the Highest Growing Global
Markets
Global:
12%
Source: Bloomberg New Energy Finance.
(1) Totals may not add due to rounding.
China
U.S.
Turkey
Mexico
2015 – 2020
CAGR
U.S.:
10%
Turkey:
13%
Mexico:
21%
China:
14%
TPI’s facilities in the United States, China, Mexico and Turkey create a geographically-diverse, global production platform to meet its
customers’ needs in key large and growing wind markets
Offshore
Offshore:
28%
139
273
74
133
120
4
46 8
3
4 7 4
Installed capacity by end of 2015 (GW)
Projected installed capacity btwn 2016-
2020 (GW)
Projected installed capacity by end of
2020 (GW)
220
187 408
TPI’s home markets as a % of total global wind:
52% 57% 54%
TPI’s home
markets:
13%
6
September 2016 7
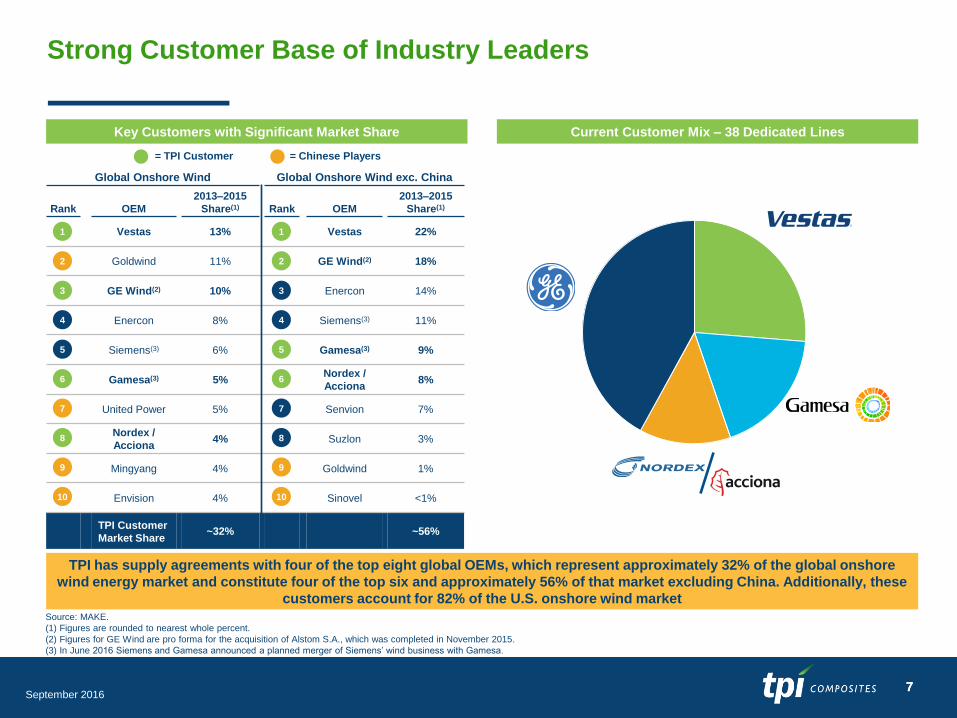
Strong Customer Base of Industry Leaders
Current Customer Mix – 38 Dedicated Lines Key Customers with Significant Market Share
= TPI Customer
Global Onshore Wind Global Onshore Wind exc. China
Rank OEM
2013–2015
Share(1) Rank OEM
2013–2015
Share(1)
1 Vestas 13% Vestas 22%
2 Goldwind 11% GE Wind(2) 18%
3 GE Wind(2) 10% Enercon 14%
4 Enercon 8% Siemens(3) 11%
5 Siemens(3) 6% Gamesa(3) 9%
6 Gamesa(3) 5% Nordex /
Acciona 8%
7 United Power 5% Senvion 7%
8 Nordex /
Acciona 4% Suzlon 3%
9 Mingyang 4% Goldwind 1%
10 Envision 4% Sinovel <1%
TPI Customer
Market Share ~32% ~56%
Source: MAKE.
(1) Figures are rounded to nearest whole percent.
(2) Figures for GE Wind are pro forma for the acquisition of Alstom S.A., which was completed in November 2015.
(3) In June 2016 Siemens and Gamesa announced a planned merger of Siemens’ wind business with Gamesa.
TPI has supply agreements with four of the top eight global OEMs, which represent approximately 32% of the global onshore
wind energy market and constitute four of the top six and approximately 56% of that market excluding China. Additionally, these
customers account for 82% of the U.S. onshore wind market
1
2
4
5
7
3
6
8
9
10
= Chinese Players
1
2
5
6
3
4
9
7
8
10
7
September 2016 8
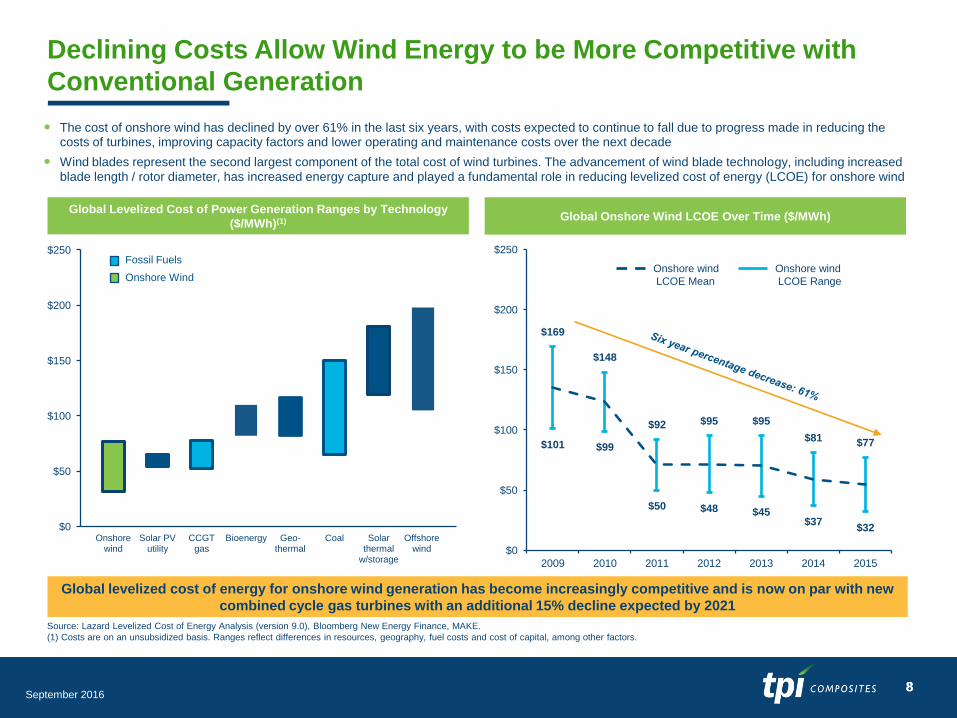
Source: Lazard Levelized Cost of Energy Analysis (version 9.0), Bloomberg New Energy Finance, MAKE.
(1) Costs are on an unsubsidized basis. Ranges reflect differences in resources, geography, fuel costs and cost of capital, among other factors.
Declining Costs Allow Wind Energy to be More Competitive with
Conventional Generation
Global Levelized Cost of Power Generation Ranges by Technology
($/MWh)(1)
Global Onshore Wind LCOE Over Time ($/MWh)
$169
$148
$92 $95 $95
$81 $77 $101 $99
$50 $48 $45 $37
$32
$0
$50
$100
$150
$200
$250
2009 2010 2011 2012 2013 2014 2015
Onshore wind
LCOE Mean
Onshore wind
LCOE Range
Global levelized cost of energy for onshore wind generation has become increasingly competitive and is now on par with new
combined cycle gas turbines with an additional 15% decline expected by 2021
The cost of onshore wind has declined by over 61% in the last six years, with costs expected to continue to fall due to progress made in reducing the costs of turbines, improving capacity factors and lower operating and maintenance costs over the next decade
Wind blades represent the second largest component of the total cost of wind turbines. The advancement of wind blade technology, including increased blade length / rotor diameter, has increased energy capture and played a fundamental role in reducing levelized cost of energy (LCOE) for onshore wind
8
$0
$50
$100
$150
$200
$250
Onshore wind
Solar PV utility
CCGT gas
Bioenergy Geo- thermal
Coal Solar thermal
w/storage
Offshore wind
Fossil Fuels
Onshore Wind

September 2016 9
U.S.
Policy
Initiatives
Increasing focus in board rooms regarding
the economic and social benefits of adopting
low-cost wind energy
In 2015, U.S. corporate, non-profit and
government entities procured 2.4 GW of wind
capacity, an increase of 12x from 2008
>50 leading multinationals such as Nike,
Walmart, IKEA, BMW, Coca Cola and Proctor
& Gamble have taken the RE100 pledge,
organized by the Climate Group, to transition
to 100% renewable energy
Global Policy Support Coupled with Corporate Initiatives Expected
to Drive Additional Growth
U.S. policy expected to support continued
domestic wind capacity installation
Extension of the Wind Production Tax Credit
(PTC) through 2019 with recent IRS
clarifications expanding PTC eligibility
allowing developers two additional years to
construct projects
EPA’s Clean Power Plan
Renewable Portfolio Standards
Corporate
Procurement
1
4
International
Policy
Initiatives
COP21
Paris
Climate
Talks
Recent global initiatives aimed at
promoting the growth of renewable energy
including wind
Large European Union members have
implemented renewable energy targets for
2020 of between 13% and 49% of all energy
use derived from renewable energy sources
China is targeting 250 GW of grid-
connected wind capacity by 2020
Paris Agreement is a landmark deal
marking a significant commitment by the
international community to further reduce
fossil fuel consumption
The Paris Agreement is legally binding, but
does not implement sanctions for failing to
meet emissions reduction targets
Effective in 2020, once it has been ratified
by 55 countries representing at least 55% of
global greenhouse gas emission
2
3
Source: Bloomberg New Energy Finance, China National Development and Reform Commission
Longer term policy visibility and an increase in corporate procurement is expected to drive additional growth over the next
decade
9
September 2016 10
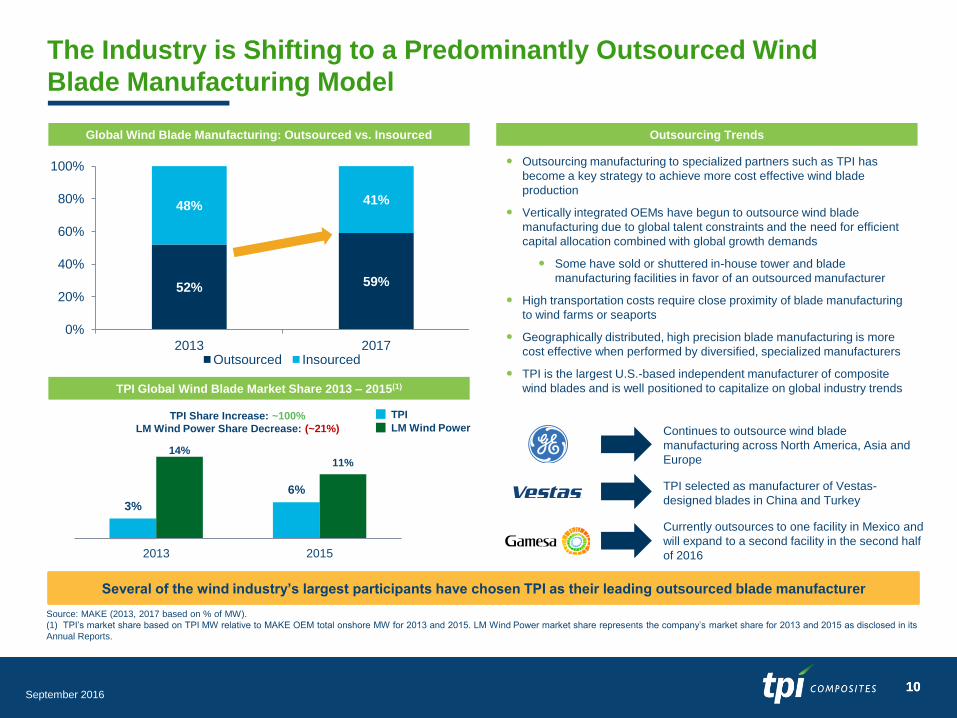
The Industry is Shifting to a Predominantly Outsourced Wind
Blade Manufacturing Model
Source: MAKE (2013, 2017 based on % of MW).
(1) TPI’s market share based on TPI MW relative to MAKE OEM total onshore MW for 2013 and 2015. LM Wind Power market share represents the company’s market share for 2013 and 2015 as disclosed in its
Annual Reports.
Global Wind Blade Manufacturing: Outsourced vs. Insourced
52% 59%
48% 41%
0%
20%
40%
60%
80%
100%
2013 2017 Outsourced Insourced
Outsourcing manufacturing to specialized partners such as TPI has
become a key strategy to achieve more cost effective wind blade
production
Vertically integrated OEMs have begun to outsource wind blade
manufacturing due to global talent constraints and the need for efficient
capital allocation combined with global growth demands
Some have sold or shuttered in-house tower and blade
manufacturing facilities in favor of an outsourced manufacturer
High transportation costs require close proximity of blade manufacturing
to wind farms or seaports
Geographically distributed, high precision blade manufacturing is more
cost effective when performed by diversified, specialized manufacturers
TPI is the largest U.S.-based independent manufacturer of composite
wind blades and is well positioned to capitalize on global industry trends
Several of the wind industry’s largest participants have chosen TPI as their leading outsourced blade manufacturer
Continues to outsource wind blade
manufacturing across North America, Asia and
Europe
TPI selected as manufacturer of Vestas-
designed blades in China and Turkey
Currently outsources to one facility in Mexico and
will expand to a second facility in the second half
of 2016
Outsourcing Trends
10
TPI Global Wind Blade Market Share 2013 – 2015(1)
3%
6%
14% 11%
2013 2015
TPI Share Increase: ~100%
LM Wind Power Share Decrease: (~21%)
TPI
LM Wind Power
September 2016 11
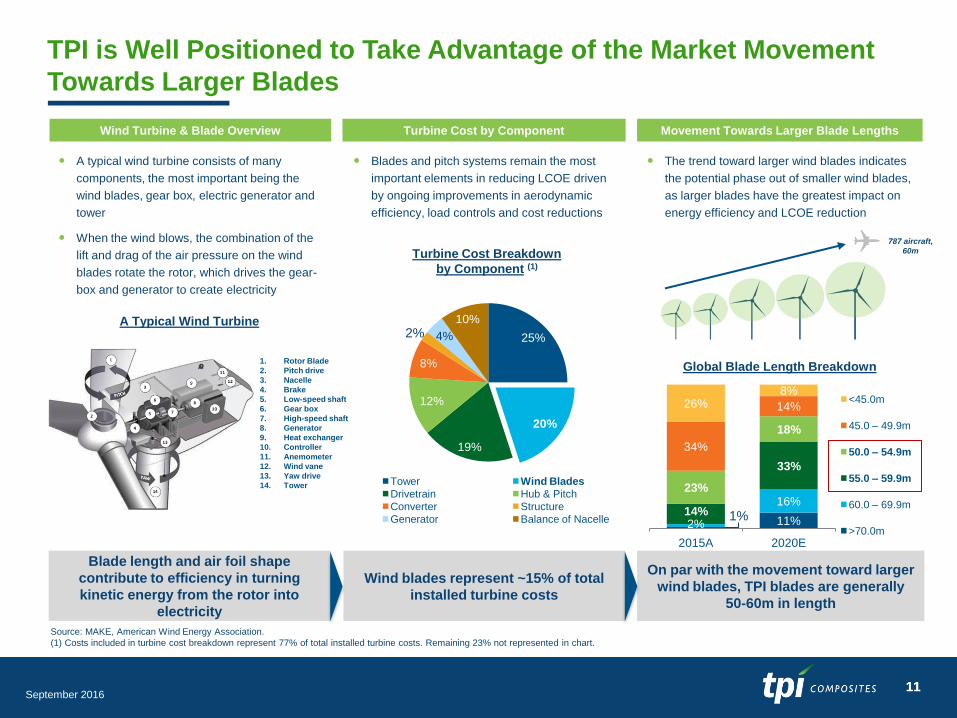
A typical wind turbine consists of many
components, the most important being the
wind blades, gear box, electric generator and
tower
When the wind blows, the combination of the
lift and drag of the air pressure on the wind
blades rotate the rotor, which drives the gear-
box and generator to create electricity
A Typical Wind Turbine
Blades and pitch systems remain the most
important elements in reducing LCOE driven
by ongoing improvements in aerodynamic
efficiency, load controls and cost reductions
25%
20%
19%
12%
8%
4%
10%
Tower Wind Blades
Drivetrain Hub & Pitch
Converter Structure
Generator Balance of Nacelle
2%
TPI is Well Positioned to Take Advantage of the Market Movement
Towards Larger Blades
11
The trend toward larger wind blades indicates
the potential phase out of smaller wind blades,
as larger blades have the greatest impact on
energy efficiency and LCOE reduction
Global Blade Length Breakdown
2% 11%
16% 14%
33%
23%
18%
34%
14% 26% 8%
2015A 2020E
<45.0m
45.0 – 49.9m
50.0 – 54.9m
55.0 – 59.9m
60.0 – 69.9m
>70.0m
1%
Wind Turbine & Blade Overview Turbine Cost by Component Movement Towards Larger Blade Lengths
Turbine Cost Breakdown
by Component (1)
Source: MAKE, American Wind Energy Association.
(1) Costs included in turbine cost breakdown represent 77% of total installed turbine costs. Remaining 23% not represented in chart.
Wind blades represent ~15% of total
installed turbine costs
787 aircraft,
60m
On par with the movement toward larger
wind blades, TPI blades are generally
50-60m in length
Blade length and air foil shape
contribute to efficiency in turning
kinetic energy from the rotor into
electricity
1. Rotor Blade
2. Pitch drive
3. Nacelle
4. Brake
5. Low-speed shaft
6. Gear box
7. High-speed shaft
8. Generator
9. Heat exchanger
10. Controller
11. Anemometer
12. Wind vane
13. Yaw drive
14. Tower

September 2016 12
Wind blades are a critical component of our customers’ strategy and, along with supply chain optimization, plays an integral role bringing down LCOE
We believe that our extensive experience and track-record in delivering high quality wind blades combined with our established global scale and
strong customer relationships creates a significant barrier to entry and is the foundation of our leadership position
Strong track record of
delivering high quality
wind blades to diverse,
global markets, and of
developing replicable and
scalable manufacturing
facilities and processes
Extensive Expertise
Strong Barriers to Entry will allow TPI to Capture Additional Market
Share
Reputation for Reliability
Established Global Scale Customer Stickiness
Over 26,000 wind blades
produced since 2001, with
an excellent field
performance record in a
market where reliability is
critical to our customers’
success
We expand our
manufacturing footprint in
coordination with our
customers’ needs, scaling
our capacity to meet
demand in markets across
the globe
Dedicated capacity and
collaborative approach of
manufacturing wind blades
to meet customer
specifications promotes
significant customer
loyalty and creates higher
switching costs
Source: MAKE.
12
TPI’s ability to capitalize on recent growth trends in the wind energy market and outsourcing trends has allowed it to grow its
revenue by 172% from 2013 to 2015 while expanding its global manufacturing footprint over the same period
September 2016 13
Global Footprint Strategically Optimized for Regional Industry
Demand
Source: Bloomberg New Energy Finance.
Note: Onshore wind capacity and installation statistics shown. Bubble sizes represent projected onshore wind generation capacity installations from 2016 to 2020 in GW.
(1) Includes new manufacturing facilities under construction in Mexico and Turkey expected to commence operations in the second half of 2016 and another new facility in Mexico expected to commence
operations in the first half of 2017.
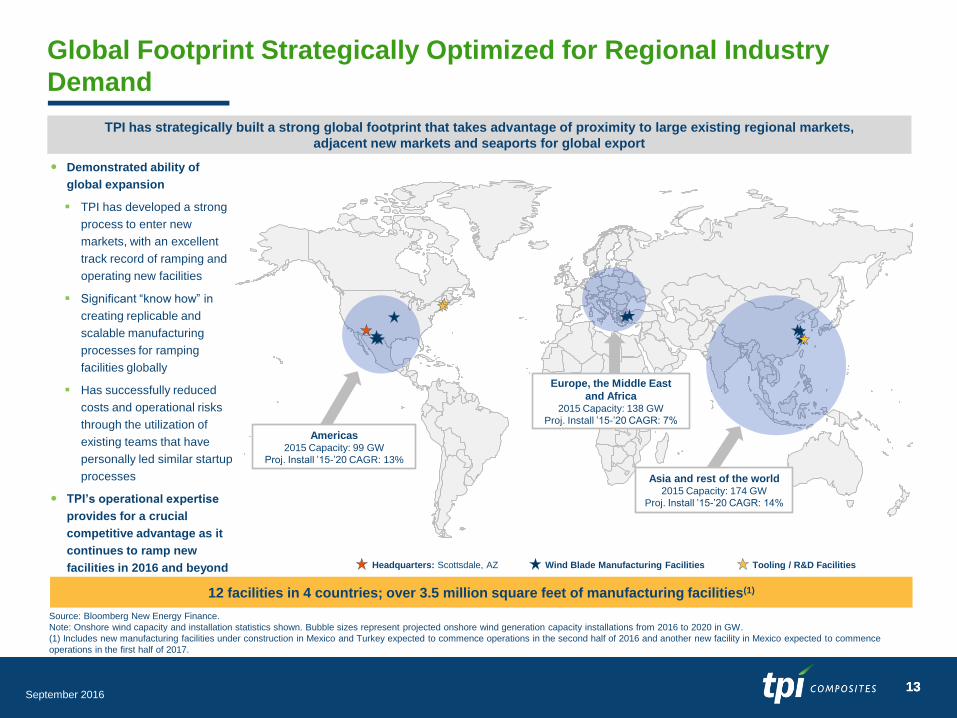
TPI has strategically built a strong global footprint that takes advantage of proximity to large existing regional markets,
adjacent new markets and seaports for global export
12 facilities in 4 countries; over 3.5 million square feet of manufacturing facilities(1)
Headquarters: Scottsdale, AZ Wind Blade Manufacturing Facilities Tooling / R&D Facilities
Europe, the Middle East
and Africa 2015 Capacity: 138 GW
Proj. Install ’15-’20 CAGR: 7%
Americas 2015 Capacity: 99 GW
Proj. Install ’15-’20 CAGR: 13%
Asia and rest of the world 2015 Capacity: 174 GW
Proj. Install ’15-’20 CAGR: 14%
13
Demonstrated ability of
global expansion
TPI has developed a strong
process to enter new
markets, with an excellent
track record of ramping and
operating new facilities
Significant “know how” in
creating replicable and
scalable manufacturing
processes for ramping
facilities globally
Has successfully reduced
costs and operational risks
through the utilization of
existing teams that have
personally led similar startup
processes
TPI’s operational expertise
provides for a crucial
competitive advantage as it
continues to ramp new
facilities in 2016 and beyond

September 2016 14
Advanced Composite Technology and Production Expertise Provides
Barrier to Entry
Blade technology has the greatest impact on reducing LCOE and is thus a key R&D focus for material suppliers and turbine
OEMs seeking to scale rotors cost effectively
Near-Aerospace Precision Blades
TPI technology toolbox includes highly advanced materials, tooling,
process and inspection methods & design for manufacturability (DFM)
Precision moulding and assembly systems deliver precise blades and
components
Blade tolerances & reliability require relentless quality control
Manufactured to Last
Advanced process technology creates lighter, stronger, and more
reliable composite structures
~26,000 blades produced with an excellent field performance record
Low Cost/High Quality Production
Optimization of labor and transportation costs from each of TPI’s
global sites
Innovation effort continues to improve performance while driving
down cost of materials and manufacturing process
Economies of scale and existing regional infrastructure drive down
direct costs
Customer partnerships include shared R&D and engineering
expertise to optimize manufacturing
Global sourcing creates purchasing power with suppliers
Joint Design Optimization with Customers
As production costs improve, TPI is able to help further reduce LCOE
and cement strong customer partnerships
14
September 2016 15
Dedicated Supplier Model Encourages Stable Long-Term
Customers
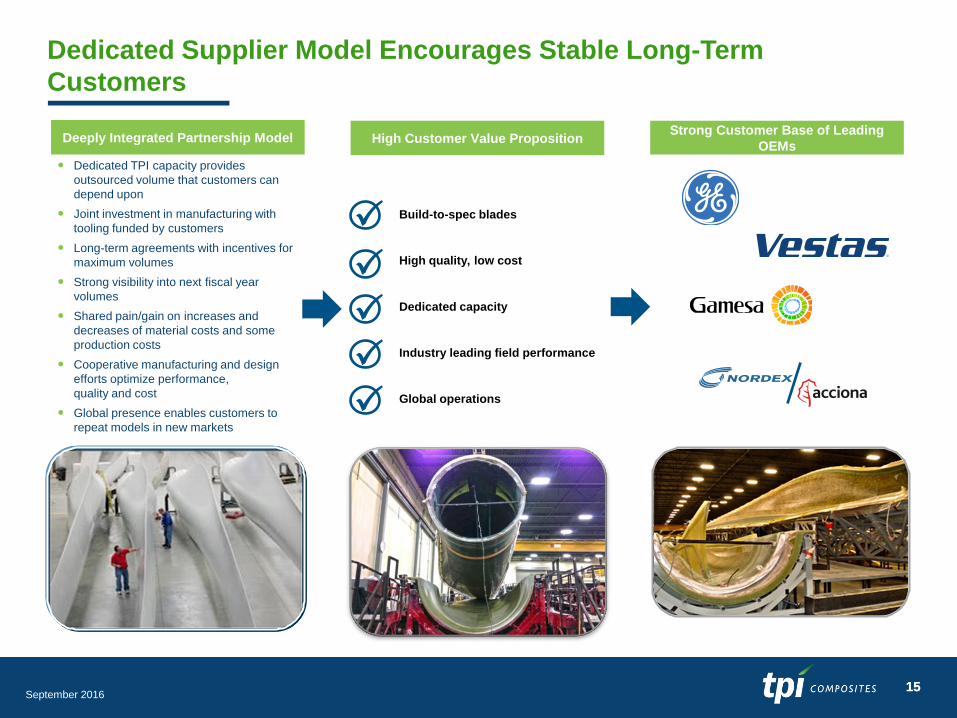
Build-to-spec blades
Dedicated TPI capacity provides
outsourced volume that customers can
depend upon
Joint investment in manufacturing with
tooling funded by customers
Long-term agreements with incentives for
maximum volumes
Strong visibility into next fiscal year
volumes
Shared pain/gain on increases and
decreases of material costs and some
production costs
Cooperative manufacturing and design
efforts optimize performance,
quality and cost
Global presence enables customers to
repeat models in new markets
Dedicated capacity
Industry leading field performance
High quality, low cost
Global operations
High Customer Value Proposition Deeply Integrated Partnership Model Strong Customer Base of Leading
OEMs
15
September 2016 16
Existing Contracts Provide for up to $3.1 Billion in Revenue
Long-term contracts with minimum volume obligations provide strong revenue visibility
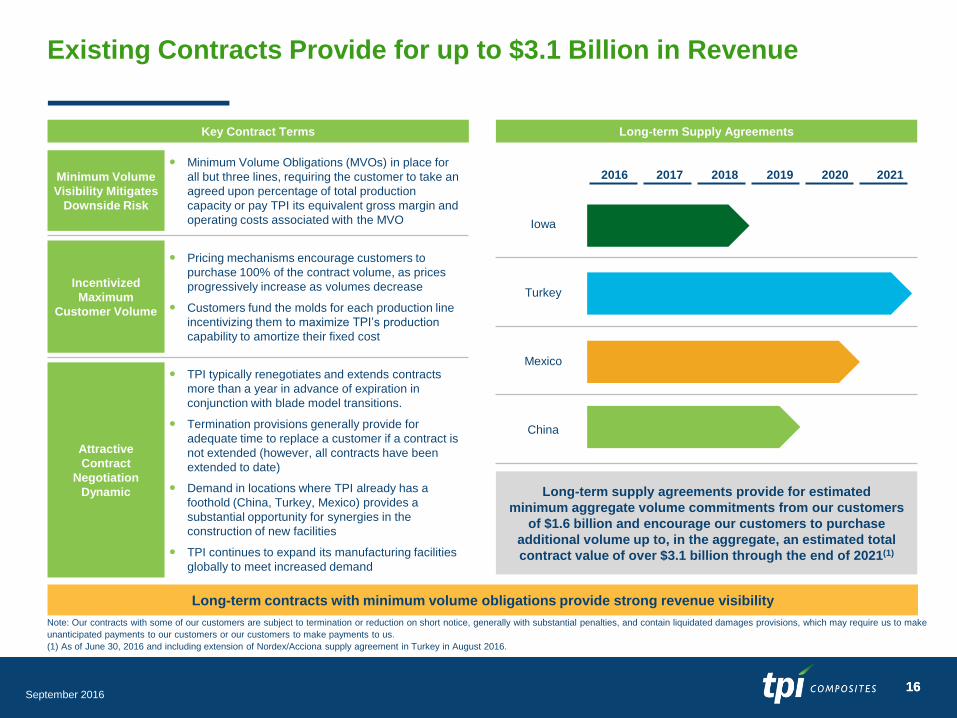
Key Contract Terms
Minimum Volume
Visibility Mitigates
Downside Risk
Minimum Volume Obligations (MVOs) in place for
all but three lines, requiring the customer to take an
agreed upon percentage of total production
capacity or pay TPI its equivalent gross margin and
operating costs associated with the MVO
Incentivized
Maximum
Customer Volume
Pricing mechanisms encourage customers to
purchase 100% of the contract volume, as prices
progressively increase as volumes decrease
Customers fund the molds for each production line
incentivizing them to maximize TPI’s production
capability to amortize their fixed cost
Attractive
Contract
Negotiation
Dynamic
TPI typically renegotiates and extends contracts
more than a year in advance of expiration in
conjunction with blade model transitions.
Termination provisions generally provide for
adequate time to replace a customer if a contract is
not extended (however, all contracts have been
extended to date)
Demand in locations where TPI already has a
foothold (China, Turkey, Mexico) provides a
substantial opportunity for synergies in the
construction of new facilities
TPI continues to expand its manufacturing facilities
globally to meet increased demand
2016 2017 2018 2019 2020 2021
Iowa
Turkey
Mexico
China
Note: Our contracts with some of our customers are subject to termination or reduction on short notice, generally with substantial penalties, and contain liquidated damages provisions, which may require us to make
unanticipated payments to our customers or our customers to make payments to us.
(1) As of June 30, 2016 and including extension of Nordex/Acciona supply agreement in Turkey in August 2016.
Long-term supply agreements provide for estimated
minimum aggregate volume commitments from our customers
of $1.6 billion and encourage our customers to purchase
additional volume up to, in the aggregate, an estimated total
contract value of over $3.1 billion through the end of 2021(1)
Long-term Supply Agreements
16
September 2016 17
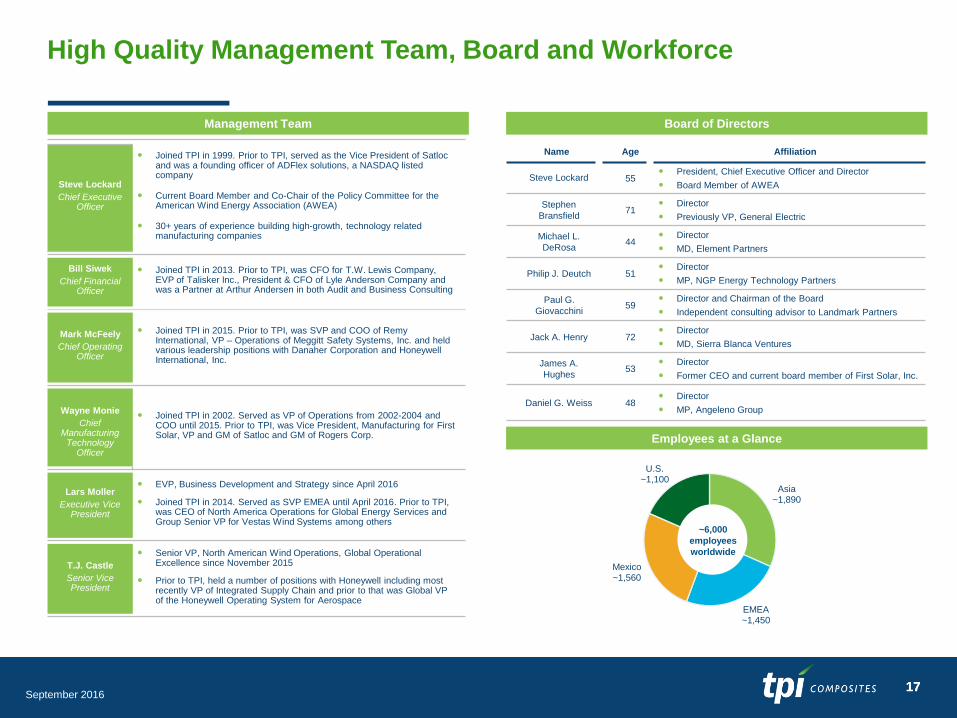
Asia ~1,890
EMEA ~1,450
Mexico ~1,560
U.S. ~1,100
High Quality Management Team, Board and Workforce
Management Team Board of Directors
Steve Lockard
Chief Executive Officer
Joined TPI in 1999. Prior to TPI, served as the Vice President of Satloc and was a founding officer of ADFlex solutions, a NASDAQ listed company
Current Board Member and Co-Chair of the Policy Committee for the American Wind Energy Association (AWEA)
30+ years of experience building high-growth, technology related manufacturing companies
Bill Siwek
Chief Financial Officer
Joined TPI in 2013. Prior to TPI, was CFO for T.W. Lewis Company, EVP of Talisker Inc., President & CFO of Lyle Anderson Company and was a Partner at Arthur Andersen in both Audit and Business Consulting
Mark McFeely
Chief Operating Officer
Joined TPI in 2015. Prior to TPI, was SVP and COO of Remy International, VP – Operations of Meggitt Safety Systems, Inc. and held various leadership positions with Danaher Corporation and Honeywell International, Inc.
Wayne Monie
Chief Manufacturing
Technology Officer
Joined TPI in 2002. Served as VP of Operations from 2002-2004 and COO until 2015. Prior to TPI, was Vice President, Manufacturing for First Solar, VP and GM of Satloc and GM of Rogers Corp.
Lars Moller
Executive Vice President
EVP, Business Development and Strategy since April 2016
Joined TPI in 2014. Served as SVP EMEA until April 2016. Prior to TPI, was CEO of North America Operations for Global Energy Services and Group Senior VP for Vestas Wind Systems among others
T.J. Castle
Senior Vice President
Senior VP, North American Wind Operations, Global Operational Excellence since November 2015
Prior to TPI, held a number of positions with Honeywell including most recently VP of Integrated Supply Chain and prior to that was Global VP of the Honeywell Operating System for Aerospace
Employees at a Glance
Name Age Affiliation
Steve Lockard 55 President, Chief Executive Officer and Director
Board Member of AWEA
Stephen
Bransfield 71
Director
Previously VP, General Electric
Michael L.
DeRosa 44
Director
MD, Element Partners
Philip J. Deutch 51 Director
MP, NGP Energy Technology Partners
Paul G.
Giovacchini 59
Director and Chairman of the Board
Independent consulting advisor to Landmark Partners
Jack A. Henry 72 Director
MD, Sierra Blanca Ventures
James A.
Hughes 53
Director
Former CEO and current board member of First Solar, Inc.
Daniel G. Weiss 48 Director
MP, Angeleno Group
~6,000
employees
worldwide
17

September 2016 18
Key Company Highlights
Capitalizing on Strong Wind Industry Growth, Blade Outsourcing Trends and Market
Share Gains
Long-Term Supply Agreements Provide Significant Revenue Visibility
Industry Leader with Strategic Global Footprint
Advanced Composite Technology and Production Expertise Provides Barrier to Entry
Unique Collaborative Dedicated Supplier Model
Compelling Return on Invested Capital
Seasoned Management Team with Significant High Growth Experience
19 September 2016
Financial Summary
September 2016 20
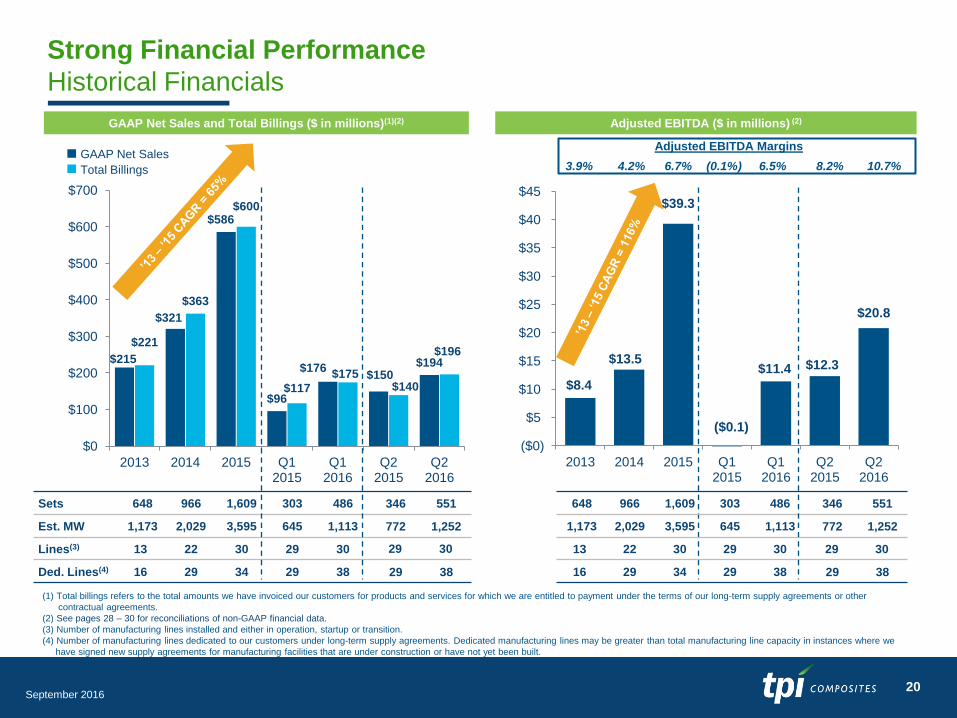
$8.4
$13.5
$39.3
$11.4 $12.3
$20.8
($0)
$5
$10
$15
$20
$25
$30
$35
$40
$45
2013 2014 2015 Q1 2015
Q1 2016
Q2 2015
Q2 2016
Sets 648 966 1,609 303 486 346 551
Est. MW 1,173 2,029 3,595 645 1,113 772 1,252
Lines(3) 13 22 30 29 30 29 30
Ded. Lines(4) 16 29 34 29 38 29 38
Strong Financial Performance
Historical Financials
GAAP Net Sales and Total Billings ($ in millions)(1)(2) Adjusted EBITDA ($ in millions) (2)
$215
$321
$586
$96
$176 $150
$194
$221
$363
$600
$117
$175 $140
$196
$0
$100
$200
$300
$400
$500
$600
$700
2013 2014 2015 Q1 2015
Q1 2016
Q2 2015
Q2 2016
(1) Total billings refers to the total amounts we have invoiced our customers for products and services for which we are entitled to payment under the terms of our long-term supply agreements or other
contractual agreements.
(2) See pages 28 – 30 for reconciliations of non-GAAP financial data.
(3) Number of manufacturing lines installed and either in operation, startup or transition.
(4) Number of manufacturing lines dedicated to our customers under long-term supply agreements. Dedicated manufacturing lines may be greater than total manufacturing line capacity in instances where we
have signed new supply agreements for manufacturing facilities that are under construction or have not yet been built.
Total Billings
GAAP Net Sales
($0.1)
Adjusted EBITDA Margins
6.7% 4.2% 3.9% (0.1%) 6.5%
648 966 1,609 303 486 346 551
1,173 2,029 3,595 645 1,113 772 1,252
13 22 30 29 30 29 30
16 29 34 29 38 29 38
8.2% 10.7%
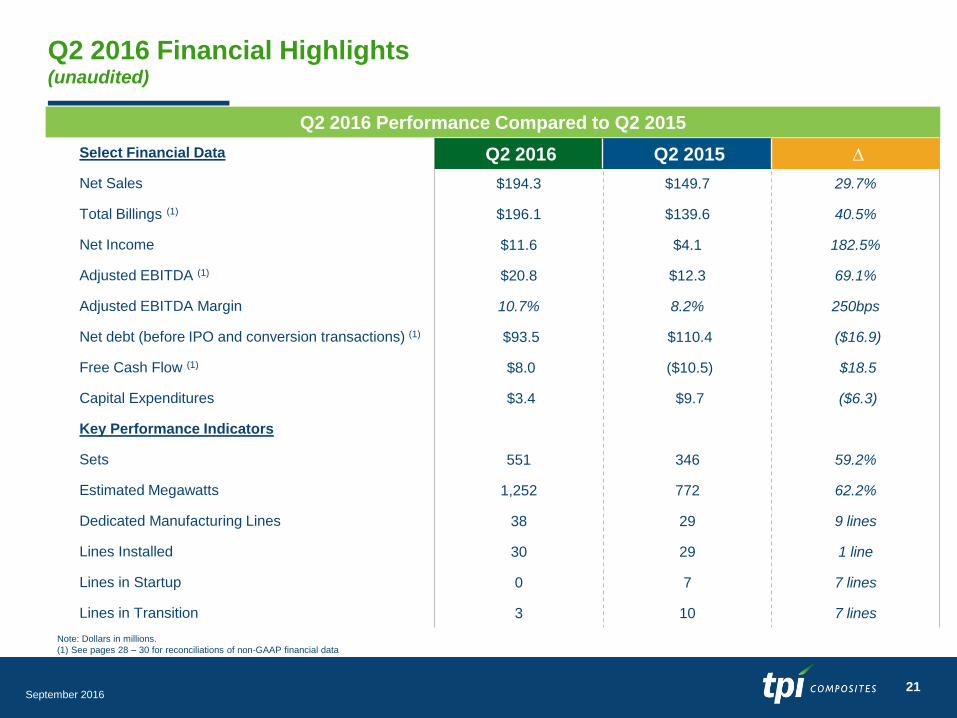
September 2016 21
Q2 2016 Financial Highlights (unaudited)
Q2 2016 Performance Compared to Q2 2015
Select Financial Data
Net Sales $194.3 $149.7 29.7%
Total Billings (1) $196.1 $139.6 40.5%
Net Income $11.6 $4.1 182.5%
Adjusted EBITDA (1) $20.8 $12.3 69.1%
Adjusted EBITDA Margin 10.7% 8.2% 250bps
Net debt (before IPO and conversion transactions) (1) $93.5 $110.4 ($16.9)
Free Cash Flow (1) $8.0 ($10.5) $18.5
Capital Expenditures $3.4 $9.7 ($6.3)
Key Performance Indicators
Sets 551 346 59.2%
Estimated Megawatts 1,252 772 62.2%
Dedicated Manufacturing Lines 38 29 9 lines
Lines Installed 30 29 1 line
Lines in Startup 0 7 7 lines
Lines in Transition 3 10 7 lines
Q2 2016 Q2 2015 ∆
Note: Dollars in millions.
(1) See pages 28 – 30 for reconciliations of non-GAAP financial data
September 2016 22
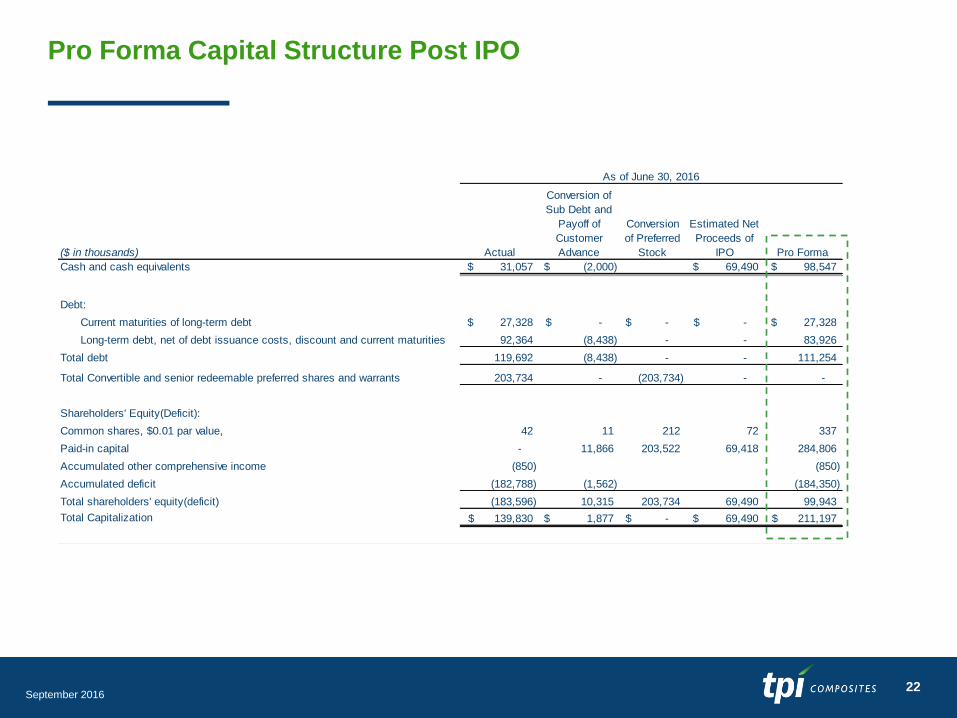
Pro Forma Capital Structure Post IPO
($ in thousands) Actual
Conversion of
Sub Debt and
Payoff of
Customer
Advance
Conversion
of Preferred
Stock
Estimated Net
Proceeds of
IPO Pro Forma
Cash and cash equivalents 31,057$ (2,000)$ 69,490$ 98,547$
Debt:
Current maturities of long-term debt 27,328$ -$ -$ -$ 27,328$
Long-term debt, net of debt issuance costs, discount and current maturities 92,364 (8,438) - - 83,926
Total debt 119,692 (8,438) - - 111,254
Total Convertible and senior redeemable preferred shares and warrants 203,734 - (203,734) - -
Shareholders' Equity(Deficit):
Common shares, $0.01 par value, 42 11 212 72 337
Paid-in capital - 11,866 203,522 69,418 284,806
Accumulated other comprehensive income (850) (850)
Accumulated deficit (182,788) (1,562) (184,350)
Total shareholders' equity(deficit) (183,596) 10,315 203,734 69,490 99,943
Total Capitalization 139,830$ 1,877$ -$ 69,490$ 211,197$
As of June 30, 2016

September 2016 23
Income Statement Summary (unaudited)
(1) Includes conversion of preferred stock, preferred stock warrants and subordinated convertible promissory notes immediately prior to IPO
(2) See pages 28 – 30 for reconciliations of Non-GAAP financial data
Pro Forma
Three Months
Ended June 30,
2015 2016 2016 (1) $ %
($ in thousands, except per share amounts)
Net sales 149,739$ 194,255$ 194,255$ 44,516$ 29.7%
Gross profit 12,150$ 22,818$ 22,818$ 10,668$ 87.8%
Gross profit % 8.1% 11.7% 11.7% 360bps
General and administrative expenses 2,899$ 5,340$ 5,340$ 2,441$ 84.2%
General and administrative expenses % 1.9% 2.7% 2.7% 80bps
Income from operations 9,251$ 17,478$ 17,478$ 8,227$ 88.9%
Income before income taxes 5,314$ 13,508$ 13,508$ 8,194$ 154.2%
Net income 4,090$ 11,555$ 11,555$ 7,465$ 182.5%
Net income attributable to preferred shareholders 2,356$ 2,438$ -$ 82$ 3.5%
Net income attributable to common shareholders 1,734$ 9,117$ 11,555$ 7,383$ 425.8%
Weighted-average common shares outstanding:
Basic 4,238 4,238 26,549
Diluted 4,244 4,244 26,555
Basic income per common share 0.41$ 2.15$ 0.44$ 1.74$
Diluted income per common share 0.41$ 2.15$ 0.44$ 1.74$
Non-GAAP Metrics
Total billings (2) 139,602$ 196,146$ 196,146$ 56,544$ 40.5%
EBITDA (2) 11,867$ 20,776$ 20,776$ 8,909$ 75.1%
EBITDA margin 7.9% 10.7% 10.7% 280bps
Adjusted EBITDA (2) 12,300$ 20,794$ 20,794$ 8,494$ 69.1%
Adjusted EBITDA margin 8.2% 10.7% 10.7% 250bps
Three Months Ended
June 30, Change
September 2016 24
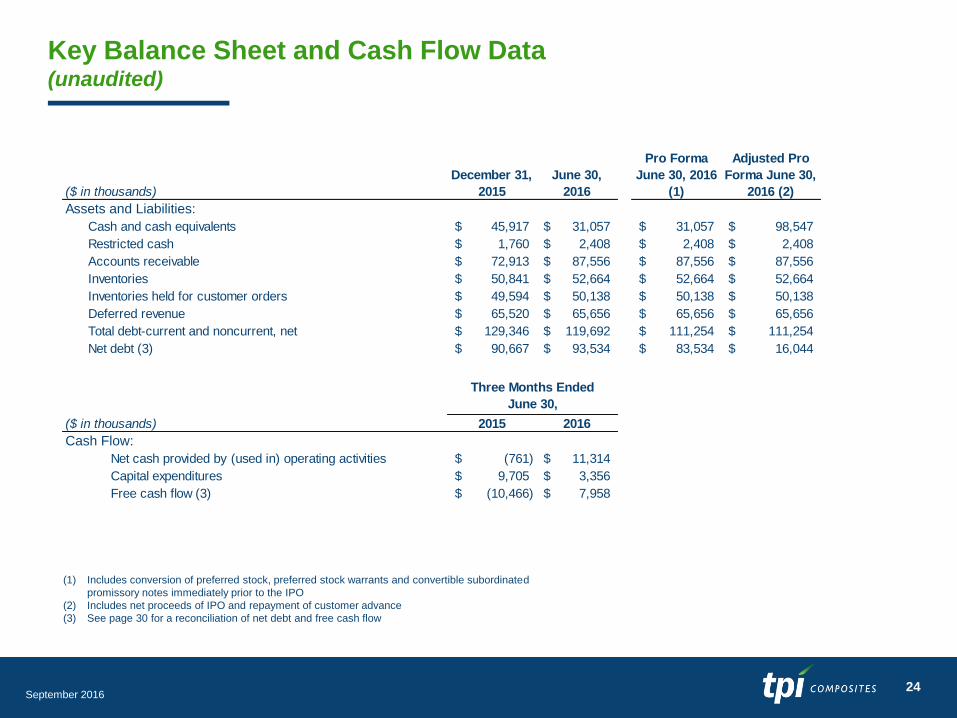
Key Balance Sheet and Cash Flow Data (unaudited)
(1) Includes conversion of preferred stock, preferred stock warrants and convertible subordinated
promissory notes immediately prior to the IPO
(2) Includes net proceeds of IPO and repayment of customer advance
(3) See page 30 for a reconciliation of net debt and free cash flow
($ in thousands)
December 31,
2015
June 30,
2016
Pro Forma
June 30, 2016
(1)
Adjusted Pro
Forma June 30,
2016 (2)
Assets and Liabilities:
Cash and cash equivalents 45,917$ 31,057$ 31,057$ 98,547$
Restricted cash 1,760$ 2,408$ 2,408$ 2,408$
Accounts receivable 72,913$ 87,556$ 87,556$ 87,556$
Inventories 50,841$ 52,664$ 52,664$ 52,664$
Inventories held for customer orders 49,594$ 50,138$ 50,138$ 50,138$
Deferred revenue 65,520$ 65,656$ 65,656$ 65,656$
Total debt-current and noncurrent, net 129,346$ 119,692$ 111,254$ 111,254$
Net debt (3) 90,667$ 93,534$ 83,534$ 16,044$
($ in thousands) 2015 2016
Cash Flow:
Net cash provided by (used in) operating activities (761)$ 11,314$
Capital expenditures 9,705$ 3,356$
Free cash flow (3) (10,466)$ 7,958$
Three Months Ended
June 30,
25 September 2016
2016 Guidance
September 2016 26
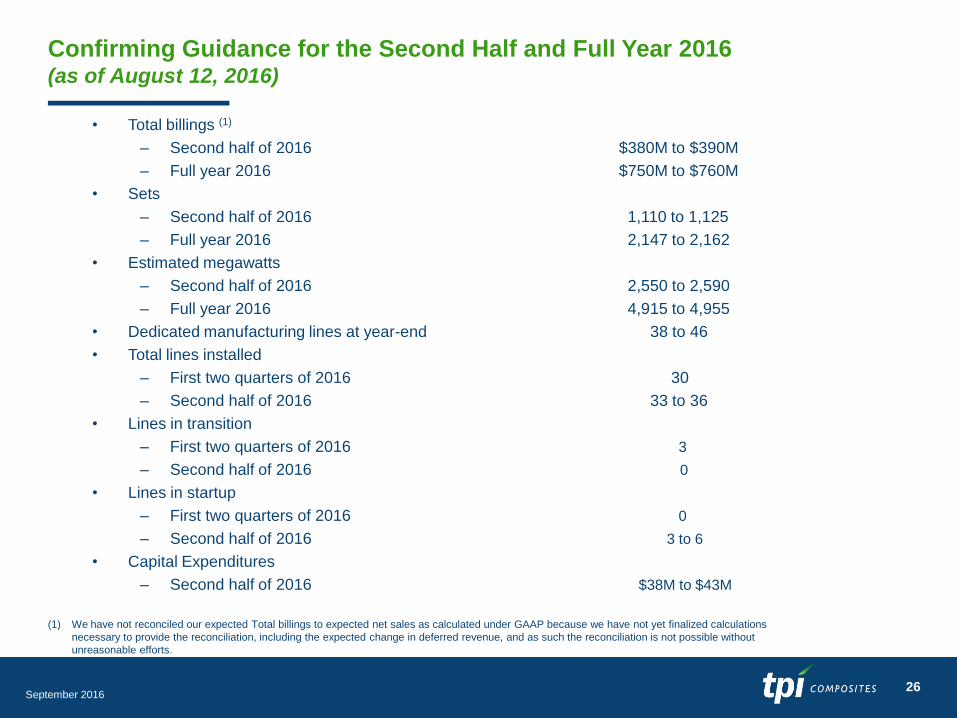
Confirming Guidance for the Second Half and Full Year 2016 (as of August 12, 2016)
• Total billings (1)
– Second half of 2016 $380M to $390M
– Full year 2016 $750M to $760M
• Sets
– Second half of 2016 1,110 to 1,125
– Full year 2016 2,147 to 2,162
• Estimated megawatts
– Second half of 2016 2,550 to 2,590
– Full year 2016 4,915 to 4,955
• Dedicated manufacturing lines at year-end 38 to 46
• Total lines installed
– First two quarters of 2016 30
– Second half of 2016 33 to 36
• Lines in transition
– First two quarters of 2016 3
– Second half of 2016 0
• Lines in startup
– First two quarters of 2016 0
– Second half of 2016 3 to 6
• Capital Expenditures
– Second half of 2016 $38M to $43M
(1) We have not reconciled our expected Total billings to expected net sales as calculated under GAAP because we have not yet finalized calculations
necessary to provide the reconciliation, including the expected change in deferred revenue, and as such the reconciliation is not possible without
unreasonable efforts.
27 September 2016
Appendix - Non-GAAP Information
This presentation includes unaudited non-GAAP financial measures including total billings, EBITDA, adjusted EBITDA, net
debt and free cash flow. We define total billings as the total amounts we have invoiced our customers for products and
services for which we are entitled to payment under the terms of our long-term supply agreements or other contractual
agreements. We define EBITDA as net income (loss) attributable to the Company plus interest expense (net of interest
income), income taxes, and depreciation and amortization. We define adjusted EBITDA as EBITDA plus any share-based
compensation expense, plus or minus any gains or losses from foreign currency remeasurement plus any loss on
extinguishment of debt. We define net debt as the total principal amount of debt outstanding less unrestricted cash and
equivalents. We define free cash flow as net cash flow generated from operating activities less capital expenditures. We
present non-GAAP measures when we believe that the additional information is useful and meaningful to investors. Non-
GAAP financial measures do not have any standardized meaning and are therefore unlikely to be comparable to similar
measures presented by other companies. The presentation of non-GAAP financial measures is not intended to be a
substitute for, and should not be considered in isolation from, the financial measures reported in accordance with GAAP. See
below for a reconciliation of certain non-GAAP financial measures to the comparable GAAP measures.

September 2016 28
Non-GAAP Reconciliations (unaudited)
Note: Footnote references on the following page
Net sales is reconciled to total billings as follows:
Net income is reconciled to EBITDA and adjusted EBITDA as follows:
Pro Forma
Three
Months
Ended
June 30, (3)
($ in thousands) 2013 2014 2015 2015 2016 2015 2016 2016
Net sales 215,054$ 320,747$ 585,852$ 95,589$ 176,110$ 149,739$ 194,255$ 194,255$
Change in deferred revenue:
Blade-related deferred revenue at beginning of period (1) (16,730) (20,646) (59,476) (59,476) (65,520) (76,534) (65,027) (65,027)
Blade-related deferred revenue at end of period (1) 20,646 59,476 65,520 76,534 65,027 68,226 65,656 65,656
Foreign exchange impact (2) 2,087 3,172 8,211 4,443 (1,079) (1,829) 1,262 1,262
Change in deferred revenue 6,003 42,002 14,255 21,501 (1,572) (10,137) 1,891 1,891
Total billings 221,057$ 362,749$ 600,107$ 117,090$ 174,538$ 139,602$ 196,146$ 196,146$
Three Months Ended
June 30,
Three Months Ended
March 31, Year Ended December 31,
Pro Forma
Three
Months
Ended
June 30, (3)
($ in thousands) 2013 2014 2015 2015 2016 2015 2016 2016
Net income (loss) 1,279$ (6,648)$ 7,682$ (5,737)$ 1,746$ 4,090$ 11,555$ 11,555$
Adjustments:
Depreciation and amortization 5,250 7,441 11,416 2,401 3,011 2,909 3,162 3,162
Interest expense (net of interest income) 3,319 7,050 14,404 3,492 3,891 3,644 4,106 4,106
Income tax provision (benefit) (3,346) 925 3,977 (120) 2,303 1,224 1,953 1,953
EBITDA 6,502 8,768 37,479 36 10,951 11,867 20,776 20,776
Realized loss (gain) on foreign currency remeasurement 1,892 1,743 1,802 (163) 439 433 18 18
Share-based compensation expense 36 - - - - - - -
Loss on extinguishment of debt - 2,946 - - - - - -
Adjusted EBITDA 8,430$ 13,457$ 39,281$ (127)$ 11,390$ 12,300$ 20,794$ 20,794$
Three Months Ended
June 30, Year Ended December 31,
Three Months Ended
March 31,
September 2016 29
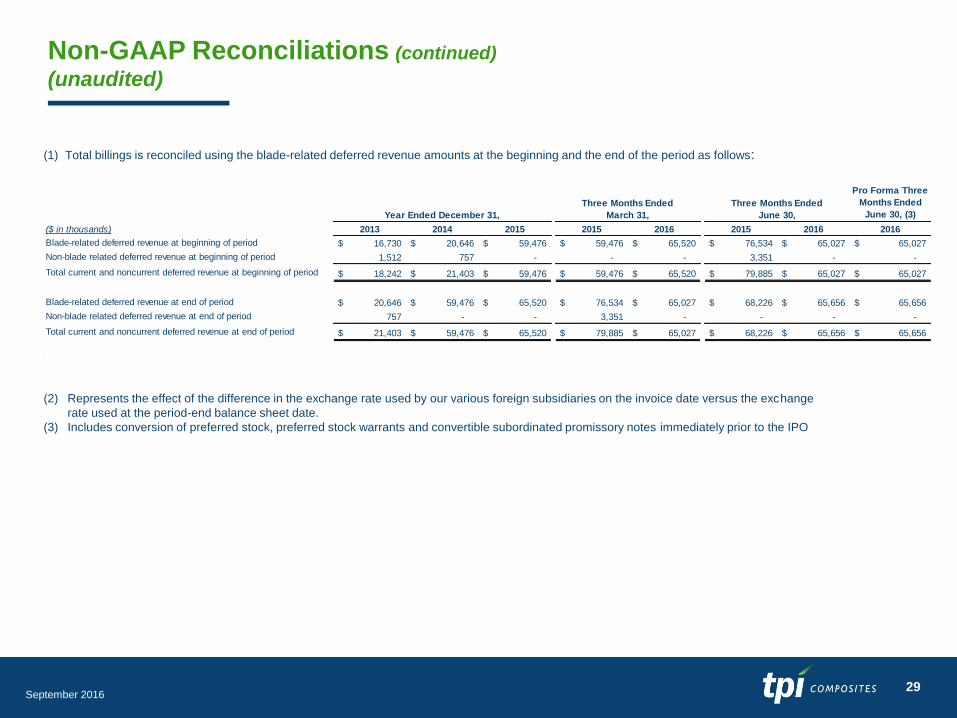
Non-GAAP Reconciliations (continued)
(unaudited)
(1) Total billings is reconciled using the blade-related deferred revenue amounts at the beginning and the end of the period as follows:
(2) Represents the effect of the difference in the exchange rate used by our various foreign subsidiaries on the invoice date versus the exchange
rate used at the period-end balance sheet date.
(3) Includes conversion of preferred stock, preferred stock warrants and convertible subordinated promissory notes immediately prior to the IPO
Pro Forma Three
Months Ended
June 30, (3)
($ in thousands) 2013 2014 2015 2015 2016 2015 2016 2016
Blade-related deferred revenue at beginning of period 16,730$ 20,646$ 59,476$ 59,476$ 65,520$ 76,534$ 65,027$ 65,027$
Non-blade related deferred revenue at beginning of period 1,512 757 - - - 3,351 - -
Total current and noncurrent deferred revenue at beginning of period 18,242$ 21,403$ 59,476$ 59,476$ 65,520$ 79,885$ 65,027$ 65,027$
Blade-related deferred revenue at end of period 20,646$ 59,476$ 65,520$ 76,534$ 65,027$ 68,226$ 65,656$ 65,656$
Non-blade related deferred revenue at end of period 757 - - 3,351 - - - -
Total current and noncurrent deferred revenue at end of period 21,403$ 59,476$ 65,520$ 79,885$ 65,027$ 68,226$ 65,656$ 65,656$
Three Months Ended
June 30, Year Ended December 31,
Three Months Ended
March 31,

September 2016 30
Non-GAAP Reconciliations (continued)
(unaudited)
Net debt is reconciled as follows:
Free cash flow is reconciled as follows:
($ in thousands) 2015 2016
Net cash provided by (used in) operating activities (761)$ 11,314$
Less capital expenditures (9,705) (3,356)
Free cash flow (10,466)$ 7,958$
Three Months Ended
June 30,
($ in thousands)
December 31,
2015
June 30,
2016
Pro Forma
June 30, 2016
(1)
Adjusted Pro
Forma June
30, 2016 (2)
June 30,
2015
Total debt, net of debt issuance costs and discount 129,346$ 119,692$ 111,254$ 111,254$ 114,411$
Add debt issuance costs 4,220 3,390 3,337 3,337 3,773
Add discount on debt 3,018 1,509 - - 4,526
Less cash and cash equivalents (45,917) (31,057) (31,057) (98,547) (12,325)
Net debt 90,667$ 93,534$ 83,534$ 16,044$ 110,385$
(1) Includes conversion of preferred stock, preferred stock warrants and convertible subordinated promissory notes immediately prior to the IPO
(2) Includes net proceeds of IPO after repayment of customer advance.

Related Documents