COMPANY OVERVIEW October 2020

Welcome message from author
This document is posted to help you gain knowledge. Please leave a comment to let me know what you think about it! Share it to your friends and learn new things together.
Transcript
COMPANY OVERVIEWOctober 2020
2
Contents
Company Profile
Investment Highlights
Financial Overview
1
2
3

Company Profile

Largest Integrated Petrochemical Producer in Indonesia
Chandra Asri – Indonesia’s leading and preferred petrochemical company
Integration from upstream cracker to downstream polyolefin products– Strategically located near key customers
Low production cost base and operating efficiencies– Benefit from scale of feedstock sourcing and stable supplier relationships– Naphtha cracker utilization rate >90% in average
Long-standing relationships with diverse customer base– No single customer accounts for more than 7-8% of consolidated revenue– Around +/- 75% of products by revenue were sold to domestic market
Captive distribution network provides significant cost efficiencies– Key customers integrated with CAP production facilities via CAP’s pipelines– Provides significant cost efficiencies to key customers
New projects fueling strategic growth– Other efficiency improvements to complete integration of existing complex. – CAP 2 plan remains fully unchanged, and the pace will be subject to the stage-gated approach we have consistently adopted to ensure prudent
and effective deployment of capital, underpinned by a strong equity base.
Largest integrated petrochemical producer in Indonesia and operates the country’s only Naphtha Cracker, Styrene Monomer, Butadiene, MTBE and Butene-1 plants
Market leadership in highly attractive Indonesia and SE Asia petrochemical market– Market share of approximately 50%, 30%, and 32% of the domestic market (including imports) in Olefin, Polyethylene, and Polypropylene,
respectively
Support from Barito Pacific Group and Siam Cement Group
Vital National Object status
Transformed in 2016 following the 4Q2015 Naphtha Cracker expansion and Furnace revamping in 2019, Production capacity increased by some 50% to Ethylene 900 KTA, Propylene 490 KTA, Py-Gas 418 KTA, and Mixed C4 330 KTA
Further downstream expansion completed in 2018-2020, Butadiene plant up to 137 KTA from 100 KTA; new Synthetic Rubber plant with capacity of 120 KTA (a joint venture with Michelin); new Polyethylene plant of 400 KTA bringing total Polyethylene capacity to 736 KTA, new expanded capacity of Polypropylene plant at 590 KTA through debottlenecking; and new plant of MTBE and Butene-1 plant with capacity of 128 KTA and 43 KTA respectively which completed the second phase master plan of CAP integrated complex.
CAP’s main integrated manufacturing complex
FY-2019 Key Figures
Stable and Robust Financials Supported by Credit StrengthsNet RevenuesUSD1,881m
EBITDAUSD180m
Net IncomeUSD24m
Cash BalanceUSD660m
Cash Flow fromOperating Activities
USD238m
Capital ExpenditureUSD385m
4
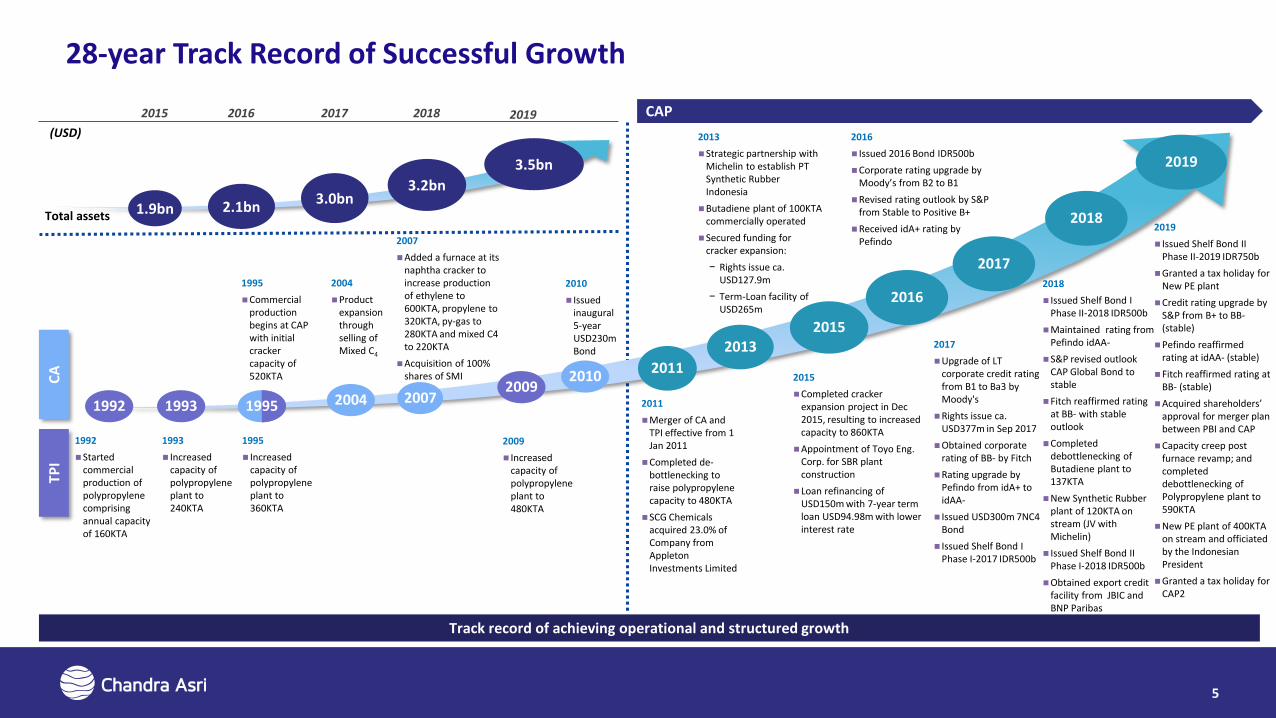
28-year Track Record of Successful Growth
CAP
Track record of achieving operational and structured growth
TPI
CA
1992
Started commercial production of polypropylene comprising annual capacity of 160KTA
1993
Increased capacity of polypropylene plant to 240KTA
1995
Increased capacity of polypropylene plant to 360KTA
2009
Increased capacity of polypropylene plant to 480KTA
1995
Commercial production begins at CAP with initial cracker capacity of 520KTA
2004
Product expansion through selling of Mixed C4
2007
Added a furnace at its naphtha cracker to increase production of ethylene to 600KTA, propylene to 320KTA, py-gas to 280KTA and mixed C4 to 220KTA
Acquisition of 100% shares of SMI
2010
Issued inaugural 5-year USD230m Bond
2015
Completed cracker expansion project in Dec 2015, resulting to increased capacity to 860KTA
Appointment of Toyo Eng. Corp. for SBR plant construction
Loan refinancing of USD150m with 7-year term loan USD94.98m with lower interest rate
2013
Strategic partnership with Michelin to establish PT Synthetic Rubber Indonesia
Butadiene plant of 100KTA commercially operated
Secured funding for cracker expansion:
− Rights issue ca. USD127.9m
− Term-Loan facility of USD265m
2011
Merger of CA and TPI effective from 1 Jan 2011
Completed de-bottlenecking to raise polypropylene capacity to 480KTA
SCG Chemicals acquired 23.0% of Company from Appleton Investments Limited
2015 2016
2016
Issued 2016 Bond IDR500b
Corporate rating upgrade by Moody’s from B2 to B1
Revised rating outlook by S&P from Stable to Positive B+
Received idA+ rating by Pefindo
2017
Upgrade of LT corporate credit rating from B1 to Ba3 by Moody's
Rights issue ca. USD377m in Sep 2017
Obtained corporate rating of BB- by Fitch
Rating upgrade by Pefindo from idA+ to idAA-
Issued USD300m 7NC4 Bond
Issued Shelf Bond I Phase I-2017 IDR500b
1992 1993 19952009
2004 2007
20102011
2015
2016
2017
2013
2018
2018
Issued Shelf Bond I Phase II-2018 IDR500b
Maintained rating from Pefindo idAA-
S&P revised outlook CAP Global Bond to stable
Fitch reaffirmed rating at BB- with stable outlook
Completed debottlenecking of Butadiene plant to 137KTA
New Synthetic Rubber plant of 120KTA on stream (JV with Michelin)
Issued Shelf Bond II Phase I-2018 IDR500b
Obtained export credit facility from JBIC and BNP Paribas
2017
Total assets 1.9bn 2.1bn
(USD)
3.0bn3.2bn
2018
5
2019
Issued Shelf Bond II Phase II-2019 IDR750b
Granted a tax holiday for New PE plant
Credit rating upgrade by S&P from B+ to BB-(stable)
Pefindo reaffirmed rating at idAA- (stable)
Fitch reaffirmed rating at BB- (stable)
Acquired shareholders’ approval for merger plan between PBI and CAP
Capacity creep post furnace revamp; and completed debottlenecking of Polypropylene plant to 590KTA
New PE plant of 400KTA on stream and officiated by the Indonesian President
Granted a tax holiday for CAP2
20193.5bn
2019
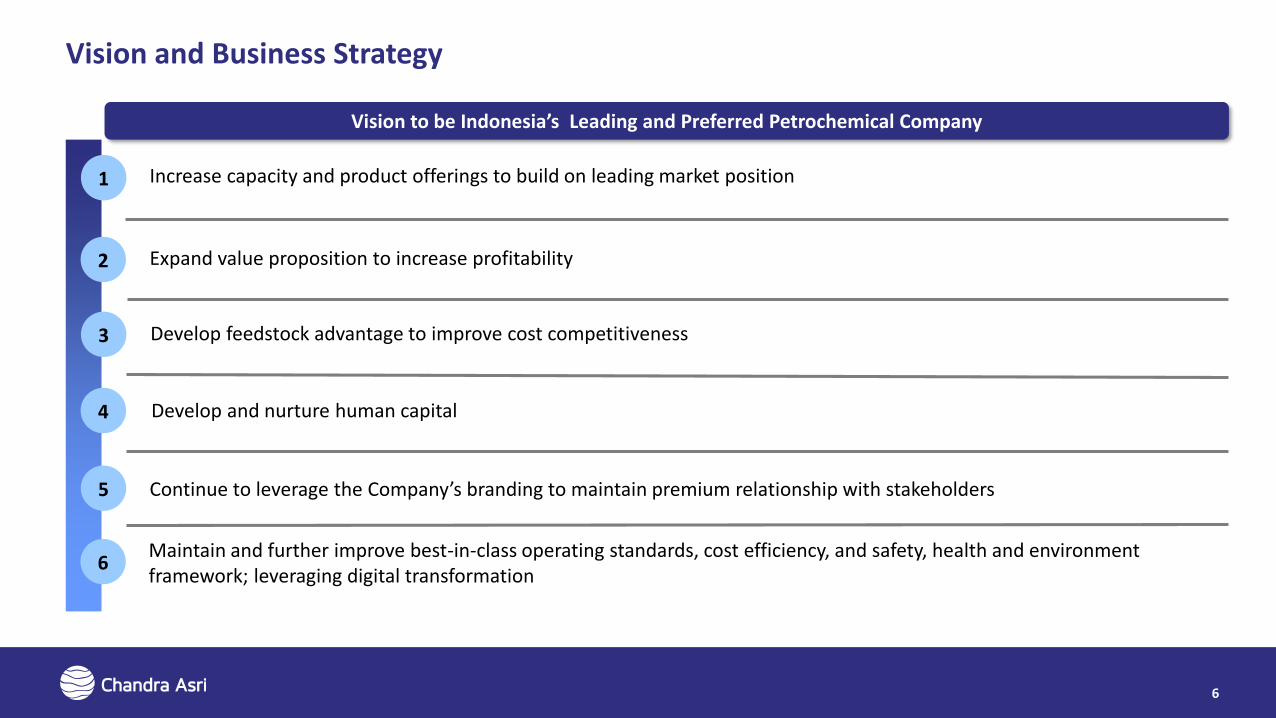
Vision and Business Strategy
6
Continue to leverage the Company’s branding to maintain premium relationship with stakeholders
1
4
2 Expand value proposition to increase profitability
3
Maintain and further improve best-in-class operating standards, cost efficiency, and safety, health and environmentframework; leveraging digital transformation
Increase capacity and product offerings to build on leading market position
Develop feedstock advantage to improve cost competitiveness
Develop and nurture human capital
5
6
Vision to be Indonesia’s Leading and Preferred Petrochemical Company
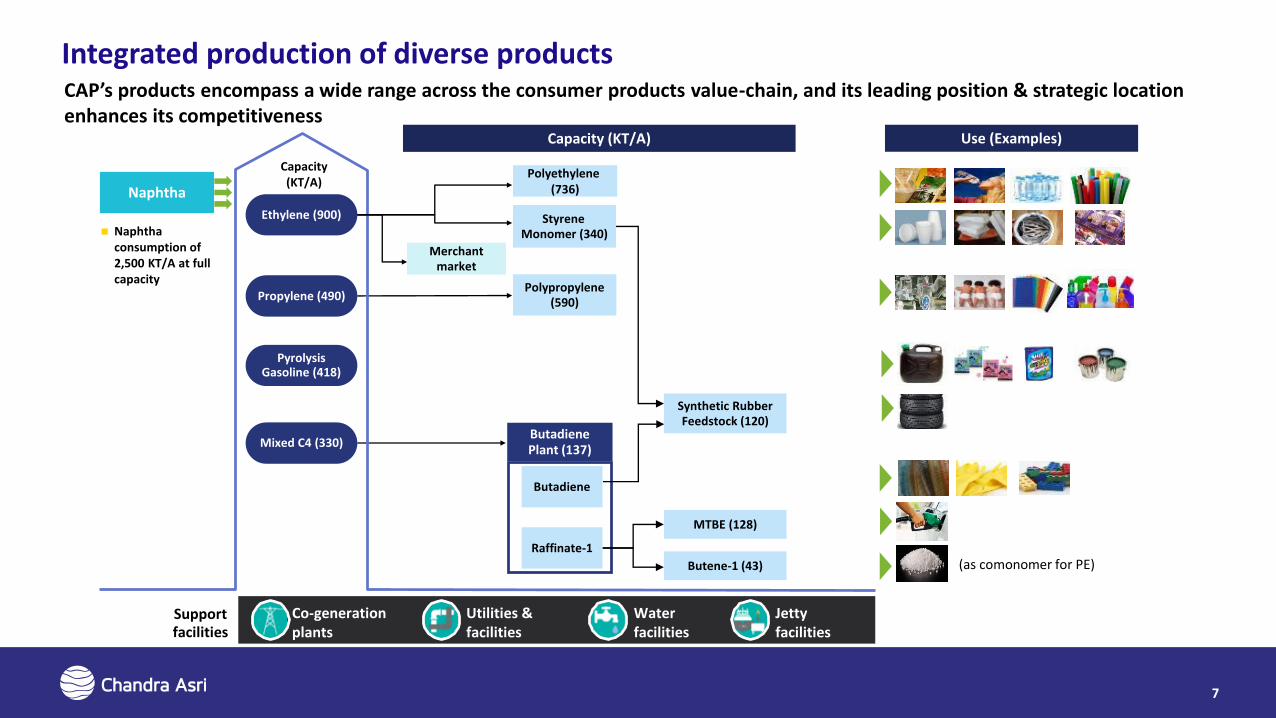
Integrated production of diverse productsCAP’s products encompass a wide range across the consumer products value-chain, and its leading position & strategic location enhances its competitiveness
7
Ethylene (900)
Propylene (490)
PyrolysisGasoline (418)
Mixed C4 (330)
Polypropylene (590)
Capacity (KT/A) Use (Examples)
Naphtha consumption of 2,500 KT/A at full capacity
Polyethylene (736)
Styrene Monomer (340)
Naphtha
Co-generation plants
Utilities & facilities
Jetty facilities
Water facilities
Support facilities
Butadiene
Merchant market
Capacity(KT/A)
Synthetic Rubber Feedstock (120)
MTBE (128)
Butene-1 (43)
Raffinate-1
(as comonomer for PE)
Butadiene Plant (137)
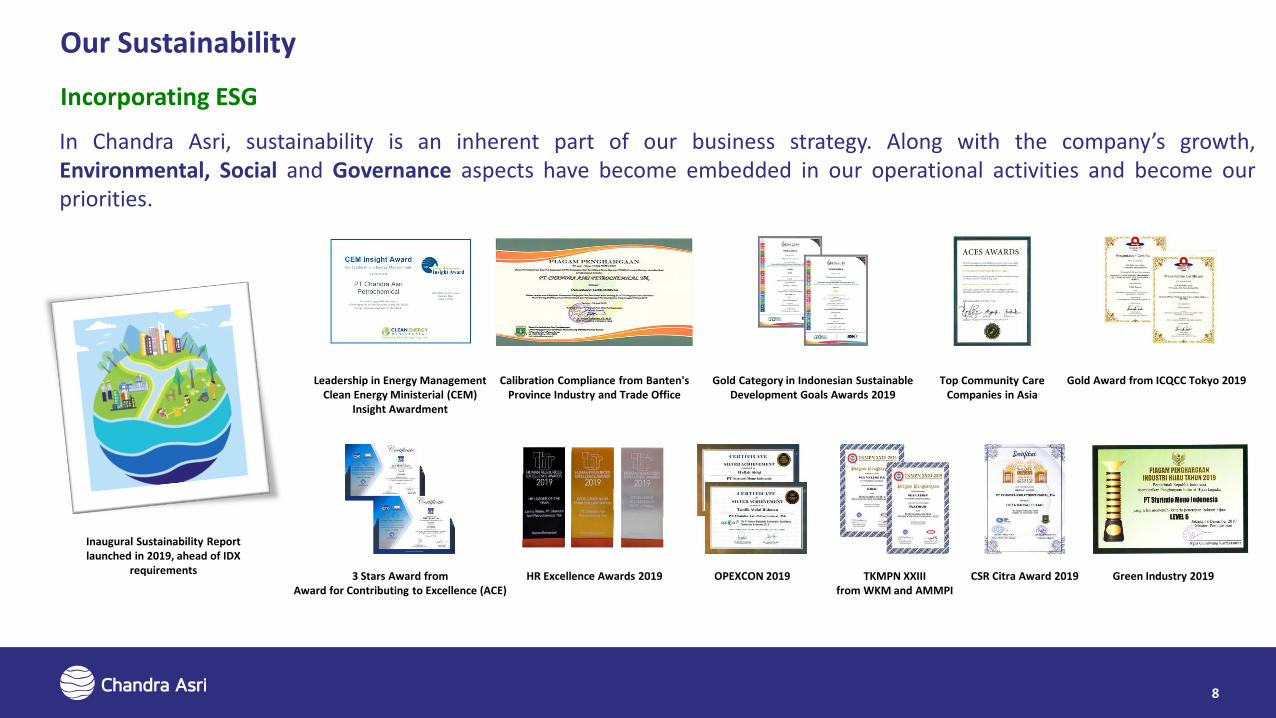
Incorporating ESG
Our Sustainability
In Chandra Asri, sustainability is an inherent part of our business strategy. Along with the company’s growth,Environmental, Social and Governance aspects have become embedded in our operational activities and become ourpriorities.
8
Gold Award from ICQCC Tokyo 2019
Green Industry 2019TKMPN XXIIIfrom WKM and AMMPI
Calibration Compliance from Banten'sProvince Industry and Trade Office
Gold Category in Indonesian Sustainable Development Goals Awards 2019
Top Community Care Companies in Asia
3 Stars Award fromAward for Contributing to Excellence (ACE)
Leadership in Energy ManagementClean Energy Ministerial (CEM)
Insight Awardment
OPEXCON 2019HR Excellence Awards 2019 CSR Citra Award 2019
Inaugural Sustainability Report launched in 2019, ahead of IDX
requirements

Holistic Focus ESG Factors Across 4 Key Pillars
Working with local Government in implementing plastic asphalt project Supporting community-based waste management industry
Distributing aid for the victims of natural disaster Holding several health events for both internal and external parties
Building partnership to support Polymer material technology innovation Exploring opportunities for collaboration in the petrochemical sector
Rebuilding a few inadequate schools Holding training programs for teachers
Health Environment
Socioeconomic Education
9
Investment Highlights

Key Investment Highlights
11
Strong Shareholder support
Well-positioned to benefit from attractive Indonesian growth fundamentals
Indonesia’s leading petrochemical producer with a diverse product portfolio
Diversified customer base and strategically located to supply key customers
Diverse and secured sources of feedstock and raw materials
Highly experienced Management team with proven track record of delivering Growth
2
3
4
5
6
1
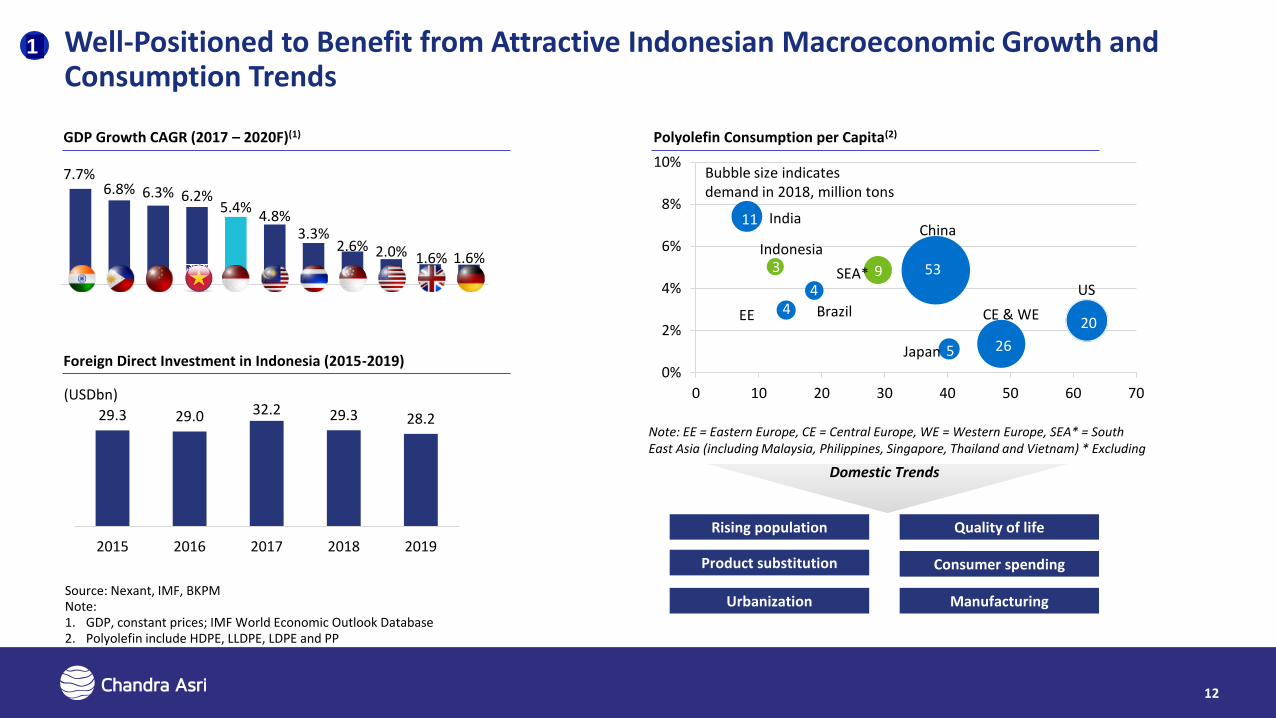
Well-Positioned to Benefit from Attractive Indonesian Macroeconomic Growth and Consumption Trends
US
Indonesia
India
0%
2%
4%
6%
8%
10%
0 10 20 30 40 50 60 70
Bubble size indicates demand in 2018, million tons
11
53
20
26
49
5
SEA*3
Brazil4
Note: EE = Eastern Europe, CE = Central Europe, WE = Western Europe, SEA* = South East Asia (including Malaysia, Philippines, Singapore, Thailand and Vietnam) * Excluding Indonesia
EE
China
Japan
CE & WE
GDP Growth CAGR (2017 – 2020F)(1) Polyolefin Consumption per Capita(2)
Domestic Trends
7.7%6.8% 6.3% 6.2%
5.4%4.8%
3.3%2.6% 2.0% 1.6% 1.6%
Source: Nexant, IMF, BKPMNote:1. GDP, constant prices; IMF World Economic Outlook Database2. Polyolefin include HDPE, LLDPE, LDPE and PP
(USDbn)
Rising population
Product substitution
Urbanization
Quality of life
Consumer spending
Manufacturing
Foreign Direct Investment in Indonesia (2015-2019)
29.3 29.0 32.2 29.3 28.2
2015 2016 2017 2018 2019
12
1

Strong Demand Growth for Petrochemical Products in Indonesia
Polyethylene
Polypropylene
Styrene Monomer
Butadiene
End Markets
Petrochemical products are fundamental to the production of a wide variety of consumer and industrial products, such as packaging, containers, automotive and construction materials
Total Demand Growth (2018 – 2025F CAGR(1))
Plastic films Containers Bottles Plastic bags
Packaging Films and sheets Fibers and filaments Toys Automotive parts
Drinks cups Food containers Car interiors Helmet padding
Vehicle tires Synthetic rubber Gloves and footwear 2.2%
2.0%
4.4%
3.8%
11.3%
6.3%
5.4%
4.8%
BD
SM
PP
PE
Indonesia
RoW
Source: Nexant
13
1

CAP is the Largest Petrochemical Producer in Indonesia
Source: Company, ICIS, Nexant
Capacities of Petrochemical Producers in Indonesia (2020)
CAP offers the most diverse product range and is a dominant producer with market share of approximately 50%, 30%, and 32% of the domestic market (including imports) in olefin, polyethylene and polypropylene respectively
14
2
Capacity ('000 tons per year) s Others Total
Ethylene 900 - - - - - - - 900
Propylene 490 - 625 - - - - - 1,115
LLDPE 400 200 - - - - - - 600
HDPE 336 250 - - - - - - 586
Polypropylene 590 - 45 300 - - - - 935
Ethylene Dichloride - - - - 760 380 - - 1,140
Vinyl Chloride Monomer - - - - 875 130 - - 1,005
Polyvinyl Chloride - - - - 550 110 - 202 862
Ethylene Oxide - - - - - - - 240 240
Mono Ethylene Glycol - - - - - - - 220 220
Acrylic Acid - - - - - - - 140 140
Butanol - - - - - - - 20 20
2-Ethylhexanol - - - - - - - 140 140
Pygas 418 - - - - - - - 418
Crude C4 330 - - - - - - - 330
Butadiene 137 - - - - - - - 137
Benzene - - 100 - - - 2071 - 307
Para-Xylene - - 270 - - - 5001 - 770
Styrene 340 - - - - - - - 340
Synthetic Rubber 120 - - - - - 75 195
Methyl Tert-butyl Ether 128 128
Butene-1 43 43
Total 4,232 450 1,040 300 2,185 620 707 1,037 10,571

CAP is a market leader in Indonesia across all of its products, and a leading player in the region
CAP is the Country’s Market Leader for its Product Portfolio
Largest Petrochemical Company in Indonesia11 Olefin Top 10 South East Asia Producers2
Polyolefin Top 10 South East Asia Producers2
15
Source: Company, NexantNote:1. By production excluding fertilizer producers and including imports2. Chandra Asri capacity is inclusive of SCG’s equity in Chandra Asri
2
Import28%
Pertamina22%
CAP50%
Olefins
Import52%
LCT18%
Total Supply
2.8m tons
Polyethylene
Total Supply
2.5m tons
CAP30%
Polypropylene Styrene Monomer
Import50%
Polytama16%
Pertamina2%
Total Supply
1.8m tons
Total Supply
0.3m tons
CAP32%
CAP100%
01,0002,0003,0004,0005,000
Exxo
nM
ob
il
SCG
PTT
GC
Lott
eC
hem
ical
…
TPC
IRP
C
Ch
and
raA
sri* PC
G
JG S
um
mit
Ch
evro
nP
hill
ips
HD LL LD PP Polyolefins Capacity Addition
Ch
and
ra
Asr
i* IRP
C
(’000 tons per year)
TPC
5
01,0002,0003,0004,0005,000
PTT
GC
SCG
Exxo
nM
ob
il
Shel
l/Q
PI
PC
G
Lott
eC
hem
ical
…
Ch
and
raA
sri* IRP
C
Sum
ito
mo
Per
tam
ina
Ethylene PropyleneEthylene Capacity Addition Propylene Capacity Addition
(’000 tons per year)
7
Strong Brand with Diversified Client Base of Industry Leaders, Developed Over Many Years
16
Sales Breakdown (2017 – 2019)
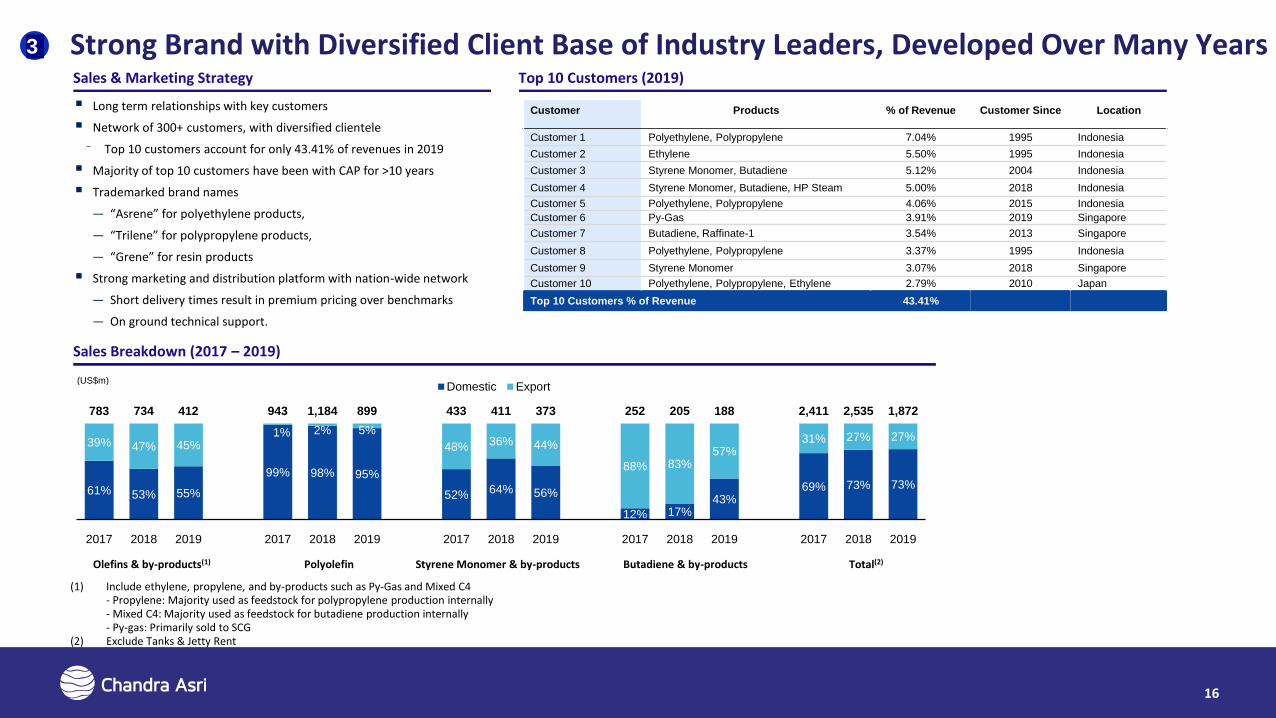
Top 10 Customers (2019)Sales & Marketing Strategy
Customer Products % of Revenue Customer Since Location
Customer 1 Polyethylene, Polypropylene 7.04% 1995 Indonesia
Customer 2 Ethylene 5.50% 1995 Indonesia
Customer 3 Styrene Monomer, Butadiene 5.12% 2004 Indonesia
Customer 4 Styrene Monomer, Butadiene, HP Steam 5.00% 2018 Indonesia
Customer 5 Polyethylene, Polypropylene 4.06% 2015 Indonesia
Customer 6 Py-Gas 3.91% 2019 Singapore
Customer 7 Butadiene, Raffinate-1 3.54% 2013 Singapore
Customer 8 Polyethylene, Polypropylene 3.37% 1995 Indonesia
Customer 9 Styrene Monomer 3.07% 2018 Singapore
Customer 10 Polyethylene, Polypropylene, Ethylene 2.79% 2010 Japan
Top 10 Customers % of Revenue 43.41%
61% 53% 55%
99% 98% 95%
52% 64% 56%
12% 17% 43%
69% 73% 73%
39% 47% 45% 1% 2% 5%
48% 36% 44%
88% 83% 57%
31% 27% 27%
783 734 412 943 1,184 899 433 411 373 252 205 188 2,411 2,535 1,872
2017 2018 2019 2017 2018 2019 2017 2018 2019 2017 2018 2019 2017 2018 2019
Domestic Export(US$m)
Olefins & by-products(1) Polyolefin Styrene Monomer & by-products Butadiene & by-products
(1) Include ethylene, propylene, and by-products such as Py-Gas and Mixed C4- Propylene: Majority used as feedstock for polypropylene production internally- Mixed C4: Majority used as feedstock for butadiene production internally- Py-gas: Primarily sold to SCG
(2) Exclude Tanks & Jetty Rent
Total(2)
Long term relationships with key customers
Network of 300+ customers, with diversified clientele
⁻ Top 10 customers account for only 43.41% of revenues in 2019
Majority of top 10 customers have been with CAP for >10 years
Trademarked brand names
― “Asrene” for polyethylene products,
― “Trilene” for polypropylene products,
― “Grene” for resin products
Strong marketing and distribution platform with nation-wide network
― Short delivery times result in premium pricing over benchmarks
― On ground technical support.
3

Strategically Located Key Customers, with Location Proximity & a Proprietary PipelineCAP’s Integrated Petrochemical Complexes
Location proximity and well established pipeline ensures excellent connectivity to key customers. This coupled with reliability of supply lead to premium pricing, with integration of facilities creating significant barriers to entry.
Cilegon
Merak
Jetty CAP PipelineToll Road Road
Puloampel-Serang
Styrene Monomer Plant
Capacity 340 KT/A
Dongjin
Lautan OtsukaAsahimas
SankyuIndorama Petrochemical
Amoco Mitsui
TITAN PE
Mitsubishi Kasei
PIPI PS and SBL
Unggul Indah AB
Prointail
Statomer PVC
Buana Sulfindo
Santa Fe
Rhone Poulenc SBL
Banten Java Persada
Multisidia Arbe Styrindo RBSBakrie Construction
Conch Cement Indonesia
Indochlor
Sintetikajaya
Sulfindo Adi. PVC
Polychem LindoRedeco Petrolin Utama
Cabot
Siemens
Hoechst
KS
Dow Chemical
Air Liquide
UAP
Customers with pipeline access
NSI
Sulfindo Adi Usaha. EDC, VCM
Indonesia
Cilegon
Integrated Complex
N
Integrated Complex
Main Plant Capacity (KT/A)
− Ethylene: 900
− Propylene: 490
− Py-Gas: 418
− Mixed C4: 330
− Polyethylene: 736
− Polypropylene: 590
Butadiene Plant: 137 KT/A
MTBE and B1 Plant: 128 KT/A and 43 KT/A
On-Site Power
SBR Plant: 120 KT/A
Jakarta
Anyer
Nufarm Indonesia
Indo sukses Sentra Usaha
Inti Everspring Indonesia
Merak Energi
Gumindo Perkasa Industri
BASF Indonesia
Lobunta Kencana
Sulfindo Adiusaha NAOH, Cl2
Sauh Bahtera samudera
Gajah Tunggal Tbk -SBR
Polychem Indonesia Tbk.GT Petrochem Industries Tbk
Gunanusa Fabrikasi
Duta Sugar Wilmar Group
17
3
Stable & Flexible Feedstock Supply from Long-Term International Suppliers
18
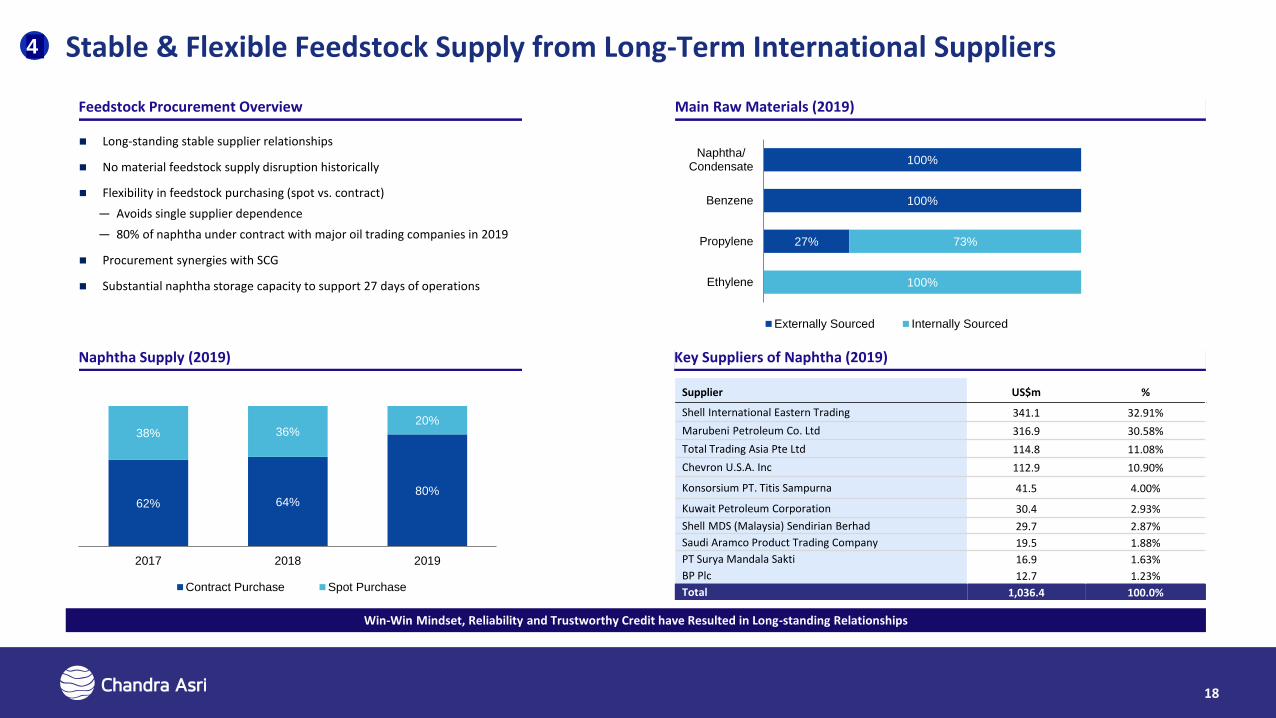
Long-standing stable supplier relationships
No material feedstock supply disruption historically
Flexibility in feedstock purchasing (spot vs. contract)
― Avoids single supplier dependence
― 80% of naphtha under contract with major oil trading companies in 2019
Procurement synergies with SCG
Substantial naphtha storage capacity to support 27 days of operations
Feedstock Procurement Overview Main Raw Materials (2019)
Key Suppliers of Naphtha (2019)
27%
100%
100%
100%
73%
Ethylene
Propylene
Benzene
Naphtha/Condensate
Externally Sourced Internally Sourced
Naphtha Supply (2019)
62% 64%80%
38% 36%20%
2017 2018 2019
Contract Purchase Spot Purchase
Supplier US$m %
Shell International Eastern Trading 341.1 32.91%
Marubeni Petroleum Co. Ltd 316.9 30.58%
Total Trading Asia Pte Ltd 114.8 11.08%
Chevron U.S.A. Inc 112.9 10.90%
Konsorsium PT. Titis Sampurna 41.5 4.00%
Kuwait Petroleum Corporation 30.4 2.93%
Shell MDS (Malaysia) Sendirian Berhad 29.7 2.87%
Saudi Aramco Product Trading Company 19.5 1.88%
PT Surya Mandala Sakti 16.9 1.63%
BP Plc 12.7 1.23%
Total 1,036.4 100.0%
Win-Win Mindset, Reliability and Trustworthy Credit have Resulted in Long-standing Relationships
4
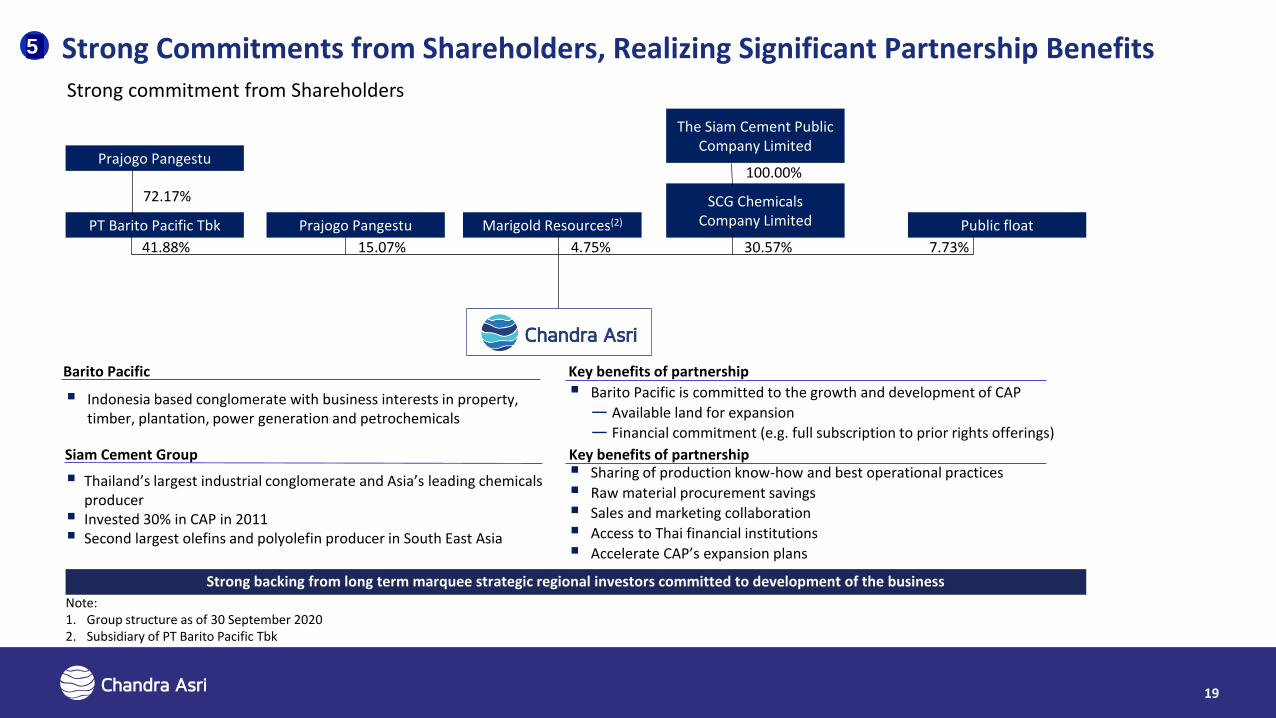
Strong Commitments from Shareholders, Realizing Significant Partnership BenefitsStrong commitment from Shareholders
Prajogo Pangestu
Marigold Resources(2) Public float
41.88% 4.75% 30.57% 7.73%
The Siam Cement Public Company Limited
SCG Chemicals Company LimitedPrajogo Pangestu
72.17%
100.00%
15.07%
PT Barito Pacific Tbk
Barito Pacific
Indonesia based conglomerate with business interests in property, timber, plantation, power generation and petrochemicals
Siam Cement Group
Thailand’s largest industrial conglomerate and Asia’s leading chemicals producer
Invested 30% in CAP in 2011 Second largest olefins and polyolefin producer in South East Asia
Key benefits of partnership
Barito Pacific is committed to the growth and development of CAP
― Available land for expansion
― Financial commitment (e.g. full subscription to prior rights offerings)
Key benefits of partnership Sharing of production know-how and best operational practices
Raw material procurement savings
Sales and marketing collaboration
Access to Thai financial institutions
Accelerate CAP’s expansion plans
Note: 1. Group structure as of 30 September 20202. Subsidiary of PT Barito Pacific Tbk
Strong backing from long term marquee strategic regional investors committed to development of the business
19
5

Barito Pacific Group – A Leading Indonesian Conglomerate with Diversified Assets
20
Management Team
Name Position
Agus Salim Pangestu President Director
Rudy Suparman VP Director
Andry Setiawan Director
David Kosasih Independent Director
Business Description Business Segments1
Financial Performance3 (USDm)
Barito was originally established in 1979 under the name of PT Bumi Raya Pura MasKalimantan, with its beginnings centered around the forestry and timber businesses
Barito is listed on the Indonesia Stock Exchange with a market capitalization of c. USD9.7bn,and has now transformed into an integrated energy company with multiple power andindustrial assets
Owns a controlling share in PT Chandra Asri Petrochemical Tbk, Indonesia’s largest and onlyintegrated petrochemical company
Barito Pacific also owns a controlling share in Star Energy, the largest geothermal companyin Indonesia and the third largest geothermal company in the world
Barito’s largest shareholder is Prajogo Pangestu, an Indonesian business magnate andinvestor with c.71.48% stake in the company
2019A 2018A 2017A
Sales 2,402 3,076 2,852
Growth (%) -21.9% 14.7% 46.3%
EBITDA 595 813 899
Margin (%) 24.8% 26.4% 31.5%
EBIT 451 675 765
Margin (%) 18.8% 21.9% 26.8%
Net Income 137 242 375
Margin (%) 5.7% 7.9% 13.1%
Sources: Company presentations, Bloomberg and Factset as of 31 December 2019Notes:1. Based on FY2019 sales; Petrochemical segment sales exclude tank & jetty rents2. EBITDA from Barito & Others was insignificant in FY20193. Growth rates calculated in local currency (IDR)
PT Barito Pacific Tbk (“Barito”) is aresource-based company listed onthe Indonesia Stock Exchange with adiversified portfolio of businessesincluding petrochemicals, property,plantation and renewable energy.
Market Capitalization & Credit Profile
As of Dec 31, 2019 IDRb USDm
Price (IDR / USD) 1,510 0.11
x Shares Outstanding (m) 89,016 89,016
Market Cap. 134,414 9,669
Total Debt 35,248 2,536
Total Cash 10,345 744
Debt / EBITDA 4.3x 4.3x
Net Debt / EBITDA 3.0x 3.0x
Organizational Structure
PT Barito Pacific Tbk(“Barito Pacific”)
Star Energy Group
Holding
Chandra AsriPetrochemical
PT Indo Raya
Tenaga
PT GriyaIdola
Petrochemicals EnergyProperty and
Others
46.63% 66.7% 49.0% 100%
30.0%
68.0%
Breakdown by FY2019 Sales Breakdown by FY2019 EBITDA
78.0%
22.0%
0.0%
CAP Star Energy Barito & Others2
5
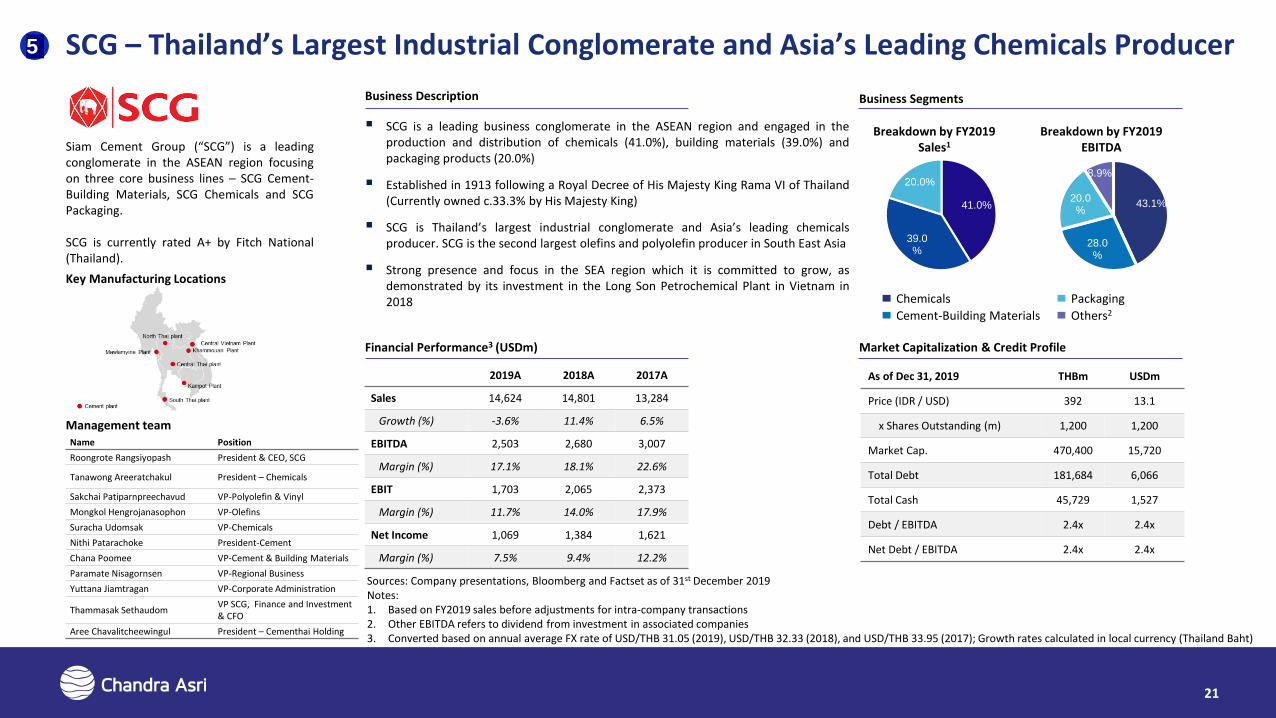
Siam Cement Group (“SCG”) is a leadingconglomerate in the ASEAN region focusingon three core business lines – SCG Cement-Building Materials, SCG Chemicals and SCGPackaging.
SCG is currently rated A+ by Fitch National(Thailand).
SCG – Thailand’s Largest Industrial Conglomerate and Asia’s Leading Chemicals Producer
21
41.0%
39.0%
20.0%
Management team
Key Manufacturing Locations
Name Position
Roongrote Rangsiyopash President & CEO, SCG
Tanawong Areeratchakul President – Chemicals
Sakchai Patiparnpreechavud VP-Polyolefin & Vinyl
Mongkol Hengrojanasophon VP-Olefins
Suracha Udomsak VP-Chemicals
Nithi Patarachoke President-Cement
Chana Poomee VP-Cement & Building Materials
Paramate Nisagornsen VP-Regional Business
Yuttana Jiamtragan VP-Corporate Administration
Thammasak SethaudomVP SCG, Finance and Investment & CFO
Aree Chavalitcheewingul President – Cementhai Holding
Sources: Company presentations, Bloomberg and Factset as of 31st December 2019Notes:1. Based on FY2019 sales before adjustments for intra-company transactions2. Other EBITDA refers to dividend from investment in associated companies3. Converted based on annual average FX rate of USD/THB 31.05 (2019), USD/THB 32.33 (2018), and USD/THB 33.95 (2017); Growth rates calculated in local currency (Thailand Baht)
Business Description Business Segments
Market Capitalization & Credit ProfileFinancial Performance3 (USDm)
As of Dec 31, 2019 THBm USDm
Price (IDR / USD) 392 13.1
x Shares Outstanding (m) 1,200 1,200
Market Cap. 470,400 15,720
Total Debt 181,684 6,066
Total Cash 45,729 1,527
Debt / EBITDA 2.4x 2.4x
Net Debt / EBITDA 2.4x 2.4x
2019A 2018A 2017A
Sales 14,624 14,801 13,284
Growth (%) -3.6% 11.4% 6.5%
EBITDA 2,503 2,680 3,007
Margin (%) 17.1% 18.1% 22.6%
EBIT 1,703 2,065 2,373
Margin (%) 11.7% 14.0% 17.9%
Net Income 1,069 1,384 1,621
Margin (%) 7.5% 9.4% 12.2%
SCG is a leading business conglomerate in the ASEAN region and engaged in theproduction and distribution of chemicals (41.0%), building materials (39.0%) andpackaging products (20.0%)
Established in 1913 following a Royal Decree of His Majesty King Rama VI of Thailand(Currently owned c.33.3% by His Majesty King)
SCG is Thailand’s largest industrial conglomerate and Asia’s leading chemicalsproducer. SCG is the second largest olefins and polyolefin producer in South East Asia
Strong presence and focus in the SEA region which it is committed to grow, asdemonstrated by its investment in the Long Son Petrochemical Plant in Vietnam in2018
Breakdown by FY2019 Sales1
Breakdown by FY2019 EBITDA
43.1%
28.0%
20.0%
8.9%
Chemicals
Cement-Building Materials
Packaging
Others2
5
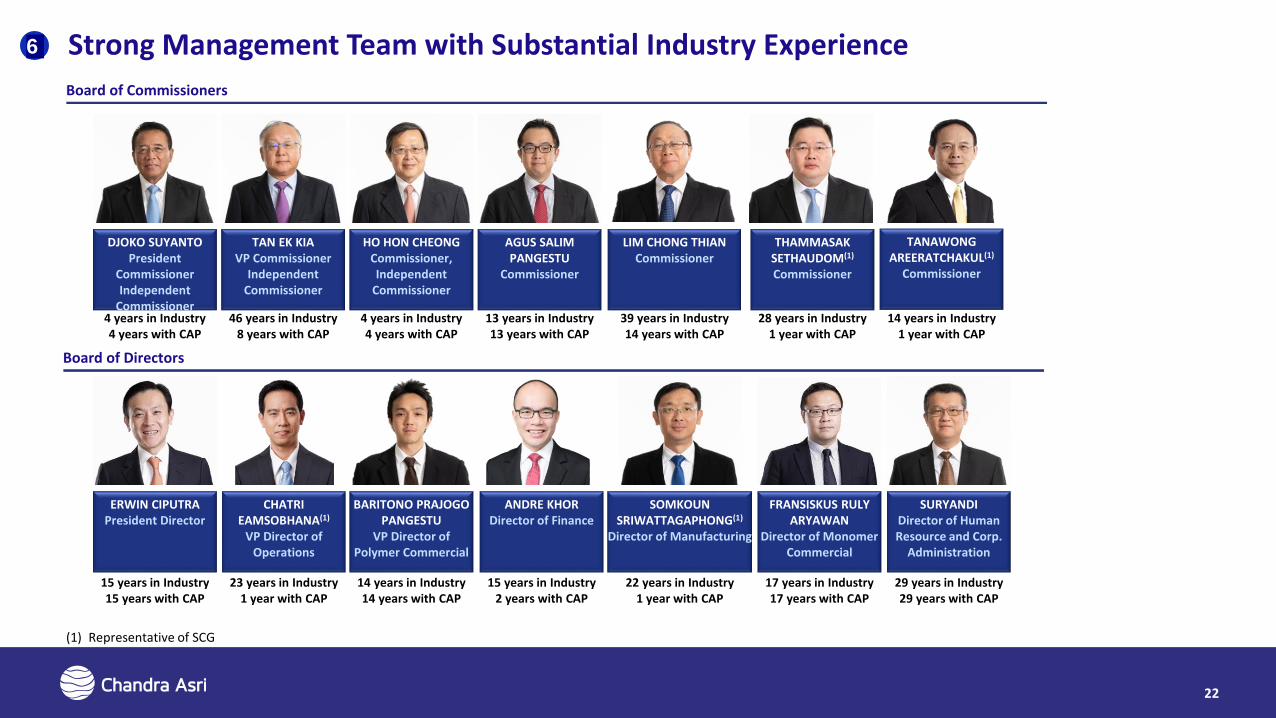
Strong Management Team with Substantial Industry Experience
(1) Representative of SCG
Board of Directors
Board of Commissioners
DJOKO SUYANTOPresident
CommissionerIndependent
Commissioner4 years in Industry4 years with CAP
TAN EK KIAVP Commissioner
IndependentCommissioner
46 years in Industry8 years with CAP
HO HON CHEONGCommissioner, Independent
Commissioner
4 years in Industry4 years with CAP
LIM CHONG THIANCommissioner
39 years in Industry14 years with CAP
AGUS SALIM PANGESTU
Commissioner
13 years in Industry13 years with CAP
THAMMASAK SETHAUDOM(1)
Commissioner
28 years in Industry1 year with CAP
TANAWONGAREERATCHAKUL(1)
Commissioner
14 years in Industry1 year with CAP
ERWIN CIPUTRAPresident Director
15 years in Industry15 years with CAP
CHATRI EAMSOBHANA(1)
VP Director of Operations
23 years in Industry1 year with CAP
BARITONO PRAJOGO PANGESTU
VP Director of Polymer Commercial
14 years in Industry14 years with CAP
ANDRE KHORDirector of Finance
15 years in Industry2 years with CAP
SOMKOUN SRIWATTAGAPHONG(1)
Director of Manufacturing
22 years in Industry1 year with CAP
FRANSISKUS RULY ARYAWAN
Director of Monomer Commercial
17 years in Industry17 years with CAP
SURYANDIDirector of Human Resource and Corp.
Administration
29 years in Industry29 years with CAP
22
6
23
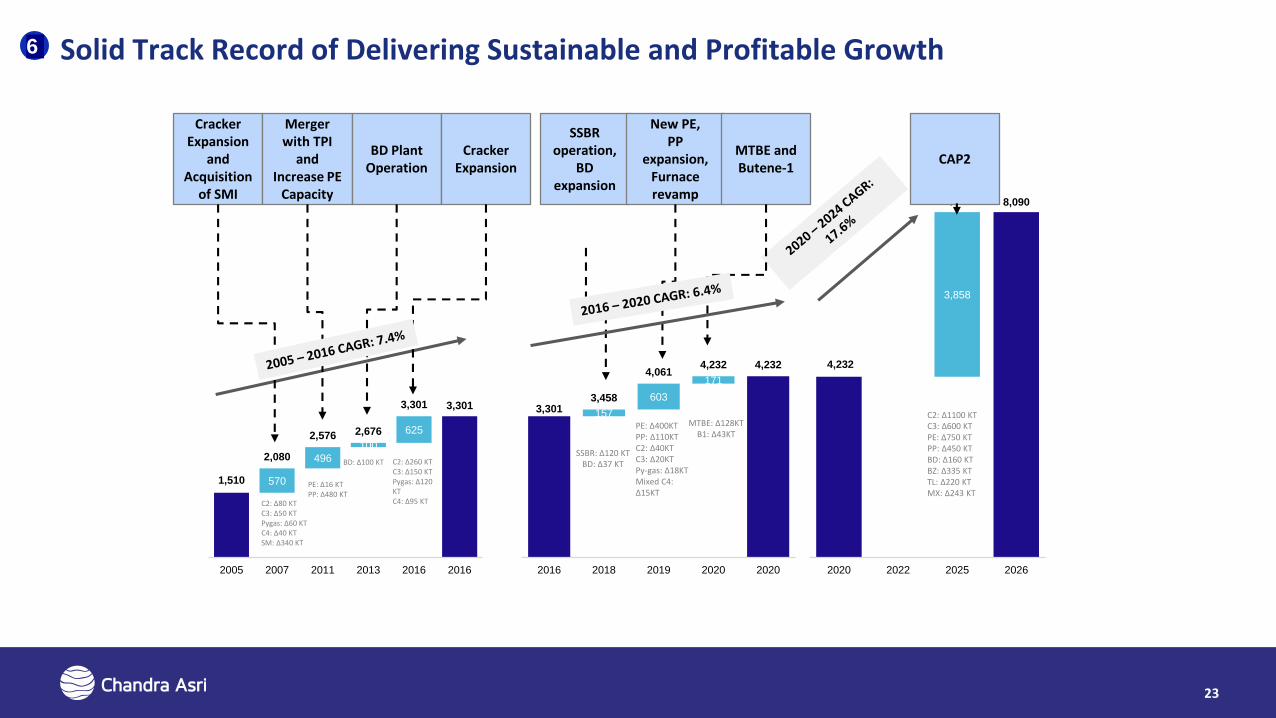
4,232
3,858
8,0908,090
2020 2022 2025 2026
3,301 157
603
171
3,458
4,0614,232 4,232
2016 2018 2019 2020 2020
1,510
3,301
570
496
100
625
2,080
2,576 2,676
3,301
2005 2007 2011 2013 2016 2016
Cracker Expansion
and Acquisition
of SMI
Merger with TPI
and Increase PE
Capacity
BD Plant Operation
Cracker Expansion
SSBR operation,
BD expansion
New PE,PP
expansion, Furnace revamp
MTBE and Butene-1
CAP2
C2: Δ80 KTC3: Δ50 KTPygas: Δ60 KTC4: Δ40 KTSM: Δ340 KT
PE: Δ16 KTPP: Δ480 KT
BD: Δ100 KT C2: Δ260 KTC3: Δ150 KTPygas: Δ120 KTC4: Δ95 KT
SSBR: Δ120 KTBD: Δ37 KT
MTBE: ∆128KTB1: ∆43KT
C2: Δ1100 KTC3: Δ600 KTPE: Δ750 KTPP: Δ450 KTBD: Δ160 KTBZ: Δ335 KTTL: Δ220 KTMX: Δ243 KT
PE: ∆400KTPP: ∆110KTC2: ∆40KTC3: ∆20KTPy-gas: ∆18KTMixed C4: ∆15KT
6 Solid Track Record of Delivering Sustainable and Profitable Growth

24
President Jokowi: “The development of Chandra Asri’s new plant is a concrete step that is needed by our country”
– The Jakarta Post, 9 Dec 2019
Government Supports Exponential Growth

First MTBE and B1 Plants Geared to Meet Domestic Demand
Ministry of Industry: “We need to support the domestic petrochemical industry in Indonesia as it
holds an important role to substitute import. In addition, petrochemical companies such as Chandra
Asri also attracts new investors which will bring positive impact to the Indonesian economy”
– IDN Financials, 7 Sep 2020
MTBE (Methyl Tert-butyl Ether) plant capacity is 128KTA, tapping into octane booster market that is still reliant to import.
B1 (Butene 1) plant capacity is 43KTA, where 33KTA will be absorbed by Chandra Asri’s own operation while the rest is targeted for domestic market.
Capacity
Both plants are using Lummus Technology, one of the most advanced petrochemical processing technology in the world.
Technology
Capturing added value along integrated production chain especially Raffinate-1 which produced from our Butadiene plant process.
Values
MTBE & B1 Plants
25
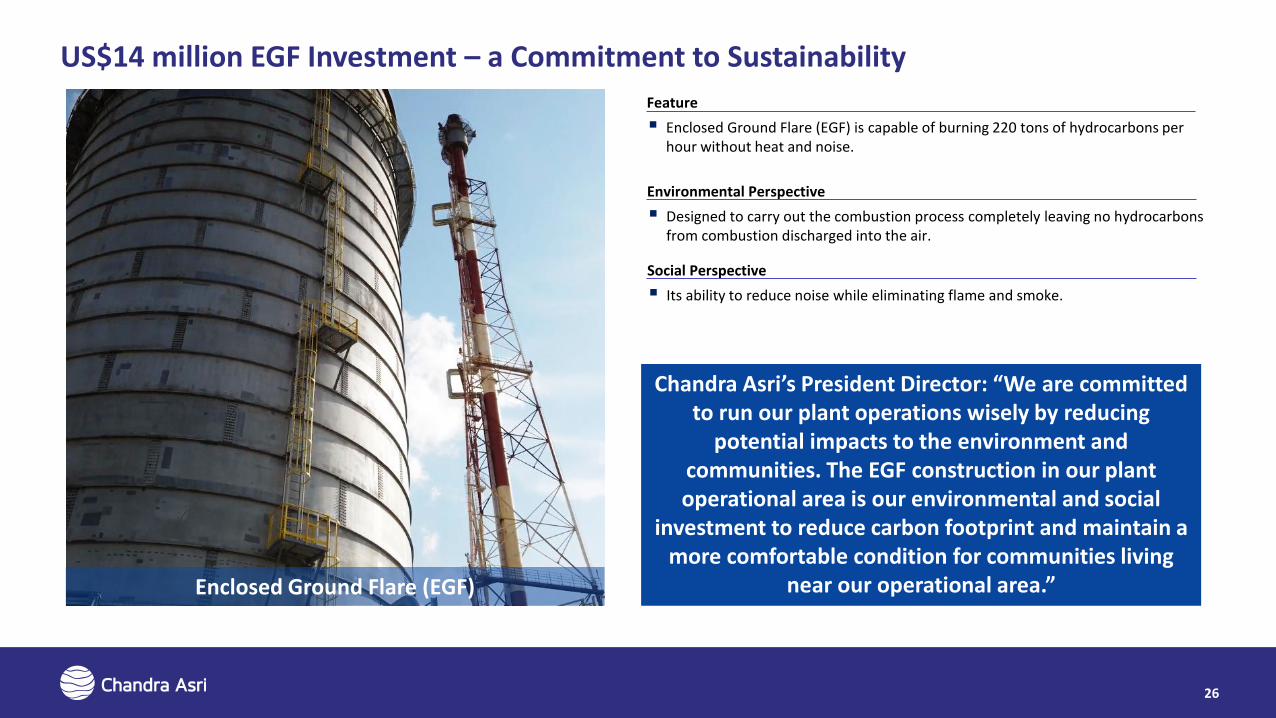
US$14 million EGF Investment – a Commitment to Sustainability
Enclosed Ground Flare (EGF) is capable of burning 220 tons of hydrocarbons per hour without heat and noise.
Feature
Designed to carry out the combustion process completely leaving no hydrocarbons from combustion discharged into the air.
Environmental Perspective
Its ability to reduce noise while eliminating flame and smoke.
Social Perspective
Chandra Asri’s President Director: “We are committed to run our plant operations wisely by reducing
potential impacts to the environment and communities. The EGF construction in our plant operational area is our environmental and social
investment to reduce carbon footprint and maintain a more comfortable condition for communities living
near our operational area.”Enclosed Ground Flare (EGF)
26

Chandra Asri & Pertamina Develop Petrochemical Business in Indonesia
Chandra Asri & PT Kilang Pertamina Internasional, a subsidiary of PT Pertamina (Persero), signed a Head of Agreement (HoA) as a form of cooperation in developing the petrochemical business in Indonesia. It is hoped
that this cooperation can reduce petrochemical imports and develop the domestic petrochemical business.
27
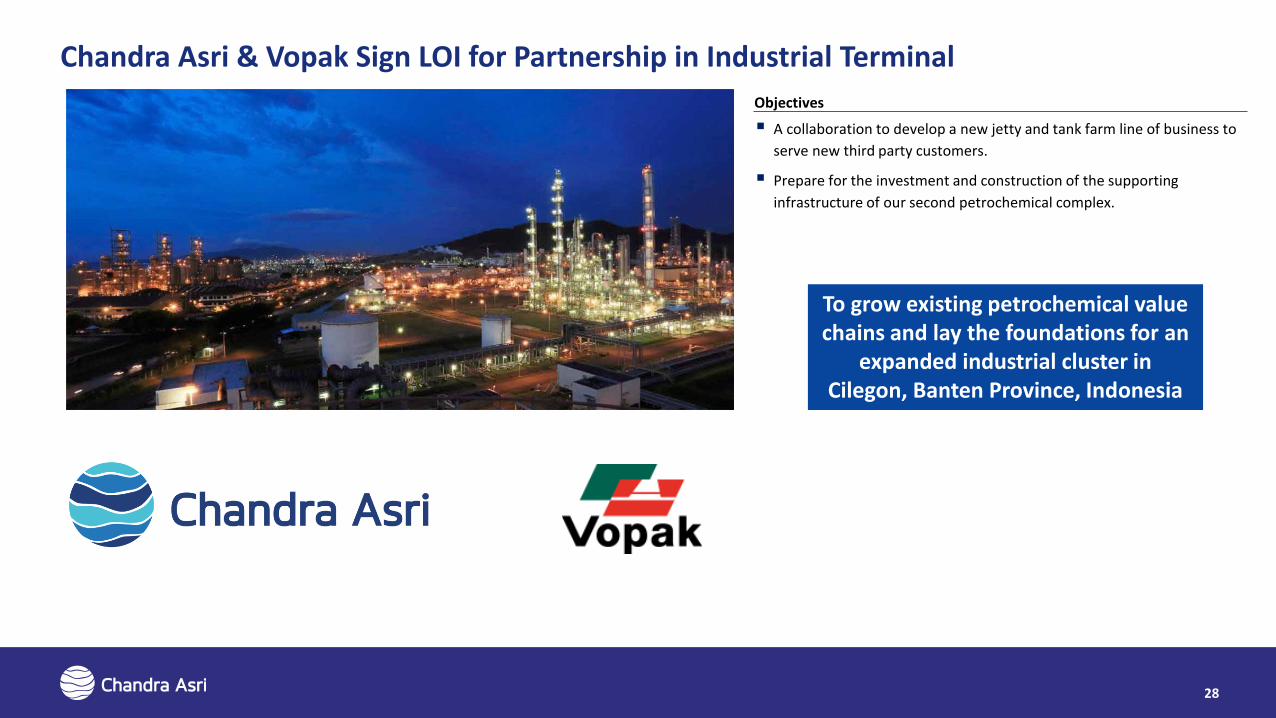
Chandra Asri & Vopak Sign LOI for Partnership in Industrial Terminal
A collaboration to develop a new jetty and tank farm line of business to
serve new third party customers.
Prepare for the investment and construction of the supporting
infrastructure of our second petrochemical complex.
Objectives
28
To grow existing petrochemical value chains and lay the foundations for an
expanded industrial cluster in Cilegon, Banten Province, Indonesia
Financial Overview
Prudent Financial Policies
30
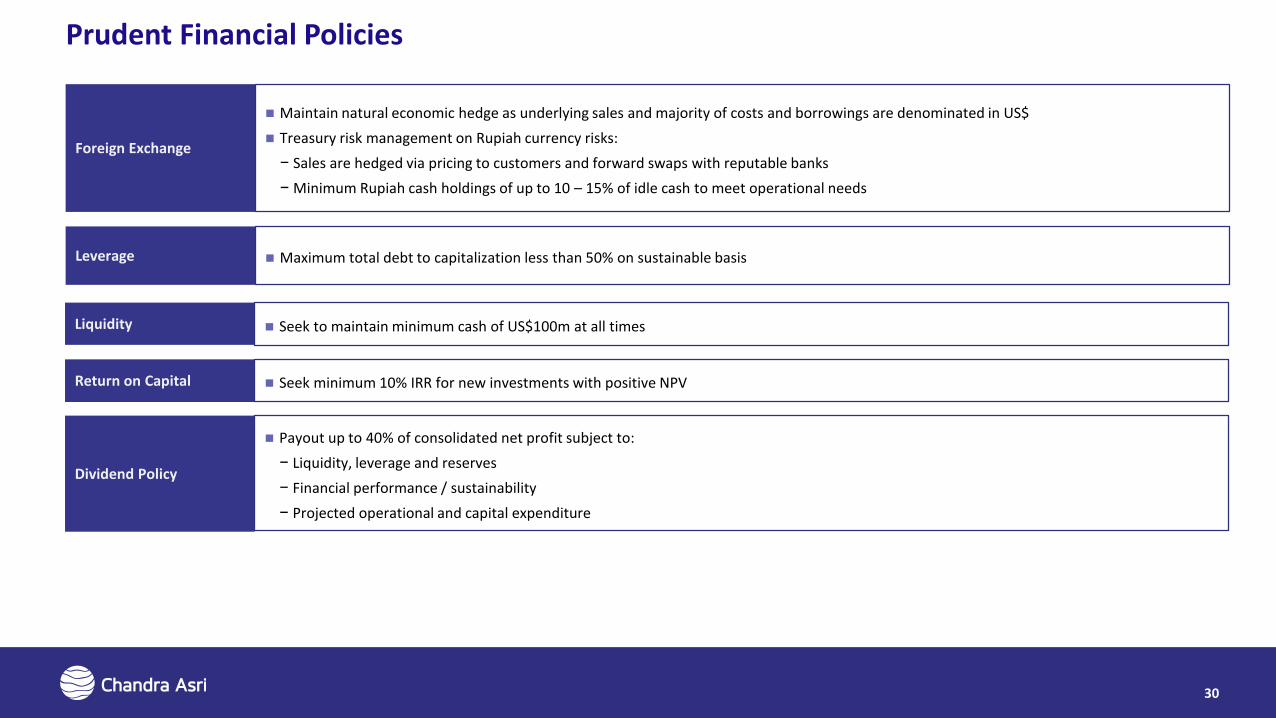
Foreign Exchange
Maintain natural economic hedge as underlying sales and majority of costs and borrowings are denominated in US$
Treasury risk management on Rupiah currency risks:
− Sales are hedged via pricing to customers and forward swaps with reputable banks
− Minimum Rupiah cash holdings of up to 10 – 15% of idle cash to meet operational needs
Leverage Maximum total debt to capitalization less than 50% on sustainable basis
Dividend Policy
Payout up to 40% of consolidated net profit subject to:
− Liquidity, leverage and reserves
− Financial performance / sustainability
− Projected operational and capital expenditure
Liquidity
Return on Capital
Seek to maintain minimum cash of US$100m at all times
Seek minimum 10% IRR for new investments with positive NPV
Diversified Product Mix generates a Broad Revenue Base
31
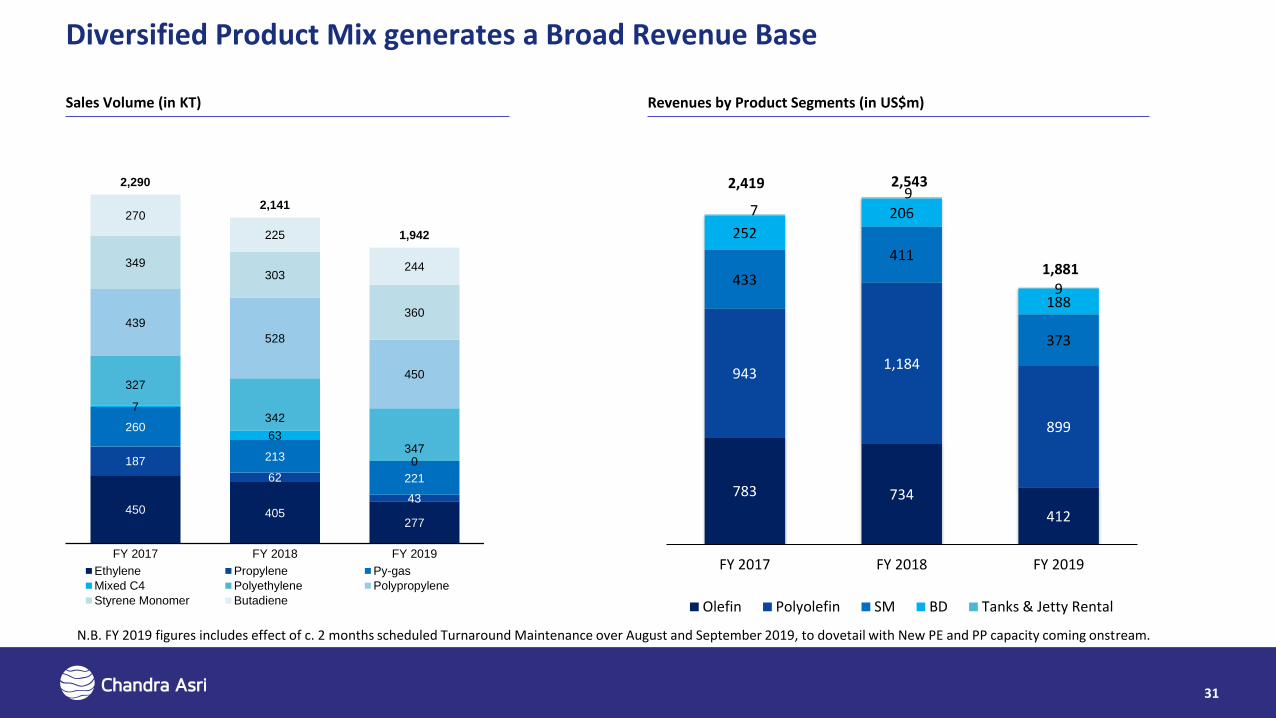
450 405 277
187
62
43
260
213
221
7
63
0
327
342
347
439
528
450
349 303
360
270
225
244
2,290
2,141
1,942
FY 2017 FY 2018 FY 2019
Ethylene Propylene Py-gas
Mixed C4 Polyethylene Polypropylene
Styrene Monomer Butadiene
Sales Volume (in KT)
783 734
412
9431,184
899
433
411
373
252
206
188
79
9
2,419 2,543
1,881
FY 2017 FY 2018 FY 2019
Olefin Polyolefin SM BD Tanks & Jetty Rental
Revenues by Product Segments (in US$m)
N.B. FY 2019 figures includes effect of c. 2 months scheduled Turnaround Maintenance over August and September 2019, to dovetail with New PE and PP capacity coming onstream.
Robust Operating and Financial Performance
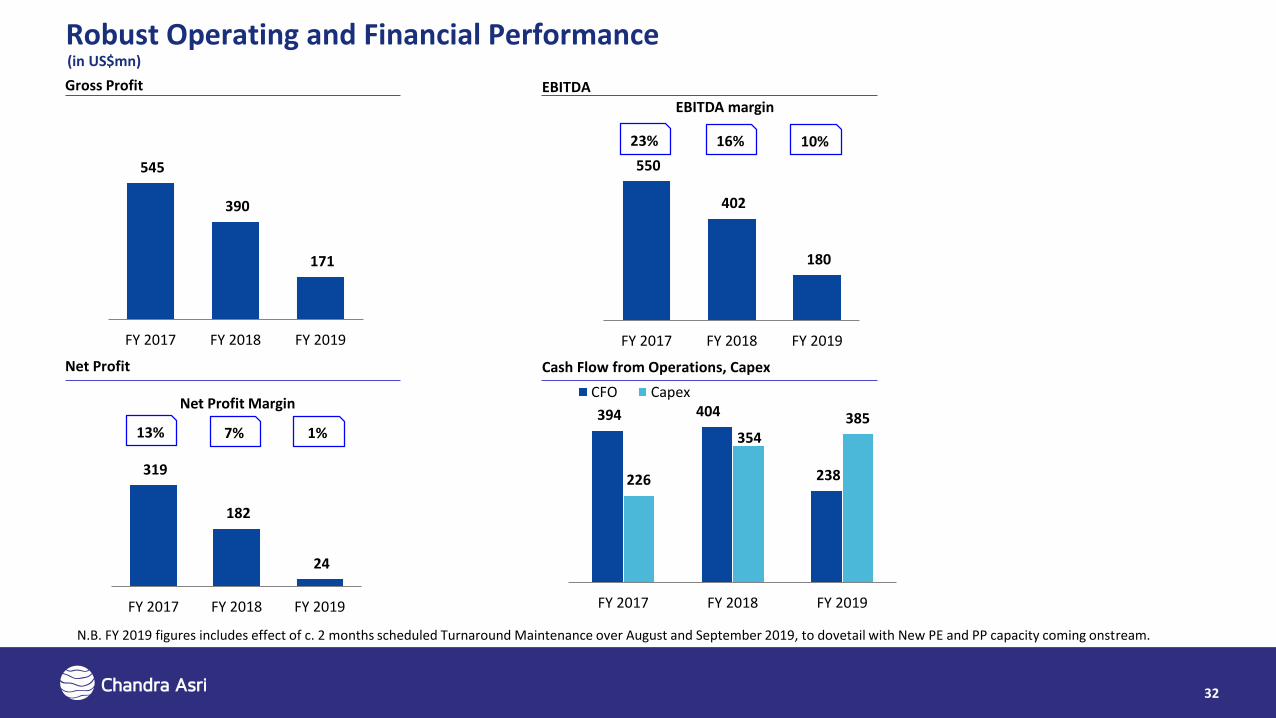
550
402
180
FY 2017 FY 2018 FY 2019
319
182
24
FY 2017 FY 2018 FY 2019
545
390
171
FY 2017 FY 2018 FY 2019
394 404
238 226
354385
FY 2017 FY 2018 FY 2019
CFO Capex
EBITDA margin
Net Profit Margin
Gross Profit EBITDA
16% 10%
Net Profit
7% 1%
Cash Flow from Operations, Capex
32
23%
13%
N.B. FY 2019 figures includes effect of c. 2 months scheduled Turnaround Maintenance over August and September 2019, to dovetail with New PE and PP capacity coming onstream.
(in US$mn)
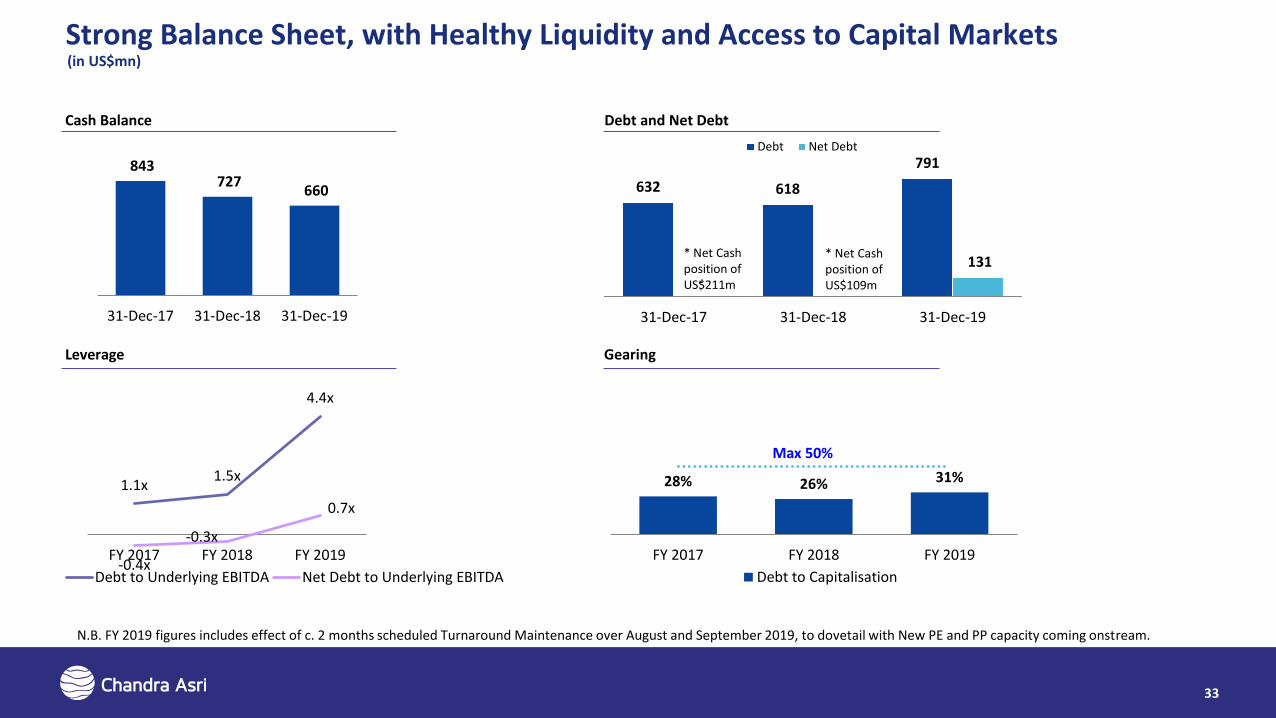
1.1x1.5x
4.4x
-0.4x
-0.3x
0.7x
FY 2017 FY 2018 FY 2019
Debt to Underlying EBITDA Net Debt to Underlying EBITDA
28% 26% 31%
FY 2017 FY 2018 FY 2019
Debt to Capitalisation
Strong Balance Sheet, with Healthy Liquidity and Access to Capital Markets
632 618
791
-131
31-Dec-17 31-Dec-18 31-Dec-19
Debt Net Debt
Max 50%
* Net Cash position of US$109m
843 727
660
31-Dec-17 31-Dec-18 31-Dec-19
Cash Balance Debt and Net Debt
Leverage Gearing
33
* Net Cash position of US$211m
N.B. FY 2019 figures includes effect of c. 2 months scheduled Turnaround Maintenance over August and September 2019, to dovetail with New PE and PP capacity coming onstream.
(in US$mn)
For more information please contact:
Visit our website at www.chandra-asri.com
Head Office Address:PT Chandra Asri Petrochemical TbkWisma Barito Pacific Tower A, 7th FloorJl. Let. Jend. S. Parman Kav. 62-63Jakarta 11410
Contact:Investor RelationsEmail: [email protected]: +62 21 530 7950Fax: +62 21 530 8930
Related Documents


