May 11, 2015 Summary of Consolidated Financial Results for the Fiscal Year Ended March 31, 2015 (FY2014) [Japanese GAAP] Company name: ZUKEN Inc. Listing: Tokyo Stock Exchange, First Section Stock code: 6947 URL: http://www.zuken.co.jp Representative: Makoto Kaneko, President and Representative Director Contact: Susumu Yoshida, General Manager of Finance Department Tel: +81-45-942-1511 Scheduled date of Annual General Shareholders’ Meeting: June 26, 2015 Scheduled date of payment of dividend: June 29, 2015 Scheduled date of filing of Annual Securities Report: June 26, 2015 Preparation of supplementary materials for financial results: None Holding of financial results meeting: None (All amounts are rounded down to the nearest million yen) 1. Consolidated Financial Results for the Fiscal Year Ended March 31, 2015 (Apr. 1, 2014–Mar. 31, 2015) (1) Consolidated results of operations (Percentages for net sales and incomes represent year-on-year changes) Net sales Operating income Ordinary income Net income Fiscal years ended Millions of yen % Millions of yen % Millions of yen % Millions of yen % Mar. 31, 2015 21,297 7.7 1,009 60.2 1,166 37.5 509 9.2 Mar. 31, 2014 19,772 10.5 630 77.7 848 73.1 466 53.5 Note: Comprehensive income (Millions of yen) Fiscal year ended Mar. 31, 2015: 834 (up 13.1%) Fiscal year ended Mar. 31, 2014: 738 (up 67.0%) Net income per share Diluted net income per share Return on equity Ordinary income on total assets Operating income to net sales Fiscal years ended Yen Yen % % % Mar. 31, 2015 21.92 - 1.8 2.9 4.7 Mar. 31, 2014 20.08 - 1.7 2.2 3.2 Reference: Equity in earnings of affiliates (Millions of yen) Fiscal year ended Mar. 31, 2015: (31) Fiscal year ended Mar. 31, 2014: (25) (2) Consolidated financial position Total assets Net assets Shareholders’ equity ratio Net assets per share Millions of yen Millions of yen % Yen As of Mar. 31, 2015 40,463 28,377 69.0 1,201.59 As of Mar. 31, 2014 38,846 27,680 70.3 1,173.84 Reference: Shareholders’ equity (Millions of yen) As of Mar. 31, 2015: 27,938 As of Mar. 31, 2014: 27,294 (3) Consolidated cash flows Cash flows from operating activities Cash flows from investing activities Cash flows from financing activities Cash and cash equivalents at end of period Fiscal years ended Millions of yen Millions of yen Millions of yen Millions of yen Mar. 31, 2015 1,584 384 (295) 14,046 Mar. 31, 2014 1,243 (706) (337) 12,306 2. Dividends Dividend per share Total dividends Payout ratio (consolidated) Dividend on equity (consolidated) 1Q-end 2Q-end 3Q-end Year-end Total Yen Yen Yen Yen Yen Millions of yen % % Fiscal year ended Mar. 31, 2014 - 7.00 - 7.00 14.00 325 69.7 1.2 Fiscal year ended Mar. 31, 2015 - 7.00 - 10.00 17.00 395 77.6 1.4 Fiscal year ending Mar. 31, 2016 (forecast) - 20.00 - 10.00 30.00 64.6 Note: The dividends forecast for 2Q-end of Fiscal year ending March 31, 2016 includes commemorative dividend of 10 yen. Please refer to “Basic Policy for Profit Distribution, and Dividends in the Current and Next Fiscal Years” on page 5 for details. 3. Consolidated Forecast for the Fiscal Year Ending March 31, 2016 (Apr. 1, 2015–Mar. 31, 2016) (Percentages represent year-on-year changes) Net sales Operating income Ordinary income Profit attributable to owners of parent Net income per share Millions of yen % Millions of yen % Millions of yen % Millions of yen % Yen Full year 22,700 6.6 1,500 48.6 1,580 35.5 1,080 111.9 46.45 Note: Only the full-year forecast is shown because Zuken manages performance on a fiscal year basis.

Welcome message from author
This document is posted to help you gain knowledge. Please leave a comment to let me know what you think about it! Share it to your friends and learn new things together.
Transcript
May 11, 2015
Summary of Consolidated Financial Results for the Fiscal Year Ended March 31, 2015 (FY2014)
[Japanese GAAP] Company name: ZUKEN Inc. Listing: Tokyo Stock Exchange, First Section Stock code: 6947 URL: http://www.zuken.co.jp Representative: Makoto Kaneko, President and Representative Director Contact: Susumu Yoshida, General Manager of Finance Department Tel: +81-45-942-1511 Scheduled date of Annual General Shareholders’ Meeting: June 26, 2015 Scheduled date of payment of dividend: June 29, 2015 Scheduled date of filing of Annual Securities Report: June 26, 2015 Preparation of supplementary materials for financial results: None Holding of financial results meeting: None
(All amounts are rounded down to the nearest million yen)
1. Consolidated Financial Results for the Fiscal Year Ended March 31, 2015 (Apr. 1, 2014–Mar. 31, 2015) (1) Consolidated results of operations (Percentages for net sales and incomes represent year-on-year changes)
Net sales Operating income Ordinary income Net income Fiscal years ended Millions of yen % Millions of yen % Millions of yen % Millions of yen %
Mar. 31, 2015 21,297 7.7 1,009 60.2 1,166 37.5 509 9.2 Mar. 31, 2014 19,772 10.5 630 77.7 848 73.1 466 53.5
Note: Comprehensive income (Millions of yen) Fiscal year ended Mar. 31, 2015: 834 (up 13.1%) Fiscal year ended Mar. 31, 2014: 738 (up 67.0%)
Net income per share Diluted net income
per share Return on equity
Ordinary income on total assets
Operating income to net sales
Fiscal years ended Yen Yen % % %
Mar. 31, 2015 21.92 - 1.8 2.9 4.7 Mar. 31, 2014 20.08 - 1.7 2.2 3.2
Reference: Equity in earnings of affiliates (Millions of yen) Fiscal year ended Mar. 31, 2015: (31) Fiscal year ended Mar. 31, 2014: (25)
(2) Consolidated financial position
Total assets Net assets Shareholders’ equity ratio Net assets per share Millions of yen Millions of yen % Yen
As of Mar. 31, 2015 40,463 28,377 69.0 1,201.59 As of Mar. 31, 2014 38,846 27,680 70.3 1,173.84 Reference: Shareholders’ equity (Millions of yen) As of Mar. 31, 2015: 27,938 As of Mar. 31, 2014: 27,294
(3) Consolidated cash flows
Cash flows from
operating activities Cash flows from
investing activities Cash flows from
financing activities Cash and cash equivalents at
end of period Fiscal years ended Millions of yen Millions of yen Millions of yen Millions of yen
Mar. 31, 2015 1,584 384 (295) 14,046 Mar. 31, 2014 1,243 (706) (337) 12,306
2. Dividends
Dividend per share
Total dividends Payout ratio
(consolidated)
Dividend on equity
(consolidated) 1Q-end 2Q-end 3Q-end Year-end Total
Yen Yen Yen Yen Yen Millions of yen % %
Fiscal year ended Mar. 31, 2014 - 7.00 - 7.00 14.00 325 69.7 1.2 Fiscal year ended Mar. 31, 2015 - 7.00 - 10.00 17.00 395 77.6 1.4 Fiscal year ending Mar. 31, 2016 (forecast) - 20.00 - 10.00 30.00 64.6
Note: The dividends forecast for 2Q-end of Fiscal year ending March 31, 2016 includes commemorative dividend of 10 yen. Please refer to “Basic Policy for Profit Distribution, and Dividends in the Current and Next Fiscal Years” on page 5 for details.
3. Consolidated Forecast for the Fiscal Year Ending March 31, 2016 (Apr. 1, 2015–Mar. 31, 2016) (Percentages represent year-on-year changes)
Net sales Operating income Ordinary income Profit attributable to
owners of parent Net income per
share Millions of yen % Millions of yen % Millions of yen % Millions of yen % Yen
Full year 22,700 6.6 1,500 48.6 1,580 35.5 1,080 111.9 46.45
Note: Only the full-year forecast is shown because Zuken manages performance on a fiscal year basis.

* Notes (1) Changes in significant subsidiaries during the period (changes in specified subsidiaries resulting in change in scope
of consolidation): None (2) Changes in accounting policies and accounting-based estimates, and restatements
(a) Changes in accounting policies due to revisions in accounting standards, others: Yes
(b) Changes in accounting policies other than (a) above: None
(c) Changes in accounting-based estimates: None
(d) Restatements: None
Note: Please refer to “Changes in Accounting Policies” on page 19 for further information.
(3) Number of outstanding shares (common stock)
(a) Number of shares outstanding at the end of period (including treasury shares)
As of Mar. 31, 2015: 23,267,169 shares As of Mar. 31, 2014: 23,267,169 shares
(b) Number of treasury shares at the end of period
As of Mar. 31, 2015: 15,836 shares As of Mar. 31, 2014: 14,869 shares
(c) Average number of shares outstanding during the period
Fiscal year ended Mar. 31, 2015: 23,251,753 shares Fiscal year ended Mar. 31, 2014: 23,252,661 shares
Reference: Summary of Non-consolidated Financial Results
Non-consolidated Financial Results for the Fiscal Year Ended March 31, 2015 (Apr. 1, 2014–Mar. 31, 2015)
(1) Non-consolidated results of operations (Percentages represent year-on-year changes)
Net sales Operating income Ordinary income Net income Fiscal years ended Millions of yen % Millions of yen % Millions of yen % Millions of yen %
Mar. 31, 2015 10,567 12.8 777 142.0 1,610 114.3 1,047 99.1 Mar. 31, 2014 9,372 9.2 321 - 751 652.7 526 516.3
Net income per share Diluted net income per share Fiscal years ended Yen Yen
Mar. 31, 2015 45.06 - Mar. 31, 2014 22.63 -
(2) Non-consolidated financial position
Total assets Net assets Shareholders’ equity ratio Net assets per share Millions of yen Millions of yen % Yen
As of Mar. 31, 2015 32,970 27,769 84.2 1,194.34 As of Mar. 31, 2014 31,048 26,594 85.7 1,143.72
Reference: Shareholders’ equity (Millions of yen) As of Mar. 31, 2015: 27,769 As of Mar. 31, 2014: 26,594
* Information regarding the implementation of audit procedure
The current financial statements in this report are exempted from audit procedures based on the Financial Instruments and Exchange Act. At the time of disclosure, the audit procedures for these financial statements have not been completed.
* Cautionary statement with respect to forward-looking statements and other special items
Forecasts of future performance in this report are based on assumption judged to be valid information available to the Company’s management at the time this report was prepared, but are not promises by the Company regarding future performance. Actual results may differ substantially from the forecasts for a number of reasons. Please refer to “Analysis of Results of Operations” on page 2 for forecast assumptions and notes of caution for usage.
ZUKEN Inc. (6947) Financial Results for the Fiscal Year Ended March 31, 2015
1
Contents of Attachments
1. Analysis of Results of Operations and Financial Position ............................................................................................ 2
(1) Analysis of Results of Operations ........................................................................................................................... 2
(2) Analysis of Financial Position ................................................................................................................................. 4
(3) Basic Policy for Profit Distribution, and Dividends in the Current and Next Fiscal Years ..................................... 5
2. Corporate Group .......................................................................................................................................................... 6
3. Management Policies ................................................................................................................................................... 8
(1) Basic Management Policy ....................................................................................................................................... 8
(2) Performance Targets ................................................................................................................................................ 8
(3) Medium- and Long-term Business Strategy and Issues ........................................................................................... 8
4. Basic Approach for the Selection of Accounting Standards ........................................................................................ 9
5. Consolidated Financial Statements ............................................................................................................................ 10
(1) Consolidated Balance Sheet .................................................................................................................................... 10
(2) Consolidated Statements of Income and Comprehensive Income ........................................................................... 12
Consolidated Statement of Income ............................................................................................................................ 12
Consolidated Statement of Comprehensive Income .................................................................................................. 13
(3) Consolidated Statement of Changes in Equity ........................................................................................................ 14
(4) Consolidated Statement of Cash Flows ................................................................................................................... 16
(5) Notes to Consolidated Financial Statements ........................................................................................................... 17
Going Concern Assumption ...................................................................................................................................... 17
Basis of Presenting the Consolidated Financial Statements ...................................................................................... 17
Changes in Accounting Policies ................................................................................................................................ 19
Reclassifications ........................................................................................................................................................ 20
Notes to Consolidated Balance Sheet ........................................................................................................................ 21
Notes to Consolidated Statement of Income ............................................................................................................. 21
Notes to Consolidated Statement of Comprehensive Income .................................................................................... 22
Notes to Consolidated Statement of Changes in Equity ............................................................................................ 22
Notes to Consolidated Statement of Cash Flows ....................................................................................................... 23
Financial Instruments ................................................................................................................................................ 24
Marketable Securities ................................................................................................................................................ 26
Segment Information ................................................................................................................................................. 28
Per-share Information ................................................................................................................................................ 30
Subsequent Events ..................................................................................................................................................... 31
Omission of Disclosure ............................................................................................................................................. 31
6. Production, Orders and Sales ..................................................................................................................................... 32
7. Non-consolidated Financial Statements .................................................................................................................... 33
(1) Balance Sheet .......................................................................................................................................................... 33
(2) Statement of Income ................................................................................................................................................ 35
(3) Statement of Changes in Equity .............................................................................................................................. 36
ZUKEN Inc. (6947) Financial Results for the Fiscal Year Ended March 31, 2015
2
1. Analysis of Results of Operations and Financial Position
(1) Analysis of Results of Operations
(a) Summary of the fiscal year under review
In the fiscal year that ended on March 31, 2015, the U.S. and Japanese economies continued to steadily recover.
However, the overall economic outlook remained uncertain because of the prolonged financial instability in Europe
and slowing economic growth in China.
Companies in the electronics manufacturing sector, automobile-related manufacturing sector and industrial
equipment manufacturing sector are major customer segments of the Zuken Group. Although earnings have clearly
been recovering in these sectors, companies remain cautious about making capital investments because of the
uncertain outlook.
The Zuken Group made substantial investments aimed at growth in order to become a “truly global company” that
provides the best possible solutions to manufacturers on a global scale. Becoming a “truly global company” requires
seamless cooperation among our bases in Japan, Europe, Americas and Asia in order to serve manufacturers
worldwide with highly advanced solutions that are competitive in global markets. To accomplish this goal, we
utilized the collective strengths of our group, made our organization more powerful and took many actions in
numerous market sectors.
(i) In the electronics manufacturing sector, we reinforced marketing and development capabilities primarily by
using Zuken SOZO Center (SOZO means “creation”), which is located in the U.S. Silicon Valley. This center is
a strategic investment with the initial objective of capturing market share in the United States, where there are a
large number of companies with global operations. Next, we plan to use these relationships to do business with
the manufacturing operations of these companies in emerging countries. In Asia, we established a subsidiary to
start full-scale operations in India, which has excellent prospects for growth.
In addition to these measures to strengthen our organization, we continued to concentrate on sales of the
CR-8000/Design Force electronic design solution system, our newest core product. The system features
outstanding performance and many customized functions along with even greater ease of operation. Sales have
been growing in Japan, Europe, Americas, and Asia.
(ii) In the automobile-related manufacturing sector, we established a separate business unit in Japan for the purpose
of significantly strengthening development and sales structures. In Germany, we recruited highly skilled
engineers and established a new development base in order to speed up the development of new products with
cooperation from Japan. Automotive designs are becoming more complex as the number of electronic devices
increases. Companies need to perform intricate studies of products even at the conceptual and planning stages
of a product’s design. At the newly establish bases, we will develop the systems needed to support concept
design work which is becoming increasingly important.
We continued to concentrate on increasing sales of the E3. series and Cabling Designer, which are systems for
designing wiring in components used in automobiles and other transportation machines. In addition, we started
selling the Harness Designer to companies that manufacture electronic automotive parts. By taking these action,
we have extended our sales both to companies that design entire vehicles and to suppliers of automotive
electronic components.
(iii) In the industrial equipment manufacturing sector, one priority was increasing sales of PreSight/visual BOM, a
product information platform. The goal is to establish relationships with customers in segments we do not
currently serve. Companies can utilize this system regardless of the types of electrical and mechanical designs
they use. Product information can be shared with design, production, and procurement operations. As a result,
we anticipate demand for the PreSight/visual BOM for use in a variety of departments of manufacturers in
ZUKEN Inc. (6947) Financial Results for the Fiscal Year Ended March 31, 2015
3
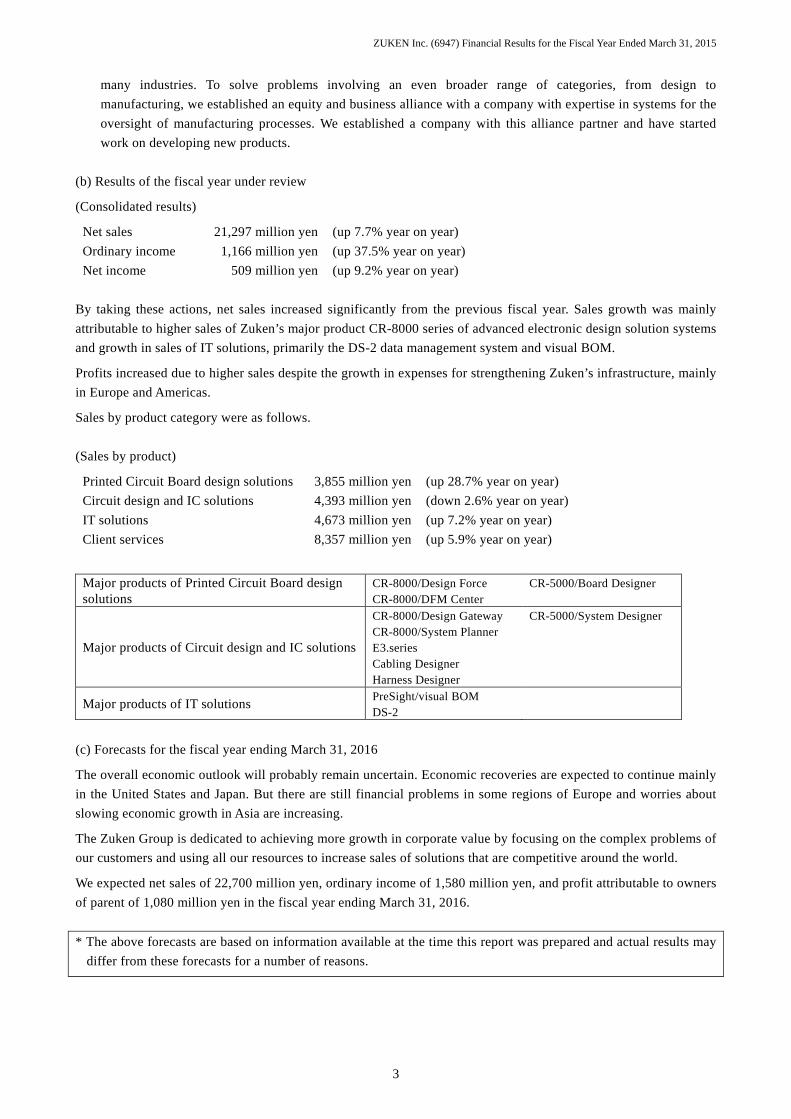
many industries. To solve problems involving an even broader range of categories, from design to
manufacturing, we established an equity and business alliance with a company with expertise in systems for the
oversight of manufacturing processes. We established a company with this alliance partner and have started
work on developing new products.
(b) Results of the fiscal year under review
(Consolidated results)
Net sales 21,297 million yen (up 7.7% year on year)
Ordinary income 1,166 million yen (up 37.5% year on year)
Net income 509 million yen (up 9.2% year on year)
By taking these actions, net sales increased significantly from the previous fiscal year. Sales growth was mainly
attributable to higher sales of Zuken’s major product CR-8000 series of advanced electronic design solution systems
and growth in sales of IT solutions, primarily the DS-2 data management system and visual BOM.
Profits increased due to higher sales despite the growth in expenses for strengthening Zuken’s infrastructure, mainly
in Europe and Americas.
Sales by product category were as follows.
(Sales by product)
Printed Circuit Board design solutions 3,855 million yen (up 28.7% year on year)
Circuit design and IC solutions 4,393 million yen (down 2.6% year on year)
IT solutions 4,673 million yen (up 7.2% year on year)
Client services 8,357 million yen (up 5.9% year on year)
Major products of Printed Circuit Board design solutions
CR-8000/Design Force CR-8000/DFM Center
CR-5000/Board Designer
Major products of Circuit design and IC solutions
CR-8000/Design Gateway CR-8000/System Planner E3.series Cabling Designer Harness Designer
CR-5000/System Designer
Major products of IT solutions PreSight/visual BOM DS-2
(c) Forecasts for the fiscal year ending March 31, 2016
The overall economic outlook will probably remain uncertain. Economic recoveries are expected to continue mainly
in the United States and Japan. But there are still financial problems in some regions of Europe and worries about
slowing economic growth in Asia are increasing.
The Zuken Group is dedicated to achieving more growth in corporate value by focusing on the complex problems of
our customers and using all our resources to increase sales of solutions that are competitive around the world.
We expected net sales of 22,700 million yen, ordinary income of 1,580 million yen, and profit attributable to owners
of parent of 1,080 million yen in the fiscal year ending March 31, 2016.
* The above forecasts are based on information available at the time this report was prepared and actual results may
differ from these forecasts for a number of reasons.
ZUKEN Inc. (6947) Financial Results for the Fiscal Year Ended March 31, 2015
4
(2) Analysis of Financial Position
(a) Assets, liabilities and net assets
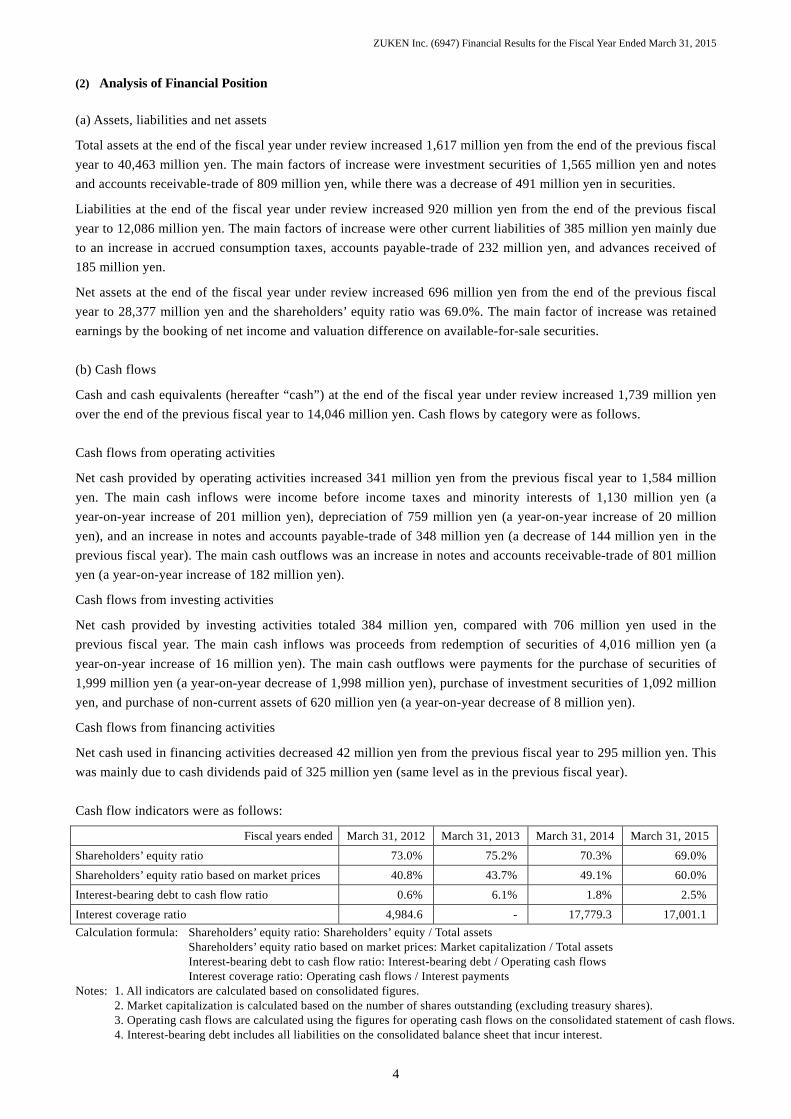
Total assets at the end of the fiscal year under review increased 1,617 million yen from the end of the previous fiscal
year to 40,463 million yen. The main factors of increase were investment securities of 1,565 million yen and notes
and accounts receivable-trade of 809 million yen, while there was a decrease of 491 million yen in securities.
Liabilities at the end of the fiscal year under review increased 920 million yen from the end of the previous fiscal
year to 12,086 million yen. The main factors of increase were other current liabilities of 385 million yen mainly due
to an increase in accrued consumption taxes, accounts payable-trade of 232 million yen, and advances received of
185 million yen.
Net assets at the end of the fiscal year under review increased 696 million yen from the end of the previous fiscal
year to 28,377 million yen and the shareholders’ equity ratio was 69.0%. The main factor of increase was retained
earnings by the booking of net income and valuation difference on available-for-sale securities.
(b) Cash flows
Cash and cash equivalents (hereafter “cash”) at the end of the fiscal year under review increased 1,739 million yen
over the end of the previous fiscal year to 14,046 million yen. Cash flows by category were as follows.
Cash flows from operating activities
Net cash provided by operating activities increased 341 million yen from the previous fiscal year to 1,584 million
yen. The main cash inflows were income before income taxes and minority interests of 1,130 million yen (a
year-on-year increase of 201 million yen), depreciation of 759 million yen (a year-on-year increase of 20 million
yen), and an increase in notes and accounts payable-trade of 348 million yen (a decrease of 144 million yen in the
previous fiscal year). The main cash outflows was an increase in notes and accounts receivable-trade of 801 million
yen (a year-on-year increase of 182 million yen).
Cash flows from investing activities
Net cash provided by investing activities totaled 384 million yen, compared with 706 million yen used in the
previous fiscal year. The main cash inflows was proceeds from redemption of securities of 4,016 million yen (a
year-on-year increase of 16 million yen). The main cash outflows were payments for the purchase of securities of
1,999 million yen (a year-on-year decrease of 1,998 million yen), purchase of investment securities of 1,092 million
yen, and purchase of non-current assets of 620 million yen (a year-on-year decrease of 8 million yen).
Cash flows from financing activities
Net cash used in financing activities decreased 42 million yen from the previous fiscal year to 295 million yen. This
was mainly due to cash dividends paid of 325 million yen (same level as in the previous fiscal year).
Cash flow indicators were as follows:
Fiscal years ended March 31, 2012 March 31, 2013 March 31, 2014 March 31, 2015
Shareholders’ equity ratio 73.0% 75.2% 70.3% 69.0%
Shareholders’ equity ratio based on market prices 40.8% 43.7% 49.1% 60.0%
Interest-bearing debt to cash flow ratio 0.6% 6.1% 1.8% 2.5%
Interest coverage ratio 4,984.6 - 17,779.3 17,001.1
Calculation formula: Shareholders’ equity ratio: Shareholders’ equity / Total assets Shareholders’ equity ratio based on market prices: Market capitalization / Total assets Interest-bearing debt to cash flow ratio: Interest-bearing debt / Operating cash flows Interest coverage ratio: Operating cash flows / Interest payments Notes: 1. All indicators are calculated based on consolidated figures. 2. Market capitalization is calculated based on the number of shares outstanding (excluding treasury shares). 3. Operating cash flows are calculated using the figures for operating cash flows on the consolidated statement of cash flows. 4. Interest-bearing debt includes all liabilities on the consolidated balance sheet that incur interest.

ZUKEN Inc. (6947) Financial Results for the Fiscal Year Ended March 31, 2015
5
(3) Basic Policy for Profit Distribution, and Dividends in the Current and Next Fiscal Years
Distributing profits to shareholders is one of the highest management priorities of the Zuken Group. The basic
policy is to pay a stable and consistent dividend. In addition, we will continue to consider suitable and highly
effective methods of returning earnings to shareholders while taking into account business performance, operating
conditions and other factors. Profit distributions will also reflect the need to retain earnings for strengthening
business operations and financial soundness and for funding upcoming business activities.
Earnings have increased in each of the past two fiscal years because of the development of new products, measures
to strengthen the sales organization, and other initiatives. As a result, we have made progress with building a more
powerful foundation for stable earnings.
In consideration of our performance and basic policy for profit distributions, we plan to pay a year-end dividend of
10 yen per share, which is 3 yen higher than the previous fiscal year. With the interim dividend of 7 yen per share,
this will result in a dividend of 17 yen per share for the fiscal year that ended on March 31, 2015.
For the fiscal year ending on March 31, 2016, we plan to pay a dividend of 30 yen per share. This is the sum of an
ordinary dividend of 20 yen per share and a commemorative dividend of 10 yen per share for our 40th anniversary.
Dividend per share (Yen)
2Q-end Year-end Total Fiscal year ended Mar. 31, 2015 7 10 17
Fiscal year ending Mar. 31, 2016 20
(Ordinary dividend: 10) (Commemorative dividend: 10)
10 30
(Ordinary dividend: 20) (Commemorative dividend: 10)
Reference: Fiscal year ended Mar. 31, 2014
7 7 14
ZUKEN Inc. (6947) Financial Results for the Fiscal Year Ended March 31, 2015
6
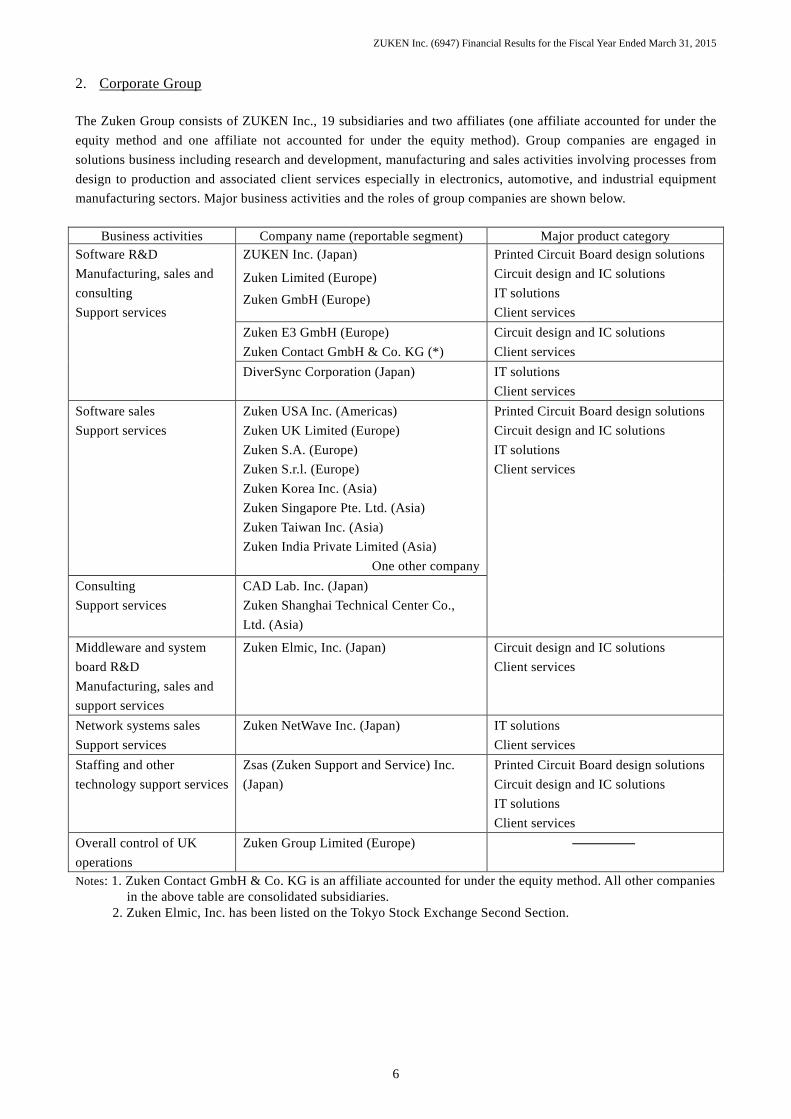
2. Corporate Group
The Zuken Group consists of ZUKEN Inc., 19 subsidiaries and two affiliates (one affiliate accounted for under the
equity method and one affiliate not accounted for under the equity method). Group companies are engaged in
solutions business including research and development, manufacturing and sales activities involving processes from
design to production and associated client services especially in electronics, automotive, and industrial equipment
manufacturing sectors. Major business activities and the roles of group companies are shown below.
Business activities Company name (reportable segment) Major product category
Software R&D
Manufacturing, sales and
consulting
Support services
ZUKEN Inc. (Japan)
Zuken Limited (Europe)
Zuken GmbH (Europe)
Printed Circuit Board design solutions
Circuit design and IC solutions
IT solutions
Client services
Zuken E3 GmbH (Europe)
Zuken Contact GmbH & Co. KG (*)
Circuit design and IC solutions
Client services
DiverSync Corporation (Japan) IT solutions
Client services
Software sales
Support services
Zuken USA Inc. (Americas)
Zuken UK Limited (Europe)
Zuken S.A. (Europe)
Zuken S.r.l. (Europe)
Zuken Korea Inc. (Asia)
Zuken Singapore Pte. Ltd. (Asia)
Zuken Taiwan Inc. (Asia)
Zuken India Private Limited (Asia)
One other company
Printed Circuit Board design solutions
Circuit design and IC solutions
IT solutions
Client services
Consulting
Support services
CAD Lab. Inc. (Japan)
Zuken Shanghai Technical Center Co.,
Ltd. (Asia)
Middleware and system
board R&D
Manufacturing, sales and
support services
Zuken Elmic, Inc. (Japan) Circuit design and IC solutions
Client services
Network systems sales
Support services
Zuken NetWave Inc. (Japan) IT solutions
Client services
Staffing and other
technology support services
Zsas (Zuken Support and Service) Inc.
(Japan)
Printed Circuit Board design solutions
Circuit design and IC solutions
IT solutions
Client services
Overall control of UK
operations
Zuken Group Limited (Europe)
Notes: 1. Zuken Contact GmbH & Co. KG is an affiliate accounted for under the equity method. All other companies in the above table are consolidated subsidiaries.
2. Zuken Elmic, Inc. has been listed on the Tokyo Stock Exchange Second Section.

ZUKEN Inc. (6947) Financial Results for the Fiscal Year Ended March 31, 2015
7
The diagram below provides a visual representation of the positioning and relationships of businesses within the
group.
<The Company> <Affiliates>
(Overall control of UK operations)
Zuken Group Limited
(R&D, manufacturing, sales, consulting and support services)
Zuken LimitedZuken GmbHZuken E3 GmbHZuken Contact GmbH & Co. KG (*)
(Sales and support services)
Zuken USA Inc.Zuken UK LimitedZuken S.A. Zuken S.r.l. One other company
(Sales and support services)
Zuken Korea Inc.Zuken Singapore Pte. Ltd.Zuken Taiwan Inc. Zuken India Private Limited
(Consulting and support services)
Zuken Shanghai Technical Center Co., Ltd.
(Consulting and support services)
CAD Lab. Inc.
(R&D, manufacturing, sales, consulting and support services)
DiverSync Corporation
(R&D, manufacturing, sales and support services)
Zuken Elmic, Inc.
(Sales and support services)
Zuken NetWave Inc.
(Staffing and other technology support services)
Zsas (Zuken Support and Service) Inc.
(Domestic users) (Overseas users)
ZU
KE
N In
c.(R
&D
, ma
nu
factu
ring
, sale
s, con
sultin
g a
nd
sup
po
rt service
s for e
ach
solu
tion
)
Product and support services
Product andsupport services
Product and support services
Product and support services
Support services
Consulting andsupport services
Product andsupport services
Staffing and other technology support
services
Product andsupport services
ZUKEN Inc. (6947) Financial Results for the Fiscal Year Ended March 31, 2015
8
3. Management Policies
(1) Basic Management Policy
The Zuken Group is dedicated to making a significant contribution to the advancement of the manufacturing sector
by assisting in the development and manufacture of products. Our goal is to assist a broad range of manufacturers,
primarily in the electronics, automotive, and industrial equipment manufacturing sectors, improve design and
manufacturing efficiency and raise productivity. To accomplish this goal, we concentrate on supplying the best
possible solutions while constantly adapting to changes in market needs.
(2) Performance Targets
The Zuken Group is fulfilling increasingly important roles in the electronics, automotive, and industrial equipment
manufacturing sectors, which are the group’s primary markets, as demand for these products grows in emerging
countries and technological advances are needed for environmental and other requirements. In addition, markets that the
Zuken Group can serve are expanding as all manufacturers rapidly increase the use of electronics in their products. To
capitalize on these opportunities, we will continue our solutions business while aggressively entering new markets and
technology domains. We are determined to generate long-term returns for shareholders as we continue increasing the
scope and scale of our business activities. Consequently, sustaining the growth of earnings per share is one of our key
performance indicators.
(3) Medium- and Long-term Business Strategy and Issues
The Zuken Group will continue to make proactive investments for achieving more growth and to develop highly
advanced solutions for the problems of manufacturers around the world. We will use the resources of the entire
group to aim for growth in sales on a global scale.
We will need to work on the following issues to accomplish this goal. (a) Increase sales of the CR-8000 series, Zuken’s major product
For the state-of-the-art CR-8000 electronic design system, we will add more functions in anticipation of customers’
needs and use the resources of the entire group to achieve strong sales growth worldwide. Our objective is to
achieve more growth in the electronics manufacturing sector. (b) In the automotive sector, develop electronic control design systems and increase sales of these systems
Electronic control is vital to the safe operation of automobiles. Motor vehicles will use an increasing amount of
electronics and the designs of these devices are becoming more sophisticated and intricate. To develop and sell the
required systems, the Zuken Group will use collaboration between development bases in Japan and Germany to
create a support system for the conceptual design stage, an infrastructure system for managing design data, and
other products. We plan to sell these products on a global scale. (c) Upgrade functions of the PreSight/visual BOM and increase sales to new customers
Zuken will concentrate on further enhancing functions for component data management solutions that utilize 3D
data compression technology, targeting mostly manufacturers of industrial equipment. We will extensively utilize
external technologies and expertise and work with other companies in order to be a source of support for problems
across a diverse spectrum of business domains. Our aim is to use these activities to become an organization that
can supply an increasing number and variety of solutions to manufacturers of electronics, machinery and many
other products.
The Zuken Group plans to achieve more growth in corporate value by using these initiatives to increase sales of
globally competitive solutions that draw on all of the group’s resources and directly target our customers’ complex
problems.

ZUKEN Inc. (6947) Financial Results for the Fiscal Year Ended March 31, 2015
9
4. Basic Approach for the Selection of Accounting Standards
The ZUKEN Group will continue to prepare consolidated financial statements in accordance with generally
accepted accounting principles in Japan for the time being to permit comparisons with prior years and with the
financial data of other companies.
We will take suitable actions with regard to the application of International Financial Reporting Standards by taking
into account associated factors in Japan and other countries.

ZUKEN Inc. (6947) Financial Results for the Fiscal Year Ended March 31, 2015
10
5. Consolidated Financial Statements
(1) Consolidated Balance Sheet (Thousands of yen)
FY2013
(As of Mar. 31, 2014) FY2014
(As of Mar. 31, 2015)
Assets
Current assets
Cash and deposits 5,071,935 5,252,859
Notes and accounts receivable-trade 4,895,506 5,705,030
Securities 16,188,534 15,696,959
Merchandise and finished goods 176,908 271,201
Work in process 49,974 67,494
Raw materials and supplies 1,993 3,567
Deferred tax assets 341,853 333,965
Other 1,520,183 1,658,223
Allowance for doubtful accounts (30,879) (35,124)
Total current assets 28,216,009 28,954,177
Non-current assets
Property, plant and equipment
Buildings and structures 9,102,396 9,156,722
Accumulated depreciation (5,954,566) (6,104,157)
Buildings and structures, net 3,147,830 3,052,564
Machinery, equipment and vehicles 98,260 98,706
Accumulated depreciation (61,515) (73,369)
Machinery, equipment and vehicles, net 36,744 25,336
Tools, furniture and fixtures 1,965,871 1,991,046
Accumulated depreciation (1,606,593) (1,638,900)
Tools, furniture and fixtures, net 359,277 352,145
Land 3,009,821 3,009,821
Leased assets 42,463 58,938
Accumulated depreciation (20,647) (22,160)
Leased assets, net 21,815 36,778
Construction in progress 4,015 2,398
Total property, plant and equipment 6,579,505 6,479,044
Intangible assets
Goodwill 997,450 836,119
Other 758,818 724,828
Total intangible assets 1,756,268 1,560,947
Investments and other assets
Investment securities 927,729 2,493,402
Deferred tax assets 787,582 498,207
Other 588,756 492,709
Allowance for doubtful accounts (9,674) (14,816)
Total investments and other assets 2,294,393 3,469,502
Total non-current assets 10,630,168 11,509,495
Total assets 38,846,177 40,463,672

ZUKEN Inc. (6947) Financial Results for the Fiscal Year Ended March 31, 2015
11
(Thousands of yen)
FY2013
(As of Mar. 31, 2014) FY2014
(As of Mar. 31, 2015)
Liabilities
Current liabilities
Accounts payable-trade 705,940 938,362
Income taxes payable 315,777 373,341
Advances received 3,530,050 3,715,976
Provision for bonuses 661,002 765,653
Provision for directors' bonuses 18,062 26,268
Other provision 13,877 12,738
Other 1,350,462 1,736,218
Total current liabilities 6,595,173 7,568,558
Non-current liabilities
Net defined benefit liability 4,370,781 4,308,728
Other 200,067 209,319
Total non-current liabilities 4,570,848 4,518,048
Total liabilities 11,166,021 12,086,607
Net assets
Shareholders’ equity
Capital stock 10,117,065 10,117,065
Capital surplus 8,657,753 8,657,753
Retained earnings 8,986,688 9,314,627
Treasury shares (13,209) (14,159)
Total shareholders’ equity 27,748,297 28,075,286
Accumulated other comprehensive income
Valuation difference on available-for-sale securities 318,521 672,273
Foreign currency translation adjustment 210,057 79,341
Remeasurements of defined benefit plans (982,326) (888,358)
Total accumulated other comprehensive income (453,747) (136,743)
Minority interests 385,606 438,522
Total net assets 27,680,156 28,377,065
Total liabilities and net assets 38,846,177 40,463,672
ZUKEN Inc. (6947) Financial Results for the Fiscal Year Ended March 31, 2015
12
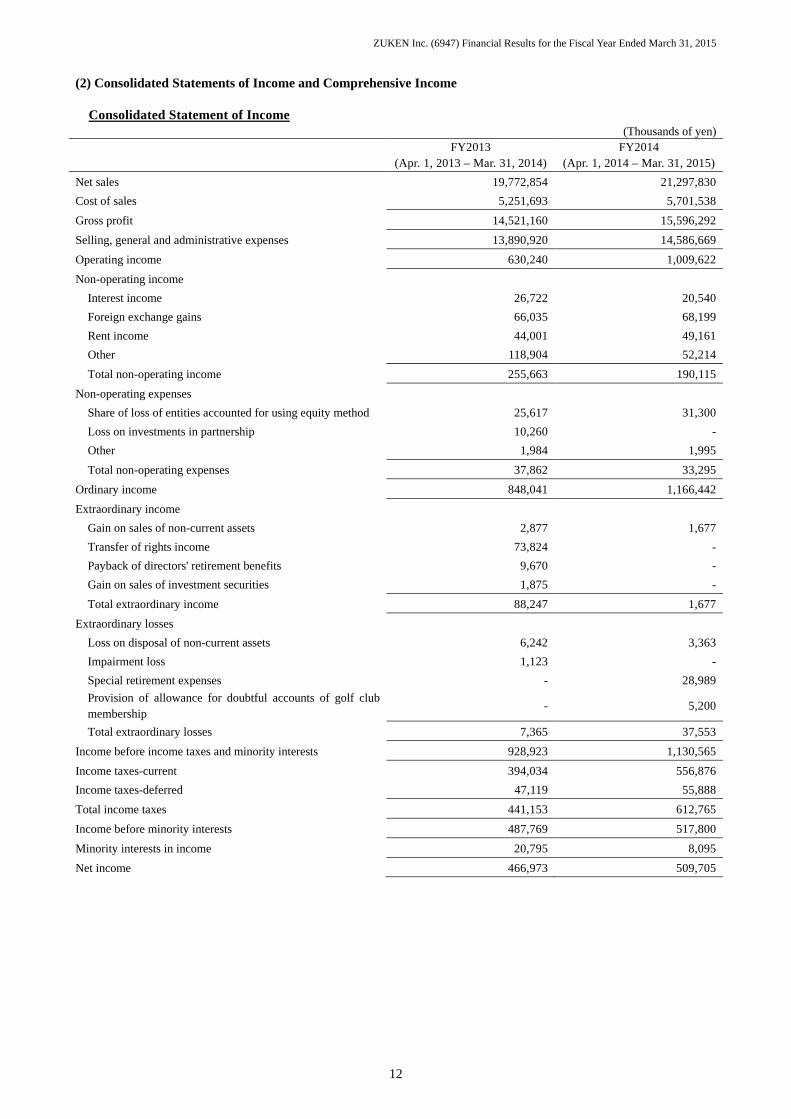
(2) Consolidated Statements of Income and Comprehensive Income Consolidated Statement of Income
(Thousands of yen)
FY2013
(Apr. 1, 2013 – Mar. 31, 2014) FY2014
(Apr. 1, 2014 – Mar. 31, 2015)
Net sales 19,772,854 21,297,830
Cost of sales 5,251,693 5,701,538
Gross profit 14,521,160 15,596,292
Selling, general and administrative expenses 13,890,920 14,586,669
Operating income 630,240 1,009,622
Non-operating income
Interest income 26,722 20,540
Foreign exchange gains 66,035 68,199
Rent income 44,001 49,161
Other 118,904 52,214
Total non-operating income 255,663 190,115
Non-operating expenses
Share of loss of entities accounted for using equity method 25,617 31,300
Loss on investments in partnership 10,260 -
Other 1,984 1,995
Total non-operating expenses 37,862 33,295
Ordinary income 848,041 1,166,442
Extraordinary income
Gain on sales of non-current assets 2,877 1,677
Transfer of rights income 73,824 -
Payback of directors' retirement benefits 9,670 -
Gain on sales of investment securities 1,875 -
Total extraordinary income 88,247 1,677
Extraordinary losses
Loss on disposal of non-current assets 6,242 3,363
Impairment loss 1,123 -
Special retirement expenses - 28,989
Provision of allowance for doubtful accounts of golf club membership
- 5,200
Total extraordinary losses 7,365 37,553
Income before income taxes and minority interests 928,923 1,130,565
Income taxes-current 394,034 556,876
Income taxes-deferred 47,119 55,888
Total income taxes 441,153 612,765
Income before minority interests 487,769 517,800
Minority interests in income 20,795 8,095
Net income 466,973 509,705

ZUKEN Inc. (6947) Financial Results for the Fiscal Year Ended March 31, 2015
13
Consolidated Statement of Comprehensive Income (Thousands of yen)
FY2013
(Apr. 1, 2013 – Mar. 31, 2014) FY2014
(Apr. 1, 2014 – Mar. 31, 2015)
Income before minority interests 487,769 517,800
Other comprehensive income
Valuation difference on available-for-sale securities 12,191 353,752
Foreign currency translation adjustment 225,284 (127,061)
Remeasurements of defined benefit plans, net of tax - 93,968
Share of other comprehensive income of entities accounted for using equity method
12,866 (3,653)
Total other comprehensive income 250,342 317,004
Comprehensive income 738,111 834,805
Comprehensive income attributable to
Comprehensive income attributable to owners of parent 717,458 826,709
Comprehensive income attributable to minority interests 20,653 8,095
ZUKEN Inc. (6947) Financial Results for the Fiscal Year Ended March 31, 2015
14
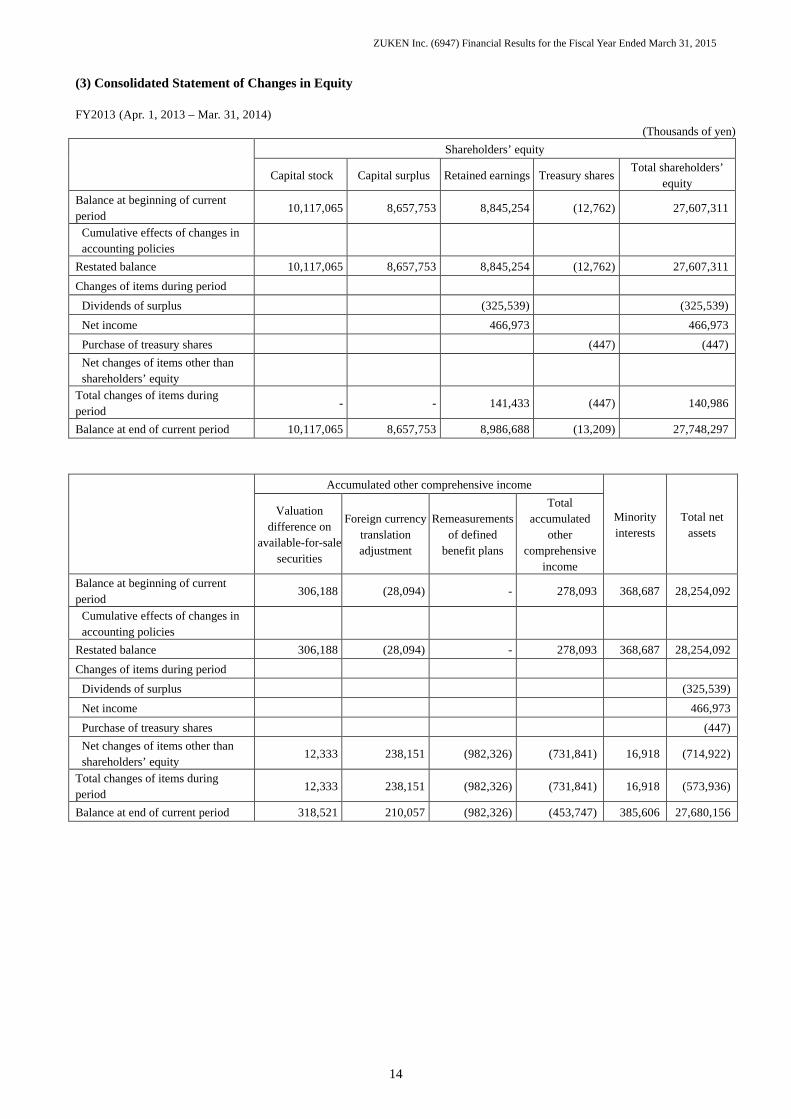
(3) Consolidated Statement of Changes in Equity FY2013 (Apr. 1, 2013 – Mar. 31, 2014)
(Thousands of yen)
Shareholders’ equity
Capital stock Capital surplus Retained earnings Treasury shares Total shareholders’
equity Balance at beginning of current period
10,117,065 8,657,753 8,845,254 (12,762) 27,607,311
Cumulative effects of changes in accounting policies
Restated balance 10,117,065 8,657,753 8,845,254 (12,762) 27,607,311
Changes of items during period
Dividends of surplus (325,539) (325,539)
Net income 466,973 466,973
Purchase of treasury shares (447) (447)
Net changes of items other than shareholders’ equity
Total changes of items during period
- - 141,433 (447) 140,986
Balance at end of current period 10,117,065 8,657,753 8,986,688 (13,209) 27,748,297
Accumulated other comprehensive income
Minority interests
Total net assets
Valuation difference on
available-for-sale securities
Foreign currency translation adjustment
Remeasurements of defined
benefit plans
Total accumulated
other comprehensive
income Balance at beginning of current period
306,188 (28,094) - 278,093 368,687 28,254,092
Cumulative effects of changes in accounting policies
Restated balance 306,188 (28,094) - 278,093 368,687 28,254,092
Changes of items during period
Dividends of surplus (325,539)
Net income 466,973
Purchase of treasury shares (447)
Net changes of items other than shareholders’ equity
12,333 238,151 (982,326) (731,841) 16,918 (714,922)
Total changes of items during period
12,333 238,151 (982,326) (731,841) 16,918 (573,936)
Balance at end of current period 318,521 210,057 (982,326) (453,747) 385,606 27,680,156
ZUKEN Inc. (6947) Financial Results for the Fiscal Year Ended March 31, 2015
15
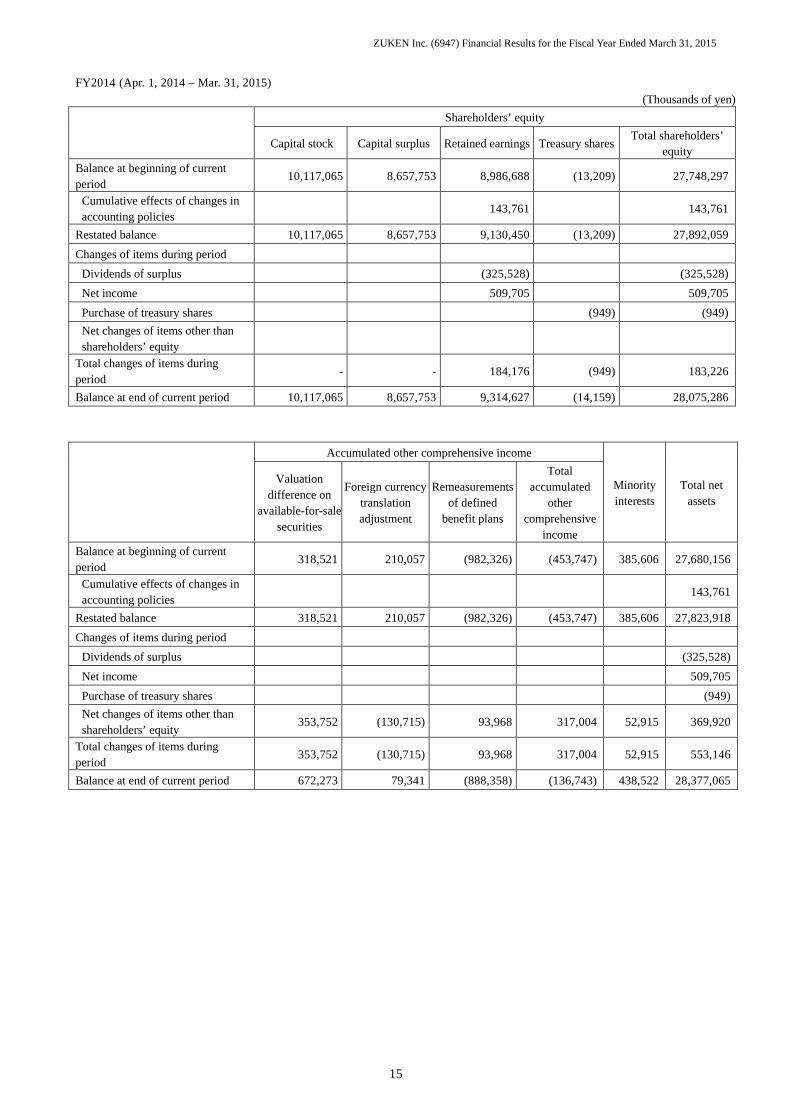
FY2014 (Apr. 1, 2014 – Mar. 31, 2015) (Thousands of yen)
Shareholders’ equity
Capital stock Capital surplus Retained earnings Treasury shares Total shareholders’
equity Balance at beginning of current period
10,117,065 8,657,753 8,986,688 (13,209) 27,748,297
Cumulative effects of changes in accounting policies
143,761 143,761
Restated balance 10,117,065 8,657,753 9,130,450 (13,209) 27,892,059
Changes of items during period
Dividends of surplus (325,528) (325,528)
Net income 509,705 509,705
Purchase of treasury shares (949) (949)
Net changes of items other than shareholders’ equity
Total changes of items during period
- - 184,176 (949) 183,226
Balance at end of current period 10,117,065 8,657,753 9,314,627 (14,159) 28,075,286
Accumulated other comprehensive income
Minority interests
Total net assets
Valuation difference on
available-for-sale securities
Foreign currency translation adjustment
Remeasurements of defined
benefit plans
Total accumulated
other comprehensive
income Balance at beginning of current period
318,521 210,057 (982,326) (453,747) 385,606 27,680,156
Cumulative effects of changes in accounting policies
143,761
Restated balance 318,521 210,057 (982,326) (453,747) 385,606 27,823,918
Changes of items during period
Dividends of surplus (325,528)
Net income 509,705
Purchase of treasury shares (949)
Net changes of items other than shareholders’ equity
353,752 (130,715) 93,968 317,004 52,915 369,920
Total changes of items during period
353,752 (130,715) 93,968 317,004 52,915 553,146
Balance at end of current period 672,273 79,341 (888,358) (136,743) 438,522 28,377,065

ZUKEN Inc. (6947) Financial Results for the Fiscal Year Ended March 31, 2015
16
(4) Consolidated Statement of Cash Flows (Thousands of yen)
FY2013
(Apr. 1, 2013 – Mar. 31, 2014) FY2014
(Apr. 1, 2014 – Mar. 31, 2015)
Cash flows from operating activities
Income before income taxes and minority interests 928,923 1,130,565
Depreciation 738,546 759,177
Amortization of goodwill 79,339 118,202
Interest and dividend income (30,076) (27,236)
Foreign exchange losses (gains) (25,954) (30,649)
Share of (profit) loss of entities accounted for using equity method
25,617 31,300
Decrease (increase) in notes and accounts receivable-trade (619,692) (801,962)
Increase (decrease) in notes and accounts payable-trade (144,261) 348,072
Increase (decrease) in net defined benefit liability 387,808 339,574
Other, net 122,670 191,591
Subtotal 1,462,920 2,058,635
Interest and dividend income received 26,910 29,688
Interest expenses paid (69) (93)
Income taxes paid (246,487) (503,428)
Net cash provided by (used in) operating activities 1,243,274 1,584,802
Cash flows from investing activities
Decrease (increase) in time deposits (136,950) 102,700
Purchase of securities (3,998,800) (1,999,900)
Proceeds from redemption of securities 4,000,000 4,016,180
Purchase of property, plant and equipment (343,128) (228,950)
Proceeds from sales of property, plant and equipment 25,860 2,431
Purchase of intangible assets (285,360) (391,229)
Purchase of investment securities - (1,092,684)
Proceeds from sales and redemption of investment securities 38,484 -
Other, net (6,594) (24,446)
Net cash provided by (used in) investing activities (706,489) 384,099
Cash flows from financing activities
Proceeds from share issuance to minority shareholders - 49,000
Purchase of treasury shares (447) (949)
Cash dividends paid (325,539) (325,528)
Other, net (11,831) (17,595)
Net cash provided by (used in) financing activities (337,817) (295,073)
Effect of exchange rate change on cash and cash equivalents 341,166 65,764
Net increase (decrease) in cash and cash equivalents 540,133 1,739,591
Cash and cash equivalents at beginning of period 11,766,640 12,306,774
Cash and cash equivalents at end of period 12,306,774 14,046,366

ZUKEN Inc. (6947) Financial Results for the Fiscal Year Ended March 31, 2015
17
(5) Notes to Consolidated Financial Statements
Going Concern Assumption
Not applicable.
Basis of Presenting the Consolidated Financial Statements
1. Scope of consolidation
Number of consolidated subsidiaries: 19
Name of the consolidated subsidiaries are stated in the Section “2. Corporate Group.”
In the current fiscal year, the number of consolidated subsidiaries has increased due to the establishment of DiverSync
Corporation and Zuken India Private Limited.
2. Application of equity method
(1) Number of affiliates accounted for under the equity method: 1 (Zuken Contact GmbH & Co. KG)
(2) Number of affiliates not accounted for under the equity method: 1 (Zuken Contact Verwaltungs GmbH)
Zuken Contact Verwaltungs GmbH is not included in the scope of application of the equity method since it is a small-scale
business whose net income (equity in earnings) and retained earnings (equity in earnings) have no significant effect on the
overall results of consolidated financial statements. (3) The fiscal year-end of Zuken Contact GmbH & Co. KG is different from the fiscal year-end for the consolidated financial
statements. ZUKEN Inc. (the “Company”) prepares provisional accounts for Zuken Contact GmbH & Co. KG as of the fiscal
year-end for the consolidated financial statements.
3. Fiscal year-end of consolidated subsidiaries
Among the consolidated subsidiaries, fiscal year-ends of Zuken Korea Inc., Zuken Singapore Pte. Ltd. and Zuken Taiwan Inc.
are the end of February, and fiscal year-end of Zuken Shanghai Technical Center Co., Ltd. is the end of December.
The consolidated financial statements include the financial statements of these consolidated subsidiaries as of their fiscal
year-ends. However, adjustments to the consolidated financial statements are made as needed for significant transactions at the
above four subsidiaries with different fiscal year-ends that occur between their fiscal year-ends and the fiscal year-end for the
consolidated financial statements.
4. Accounting standards
(1) Valuation standards and methods for principal assets
(a) Securities
Held-to-maturity debt securities: Stated at cost determined by the amortized cost method (straight-line method).
Available-for-sale securities
Marketable securities: Stated at fair value using quoted market price on the balance sheet date. (Unrealized gain or loss
is included in net assets. Cost of securities sold is determined by the moving-average method).
Non-marketable securities: Stated at cost determined by the moving-average method.
With respect to investments in investment partnerships (regard as marketable securities under
Article 2-2 of the Japanese Financial Instruments and Exchange Act), the net amount equivalent
to the level of equity based on the most recently available financial statements for the reporting
date specified in the partnership agreement is used.
(b) Inventories
Valued at the cost method (the book value on the balance sheet is written down to reflect the effect of lower profitability).
Merchandise: Primarily stated at cost, determined by the moving-average method.
Finished goods, work in process: Stated at cost, determined by the specific identification method at the Company and its
major consolidated subsidiaries, and stated at cost, determined by the periodic average
method at some consolidated subsidiaries.
ZUKEN Inc. (6947) Financial Results for the Fiscal Year Ended March 31, 2015
18
Raw materials: Stated at cost, determined by the moving-average method at the Company, and stated at cost, determined by
the specific identification method at major consolidated subsidiaries.
Supplies: Stated at cost, determined by the last purchased price method at the Company and its major consolidated
subsidiaries.
(2) Depreciation and amortization of significant depreciable assets
(a) Property, plant and equipment (excluding leased assets)
The Company and its domestic consolidated subsidiaries compute depreciation of buildings (excluding attached structures)
by the straight-line method, other than buildings, the declining-balance method is used. Overseas consolidated subsidiaries
compute depreciation mainly by the straight-line method.
Estimated useful lives of principle assets are as follows: Buildings and structures: 3 years to 60 years Tools, furniture and fixtures: 2 years to 20 years
(b) Intangible assets (excluding leased assets)
Software for sale at the Company and its domestic consolidated subsidiaries are amortized using the straight-line method
over the period of validity starting when sales begin (not more than three years) and software for internal use at these
companies is amortized using the straight-line method over the estimated useful lives (not more than five years).
Amortization of other intangible assets is calculated by the straight-line method. (c) Leased assets
Depreciation of finance lease transaction where there is no transfer of ownership is calculated based on the straight-line
method, assuming the lease period to be the useful lives and a residual value of zero.
For finance lease transaction where there is no transfer of ownership that started on or before March 31, 2008, the Company
uses an accounting method that is based on the method used for ordinary rental transactions.
(3) Recognition of significant allowances
(a) Allowance for doubtful accounts
To prepare for losses on doubtful accounts such as notes and account receivables-trade and loans receivable, allowances
equal to the estimated amount of uncollectible receivables are booked for general receivables based on the historical
write-off ratio, and bad receivables based on case-by-case determination of collectibility. (b) Provision for bonuses
To provide for employee bonus obligation, the Company and some consolidated subsidiaries provide an allowance at the
amount based on the estimated bonus obligations. (c) Provision for directors’ bonuses
To provide for directors’ bonuses, the Company and some consolidated subsidiaries provide an allowance at the amount
based on the estimated bonus obligations.
(4) Accounting for retirement benefit
(a) Allocation method for the estimated retirement benefit obligations
For the determination of retirement benefit obligations, the benefit formula standard is used as the method for allocating
estimated retirement payments over the period ending in the fiscal year under review. (b) Accounting for actuarial gain or loss
Actuarial gain or loss is amortized and charged to expenses in the year following the fiscal year in which such gain or loss is
recognized by the straight-line method over five years.
(5) Recognition of significant income and expenses
Recognition criteria for net sales and cost of sales of completed construction contracts
(a) The portion of contracted work deemed to have been completed by the end of the fiscal year under review
The percentage-of-completion standard (with the percentage of completion estimated on the cost-to-cost basis).

ZUKEN Inc. (6947) Financial Results for the Fiscal Year Ended March 31, 2015
19
(b) Other contracted work
The completed-contract standard.
(6) Translation of significant foreign currency-denominated assets and liabilities
Foreign currency receivables and payables are translated into Japanese yen at year-end exchange rates and resulting exchange
gains or losses are recognized in earnings currently. All assets and liabilities of overseas consolidated subsidiaries and
affiliates are translated into Japanese yen at year-end exchange rates, and income and expenses into Japanese yen at the
average of the exchange rates in effect during each fiscal period, and resulting exchange gains or losses are included in foreign
currency translation adjustments and minority interests under the net assets section.
(7) Amortization method and amortization period of goodwill
Goodwill is amortized using the straight-line method within 15 years, with the number of years determined by the origin of the
goodwill. Negative goodwill recorded due to business combinations and other events on or prior to March 31, 2010 is
amortized using the straight-line method within five years.
(8) Scope of cash and cash equivalents on consolidated statement of cash flows
Cash and cash equivalents consist of cash on hand and readily available deposits and short-term investments which can be
easily converted to cash and are exposed to little risk of change in value.
(9) Other significant accounting policies in the preparation of consolidated financial statements
(a) Accounting for consumption taxes, etc.
Consumption taxes, etc. are accounted by the tax-exclusion method.
Changes in Accounting Policies
Application of the accounting standard for retirement benefits
The Company has applied the “Accounting Standard for Retirement Benefits (Accounting Standards Board of Japan (ASBJ)
Statement No. 26, May 17, 2012)” and the “Guidance on Accounting Standard for Retirement Benefits (ASBJ Guidance No. 25,
March 26, 2015)” from the current fiscal year, for provisions set forth in the main clauses of Paragraph 35 of the Accounting
Standard for Retirement Benefits, and Paragraph 67 of the Guidance on Accounting Standard for Retirement Benefits.
Accordingly, the Company reviewed the methods for calculating retirement benefit obligations and service costs, and revised the
method of attributing estimated retirement benefit obligations to periods from the straight-line basis to the benefit formula basis.
The method of determining the discount rate for the period of bonds used for the basis of determining the discount rate has been
changed. Previously the method used the approximate number of years of expected average length of the remaining service
period of employees; the new method uses a single weighted average discount rate reflecting the estimated period and amount of
benefit payment.
For the application of this accounting standard, in accordance with the transitional accounting treatments set forth in Paragraph
37 of the Accounting Standard for Retirement Benefits, the adjustments associated with the change in calculation methods of
retirement benefit obligations and service costs are recorded in retained earnings at the beginning of the current fiscal year.
The result was a decrease of 223,232 thousand yen in net defined benefit liability, and an increase of 143,761 thousand yen in
retained earnings at the beginning of the current fiscal year. The effect of these changes on profit or loss is insignificant.
Net assets per share increased 6.18 yen.
ZUKEN Inc. (6947) Financial Results for the Fiscal Year Ended March 31, 2015
20
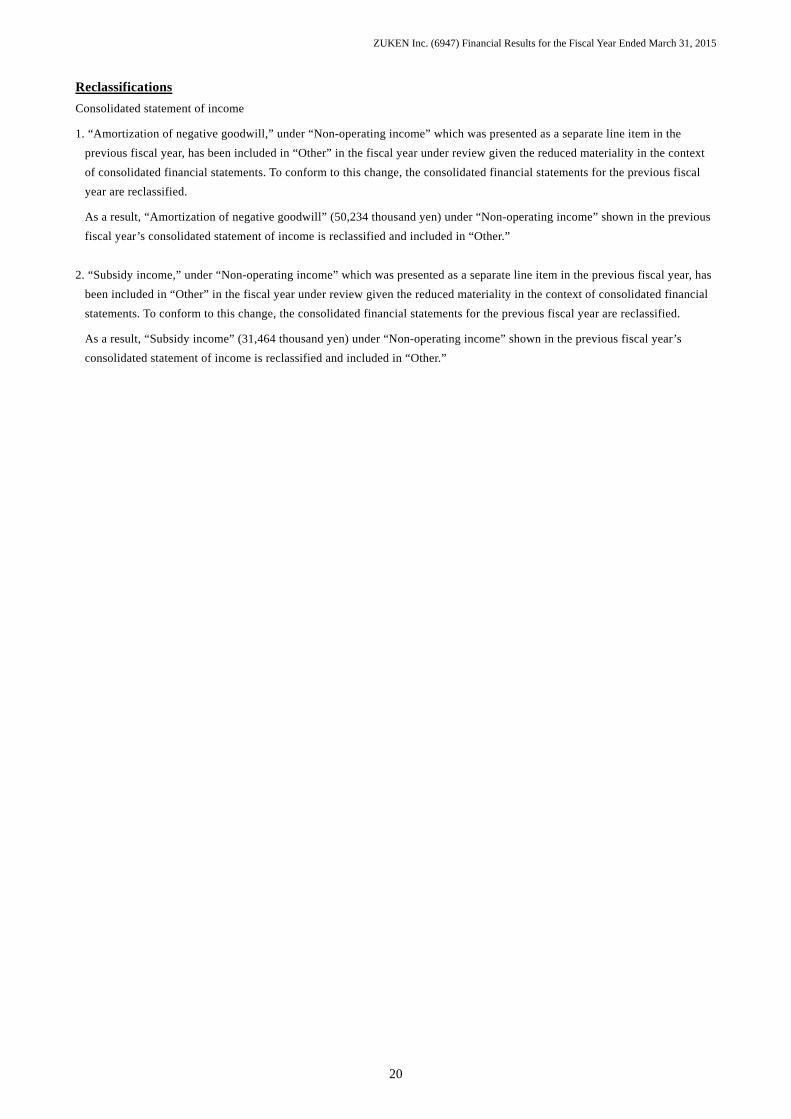
Reclassifications
Consolidated statement of income
1. “Amortization of negative goodwill,” under “Non-operating income” which was presented as a separate line item in the
previous fiscal year, has been included in “Other” in the fiscal year under review given the reduced materiality in the context
of consolidated financial statements. To conform to this change, the consolidated financial statements for the previous fiscal
year are reclassified.
As a result, “Amortization of negative goodwill” (50,234 thousand yen) under “Non-operating income” shown in the previous
fiscal year’s consolidated statement of income is reclassified and included in “Other.”
2. “Subsidy income,” under “Non-operating income” which was presented as a separate line item in the previous fiscal year, has
been included in “Other” in the fiscal year under review given the reduced materiality in the context of consolidated financial
statements. To conform to this change, the consolidated financial statements for the previous fiscal year are reclassified.
As a result, “Subsidy income” (31,464 thousand yen) under “Non-operating income” shown in the previous fiscal year’s
consolidated statement of income is reclassified and included in “Other.”
ZUKEN Inc. (6947) Financial Results for the Fiscal Year Ended March 31, 2015
21
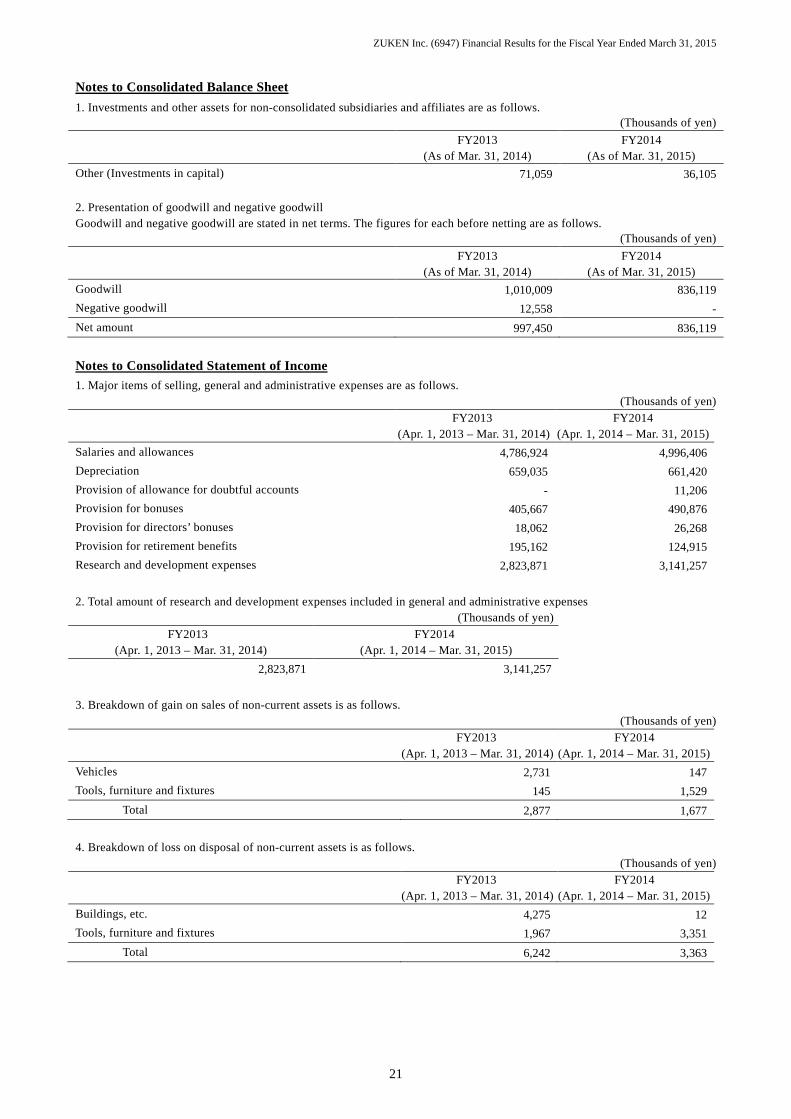
Notes to Consolidated Balance Sheet
1. Investments and other assets for non-consolidated subsidiaries and affiliates are as follows. (Thousands of yen)
FY2013
(As of Mar. 31, 2014) FY2014
(As of Mar. 31, 2015)
Other (Investments in capital) 71,059 36,105
2. Presentation of goodwill and negative goodwill Goodwill and negative goodwill are stated in net terms. The figures for each before netting are as follows.
(Thousands of yen)
FY2013
(As of Mar. 31, 2014) FY2014
(As of Mar. 31, 2015)
Goodwill 1,010,009 836,119
Negative goodwill 12,558 -
Net amount 997,450 836,119
Notes to Consolidated Statement of Income 1. Major items of selling, general and administrative expenses are as follows.
(Thousands of yen)
FY2013
(Apr. 1, 2013 – Mar. 31, 2014) FY2014
(Apr. 1, 2014 – Mar. 31, 2015)
Salaries and allowances 4,786,924 4,996,406
Depreciation 659,035 661,420
Provision of allowance for doubtful accounts - 11,206
Provision for bonuses 405,667 490,876
Provision for directors’ bonuses 18,062 26,268
Provision for retirement benefits 195,162 124,915
Research and development expenses 2,823,871 3,141,257
2. Total amount of research and development expenses included in general and administrative expenses
(Thousands of yen) FY2013
(Apr. 1, 2013 – Mar. 31, 2014) FY2014
(Apr. 1, 2014 – Mar. 31, 2015)
2,823,871 3,141,257
3. Breakdown of gain on sales of non-current assets is as follows.
(Thousands of yen)
FY2013 (Apr. 1, 2013 – Mar. 31, 2014)
FY2014 (Apr. 1, 2014 – Mar. 31, 2015)
Vehicles 2,731 147
Tools, furniture and fixtures 145 1,529
Total 2,877 1,677
4. Breakdown of loss on disposal of non-current assets is as follows. (Thousands of yen)
FY2013 (Apr. 1, 2013 – Mar. 31, 2014)
FY2014 (Apr. 1, 2014 – Mar. 31, 2015)
Buildings, etc. 4,275 12
Tools, furniture and fixtures 1,967 3,351
Total 6,242 3,363

ZUKEN Inc. (6947) Financial Results for the Fiscal Year Ended March 31, 2015
22
Notes to Consolidated Statement of Comprehensive Income Re-classification adjustments and tax effect with respect to other comprehensive income
(Thousands of yen) FY2013
(Apr. 1, 2013 – Mar. 31, 2014) FY2014
(Apr. 1, 2014 – Mar. 31, 2015) Valuation difference on available-for-sale securities:
Amount incurred during the period 17,056 508,794 Re-classification adjustments 1,875 -
Before tax effect adjustments 18,931 508,794 Tax effect (6,739) (155,042) Valuation difference on available-for-sale securities 12,191 353,752
Foreign currency translation adjustment: Amount incurred during the period 225,284 (127,061)
Remeasurements of defined benefit plans, net of tax Amount incurred during the period - (237,641) Re-classification adjustments - 341,737
Before tax effect adjustments - 104,095 Tax effect - (10,127) Remeasurements of defined benefit plans, net of tax - 93,968
Share of other comprehensive income of associates accounted for using equity method
Amount incurred during the period 12,866 (3,653) Total other comprehensive income 250,342 317,004
Notes to Consolidated Statement of Changes in Equity
FY2013 (Apr. 1, 2013 – Mar. 31, 2014)
1. Type of share and number of shares of outstanding shares and treasury shares (Shares)
Number of shares as of Apr. 1, 2013
Increase Decrease Number of shares
as of Mar. 31, 2014
Outstanding shares
Common stock 23,267,169 - - 23,267,169
Total 23,267,169 - - 23,267,169
Treasury shares
Common stock (Note) 14,299 570 - 14,869
Total 14,299 570 - 14,869
Note: Number of treasury shares of common stock increased 570 shares due to the acquisition of odd-lot shares.
2. Dividends
(1) Dividend payment
Resolution Type of share Total dividends
(Thousands of yen) Dividend per share (Yen)
Record date Effective date
General Shareholders’ Meeting on Jun. 27, 2013
Common stock 162,770 7 Mar. 31, 2013 Jun. 28, 2013
Board of Directors’ meeting on Nov. 5, 2013
Common stock 162,769 7 Sep. 30, 2013 Dec. 3, 2013
(2) Dividends with a record date in the fiscal year under review but an effective date in the following fiscal year
Resolution Type of share
Total dividends (Thousands of yen)
Source of funds
Dividend per share (Yen)
Record date Effective date
General Shareholders’ Meeting on Jun. 27, 2014
Common stock
162,766 Retained earnings
7 Mar. 31, 2014 Jun. 30, 2014
ZUKEN Inc. (6947) Financial Results for the Fiscal Year Ended March 31, 2015
23
FY2014 (Apr. 1, 2014 – Mar. 31, 2015)
1. Type of share and number of shares of outstanding shares and treasury shares (Shares)
Number of shares as of Apr. 1, 2014
Increase Decrease Number of shares
as of Mar. 31, 2015
Outstanding shares
Common stock 23,267,169 - - 23,267,169
Total 23,267,169 - - 23,267,169
Treasury shares
Common stock (Note) 14,869 967 - 15,836
Total 14,869 967 - 15,836
Note: Number of treasury shares of common stock increased 967 shares due to the acquisition of odd-lot shares.
2. Dividends
(1) Dividend payment
Resolution Type of share Total dividends
(Thousands of yen) Dividend per share (Yen)
Record date Effective date
General Shareholders’ Meeting on Jun. 27, 2014
Common stock 162,766 7 Mar. 31, 2014 Jun. 30, 2014
Board of Directors’ meeting on Nov. 4, 2014
Common stock 162,762 7 Sep. 30, 2014 Dec. 2, 2014
(2) Dividends with a record date in the fiscal year under review but an effective date in the following fiscal year
Resolution Type of share
Total dividends (Thousands of yen)
Source of funds
Dividend per share (Yen)
Record date Effective date
General Shareholders’ Meeting on Jun. 26, 2015
Common stock
232,513 Retained earnings
10 Mar. 31, 2015 Jun. 29, 2015
Notes to Consolidated Statement of Cash Flows
1. Reconciliation of cash and cash equivalents at end of period and amount of consolidated balance sheet is made as follows. (Thousands of yen)
FY2013
(Apr. 1, 2013 – Mar. 31, 2014) FY2014
(Apr. 1, 2014 – Mar. 31, 2015)
Cash and deposits 5,071,935 5,252,859
Short-term investments included in securities account 7,488,834 8,972,818
Time deposit with maturities over three months (253,995) (179,312)
Cash and cash equivalents 12,306,774 14,046,366
ZUKEN Inc. (6947) Financial Results for the Fiscal Year Ended March 31, 2015
24
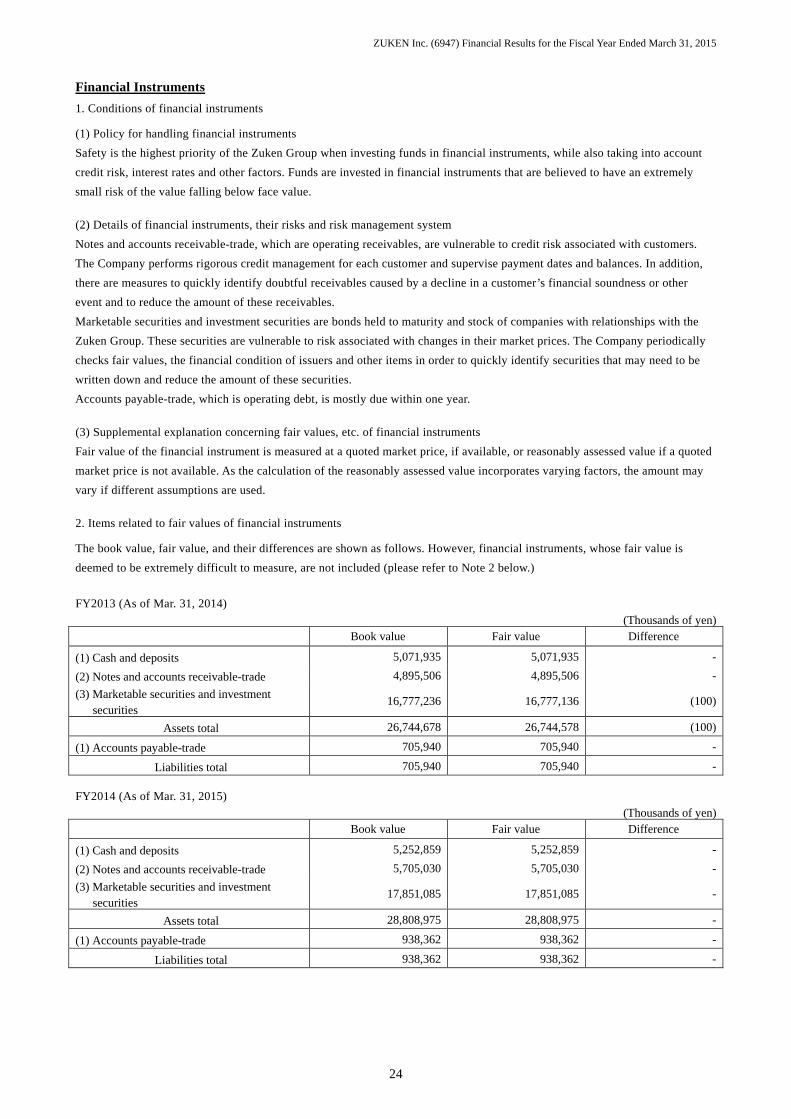
Financial Instruments
1. Conditions of financial instruments
(1) Policy for handling financial instruments
Safety is the highest priority of the Zuken Group when investing funds in financial instruments, while also taking into account
credit risk, interest rates and other factors. Funds are invested in financial instruments that are believed to have an extremely
small risk of the value falling below face value. (2) Details of financial instruments, their risks and risk management system
Notes and accounts receivable-trade, which are operating receivables, are vulnerable to credit risk associated with customers.
The Company performs rigorous credit management for each customer and supervise payment dates and balances. In addition,
there are measures to quickly identify doubtful receivables caused by a decline in a customer’s financial soundness or other
event and to reduce the amount of these receivables.
Marketable securities and investment securities are bonds held to maturity and stock of companies with relationships with the
Zuken Group. These securities are vulnerable to risk associated with changes in their market prices. The Company periodically
checks fair values, the financial condition of issuers and other items in order to quickly identify securities that may need to be
written down and reduce the amount of these securities.
Accounts payable-trade, which is operating debt, is mostly due within one year.
(3) Supplemental explanation concerning fair values, etc. of financial instruments
Fair value of the financial instrument is measured at a quoted market price, if available, or reasonably assessed value if a quoted
market price is not available. As the calculation of the reasonably assessed value incorporates varying factors, the amount may
vary if different assumptions are used. 2. Items related to fair values of financial instruments
The book value, fair value, and their differences are shown as follows. However, financial instruments, whose fair value is
deemed to be extremely difficult to measure, are not included (please refer to Note 2 below.)
FY2013 (As of Mar. 31, 2014)
(Thousands of yen)
Book value Fair value Difference
(1) Cash and deposits 5,071,935 5,071,935 -
(2) Notes and accounts receivable-trade 4,895,506 4,895,506 -
(3) Marketable securities and investment securities
16,777,236 16,777,136 (100)
Assets total 26,744,678 26,744,578 (100)
(1) Accounts payable-trade 705,940 705,940 -
Liabilities total 705,940 705,940 - FY2014 (As of Mar. 31, 2015)
(Thousands of yen)
Book value Fair value Difference
(1) Cash and deposits 5,252,859 5,252,859 -
(2) Notes and accounts receivable-trade 5,705,030 5,705,030 -
(3) Marketable securities and investment securities
17,851,085 17,851,085 -
Assets total 28,808,975 28,808,975 -
(1) Accounts payable-trade 938,362 938,362 -
Liabilities total 938,362 938,362 -
ZUKEN Inc. (6947) Financial Results for the Fiscal Year Ended March 31, 2015
25
Notes 1. Matters concerning determination of fair value of financial instruments and marketable securities
Assets
(1) Cash and deposits, and (2) Notes and accounts receivable-trade
Fair value of the financial instruments in these categories is deemed to be equal to their carrying amount.
(3) Marketable securities and investment securities
For fair value of the financial instruments in these categories, stocks are valued based on their prices on securities exchanges. Bonds are valued based on securities exchange prices or prices provided by financial institutions. Please refer to the section “Marketable Securities” for information about securities categorized by purpose.
Liabilities
(1) Accounts payable-trade
Fair value of the financial instrument in this category is deemed to be equal to their carrying amount because they are settled within a short period of time.
2. Financial instruments whose fair values are deemed to be extremely difficult to measure.
(Thousands of yen)
Item FY2013
(As of Mar. 31, 2014) FY2014
(As of Mar. 31, 2015)
Unlisted stocks 306,063 315,135
Investment in partnership 32,964 24,141
Investments in capital of subsidiaries and associates 71,059 36,105
These instruments are not included in the above table because there are no market prices and the fair values are deemed to be extremely difficult to measure.
3. Balance of money claims and marketable securities with maturity scheduled to be redeemed in the subsequent fiscal years
FY2013 (As of Mar. 31, 2014) (Thousands of yen)
Due within one
year One to five years Five to ten years Over ten years
Cash and deposits 5,071,935 - - -
Notes and accounts receivable-trade 4,895,506 - - -
Marketable securities and investment securities
Held-to-maturity debt securities
Government bonds 2,000,000 - - -
Total 11,967,441 - - -
FY2014 (As of Mar. 31, 2015) (Thousands of yen)
Due within one
year One to five years Five to ten years Over ten years
Cash and deposits 5,252,859 - - -
Notes and accounts receivable-trade 5,705,030 - - -
Total 10,957,889 - - -
ZUKEN Inc. (6947) Financial Results for the Fiscal Year Ended March 31, 2015
26
Marketable Securities
1. Held-to-maturity debt securities
FY2013 (As of Mar. 31, 2014)
(Thousands of yen)
Type Book value Fair value Unrealized gains (losses)
Securities with fair value exceeds book value
Government bonds - - -
Sub-total - - -
Securities with fair value not exceeding book value
Government bonds 1,999,700 1,999,600 (100)
Sub-total 1,999,700 1,999,600 (100)
Total 1,999,700 1,999,600 (100)
FY2014 (As of Mar. 31, 2015)
Not applicable.
2. Available-for-sale securities
FY2013 (As of Mar. 31, 2014)
(Thousands of yen)
Type Book value Acquisition cost Unrealized gains (losses)
Securities with book value exceeds acquisition cost
(1) Shares 588,702 97,677 491,024
(2) Bonds - - -
(3) Others - - -
Sub-total 588,702 97,677 491,024
Securities with book value not exceeding acquisition cost
(1) Shares - - -
(2) Bonds - - -
(3) Others 14,188,834 14,188,834 -
Sub-total 14,188,834 14,188,834 -
Total 14,777,536 14,286,511 491,024
Note: Unlisted stocks (book value of 306,063 thousand yen) and investment in partnership (book value of 32,964 thousand yen) are not included in available-for-sale securities in the above table because there are no market prices and the fair values are deemed to be extremely difficult to measure.

ZUKEN Inc. (6947) Financial Results for the Fiscal Year Ended March 31, 2015
27
FY2014 (As of Mar. 31, 2015)
(Thousands of yen)
Type Book value Acquisition cost Unrealized gains (losses)
Securities with book value exceeds acquisition cost
(1) Shares 2,178,266 1,181,362 996,904
(2) Bonds - - -
(3) Others - - -
Sub-total 2,178,266 1,181,362 996,904
Securities with book value not exceeding acquisition cost
(1) Shares - - -
(2) Bonds - - -
(3) Others 15,672,818 15,672,818 -
Sub-total 15,672,818 15,672,818 -
Total 17,851,085 16,854,180 996,904
Note: Unlisted stocks (book value of 315,135 thousand yen) and investment in partnership (book value of 24,141 thousand yen) are not included in available-for-sale securities in the above table because there are no market prices and the fair values are deemed to be extremely difficult to measure.
3. Available-for-sale securities sold
FY2013 (Apr. 1, 2013 – Mar. 31, 2014)
(Thousands of yen)
Type Sales amount Aggregate gains Aggregate losses
(1) Shares 9,715 1,875 -
(2) Bonds - - -
(3) Others - - -
Total 9,715 1,875 -
FY2014 (Apr. 1, 2014 – Mar. 31, 2015)
Not applicable.

ZUKEN Inc. (6947) Financial Results for the Fiscal Year Ended March 31, 2015
28
Segment Information
1. General information about reportable segments
Reportable segments of the Zuken Group are based on the group’s components from which financial information
can be obtained separately, so that CEO can judge how to distribute management resources and to evaluate its
performance.
The group is engaged in solutions business including research and development, manufacturing and sales activities
involving processes from design to production in related client services especially in electronics, automotive, and
industrial equipment manufacturing sectors. In the domestic market, the Company and its domestic subsidiaries are
in charge and in overseas, each sales subsidiary which is an independent management unit in each country is in
charge in Europe (mainly UK, Germany, France) and USA, Asia (mainly Korea, Singapore, China).
Therefore, the group consist of segments based on the sales structure. Reportable segments are divided into
following four areas: Japan, Europe, Americas, and Asia. Each reportable segment consists of sales of solutions for
processes extending from designs to production and related client services especially in electronics, automotive, and
industrial equipment manufacturing sectors.
Starting in FY2014, the reportable segments have been revised for the purpose of providing financial information that
more accurately reflects the operations of the ZUKEN Group.
In previous fiscal years, there were three reportable segments: Japan, Europe & Americas, and Asia. Now that the U.S.
subsidiary is no longer under the oversight of the subsidiary in Germany, there are four segments: Japan, Europe,
Americas and Asia.
The segment information for FY2013 is prepared and disclosed based on the reportable segment structure after the
revision.
2. Basis of measurement for net sales, profit or loss, segment assets, and other material items for each reportable
segment
The accounting treatment methods for reportable segments are the same as those listed in the section “Basis of
Presenting the Consolidated Financial Statements.”
Profits for reportable segments are operating income figures in the consolidated statement of income.
Intersegment sales or transfers are based on market price.

ZUKEN Inc. (6947) Financial Results for the Fiscal Year Ended March 31, 2015
29
3. Information about net sales, profit or loss, segment assets, and other material items for reportable each segment
FY2013 (Apr. 1, 2013 – Mar. 31, 2014)
(Thousands of yen)
Reportable segment Adjustment
amount (Note 1)
Appropriated amount in the consolidated
financial statements (Note 2)
Japan Europe Americas Asia Total
Net sales
Sales to third parties 13,610,527 4,040,663 1,050,310 1,071,353 19,772,854 - 19,772,854
Intersegment sales or transfers 707,798 673,835 53,077 84,230 1,518,942 (1,518,942) -
Total 14,318,325 4,714,499 1,103,387 1,155,584 21,291,796 (1,518,942) 19,772,854
Segment profit (loss) 574,024 (117,241) (97,625) 261,774 620,932 9,308 630,240
Segment assets 16,655,122 5,190,649 689,311 1,513,267 24,048,351 14,797,826 38,846,177
Other items
Depreciation and amortization 602,923 115,089 11,150 13,262 742,426 (3,879) 738,546
Amortization of goodwill - 129,574 - - 129,574 - 129,574
Investment on companies accounted for using equity method
- 69,511 - - 69,511 - 69,511
Increase in property, plant and equipment and intangible assets
474,090 150,047 11,010 3,568 638,716 - 638,716
Notes: 1. Contents of adjustments are as follows. (1) Adjustment amount in segment profit (or loss) includes amount of 9,308 thousand yen eliminated for intersegment
transactions. (2) Adjustment amount in segment assets includes amount of -2,229,656 thousand yen eliminated for intersegment
transactions and total company assets of 17,027,482 thousand yen. The total company assets are mainly composed of surplus funds (cash and deposits and marketable securities), and long-term invested assets (investment securities) of the Company.
(3) Adjustment amount of depreciation and amortization includes amount of -3,879 thousand yen eliminated for intersegment transactions.
2. Segment profit (loss) is adjusted with operating income in the consolidated statement of income.
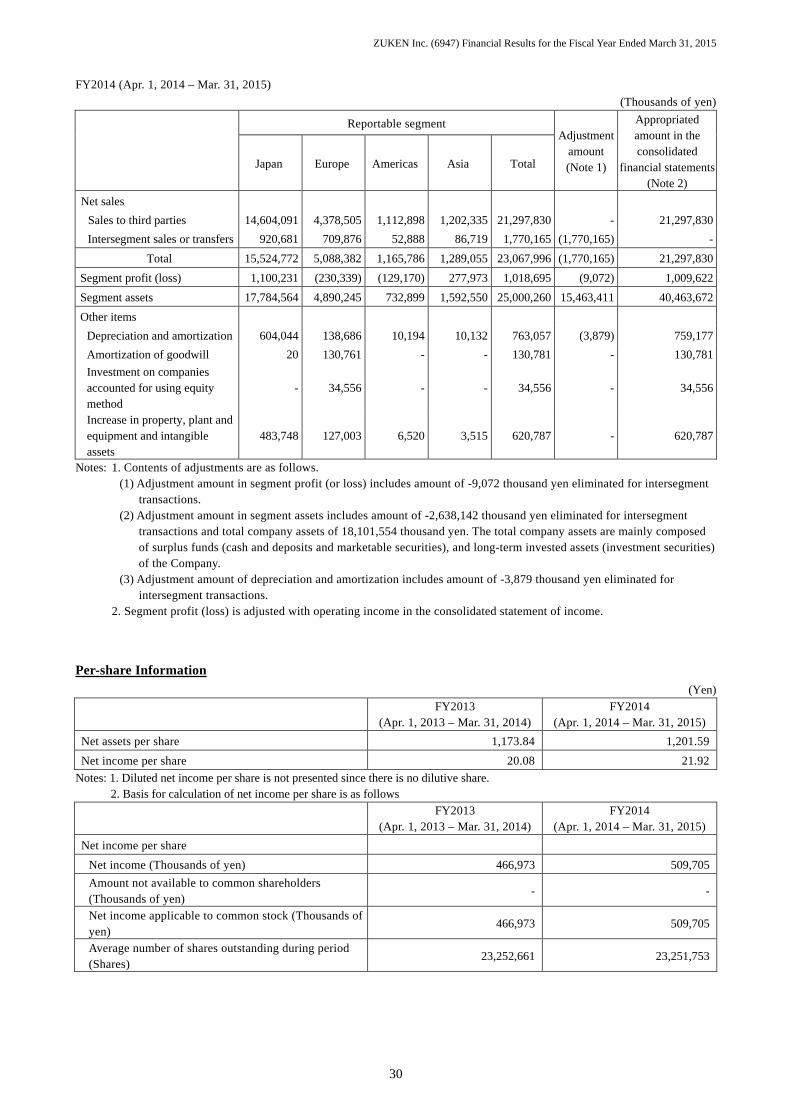
ZUKEN Inc. (6947) Financial Results for the Fiscal Year Ended March 31, 2015
30
FY2014 (Apr. 1, 2014 – Mar. 31, 2015)
(Thousands of yen)
Reportable segment Adjustment
amount (Note 1)
Appropriated amount in the consolidated
financial statements (Note 2)
Japan Europe Americas Asia Total
Net sales
Sales to third parties 14,604,091 4,378,505 1,112,898 1,202,335 21,297,830 - 21,297,830
Intersegment sales or transfers 920,681 709,876 52,888 86,719 1,770,165 (1,770,165) -
Total 15,524,772 5,088,382 1,165,786 1,289,055 23,067,996 (1,770,165) 21,297,830
Segment profit (loss) 1,100,231 (230,339) (129,170) 277,973 1,018,695 (9,072) 1,009,622
Segment assets 17,784,564 4,890,245 732,899 1,592,550 25,000,260 15,463,411 40,463,672
Other items
Depreciation and amortization 604,044 138,686 10,194 10,132 763,057 (3,879) 759,177
Amortization of goodwill 20 130,761 - - 130,781 - 130,781
Investment on companies accounted for using equity method
- 34,556 - - 34,556 - 34,556
Increase in property, plant and equipment and intangible assets
483,748 127,003 6,520 3,515 620,787 - 620,787
Notes: 1. Contents of adjustments are as follows. (1) Adjustment amount in segment profit (or loss) includes amount of -9,072 thousand yen eliminated for intersegment
transactions. (2) Adjustment amount in segment assets includes amount of -2,638,142 thousand yen eliminated for intersegment
transactions and total company assets of 18,101,554 thousand yen. The total company assets are mainly composed of surplus funds (cash and deposits and marketable securities), and long-term invested assets (investment securities) of the Company.
(3) Adjustment amount of depreciation and amortization includes amount of -3,879 thousand yen eliminated for intersegment transactions.
2. Segment profit (loss) is adjusted with operating income in the consolidated statement of income.
Per-share Information (Yen)
FY2013
(Apr. 1, 2013 – Mar. 31, 2014) FY2014
(Apr. 1, 2014 – Mar. 31, 2015)
Net assets per share 1,173.84 1,201.59
Net income per share 20.08 21.92
Notes: 1. Diluted net income per share is not presented since there is no dilutive share. 2. Basis for calculation of net income per share is as follows
FY2013
(Apr. 1, 2013 – Mar. 31, 2014) FY2014
(Apr. 1, 2014 – Mar. 31, 2015)
Net income per share
Net income (Thousands of yen) 466,973 509,705
Amount not available to common shareholders (Thousands of yen)
- -
Net income applicable to common stock (Thousands of yen)
466,973 509,705
Average number of shares outstanding during period (Shares)
23,252,661 23,251,753

ZUKEN Inc. (6947) Financial Results for the Fiscal Year Ended March 31, 2015
31
Subsequent Events
Not applicable.
Omission of Disclosure
Disclosure of the notes on leases, derivatives, retirement benefits, stock options, deferred tax accounting, business combinations,
asset retirement obligations, rental and other properties, and related party information was omitted since the disclosure of these
information are not significant in the context of the summary of financial results.
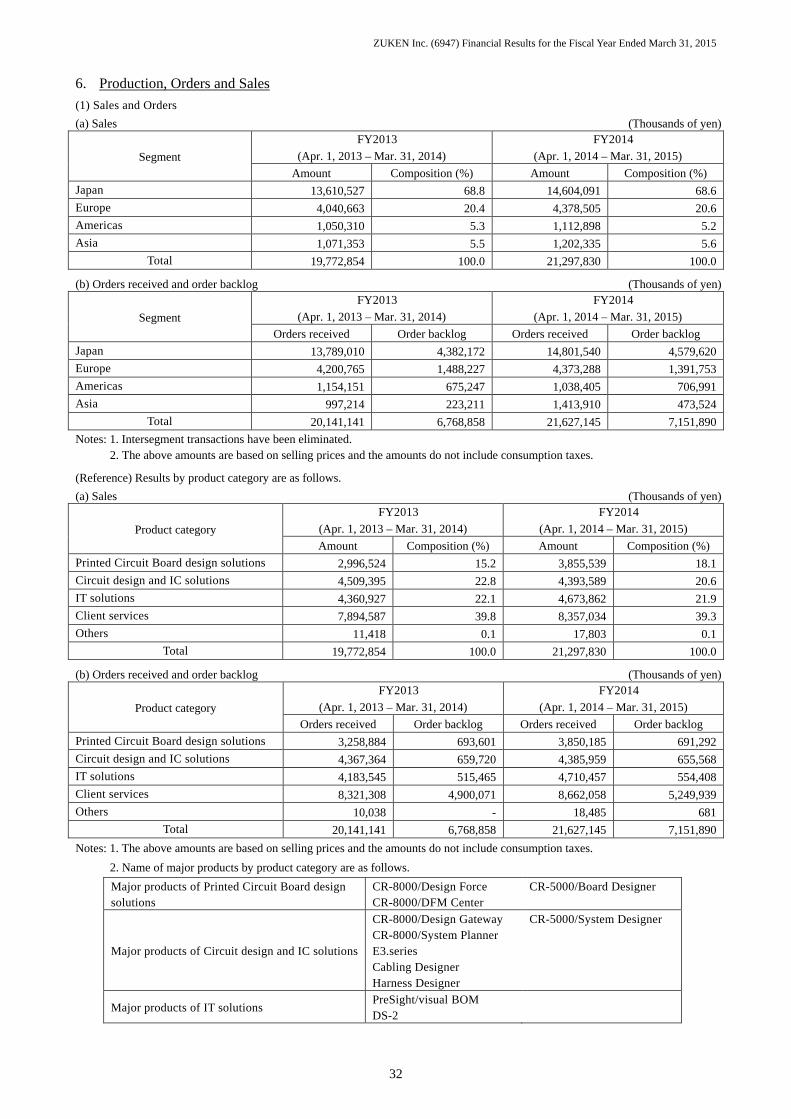
ZUKEN Inc. (6947) Financial Results for the Fiscal Year Ended March 31, 2015
32
6. Production, Orders and Sales
(1) Sales and Orders
(a) Sales (Thousands of yen)
Segment
FY2013
(Apr. 1, 2013 – Mar. 31, 2014)
FY2014
(Apr. 1, 2014 – Mar. 31, 2015)
Amount Composition (%) Amount Composition (%) Japan 13,610,527 68.8 14,604,091 68.6
Europe 4,040,663 20.4 4,378,505 20.6
Americas 1,050,310 5.3 1,112,898 5.2
Asia 1,071,353 5.5 1,202,335 5.6
Total 19,772,854 100.0 21,297,830 100.0
(b) Orders received and order backlog (Thousands of yen)
Segment
FY2013
(Apr. 1, 2013 – Mar. 31, 2014)
FY2014
(Apr. 1, 2014 – Mar. 31, 2015)
Orders received Order backlog Orders received Order backlog
Japan 13,789,010 4,382,172 14,801,540 4,579,620 Europe 4,200,765 1,488,227 4,373,288 1,391,753
Americas 1,154,151 675,247 1,038,405 706,991
Asia 997,214 223,211 1,413,910 473,524
Total 20,141,141 6,768,858 21,627,145 7,151,890
Notes: 1. Intersegment transactions have been eliminated. 2. The above amounts are based on selling prices and the amounts do not include consumption taxes.
(Reference) Results by product category are as follows.
(a) Sales (Thousands of yen)
Product category
FY2013
(Apr. 1, 2013 – Mar. 31, 2014)
FY2014
(Apr. 1, 2014 – Mar. 31, 2015)
Amount Composition (%) Amount Composition (%)
Printed Circuit Board design solutions 2,996,524 15.2 3,855,539 18.1
Circuit design and IC solutions 4,509,395 22.8 4,393,589 20.6
IT solutions 4,360,927 22.1 4,673,862 21.9
Client services 7,894,587 39.8 8,357,034 39.3
Others 11,418 0.1 17,803 0.1 Total 19,772,854 100.0 21,297,830 100.0
(b) Orders received and order backlog (Thousands of yen)
Product category
FY2013
(Apr. 1, 2013 – Mar. 31, 2014)
FY2014
(Apr. 1, 2014 – Mar. 31, 2015)
Orders received Order backlog Orders received Order backlog
Printed Circuit Board design solutions 3,258,884 693,601 3,850,185 691,292
Circuit design and IC solutions 4,367,364 659,720 4,385,959 655,568
IT solutions 4,183,545 515,465 4,710,457 554,408
Client services 8,321,308 4,900,071 8,662,058 5,249,939
Others 10,038 - 18,485 681 Total 20,141,141 6,768,858 21,627,145 7,151,890
Notes: 1. The above amounts are based on selling prices and the amounts do not include consumption taxes.
2. Name of major products by product category are as follows.
Major products of Printed Circuit Board design solutions
CR-8000/Design Force CR-8000/DFM Center
CR-5000/Board Designer
Major products of Circuit design and IC solutions
CR-8000/Design Gateway CR-8000/System Planner E3.series Cabling Designer Harness Designer
CR-5000/System Designer
Major products of IT solutions PreSight/visual BOM DS-2

ZUKEN Inc. (6947) Financial Results for the Fiscal Year Ended March 31, 2015
33
7. Non-consolidated Financial Statements (1) Balance Sheet
(Thousands of yen)
FY2013
(As of Mar. 31, 2014) FY2014
(As of Mar. 31, 2015)
Assets
Current assets
Cash and deposits 1,059,545 1,069,484
Notes receivable-trade 139,446 117,801
Accounts receivable-trade 2,473,112 3,358,892
Securities 16,125,384 15,633,783
Inventories 25,743 48,349
Deferred tax assets 216,401 199,224
Other 189,395 209,882
Allowance for doubtful accounts (780) (690)
Total current assets 20,228,249 20,636,728
Non-current assets
Property, plant and equipment
Buildings 3,006,985 2,906,948
Structures 49,022 45,959
Vehicles 13,845 8,827
Tools, furniture and fixtures 112,729 118,554
Land 3,009,559 3,009,559
Leased assets 11,641 12,608
Total property, plant and equipment 6,203,783 6,102,456
Intangible assets
Other 555,548 557,022
Total intangible assets 555,548 557,022
Investments and other assets
Investment securities 902,098 2,467,771
Stocks of subsidiaries and affiliates 816,409 917,593
Investments in capital of subsidiaries and affiliates 739,946 739,946
Long-term trade accounts receivables from subsidiaries 602,336 864,847
Deferred tax assets 606,661 361,215
Other 401,648 336,271
Allowance for doubtful accounts (7,824) (12,966)
Total investments and other assets 4,061,277 5,674,679
Total non-current assets 10,820,609 12,334,158
Total assets 31,048,858 32,970,887

ZUKEN Inc. (6947) Financial Results for the Fiscal Year Ended March 31, 2015
34
(Thousands of yen)
FY2013
(As of Mar. 31, 2014) FY2014
(As of Mar. 31, 2015)
Liabilities
Current liabilities
Accounts payable-trade 473,996 751,535
Accounts payable-other 413,361 645,333
Income taxes payable 193,940 246,204
Advances received 473,869 502,476
Provision for bonuses 334,000 357,710
Provision for directors’ bonuses 15,000 23,000
Other 189,131 198,487
Total current liabilities 2,093,299 2,724,749
Non-current liabilities
Provision for retirement benefits 2,188,795 2,135,081
Provision for loss on business of subsidiaries and affiliates 49,000 217,000
Long-term accounts payable-other 104,850 104,850
Other 18,694 19,319
Total non-current liabilities 2,361,340 2,476,250
Total liabilities 4,454,639 5,200,999
Net assets
Shareholders’ equity
Capital stock 10,117,065 10,117,065
Capital surplus
Legal capital surplus 8,657,753 8,657,753
Total capital surpluses 8,657,753 8,657,753
Retained earnings
Legal retained earnings 311,082 311,082
Other retained earnings
General reserve 6,325,000 6,325,000
Retained earnings brought forward 878,006 1,700,871
Total retained earnings 7,514,088 8,336,954
Treasury shares (13,209) (14,159)
Total shareholders’ equity 26,275,697 27,097,613
Valuation and translation adjustments
Valuation difference on available-for-sale securities 318,521 672,273
Total valuation and translation adjustments 318,521 672,273
Total net assets 26,594,219 27,769,887
Total liabilities and net assets 31,048,858 32,970,887

ZUKEN Inc. (6947) Financial Results for the Fiscal Year Ended March 31, 2015
35
(2) Statement of Income (Thousands of yen)
FY2013
(Apr. 1, 2013 – Mar. 31, 2014) FY2014
(Apr. 1, 2014 – Mar. 31, 2015)
Net sales 9,372,479 10,567,902
Cost of sales 2,425,096 3,044,193
Gross profit 6,947,383 7,523,708
Selling, general and administrative expenses 6,626,295 6,746,701
Operating income 321,088 777,006
Non-operating income
Interest income 96 70
Interest on securities 14,252 11,760
Dividend income 157,234 616,841
Foreign exchange gains 118,403 53,402
Rent income 144,704 153,479
Other 23,718 26,346
Total non-operating income 458,409 861,900
Non-operating expenses
Rent cost of real estate 17,358 16,463
Taxes and dues - 11,596
Loss on investments in partnership 10,260 -
Other 503 348
Total non-operating expenses 28,122 28,408
Ordinary income 751,374 1,610,498
Extraordinary income
Gain on sales of non-current assets 2,259 -
Transfer of rights income 73,824 -
Total extraordinary income 76,083 -
Extraordinary losses
Loss on disposal of non-current assets 2,920 479
Provision for loss on business of subsidiaries and associates 36,000 168,000
Provision of allowance for doubtful accounts of golf club membership
- 5,200
Total extraordinary losses 38,920 173,679
Income before income taxes 788,538 1,436,819
Income taxes-current 218,415 337,208
Income taxes-deferred 43,905 51,915
Total income taxes 262,321 389,124
Net income 526,216 1,047,695

ZUKEN Inc. (6947) Financial Results for the Fiscal Year Ended March 31, 2015
36
(3) Statement of Changes in Equity FY2013 (Apr. 1, 2013 – Mar. 31, 2014)
(Thousands of yen)
Shareholders’ equity
Capital stock
Capital surplus Retained earnings
Legal capital surplus
Total capital surplus
Legal retained earnings
Other retained earnings
Total retained earnings General
reserve
Retained earnings brought forward
Balance at beginning of current period
10,117,065 8,657,753 8,657,753 311,082 6,325,000 677,328 7,313,411
Cumulative effects of changes in accounting policies
Restated balance 10,117,065 8,657,753 8,657,753 311,082 6,325,000 677,328 7,313,411
Changes of items during period
Dividends of surplus (325,539) (325,539)
Net income 526,216 526,216
Purchase of treasury shares
Net changes of items other than shareholders’ equity
Total changes of items during period
- - - - - 200,677 200,677
Balance at end of current period
10,117,065 8,657,753 8,657,753 311,082 6,325,000 878,006 7,514,088
Shareholders’ equity Valuation and translation adjustments
Total net assets Treasury shares
Total shareholders’ equity
Valuation difference on
available-for-sale securities
Total valuation and translation
adjustments
Balance at beginning of current period
(12,762) 26,075,467 306,091 306,091 26,381,559
Cumulative effects of changes in accounting policies
Restated balance (12,762) 26,075,467 306,091 306,091 26,381,559
Changes of items during period
Dividends of surplus (325,539) (325,539)
Net income 526,216 526,216
Purchase of treasury shares (447) (447) (447)
Net changes of items other than shareholders’ equity
12,429 12,429 12,429
Total changes of items during period
(447) 200,230 12,429 12,429 212,659
Balance at end of current period
(13,209) 26,275,697 318,521 318,521 26,594,219
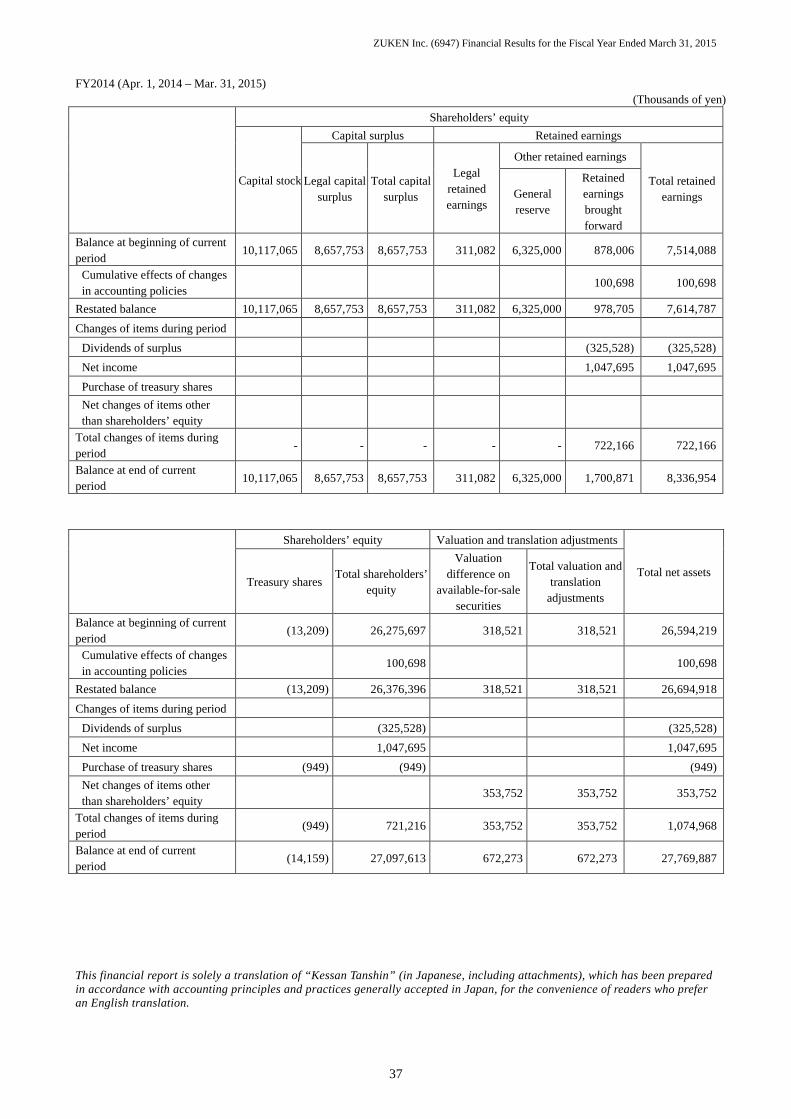
ZUKEN Inc. (6947) Financial Results for the Fiscal Year Ended March 31, 2015
37
FY2014 (Apr. 1, 2014 – Mar. 31, 2015) (Thousands of yen)
Shareholders’ equity
Capital stock
Capital surplus Retained earnings
Legal capital surplus
Total capital surplus
Legal retained earnings
Other retained earnings
Total retained earnings General
reserve
Retained earnings brought forward
Balance at beginning of current period
10,117,065 8,657,753 8,657,753 311,082 6,325,000 878,006 7,514,088
Cumulative effects of changes in accounting policies
100,698 100,698
Restated balance 10,117,065 8,657,753 8,657,753 311,082 6,325,000 978,705 7,614,787
Changes of items during period
Dividends of surplus (325,528) (325,528)
Net income 1,047,695 1,047,695
Purchase of treasury shares
Net changes of items other than shareholders’ equity
Total changes of items during period
- - - - - 722,166 722,166
Balance at end of current period
10,117,065 8,657,753 8,657,753 311,082 6,325,000 1,700,871 8,336,954
Shareholders’ equity Valuation and translation adjustments
Total net assets Treasury shares
Total shareholders’ equity
Valuation difference on
available-for-sale securities
Total valuation and translation
adjustments
Balance at beginning of current period
(13,209) 26,275,697 318,521 318,521 26,594,219
Cumulative effects of changes in accounting policies
100,698 100,698
Restated balance (13,209) 26,376,396 318,521 318,521 26,694,918
Changes of items during period
Dividends of surplus (325,528) (325,528)
Net income 1,047,695 1,047,695
Purchase of treasury shares (949) (949) (949)
Net changes of items other than shareholders’ equity
353,752 353,752 353,752
Total changes of items during period
(949) 721,216 353,752 353,752 1,074,968
Balance at end of current period
(14,159) 27,097,613 672,273 672,273 27,769,887
This financial report is solely a translation of “Kessan Tanshin” (in Japanese, including attachments), which has been prepared in accordance with accounting principles and practices generally accepted in Japan, for the convenience of readers who prefer an English translation.
Related Documents