Ambit Capital and / or its affiliates do and seek to do business including investment banking with companies covered in its research reports. As a result, investors should be aware that Ambit Capital may have a conflict of interest that could affect the objectivity of this report. Investors should not consider this report as the only factor in making their investment decision. What’s the downside? EIL’s core eps declined 70% over FY12-FY15. Delays in potential order inflows have led to margin, CFO and investor faith erosion. Adjusted for cash (60% of mcap) is now trading at `21bn, 14x FY17 core PAT; reverse DCF implies a 10-year revenue CAGR of 3%/20% EBITDA margin and a 0% perpetual growth. Whilst hydrocarbon intensity will reduce globally, India still has to invest in fuel upgrades, new-age refineries and even fertiliser plants; EIL’s talent pool and relationships with PSU OMCs (and now entry into MENA) should keep inflows trickling such as 1-2 large orders (Bina/Vizag/Euro VI upgrades) in FY17. Controlled cost structure and high operating leverage (75% utilisation) should support margin expansion to 18% in FY18 (12% in FY16). No risks to cash conversion and average 9% CFO yield at this depressed business scale offer downside protection. Turn BUYers. Competitive position: MODERATE Changes to this position: STABLE Revenue decline to stop in FY18 We see multiple order opportunities in FY17/ FY18 including inevitable fuel upgrade orders and brownfield expansions; upgrades and Bina/Vizag expansions provide `32bn for PMC opportunity vs `16bn domestic inflow since FY14-end; add to this the small opportunities in MENA (`15bn inflow). We expect 11% revenue decline in FY17 (LSTK book completion) but an 18% revenue growth in FY18 from the depressed base as consulting revenues start. Controlled cost structure—no risk to margin, ample operating leverage Most variable costs (90% of subcontracts; all material costs) are related to LSTK; even if LSTK revenue becomes nil, a 6% consulting revenue CAGR over FY15-18 can absorb 4% CAGR in overheads maintaining EBITDA margin at the FY15 level of 13%. Low utilization (75%), control over other expenses (down 2% in 9MFY16), declining employee base (~3,000 vs 3,350 in FY14) provide headroom; travel cost increase beyond 12% can be the only negative surprise. Cash is the protection EIL’s CFO/EBITDA was 118% over the last ten years and 100% last year; whilst CFO scale may have reduced conversion hasn’t. Over the last 5 years company paid 100% of CFO as dividend, invested `3bn in facilities and the balance sheet still has `86/share cash. Averaging FY16/17 CFO yields 9% CFO yield to core business (whilst business is still declining). A potential but a minor risk to the cash is unrelated investments (investing `3.4bn in a fertiliser plant). Where can we go wrong? Further delays in ordering will lead to more near-term downgrades, more so to earnings. Decline in India’s fuel needs could force diversification into segments with less expertise. Finally, there is a risk of poor capital allocation decisions (forced from Government) given high cash and low-reinvestment need. We see low probabilities of these and hence limited risk to lose money; earnings multiples based on depressed earnings should not be a dismissive deterrent. COMPANY INSIGHT ENGR IN EQUITY February 17, 2016 Engineers India BUY Engineering & Construction Recommendation Mcap (bn): `50/US$0.7 6M ADV (mn): `149/US$2.2 CMP: `148 TP (12 mths): `200 Upside (%): 35 Flags Accounting: GREEN Predictability: RED Earnings Momentum: RED Catalyst Order from Bina/ Vizag refineries to result in a 61% inflow growth in FY17E Improvement in EBITDA margins (FY17E: 15% vs 12% in FY16E) Performance (%) Source: Bloomberg, Ambit Capital Research 60 75 90 105 120 Feb-15 Apr-15 May-15 Jun-15 Aug-15 Sep-15 Nov-15 Dec-15 Feb-16 SENSEX EIL Key financials FY14 FY15E FY16E FY17E FY18E Revenue (` bn) 18.5 17.4 17.1 15.2 18.6 EBITDA margin 26.6% 13.4% 12.4% 15.4% 18.1% Core EPS (`) 9.7 4.1 3.7 4.1 6.1 RoCE 14% 5% 5% 5% 7% Cash/ share (`) 76 76 86 90 96 P/E (core; x) 7.5 17.4 16.6 14.0 8.5 EV/EBITDA (x) 5.0 10.4 9.9 8.3 5.2 Source: Company, Ambit Capital research Analyst Details Nitin Bhasin +91 22 3043 3241 [email protected] Utsav Mehta, CFA +91 22 3043 3209 [email protected]

Welcome message from author
This document is posted to help you gain knowledge. Please leave a comment to let me know what you think about it! Share it to your friends and learn new things together.
Transcript
Ambit Capital and / or its affiliates do and seek to do business including investment banking with companies covered in its research reports. As a result, investors should be aware that Ambit Capital may have a conflict of interest that could affect the objectivity of this report. Investors should not consider this report as the only factor in making their investment decision.
What’s the downside?EIL’s core eps declined 70% over FY12-FY15. Delays in potential order inflows have led to margin, CFO and investor faith erosion. Adjusted for cash (60% of mcap) is now trading at `21bn, 14x FY17 core PAT; reverse DCF implies a 10-year revenue CAGR of 3%/20% EBITDA margin and a 0% perpetual growth. Whilst hydrocarbon intensity will reduce globally, India still has to invest in fuel upgrades, new-age refineries and even fertiliser plants; EIL’s talent pool and relationships with PSU OMCs (and now entry into MENA) should keep inflows trickling such as 1-2 large orders (Bina/Vizag/Euro VI upgrades) in FY17. Controlled cost structure and high operating leverage (75% utilisation) should support margin expansion to 18% in FY18 (12% in FY16). No risks to cash conversion and average 9% CFO yield at this depressed business scale offer downside protection. Turn BUYers.
Competitive position: MODERATE Changes to this position: STABLE
Revenue decline to stop in FY18 We see multiple order opportunities in FY17/ FY18 including inevitable fuel upgrade orders and brownfield expansions; upgrades and Bina/Vizag expansions provide `32bn for PMC opportunity vs `16bn domestic inflow since FY14-end; add to this the small opportunities in MENA (`15bn inflow). We expect 11% revenue decline in FY17 (LSTK book completion) but an 18% revenue growth in FY18 from the depressed base as consulting revenues start.
Controlled cost structure—no risk to margin, ample operating leverage Most variable costs (90% of subcontracts; all material costs) are related to LSTK; even if LSTK revenue becomes nil, a 6% consulting revenue CAGR over FY15-18 can absorb 4% CAGR in overheads maintaining EBITDA margin at the FY15 level of 13%. Low utilization (75%), control over other expenses (down 2% in 9MFY16), declining employee base (~3,000 vs 3,350 in FY14) provide headroom; travel cost increase beyond 12% can be the only negative surprise.
Cash is the protection EIL’s CFO/EBITDA was 118% over the last ten years and 100% last year; whilst CFO scale may have reduced conversion hasn’t. Over the last 5 years company paid 100% of CFO as dividend, invested `3bn in facilities and the balance sheet still has `86/share cash. Averaging FY16/17 CFO yields 9% CFO yield to core business (whilst business is still declining). A potential but a minor risk to the cash is unrelated investments (investing `3.4bn in a fertiliser plant).
Where can we go wrong? Further delays in ordering will lead to more near-term downgrades, more so to earnings. Decline in India’s fuel needs could force diversification into segments with less expertise. Finally, there is a risk of poor capital allocation decisions (forced from Government) given high cash and low-reinvestment need. We see low probabilities of these and hence limited risk to lose money; earnings multiples based on depressed earnings should not be a dismissive deterrent.
COMPANY INSIGHT ENGR IN EQUITY February 17, 2016
Engineers IndiaBUY
Engineering & Construction
Recommendation Mcap (bn): `50/US$0.7 6M ADV (mn): `149/US$2.2 CMP: `148 TP (12 mths): `200 Upside (%): 35
Flags Accounting: GREEN Predictability: RED Earnings Momentum: RED
Catalyst
Order from Bina/ Vizag refineries to result in a 61% inflow growth in FY17E
Improvement in EBITDA margins (FY17E: 15% vs 12% in FY16E)
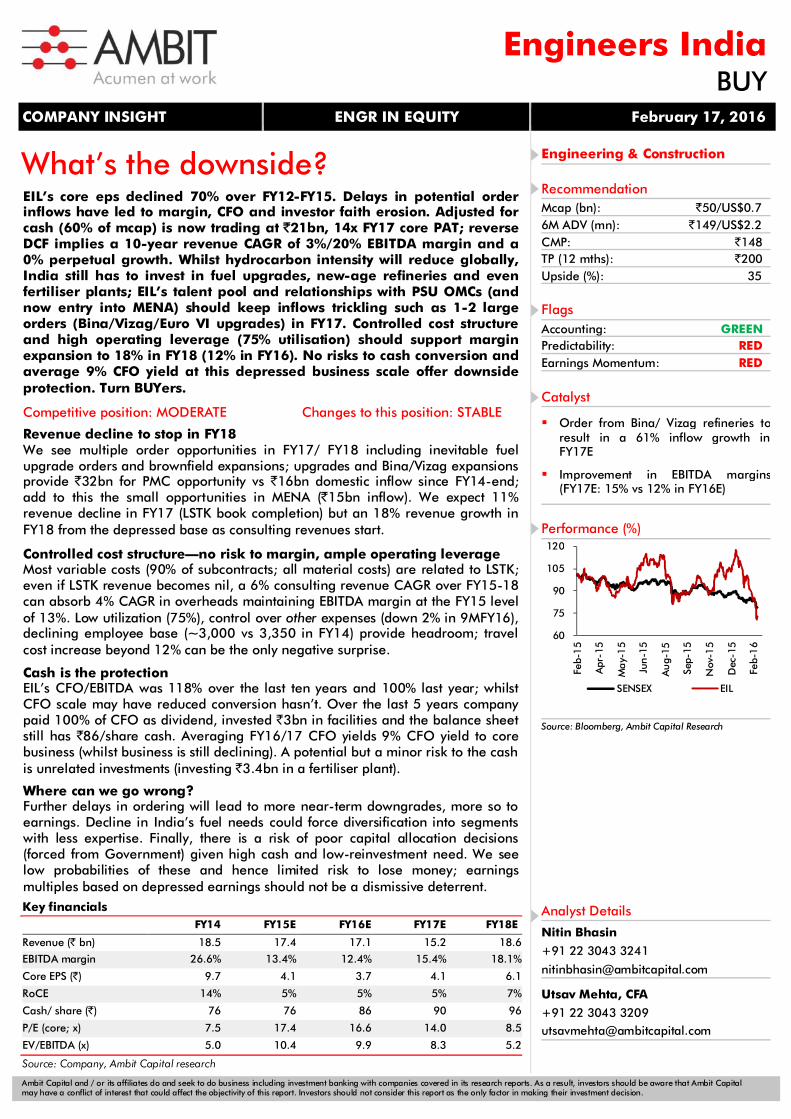
Performance (%)
Source: Bloomberg, Ambit Capital Research
60
75
90
105
120
Feb-
15
Apr
-15
Ma
y-1
5
Jun
-15
Au
g-15
Sep-
15
Nov
-15
Dec
-15
Feb-
16
SENSEX EIL
Key financials FY14 FY15E FY16E FY17E FY18E
Revenue (` bn) 18.5 17.4 17.1 15.2 18.6
EBITDA margin 26.6% 13.4% 12.4% 15.4% 18.1%
Core EPS (`) 9.7 4.1 3.7 4.1 6.1
RoCE 14% 5% 5% 5% 7%
Cash/ share (`) 76 76 86 90 96
P/E (core; x) 7.5 17.4 16.6 14.0 8.5
EV/EBITDA (x) 5.0 10.4 9.9 8.3 5.2
Source: Company, Ambit Capital research
Analyst Details
Nitin Bhasin
+91 22 3043 3241
Utsav Mehta, CFA
+91 22 3043 3209 [email protected]

Engineers India
February 17, 2016 Ambit Capital Pvt. Ltd. Page 2
Even a few will do … Order inflows should stabilize and grow from the lows of FY17 (̀ 27bn vs `17bn in FY16E and `23bn in FY15) led by capacity expansion programmes at Vizag and Bina. Although the outlook is weak due to delays in expansion projects, it will take only a few large wins to boost order book. Although OMCs are a lot more profitable since the drop in crude oil prices and have indicated significant capacity expansion plans, delay in on-ground action has led to lack of ordering. Euro-VI implementation too, is on the horizon (which will lead to aggregate capex of ~`250bn). EIL’s LSTK order book will largely be depleted in FY17 if the company doesn’t win any new orders. However, the management is confident that it can continue to win short-cycle/small sized orders to keep utilization at least at 70%; even we believe this is highly possible.
Large order inflows have been elusive despite reasonable visibility
As shown in the exhibit below, the pipeline in terms of projects seems healthy but will be impacted by uncertain timelines and delays. The company is the most confident on Bina and Vizag, which should materialize in FY17. Moreover, post completion of the Panipat refinery, IOCL may turn its attention towards expansion of Panipat/Gujarat or Mathura refineries.
Finally, investments to upgrade capacities to meet Euro-VI norms are also on the anvil (aggregate capex of `250bn); the companies will need to give forth orders in the next three months if the timelines set by the Government are to be met. Our Oil & Gas analyst is a bit more circumspect and expects the orders to be given out only towards 2HCY16.
Exhibit 1: Project pipeline of major OMCs
Project Company Size (` mn) Expansion plans Current status
Kochi PDPP BPCL 45,880 NA Likely to happen soon
Bina Refinery BPCL Phase I: 35,000 Phase II: 200,000
Phase I: 6 to 7.8mmt Phase II: 7.5mmt to 15mmt Phase II likely in FY17
Numaligarh BPCL 89,550 From 3 to 9mmt Unlikely to receive tax concessions making project unviable
Vizag refinery HPCL 184,122 From 8.3 to 15mmt Environmental clearance received
Mumbai refinery HPCL 42,000 From 6.5 to 9.5mmt BoD approval done. Awaiting environmental clearance
Panipat refinery IOCL 60,000 From 15 to 20mmt Award timeline is uncertain
Gujarat refinery IOCL 68,000 From 13.7 to 18mmt Award timeline is uncertain
Mathura refinery IOCL 87,000 From 8 to 11mmt Award timeline is uncertain
Source: Media, Ambit Capital research
There is adequate refining capacity in India. However, this capacity falls short when the private sector, which typically exports, is excluded. It is advantageous in terms of tariffs for these private companies to sell to the OMCs directly and if that model were to be followed, India will have overcapacity. To reduce the under-capacity, the PSUs have announced expansion plans, which are factored into consensus expectations as shown in exhibit 2.
Exhibit 2: Ex-private sector, which typically exports, there is a lack of capacity unless PSUs start sourcing from private sector or if private sector starts retailing themselves
(in mmt) FY14 FY15 FY16 FY17 FY18 FY19 FY20
Petroleum products demand 160 169 177 186 197 209 221
HPCL 24 24 24 26 26 32 32
BPCL 31 31 39 39 39 45 45
IOCL 54 54 69 70 70 80 80
MRPL 15 15 16 16 18 18 18
Private 80 80 80 86 86 113 113
Total 204 204 228 237 239 288 288
Surplus capacity 43 35 51 50 41 79 68
Surplus capacity (ex-pvt sector) (37) (45) (29) (36) (45) (34) (45)
Source: Ambit Capital research

Engineers India
February 17, 2016 Ambit Capital Pvt. Ltd. Page 3
Exhibit 3: Despite improving profitability, consensus expects downstream capex of `230-260bn over the next two years; a number very close to the last few years
Source: Company, Ambit Capital research
Inflows to add to FY18 visibility and not so much critical for FY17
According to the management, even if some of the large orders fructify, execution is unlikely to exceed 10%-15% of order inflows in FY17 itself; hence there is not going to be any revenue growth in FY17. We expect revenue to decline by 11% YoY in FY17 led primarily by a sharp 40% decline in LSTK revenues. Note that the LSTK order book has largely been depleted (`6.6bn as of 9MFY16, book to bill of 0.9x vs 1.7x a year ago) and barring a few orders will largely be executed in FY17.
However, the company is confident that it will be able to maintain utilization at least at 70% (currently: 75%) driven primarily by short-cycle orders and/or small sized orders. Short cycle orders such as feasibility reports typically contribute 15%-25% to the company’s consultancy revenues each year.
Exhibit 4: LSTK order book is largely depleted; there have been no order inflows thus far in FY16 in this segment
Source: Company, Ambit Capital research
Exhibit 5: Marginal growth in consulting will drive revenues henceforth
Source: Company, Ambit Capital research
Can revenues shrink another 50%? Unlikely
EIL’s revenues are unlikely to decline by another 53%, as it did between FY12-FY15. India’s dependence on oil-based products is unlikely to wither away in the next five years given the nascent electric transport ecosystem (public or private) and lack of constant power supply. Moreover, tightening of environmental norms could force further spending. Our oil & gas analyst expects fuel consumption to grow at 4%-5% CAGR over the next 5-10 years. OMCs have large expansion plans to plug the PSU under-capacity and these will likely materialize into orders, if not immediately, then eventually. Even if the demand growth was to be 2-3%, we still believe there will be enough consultancy work for upgradation.
-30%
-20%
-10%
0%
10%
20%
30%
-
50
100
150
200
250
300
FY12 FY13 FY14 FY15 FY16 FY17 FY18
Total downstream PSU capex (Rs bn) Growth (YoY)
-
0.5
1.0
1.5
2.0
-
5
10
15
20
25
30
FY12 FY13 FY14 FY15 FY16E
LSTK order book
LSTK order book (Rs bn) Book to bill (RHS)
-60%
-35%
-10%
15%
40%
-
5
10
15
20
25
30
FY12 FY13 FY14 FY15 FY16E FY17E
Revenues(` bn)
Consulting LSTKConsulting growth (RHS) LSTK growth (RHS)

Engineers India
February 17, 2016 Ambit Capital Pvt. Ltd. Page 4
A lean cost structure; can absorb low-growth Control over fixed overheads is visible in 9MFY16; though management does indicate that multiple measures to cut overheads have already fructified and hence it is unlikely that expenses can reduce henceforth (standalone employee costs plus other expenses down 2% YoY in 9MFY16). Almost all of the company’s variable expenses (subcontracting and cost of materials) can be attributed to its LSTK business, the revenues of which may become negligible if the company doesn’t win any orders in FY17. But even if this were to happen, EIL’s EBITDA margin would still be the same as at FY15 (13.4%) even if consulting revenues don’t increase beyond `11.7bn (6% CAGR over FY15) in FY18. Present low utilization rate (75%) and declining employee base will help limit costs. Hence, we believe that there is limited downside to EBITDA margin (LTM: 13%).
Limited headroom to cut the overheads more but can’t increase either
The company’s reported fixed overhead costs have declined by a higher number,; however, adjusted for the writeback of provisions, the employee and other expenses have declined by 2% in 9MFY16. Given that the company is not adding any new employees employee expenses are unlikely to increase (salary hikes will be offset by voluntary attrition and retirements). Note that its workforce is largely fungible and hence the reduced business from LSTK business should not impact employee utilization if consulting grows. Hence, fixed overheads are unlikely to increase significantly over the next year.
Exhibit 6: Adjusting for provision write-backs, the overheads are flat YoY ` mn (standalone) 9MFY16 9MFY15 % change
Revenue 12,094 12,244 -1%
Consulting 7,190 6,930 4%
LSTK 4,905 5,314 -8%
Cost of materials 3,462 1,648 110%
Subcontracting costs 1,803 2,995 -40%
Total variable costs 5,264 4,643 13%
as % of LSTK revenues 107% 87% Employee cost (a) 4,508 4,453 1%
as % of revenues 37% 36% Other expenses (net) (b) 1,115 1,948 -43%
In which: Provision for exp losses written back (c) 650 DNA NA
as % of revenues 9% 16% Fixed overheads (a+b+c) 6,274 6,400 -2%
as % of revenues 52% 52% Source: Company, Ambit Capital research
Worst case scenario analysis: `11.7bn of consulting revenue should be enough to maintain FY15 EBITDA margin
Given the limited order book, and uncertain outlook for inflows, it is possible that the company’s consulting revenues will not grow in FY17/FY18 and the LSTK revenues could shrink to a negligible amount. However, as shown in the exhibit below, we expect EBITDA margin of 13.4% (same as FY15) even in case the company is able to generate consulting revenues of `11.7bn (6% CAGR over FY15) if overheads grow at 4% CAGR (base case assumption: 9%; travel costs in-line with base case). Currently, a bulk of the variable costs (90%-95% of subcontracting costs and 100% of cost of materials) is on account of the LSTK business, according to the management. This leaves fixed costs unabsorbed which are unlikely to increase materially over the next few years. Utilisation rate is only 75% currently and the company is not recruiting thereby ensuring that the employee base shrinks through voluntary attrition and retirement. The additional growth of 20% (on FY15 revenues) can be absorbed by increasing utilization to 90%.

Engineers India
February 17, 2016 Ambit Capital Pvt. Ltd. Page 5
Exhibit 7: The company will need revenues of ̀ 11.7bn to maintain FY15 margins
` mn; consolidated FY14 FY15 FY18E Worst case FY18E base case
Revenue 18,465 17,412 11,748 18,601
Consulting 11,320 9,762 11,748 13,691
LSTK 7,145 7,650 - 4,909
Variable costs related to LSTK (all materials +90% of subcontracting)
Cost of materials 1,925 2,533 - -
Subcontracting 3,917 2,996 - 3,694
Consulting subcontract costs 435 333 411 479
% of consulting revenue 3.8% 3.4% 3.5% 3.5%
Employee cost 6,061 6,009 6,759 7,356
% increase (FY15-18E CAGR) 4% -1% 4.0% 7.0% Other expenses (ex-provisions of contractual obligation, travel) 479 1,589 1,787 2,486
% increase (FY15-18E CAGR) NA 232% 4.0% 16.1%
Travel costs 736 858 1,216 1,216
% increase (FY15-18E CAGR) 4% 5% 12.3% 12.3%
Provision for expected losses - 755 - -
EBITDA 4,912 2,339 1,574 3,370
EBITDA margin 26.6% 13.4% 13.4% 18.1%
Source: Company, Ambit Capital research
Revenue of `11.6bn in consulting and a 13.4% EBITDA margin would imply an EBITDA of `1.6bn and a core net profit of ~`830mn. Note that any increase in consulting revenues above this figure would flow through directly to EBITDA. Hence, a marginal improvement in prospects would yield a disproportionate improvement in margins and therefore profitability.
Exhibit 8: EBITDA margin sensitivity (using the worst case scenario) – any outperformance on revenues will lead to a step change in EBITDA margin due to high operating leverage
CAGR in in fixed overheads (employee+others; FY15-18E)
0% 2% 4% 6% 8%
Consulting revenue (̀ mn)
9,000 -1% -7% -12% -18% -23%
10,000 8% 4% -1% -6% -11%
11,750 21% 18% 13% 9% 5%
12,000 23% 19% 15% 11% 7%
13,000 29% 25% 21% 18% 14%
Source: Ambit Capital research

Engineers India
February 17, 2016 Ambit Capital Pvt. Ltd. Page 6
Advantages still remain EIL still enjoys significant advantages over smaller/scattered/segment specific peers in the form of strong relationships with OMCs and high employee productivity (which indicates better employee quality). Whilst higher competition could erode some of its pricing power, the aforementioned advantages will sustain. Moreover, the company’s strong bargaining power manifests in a negative working capital cycle which will only improve further as the share of consulting increases and settlements for past projects are made (working capital has deteriorated since the company has not been able to get payments for finished projects).
Employee productivity has been impacted by the fall in revenue
EIL has relatively a low voluntary attrition rate of ~2% which has not increased over the past few years despite the reducing revenue base. EIL recruits primarily from the top-5-6 engineering colleges in India. It provides extensive training to its employee through placements in technical and cross-functional teams. As shown in the exhibit below, EIL had better employee productivity than peers amongst public sector consultants. Given the recent revenue decline, productivity has declined as utilization levels have dipped.
Exhibit 9: EIL’s employee productivity (EBITDA/ employee) was higher than other PSU consultants but has declined recently
Revenue (̀ mn) Revenue/employee (̀ mn/ yr) EBITDA/employee (̀ mn/ yr)
FY13 FY14 FY15 FY13 FY14 FY15 FY13 FY14 FY15
EIL 25,290 18,465 17,412 7.4 5.5 5.3 1.8 1.5 0.7
Peers NBCC 32,323 40,701 46,741 13.9 17.4 19.2 0.8 1.0 1.2
MECON 5,648 3,714 4,306 3.3 2.2 2.7 0.5 (0.2) (0.4)
PDIL 677 583 NA 1.5 1.3 NA 0.0 (0.2) NA
NPCC 11,550 11,747 11,085 7.4 8.3 8.8 (0.0) 0.1 0.0
VA Tech 16,189 22,386 24,352 10.8 14.9 13.9 1.0 1.4 1.2
Source: Company, Ambit Capital research
Good relationships with OMCs
EIL has a strong relationship with the top 3 OMCs. It typically wins most of the major projects with BPCL and HPCL on a nomination basis. IOCL contracts are typically bid out but the larger ones are given out on a nomination basis (large brownfield expansions, greenfield projects). The experience, capabilities and the flexibility offered by EIL to large PSUs is the prime reason PSUs do not opt for competitive bidding. Secondly, specialized jobs/critical path jobs require fast execution and a specific experience, which may not be available with many other consultants.
Exhibit 10: BPCL has the been the company’s largest client in terms of awards recently
Source: Source: Company, Ambit Capital research; Note: Above figures derived from company’s release which provides information of 84% of the `7.2bn inflows of 9MFY16
Exhibit 11: Overseas consulting revenues should increase in near-term until the domestic inflow revives
Source: Company, Ambit Capital research
BPCL28%
HPCL3%
Other domestic
28%
Overseas41%
9MFY16 order inflow*
Dom. Consulting
39%
Overseas consulting
20%
LSTK41%
9MFY16 revenue

Engineers India
February 17, 2016 Ambit Capital Pvt. Ltd. Page 7
Strong cash conversion
As shown in the exhibit below, the company’s cash conversion track record is strong due to a negative working capital cycle. However, this has deteriorated over the past two years as large contracts have declined and the company has struggled to get the final tranche of payment for recently completed projects. Whilst CFO/ EBITDA is still at 100%, the real issue is the scale of EBITDA which has been declining.
Exhibit 12: EIL’s cash conversion ratio has been 118% in the last ten years cumulatively and above 100% in eight of the last ten years
Source: Company, Ambit Capital research
No risk to CFO but capital misallocation is a probable risk
EIL has committed to invest `3.4bn (13% of FY15 net worth, 12% of FY16E cash) over the next 2-3 years in the Ramagundam fertilizer plant. Given this investment, EIL has bagged an EPC contract of `1.9bn and hence the company will recover a part of the investment through its core business; moreover this also adds to it experience to bid for other fertiliser plants later. Although the company hasn’t made any capital allocation errors in the past, taking equity stake in such projects could impact our valuations. However, note that DPE guidelines prevent setting up of subsidiary/JV subject to a limitation up to 15% of net worth on one project and 30% overall. This will limit the investments that the company makes. We presently do not value this investment.
0%
50%
100%
150%
200%
250%
300%
0
1
2
3
4
5
6
7
FY06 FY07 FY08 FY09 FY10 FY11 FY12 FY13 FY14 FY15
Cash conversion
CFO (Rs bn) Pre-tax CFO/ EBITDA (RHS)

Engineers India
February 17, 2016 Ambit Capital Pvt. Ltd. Page 8
Appealing valuations; at the lowest point in the cycle? EIL’s FY16E RoE of 11% is likely to be the lowest in the current cycle given that margins should pick up henceforth and working capital will improve. Although RoEs are unlikely to reach the heady highs of FY10-FY12 (35%-40%), we expect an improvement to 14% by FY18. We expect revenue/ core EPS to increase at 2%/14% CAGR over FY15-FY18E driven mainly by margin improvement (increasing share of consulting, control on overheads). The recent share price decline has led to an ex-cash market capitalization of `21bn (barely off the 5-year low of `16bn), implying a multiple of 14x on core FY17E EPS and a 9%/5% CFO/FCF yield (on FY16E-FY17E average). A reverse DCF suggests a revenue CAGR of 3% and EBITDA margin of 20% throughout the next 10 years and 0% terminal growth (whilst maintaining capex/revenue and working capital/revenue constant), which seems unreasonably low. Our TP of `200 implies a multiple of 17x on core FY18E earnings warranted given that growth and margins are likely at their respective troughs.
Reducing earnings estimates by another ~25% Exhibit 13: We cut our FY17/ FY18 revenue/ PAT estimates by 24-31%
New Estimates Change in Estimates
Comments FY16E FY17E FY18E FY16E FY17E FY18E
Order book
Order book 36,109 47,853 62,362 -10% 8% 30%
YoY growth (%) -0.8% 32.5% 30.3%
Consultancy segment 31,358 41,370 51,789 -9% -6% -4% YoY growth (%) 27.8% 31.9% 25.2% LSTK segment 4,751 6,482 10,573 -21% 1325% -282% YoY growth (%) -60.0% 36.4% 63.1% Order flow 16,772 26,966 33,110 -25% 3% 10%
No order inflows in LSTK in FY16 due to limited visibility We also cut our inflow estimates for consulting business on the back of a weak business environment; however, note that one large order can materially change estimates here
YoY growth (%) -27.3% 60.8% 22.8% Consultancy Segment 16,772 20,966 24,110 -18% -13% -13% YoY growth (%) -10.0% 25.0% 15.0% LSTK segment - 6,000 9,000 -100% 183% 254% YoY growth (%) -100.0% NA 50.0% Financials Revenues 17,072 15,222 18,601 -7% -31% -30%
We expect revenues to decline more in FY17 vs FY16 mainly driven by a depletion of LSTK order book and limited uptick in consulting inflows. Even if the company manages to win large consulting orders, only 10-15% of this will be executed in FY17
YoY growth (%) -2% -11% 22%
Consultancy segment 9,957 10,953 13,691 -7% -23% -23% YoY growth (%) 2% 10% 25% LSTK segment 7,115 4,269 4,909 -7% -44% -44% YoY growth (%) -7% -40% 15% Fixed overheads 9,259 9,328 11,058 NA NA NA
We build in a sharp growth in fixed overheads in FY18 led by (1) strong growth in revenues necessitating increased provisioning; (2) employee costs increase led by pay omission hikes; high operating leverage led by improvement in utilisation Increase should be limited in FY17 due to low utilisation currently
YoY growth (%) 1% 1% 19% NA NA NA
Employee costs 6,069 6,130 7,356 NA NA NA YoY growth (%) 1% 1% 20% NA NA NA Total ex-employee & travel fixed overheads 2,203 2,112 2,486 NA NA NA
YoY growth (%) -6% -4% 18% NA NA NA Travel costs 987 1,086 1,216 NA NA NA YoY growth (%) 15% 10% 12% NA NA NA EBITDA 2,121 2,351 3,370 -25% -39% -34%
Increase in overall margins as share of consulting business increases and overheads are controlled. LSTK margins to become zero in FY17 due to lack of order book and limited execution Consulting margins to improve due to better utilisation
EBITDA margin 12.4% 15.4% 18.1% -300bps -220bps -110bps
Net depreciation 239 275 312 -12% -16% -19%
EBIT 1,882 2,076 3,058 -27% -41% -36%
EBIT margin(%) 11.0% 13.6% 16.4% -290bps -250bps -140bps Consultancy Segment 20.0% 22.5% 25.0% -450bps -350bps -300bps LSTK segment 3.5% 0.0% 4.0% -200bps -650bps -300bps Adjusted PAT 2,967 3,442 4,205 -24% -26% -24% Resultant impact on earnings is ~25%
EPS (`.) 8.8 10.2 12.5 -24% -26% -24%
Core EPS 3.7 4.1 6.1 -28% -42% -36% WC turnover (x) 1.2 1.0 1.2 -0.1x -0.5x -0.6x
Gross block turnover 3.6 2.8 3.0 -0.2x -0.9x -0.8x
Source: Company, Ambit Capital research
Engineers India
February 17, 2016 Ambit Capital Pvt. Ltd. Page 9
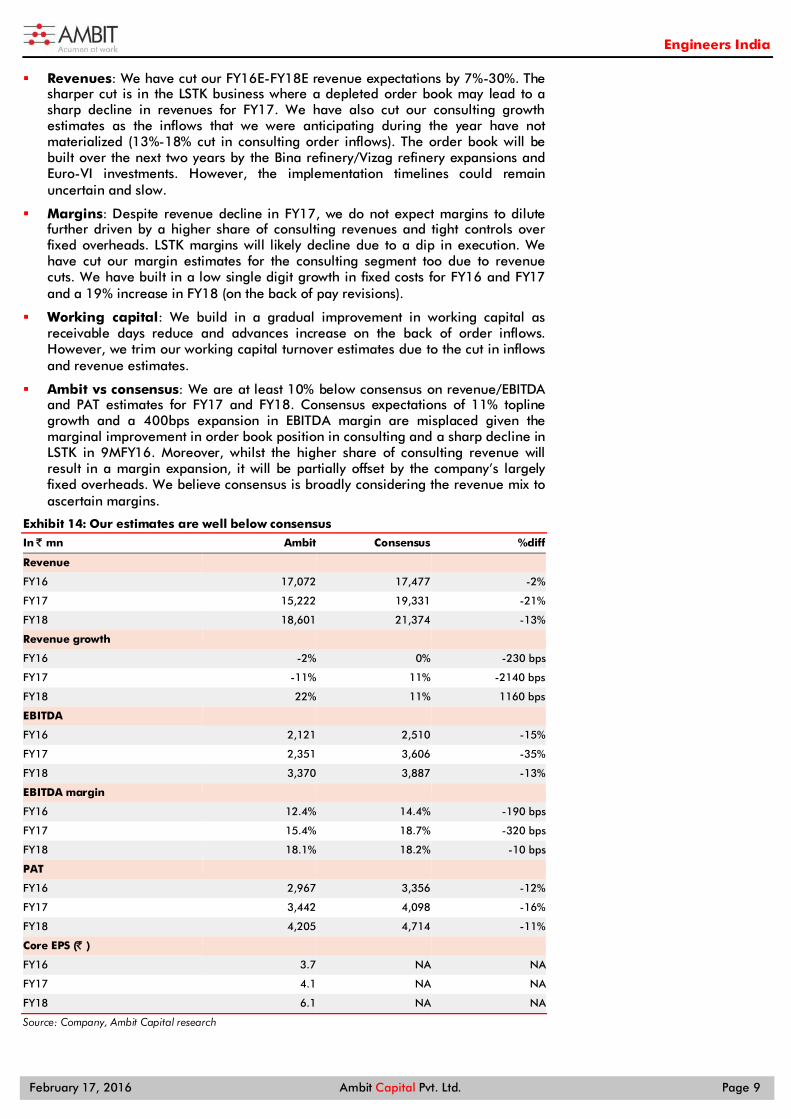
Revenues: We have cut our FY16E-FY18E revenue expectations by 7%-30%. The sharper cut is in the LSTK business where a depleted order book may lead to a sharp decline in revenues for FY17. We have also cut our consulting growth estimates as the inflows that we were anticipating during the year have not materialized (13%-18% cut in consulting order inflows). The order book will be built over the next two years by the Bina refinery/Vizag refinery expansions and Euro-VI investments. However, the implementation timelines could remain uncertain and slow.
Margins: Despite revenue decline in FY17, we do not expect margins to dilute further driven by a higher share of consulting revenues and tight controls over fixed overheads. LSTK margins will likely decline due to a dip in execution. We have cut our margin estimates for the consulting segment too due to revenue cuts. We have built in a low single digit growth in fixed costs for FY16 and FY17 and a 19% increase in FY18 (on the back of pay revisions).
Working capital: We build in a gradual improvement in working capital as receivable days reduce and advances increase on the back of order inflows. However, we trim our working capital turnover estimates due to the cut in inflows and revenue estimates.
Ambit vs consensus: We are at least 10% below consensus on revenue/EBITDA and PAT estimates for FY17 and FY18. Consensus expectations of 11% topline growth and a 400bps expansion in EBITDA margin are misplaced given the marginal improvement in order book position in consulting and a sharp decline in LSTK in 9MFY16. Moreover, whilst the higher share of consulting revenue will result in a margin expansion, it will be partially offset by the company’s largely fixed overheads. We believe consensus is broadly considering the revenue mix to ascertain margins.
Exhibit 14: Our estimates are well below consensus
In ̀ mn Ambit Consensus %diff
Revenue FY16 17,072 17,477 -2%
FY17 15,222 19,331 -21%
FY18 18,601 21,374 -13%
Revenue growth FY16 -2% 0% -230 bps
FY17 -11% 11% -2140 bps
FY18 22% 11% 1160 bps
EBITDA FY16 2,121 2,510 -15%
FY17 2,351 3,606 -35%
FY18 3,370 3,887 -13%
EBITDA margin FY16 12.4% 14.4% -190 bps
FY17 15.4% 18.7% -320 bps
FY18 18.1% 18.2% -10 bps
PAT FY16 2,967 3,356 -12%
FY17 3,442 4,098 -16%
FY18 4,205 4,714 -11%
Core EPS (̀ ) FY16 3.7 NA NA
FY17 4.1 NA NA
FY18 6.1 NA NA
Source: Company, Ambit Capital research

Engineers India
February 17, 2016 Ambit Capital Pvt. Ltd. Page 10
DCF based value of `113/share, ex-cash Our valuation of `113/share for core business is based on estimates discussed in exhibit 12 above. This is 17% lower than our previous valuation of `135, driven primarily by sharp cuts in near-term growth and margins. This valuation implies a multiple of 19x/17x FY17E/FY18E core earnings. Given that the current earnings profile is seemingly at its trough, these valuations (a 45% premium to 5-year average, one-year forward multiple) appear justified even though rich.
Exhibit 15: DCF based TP of ̀ 200; 45% of the value is cash on the company’s book ` mn
Total PV of free cash flow (a) 20,773
PV of terminal value (b) 17,882
EV (a) + (b) 38,654
Net debt (28,805)
Equity value 67,459
No. of shares (mn) 337
Implied share price (̀ ) 200
Source: Company, Ambit Capital research
Exhibit 16: We build in an improvement in RoE in the near term
Source: Company, Ambit Capital research
Reverse DCF The CMP of `148 (`62 excl FY16E cash on books) implies a perpetual revenue CAGR of 3% assuming 20% EBITDA margin and keeping working capital and capex assumptions the same (as % of revenues) and a zero perpetual growth rate. This is seemingly too low. The long term fuel consumption increase of 4%-5% CAGR and the need to improve refinery complexity and meet rising environmental norms will drive higher growth. Note that our assumption of the discount rate of 15% has been maintained.
Exhibit 17: CMP factors in just a 3% growth rate to perpetuity
Base case Reverse DCF
FY17 FY18 FY18-22 FY22-26 FY17 FY18 FY18-22 FY22-26
Revenue CAGR -11% 22% 16% 7% 3% 3% 3% 3%
EBITDA CAGR 11% 43% 19% 7% 3% 3% 3% 3%
Avg EBITDA margin 15.4% 18.1% 20.5% 20.5% 20.0% 20.0% 20.0% 20.0%
Cum. WC change as % of cum revenue 1% 2% 3% 3% 3% 0% 1% 3%
Perpetual growth rate 4% 0%
Discount rate 15% 15%
TP (`) 200 148
Source: Company, Ambit Capital research
Strong cash yields at current valuations At current market cap (ex-cash) of `21bn, the CFO/ FCF yield is 9%/5% (based on the FY16E/ FY17E average). Barring a brief period in 2013, the company’s market cap ex-cash is the lowest in five years and valuations are now at a 14% discount to its five-year average. Whilst a dip in valuations may seem warranted given that the company’s scale has declined materially over the last five years, our reverse DCF suggests that CMP builds in revenue CAGR of 3%-4% over the next 10 years and a zero perpetual growth rate, which is too low.
10%
12%
14%
16%
18%
20%
-
2,000
4,000
6,000
8,000
2017
E
2018
E
2019
E
2020
E
2021
E
2022
E
2023
E
2024
E
2025
E
2026
E
FCFF (Rs mn) RoE (RHS) WACC (RHS)

Engineers India
February 17, 2016 Ambit Capital Pvt. Ltd. Page 11
Exhibit 18: Barring a brief period in CY13, the current valuation ex-cash is the lowest in the last five years
Source: Company, Ambit Capital research
Exhibit 19: Valuations have declined materially in the last two months
Source: Company, Ambit Capital research
Exhibit 20: EIL’s PBT and EPS have declined by 40% over the last four years
Source: Company, Ambit Capital research
Exhibit 21: And consensus estimates for FY16/ FY17 have been downgraded as large orders were delayed
Source: Company, Ambit Capital research
Catalysts Likely catalysts are the actual awards of large expansion projects in FY17 and acceleration in consulting revenue growth. Whilst order awards have no certainty we find that these are highly probable in FY17; revenue growth pickup is achievable in FY17 given the current order book situation (up 4% YoY in 9MFY16). Moreover, the decline in EBITDA margin should cease in FY16 and margins should expand in FY17.
Order inflow and execution improvement in consulting in FY17: There are two large expansion projects (Vizag and Bina) likely to be awarded in FY17 (combined project size of ~`380bn, implying a PMC contract size of `19bn). Moreover, order inflows can be boosted the by Euro VI programme (`250bn of capex implying a PMC contract size of `12.5bn). Consulting revenue growth should accelerate in FY17 (from 2% in FY16 to 10%) which will stem the decline caused by a 40% drop in LSTK revenues.
EBITDA margin improvement to 15% in FY17: A constant employee base, higher utilization due to 10% topline growth in consulting should lead to an EBITDA margin expansion of 200bps YoY in FY17 despite a 40% drop in LSTK revenue. These estimates are centered around the company’s ability to control its fixed costs.
- 10 20 30 40 50 60 70 80 90
Feb-
11
Aug
-11
Feb-
12
Aug
-12
Feb-
13
Aug
-13
Feb-
14
Aug
-14
Feb-
15
Aug
-15
Market-cap(ex-cash; ` bn)
0
5
10
15
20
25
30
Feb-
11
Aug
-11
Feb-
12
Aug
-12
Feb-
13
Aug
-13
Feb-
14
Aug
-14
Feb-
15
Aug
-15
Core P/E(one yr fwd, consensus)
16
19 17
14
10
- 1 2 3 4 5 6 7 8 9 10
-
5
10
15
20
25
FY11 FY12 FY13 FY14 FY15
EIL's profitability
Adj EPS (Rs) PBT (Rs bn; RHS)
8 10 12 14 16 18 20 22 24 26
Mar
-14
May
-14
Jul-
14
Sep-
14
Nov
-14
Jan-
15
Mar
-15
May
-15
Jul-
15
Sep-
15
Nov
-15
Jan-
16
Consensus EPS estimates
FY16 FY17

Engineers India
February 17, 2016 Ambit Capital Pvt. Ltd. Page 12
Key risks to our thesis The key risks to our thesis will be the inability of the company to win or an inordinate delay in new orders (whether short cycle or long) in the consulting segment. Moreover, increased competition on the back of fewer orders in the system and deterioration in working capital due to exposure to the Middle East, may result in a material downgrade to our estimates. Delays to OMCs’ capex plans/failure to win consulting projects: Our
estimates on the company’s margins are entwined with its ability to maintain its utilization levels by filling its declining LSTK revenue bucket with consulting revenues. Given the high operating leverage (due to high proportion of fixed costs), any downgrades to revenue estimates will lead to a substantial decline at the EBITDA level and hence at the profitability level as shown in the exhibit below. Failure to win projects could be driven by: (1) delays in capex plans of the OMCs; and/or: (2) increased competition on the back of fewer orders in the system.
Exhibit 22: TP sensitivity - There is high sensitivity to revenue growth rate due to high operating leverage; more than the implied multiple due to the high cash component
FY18E consulting revenue growth (YoY) 5% 15% 20% 25% 30%
Implied multiple on FY18E core EPS
15 122 155 171 188 204 16 124 159 176 194 211 17 126 163 182 200 219 18 127 167 186 206 225 19 129 171 191 212 233
Source: Ambit Capital research
Deterioration in working capital due to exposure to the Middle East: The company’s share of overseas revenues has steadily increased over the past few years. Media sources suggest that payment cycles in the Middle East’s hydrocarbon projects have been elongated due to the sharp decline in oil prices. We have currently built in an improvement in the working capital cycle which may need to be revised downwards if the Middle East related project payments need to written off/or are delayed. 33%/19% of consulting/overall revenues is from the overseas markets.
Exhibit 23: Proportion of international revenues has continued to rise
Source: Company, Ambit Capital research
Exhibit 24: We expect working capital cycle to improve henceforth
Source: Company, Ambit Capital research
Exhibit 25: Explanation for flags on the front page Segment Score Comment
Accounting GREEN EIL appears in the top half of the others category in our proprietary accounting framework due to its low debtors, high cash conversion and limited contingent liabilities
Predictability RED The company doesn’t give a definitive guidance. Moreover, execution pace is uncertain as indicated by a double digit surprise even on revenues in four of the last eight quarters
Earnings momentum RED Consensus consolidated EPS estimates for FY16 and FY17 have been downgraded by 9% over the last six months. Over FY12-FY15, the company's EPS has declined by 50%
Source: Ambit Capital research, Bloomberg
0%5%
10%15%20%25%30%35%40%
1QFY
14
2QFY
14
3QFY
14
4QFY
14
1QFY
15
2QFY
15
3QFY
15
4QFY
15
1QFY
16
2QFY
16
3QFY
16
Overseas as % of revenues
% of overall revs % of consulting revs
-
20
40
60
80
100
(120)
(100)
(80)
(60)
(40)
(20)
-
FY12
FY13
FY14
FY15
FY16
E
FY17
E
FY18
E
WC days based on revenues (avg)
Overall Receivable Advances

Engineers India
February 17, 2016 Ambit Capital Pvt. Ltd. Page 13
Balance sheet
Particulars (̀ mn) FY14 FY15E FY16E FY17E FY17E
Share capital 1,685 1,685 1,685 1,685 1,685
Reserves and surplus 23,533 24,632 25,817 27,191 28,870
Total Net worth 25,217 26,317 27,501 28,876 30,555
Loans 2 5 5 5 5
Sources of funds 25,219 26,322 27,506 28,881 30,560
Gross Block 2,801 4,437 5,137 5,862 6,612
Net block 1,209 2,723 3,183 3,633 4,071
Capital work-in-progress 1,318 191 191 191 191
Investments 7,317 1,378 1,378 1,378 1,378
Cash and bank balances 18,125 24,190 27,564 28,979 31,080
Sundry debtors 3,537 4,386 3,742 3,295 3,975
Inventories 10 8 9 10 10
Loans and advances 1,053 1,380 1,229 1,147 1,433
Other Current Assets 3,216 3,289 3,290 3,032 3,640
Total Current Assets 26,006 33,258 35,873 36,461 40,094
Current liabilities and provisions 12,951 13,560 15,450 15,114 17,506
Net current assets 13,055 19,699 20,423 21,347 22,588
Deferred Tax Assets 2,320 2,331 2,331 2,331 2,331
Application of funds 25,219 26,322 27,506 28,881 30,560
Source: Company, Ambit Capital research
Income statement Particulars (̀ mn) FY14 FY15 FY16E FY17E FY18E
Order book (total) 29,108 36,409 36,109 47,853 62,362
Order inflow (total) 11,548 23,056 16,772 26,966 33,110
Revenue 18,465 17,412 17,072 15,222 18,601
Consultancy 11,320 9,762 9,957 10,953 13,691
LSTK 7,145 7,650 7,115 4,269 4,909
Total expenses 13,553 15,073 14,951 12,871 15,231
EBITDA 4,912 2,339 2,121 2,351 3,370
EBITDA margin 26.6% 13.4% 12.4% 15.4% 18.1%
Net depreciation / amortisation 148 202 239 275 312
EBIT 4,764 2,137 1,882 2,076 3,058
Other income 2,320 2,731 2,547 3,060 3,217
Adjusted PBT 7,071 4,852 4,429 5,137 6,276
Provision for taxation 2,214 1,630 1,461 1,695 2,071
Adjusted consolidated PAT 4,857 3,221 2,967 3,442 4,205
EPS (Adjusted) (`.) 14.4 9.6 8.8 10.2 12.5
Source: Company, Ambit Capital research

Engineers India
February 17, 2016 Ambit Capital Pvt. Ltd. Page 14
Cash flow statement
Particulars (̀ mn) FY14 FY15E FY16E FY17E FY17E
PBT 7,070 4,852 4,429 5,137 6,276
Depreciation 151 205 239 275 312
Interest expense/ (income) (1,848) (1,967) (2,017) (2,196) (2,328)
Direct taxes paid (2,127) (1,612) (1,461) (1,695) (2,071)
Change in working capital (1,957) (42) 1,679 206 401
CFO (before exceptional) 852 646 2,589 1,062 1,900
Exceptional items (29) (82) - - -
CFO 823 564 2,589 1,062 1,900
Purchase of fixed assets (820) (632) (700) (725) (750)
Investment 483 474 - - -
Dividend received 16 28 280 664 689
Interest Income 1,993 1,868 2,017 2,196 2,328
CFI 1,673 1,741 1,597 2,135 2,267
Dividends paid (1,183) (1,183) (674) (1,484) (1,721)
CFF (2,562) (2,396) (811) (1,782) (2,067)
Net Cash (37) (9) 3,374 1,415 2,100
Cash at the beg 198 160 151 151 151
Cash at the end 160 151 3,526 1,566 2,252
Free cash flow 33 15 1,889 337 1,150
Source: Company, Ambit Capital research
Ratios FY14 FY15E FY16E FY17E FY17E
Growth (YoY)
Sales -27% -6% -2% -11% 22%
EBITDA -18% -52% -9% 11% 43%
Adj PBT -17% -31% -9% 16% 22%
Adj consolidated PAT -17% -34% -8% 16% 22%
EPS norm (dil) -17% -34% -8% 16% 22%
Margin
EBITDA margin (%) 26.6% 13.4% 12.4% 15.4% 18.1%
EBIT Margin (%) 25.8% 12.3% 11.0% 13.6% 16.4%
Net margin (Adj) 26.3% 18.5% 17.4% 22.6% 22.6%
Others
Dividend payout ratio (%) 53.1% 64.7% 50.0% 50.0% 50.0%
Net debt/Equity (0.7) (0.9) (1.0) (1.0) (1.0)
Working capital turnover (x) 2.4 1.5 1.2 1.0 1.2
Gross block turnover (x) 7.7 4.8 3.6 2.8 3.0
ROCE 13.6% 5.5% 4.7% 4.9% 6.9%
ROE 20.2% 12.5% 11.0% 12.2% 14.1%
Valuation metrics
Dividend yield 4.4% 3.4% 3.0% 3.5% 4.2%
P/E (x) 10.3 15.5 16.8 14.5 11.9
P/E (core; x) 7.5 17.4 16.6 14.0 8.5
P/B (x) 2.0 1.9 1.8 1.7 1.6
EV/EBITDA (x) 5.0 10.4 9.9 8.3 5.2
Source: Company, Ambit Capital research

Engineers India
February 17, 2016 Ambit Capital Pvt. Ltd. Page 15
Institutional Equities Team Saurabh Mukherjea, CFA CEO, Institutional Equities (022) 30433174 [email protected]
Research
Analysts Industry Sectors Desk-Phone E-mail
Nitin Bhasin - Head of Research E&C / Infra / Cement / Industrials (022) 30433241 [email protected]
Aadesh Mehta, CFA Banking / Financial Services (022) 30433239 [email protected]
Aakash Adukia Oil & Gas / Chemicals / Agri Inputs (022) 30433273 [email protected]
Abhishek Ranganathan, CFA Retail / Mid-caps (022) 30433085 [email protected]
Achint Bhagat, CFA Cement / Roads / Home Building (022) 30433178 [email protected]
Ashvin Shetty, CFA Automobile (022) 30433285 [email protected]
Bhargav Buddhadev Power Utilities / Capital Goods (022) 30433252 [email protected]
Deepesh Agarwal, CFA Power Utilities / Capital Goods (022) 30433275 [email protected] Dhiraj Mistry, CFA Consumer (022) 30433264 [email protected]
Gaurav Khandelwal, CFA Automobile (022) 30433132 [email protected] Girisha Saraf Mid-caps / Small-caps (022) 30433211 [email protected]
Karan Khanna, CFA Strategy (022) 30433251 [email protected]
Kushank Poddar Technology (022) 30433203 [email protected] Pankaj Agarwal, CFA Banking / Financial Services (022) 30433206 [email protected]
Paresh Dave, CFA Healthcare (022) 30433212 [email protected]
Parita Ashar, CFA Metals & Mining (022) 30433223 [email protected]
Prashant Mittal, CFA Derivatives (022) 30433218 [email protected]
Rahil Shah Banking / Financial Services (022) 30433217 [email protected]
Rakshit Ranjan, CFA Consumer (022) 30433201 [email protected]
Ravi Singh Banking / Financial Services (022) 30433181 [email protected]
Ritesh Gupta, CFA Oil & Gas / Chemicals / Agri Inputs (022) 30433242 [email protected]
Ritesh Vaidya, CFA Consumer (022) 30433246 [email protected] Ritika Mankar Mukherjee, CFA Economy / Strategy (022) 30433175 [email protected]
Ritu Modi Automobile (022) 30433292 [email protected]
Sagar Rastogi Technology (022) 30433291 [email protected]
Sumit Shekhar Economy / Strategy (022) 30433229 [email protected]
Utsav Mehta, CFA E&C / Industrials (022) 30433209 [email protected]
Vivekanand Subbaraman, CFA Media (022) 30433261 [email protected]
Sales
Name Regions Desk-Phone E-mail
Sarojini Ramachandran - Head of Sales UK +44 (0) 20 7614 8374 [email protected]
Dharmen Shah India / Asia (022) 30433289 [email protected]
Dipti Mehta India / USA (022) 30433053 [email protected]
Hitakshi Mehra India (022) 30433204 [email protected]
Krishnan V India / Asia (022) 30433295 [email protected]
Nityam Shah, CFA USA / Europe (022) 30433259 [email protected]
Parees Purohit, CFA UK / USA (022) 30433169 [email protected]
Praveena Pattabiraman India / Asia (022) 30433268 [email protected]
Shaleen Silori India (022) 30433256 [email protected]
Singapore
Pramod Gubbi, CFA – Director Singapore +65 8606 6476 [email protected]
Shashank Abhisheik Singapore +65 6536 1935 [email protected]
USA / Canada
Ravilochan Pola - CEO Americas +1(646) 361 3107 [email protected]
Production
Sajid Merchant Production (022) 30433247 [email protected]
Sharoz G Hussain Production (022) 30433183 [email protected]
Nikhil Pillai Database (022) 30433265 [email protected]
E&C = Engineering & Construction
Engineers India
February 17, 2016 Ambit Capital Pvt. Ltd. Page 16
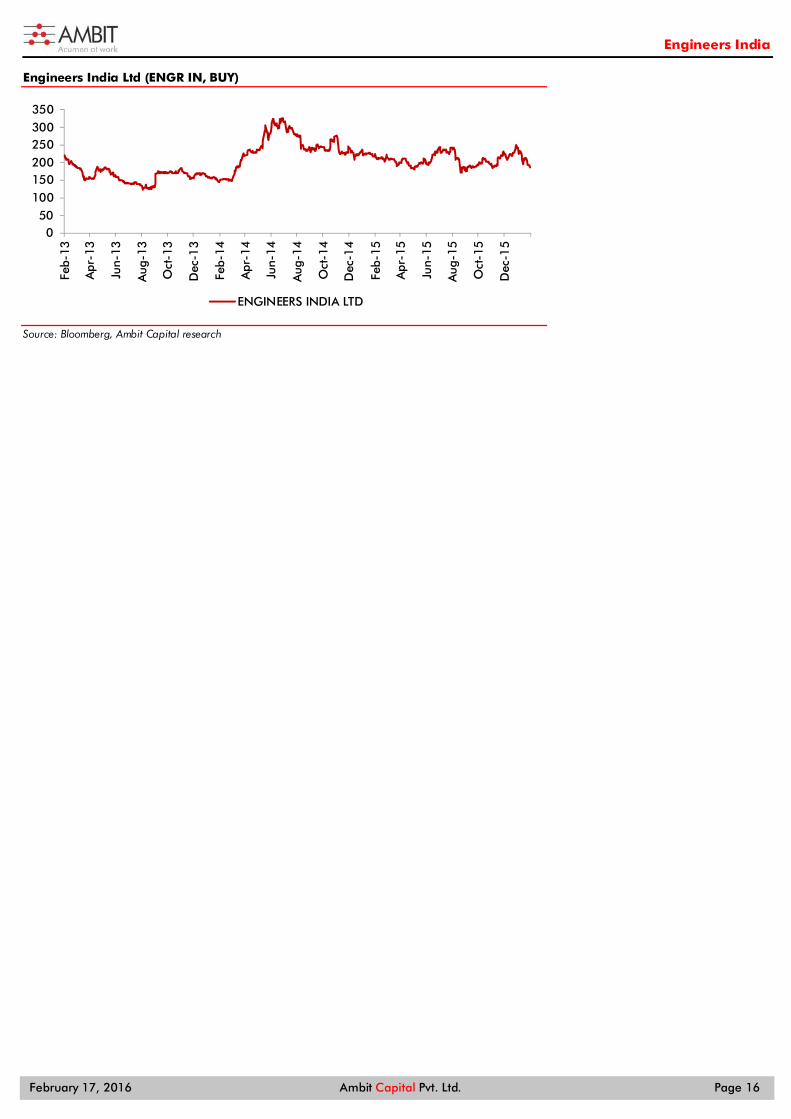
Engineers India Ltd (ENGR IN, BUY)
Source: Bloomberg, Ambit Capital research
050
100150200250300350
Feb-
13
Apr
-13
Jun-
13
Aug
-13
Oct
-13
Dec
-13
Feb-
14
Apr
-14
Jun-
14
Aug
-14
Oct
-14
Dec
-14
Feb-
15
Apr
-15
Jun-
15
Aug
-15
Oct
-15
Dec
-15
ENGINEERS INDIA LTD

Engineers India
February 17, 2016 Ambit Capital Pvt. Ltd. Page 17
Explanation of Investment Rating
Investment Rating Expected return (over 12-month)
BUY >10%
SELL <10%
NO STANCE We have forward looking estimates for the stock but we refrain from assigning valuation and recommendation
UNDER REVIEW We will revisit our recommendation, valuation and estimates on the stock following recent events
NOT RATED We do not have any forward looking estimates, valuation or recommendation for the stock Disclaimer
This report or any portion hereof may not be reprinted, sold or redistributed without the written consent of Ambit Capital. AMBIT Capital Research is disseminated and available primarily electronically, and, in some cases, in printed form.
Additional information on recommended securities is available on request.
Disclaimer
1. AMBIT Capital Private Limited (“AMBIT Capital”) and its affiliates are a full service, integrated investment banking, investment advisory and brokerage group. AMBIT Capital is a Stock Broker, Portfolio Manager and Depository Participant registered with Securities and Exchange Board of India Limited (SEBI) and is regulated by SEBI
2. AMBIT Capital makes best endeavours to ensure that the research analyst(s) use current, reliable, comprehensive information and obtain such information from sources which the analyst(s) believes to be reliable. However, such information has not been independently verified by AMBIT Capital and/or the analyst(s) and no representation or warranty, express or implied, is made as to the accuracy or completeness of any information obtained from third parties. The information, opinions, views expressed in this Research Report are those of the research analyst as at the date of this Research Report which are subject to change and do not represent to be an authority on the subject. AMBIT Capital may or may not subscribe to any and/ or all the views expressed herein.
3. This Research Report should be read and relied upon at the sole discretion and risk of the recipient. If you are dissatisfied with the contents of this complimentary Research Report or with the terms of this Disclaimer, your sole and exclusive remedy is to stop using this Research Report and AMBIT Capital or its affiliates shall not be responsible and/ or liable for any direct/consequential loss howsoever directly or indirectly, from any use of this Research Report.
4. If this Research Report is received by any client of AMBIT Capital or its affiliate, the relationship of AMBIT Capital/its affiliate with such client will continue to be governed by the terms and conditions in place between AMBIT Capital/ such affiliate and the client.
5. This Research Report is issued for information only and the 'Buy', 'Sell', or ‘Other Recommendation’ made in this Research Report such should not be construed as an investment advice to any recipient to acquire, subscribe, purchase, sell, dispose of, retain any securities and should not be intended or treated as a substitute for necessary review or validation or any professional advice. Recipients should consider this Research Report as only a single factor in making any investment decisions. This Research Report is not an offer to sell or the solicitation of an offer to purchase or subscribe for any investment or as an official endorsement of any investment.
6. This Research Report is being supplied to you solely for your information and may not be reproduced, redistributed or passed on, directly or indirectly, to any other person or published, copied in whole or in part, for any purpose. Neither this Research Report nor any copy of it may be taken or transmitted or distributed, directly or indirectly within India or into any other country including United States (to US Persons), Canada or Japan or to any resident thereof. The distribution of this Research Report in other jurisdictions may be strictly restricted and/ or prohibited by law or contract, and persons into whose possession this Research Report comes should inform themselves about such restriction and/ or prohibition, and observe any such restrictions and/ or prohibition.
7. Ambit Capital Private Limited is registered as a Research Entity under the SEBI (Research Analysts) Regulations, 2014. SEBI Reg.No.- INH000000313.
Conflict of Interests
8. In the normal course of AMBIT Capital’s business circumstances may arise that could result in the interests of AMBIT Capital conflicting with the interests of clients or one client’s interests conflicting with the interest of another client. AMBIT Capital makes best efforts to ensure that conflicts are identified and managed and that clients’ interests are protected. AMBIT Capital has policies and procedures in place to control the flow and use of non-public, price sensitive information and employees’ personal account trading. Where appropriate and reasonably achievable, AMBIT Capital segregates the activities of staff working in areas where conflicts of interest may arise. However, clients/potential clients of AMBIT Capital should be aware of these possible conflicts of interests and should make informed decisions in relation to AMBIT Capital’s services.
9. AMBIT Capital and/or its affiliates may from time to time have or solicit investment banking, investment advisory and other business relationships with companies covered in this Research Report and may receive compensation for the same.
Additional Disclaimer for U.S. Persons
10. The research report is solely a product of AMBIT Capital 11. AMBIT Capital is the employer of the research analyst(s) who has prepared the research report 12. Any subsequent transactions in securities discussed in the research reports should be effected through Enclave Capital LLC. (“Enclave”). 13. Enclave does not accept or receive any compensation of any kind for the dissemination of the AMBIT Capital research reports. 14. The research analyst(s) preparing the email / Research Report/ attachment is resident outside the United States and is/are not associated persons of any U.S. regulated broker-dealer and that
therefore the analyst(s) is/are not subject to supervision by a U.S. broker-dealer, and is/are not required to satisfy the regulatory licensing requirements of FINRA or required to otherwise comply with U.S. rules or regulations regarding, among other things, communications with a subject company, public appearances and trading securities held by a research analyst account.
15. This report is prepared, approved, published and distributed by the Ambit Capital located outside of the United States (a non-US Group Company”). This report is distributed in the U.S.by Enclave Capital LLC, a U.S. registered broker dealer, on behalf of Ambit Capital only to major U.S. institutional investors (as defined in Rule 15a-6 under the U.S. Securities Exchange Act of 1934 (the “Exchange Act”)) pursuant to the exemption in Rule 15a-6 and any transaction effected by a U.S. customer in the securities described in this report must be effected through Enclave Capital LLC (19 West 44th Street, suite 1700, New York, NY 10036).
16. As of the publication of this report Enclave Capital LLC, does not make a market in the subject securities. 17. This document does not constitute an offer of, or an invitation by or on behalf of Ambit Capital or its affiliates or any other company to any person, to buy or sell any security. The information
contained herein has been obtained from published information and other sources, which Ambit Capital or its Affiliates consider to be reliable. None of Ambit Capital accepts any liability or responsibility whatsoever for the accuracy or completeness of any such information. All estimates, expressions of opinion and other subjective judgments contained herein are made as of the date of this document. Emerging securities markets may be subject to risks significantly higher than more established markets. In particular, the political and economic environment, company practices and market prices and volumes may be subject to significant variations. The ability to assess such risks may also be limited due to significantly lower information quantity and quality. By accepting this document, you agree to be bound by all the foregoing provisions.
Additional Disclaimer for Canadian Persons
18. AMBIT Capital is not registered in the Province of Ontario and /or Province of Québec to trade in securities and/or to provide advice with respect to securities. 19. AMBIT Capital's head office or principal place of business is located in India. 20. All or substantially all of AMBIT Capital's assets may be situated outside of Canada. 21. It may be difficult for enforcing legal rights against AMBIT Capital because of the above. 22. Name and address of AMBIT Capital's agent for service of process in the Province of Ontario is: Torys LLP, 79 Wellington St. W., 30th Floor, Box 270, TD South Tower, Toronto, Ontario M5K 1N2
Canada. 23. Name and address of AMBIT Capital's agent for service of process in the Province of Montréal is Torys Law Firm LLP, 1 Place Ville Marie, Suite 1919 Montréal, Québec H3B 2C3 Canada.
Additional Disclaimer for Singapore Persons 24. This Report is prepared and distributed by Ambit Capital Private Limited and distributed as per the approved arrangement under Paragraph 9 of Third Schedule of Securities and Futures Act (CAP
289) and Paragraph 11 of the First Schedule to the Financial Advisors Act (CAP 110) provided to Ambit Singapore Pte. Limited by Monetary Authority of Singapore. 25. This Report is only available to persons in Singapore who are institutional investors (as defined in section 4A of the Securities and Futures Act (Cap. 289) of Singapore (the “SFA”).” Accordingly, if a
Singapore Person is not or ceases to be such an institutional investor, such Singapore Person must immediately discontinue any use of this Report and inform Ambit Singapore Pte. Limited.
Disclosures 26. The analyst (s) has/have not served as an officer, director or employee of the subject company. 27. There is no material disciplinary action that has been taken by any regulatory authority impacting equity research analysis activities. 28. All market data included in this report are dated as at the previous stock market closing day from the date of this report.
Analyst Certification Each of the analysts identified in this report certifies, with respect to the companies or securities that the individual analyses, that (1) the views expressed in this report reflect his or her personal views about all of the subject companies and securities and (2) no part of his or her compensation was, is or will be directly or indirectly dependent on the specific recommendations or views expressed in this report. © Copyright 2015 AMBIT Capital Private Limited. All rights reserved.
Ambit Capital Pvt. Ltd. Ambit House, 3rd Floor. 449, Senapati Bapat Marg, Lower Parel, Mumbai 400 013, India. Phone: +91-22-3043 3000 | Fax: +91-22-3043 3100 CIN: U74140MH1997PTC107598 www.ambitcapital.com
Related Documents