ORIGINAL ARTICLE Comorbidity and Insurance as Predictors of Disability After Traumatic Brain Injury Elmar Gardizi, MA, a Robin A. Hanks, PhD, b Scott R. Millis, PhD, b Maritza J. Figueroa, PhD c From the a Department of Psychology, University of Windsor, Windsor, ON, Canada; b Department of Physical Medicine and Rehabilitation, Wayne State University School of Medicine, Detroit, MI; and c Touchstone Neurorecovery Center/Nexus Health Systems, Conroe, TX. Abstract Objective: To examine the unique contribution of self-reported medical comorbidity and insurance type on disability after traumatic brain injury (TBI). Design: Inception cohort design at 1-year follow up. Setting: A university affiliated rehabilitation hospital. Participants: Adults with mild-complicated to severe TBI (NZ70). Intervention: Not applicable. Main Outcome Measures: Self-reported medical comorbidities were measured using the Modified Cumulative Illness Rating Scale, while insurance type was classified as commercial or government-funded; disability was measured using the Disability Rating Scale. Results: Two models were run using multiple linear regression, and the best-fitting model was selected on the basis of Bayesian information criterion. The full model, which included self-reported medical comorbidity and insurance type, was significantly better fitting than the reduced model. Participants with a longer duration of posttraumatic amnesia, more self-reported medical comorbidities, and government insurance were more likely to have higher levels of disability. Meanwhile, individual organ systems were not predictive of disability. Conclusions: The cumulative effect of self-reported medical comorbidities and type of insurance coverage predict disability above and beyond well-known prognostic variables. Early assessment of medical complications and improving services provided by government-funded insurance may enhance quality of life and reduce long-term health care costs. Archives of Physical Medicine and Rehabilitation 2014;-:------- ª 2014 by the American Congress of Rehabilitation Medicine Approximately 1.7 million individuals sustain a traumatic brain injury (TBI) in the United States each year. 1 Many of these individuals experience long-term physical disability that affects their quality of life and places a significant burden on the health care system. 2-4 To improve rehabilitation outcomes and reduce disability for persons with TBI, treatment plans need to become more targeted. This can be accomplished by increasing our understanding regarding commonly overlooked rehabilitation-related factors such as medical comorbidity and insurance type. Persons with TBI may experience medical comorbidities at a similar rate as the general population. 5 Conversely, they are susceptible to the development of novel comorbidities, which can generally be attributed to injury, treatment, or posteinjury-related factors. For instance, moderate-to-severe TBI is known to cause neuropathological changes, 6 some of which have been linked to the development of psychiatric illness. 7-10 Epileptic seizures are also commonly caused by TBI and can be more difficult to treat relative to seizures in the absence of brain trauma. 11 Moreover, the violent causes of most TBIs can also cause persistent orthopedic injuries. 12 Treatments associated with TBI can increase the risk for developing various complications. For example, induced hypo- thermia, which is used to improve neurological recovery in per- sons with severe TBI, 13 may cause ventricular arrhythmia and artrioventricular blockage. 14 Decompressive craniectomy has been associated with the development of brain infections, hydroceph- alus, and syndrome of the trephined. 15 Similarly, intubation and tracheotomy procedures can lead to the development of sinusitis, Supported by the US Department of Education-National Institute of Disability Research and Rehabilitation (grant no. H133A020515). Disclosures: none. 0003-9993/14/$36 - see front matter ª 2014 by the American Congress of Rehabilitation Medicine http://dx.doi.org/10.1016/j.apmr.2014.06.004 Archives of Physical Medicine and Rehabilitation journal homepage: www.archives-pmr.org Archives of Physical Medicine and Rehabilitation 2014;-:-------

Welcome message from author
This document is posted to help you gain knowledge. Please leave a comment to let me know what you think about it! Share it to your friends and learn new things together.
Transcript

edicine and Rehabilitation
Archives of Physical M journal homepage: www.archives-pmr.orgArchives of Physical Medicine and Rehabilitation 2014;-:-------
ORIGINAL ARTICLE
Comorbidity and Insurance as Predictors of DisabilityAfter Traumatic Brain Injury
Elmar Gardizi, MA,a Robin A. Hanks, PhD,b Scott R. Millis, PhD,b Maritza J. Figueroa, PhDc
From the aDepartment of Psychology, University of Windsor, Windsor, ON, Canada; bDepartment of Physical Medicine and Rehabilitation,Wayne State University School of Medicine, Detroit, MI; and cTouchstone Neurorecovery Center/Nexus Health Systems, Conroe, TX.
Abstract
Objective: To examine the unique contribution of self-reported medical comorbidity and insurance type on disability after traumatic brain injury
(TBI).
Design: Inception cohort design at 1-year follow up.
Setting: A university affiliated rehabilitation hospital.
Participants: Adults with mild-complicated to severe TBI (NZ70).
Intervention: Not applicable.
Main Outcome Measures: Self-reported medical comorbidities were measured using the Modified Cumulative Illness Rating Scale, while
insurance type was classified as commercial or government-funded; disability was measured using the Disability Rating Scale.
Results: Two models were run using multiple linear regression, and the best-fitting model was selected on the basis of Bayesian information
criterion. The full model, which included self-reported medical comorbidity and insurance type, was significantly better fitting than the reduced
model. Participants with a longer duration of posttraumatic amnesia, more self-reported medical comorbidities, and government insurance were
more likely to have higher levels of disability. Meanwhile, individual organ systems were not predictive of disability.
Conclusions: The cumulative effect of self-reported medical comorbidities and type of insurance coverage predict disability above and beyond
well-known prognostic variables. Early assessment of medical complications and improving services provided by government-funded insurance
may enhance quality of life and reduce long-term health care costs.
Archives of Physical Medicine and Rehabilitation 2014;-:-------
ª 2014 by the American Congress of Rehabilitation Medicine
Approximately 1.7 million individuals sustain a traumatic braininjury (TBI) in the United States each year.1 Many of theseindividuals experience long-term physical disability thataffects their quality of life and places a significant burden onthe health care system.2-4 To improve rehabilitation outcomesand reduce disability for persons with TBI, treatment plansneed to become more targeted. This can be accomplished byincreasing our understanding regarding commonly overlookedrehabilitation-related factors such as medical comorbidity andinsurance type.
Persons with TBI may experience medical comorbidities at asimilar rate as the general population.5 Conversely, they are
Supported by the US Department of Education-National Institute of Disability Research and
Rehabilitation (grant no. H133A020515).
Disclosures: none.
0003-9993/14/$36 - see front matter ª 2014 by the American Congress of Re
http://dx.doi.org/10.1016/j.apmr.2014.06.004
susceptible to the development of novel comorbidities, which cangenerally be attributed to injury, treatment, or posteinjury-relatedfactors. For instance, moderate-to-severe TBI is known to causeneuropathological changes,6 some of which have been linked tothe development of psychiatric illness.7-10 Epileptic seizures arealso commonly caused by TBI and can be more difficult to treatrelative to seizures in the absence of brain trauma.11 Moreover, theviolent causes of most TBIs can also cause persistent orthopedicinjuries.12
Treatments associated with TBI can increase the risk fordeveloping various complications. For example, induced hypo-thermia, which is used to improve neurological recovery in per-sons with severe TBI,13 may cause ventricular arrhythmia andartrioventricular blockage.14 Decompressive craniectomy has beenassociated with the development of brain infections, hydroceph-alus, and syndrome of the trephined.15 Similarly, intubation andtracheotomy procedures can lead to the development of sinusitis,
habilitation Medicine

Table 1 Demographic characteristics (NZ70)
2 E. Gardizi et al
laryngotracheal stenosis, vocal cord damage, esophageal perfo-ration, retropharyngeal abscess, and nerve injury.16-19
Lifestyle changes after TBI have also been associated withmedical illness. For instance, physical inactivity resulting fromdisability20 can lead to obesity, heart disease, and diabetes.21-24
Furthermore, difficulties in coping with TBI can result in thedevelopment of psychological illness, especially depression.25-27
Having briefly discussed common medical comorbidities thataffect persons with TBI, the next step is to better understand thecumulative effect of these complications on disability. For otherrehabilitation populations (ie, patients with stroke and orthopedicproblems), comorbidity has been shown to negatively affectdisability.28 Similarly, in persons with TBI, the presence ofmedical complications has also been associated with moredisability.29 However, the predictive ability of medical comor-bidity in relation to other variables as well as its long-term effecton disability is poorly understood.
Type of insurance coverage may also be an important prog-nostic factor given its effect on quality of care.30,31 For example,research has found that patients with Medicaid are 68% morelikely to be discharged to a skilled nursing facility rather than arehabilitation facility relative to patients with commercial insur-ance.32 It was also found that patients who are funded through ahealth maintenance organization (HMO) are 23% more likely tobe discharged to a skilled nursing facility than are patients withfee-for-service insurance.32 These results are important becauseinpatient rehabilitation facilities are thought to provide moreintensive postacute rehabilitation care than do skilled nursingfacilities or home health. Other studies have found that uninsuredpatients are less likely to be transferred to an inpatient rehabili-tation facility relative to commercially funded individuals.Uninsured individuals are also more likely to leave againstmedical advice, and they have a significantly shorter lengthof stay.33,34
These results suggest that type of insurance coverage has thepotential to predict outcome. However, studies that have exam-ined this issue tend to classify groups on the basis of individualswho are insured versus those who are uninsured. Not surprisingly,these investigations confirm that having insurance coverage isassociated with lower levels of disability.35 Conversely, the rela-tion between the type of insurance coverage (ie, government-funded vs commercially funded) and disability requires furtherexamination.
As such, the aim of this study was to investigate whether in-surance type and the cumulative effect of self-reported medicalcomorbidities are predictive of disability above and beyonddemographic and injury factors. It was hypothesized thatgovernment-funded insurance and greater self-reported medicalproblems would be associated with higher levels of disabilityafter TBI.
List of abbreviations:
BIC Bayesian information criterion
DRS Disability Rating Scale
EENT eye/ear/nose/throat
HMO health maintenance organization
MCIRS Modified Cumulative Illness Rating Scale
PTA posttraumatic amnesia
TBI traumatic brain injury
TBIMS Traumatic Brain Injury Model Systems
Methods
Participants
This study used archival data from 70 individuals enrolled in theSoutheastern Michigan Traumatic Brain Injury System, which ispart of the National Institute on Disability and RehabilitationResearchefunded Traumatic Brain Injury Model Systems(TBIMS) project.36 Approval for this study was granted by WayneState University’s Internal Review Board. Demographic and injurycharacteristics of the sample are described in tables 1 and 2,respectively. All participants received acute care at the TBIMS sitewithin 72 hours of injury and had a Glasgow Coma Scale score of3 to 12 or 13 to 15 with intracranial hemorrhage. Those with aGlasgow Coma Scale score of 13 to 15 with positive neuroimagingfindings were classified as having a mild-complicated TBI.37
Informed consent was obtained by the participant or a desig-nated proxy if the participant was suffering from posttraumaticamnesia (PTA) at the time of inpatient rehabilitation.
Measures
The Modified Cumulative Illness Rating Scale (MCIRS) was usedto assess medical comorbidities.28 The MCIRS was selectedbecause it allows a meaningful comparison of medical burden andtreatment outcomes in individuals with variable and complexmedical information and because it has been validated in a reha-bilitation population.28,38 The MCIRS is a 14-item rating scaleused to indicate medical burden by rating impairment across 13different organ systems (cardiac, hypertension, vascular, respira-tory, eye/ear/nose/throat [EENT], upper gastrointestinal, lowergastrointestinal, hepatic, renal, other genitourinary, musculoskel-etal, neurological, and endocrine-metabolic) as well as psychiatric/behavioral disturbances (excluding dementia). Ratings are madeon a 0 (no impairment) to 4 (extremely severe impairment) scale.For this study, ratings for the “neurological” category wereexcluded given the fact that it was already known that the par-ticipants sustained a TBI and the focus of this study was to look atcomorbid issues in conjunction with a TBI; thus, total scoresranged from 0 to 52.
The Disability Rating Scale (DRS) was used to assess thelevel of participant disability.39 The DRS consists of 4 categories(arousal and awareness, cognitive ability to handle self-care in-structions, physical dependence on others, and psychosocialability to work and perform daily functions). The scale wasdeveloped for use with adult individuals with moderate-to-severeTBI to track disability over the course of recovery. Total scores
Characteristic Mean � SD Range
Age (y) 37�14.2 16e67
Education (y) 12�2.2 8e18
Sex (%)
Male 81
Female 19
Ethnicity (%)
Black 61
White 36
Hispanic/Native
American/Pacific Islander
3
www.archives-pmr.org
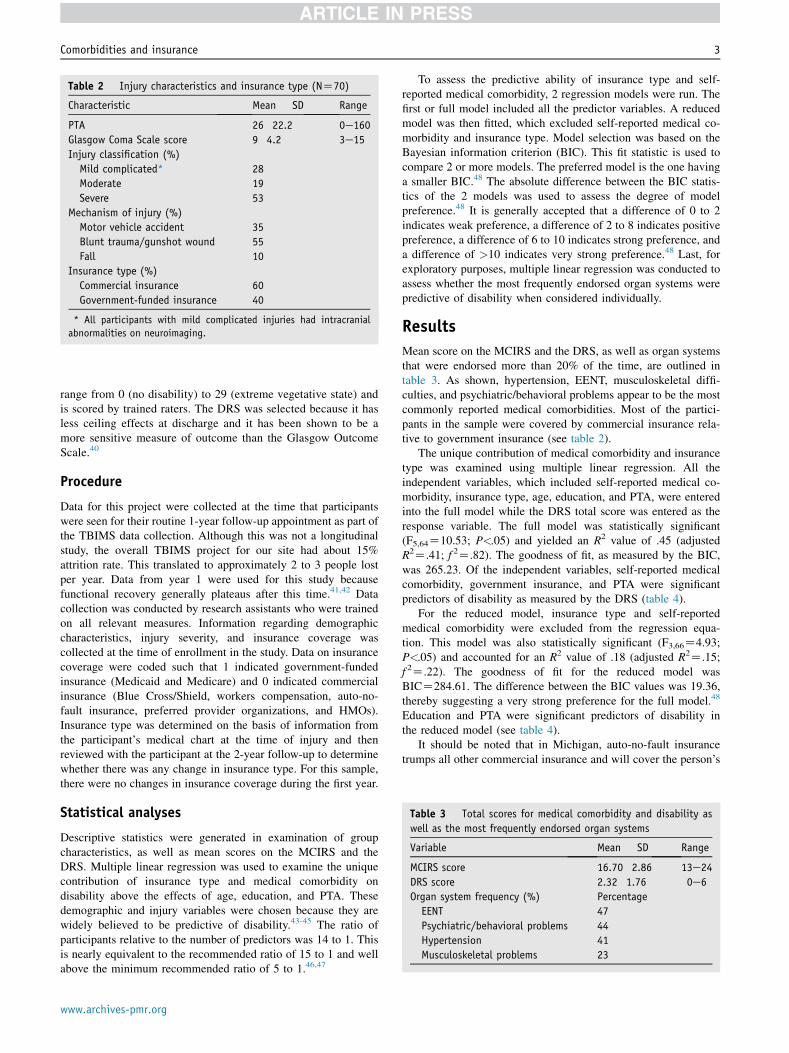
Table 2 Injury characteristics and insurance type (NZ70)
Characteristic Mean � SD Range
PTA 26�22.2 0e160
Glasgow Coma Scale score 9�4.2 3e15
Injury classification (%)
Mild complicated* 28
Moderate 19
Severe 53
Mechanism of injury (%)
Motor vehicle accident 35
Blunt trauma/gunshot wound 55
Fall 10
Insurance type (%)
Commercial insurance 60
Government-funded insurance 40
* All participants with mild complicated injuries had intracranial
abnormalities on neuroimaging.
Table 3 Total scores for medical comorbidity and disability as
well as the most frequently endorsed organ systems
Variable Mean � SD Range
MCIRS score 16.70�2.86 13e24
DRS score 2.32�1.76 0e6
Organ system frequency (%) Percentage
EENT 47
Psychiatric/behavioral problems 44
Hypertension 41
Musculoskeletal problems 23
Comorbidities and insurance 3
range from 0 (no disability) to 29 (extreme vegetative state) andis scored by trained raters. The DRS was selected because it hasless ceiling effects at discharge and it has been shown to be amore sensitive measure of outcome than the Glasgow OutcomeScale.40
Procedure
Data for this project were collected at the time that participantswere seen for their routine 1-year follow-up appointment as part ofthe TBIMS data collection. Although this was not a longitudinalstudy, the overall TBIMS project for our site had about 15%attrition rate. This translated to approximately 2 to 3 people lostper year. Data from year 1 were used for this study becausefunctional recovery generally plateaus after this time.41,42 Datacollection was conducted by research assistants who were trainedon all relevant measures. Information regarding demographiccharacteristics, injury severity, and insurance coverage wascollected at the time of enrollment in the study. Data on insurancecoverage were coded such that 1 indicated government-fundedinsurance (Medicaid and Medicare) and 0 indicated commercialinsurance (Blue Cross/Shield, workers compensation, auto-no-fault insurance, preferred provider organizations, and HMOs).Insurance type was determined on the basis of information fromthe participant’s medical chart at the time of injury and thenreviewed with the participant at the 2-year follow-up to determinewhether there was any change in insurance type. For this sample,there were no changes in insurance coverage during the first year.
Statistical analyses
Descriptive statistics were generated in examination of groupcharacteristics, as well as mean scores on the MCIRS and theDRS. Multiple linear regression was used to examine the uniquecontribution of insurance type and medical comorbidity ondisability above the effects of age, education, and PTA. Thesedemographic and injury variables were chosen because they arewidely believed to be predictive of disability.43-45 The ratio ofparticipants relative to the number of predictors was 14 to 1. Thisis nearly equivalent to the recommended ratio of 15 to 1 and wellabove the minimum recommended ratio of 5 to 1.46,47
www.archives-pmr.org
To assess the predictive ability of insurance type and self-reported medical comorbidity, 2 regression models were run. Thefirst or full model included all the predictor variables. A reducedmodel was then fitted, which excluded self-reported medical co-morbidity and insurance type. Model selection was based on theBayesian information criterion (BIC). This fit statistic is used tocompare 2 or more models. The preferred model is the one havinga smaller BIC.48 The absolute difference between the BIC statis-tics of the 2 models was used to assess the degree of modelpreference.48 It is generally accepted that a difference of 0 to 2indicates weak preference, a difference of 2 to 8 indicates positivepreference, a difference of 6 to 10 indicates strong preference, anda difference of >10 indicates very strong preference.48 Last, forexploratory purposes, multiple linear regression was conducted toassess whether the most frequently endorsed organ systems werepredictive of disability when considered individually.
Results
Mean score on the MCIRS and the DRS, as well as organ systemsthat were endorsed more than 20% of the time, are outlined intable 3. As shown, hypertension, EENT, musculoskeletal diffi-culties, and psychiatric/behavioral problems appear to be the mostcommonly reported medical comorbidities. Most of the partici-pants in the sample were covered by commercial insurance rela-tive to government insurance (see table 2).
The unique contribution of medical comorbidity and insurancetype was examined using multiple linear regression. All theindependent variables, which included self-reported medical co-morbidity, insurance type, age, education, and PTA, were enteredinto the full model while the DRS total score was entered as theresponse variable. The full model was statistically significant(F5,64Z10.53; P<.05) and yielded an R2 value of .45 (adjustedR2Z.41; f 2Z.82). The goodness of fit, as measured by the BIC,was 265.23. Of the independent variables, self-reported medicalcomorbidity, government insurance, and PTA were significantpredictors of disability as measured by the DRS (table 4).
For the reduced model, insurance type and self-reportedmedical comorbidity were excluded from the regression equa-tion. This model was also statistically significant (F3,66Z4.93;P<.05) and accounted for an R2 value of .18 (adjusted R2Z.15;f 2Z.22). The goodness of fit for the reduced model wasBICZ284.61. The difference between the BIC values was 19.36,thereby suggesting a very strong preference for the full model.48
Education and PTA were significant predictors of disability inthe reduced model (see table 4).
It should be noted that in Michigan, auto-no-fault insurancetrumps all other commercial insurance and will cover the person’s

Table 4 Coefficient, SE, and P values for the regression models
Model Variable B SE b P
1 (Full) Age .00 .01 �.00 .97
Education �.09 .07 �.12 .25
PTA .03 .01 .36 .00
Self-reported medical
comorbidity
.23 .06 .38 .00
Government insurance 1.57 .35 .44 .00
2 (Reduced) Age .01 .01 .12 .28
Education �.22 .08 �.30 .03
PTA .02 .01 .27 .02
NOTE. Model 1 predictors: medical comorbidity, insurance type, age,
years of education at injury, and PTA. Model 2 predictors: age, years of
education at injury, and PTA.
Abbreviation: SE, standard error.
Table 6 Coefficient, SE, and P values for the regression model
with covariates
Model Variable B SE b P
1 (Complete) Age .00 .01 �.01 .89
Education �.03 .08 �.05 .65
PTA .03 .01 .35 .00
Self-reported medical
comorbidity
.26 .06 .42 .00
Government insurance 1.5 .36 .43 .00
Race .94 .37 .26 .01
Cause of injury �.36 .38 �.10 .35
NOTE. Covariates include race and cause of injury.
Abbreviation: SE, standard error.
4 E. Gardizi et al
medical care even if he or she loses medical insurance. For oursample, 26% of the individuals were covered by auto-no-faultinsurance. To control for possible confounding effects, dummycoding was used to categorize auto insurance as a separate type ofinsurance. Government-funded insurance was designated as thereference group and was assigned a value of [0, 0], commercialinsurance was coded [1, 0], and auto insurance was coded[0, 1]. The dummy variables were then entered into a multiplelinear regression model along with PTA, education, age, and self-reported medical comorbidity. The results showed that individualswith government-funded insurance continued to experience higherrates of disability relative to those with commercial insurance andauto insurance (table 5). Consequently, for the purpose of thisstudy, we felt that it was reasonable to categorize auto insurance asa commercial insurance.
Independent-samples t tests were conducted to examine dif-ferences in group characteristics between individuals with com-mercial insurance and individuals with government-fundedinsurance. Individuals with commercial insurance were more likelyto be white [t(65)Z�2.14; P<.05], educated [t(68)Z2.51; P<.05],and injured through noneassault-related means (ie, motor vehicleaccidents/falls) [t(50)Z�3.11; P<.05] relative to individualswith government-funded insurance. Conversely, there were nobetween-group differences for age [t(68)Z.12; P>.05], employ-ment status [t(55)Z1.58; P>.05], PTA [t(68)Z1.3; P>.05],length of hospital stay [t(67)Z.64; P>.05], total MCIRS score[t(68)Z.54; P>.05], and incarceration history [t(45)Z�1.66;P>.05]. Racial status, which was coded as 0 for white and 1 for
Table 5 Coefficient, SE, and P values for the regression model
with private and auto insurance
Model Variable B SE b P
1 (Complete) Age .00 .01 �.02 .79
Education �.07 .07 �.10 .30
PTA .02 .01 .29 .00
Self-reported medical
comorbidity
.23 .06 .38 .00
Private insurance �2.02 .38 �.55 .00
Auto insurance �.92 .42 �.23 .03
NOTE. Government-funded insurance used as reference group.
Abbreviation: SE, standard error.
minority (black, Hispanic, Native American, and Pacific Islander),and cause of injury, which was coded 0 for noneassault-relatedand 1 for assault related, were entered into the full regressionmodel to assess whether they confounded the relation betweeninsurance type and disability. Although it was found that minoritystatus was associated with disability, this did not affect the relationbetween government-funded insurance and disability (table 6).
The most frequently endorsed organ systems were examined todetermine whether they individually predicted disability. Given thatlevels of impairment on these subscales were rated as minimal,responses were coded dichotomously to account for the lack ofvariability. Specifically, 0 was coded as “no impairment,” whereas 1was coded as “any type of impairment” (eg, mild, moderate, andsevere). Results of the standard regression revealed that hyperten-sion, EENT, musculoskeletal, and psychiatric/behavioral systemson their own did not predict disability at 1-year follow up.
Discussion
As anticipated, self-reported medical comorbidity and insurancetype predicted disability above and beyond established prognosticvariables. The most frequently endorsed organ systems were (1)hypertension, (2) psychiatric/behavioral problems, (3) EENT, and(4) musculoskeletal problems. Endorsement of individual organsystems, however, was not predictive of outcome. Rather, it wasthe cumulative effect of minor self-reported medical complica-tions that was most impactful. As noted at the beginning of thearticle, some of these medical complications may have resultedfrom TBI-related factors. However, research has shown thatpersistent somatic complaints after mild TBI can be related topsychiatric and personality factors.49,50 Future studies shouldexamine whether this pattern is evident for more seriously injuredindividuals. Importantly, our results also showed that effects ofmedical comorbidities on disability can persist up to a yearafter injury.
It was also found that individuals with government-fundedinsurance had higher levels of disability relative to individualswith commercial insurance. This relation persisted even whenlevel of education, race, and cause of injury were controlled for.This may suggest that government-funded insurance is associatedwith lower quality care relative to commercial insurance. Giventhat all the participants in our sample were provided with acutecare at a level 1 trauma facility, it is likely that disparities inquality of care became salient once the patients were discharged.This may result from limitations in long-term health care services
www.archives-pmr.org
Comorbidities and insurance 5
that are provided by government-funded insurance policies. Forexample, individuals with Medicare receive coverage only forlong-term skilled care provided in nursing facilities.51 As dis-cussed, the care provided at these facilities may not be as intensiveas rehabilitation settings. In addition, Medicare will cover thecomplete cost of nursing home care for only up to 20 days andonly part of the cost for days 21 to 100.51 This may impede in-dividuals with Medicare from acquiring necessary servicesbecause of financial limitations. Although the coverage that isprovided by Medicaid is more comprehensive relative to Medi-care, it can require individuals to apply through secondary pro-grams (ie, MI Choice Waiver Program) for adequate long-termcare that is outside of a nursing home.52 Consequently, individualswith Medicaid may not be aware of which services they areeligible for or how to obtain them. Similarly, managed health careservices such as those provided by HMOs may be limited becausethey require individuals to receive care from doctors and hospitalsthat are part of the HMO network.53 Individuals are not coveredfor any out-of-network services they may require. Also, referralsto specialists can be made only through the primary care physicianand the specialist must also be a part of the HMO network.53 Incomparison, individuals with commercial insurance have morefreedom to choose their provider network and can often see spe-cialists without a referral. These limitations may have contributedto our results; nevertheless, more research needs to focus on howrehabilitation services can vary on the basis of insurance coverageand how this affects outcome.
Study limitations
There are some notable limitations to this study. First, our samplesize was small; as such, future studies should attempt to replicateour findings with larger samples. Given that the MCIRS is a self-report measure, there is always concern regarding subjectiveresponding. Several variables were examined to explain in-between group differences between persons with government-funded insurance and persons with commercial insurance. It ispossible, however, that we overlooked others such as substanceabuse and mental health history, which may have been importantto consider.54 Our study was also limited in that most of ourgovernment-funded participants consisted of those with Medicaidor HMO insurance. From a socioeconomic standpoint, Medicaidand Medicare may be associated with different population char-acteristics. As a result, follow-up studies should attempt to look atthese insurance types separately. In addition, many of the eligi-bility requirements for government-funded insurance, in particularMedicaid, are state dependent. Consequently, this sample may beslightly different from other persons with TBI for whom there isno such auto-no-fault coverage or for whom Medicaid eligibilitycriteria differ. Last, one of the greatest obstacles when studyingpatients with moderate to severe TBI is their lack of self-awareness. Not controlling for this factor may have confoundedour results to some extent, particularly as it relates to the under-reporting of problems on the MCIRS.
Conclusions
Our results provide evidence for the effect of insurance typeand self-reported medical comorbidity on disability after TBI.Improving services provided by government-funded insurance aswell as early assessment and treatment of medical comorbiditiesmay improve quality of life as well as reduce long-term healthcare costs as it pertains to this population.
www.archives-pmr.org
Keywords
Comorbidity; Insurance; Rehabilitation; Traumatic brain injury
Corresponding author
Elmar Gardizi, MA, Department of Psychology, University ofWindsor, Chrysler Hall South, 401 Sunset Ave, Windsor, ON,Canada N9B 3P4. E-mail address: [email protected].
Acknowledgments
We thank Robert Kotasek, MA, and Carole Koviak, RN, MSA,for their assistance with data collection and management forthis project.
References
1. Faul M, Xu L, Wald MM, Coronado VG. Traumatic brain injury in
the United States: emergency department visits, hospitalizations, and
deaths. Available from: http://www.cdc.gov/traumaticbraininjury/
pdf/blue_book.pdf. Accessed March 20, 2013.
2. Webb CR, Wrigley M, Yoels W, Fine PR. Explaining quality of life
for persons with traumatic brain injuries 2 years after injury. Arch
Phys Med Rehabil 1995;76:1113-9.
3. Orman JAL, Kraus JF, Zaloshnja E, Miller T. Epidemiology. In:
Silver JM, McAllister TW, Yudofsky SC, editors. Textbook of trau-
matic brain injury. 2nd ed. Washington (DC): American Psychiatric
Pub; 2011. p 3-22.
4. Finkelstein EA, Corso PC, Miller TR, Fiebelkorn IA, Zaloshnja E,
Lawrence BA. Incidence and economic burden of injuries in the
United States. New York: Oxford Univ Pr; 2006.
5. Holcomb EM, Millis SR, Hanks RA. Comorbid disease in persons
with traumatic brain injury: descriptive findings utilizing the modi-
fied cumulative illness rating scale. Arch Phys Med Rehabil 2012;93:
1338-42.
6. Lucas JA, Addeo R. Traumatic brain injury and postconcussion
syndrome. In: Snyder PJ, Nussbaum PD, Robins DL, editors. Clinical
neuropsychology: a pocket handbook for assessment. 2nd ed.
Washington (DC): American Psychological Association; 2009. p
351-80.
7. Fujii D, Ahmed I, Hishinuma E. A neuropsychological comparison
of psychotic disorder following traumatic brain injury, traumatic
brain injury without psychotic disorder, and schizophrenia. J
Neuropsychiatry Clin Neurosci 2004;16:306-14.
8. Jorge RE, Acion L, Starkstein SE, Magnotta V. Hippocampal volume
and mood disorders after traumatic brain injury. Biol Psychiatry
2007;62:332-8.
9. Rao V, Munro C, Rosenberg P, et al. Neuroanatomical correlates of
depression in post traumatic brain injury: preliminary results of a
pilot study. J Neuropsychiatry Clin Neurosci 2010;22:231-5.
10. Zafonte RD, Cullen N, Lexell J. Serotonin agents in the treatment of
acquired brain injury. J Head Trauma Rehabil 2002;17:322-34.
11. Semah F, Picot MC, Adam C, et al. Is the underlying cause of epi-
lepsy a major prognostic factor for recurrence? Neurology 1998;51:
1256-62.
12. Colantonio A, Ratcliff G, Chase S, Vernich L. Aging with traumatic
brain injury: long-term health conditions. Int J Rehabil Res 2004;27:
209-14.
13. Marion DW, Penrod LE, Kelsey SF, et al. Treatment of traumatic
brain injury with moderate hypothermia. N Engl J Med 1997;336:
540-6.
14. Clifton GL, Allen S, Berry J, Koch SM. Systemic hypothermia in
treatment of brain injury. J Neurotrauma 1992;9:S487.

6 E. Gardizi et al
15. Stiver SI. Complications of decompressive craniectomy for traumatic
brain injury. Neurosurg Focus 2009;26:7.
16. Benumof J, Hagberg CA. Benumof’s airway management: principles
and practice. Philadelphia: Mosby Inc; 2007.
17. Pilitsis JG, Rengachary SS. Complications of head injury. Neurol Res
2001;23:227-36.
18. Richard I, Hamon MA, Ferrapie AL, Rome J, Brunel P, Mathe JF.
[Tracheostomy in brain injured patients: which patients? Why?
When? How?] [French]. Ann Fr Anesth Reanim 2005;24:659-62.
19. Stauffer JL, Olson DE, Petty TL. Complications of endotracheal
intubation and tracheotomy: a prospective study of 150 critically ill
patients. Am J Med 1981;70:65-76.
20. Rimmer JH. Exercise and physical activity in persons aging
with a physical disability. Phys Med Rehabil Clin N Am 2005;16:
41-56.
21. Bassuk SS, Manson JE. Epidemiological evidence for the role of
physical activity in reducing risk of type 2 diabetes and cardiovas-
cular disease. J Appl Physiol 2005;99:1193-204.
22. Berlin JA, Colditz GA. A meta-analysis of physical activity in
the prevention of coronary heart disease. Am J Epidemiol 1990;132:
612-28.
23. Laaksonen DE, Lakka HM, Salonen JT, Niskanen LK, Rauramaa R,
Lakka TA. Low levels of leisure-time physical activity and cardio-
respiratory fitness predict development of the metabolic syndrome.
Diabetes Care 2002;25:1612-8.
24. Liou TH, Pi-Sunyer FX, Laferrere B. Physical disability and obesity.
Nutr Rev 2005;63:321-31.
25. Rogers JM, Read CA. Psychiatric comorbidity following traumatic
brain injury. Brain Inj 2007;21:1321-33.
26. Bombardier CH, Fann JR, Temkin NR, Esselman PC, Barber J,
Dikmen SS. Rates of major depressive disorder and clinical
outcomes following traumatic brain injury. JAMA 2010;303:
1938-45.
27. Rapoport MJ. Depression following traumatic brain injury. CNS
Drugs 2012;26:111-121.
28. Giaquinto S, Palma E, Maiolo I, et al. Importance and evaluation of
comorbidity in rehabilitation. Disabil Rehabil 2001;23:296-9.
29. Lew HL, Lee E, Date ES, Zeiner H. Influence of medical comor-
bidities and complications on FIM (TM) change and length of
stay during inpatient rehabilitation. Am J Phys Med Rehabil 2002;81:
830-7.
30. Chan L, Ciol MA. Medicare’s payment system: its effect on dis-
charges to skilled nursing facilities from rehabilitation hospitals.
Arch Phys Med Rehabil 2000;81:715-9.
31. Retchin SM, Brown RS, Yeh S-C, Chu D, Moreno L. Outcome of
stroke patients in Medicare fee for service and managed care. JAMA
1997;278:119-24.
32. Chan L, Doctor J, Temkin N. Discharge disposition from acute care
after traumatic brain injury: the effects of insurance type. Arch Phys
Med Rehabil 2001;82:1151-4.
33. Nirula R, Nirula G, Gentilello L. Inequity of rehabilitation services
after traumatic injury. J Trauma 2008;66:255-9.
34. Heffernan DS, Vera RM, Monaghan SF, et al. Impact of socioethnic
factors on outcomes following traumatic brain injury. J Trauma 2011;
70:527-34.
35. Shafi S, de la Plata CM, Diaz-Arrastia R, et al. Racial disparities in
long-term functional outcome after traumatic brain injury. J Trauma
Acute Care Surg 2007;63:1263-70.
36. Corrigan JD, Cuthbert JP, Whiteneck GG, et al. Representativeness
of the Traumatic Brain Injury Model Systems Database. J Head
Trauma Rehabil 2011;26:1-9.
37. Kashluba S, Hanks RA, Casey JE, Millis SR. Neuropsychologic and
functional outcome after complicated mild traumatic brain injury.
Arch Phys Med Rehabil 2008;89:904-11.
38. Salvi F, Miller MD, Grilli A, et al. A manual of guidelines to score
the modified cumulative illness rating scale and its validation in
acute hospitalized elderly patients. J Am Geriatr Soc 2008;56:
1926-31.
39. Rappaport M, Hall KM, Hopkins K, Belleza T, Cope DN. Disability
rating scale for severe head trauma: coma to community. Arch Phys
Med Rehabil 1982;63:118-23.
40. Cowen TD, Meythaler JM, DeVivo MJ, Ivie CS III, Lebow J,
Novack TA. Influence of early variables in traumatic brain injury on
functional independence measure scores and rehabilitation length of
stay and charges. Arch Phys Med Rehabil 1995;76:797-803.
41. Hammond FM, Grattan KD, Sasser H, et al. Five years after trau-
matic brain injury: a study of individual outcomes and predictors of
change in function. NeuroRehabilitation 2004;19:24-35.
42. Oddy M, Coughlan T, Tyerman A, Jenkins D. Social adjustment after
closed head injury: a further follow-up seven years after injury. J
Neurol Neurosurg Psychiatry 1985;48:564-8.
43. Ponsford J, Draper K, Schonberger M. Disability 10 years after
traumatic brain injury: its relationship with demographic, injury
severity, and cognitive and emotional status. J Int Neuropsychol Soc
2008;14:233-42.
44. Hukkelhoven CW, Steyerberg EW, Rampen AJ, et al. Patient age and
outcome following severe traumatic brain injury: an analysis of 5600
patients. J Neurosurg 2003;99:666-73.
45. Shavelle R, Strauss D, Day S, Ojdana K. Life expectancy. In:
Zasler ND, Katz DI, Zafonte RD, editors. Brain injury medicine:
principles and practice. New York: Demos Medical; 2007. p 247-61.
46. Stevens J. Applied multivariate statistics for the social sciences.
Hillsdale: Erlbaum; 1986.
47. Tabachnick BG, Fidel LS. Using multivariate statistics. 2nd ed. New
York: Harper & Row; 1989.
48. Raftery AE. Approximate Bayes factors and accounting for model
uncertainty in generalised linear models. Biometrika 1996;83:251-66.
49. Ruff RM, Lorraine C, Mueller J. Miserable minority: emotional risk
factors that influence the outcome of mild traumatic brain injury.
Brain Inj 1996;10:551-66.
50. Lange RT, Iverson GL, Rose A. Depression strongly influences
postconcussion symptom reporting following mild traumatic brain
injury. J Head Trauma Rehabil 2011;26:127-37.
51. LongTermCare.gov. Available from: http://longtermcare.gov/medicare-
medicaid-more/medicare/. Accessed July 31, 2013.
52. Choices for older or disabled persons who may need help caring
for themselves. Michigan: Michigan.gov. 2012. Available from: http://
www.michigan.gov/mdch/0, 4612,7-132-2943_4857_5045-16263e,
00.html. Accessed July 31, 2013.
53. Bihari M. HMOs vs. PPOs e what are the differences between HMOs
and PPOs? 2010. Available from: http://healthinsurance.about.com/
od/understandingmanagedcare/a/HMOs_vs_PPOs.htm. Accessed July
31, 2013.
54. Adelmann PK. Mental and substance abuse disorders among
Medicaid recipients: prevalence estimates from two national surveys.
Admin Policy Ment Health 2003;31:111-29.
www.archives-pmr.org
Related Documents