This article appeared in a journal published by Elsevier. The attached copy is furnished to the author for internal non-commercial research and education use, including for instruction at the authors institution and sharing with colleagues. Other uses, including reproduction and distribution, or selling or licensing copies, or posting to personal, institutional or third party websites are prohibited. In most cases authors are permitted to post their version of the article (e.g. in Word or Tex form) to their personal website or institutional repository. Authors requiring further information regarding Elsevier’s archiving and manuscript policies are encouraged to visit: http://www.elsevier.com/copyright

Welcome message from author
This document is posted to help you gain knowledge. Please leave a comment to let me know what you think about it! Share it to your friends and learn new things together.
Transcript
This article appeared in a journal published by Elsevier. The attachedcopy is furnished to the author for internal non-commercial researchand education use, including for instruction at the authors institution
and sharing with colleagues.
Other uses, including reproduction and distribution, or selling orlicensing copies, or posting to personal, institutional or third party
websites are prohibited.
In most cases authors are permitted to post their version of thearticle (e.g. in Word or Tex form) to their personal website orinstitutional repository. Authors requiring further information
regarding Elsevier’s archiving and manuscript policies areencouraged to visit:
http://www.elsevier.com/copyright
Author's personal copy
Accident Analysis and Prevention 42 (2010) 2149–2157
Contents lists available at ScienceDirect
Accident Analysis and Prevention
journa l homepage: www.e lsev ier .com/ locate /aap
Commuting by bike in Belgium, the costs of minor accidents
Joris Aertsensa, Bas de Geusb, Grégory Vandenbulckec, Bart Degraeuwea, Steven Broekxa,Leo De Nockera, Inge Liekensa, Inge Mayeresa,e, Romain Meeusenb, Isabelle Thomasc,Rudi Torfsa, Hanny Willemsa, Luc Int Panisa,d,∗
a Flemish Institute for Technological Research (VITO), 200 Boeretang, Mol B-2400, Belgiumb Vrije Universiteit Brussel (VUB), Faculteit LK, Department Human Physiology & Sports Medicine, Pleinlaan 2, Brussels B-1050, Belgiumc CORE & Department of Geography, Université catholique de Louvain (UCL), 34 Voie du Roman Pays, Louvain-la-Neuve B-1348, Belgiumd Transportation Research Institute (IMOB), University of Hasselt, Campus Diepenbeek, Wetenschapspark 5 bus 6, B-3590 Diepenbeek, Belgiume K.U. Leuven, Faculty of Business and Economics, Leuven B-3000, Belgium
a r t i c l e i n f o
Article history:Received 21 May 2010Received in revised form 9 July 2010Accepted 14 July 2010
Keywords:Commuter cyclingActive travelTraffic safetyBicycle accidentsAccident riskMedical costsCost of illnessIntangible costsProspective survey
a b s t r a c t
Minor bicycle accidents are defined as “bicycle accidents not involving death or heavily injured persons,implying that possible hospital visits last less than 24 hours”. Statistics about these accidents and relatedinjuries are very poor, because they are mostly not reported to police, hospitals or insurance companies.Yet, they form a major share of all bicycle accidents. Official registrations underestimate the numberof minor accidents and do not provide cost data, nor the distance cycled. Therefore related policies arehampered by a lack of accurate data.
This paper provides more insight into the importance of minor bicycle accidents and reports the fre-quency, risk and resulting costs of minor bicycle accidents. Direct costs, including the damage to bike andclothes as well as medical costs and indirect costs such as productivity loss and leisure time lost are cal-culated. We also estimate intangible costs of pain and psychological suffering and costs for other partiesinvolved in the accident. Data were collected during the SHAPES project using several electronic surveys.The weekly prospective registration that lasted a year, covered 1187 persons that cycled 1,474,978 km.219 minor bicycle accidents were reported. Resulting in a frequency of 148 minor bicycle accidents permillion kilometres. We analyzed the economic costs related to 118 minor bicycle accidents in detail. Theaverage total cost of these accidents is estimated at 841 euro (95% CI: 579–1205) per accident or 0.125euro per kilometre cycled. Overall, productivity loss is the most important component accounting for48% of the total cost. Intangible costs, which in past research were mostly neglected, are an importantburden related to minor bicycle accidents (27% of the total cost). Even among minor accidents there areimportant differences in the total cost depending on the severity of the injury.
© 2010 Elsevier Ltd. All rights reserved.
1. Introduction
The interest of policy makers in commuter cycling as a solutionto a myriad of problems such as energy demand, climate change, airpollution, congestion and physical inactivity has recently increased(e.g. de Nazelle and Nieuwenhuijsen, 2010; Lusk et al., 2010). How-ever, policies on a modal shift to active transport are hampered by alack of accurate data and formal risk assessments. This article is partof the SHAPES-project (Berghmans et al., 2009; Int Panis et al., 2009,2010; Vandenbulcke et al., 2009) that aimed to quantify the healthbenefits and costs of commuter cycling for the cyclist and for societyin order to assist policy makers with developing future transport
∗ Corresponding author at: Flemish Institute for Technological Research (VITO),200 Boeretang, Mol B-2400, Belgium. Tel.: +32 14 33 51 02; fax: +32 14 58 05 23.
E-mail addresses: [email protected], [email protected] (L. Int Panis).
and public health policies. For the individual cyclist, the physicalactivity involved in cycling can enhance the long-term health (deGeus et al., 2008, 2009; Hendriksen et al., 2000; Andersen et al.,2000), but he/she may be exposed to higher risks due to air pol-lution and accidents. From a societal point of view a non-marginalshift from the use of motorised vehicles to cycling is expected torealize a better general air quality, a better overall physical condi-tion of the population, and an increased general traffic safety, dueto the “safety in numbers” effect (Jacobsen, 2003; Robinson, 2005;Elvik, 2009).
The specific aim of this paper is to estimate the costs related to“minor bicycle accidents” as a step towards a complete cost–benefitevaluation of commuter cycling. In line with the national databasesin Belgium, minor bicycle accidents are defined as “bicycle acci-dents not involving death or heavily injured persons, implying thatpossible hospital visits lasted less than 24 hours”. Focussing onminor accidents in this study is meaningful for three reasons: (1)they are by far the most numerous among all accidents, (2) they are
0001-4575/$ – see front matter © 2010 Elsevier Ltd. All rights reserved.doi:10.1016/j.aap.2010.07.008
Author's personal copy
2150 J. Aertsens et al. / Accident Analysis and Prevention 42 (2010) 2149–2157
strongly under-registered in official statistics and (3) very little isknown about the related costs.
In Belgium in 2007, out of all 8048 officially registered victimsfrom bicycle accidents, 7013 were due to “minor bicycle accidents”,926 due to “major accidents” and 88 victims died within 30 daysafter the accident (BRSI, 2009). When considering these officialstatistics it is important to realize that most road accident statis-tics strongly underestimate the total number of cycling accidents(Aultman-Hall and Hall, 1998; Elvik and Mysen, 1999; Dhillon etal., 2001; Bickel et al., 2006; De Mol and Lammar, 2006). Especiallywhen there is no hospitalisation and/or when the cyclist is the onlyparty involved, accidents do not appear in accident statistics (Elvikand Vaa, 2004; Vandenbulcke et al., 2009). Veisten et al. (2007)estimated that in Norway the official statistics only cover 13% of allbicycle accidents and that light injuries in particular are stronglyunder-registered (only 12% of all light injuries were reported com-pared to 33% of the serious injuries and 71% of the severe injuries).In Belgium, only 15 to 30% of cycling accidents are officially reported(Doom and Derweduwen, 2005; De Mol and Lammar, 2006; BRSI,2006). A top down estimation of the total cost of cycling acci-dents in general and for minor accidents in particular, based onthe official statistics is therefore problematic. In contrast, our sur-vey applies a bottom-up approach and is much better suited forstudying the frequency and costs related to minor bicycle accidents.Earlier calculations of the cost of bicycle accidents in Belgium aretherefore based on many assumptions and riddled with uncertainty(De Nocker et al., 2006).
A search on “ISI Web of Knowledge” and “Pubmed” for the terms“bicycle accidents” and “costs” in title/abstract learned that there isvery limited information about the costs of bicycle accidents. OnlyVeisten et al. (2007) have thoroughly studied the costs of bicycleaccidents. Their estimation is based on the number of bicycle acci-dents in different categories according to the Abbreviated InjuryScale (AIS an indicator of the severity of the injury in relation tothe probability of decease). Their data were reported by hospitalsin Norway in the period 1990–1997 and combined with cost fig-ures from the US provided by Miller (1993). They calculated thatthe average cost for a bicycle accident resulting in a minor injurywas 42,990 Norwegian Kroner (2004 prices) or approximately 5804euro (2010 prices). According to Veisten et al. (2007) the totalcost for such a minor injury is composed of costs for a reducedquality of life (57%), productivity loss (12%), administrative costs(13%), medical costs (10%), property damage (8%) and traffic delays(0.5%). Major drawbacks of the study of Veisten et al. (2007) are:(1) the cost of reduced quality of life is estimated by the willing-ness to pay (WTP) of individuals for reducing injury/fatality risk.This measure represents an ex ante value of risk reduction anddoes not measure grief and pain ex post; (2) only bicycle accidentsreported by the hospitals were taken into account. Although thisis a huge improvement in comparison with the official statistics, it
may again result in an under-reporting because many minor bicy-cle accidents do not result in hospitalisation. (3) AIS is not a verygood indicator of the total cost for a crash survivor, because thetype of body part(s) that are affected and the possible presence of afracture have an important influence on the costs (Zaloshnja et al.,2004).
2. Methodology
2.1. Theoretical framework
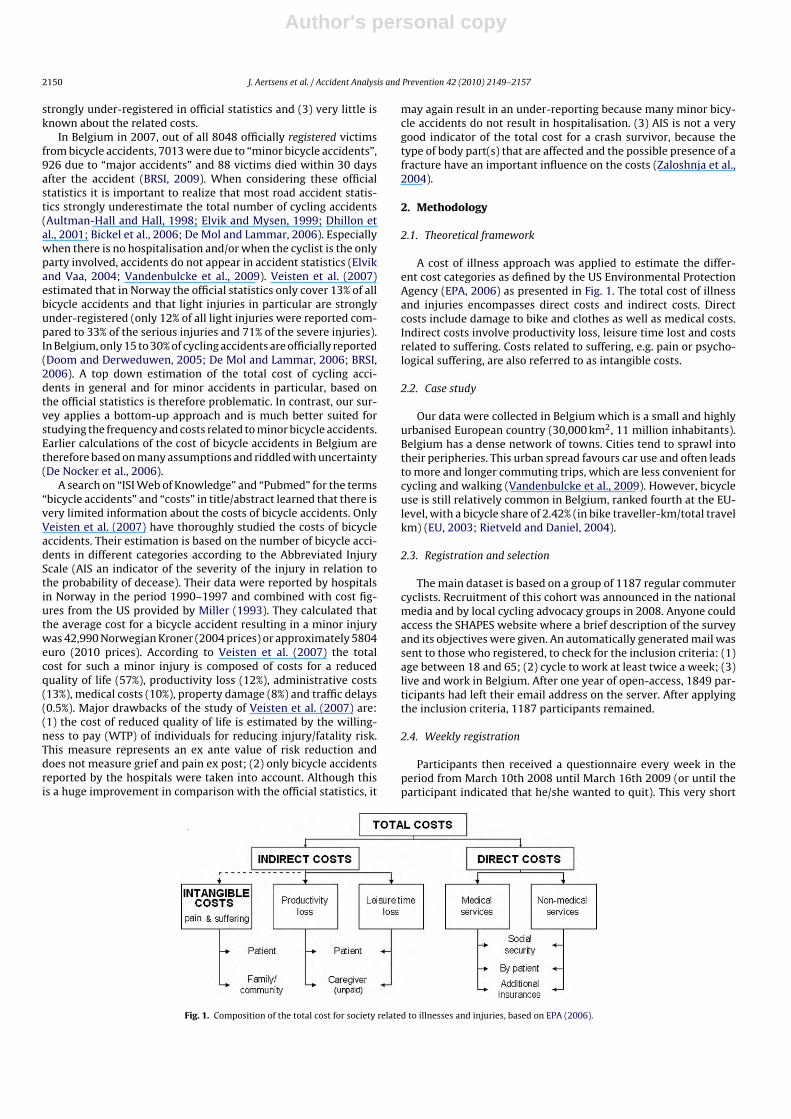
A cost of illness approach was applied to estimate the differ-ent cost categories as defined by the US Environmental ProtectionAgency (EPA, 2006) as presented in Fig. 1. The total cost of illnessand injuries encompasses direct costs and indirect costs. Directcosts include damage to bike and clothes as well as medical costs.Indirect costs involve productivity loss, leisure time lost and costsrelated to suffering. Costs related to suffering, e.g. pain or psycho-logical suffering, are also referred to as intangible costs.
2.2. Case study
Our data were collected in Belgium which is a small and highlyurbanised European country (30,000 km2, 11 million inhabitants).Belgium has a dense network of towns. Cities tend to sprawl intotheir peripheries. This urban spread favours car use and often leadsto more and longer commuting trips, which are less convenient forcycling and walking (Vandenbulcke et al., 2009). However, bicycleuse is still relatively common in Belgium, ranked fourth at the EU-level, with a bicycle share of 2.42% (in bike traveller-km/total travelkm) (EU, 2003; Rietveld and Daniel, 2004).
2.3. Registration and selection
The main dataset is based on a group of 1187 regular commutercyclists. Recruitment of this cohort was announced in the nationalmedia and by local cycling advocacy groups in 2008. Anyone couldaccess the SHAPES website where a brief description of the surveyand its objectives were given. An automatically generated mail wassent to those who registered, to check for the inclusion criteria: (1)age between 18 and 65; (2) cycle to work at least twice a week; (3)live and work in Belgium. After one year of open-access, 1849 par-ticipants had left their email address on the server. After applyingthe inclusion criteria, 1187 participants remained.
2.4. Weekly registration
Participants then received a questionnaire every week in theperiod from March 10th 2008 until March 16th 2009 (or until theparticipant indicated that he/she wanted to quit). This very short
Fig. 1. Composition of the total cost for society related to illnesses and injuries, based on EPA (2006).
Author's personal copy
J. Aertsens et al. / Accident Analysis and Prevention 42 (2010) 2149–2157 2151
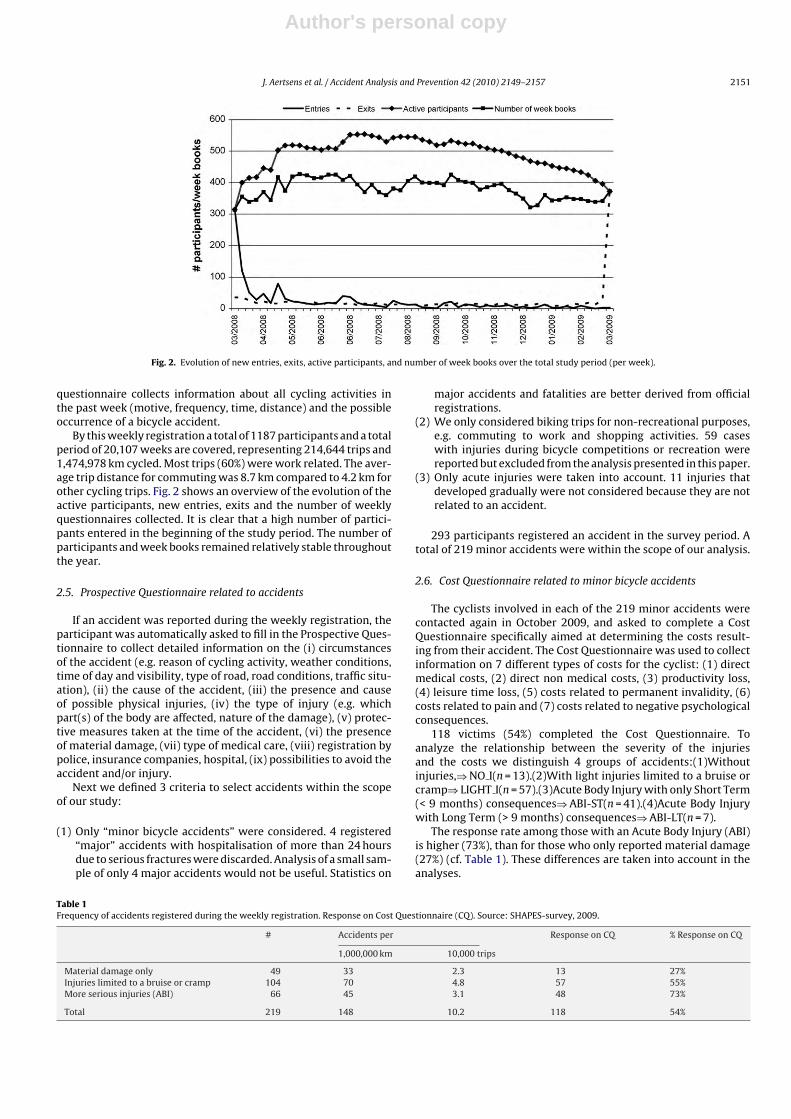
Fig. 2. Evolution of new entries, exits, active participants, and number of week books over the total study period (per week).
questionnaire collects information about all cycling activities inthe past week (motive, frequency, time, distance) and the possibleoccurrence of a bicycle accident.
By this weekly registration a total of 1187 participants and a totalperiod of 20,107 weeks are covered, representing 214,644 trips and1,474,978 km cycled. Most trips (60%) were work related. The aver-age trip distance for commuting was 8.7 km compared to 4.2 km forother cycling trips. Fig. 2 shows an overview of the evolution of theactive participants, new entries, exits and the number of weeklyquestionnaires collected. It is clear that a high number of partici-pants entered in the beginning of the study period. The number ofparticipants and week books remained relatively stable throughoutthe year.
2.5. Prospective Questionnaire related to accidents
If an accident was reported during the weekly registration, theparticipant was automatically asked to fill in the Prospective Ques-tionnaire to collect detailed information on the (i) circumstancesof the accident (e.g. reason of cycling activity, weather conditions,time of day and visibility, type of road, road conditions, traffic situ-ation), (ii) the cause of the accident, (iii) the presence and causeof possible physical injuries, (iv) the type of injury (e.g. whichpart(s) of the body are affected, nature of the damage), (v) protec-tive measures taken at the time of the accident, (vi) the presenceof material damage, (vii) type of medical care, (viii) registration bypolice, insurance companies, hospital, (ix) possibilities to avoid theaccident and/or injury.
Next we defined 3 criteria to select accidents within the scopeof our study:
(1) Only “minor bicycle accidents” were considered. 4 registered“major” accidents with hospitalisation of more than 24 hoursdue to serious fractures were discarded. Analysis of a small sam-ple of only 4 major accidents would not be useful. Statistics on
major accidents and fatalities are better derived from officialregistrations.
(2) We only considered biking trips for non-recreational purposes,e.g. commuting to work and shopping activities. 59 caseswith injuries during bicycle competitions or recreation werereported but excluded from the analysis presented in this paper.
(3) Only acute injuries were taken into account. 11 injuries thatdeveloped gradually were not considered because they are notrelated to an accident.
293 participants registered an accident in the survey period. Atotal of 219 minor accidents were within the scope of our analysis.
2.6. Cost Questionnaire related to minor bicycle accidents
The cyclists involved in each of the 219 minor accidents werecontacted again in October 2009, and asked to complete a CostQuestionnaire specifically aimed at determining the costs result-ing from their accident. The Cost Questionnaire was used to collectinformation on 7 different types of costs for the cyclist: (1) directmedical costs, (2) direct non medical costs, (3) productivity loss,(4) leisure time loss, (5) costs related to permanent invalidity, (6)costs related to pain and (7) costs related to negative psychologicalconsequences.
118 victims (54%) completed the Cost Questionnaire. Toanalyze the relationship between the severity of the injuriesand the costs we distinguish 4 groups of accidents:(1)Withoutinjuries,⇒ NO I(n = 13).(2)With light injuries limited to a bruise orcramp⇒ LIGHT I(n = 57).(3)Acute Body Injury with only Short Term(< 9 months) consequences⇒ ABI-ST(n = 41).(4)Acute Body Injurywith Long Term (> 9 months) consequences⇒ ABI-LT(n = 7).
The response rate among those with an Acute Body Injury (ABI)is higher (73%), than for those who only reported material damage(27%) (cf. Table 1). These differences are taken into account in theanalyses.
Table 1Frequency of accidents registered during the weekly registration. Response on Cost Questionnaire (CQ). Source: SHAPES-survey, 2009.
# Accidents per Response on CQ % Response on CQ
1,000,000 km 10,000 trips
Material damage only 49 33 2.3 13 27%Injuries limited to a bruise or cramp 104 70 4.8 57 55%More serious injuries (ABI) 66 45 3.1 48 73%
Total 219 148 10.2 118 54%
Author's personal copy
2152 J. Aertsens et al. / Accident Analysis and Prevention 42 (2010) 2149–2157
3. Results
3.1. Types and frequency of minor bicycle accidents
In Table 1 the number of reported accidents for each injuryclass is reported. Among the 219 studied accidents, 49 involvedonly material damage, 104 involved injuries limited to a bruiseor cramp and 66 suffered a more serious acute body injury. Basedon the knowledge that a total of 1,474,978 cycled kilometers werereported in the weekly registration, the accident and minor injuryrisk are respectively 148 and 115 per million kilometres cycled.On average, our sample survey recorded 1 minor accident for each6735 km cycled.
Among the 170 accidents with injuries, 59 also involved mate-rial damage. There were thus a total of 108 accidents with materialdamage (49%). This corresponds to 73 bicycle accidents with mate-rial damage per million kilometres cycled.
3.2. Cost categories
3.2.1. Direct medical costs for the cyclistA detailed overview of the average cost for different cost cate-
gories and for the 4 groups is presented in Table 2.The direct medical costs include visits to the doctor, specialist
or a physiotherapist, costs of ambulance intervention and expen-ditures on medication and bandages.
The average reported costs for a visit to the doctor, specialist andphysiotherapist were 23, 42 and 36 euro respectively per visit. Inthis analysis we focus on the total cost for society. In Belgium about20 to 30% of this cost is covered by the “patient” and the remainderby the mandatory public social security system.
Only 4 respondents with a minor bicycle accident were trans-ported to the hospital by ambulance. There is an important
difference in the costs that may be attributed to an ambulance inter-vention depending on whether one opts for (a) dividing the totalcosts of the provision of the ambulance service equally among allinterventions which results in a cost of 245 euro per interventionor (b) the average variable costs of an ambulance intervention (32euro) (Linthout et al. (2006)). Here the variable cost approach waschosen. Because of the limited number of interventions, the shareof ambulance intervention costs in the total cost of minor cyclingaccidents will be small either way (Table 2).
The average direct medical costs for ABI LT are 9 times higherthan for ABI ST and 28 times larger than for LIGHT I. For NO I therewere no medical costs. The main medical cost component in thegroup ABI LT is due to the need for multiple visits to the physio-therapist, which make up 43% of the total direct medical costs.
3.2.2. Direct non medical costsMaterial costs include all damage to bicycles, clothes et cetera.
The average material costs within ABI-LT are on average about 4times higher than those in the other groups.
Police interventions are also considered a direct non medicalcost. Police interventions were only reported in the groups with anABI. Among the 66 cases with ABI there were only 8 such interven-tions (12%) and in 5 cases the accident was officially reported (8%).Similar to the ambulance interventions, the costs of police inter-ventions are mainly due to the time invested by the police men.The cost for an intervention was estimated at 30 euro when therewas no official reporting and 90 euro when an official report wasmade.
3.2.3. Productivity lossWe have calculated productivity loss by multiplying the hours
lost with the average value added per hour worked in Belgiumprovided by the OECD (2010).
Table 2Accident related costs (in euro) – average cost per respondent.
Type of accident ABI LT ABI ST LIGHT I NO I
Direct costs 696 132 78 64Medical costs 369 43 13 0
Doctor visits 53 11 5 –Specialist visits 60 12 1 –Physio-therapist visits 159 4 4 –Ambulance intervention 9 2 0 –Medication and bandages 87 15 3 –
Non medical costs 327 89 65 64Bike repair 30 16 38 61Value of old bike if replaced 54 0 0 3Damaged clothes 71 20 21 0Damaged helmet 25 7 3 0Other material damage 129 32 3 1Police intervention 18 14 0 0
Indirect costs 4760 555 122 46Productivity loss 4616 537 104 37
Late arrival at work 69 12 16 19Period unable to work 3923 450 58 0Lower productivity 624 76 29 19
Leisure time loss 144 18 18 9Repairing and replacing 34 5 12 8Personal medical care 31 9 8 0Actions for refund 54 4 6 2Lower efficiency householding 19 3 1 0Late at home (day of accident) 5 3 3 7
Intangible costs 3761 122 84 135Permanent invalidity 1018 – – –WTP to avoid pain 1885 19 60 0WTP to avoid psych. conseq. 858 103 24 135
Other costs 131 11 39 49Costs for 3rd parties 131 11 39 49
Total costs 9348 820 322 295Confidence intervals (95%) 3764–17425 588–1089 244–411 157–476
Author's personal copy
J. Aertsens et al. / Accident Analysis and Prevention 42 (2010) 2149–2157 2153
At the day of the accident 25% arrived later at work. The averagedelay was higher for the group ABI LT (84 min) than for the othergroups. In ABI ST the average delay was 12 min, for LIGHT I it was18 min and for NO I it was 24 min. Thus on average material damageseems to be more important in causing delay than light injuries.
In ABI LT, 4 out of 7 persons were absent from work for severaldays after the accident. The average absence over the whole groupwas 10.6 days. In ABI ST, only 4 out of 41 were absent. In LIGHT Ithe average absence was very limited (0.2 days) and in NO I therewas no absence in the period following the accident. For a workingday we accounted 7.6 working hours, based on a 38 h working weekof 5 days, which is common in Belgium.
28 respondents reported that they were less productive whenthey started to work again after their accident. This can be dueboth to being more distracted (a psychological consequence) or tophysical injuries resulting from the accident.
The differences in average productivity loss are large and statis-tically significant between all four groups.
3.2.4. Leisure time lostThe following sources of time loss are accounted for: time
invested in (1) repairing or replacing the material damage, (2)taking care of injuries (3) actions for getting a refund, (4) lowerefficiency when performing household activities due to injuries,(5) time lost due to later arrival at home on the day of the accident.
The value of a marginal time saving is often measured by a will-ingness to pay (WTP) approach (Hague Consulting Group, 1990).Several approaches indicate that the value of leisure time in Bel-gium is about 5 euro/hour. De Ceuster (2004) reported that thevalue of marginal travel time gains in Belgium during leisure timeequals 4.58 euro (2002 euros).
In Table 2 it can be seen that lost leisure time in the ABI LTgroup by far exceeds the other categories due to the time investedin actions to get a refund, repairing and replace damaged goods andpersonal medical care.
3.2.5. Permanent disability/invalidityWhen compensating the costs of permanent corporal dam-
age, we distinguish between (i) a possible permanent disability toperform certain tasks that leads to economic losses and (ii) a per-manent corporal invalidity for which a “moral” compensation ispaid which is equal for all individuals (pers.comm. Hudders, KBC).
There were no cases of permanent (job) disability. By our defi-nition, costs of permanent invalidity are only present in the ABI LTgroup. There were 2 cases with a permanent invalidity of 2% and 4%respectively and one case of permanent minor eyesight problemsdue to a bicycle accident. To compensate for the moral damage,insurance companies use common amounts provided by Assuralia,the Belgian federation of insurance companies. The compensationfor each percent point of invalidity equaled 687.50 euro at thebeginning of 2010 (pers.comm. Hudders, KBC). The average costsin this category among the 3 ABI LT respondents with permanentinvalidity equaled 2375 euro.
3.2.6. Physical painAlthough this may be an important aspect in the analysis, many
studies ignore “intangible” costs. Based on Rowe et al. (1996), in ourCost Questionnaire, respondents were asked questions related topossible physical and psychological suffering related to their bicy-cle accident. Specific questions were asked for the willingness topay (WTP) in order not to have suffered the pain, while all otherconsequences would remain the same.
In ABI LT all 7 respondents did suffer pain, and 5 of them havetaken pain killers (during 7 days on average). When they were ina resting position (i.e. not moving) respondents on average suf-fered “heavy pain” during 10 hours and “light” pain during 7 days.
However when executing certain movements they kept feeling aheavy/light pain during a period of 7 and 66 days respectively. Theaverage WTP to avoid physical pain was 1885 euro.
In ABI ST, 31 suffered pain but few have taken pain killers (19%during an average of 11 days). The average WTP in this group was19 euro. In the group with light injuries 41 suffered from pain andthe average WTP to avoid physical pain was 60 euro.
3.2.7. Psychological consequencesAlthough psychological consequences are often ignored, from
the 118 respondents, 36% indicated that they were affected psy-chologically due to the accident. 36 people were more concernedto go cycling again, but did not stop cycling; 6 respondents did stopcycling for a certain period, which lasted on average 13 days.
Some respondents also reported positive consequences of theaccident: 58% of the respondents indicated that afterwards theywere riding more carefully. Some indicated they were wearing hel-mets (16%) and reflective clothing (11%) more often, 5% took bettercare of the safety of the bike, 14% have changed towards a saferroute. The accident also had some consequences for relatives of therespondents. 21% of the respondents indicated that relatives weremore concerned when the respondent went cycling. The respon-dents were asked to use the bike less (3%) and/or to be more careful(19%). In 5% of the cases relatives are now more careful when usingthe bike themselves, e.g. by wearing protective clothes.
Similar with physical pain, a question measured the WTP of therespondents in order not to have experienced negative psycho-logical consequences, while all other consequences would remainthe same. In ABI LT the average amount they were willing to payequalled 858 euro, in ABI ST this was 103 euro, in LIGHT I this was24 euro and in NO I it was 136 euro.
3.2.8. Costs for “third parties”Third parties were involved in 39% of the minor accidents.
The third parties were mostly car drivers (72%), sometimes othercyclists (11%) or pedestrians (8.5%). The involvement of third par-ties is relatively higher for ABI LT group (71%) with injuries thathad an impact that lasted more than 9 months. The percentageof involvement of third parties in ABI ST, LIGHT I and NO-I wererespectively 29%, 40% and 46%.
In none of the 118 cases there were physical injuries for a thirdparty. Only in 9 cases there was material damage for the third party.The material damage was related to a car in 8 cases and to a bus inone case. Average costs to third parties are summarized in Table 2.Traffic delays for third parties were not included in the assessment.
3.3. Composition of the average total cost for each of the fourgroups
The average total cost of an accident with ABI LT is about 11times higher than one with ABI ST, which is in turn 2.5 times higherthan one with light injuries (cf. Table 2). The average total cost ofan accident without injuries in our sample is about 8% lower thanone with light injuries.
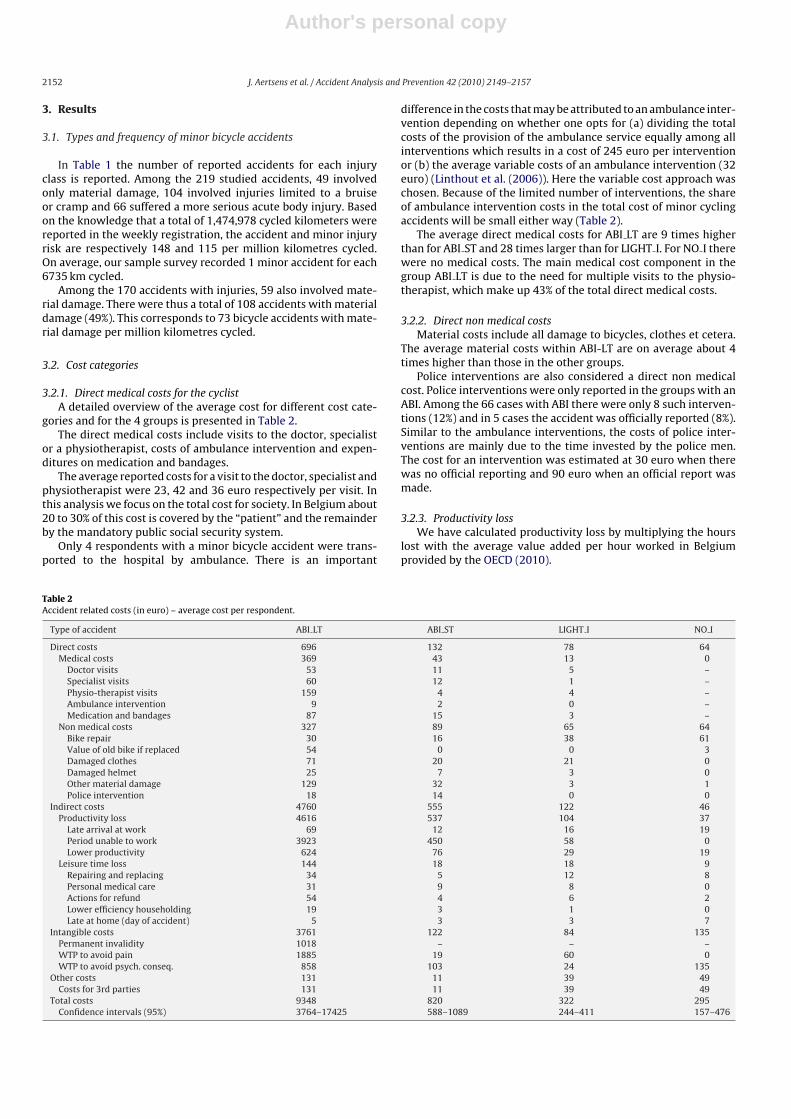
In Fig. 3 it can be seen that the composition of the total cost isstrongly different for each of the 4 groups. For ABI LT, ABI ST andLIGHT I productivity loss is the main cost category with a shareof respectively 49%, 66% and 32% in the total cost, while for NO Iproductivity loss is less important (13% of total cost). For ABI LT“permanent invalidity” with a share of 11% is an important costcomponent, while for the other groups it is non-existent.
3.4. Distribution of the total cost
It was found that the distribution of the total accident cost inthe four groups is best described with an exponential distribu-
Author's personal copy
2154 J. Aertsens et al. / Accident Analysis and Prevention 42 (2010) 2149–2157
Fig. 3. Share of each cost component in the total cost per group.
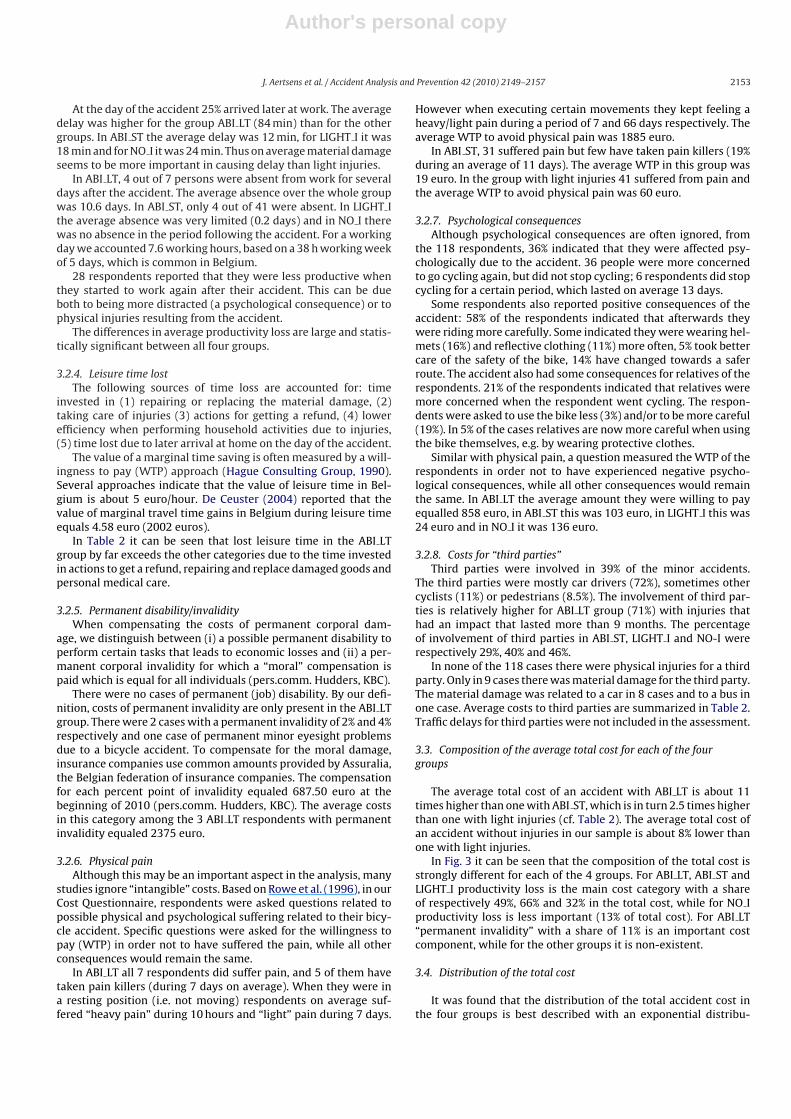
tion (Eq. 1): P(x, �) = �−1 × exp( − x × �−1), where � is the averagecost of the group and x is the cost itself and varies theoreti-cally from 0 to infinity. An exponential distribution was fitted toeach group. In Fig. 4, the distribution of the total accident costis presented. The four different accident categories are distin-guishable. From this figure it becomes clear that in line with theexpectations, there is a high frequency of less costly accidents,while the more costly accidents are less frequent. The category“no injuries” is composed mostly of the less costly accidents. Theaccidents with total accident cost higher than 2000 euro are notpresented on the graph, these belong in majority to the categoryABI LT.
In Table 3, some parameters are presented that give more detailson the distribution of the total accident cost for the 4 different
Table 3Distribution of the total accident cost (euro) for the four categories.
ABI LT ABI ST LIGHT I NO INJ
n 7 41 57 13Average 9348 820 322 295Median 6460 152 134 304st. dev. 9115 1899 502 217Min 356 1 0 45Max 25525 9569 2465 643
groups. The median of the groups LIGHT I, ABI ST and ABI LT ismuch smaller than the average indicating that the distribution ofcosts for these populations is skewed. Standard deviations are highfor all categories.
Fig. 4. Distribution of total costs and fitted exponential probability density function (graph truncated at 2000 euro).
Author's personal copy
J. Aertsens et al. / Accident Analysis and Prevention 42 (2010) 2149–2157 2155
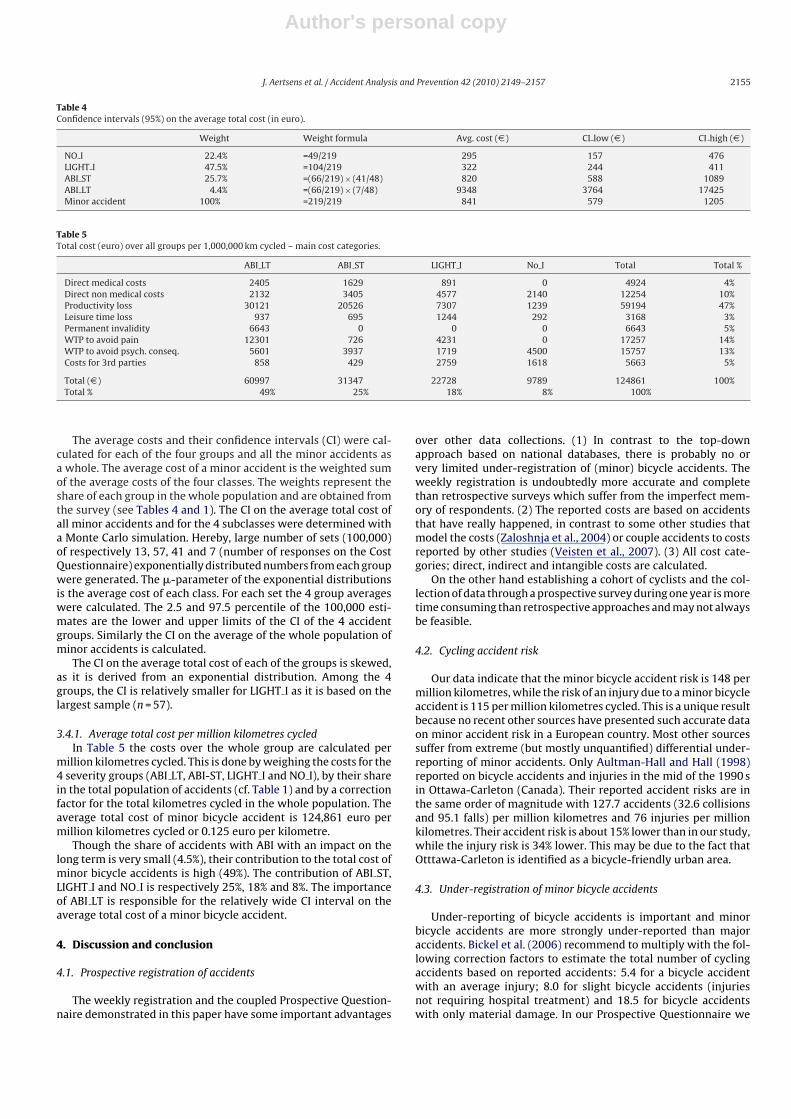
Table 4Confidence intervals (95%) on the average total cost (in euro).
Weight Weight formula Avg. cost (D ) CI low (D ) CI high (D )
NO I 22.4% =49/219 295 157 476LIGHT I 47.5% =104/219 322 244 411ABI ST 25.7% =(66/219) × (41/48) 820 588 1089ABI LT 4.4% =(66/219) × (7/48) 9348 3764 17425Minor accident 100% =219/219 841 579 1205
Table 5Total cost (euro) over all groups per 1,000,000 km cycled – main cost categories.
ABI LT ABI ST LIGHT I No I Total Total %
Direct medical costs 2405 1629 891 0 4924 4%Direct non medical costs 2132 3405 4577 2140 12254 10%Productivity loss 30121 20526 7307 1239 59194 47%Leisure time loss 937 695 1244 292 3168 3%Permanent invalidity 6643 0 0 0 6643 5%WTP to avoid pain 12301 726 4231 0 17257 14%WTP to avoid psych. conseq. 5601 3937 1719 4500 15757 13%Costs for 3rd parties 858 429 2759 1618 5663 5%
Total (D ) 60997 31347 22728 9789 124861 100%Total % 49% 25% 18% 8% 100%
The average costs and their confidence intervals (CI) were cal-culated for each of the four groups and all the minor accidents asa whole. The average cost of a minor accident is the weighted sumof the average costs of the four classes. The weights represent theshare of each group in the whole population and are obtained fromthe survey (see Tables 4 and 1). The CI on the average total cost ofall minor accidents and for the 4 subclasses were determined witha Monte Carlo simulation. Hereby, large number of sets (100,000)of respectively 13, 57, 41 and 7 (number of responses on the CostQuestionnaire) exponentially distributed numbers from each groupwere generated. The �-parameter of the exponential distributionsis the average cost of each class. For each set the 4 group averageswere calculated. The 2.5 and 97.5 percentile of the 100,000 esti-mates are the lower and upper limits of the CI of the 4 accidentgroups. Similarly the CI on the average of the whole population ofminor accidents is calculated.
The CI on the average total cost of each of the groups is skewed,as it is derived from an exponential distribution. Among the 4groups, the CI is relatively smaller for LIGHT I as it is based on thelargest sample (n = 57).
3.4.1. Average total cost per million kilometres cycledIn Table 5 the costs over the whole group are calculated per
million kilometres cycled. This is done by weighing the costs for the4 severity groups (ABI LT, ABI-ST, LIGHT I and NO I), by their sharein the total population of accidents (cf. Table 1) and by a correctionfactor for the total kilometres cycled in the whole population. Theaverage total cost of minor bicycle accident is 124,861 euro permillion kilometres cycled or 0.125 euro per kilometre.
Though the share of accidents with ABI with an impact on thelong term is very small (4.5%), their contribution to the total cost ofminor bicycle accidents is high (49%). The contribution of ABI ST,LIGHT I and NO I is respectively 25%, 18% and 8%. The importanceof ABI LT is responsible for the relatively wide CI interval on theaverage total cost of a minor bicycle accident.
4. Discussion and conclusion
4.1. Prospective registration of accidents
The weekly registration and the coupled Prospective Question-naire demonstrated in this paper have some important advantages
over other data collections. (1) In contrast to the top-downapproach based on national databases, there is probably no orvery limited under-registration of (minor) bicycle accidents. Theweekly registration is undoubtedly more accurate and completethan retrospective surveys which suffer from the imperfect mem-ory of respondents. (2) The reported costs are based on accidentsthat have really happened, in contrast to some other studies thatmodel the costs (Zaloshnja et al., 2004) or couple accidents to costsreported by other studies (Veisten et al., 2007). (3) All cost cate-gories; direct, indirect and intangible costs are calculated.
On the other hand establishing a cohort of cyclists and the col-lection of data through a prospective survey during one year is moretime consuming than retrospective approaches and may not alwaysbe feasible.
4.2. Cycling accident risk
Our data indicate that the minor bicycle accident risk is 148 permillion kilometres, while the risk of an injury due to a minor bicycleaccident is 115 per million kilometres cycled. This is a unique resultbecause no recent other sources have presented such accurate dataon minor accident risk in a European country. Most other sourcessuffer from extreme (but mostly unquantified) differential under-reporting of minor accidents. Only Aultman-Hall and Hall (1998)reported on bicycle accidents and injuries in the mid of the 1990 sin Ottawa-Carleton (Canada). Their reported accident risks are inthe same order of magnitude with 127.7 accidents (32.6 collisionsand 95.1 falls) per million kilometres and 76 injuries per millionkilometres. Their accident risk is about 15% lower than in our study,while the injury risk is 34% lower. This may be due to the fact thatOtttawa-Carleton is identified as a bicycle-friendly urban area.
4.3. Under-registration of minor bicycle accidents
Under-reporting of bicycle accidents is important and minorbicycle accidents are more strongly under-reported than majoraccidents. Bickel et al. (2006) recommend to multiply with the fol-lowing correction factors to estimate the total number of cyclingaccidents based on reported accidents: 5.4 for a bicycle accidentwith an average injury; 8.0 for slight bicycle accidents (injuriesnot requiring hospital treatment) and 18.5 for bicycle accidentswith only material damage. In our Prospective Questionnaire we
Author's personal copy
2156 J. Aertsens et al. / Accident Analysis and Prevention 42 (2010) 2149–2157
asked whether accidents were reported by the police. Based onour data, among all minor bicycle accidents with acute bodyinjuries (ABI) only 7.1% have been officially registered by the police.What we define as ABI corresponds strongly with the definition ofslight accidents in Bickel et al. (2006). Thus our data indicate thatunder-registration is even more serious than indicated by Bickelet al. (2006). Based on our data we suggest a correction factor of14. Our findings confirm that the societal cost of minor bicycleaccidents is strongly underestimated, when based on official statis-tics. Under-registration is even stronger than reported in earlierstudies.
4.4. The cost of a minor bicycle accident
We estimate the average cost of a minor bicycle accident at 841euro, with a 95% CI between 579 and 1205 euro. Our data indicatethat even within the group of minor bicycle accidents, it is impor-tant to distinguish between 4 different groups. A first group, ABI LT,are the minor bicycle accidents with acute body injuries which stillhave negative consequences even 9 months after the accident. Thisis the smallest group (4.5%) but represents the highest share in thetotal cost (49%). On average the costs of an ABI LT are an order ofmagnitude higher than for an ABI ST (9348 and 820 euro respec-tively). The average total cost of LIGHT I (322 D ) and NO I (295 D ) arein the same order of magnitude, but their composition is stronglydifferent. The main cost category among LIGHT I is productivity loss(32%), while this is relatively unimportant among NO I (13%). Themain cost category among NO I is WTP to avoid psychological con-sequences (46%). This is remarkable because there were no physicalinjuries in this group and psychological consequences were lessimportant for those who suffered light injuries (Light I; 8%). Eventhe least serious accidents may therefore affect the risk perceptionof cyclists.
Productivity loss is by far the main component (399 euro; 47%)of the total cost of an average minor bicycle accident. Intangiblecosts are the second most important costs. We estimate the WTPto avoid pain and the WTP to avoid psychological consequences at14% and 13% respectively of total costs. Direct medical costs andpermanent invalidity only account for 4% and 5% respectively.
Veisten et al. (2007) calculated that the average cost for a bicy-cle accident with a minor injury (reported by hospitals) to beapproximately 5804 euro (2010 prices). This is in the same orderof magnitude as the average cost of the group ABI LT in this study.We could find no literature on the costs of less severe minor bicycleaccidents.
Based on our sample, the total average cost of minor bicycleaccidents is calculated to be 0.125 euro per kilometre cycled. Thisis higher than earlier estimates because we have worked metic-ulously to make all hidden costs visible, resulting in a cost thatexceeds the fuel costs for most cars, even in Europe. As a point ofcomparison, the Belgian Federal Planning Bureau provides infor-mation on the societal cost of victims of traffic accidents withmotorbikes (1.20 euro/km) and cars (0.08 euro per kilometer) inBelgium for 2006. This comparison indicates that our calculatedsocietal costs related to minor bicycle accidents exceed the costsrelated to car accidents when both are expressed per vehicle kilo-metre.
4.5. Importance of minor bicycle accidents for society
Minor bicycle accident costs per kilometre are higher thanexpected. What does this imply for society? Based on our data,we can extrapolate the number of accidents in our sample to Bel-gium by two approaches. First: In Belgium in 2007, out of all 8048officially registered bicycle victims 7013 were related to “minoraccidents”. As we have found that only 7.1% of the minor cycling
accidents with ABI are officially reported, we estimate that 98,775victims suffered from minor bicycle accidents in Belgium in 2007.Second: During the weekly registration, in total, 20,107 weeks havebeen recorded during which 219 minor bicycle accidents occurred.The data of the National Institute of Statistics (NIS, 2001) registered290,995 cyclists that commuted regularly by bike. Assuming thatthis number did not change by 2009, and that these cyclists com-mute 48 weeks per year, our weekly survey has registered about1/695 of all commuting by bike. If we use this ratio the numberof minor bicycle accidents in 2007 for Belgium is extrapolated to152,205. As we calculated the average cost of a minor accident tobe 841 (579–1205) euro we estimate the total cost for Belgiumbetween 57 and 183 million euro.
4.6. Conclusion and further research
In this study we have only focussed on minor bicycle accidents,because especially for these accidents knowledge and data werelacking. Future research should give a better insight in the totalcost of all bicycle accidents (including major accidents and acci-dents involving children and elderly people). We believe that thesecosts will be significantly higher than expected by most if all rele-vant cost categories are included. On the other hand this should notbe a reason to discourage cycling. When comparing use of a bikeor a car, one should not only consider the related accident costs,but also other factors, like differences in impact on health due toair pollution effects (Int Panis et al., 2010) and the physical exerciseof cycling (Lusk et al., 2010). Benefits of bicycle use for health arelikely higher than the combined risks of air pollution and accidentseven if both these risks may have been seriously underestimatedin the past (Int Panis et al., 2010; de Hartog et al., 2010). Policiesfavouring the use of the bicycle and improving the safety for cyclists(e.g. through the implementation of cycling infrastructure) couldlead to a “safety in numbers” effect (Jacobsen, 2003) if accompa-nied with education of new cyclists (who are less experienced thanthe present cohort) and hence could reduce the number and thetotal cost of minor (and major) bicycle accidents. But, within a spe-cific injury severity class, the average costs per bicycle accidentreported here are not expected to change significantly. Air pollu-tion impacts would decrease in general and could be kept undercontrol for cyclists as well by including exposure as a design crite-rion for new cycling infrastructure. Only a meticulous collection ofdata and balancing of all health risks and benefits will reveal themost effective and cost-efficient policies to maximize the healthbenefits of cycling.
A spatially disaggregated analysis should be considered in futurestudies, since the severity and the number of bicycle accidents differaccording to the geographical context. The total cost of minor bicy-cle accidents is expected to be higher in urban areas, while the totalcost related to major bicycle accidents is expected to be higher inrural areas due to higher average speed differences between bicycleand car users in rural areas (Vandenbulcke et al., 2009).
In this paper we have reported the complete results of theprospective SHAPES database on bicycle accidents. We are awarethat sample sizes for some categories are rather small, but the orderof magnitude of the different cost categories has been estimatedwell. Sustained prospective collection of accident data may permitto get more precise cost estimates in the future.
This is the first paper reporting on the intangible costs of minorbicycle accidents. In our questionnaire we included questions thatallowed estimating these costs, by measuring the WTP of respon-dents not to have suffered the pain and psychological consequencesof their bicycle accident, ceteris paribus. Intangible costs make up27% of the total minor bicycle accident cost. As this is an importantshare of the total cost, we advise to include these costs in futurestudies.
Author's personal copy
J. Aertsens et al. / Accident Analysis and Prevention 42 (2010) 2149–2157 2157
Acknowledgements
This study was conducted within the framework of the PM2TENand SHAPES projects managed by VITO for the Belgian SciencePolicy. The authors acknowledge the financial contribution theBelgian Science Policy within the Sustainable Development Pro-gramme. We thank all participants of the SHAPES project, Ruth VanWaeyenberghe, Pascal Rosière for the information provided on theambulance costs and Christine Hudders from KBC insurances forthe information regarding the costs from permanent invalidity. Theauthors however take all responsibility for the estimates presentedin this paper.
References
Andersen, L., Schnohr, P., Schroll, M., Hein, H., 2000. All cause mortality associatedwith physical activity during leisure time, work, sports, and cycling to work.Archives of Internal Medicine 160, 1621–1628.
Aultman-Hall, L., Hall, F.L., 1998. Ottawa-Carleton Commuter Cyclist On- and Off-road incident rates. Accident Analysis and Prevention 30 (1), 29–43.
Bickel, P., Friedrich, R., Burgess, A., Fagiani, P., Hunt, A., De Jong, G., Laird, J., Lieb,C., Lindberg, G., Mackie, P., Navrud, S., Odgaard, T., Ricci, A., Shires, J., Tavasszy,L., 2006. Proposal for Harmonised Guidelines; HEATCO, deliverable 5; February2006; p. 193.
BRSI, Belgian Road Safety Institute, 2006. Cycling accidents in an urban context:three years (1998–2000) of casualties along the regional roads of the Brusselscapital region; available online at: http://www.ibsr.be (in French/Dutch).
BRSI, Belgian Road Safety Institute, 2009. Evolution of traffic safety in Belgium(2000–2007); http://bivvweb.ipower.be/Observ/NL/evolutie%20van%20de%20VV%202007 nl.pdf (in French/Dutch); p. 46.
Berghmans, P., Bleux, N., Int Panis, L., Mishra, V.K., Torfs, R., Van Poppel, M., 2009.Exposure assessment of a cyclist to PM10 and ultrafine particles. Science of theTotal Environment 407 (4), 1286–1298.
De Mol, J., Lammar, P., 2006. Half the road victims are not reported in the statistics.Verkeersspecialist 130, 15–18 (in Dutch).
De Ceuster, G., 2004. Internalisering van externe kosten van wegverkeer in Vlaan-deren, Studie uitgevoerd in opdracht van de Vlaamse MilieumaatschappijMIRA/2004/04. Transport & Mobility Leuven, 174 (in Dutch).
de Geus, B., Van Hoof, E., Aerts, I., Meeusen, R., 2008. Cycling to work: influence onindexes of health in untrained men and women in Flanders Coronary heart dis-ease and Quality of life. Scandinavian Journal of Medicine and Science in Sports18, 498–510.
de Geus, B., Joncheere, J., Meeusen, R., 2009. Commuter cycling: effect on physi-cal performance in untrained men and women in Flanders Minimum dose toimprove indexes of fitness. Scandinavian Journal of Medicine and Science inSports 19, 179–187.
de Hartog, J.J., Boogaard, H., Nijland, H., Hoek, G., 2010. Do the health ben-efits of cycling outweigh the risks? Environmental Health Perspectives.doi:10.1289/ehp.0901747.
de Nazelle, A., Nieuwenhuijsen, M., 2010. Integrated health impact assess-ment of cycling. Occupational and Environmental Medicine 67, 76–77,doi:10.1136/oem.2009.050054.
De Nocker, L., Int Panis, L., Mayeres, I., 2006. De externe kosten van personenvervoer.Mobiliteit en (groot)steden beleid. Vlaams Wetenschappelijk Economisch Con-gres – VWEC – 2006.In: Macharis Cathy VWEC (Ed.), Belgium, vol. 5, pp. 381–415(in Dutch).
Dhillon, P.K., Lightstone, A.S., Peek-Asa, C., Kraus, J.F., 2001. Assessment of hospi-tal and police ascertainment of automobile versus childhood pedestrian andbicyclist collisions. Accident Analysis and Prevention 33 (4), 529–537.
Doom, R., Derweduwen, P., 2005. Optimalisatie van de verkeersongevallen-statistieken. Onderzoekscontracten CP/02/392, CP/F1/391 (eindrapport) voorBIVV, CDO en het Federaal Wetenschapsbeleid (in Dutch).
Elvik, R., 2009. The non-linearity of risk and the promotion of environmen-tally sustainable transport. Accident Analysis and Prevention 41, 849–855.
Elvik, R., Mysen, A.B., 1999. Incomplete accident reporting: meta-analysis of studiesmade in 13 countries. Transportation Research Record 1665, 133–140.
Elvik, R., Vaa, T. (Eds.), 2004. The Handbook of Road Safety Measures. Elsevier, Ams-terdam, ISBN: 0 08 044091 6, 1078 pp.
EPA, Environmental Protection Agency, 2006. The Cost of Illness Handbook; pre-pared for the Office of Pollution Prevention and Toxics, under the direction ofNicolaas Bouwes, by Abt Associates, Cambridge, Massachusetts.
EU, 2003. Energy and transport in figures. European Commission, Directorate-General for Energy and Transport, Brussels. Available online at: http://gasunie.eldoc.ub.rug.nl/root/2004/2999175/S. Eurostat, 2010: http://epp.eurostat.ec.europa.eu/portal/page/portal/exchange rates/data/main tables (accessed 26april 2010).
Hague Consulting Group, 1990. ‘The Netherlands’ ‘Value of Time’ Study: Final Report,The Hague.
Hendriksen, I.J., Zuiderveld, B., Kemper, H.C., Bezemer, P.D., 2000. Effect of commutercycling on physical performance of male and female employees. Medicine andScience in Sports Exercise 32, 504–510.
Int Panis, L., Meeusen, R., Thomas, I., Bleux, N., Degraeuwe, B., De Vlieger, I., Torfs,R., Vankerkom, J., de Geus, J., Vandenbulcke-Passchaert, G., 2009. SHAPES: Sys-tematic analysis of Health risks and physical Activity associated with cyclingPoliciES. Phase 1 report. Belgian Federal Science Policy, SD/HE/03A, 55 pp.
Int Panis, L., de Geus, B., Vandenbulcke, G., Willems, H., Degraeuwe, B., Bleux, N.,Mishra, V., Thomas, I., Meeusen, R., 2010. Exposure to particulate matter intraffic: a comparison of cyclists and car passengers. Atmospheric Environment.doi:10.1016/j.atmosenv.2010.04.028.
Jacobsen, P.L., 2003. Safety in numbers: more walkers and bicyclists, safer walkingand bicycling. Injury Prevention 9, 205–209.
Linthout, G., Stojanovic, Bellaert, J., 2006; “Ambulancekosten”; Mobius consultancy;presentation; www.mobius.be (in Dutch; accessed 26/04/2010).
Lusk, A.C., Mekary, R.A., Feskanich, D., Willett, W.C., 2010. Bicycle riding, walking,and weight gain in premenopausal women. Archives of Internal Medicine 170(June 28 (12)).
Miller, T.R., 1993. Costs and functional consequences of U.S. roadway crashes. Acci-dent Analysis and Prevention 23, 593–607.
NIS (National Institute for Statistics), 2001. National house hold survey onmobility. Realization and results. Research contract MD/13/036, FUNDP-GRT-LV-UIA-IW-INS. Belgian Federal Science Policy Office, Brussels Availableonline at: http://www.belspo.be/belspo/fedra/proj.asp?l=en&COD=MD/DD/18(in French).
OECD, 2010. http://stats.oecd.org/Index.aspx?DataSetCode=CSP2010.Rietveld, P., Daniel, V., 2004. Determinants of bicycle use: do municipal policies
matter? Transportation Research Part A 38, 531–550.Robinson, R.L., 2005. Safety in numbers in Australia: more walkers and bicyclists
safer walking and bicycling. Health Promotion Journal of Australia 16 (1), 47–51.
Rowe, R.D., Schulze, W.D., Breffle, W.S., 1996. A test for payment card biases. Journalof Environmental Economics and Management 31, 178–185.
Vandenbulcke, G., Thomas, I., de Geus, B., Degraeuwe, B., Torfs, R., Meeusen, R., IntPanis, L., 2009. Mapping bicycle use and the risk of accidents for commuters whocycle to work in Belgium. Transport Policy 16, 77–87.
Veisten, K., Saelensminde, K., Alvaer, K., Bjørnskau, T., Elvik, R., Schistad, T., Ytter-stad, B., 2007. Total cost of bicycle injuries in Norway: correcting injuryfigures and indicating data needs. Accident Analysis and Prevention 39, 1162–1169.
Zaloshnja, E., Miller, T., Romano, E., Spicer, R., 2004. Crash costs by body part injured,fracture involvement, and threat-to-life severity, United States, 2000. AccidentAnalysis and Prevention 36, 415–427.
Related Documents