AUTHOR COPY Original Article Commuters using public transit in New York City: Using area-level data to identify neighbourhoods with vulnerable riders Sung-suk Violet Yu a, * and Martha J. Smith b a John Jay College of Criminal Justice, 524 West 59th Street, Room 2121N, New York, NY 10019, USA. E-mail: [email protected] b School of Community Affairs, Wichita State University, 1845 N. Fairmount, Wichita, KS 67260-0135, USA. E-mail: [email protected] *Corresponding author. This research was supported in part by PSC CUNY Grant Category A, John Jay College of Criminal Justice. Abstract This study uses routine activity theory and research on victimization and fear of crime to contextualize the importance of examining characteristics related to crime-target vulnerability among public transit commuters. A principal component analysis was conducted using 5-year data from the American Community Survey 2010. New York City (NYC) Police Department Compstat data for 2010 were used to provide a backcloth for understanding the types of crime problems vulnerable transit commuters may confront in their local areas. Findings show that a majority (55.3 per cent ) of the NYC commuters used public transit to travel to work, with more females, youths, ethnic mino- rities and non-naturalized immigrants commuting by public transit. Two distinct types of transit commuters were found to cluster in different parts of NYC, where the types of local-area crime problems also differed. These findings can help transit operators and policymakers build guardian- ship and assist place management in areas where potentially vulnerable commuters live. Security Journal (2014) 27, 194–209. doi:10.1057/sj.2014.6 Keywords: public transport; vulnerability; ‘whole journey’ approach; transit captives; American Community Survey Introduction Figuring out where to target scarce public resources to reach appropriate populations can be expensive if local area planners or agencies have to do all of the research by themselves. Building on existing research allows agencies to operate more cost-effectively. One such publicly available set of information about US residents is the American Community Survey (ACS). The main purpose of the ACS is to inform policymakers about how to distribute federal and state funding to various local and state governments for infrastructure and services (US Census Bureau (USCB), 2013). Transit operators who want to provide more- secure travel for passengers most in need may use the ACS to identify where they reside. In this study, we identify those most in need in terms of crime-target ‘vulnerability’ within the context of public transit use. Specifically, we define vulnerability in terms of (i) crime © 2014 Macmillan Publishers Ltd. 0955-1662 Security Journal Vol. 27, 2, 194–209 www.palgrave-journals.com/sj/

Welcome message from author
This document is posted to help you gain knowledge. Please leave a comment to let me know what you think about it! Share it to your friends and learn new things together.
Transcript
A
UTHOR COPY
Original Article
Commuters using public transit in New York City:Using area-level data to identify neighbourhoods withvulnerable riders
Sung-suk Violet Yua,* and Martha J. SmithbaJohn Jay College of Criminal Justice, 524 West 59th Street, Room 2121N, New York, NY 10019, USA.E-mail: [email protected] of Community Affairs, Wichita State University, 1845 N. Fairmount, Wichita, KS 67260-0135, USA.E-mail: [email protected]
*Corresponding author.
This research was supported in part by PSC CUNY Grant Category A, John Jay College of Criminal Justice.
Abstract This study uses routine activity theory and research on victimization and fear of crime tocontextualize the importance of examining characteristics related to crime-target vulnerability amongpublic transit commuters. A principal component analysis was conducted using 5-year data from theAmerican Community Survey 2010. New York City (NYC) Police Department Compstat data for2010 were used to provide a backcloth for understanding the types of crime problems vulnerabletransit commuters may confront in their local areas. Findings show that a majority (55.3 per cent ) ofthe NYC commuters used public transit to travel to work, with more females, youths, ethnic mino-rities and non-naturalized immigrants commuting by public transit. Two distinct types of transitcommuters were found to cluster in different parts of NYC, where the types of local-area crimeproblems also differed. These findings can help transit operators and policymakers build guardian-ship and assist place management in areas where potentially vulnerable commuters live.Security Journal (2014) 27, 194–209. doi:10.1057/sj.2014.6
Keywords: public transport; vulnerability; ‘whole journey’ approach; transit captives; AmericanCommunity Survey
Introduction
Figuring out where to target scarce public resources to reach appropriate populations can beexpensive if local area planners or agencies have to do all of the research by themselves.Building on existing research allows agencies to operate more cost-effectively. One suchpublicly available set of information about US residents is the American Community Survey(ACS). The main purpose of the ACS is to inform policymakers about how to distributefederal and state funding to various local and state governments for infrastructure andservices (US Census Bureau (USCB), 2013). Transit operators who want to provide more-secure travel for passengers most in need may use the ACS to identify where they reside.
In this study, we identify those most in need in terms of crime-target ‘vulnerability’withinthe context of public transit use. Specifically, we define vulnerability in terms of (i) crime
© 2014 Macmillan Publishers Ltd. 0955-1662 Security Journal Vol. 27, 2, 194–209
www.palgrave-journals.com/sj/
A
UTHOR COPY
victimization; (ii) fear of crime and (iii) ability to use or access other modes of travel. Wefocus on demographic factors – such as gender, age, race and ethnicity, and income level –that have been shown in past research to be correlated with vulnerability. The article firstpresents the theoretical basis for the study followed by methods and analysis. Results anddiscussion are then presented with a focus on the policy implications.
Theoretical Background
Examining services in terms of area of residence makes good sense since the decision to usepublic transport is influenced by the perceived security along the prospective rider’s ‘wholejourney’ from home to transport stop, along the transit system to destination and then back totransport stop and home again (for example, Maxson et al, 2001). While some transitprofessionals may see this focus on vulnerable passengers along the whole travel route asbeyond their remit (Loukaitou-Sideris and Fink, 2009), there are good pragmatic and socialwelfare (Knepper, 2009) reasons for this focus. The importance of pragmatic considerations iseasily understood by looking at the effects of fear of crime on ridership. For example, a studyof public transport in the United Kingdom estimated that reducing fear of crime mightincrease ridership by 3–10 per cent (Department for Transport, 1999). Moreover, many singlecrime-prevention initiatives (Clarke, 1992), and whole policing approaches (Goldstein, 1979),are focused on where, or against whom, crime is likely to occur. In terms of social welfareconcerns: (i) public transport can provide wide access across all types of persons to amenitiesavailable within the areas served, perhaps decreasing the social exclusion of marginal groups;(ii) public transport access might be seen as a right; or (iii) ‘vulnerability’ might be viewed asa fundamental aspect of the human condition and a means of examining society’s obligationsto its citizens (Fineman, 2008). It is not necessary to choose among these different types ofconsiderations, but it is important to note that each can be used to justify this approach.
Transit-rider vulnerability in an opportunity-theory context
Routine activity theory (Cohen and Felson, 1979) has sensitized us to the utility ofperceiving crime events as occurring when motivated offenders converge in time and spacewith suitable targets when capable guardians are not present, and to looking at targetcharacteristics such as value, accessibility, visibility and inertia. Later work by Felson (1987)stressed the importance of the design and layout of urban places in crime convergence.Crime pattern theory (Brantingham and Brantingham, 2008) encourages us to examine themovement patterns of offenders and victims, providing a language for discussing how theenvironment plays a large role in crime events and their prevention. Felson (1986) and Eck(1995) have expanded the view of crime-control roles beyond the lone target guardian, anddescribed linkages with offenders and places, by adding offender ‘handlers’ and place‘managers’, respectively. Increasing the presence and effects of these ‘controllers’, anddesigning movement patterns to limit convergences, are just some of the ways that theseconcepts can be used to help prevent crime events. Using the terminology of the rationalchoice perspective (Cornish and Clarke, 2008), those in control of environments need toincrease the risks and the efforts related to crime while reducing potential rewards and focus
Commuters using public transit in New York City
195© 2014 Macmillan Publishers Ltd. 0955-1662 Security Journal Vol. 27, 2, 194–209

A
UTHOR COPY
on the choice-structuring properties of crime. These approaches to target vulnerabilitysuggest looking at transit-rider vulnerability in terms of both theory and empirical research.
Transit-rider vulnerabilities
In keeping with Clarke and Cornish (1985), we adopt a ‘good enough’ or working definitionof ‘vulnerability’ to guide our efforts. We have identified four aspects of victim vulnerabilitythat transit operators should consider when targeting crime-prevention resources: (i) patternsof past victimization; (ii) perceptions of vulnerability as one dimension of fear of crime;(iii) the limited travel alternatives of the so-called ‘transit captive’; 1 and (iv) other types ofvulnerabilities (such as lack of access to education and employment opportunities). Althoughthis last type of vulnerability is beyond the scope of the present article, it is included toremind transit operators and policymakers that crime and public transit do not exist in acultural vacuum. They form part of the ‘backcloth’ of crime opportunities (Brantingham andBrantingham, 2008) that can affect victimization, and should be considered.
Past patterns of vulnerability (victimization) on public transport
Research on victimization on public transport shows variability by type of crime, mode oftravel, situational context (such as passenger density) and location in, around and on the wayto the system (see Smith and Cornish, 2006). In the United Kingdom, Crime Concern (2004)noted that ethnic minority groups reported higher levels of harassment than whites. Levineand Wachs (1986b) found that among heavy bus users, the elderly, women, Hispanics andlow-income people were most likely to report having been victimized by a bus or bus-relatedcrime (primarily larceny and robbery). However, it is important to stress that both men andwomen are victimized on public transport.
Perceptions of vulnerability and fear of crime
In general, women, the elderly, members of ethnic minority groups and those disadvantagedreport higher levels of fear of crime than others. For example, studies have shown that genderis one of the strongest factors influencing concerns for personal security in mass transitenvironments (Department for Transport, 2002). In the study noted above by Levine andWachs (1986b), women, the elderly, Hispanics and those with low incomes also reportedbeing fearful when riding buses in Los Angeles. Patterson (1985) supports this finding of fearamong elderly transit users. Research also indicates that one dimension of fear of crimeappears to be related to the respondent’s perceived likelihood of victimization (for example,Roundtree and Land, 1996). And perceived vulnerability can be related to signs of crime ordisorder, and to possible limitations in one’s ability to thwart personal victimization.
Fear of crime has been found to be high for some journeys to and from public transport(Ferrell et al, 2012; Crime Concern, 2004). The fear-inducing aspects of walking to and frompublic transport are important to consider since three out of five riders walk to transit stationsor stops (American Public Transportation Association (APTA), 2007). Considering condi-tions along travel routes fits with the ‘whole journey’ approach (Maxson et al, 2001), which
Yu and Smith
196 © 2014 Macmillan Publishers Ltd. 0955-1662 Security Journal Vol. 27, 2, 194–209
A
UTHOR COPY
considers that the most important factor in travel decisions may be how dangerous or fear-inducing one or more parts of the journey are.
Potential vulnerability due to lack of modal choice – The transit captive
Those who have no means of getting from one place to another, other than by publictransportation, are considered to be ‘transit captive’. Women (Toronto Travel Commission(TTC) et al, 1989), the elderly (Bailey, 2004) and those with low incomes often aredependent upon public transit for their transportation needs. Transit captives may represent,on average across the United States, roughly one in five (APTA, 2007). This figure was notbased on lack of vehicle ownership alone, but on not having an alternative mode of travel ifpublic transportation were not available. Others with very limited means of travel may findthemselves captive at certain times or in particular situations.
Captive transport users may have special needs in relation to their lack of travel choices.Specifically, they may be more likely to be the actual victims of crime, particularly if theylive in areas with high levels of crime, since they cannot decide to use another, potentiallysafer, mode of travel.
Why not just look at crime location?
Much recent criminological research focuses on places where past crimes have occurred, andon increasingly smaller ‘micro’ areas, such as block faces (for example, Groff et al, 2010).While this approach is useful, it does not always address the concerns of public transitpolicymakers, particularly where place of occurrence is only one of the important factors thatneeds to be considered. For example, information on crime location may not indicate if thevictim of the crime was a public transit user or potential user or if the victim was on his or herway to or from a public transport station or stop (Levine and Wachs, 1986a).
Transit operators may, therefore, have good reasons to focus some of their crime-prevention efforts on identifying factors related to transit riders as potential crime victims.Gathering this information is expensive, so starting from scratch may not be an option formany systems. Using an existing data set with information about where public transportusers live can, therefore, give transit operators a head start in deciding where to gatheradditional information or where to focus their prevention resources. If operators also havecrime data available – at an area level (informative), a compatible area level (preferred) or atthe street address level (ideal) – they can combine it with information about public transitusers’ areas of residence to assist micro-level crime-prevention planning.
Methods and Analysis
Study site
New York City (NYC) was chosen as the study site to examine the spatial concentration ofvulnerable transit riders (VTCs). It is a densely populated major US city with a high numberof public transit users and a heterogeneous population in terms of the vulnerabilitycharacteristics identified previously. NYC’s Metropolitan Transportation Authority (MTA)
Commuters using public transit in New York City
197© 2014 Macmillan Publishers Ltd. 0955-1662 Security Journal Vol. 27, 2, 194–209
A
UTHOR COPY
operates 24 hours a day. Its subway system is the seventh largest in the world by annual subwayridership (MTA, 2013b). On an average weekday, over 8.4 million trips are made on NYCsubways (APTA, 2012). An additional 2.6 million trips are made on buses in NYC. The Cityis also served by ferries and other rail services. While not all of the five boroughs (or counties)that make up NYC have all of these systems, each has access to a public transportationsystem. In 2012, there were 468 subway stations with over 20 subway lines. NYC also had235 local bus routes, 64 express bus routes and 5 Select Bus Services (MTA, 2013a).
Data
The current study utilizes two area-level data sets: the ACS 2006–2010, a 5-year average data set(USCB, 2011) aggregated by census tract, and New York Police Department (NYPD) Compstatcrime data for 2010, by precinct. Since the ACS is a part of the Census, selected respondentsare required to participate in the survey. The response rate is above 95 per cent for all years(USCB, n.d.). No individual-level data are released to the public to protect the confidentiality ofrespondents. To obtain population estimates through the ACS, the respondents are weighted atperson and housing-unit levels. The current study focuses on information on commuters2 aged16 and older in NYC. To provide a backcloth for looking at areas with VTCs, NYPD crime datawere also examined. NYPD crime data are only available by the police precinct (N=76). Wefocus our analysis on ‘index crime’ – murder, rape, robbery, felonious assault, burglary, grandlarceny and grand larceny automobile – all defined using the N.Y. Penal Code.
Analysis
The analysis included three steps. First, using the ACS data set, we examined profiles ofcommuters by means of travel. The next step involved carrying out an exploratory PrincipalComponent Analysis (PCA) in SPSS 20 to obtain the neighbourhood concentration of VTCs.PCA is frequently used to obtain an index of neighbourhood concentration in the publichealth field (Byrne et al, 2013) as well as in criminology (for example, Yu et al, 2013).Having obtained the PCA results, we also examined their relationship to variables related tothe time respondents left for work and to occupation category.
The NYPD crime data were combined into two crime types – violent index crimes(murder, rape, robbery and felonious assault) and property index crimes (burglary, grandlarceny and grand larceny automobile). While the current article relies on visual comparisonsof index crime and neighbourhood concentrations of VTCs, it should be noted that we con-sidered – and rejected – two types of more sophisticated statistical analyses (areal weightingand hierarchical linear modeling) of the data.3
Results
Profiles of transit commuters
According to the ACS, there were over 3.6 million commuters aged 16 or older in NYC. Thecommuter population includes those who work from home. Table 1 sets out the profiles of
Yu and Smith
198 © 2014 Macmillan Publishers Ltd. 0955-1662 Security Journal Vol. 27, 2, 194–209
A
UTHOR COPY
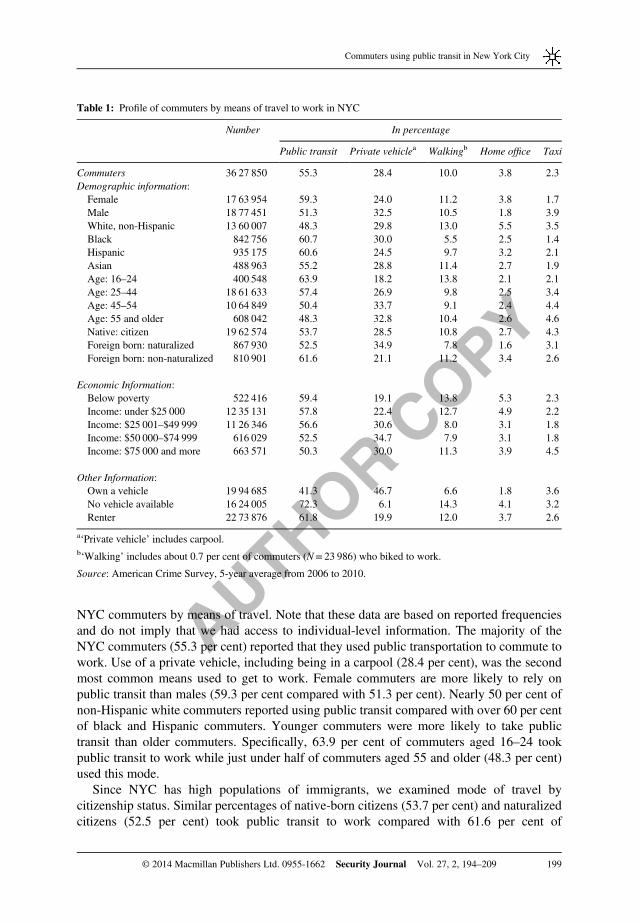
NYC commuters by means of travel. Note that these data are based on reported frequenciesand do not imply that we had access to individual-level information. The majority of theNYC commuters (55.3 per cent) reported that they used public transportation to commute towork. Use of a private vehicle, including being in a carpool (28.4 per cent), was the secondmost common means used to get to work. Female commuters are more likely to rely onpublic transit than males (59.3 per cent compared with 51.3 per cent). Nearly 50 per cent ofnon-Hispanic white commuters reported using public transit compared with over 60 per centof black and Hispanic commuters. Younger commuters were more likely to take publictransit than older commuters. Specifically, 63.9 per cent of commuters aged 16–24 tookpublic transit to work while just under half of commuters aged 55 and older (48.3 per cent)used this mode.
Since NYC has high populations of immigrants, we examined mode of travel bycitizenship status. Similar percentages of native-born citizens (53.7 per cent) and naturalizedcitizens (52.5 per cent) took public transit to work compared with 61.6 per cent of
Table 1: Profile of commuters by means of travel to work in NYC
Number In percentage
Public transit Private vehiclea Walkingb Home office Taxi
Commuters 36 27 850 55.3 28.4 10.0 3.8 2.3Demographic information:Female 17 63 954 59.3 24.0 11.2 3.8 1.7Male 18 77 451 51.3 32.5 10.5 1.8 3.9White, non-Hispanic 13 60 007 48.3 29.8 13.0 5.5 3.5Black 842 756 60.7 30.0 5.5 2.5 1.4Hispanic 935 175 60.6 24.5 9.7 3.2 2.1Asian 488 963 55.2 28.8 11.4 2.7 1.9Age: 16–24 400 548 63.9 18.2 13.8 2.1 2.1Age: 25–44 18 61 633 57.4 26.9 9.8 2.5 3.4Age: 45–54 10 64 849 50.4 33.7 9.1 2.4 4.4Age: 55 and older 608 042 48.3 32.8 10.4 2.6 4.6Native: citizen 19 62 574 53.7 28.5 10.8 2.7 4.3Foreign born: naturalized 867 930 52.5 34.9 7.8 1.6 3.1Foreign born: non-naturalized 810 901 61.6 21.1 11.2 3.4 2.6
Economic Information:Below poverty 522 416 59.4 19.1 13.8 5.3 2.3Income: under $25 000 12 35 131 57.8 22.4 12.7 4.9 2.2Income: $25 001–$49 999 11 26 346 56.6 30.6 8.0 3.1 1.8Income: $50 000–$74 999 616 029 52.5 34.7 7.9 3.1 1.8Income: $75 000 and more 663 571 50.3 30.0 11.3 3.9 4.5
Other Information:Own a vehicle 19 94 685 41.3 46.7 6.6 1.8 3.6No vehicle available 16 24 005 72.3 6.1 14.3 4.1 3.2Renter 22 73 876 61.8 19.9 12.0 3.7 2.6
a‘Private vehicle’ includes carpool.b‘Walking’ includes about 0.7 per cent of commuters (N= 23 986) who biked to work.
Source: American Crime Survey, 5-year average from 2006 to 2010.
Commuters using public transit in New York City
199© 2014 Macmillan Publishers Ltd. 0955-1662 Security Journal Vol. 27, 2, 194–209

A
UTHOR COPY
non-naturalized immigrants. We also examined mode of travel by income. Almost 60 percent of commuters with incomes below the poverty level commuted to work by publictransit. Use of public transit seemed to decrease as income level increased: 57.8 per cent ofcommuters earning less than US$25 000 a year used public transit as opposed to 50.3 percent of those earning $75 000 or more. Lastly, 72.3 per cent of those without a vehicle reliedon public transit compared with 41.3 per cent of those who had a vehicle available.
Neighbourhoods with VTCs
To discover the spatial distribution patterns of VTCs in NYC, we conducted a PCA4
including only those using public transit to go to work. On the basis of theory and empiricalresearch, we selected potentially relevant variables from the 21 variables shown in Table 1.For example, we included female transit commuters since female patrons are usually linkedto higher levels of fear of crime than male patrons. Of the four age groups, we retained theoldest group. For the income variable, we retained the lowest income-range group. Threeethnicity variables (non-Hispanic white, black and Asian) displayed low correlations withthe remaining variables and were dropped from the PCA. ‘Renters’ was also droppedbecause it was related to more than one component. In the final stage of the PCA, twocomponents, which explained 88 per cent of the seven remaining variables, were extracted atthe census-tract level.
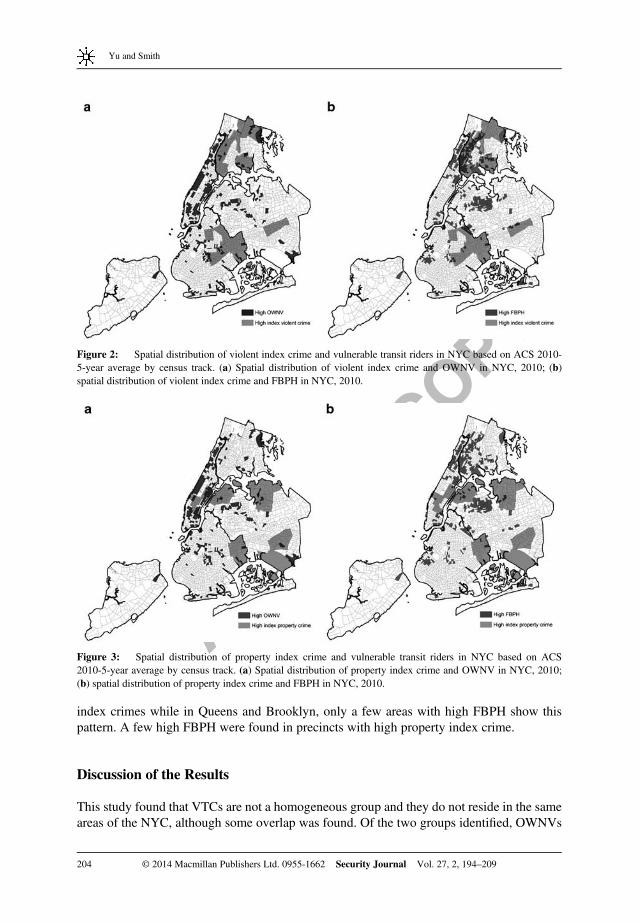
The PCA results showed there were largely two types of neighbourhoods characterized bydifferent vulnerability among transit commuters. Some census tracts (that is, neighbour-hoods) had concentrations of transit commuters with the following characteristics: (i) aged55 and older (0.998), female (0.905) and no vehicle available (0.745) (OWNV), whichexplained 17.5 per cent of total variance, and (ii) foreign-born immigrants (0.865), lowincome (0.902), Hispanic (0.972) and below poverty (0.925) (FBPH), which explained 70.6per cent of total variance. It should be noted that some of the census tracts (N= 102) had highconcentrations of both FBPH and OWNV transit commuters. These neighbourhoods aredescribed separately in the analyses of commuting patterns and in the policy implicationssection. It is important to interpret carefully what these components signify. For example, theneighbourhoods with high OWNV do not include only older women transit commuterswithout access to a vehicle; instead, these census tracts tend to have clusters of transitcommuters who are aged 55 and older, who are women or who do not have a vehicleavailable. This latter group is likely to be transit captive to the extent that they also havelimited access to a car pool or to the use of taxis.
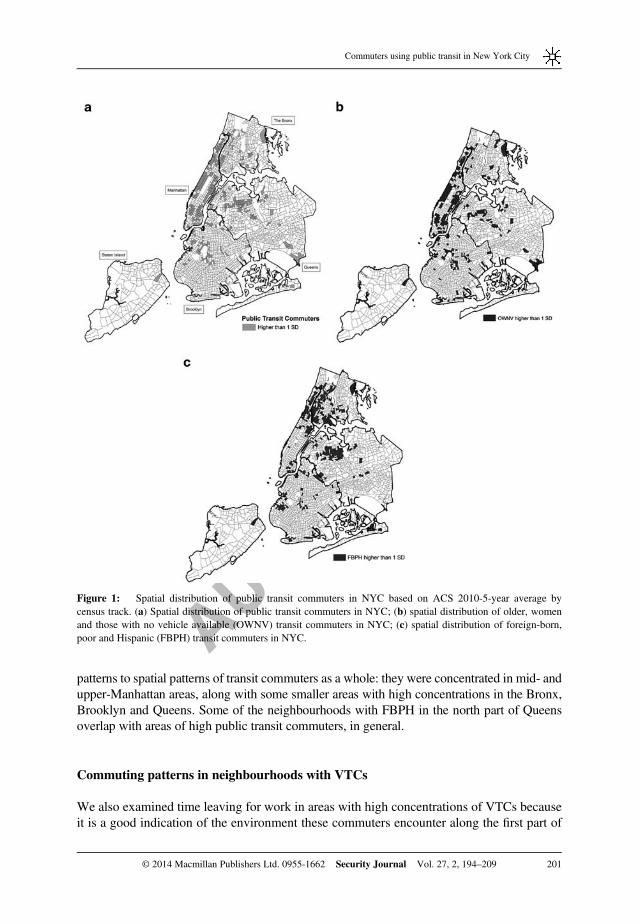
Figure 1 presents the spatial distribution of all public transit commuters (Figure 1a) and theneighbourhood concentration of VTCs (Figure 1b OWNV and Figure 1c FBPH). For ease ofcomparison among three variables, we displayed census tracts with concentrations of the targetpopulation defined as being above one standard deviation. Neighbourhoods with highconcentrations of public transit commuters, in general, were found in parts of Manhattan, andsome parts of the Bronx, Brooklyn and Queens (Figure 1a). Two patterns are apparent fromFigures 1b and 1c. First, high OWNV and FBPH areas were generally located in different partsof NYC. Concentrations of OWNV were found in Manhattan, whereas FBPH clustered in thelower Bronx, parts of Brooklyn and the northern part of Queens. Both types of areas werefound in upper Manhattan areas as well. Second, OWNV areas display somewhat similar
Yu and Smith
200 © 2014 Macmillan Publishers Ltd. 0955-1662 Security Journal Vol. 27, 2, 194–209
A
UTHOR COPY
patterns to spatial patterns of transit commuters as a whole: they were concentrated in mid- andupper-Manhattan areas, along with some smaller areas with high concentrations in the Bronx,Brooklyn and Queens. Some of the neighbourhoods with FBPH in the north part of Queensoverlap with areas of high public transit commuters, in general.
Commuting patterns in neighbourhoods with VTCs
We also examined time leaving for work in areas with high concentrations of VTCs becauseit is a good indication of the environment these commuters encounter along the first part of
Figure 1: Spatial distribution of public transit commuters in NYC based on ACS 2010-5-year average bycensus track. (a) Spatial distribution of public transit commuters in NYC; (b) spatial distribution of older, womenand those with no vehicle available (OWNV) transit commuters in NYC; (c) spatial distribution of foreign-born,poor and Hispanic (FBPH) transit commuters in NYC.
Commuters using public transit in New York City
201© 2014 Macmillan Publishers Ltd. 0955-1662 Security Journal Vol. 27, 2, 194–209
A
UTHOR COPY
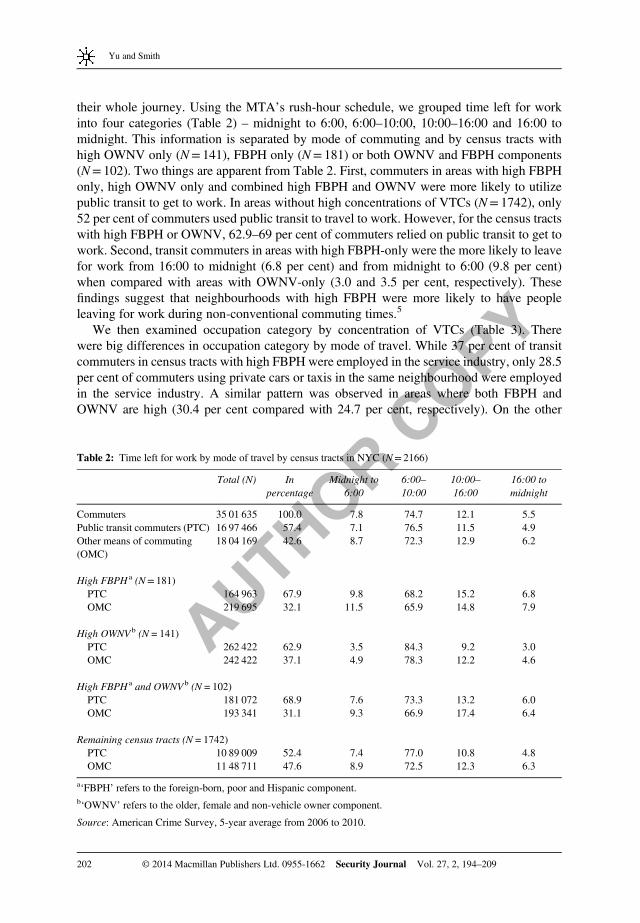
their whole journey. Using the MTA’s rush-hour schedule, we grouped time left for workinto four categories (Table 2) – midnight to 6:00, 6:00–10:00, 10:00–16:00 and 16:00 tomidnight. This information is separated by mode of commuting and by census tracts withhigh OWNV only (N= 141), FBPH only (N= 181) or both OWNV and FBPH components(N= 102). Two things are apparent from Table 2. First, commuters in areas with high FBPHonly, high OWNV only and combined high FBPH and OWNV were more likely to utilizepublic transit to get to work. In areas without high concentrations of VTCs (N= 1742), only52 per cent of commuters used public transit to travel to work. However, for the census tractswith high FBPH or OWNV, 62.9–69 per cent of commuters relied on public transit to get towork. Second, transit commuters in areas with high FBPH-only were the more likely to leavefor work from 16:00 to midnight (6.8 per cent) and from midnight to 6:00 (9.8 per cent)when compared with areas with OWNV-only (3.0 and 3.5 per cent, respectively). Thesefindings suggest that neighbourhoods with high FBPH were more likely to have peopleleaving for work during non-conventional commuting times.5
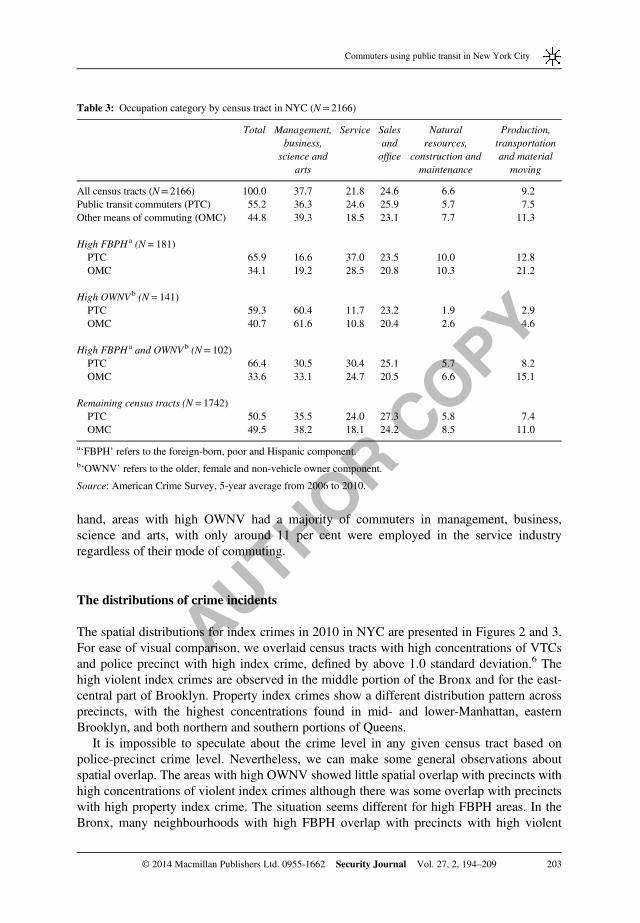
We then examined occupation category by concentration of VTCs (Table 3). Therewere big differences in occupation category by mode of travel. While 37 per cent of transitcommuters in census tracts with high FBPH were employed in the service industry, only 28.5per cent of commuters using private cars or taxis in the same neighbourhood were employedin the service industry. A similar pattern was observed in areas where both FBPH andOWNV are high (30.4 per cent compared with 24.7 per cent, respectively). On the other
Table 2: Time left for work by mode of travel by census tracts in NYC (N= 2166)
Total (N) Inpercentage
Midnight to6:00
6:00–10:00
10:00–16:00
16:00 tomidnight
Commuters 35 01 635 100.0 7.8 74.7 12.1 5.5Public transit commuters (PTC) 16 97 466 57.4 7.1 76.5 11.5 4.9Other means of commuting(OMC)
18 04 169 42.6 8.7 72.3 12.9 6.2
High FBPH a (N= 181)PTC 164 963 67.9 9.8 68.2 15.2 6.8OMC 219 695 32.1 11.5 65.9 14.8 7.9
High OWNV b (N= 141)PTC 262 422 62.9 3.5 84.3 9.2 3.0OMC 242 422 37.1 4.9 78.3 12.2 4.6
High FBPH a and OWNV b (N= 102)PTC 181 072 68.9 7.6 73.3 13.2 6.0OMC 193 341 31.1 9.3 66.9 17.4 6.4
Remaining census tracts (N= 1742)PTC 10 89 009 52.4 7.4 77.0 10.8 4.8OMC 11 48 711 47.6 8.9 72.5 12.3 6.3
a‘FBPH’ refers to the foreign-born, poor and Hispanic component.b‘OWNV’ refers to the older, female and non-vehicle owner component.
Source: American Crime Survey, 5-year average from 2006 to 2010.
Yu and Smith
202 © 2014 Macmillan Publishers Ltd. 0955-1662 Security Journal Vol. 27, 2, 194–209
A
UTHOR COPY
hand, areas with high OWNV had a majority of commuters in management, business,science and arts, with only around 11 per cent were employed in the service industryregardless of their mode of commuting.
The distributions of crime incidents
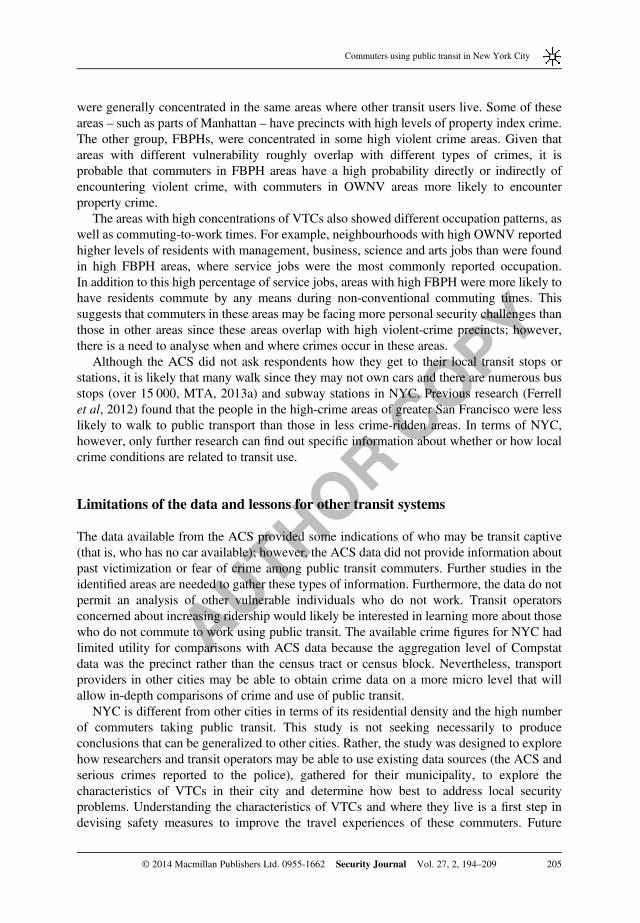
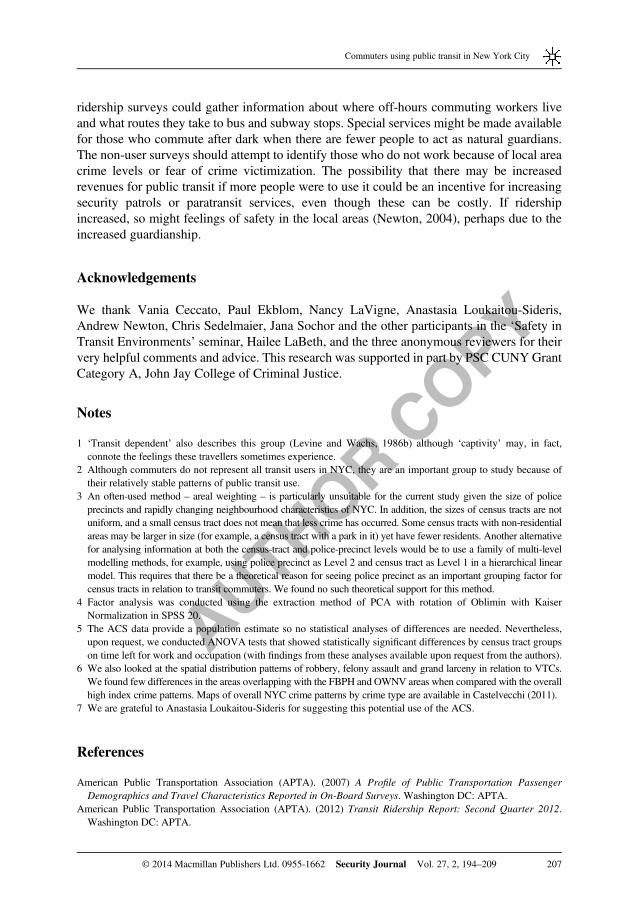
The spatial distributions for index crimes in 2010 in NYC are presented in Figures 2 and 3.For ease of visual comparison, we overlaid census tracts with high concentrations of VTCsand police precinct with high index crime, defined by above 1.0 standard deviation.6 Thehigh violent index crimes are observed in the middle portion of the Bronx and for the east-central part of Brooklyn. Property index crimes show a different distribution pattern acrossprecincts, with the highest concentrations found in mid- and lower-Manhattan, easternBrooklyn, and both northern and southern portions of Queens.
It is impossible to speculate about the crime level in any given census tract based onpolice-precinct crime level. Nevertheless, we can make some general observations aboutspatial overlap. The areas with high OWNV showed little spatial overlap with precincts withhigh concentrations of violent index crimes although there was some overlap with precinctswith high property index crime. The situation seems different for high FBPH areas. In theBronx, many neighbourhoods with high FBPH overlap with precincts with high violent
Table 3: Occupation category by census tract in NYC (N= 2166)
Total Management,business,
science andarts
Service Salesandoffice
Naturalresources,
construction andmaintenance
Production,transportationand material
moving
All census tracts (N= 2166) 100.0 37.7 21.8 24.6 6.6 9.2Public transit commuters (PTC) 55.2 36.3 24.6 25.9 5.7 7.5Other means of commuting (OMC) 44.8 39.3 18.5 23.1 7.7 11.3
High FBPH a (N= 181)PTC 65.9 16.6 37.0 23.5 10.0 12.8OMC 34.1 19.2 28.5 20.8 10.3 21.2
High OWNV b (N= 141)PTC 59.3 60.4 11.7 23.2 1.9 2.9OMC 40.7 61.6 10.8 20.4 2.6 4.6
High FBPH a and OWNV b (N= 102)PTC 66.4 30.5 30.4 25.1 5.7 8.2OMC 33.6 33.1 24.7 20.5 6.6 15.1
Remaining census tracts (N= 1742)PTC 50.5 35.5 24.0 27.3 5.8 7.4OMC 49.5 38.2 18.1 24.2 8.5 11.0
a‘FBPH’ refers to the foreign-born, poor and Hispanic component.b‘OWNV’ refers to the older, female and non-vehicle owner component.
Source: American Crime Survey, 5-year average from 2006 to 2010.
Commuters using public transit in New York City
203© 2014 Macmillan Publishers Ltd. 0955-1662 Security Journal Vol. 27, 2, 194–209
A
UTHOR COPY
index crimes while in Queens and Brooklyn, only a few areas with high FBPH show thispattern. A few high FBPH were found in precincts with high property index crime.
Discussion of the Results
This study found that VTCs are not a homogeneous group and they do not reside in the sameareas of the NYC, although some overlap was found. Of the two groups identified, OWNVs
Figure 2: Spatial distribution of violent index crime and vulnerable transit riders in NYC based on ACS 2010-5-year average by census track. (a) Spatial distribution of violent index crime and OWNV in NYC, 2010; (b)spatial distribution of violent index crime and FBPH in NYC, 2010.
Figure 3: Spatial distribution of property index crime and vulnerable transit riders in NYC based on ACS2010-5-year average by census track. (a) Spatial distribution of property index crime and OWNV in NYC, 2010;(b) spatial distribution of property index crime and FBPH in NYC, 2010.
Yu and Smith
204 © 2014 Macmillan Publishers Ltd. 0955-1662 Security Journal Vol. 27, 2, 194–209
A
UTHOR COPY
were generally concentrated in the same areas where other transit users live. Some of theseareas – such as parts of Manhattan – have precincts with high levels of property index crime.The other group, FBPHs, were concentrated in some high violent crime areas. Given thatareas with different vulnerability roughly overlap with different types of crimes, it isprobable that commuters in FBPH areas have a high probability directly or indirectly ofencountering violent crime, with commuters in OWNV areas more likely to encounterproperty crime.
The areas with high concentrations of VTCs also showed different occupation patterns, aswell as commuting-to-work times. For example, neighbourhoods with high OWNV reportedhigher levels of residents with management, business, science and arts jobs than were foundin high FBPH areas, where service jobs were the most commonly reported occupation.In addition to this high percentage of service jobs, areas with high FBPH were more likely tohave residents commute by any means during non-conventional commuting times. Thissuggests that commuters in these areas may be facing more personal security challenges thanthose in other areas since these areas overlap with high violent-crime precincts; however,there is a need to analyse when and where crimes occur in these areas.
Although the ACS did not ask respondents how they get to their local transit stops orstations, it is likely that many walk since they may not own cars and there are numerous busstops (over 15 000, MTA, 2013a) and subway stations in NYC. Previous research (Ferrellet al, 2012) found that the people in the high-crime areas of greater San Francisco were lesslikely to walk to public transport than those in less crime-ridden areas. In terms of NYC,however, only further research can find out specific information about whether or how localcrime conditions are related to transit use.
Limitations of the data and lessons for other transit systems
The data available from the ACS provided some indications of who may be transit captive(that is, who has no car available); however, the ACS data did not provide information aboutpast victimization or fear of crime among public transit commuters. Further studies in theidentified areas are needed to gather these types of information. Furthermore, the data do notpermit an analysis of other vulnerable individuals who do not work. Transit operatorsconcerned about increasing ridership would likely be interested in learning more about thosewho do not commute to work using public transit. The available crime figures for NYC hadlimited utility for comparisons with ACS data because the aggregation level of Compstatdata was the precinct rather than the census tract or census block. Nevertheless, transportproviders in other cities may be able to obtain crime data on a more micro level that willallow in-depth comparisons of crime and use of public transit.
NYC is different from other cities in terms of its residential density and the high numberof commuters taking public transit. This study is not seeking necessarily to produceconclusions that can be generalized to other cities. Rather, the study was designed to explorehow researchers and transit operators may be able to use existing data sources (the ACS andserious crimes reported to the police), gathered for their municipality, to explore thecharacteristics of VTCs in their city and determine how best to address local securityproblems. Understanding the characteristics of VTCs and where they live is a first step indevising safety measures to improve the travel experiences of these commuters. Future
Commuters using public transit in New York City
205© 2014 Macmillan Publishers Ltd. 0955-1662 Security Journal Vol. 27, 2, 194–209

A
UTHOR COPY
studies should look at ways to understand this heterogeneous population and address theirconcerns in the most useful way.
Finally, the ACS may also be used for planning and assessing other transit services, suchas the DASH bus services in Los Angeles that costs riders $0.50 or less.7 These buses servelocal neighbourhoods, providing service to the downtown area and regional transport links,and are designed to provide ‘frequent, inexpensive, and convenient bus service’ (LosAngeles Department of Transportation (LADOT), 2013).
Policy implications
This research has demonstrated ACS data can be effectively used to identify areas thatwarrant further analysis in terms of transit-commuter vulnerability. Areas identified in thisstudy have high concentrations of public-transit-commuting residents with characteristicsrelated to personal security vulnerability. Two main types of further research are neededin these areas. Site surveys (Felson et al, 1990; Ceccato et al, 2013) – often referred to assafety audits if used to focus on gender-related concerns (Smith, 2008) – and surveysof riders, non-users and community leaders (Boyle and Ouderkirk, 1993) can be used toexamine these areas in more detail and assist transit operators in planning for securityupgrades, specifically making physical changes to increase guardianship possibilities. Caremust be used, however, since both theory and practice in situational crime preventionsuggest the need for a crime-specific approach (Cornish and Clarke, 2008).
The PCA identified areas according to two main groupings (OWNV and FBPH), which,in their highest concentrations, were often not in the same census tracts – or even the sametypes of areas. This suggests that the security needs of transit commuters in these areas maybe different from each other. In addition, the high OWNV-only tracts often overlapped withareas with high levels of public transport use in general, while high FBPH-only tracts tendedonly to overlap with this group in some parts of Manhattan and in northern Queens. Theseareal overlaps may indicate that these otherwise VTCs are less vulnerable than they mightotherwise be. This could occur if areas with high usage are less risky for individualcommuters either due to the relatively higher levels of guardianship provided by other transitcommuters or if transit operators provide more security in areas with a high volume of riders.Surveys in these areas should examine this possibility and concentrate crime-preventionresources accordingly.
When focusing on the areas with high FBPH, it is important to consider the overallvulnerability characteristics of this group. For example, the FBPH clustering represents someof the most vulnerable groups in NYC – foreign-born, the poor and Hispanic. Whilerespondents in these areas are working, the areas do not tend to overlap geographically withhigh transit-use areas as a whole, except in parts of Manhattan and northern Queens. Thisgeographic separation may be a reflection of (or a causal factor for) their social or evencultural isolation, factors that are beyond the scope of the present study. Transit surveys maynot normally cover these types of issues, but questions about social isolation can be added tosee if residents in these high FBPH areas are in fact more isolated than those in high OWNVareas and to help determine if this social isolation affects their use of public transit.
The findings on times leaving for work suggest that policymakers should note thedifferent commuting patterns in the areas with high concentrations of VTCs. The focused
Yu and Smith
206 © 2014 Macmillan Publishers Ltd. 0955-1662 Security Journal Vol. 27, 2, 194–209
A
UTHOR COPY
ridership surveys could gather information about where off-hours commuting workers liveand what routes they take to bus and subway stops. Special services might be made availablefor those who commute after dark when there are fewer people to act as natural guardians.The non-user surveys should attempt to identify those who do not work because of local areacrime levels or fear of crime victimization. The possibility that there may be increasedrevenues for public transit if more people were to use it could be an incentive for increasingsecurity patrols or paratransit services, even though these can be costly. If ridershipincreased, so might feelings of safety in the local areas (Newton, 2004), perhaps due to theincreased guardianship.
Acknowledgements
We thank Vania Ceccato, Paul Ekblom, Nancy LaVigne, Anastasia Loukaitou-Sideris,Andrew Newton, Chris Sedelmaier, Jana Sochor and the other participants in the ‘Safety inTransit Environments’ seminar, Hailee LaBeth, and the three anonymous reviewers for theirvery helpful comments and advice. This research was supported in part by PSC CUNY GrantCategory A, John Jay College of Criminal Justice.
Notes
1 ‘Transit dependent’ also describes this group (Levine and Wachs, 1986b) although ‘captivity’ may, in fact,connote the feelings these travellers sometimes experience.
2 Although commuters do not represent all transit users in NYC, they are an important group to study because oftheir relatively stable patterns of public transit use.
3 An often-used method – areal weighting – is particularly unsuitable for the current study given the size of policeprecincts and rapidly changing neighbourhood characteristics of NYC. In addition, the sizes of census tracts are notuniform, and a small census tract does not mean that less crime has occurred. Some census tracts with non-residentialareas may be larger in size (for example, a census tract with a park in it) yet have fewer residents. Another alternativefor analysing information at both the census-tract and police-precinct levels would be to use a family of multi-levelmodelling methods, for example, using police precinct as Level 2 and census tract as Level 1 in a hierarchical linearmodel. This requires that there be a theoretical reason for seeing police precinct as an important grouping factor forcensus tracts in relation to transit commuters. We found no such theoretical support for this method.
4 Factor analysis was conducted using the extraction method of PCA with rotation of Oblimin with KaiserNormalization in SPSS 20.
5 The ACS data provide a population estimate so no statistical analyses of differences are needed. Nevertheless,upon request, we conducted ANOVA tests that showed statistically significant differences by census tract groupson time left for work and occupation (with findings from these analyses available upon request from the authors).
6 We also looked at the spatial distribution patterns of robbery, felony assault and grand larceny in relation to VTCs.We found few differences in the areas overlapping with the FBPH and OWNV areas when compared with the overallhigh index crime patterns. Maps of overall NYC crime patterns by crime type are available in Castelvecchi (2011).
7 We are grateful to Anastasia Loukaitou-Sideris for suggesting this potential use of the ACS.
References
American Public Transportation Association (APTA). (2007) A Profile of Public Transportation PassengerDemographics and Travel Characteristics Reported in On-Board Surveys. Washington DC: APTA.
American Public Transportation Association (APTA). (2012) Transit Ridership Report: Second Quarter 2012.Washington DC: APTA.
Commuters using public transit in New York City
207© 2014 Macmillan Publishers Ltd. 0955-1662 Security Journal Vol. 27, 2, 194–209
A
UTHOR COPY
Bailey, L. (2004) Aging Americans: Stranded without Options. Surface Transportation Policy Project WashingtonDC: American Public Transportation Association.
Boyle, D.K. and Ouderkirk, P.E. (1993) Strategic planning for transit agencies in small urbanized areas.Transportation Research Record 1402: 25–27.
Brantingham, P. and Brantingham, P. (2008) Crime pattern theory. In: R. Wortley and L. Mazerolle (eds.)Environmental Criminology and Crime Analysis. Cullompton, UK: Willan, pp. 78–93.
Byrne, T., Prvu Bettger, J., Brusilovskiy, E., Wong, Y.-L., Metraux, S. and Salzer, M.S. (2013) Comparingneighbourhoods of adults with serious mental illness and of the general population: Research implications.Psychiatric Services 64(8): 782–788.
Castelvecchi, D. (2011) New York City’s 20 years of declining crime: Two decades of New York police departmentcrime statistics mapped precinct by precinct. Scientific American, 4 August, http://www.scientificamerican.com/article.cfm?id=crime-new-york-city-20-years-declining-stats-maps, accessed 6 November 2013.
Ceccato, V., Uittenbogaard, A. and Bamzar, R. (2013) Security in Stockholm’s underground stations: Theimportance of environmental attributes and context. Security Journal 26(1): 33–59.
Clarke, R.V. (ed.) (1992) Situational Crime Prevention: Successful Case Studies. Guilderland, NY: Harrow and Heston.Clarke, R.V. and Cornish, D.B. (1985) Modelling offenders’ decisions: A framework for research and policy. In:
M. Tonry and N. Morris (eds.) Crime and Justice: An Annual Review of Research. Vol. 6. Chicago, IL: Universityof Chicago Press, pp. 147–185.
Cohen, L.E. and Felson, M. (1979) Social change and crime rates: A routine activity approach. AmericanSociological Review 44(4): 588–608.
Cornish, D.B. and Clarke, R.V. (2008) The rational choice perspective. In: R. Wortley and L. Mazerolle (eds.)Environmental Criminology and Crime Analysis. Cullompton, UK: Willan, pp. 21–47.
Crime Concern. (2004) People's Perceptions of Personal Security and Their Concerns about Crime on PublicTransport: Literature Review. London, UK: Crime Concern and Department for Transport.
Department for Transport. (1999) Personal Security Issues in Pedestrian Journeys. London, UK: Department forTransport.
Department for Transport. (2002) A Bulletin of Public Transport Statistics: Great Britain 2002. London, UK:Department for Public Transport.
Eck, J.E. (1995) Examining routine activity theory: A review of two books. Justice Quarterly 12(4): 783–797.Felson, M. (1986) Linking criminal choices, routine activities, informal control,and criminal outcomes. In:
D.B. Cornish and R.V. Clarke (eds.) The Reasoning Criminal: Rational Choice Perspectives on Offending. NewYork: Springer-Verlag, pp. 117–128.
Felson, M. (1987) Routine activity’s and crime prevention in the developing metropolis. Criminology 25(4): 911–931.Felson, M. et al (1990) Preventing crime at Newark subway stations. Security Journal 1(3): 137–142.Ferrell, C.E., Mathur, S., Meek, J. and Piven, M. (2012) Neighbourhood Crime and Travel Behavior: An
Investigation of the Influence of Neighbourhood Crime Rates on Mode Choice – Phase II. San Jose, CA: MinetaTransportation Institute.
Fineman, M.A. (2008) The vulnerable subject: Anchoring equality in the human condition. Yale Journal of Law andFeminism 20: 1–23.
Goldstein, H. (1979) Improving policing: A problem-oriented approach. Crime and Delinquency 25(2): 236–258.Groff, E.R., Weisburd, D. and Yang, S.-M. (2010) Is it important to examine crime trends at a local ‘micro’ level?:
A longitudinal analysis of street to street variability in crime trajectories. Journal of Quantitative Criminology26(1): 7–32.
Knepper, P. (2009) How situational crime prevention contributes to social welfare. Liverpool Law Review 30(1): 57–75.Levine, N. and Wachs, M. (1986a) Bus crime in Los Angeles: I – Measuring the incidence. Transportation
Research A 20(4): 273–284.Levine, N. and Wachs, M. (1986b) Bus crime in Los Angeles: II – Victims and public impact. Transportation
Research A 20A(4): 285–293.Los Angeles Department of Transportation (LADOT). (2013) LADOT transit services, http://www.ladottransit.com/
dash/, accessed 7 November 2013.Loukaitou-Sideris, A. and Fink, C. (2009) Addressing women’s fear of victimisation in transportation settings:
A survey of US transit agencies. Urban Affairs Review 44(4): 554–587.Maxson, P., Browne, C., Conway, R., Mather, A. and Ridgway, J. (2001) Secure Transport Route-Manchester
(Victoria) to Clitheroe Pilot. London: Department of the Environment, Transport and the Regions and CrimeConcern.
Yu and Smith
208 © 2014 Macmillan Publishers Ltd. 0955-1662 Security Journal Vol. 27, 2, 194–209
A
UTHOR COPY
Metropolitan Transportation Authority. (2013a) MTA info – Subway and bus ridership, http://web.mta.info/nyct/facts/ridership/index.htm, accessed 30 July 2013.
Metropolitan Transportation Authority. (2013b) MTA info – Subways, http://www.mta.info/nyct/facts/ffsubway.htm, accessed 6 October 2013.
Newton, A.D. (2004) Crime and disorder on buses: Toward an evidence base for effective crime prevention, PhDthesis. Liverpool, UK: University of Liverpool.
Patterson, A.H. (1985) Fear of crime and other barriers to the use of public trasnit by the elderly. Journal ofArchitectural Planning and Research 2(4): 277–288.
Roundtree, P.W. and Land, K.C. (1996) Perceived risk versus fear of crime: Empirical evidence of conceptuallydistinct reactions in survey data. Social Forces 74(4): 1353–1376.
Smith, M.J. (2008) Addressing the security needs of women passengers on public transport. Security Journal21(1–2): 117–133.
Smith, M.J. and Cornish, D.B. (eds.) (2006) Secure and Tranquil Travel: Preventing Crime and Disorder on PublicTransport. London: UCL – Jill Dando Institute of Crime Science.
Toronto Travel Commission (TTC), Metro Action Committee on Public Violence against Women and Children(METRAC) and Metro Toronto Police Force (MTPF). (1989) Moving Forward: Making Transit Safer forWomen. Toronto, Canada: TTC, METRAC and MTPF.
US Census Bureau (USCB). (2011) 2006–2010 American Community Survey, http://www.census.gov/acs/www/about_the_survey/american_community_survey/, accessed 6 October 2013.
US Census Bureau (USCB). (2013) American Community Survey: Information Guide. Washington DC: US CensusBureau.
US Census Bureau (USCB). (n.d.) American Community Survey: Response rates–Data, http://www.census.gov/acs/www/methodology/response_rates_data/, accessed 6 October 2013.
Yu, D., Fang, C., Xue, D. and Yin, J. (2013) Assessing urban public safety via indicator-based evaluating method:A systemic view of Shanghai. Social Indicators Research, published online 5 July, doi: 10.1007/s11205-013-0366-z.
Commuters using public transit in New York City
209© 2014 Macmillan Publishers Ltd. 0955-1662 Security Journal Vol. 27, 2, 194–209
Related Documents