Community-Wide Health Risk Assessment Using Geographically Resolved Demographic Data: A Synthetic Population Approach Jonathan I. Levy*, Maria Patricia Fabian, Junenette L. Peters Department of Environmental Health, Boston University School of Public Health, Boston, Massachusetts, United States of America Abstract Background: Evaluating environmental health risks in communities requires models characterizing geographic and demographic patterns of exposure to multiple stressors. These exposure models can be constructed from multivariable regression analyses using individual-level predictors (microdata), but these microdata are not typically available with sufficient geographic resolution for community risk analyses given privacy concerns. Methods: We developed synthetic geographically-resolved microdata for a low-income community (New Bedford, Massachusetts) facing multiple environmental stressors. We first applied probabilistic reweighting using simulated annealing to data from the 2006–2010 American Community Survey, combining 9,135 microdata samples from the New Bedford area with census tract-level constraints for individual and household characteristics. We then evaluated the synthetic microdata using goodness-of-fit tests and by examining spatial patterns of microdata fields not used as constraints. As a demonstration, we developed a multivariable regression model predicting smoking behavior as a function of individual-level microdata fields using New Bedford-specific data from the 2006–2010 Behavioral Risk Factor Surveillance System, linking this model with the synthetic microdata to predict demographic and geographic smoking patterns in New Bedford. Results: Our simulation produced microdata representing all 94,944 individuals living in New Bedford in 2006–2010. Variables in the synthetic population matched the constraints well at the census tract level (e.g., ancestry, gender, age, education, household income) and reproduced the census-derived spatial patterns of non-constraint microdata. Smoking in New Bedford was significantly associated with numerous demographic variables found in the microdata, with estimated tract-level smoking rates varying from 20% (95% CI: 17%, 22%) to 37% (95% CI: 30%, 45%). Conclusions: We used simulation methods to create geographically-resolved individual-level microdata that can be used in community-wide exposure and risk assessment studies. This approach provides insights regarding community-scale exposure and vulnerability patterns, valuable in settings where policy can be informed by characterization of multi-stressor exposures and health risks at high resolution. Citation: Levy JI, Fabian MP, Peters JL (2014) Community-Wide Health Risk Assessment Using Geographically Resolved Demographic Data: A Synthetic Population Approach. PLoS ONE 9(1): e87144. doi:10.1371/journal.pone.0087144 Editor: Yu-Kang Tu, National Taiwan University, Taiwan Received June 13, 2013; Accepted December 21, 2013; Published January 28, 2014 Copyright: ß 2014 Levy et al. This is an open-access article distributed under the terms of the Creative Commons Attribution License, which permits unrestricted use, distribution, and reproduction in any medium, provided the original author and source are credited. Funding: This research has been supported by a grant from the U.S. Environmental Protection Agency’s Science to Achieve Results (STAR) program. Although the research described in the article has been funded wholly or in part by the U.S. Environmental Protection Agency’s STAR program through grant RD83457702, it has not been subjected to any EPA review and therefore does not necessarily reflect the views of the Agency, and no official endorsement should be inferred. The funders had no role in study design, data collection and analysis, decision to publish, or preparation of the manuscript. Competing Interests: The authors have declared that no competing interests exist. * E-mail: [email protected] Introduction Evaluation of environmental health risks in communities has increasingly focused on the combined risks to health from multiple agents or stressors, defined by the United States Environmental Protection Agency (US EPA) as ‘‘cumulative risk assessment’’ [1]. This is in part because of the growing recognition that background exposures and susceptibility characteristics need to be considered in developing appropriate dose-response models, but also relates to environmental justice concerns and general decision relevance [2,3]. This cumulative risk framework theoretically considers not only multiple chemical exposures, but also the effects of social stressors and other factors of the built and social environment that operate at either individual or community levels [4]. While this framework is appealing, there are significant analytical challenges. One such challenge is developing exposure models, which must have sufficient geographic and demographic resolution to provide relevant contrasts within the community and to identify high-risk subpopulations given correlations (positive or negative) among stressors. It is impractical to gather detailed exposure measurements or exposure-related information from all members of a community, so in many cases investigators must leverage a limited number of exposure measurements and develop broadly applicable exposure PLOS ONE | www.plosone.org 1 January 2014 | Volume 9 | Issue 1 | e87144

Welcome message from author
This document is posted to help you gain knowledge. Please leave a comment to let me know what you think about it! Share it to your friends and learn new things together.
Transcript
Community-Wide Health Risk Assessment UsingGeographically Resolved Demographic Data: A SyntheticPopulation ApproachJonathan I. Levy*, Maria Patricia Fabian, Junenette L. Peters
Department of Environmental Health, Boston University School of Public Health, Boston, Massachusetts, United States of America
Abstract
Background: Evaluating environmental health risks in communities requires models characterizing geographic anddemographic patterns of exposure to multiple stressors. These exposure models can be constructed from multivariableregression analyses using individual-level predictors (microdata), but these microdata are not typically available withsufficient geographic resolution for community risk analyses given privacy concerns.
Methods: We developed synthetic geographically-resolved microdata for a low-income community (New Bedford,Massachusetts) facing multiple environmental stressors. We first applied probabilistic reweighting using simulatedannealing to data from the 2006–2010 American Community Survey, combining 9,135 microdata samples from the NewBedford area with census tract-level constraints for individual and household characteristics. We then evaluated thesynthetic microdata using goodness-of-fit tests and by examining spatial patterns of microdata fields not used asconstraints. As a demonstration, we developed a multivariable regression model predicting smoking behavior as a functionof individual-level microdata fields using New Bedford-specific data from the 2006–2010 Behavioral Risk Factor SurveillanceSystem, linking this model with the synthetic microdata to predict demographic and geographic smoking patterns in NewBedford.
Results: Our simulation produced microdata representing all 94,944 individuals living in New Bedford in 2006–2010.Variables in the synthetic population matched the constraints well at the census tract level (e.g., ancestry, gender, age,education, household income) and reproduced the census-derived spatial patterns of non-constraint microdata. Smoking inNew Bedford was significantly associated with numerous demographic variables found in the microdata, with estimatedtract-level smoking rates varying from 20% (95% CI: 17%, 22%) to 37% (95% CI: 30%, 45%).
Conclusions: We used simulation methods to create geographically-resolved individual-level microdata that can be used incommunity-wide exposure and risk assessment studies. This approach provides insights regarding community-scaleexposure and vulnerability patterns, valuable in settings where policy can be informed by characterization of multi-stressorexposures and health risks at high resolution.
Citation: Levy JI, Fabian MP, Peters JL (2014) Community-Wide Health Risk Assessment Using Geographically Resolved Demographic Data: A SyntheticPopulation Approach. PLoS ONE 9(1): e87144. doi:10.1371/journal.pone.0087144
Editor: Yu-Kang Tu, National Taiwan University, Taiwan
Received June 13, 2013; Accepted December 21, 2013; Published January 28, 2014
Copyright: � 2014 Levy et al. This is an open-access article distributed under the terms of the Creative Commons Attribution License, which permits unrestricteduse, distribution, and reproduction in any medium, provided the original author and source are credited.
Funding: This research has been supported by a grant from the U.S. Environmental Protection Agency’s Science to Achieve Results (STAR) program. Althoughthe research described in the article has been funded wholly or in part by the U.S. Environmental Protection Agency’s STAR program through grant RD83457702,it has not been subjected to any EPA review and therefore does not necessarily reflect the views of the Agency, and no official endorsement should be inferred.The funders had no role in study design, data collection and analysis, decision to publish, or preparation of the manuscript.
Competing Interests: The authors have declared that no competing interests exist.
* E-mail: [email protected]
Introduction
Evaluation of environmental health risks in communities has
increasingly focused on the combined risks to health from multiple
agents or stressors, defined by the United States Environmental
Protection Agency (US EPA) as ‘‘cumulative risk assessment’’ [1].
This is in part because of the growing recognition that background
exposures and susceptibility characteristics need to be considered
in developing appropriate dose-response models, but also relates to
environmental justice concerns and general decision relevance
[2,3]. This cumulative risk framework theoretically considers not
only multiple chemical exposures, but also the effects of social
stressors and other factors of the built and social environment that
operate at either individual or community levels [4].
While this framework is appealing, there are significant
analytical challenges. One such challenge is developing exposure
models, which must have sufficient geographic and demographic
resolution to provide relevant contrasts within the community and
to identify high-risk subpopulations given correlations (positive or
negative) among stressors.
It is impractical to gather detailed exposure measurements or
exposure-related information from all members of a community,
so in many cases investigators must leverage a limited number of
exposure measurements and develop broadly applicable exposure
PLOS ONE | www.plosone.org 1 January 2014 | Volume 9 | Issue 1 | e87144
models. For air pollutants of ambient origin, monitoring networks
and public geospatial databases may be sufficient to evaluate
exposures, but for most other stressors, additional information
would be required. For example, mercury exposure is typically
dominated by fish consumption, which may be influenced by
income, race/ethnicity, and other factors [5]. Smoking has been
predicted by gender, age, income, race/ethnicity, education,
occupation, household configuration, and community-level factors
such as poverty rate and the presence of a state cigarette tax [6].
Cord blood polychlorinated biphenyl (PCB) levels have been
related to factors such as maternal age, country of origin, and
dietary patterns [7]. Blood lead has been associated with income,
race, and age of home [8]. A common feature of these models is
that they use multivariable regression to explain exposure
variability, generally using predictors that could be obtained from
public databases or approximated using standard assumptions.
A significant barrier in applying these models to specific
communities is the lack of geographically resolved multivariable
data on key predictors. For example, the US Census provides the
distribution of home age and the distribution of household income
at the census tract level, but not the cross-tabulated distribution of
home age by household income. If attributes are correlated with
one another, which is generally the case given strong socioeco-
nomic interdependence for many attributes, the lack of this
information will lead to erroneous exposure models. Census
microdata provide the detailed individual-level data needed to
determine these interdependencies, but only at very coarse
geographic resolution, because of the need to limit potential
identifiability. Most exposure regression models involve a blend of
geographically resolved (i.e., proximity to sources, home attributes)
and demographically resolved (i.e., age by income by race/
ethnicity) predictors, but it is not possible to obtain multivariable
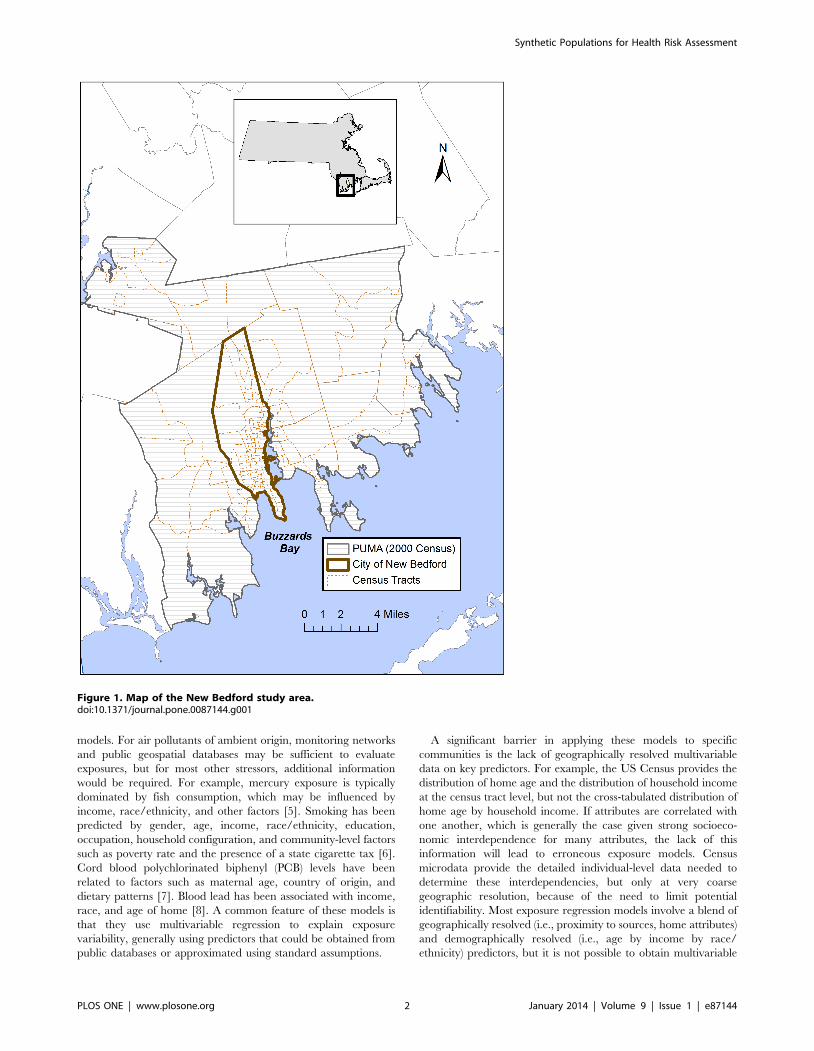
Figure 1. Map of the New Bedford study area.doi:10.1371/journal.pone.0087144.g001
Synthetic Populations for Health Risk Assessment
PLOS ONE | www.plosone.org 2 January 2014 | Volume 9 | Issue 1 | e87144
demographic information with high-resolution geographic data
from public data resources.
Simulation approaches can be used to construct geographically
resolved microdata, using optimization techniques to maximize
the fit between individual-level microdata lacking geographic
resolution and aggregated census data at high geographic
resolution [9,10]. Synthetic microdata have been developed for
a variety of applications, including transportation planning [11],
micro-marketing [12], and health behavior modeling [13].
However, to our knowledge, these methods have never been used
for community-scale modeling of environmental health risks.
In this paper, we develop synthetic microdata for a low-income
community living near a Superfund site (New Bedford, Massa-
chusetts), where these synthetic microdata include multivariable
individual-level attributes and spatially resolved geographic
assignment. We then constructed a new model of the individual-
level likelihood of smoking in New Bedford as a function of the
microdata characteristics. We linked this model to the synthetic
microdata as a demonstration of the usefulness of developing
synthetic microdata in providing insight about the geographic and
demographic patterns of exposure to a key risk factor for the
residents of New Bedford, which can have further implications for
use in characterizing multi-stressor exposures.
Methods
LocationNew Bedford, Massachusetts is a diverse urban city with
approximately 95,000 residents in 2010 (Figure 1). The New
Bedford Harbor was designated a Superfund site in 1982, related
to PCB contamination, and New Bedford contains a number of
hazardous waste sites, industrial sources, and nearby major
roadways [14]. Of the 233 census-designated places in Massachu-
setts in the 2006–2010 American Community Survey (ACS), New
Bedford had the 14th-lowest median household income. Residents
had elevated rates of adult diabetes, hypertension, high cholesterol,
smoking, and obesity [15,16], as well as elevated rates of low birth
weight, inadequate prenatal care, and high childhood blood lead
[17]. New Bedford is therefore a highly vulnerable and susceptible
community, for which cumulative risk assessments can be
informative.
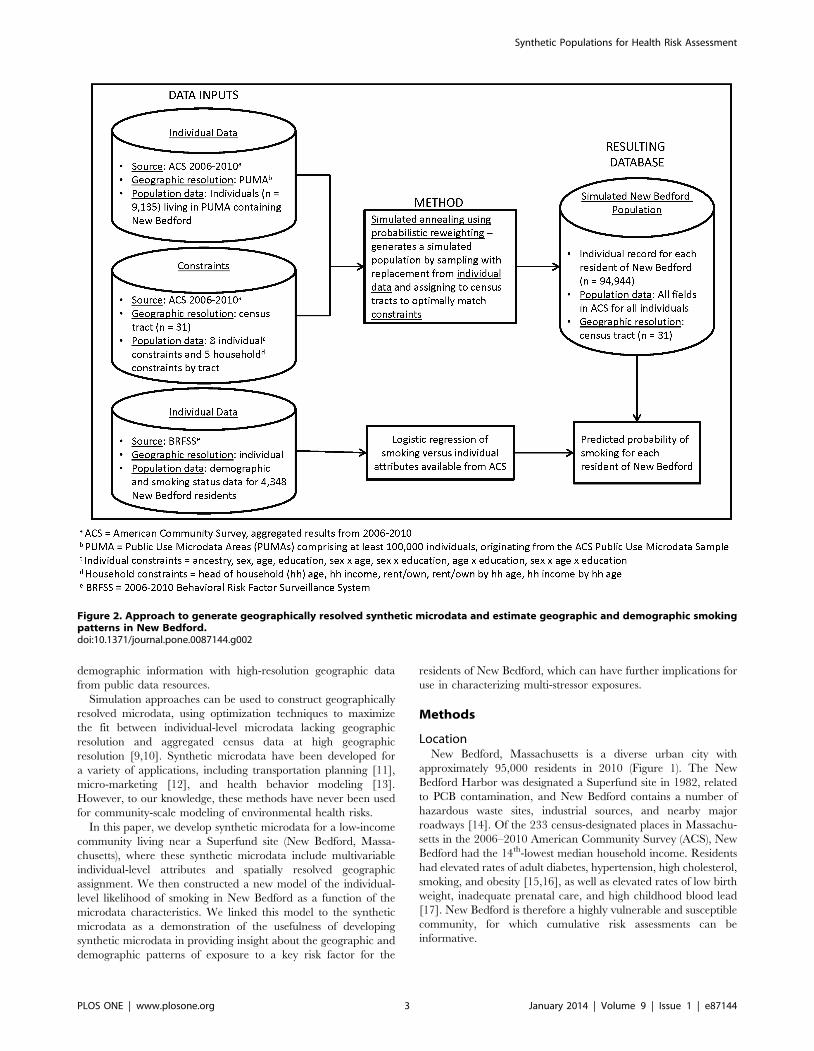
Figure 2. Approach to generate geographically resolved synthetic microdata and estimate geographic and demographic smokingpatterns in New Bedford.doi:10.1371/journal.pone.0087144.g002
Synthetic Populations for Health Risk Assessment
PLOS ONE | www.plosone.org 3 January 2014 | Volume 9 | Issue 1 | e87144
Simulation methodologyTwo general approaches have been used in the literature to
generate synthetic microdata [10] - reweighting, in which the
existing microdata are assigned sets of weights for each small area
to best match the aggregate distributions, and synthetic recon-
struction, in which the microdata are probabilistically generated
given the aggregate distributions. We focus on reweighting
approaches in this analysis, given our interest in characterizing a
large number of population characteristics that may predict
exposure or vulnerability.
Probabilistic reweighting using simulated annealing has been
shown to perform slightly better than alternative reweighting
approaches, such as deterministic reweighting or conditional
probability modeling [9]. As illustrated in Figure 2, this entails
selecting a random subset of households from microdata and
comparing to aggregate area-level constraints, sequentially replac-
ing individual households to see if the fit improves [18]. The
simulated annealing approach helps ensure that global rather than
local optima are obtained. We applied this methodology using the
software package CO [19], which has been tested in multiple
applications and considered to be more robust than alternative
algorithms [10].
Census dataGenerating synthetic microdata using probabilistic reweighting
requires two basic types of data – multivariable individual-level
microdata lacking resolved geographic identifiers, and small area
constraints to place the individuals in appropriate locations. We
derived both from the ACS 5-year database (2006–2010). The
ACS surveys a fraction of the US population each year, and the 5-
year estimates are generally used to determine estimates for
smaller geographic areas (like census tracts). For the microdata, we
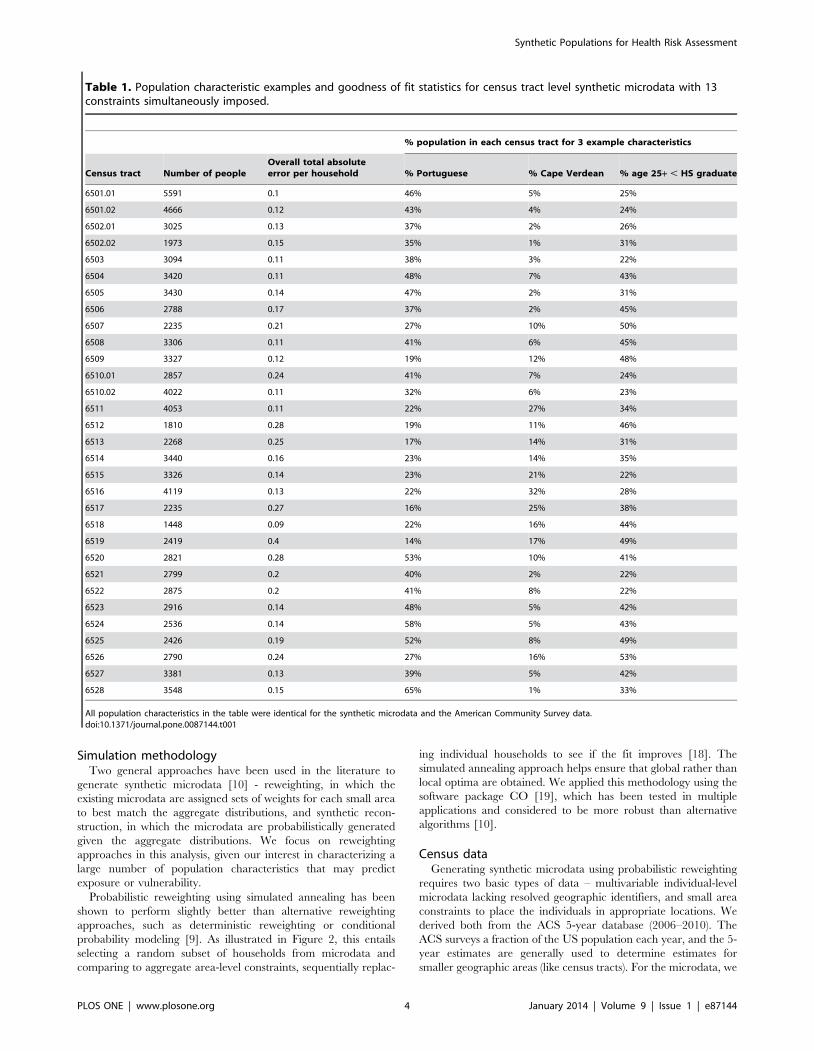
Table 1. Population characteristic examples and goodness of fit statistics for census tract level synthetic microdata with 13constraints simultaneously imposed.
% population in each census tract for 3 example characteristics
Census tract Number of peopleOverall total absoluteerror per household % Portuguese % Cape Verdean % age 25+ , HS graduate
6501.01 5591 0.1 46% 5% 25%
6501.02 4666 0.12 43% 4% 24%
6502.01 3025 0.13 37% 2% 26%
6502.02 1973 0.15 35% 1% 31%
6503 3094 0.11 38% 3% 22%
6504 3420 0.11 48% 7% 43%
6505 3430 0.14 47% 2% 31%
6506 2788 0.17 37% 2% 45%
6507 2235 0.21 27% 10% 50%
6508 3306 0.11 41% 6% 45%
6509 3327 0.12 19% 12% 48%
6510.01 2857 0.24 41% 7% 24%
6510.02 4022 0.11 32% 6% 23%
6511 4053 0.11 22% 27% 34%
6512 1810 0.28 19% 11% 46%
6513 2268 0.25 17% 14% 31%
6514 3440 0.16 23% 14% 35%
6515 3326 0.14 23% 21% 22%
6516 4119 0.13 22% 32% 28%
6517 2235 0.27 16% 25% 38%
6518 1448 0.09 22% 16% 44%
6519 2419 0.4 14% 17% 49%
6520 2821 0.28 53% 10% 41%
6521 2799 0.2 40% 2% 22%
6522 2875 0.2 41% 8% 22%
6523 2916 0.14 48% 5% 42%
6524 2536 0.14 58% 5% 43%
6525 2426 0.19 52% 8% 49%
6526 2790 0.24 27% 16% 53%
6527 3381 0.13 39% 5% 42%
6528 3548 0.15 65% 1% 33%
All population characteristics in the table were identical for the synthetic microdata and the American Community Survey data.doi:10.1371/journal.pone.0087144.t001
Synthetic Populations for Health Risk Assessment
PLOS ONE | www.plosone.org 4 January 2014 | Volume 9 | Issue 1 | e87144
Synthetic Populations for Health Risk Assessment
PLOS ONE | www.plosone.org 5 January 2014 | Volume 9 | Issue 1 | e87144
used ACS data from the Public Use Microdata Sample (PUMS),
which provides geographic identifiers for Public Use Microdata
Areas (PUMAs) comprising at least 100,000 individuals. The
PUMA of interest for our analysis includes New Bedford as well as
bordering or nearby communities (Figure 1). Based on Census
2000 population estimates, 54% of the people living in this PUMA
reside in New Bedford. Of note, if the demographics differ
significantly between surrounding communities and New Bedford,
the simulation approach will preferentially select those microdata
surveys consistent with the small-area constraints for New Bedford,
reducing potential errors associated with PUMA resolution.
For small area constraints, we focused on the census tract as the
unit of analysis, because more candidate constraints were available
at the census tract level than at the block group level. There are 31
census tracts in New Bedford (Figure 1), with population by tract
ranging from 1,448 to 5,591. Candidate constraints were either
associated in the literature with exposures or health outcomes of
interest for our cumulative risk assessments, available in cross-
tabulations (i.e., age by household income, rather than only having
age and household income as separate constraints), or suggested by
community partners given insight about neighborhood differences.
We included 8 individual-level constraints (ancestry, sex, age,
educational attainment, sex by age, sex by educational attainment,
age by educational attainment, and sex by age by educational
attainment) and 5 household-level constraints (head of household
age, household income, rent/own, rent/own by head of household
age, household income by head of household age). Ancestry was
collapsed into 13 categories representing the main countries of
origin in the community and those previously associated with
environmental exposures of interest in New Bedford [7]. For all
other fields, categories were used as provided in the ACS.
Optimization approachFor a given set of constraints, the goodness of fit was evaluated
using the relative sum of square Z-scores associated with individual
constraint tables, in comparison with the chi-square critical value
(p , 0.05). As described by Williamson [19], this approach
minimizes the proportional differences between constraints and
weighted estimates, versus approaches that focus on the absolute
differences. We additionally examined the sum of the total
absolute errors across constraint tables, which is generally
considered to be problematic if the sum exceeds the number of
households in a given geographic area (i.e., if total absolute error
divided by number of households exceeds 1) [19]. Of note, if a
small number of relatively weak constraints are used, it will be easy
to match these constraints with limited error, but there may be
significant error in the distribution of other microdata fields. We
therefore attempted to impose the largest number of constraints
possible, without leading to excessive error.
Microdata evaluation and applicationSynthetic microdata need to be evaluated across three major
dimensions to ensure that the individuals have been assigned to
appropriate geographic areas, therefore making the microdata
applicable to community-scale modeling of environmental health
risks.
Evaluation 1. First, the degree of error needs to be assessed for
the microdata fields included in the constraints (e.g., the total
absolute error divided by the number of households).
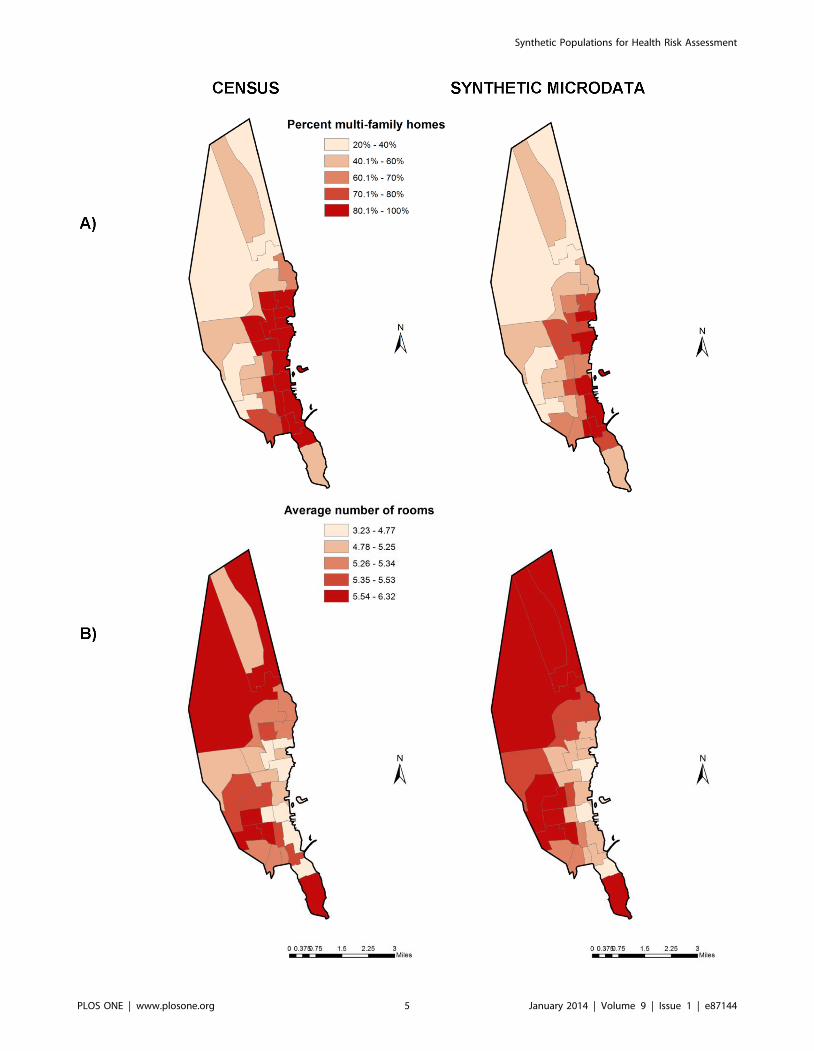
Figure 3. A) Percentage of multi-family homes and B) average number of rooms per household by census tract in New Bedford, asreported by the American Community Survey and estimated by synthetic microdata.doi:10.1371/journal.pone.0087144.g003
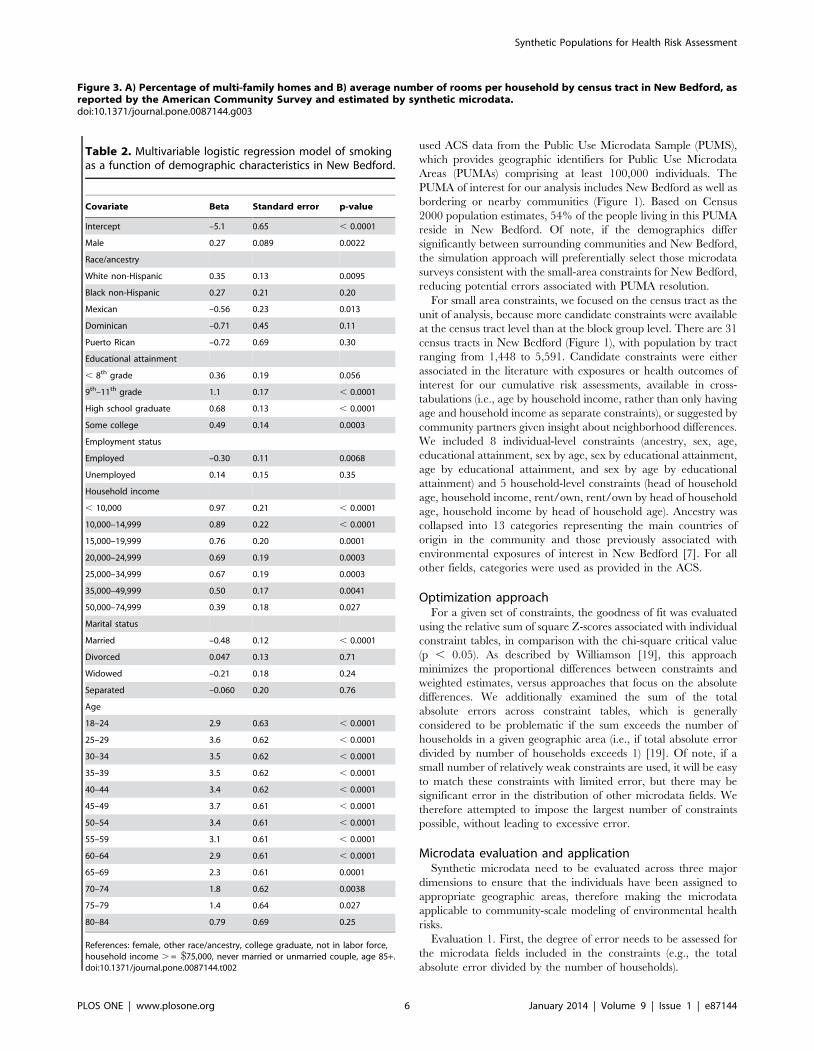
Table 2. Multivariable logistic regression model of smokingas a function of demographic characteristics in New Bedford.
Covariate Beta Standard error p-value
Intercept –5.1 0.65 , 0.0001
Male 0.27 0.089 0.0022
Race/ancestry
White non-Hispanic 0.35 0.13 0.0095
Black non-Hispanic 0.27 0.21 0.20
Mexican –0.56 0.23 0.013
Dominican –0.71 0.45 0.11
Puerto Rican –0.72 0.69 0.30
Educational attainment
, 8th grade 0.36 0.19 0.056
9th–11th grade 1.1 0.17 , 0.0001
High school graduate 0.68 0.13 , 0.0001
Some college 0.49 0.14 0.0003
Employment status
Employed –0.30 0.11 0.0068
Unemployed 0.14 0.15 0.35
Household income
, 10,000 0.97 0.21 , 0.0001
10,000–14,999 0.89 0.22 , 0.0001
15,000–19,999 0.76 0.20 0.0001
20,000–24,999 0.69 0.19 0.0003
25,000–34,999 0.67 0.19 0.0003
35,000–49,999 0.50 0.17 0.0041
50,000–74,999 0.39 0.18 0.027
Marital status
Married –0.48 0.12 , 0.0001
Divorced 0.047 0.13 0.71
Widowed –0.21 0.18 0.24
Separated –0.060 0.20 0.76
Age
18–24 2.9 0.63 , 0.0001
25–29 3.6 0.62 , 0.0001
30–34 3.5 0.62 , 0.0001
35–39 3.5 0.62 , 0.0001
40–44 3.4 0.62 , 0.0001
45–49 3.7 0.61 , 0.0001
50–54 3.4 0.61 , 0.0001
55–59 3.1 0.61 , 0.0001
60–64 2.9 0.61 , 0.0001
65–69 2.3 0.61 0.0001
70–74 1.8 0.62 0.0038
75–79 1.4 0.64 0.027
80–84 0.79 0.69 0.25
References: female, other race/ancestry, college graduate, not in labor force,household income . = $75,000, never married or unmarried couple, age 85+.doi:10.1371/journal.pone.0087144.t002
Synthetic Populations for Health Risk Assessment
PLOS ONE | www.plosone.org 6 January 2014 | Volume 9 | Issue 1 | e87144
Evaluation 2. Second, the degree of error needs to be assessed
for microdata fields that are not included in the constraints but are
potentially important for evaluating environmental health risks in
the community. While greater error would be anticipated for fields
not included as constraints, it is important to know whether the
complete multivariable microdata reasonably reflect the spatial
and demographic patterns described in the ACS. For this second
evaluation, we focused on whether the geographically resolved
microdata reasonably predict the percentage of multi-family
homes and number of rooms per home by census tract. Both of
these variables are potentially relevant for housing-related
exposures and are not simply explained by the constraint variables
(i.e., while income and home type are clearly correlated, there is
inherent spatial patterning related to zoning and proximity to
commercial areas).
Evaluation 3. Third, the synthetic microdata must be able to
characterize geographic and demographic distributions for key
stressors of interest not available in the microdata, using regression
models explaining variability as a function of the microdata. These
distributions cannot be directly validated in the same manner as in
the first two evaluations above, because the lack of geographically
and demographically refined exposure data is the precise rationale
for this modeling approach. However, some of the aggregated
estimates can be compared with surveillance data or previous
models. To conduct the third evaluation, we developed a
multivariable regression model for smoking, given that direct
smoking and resulting environmental tobacco smoke are associ-
ated with multiple health outcomes of concern to the community.
We obtained 2006–2010 Behavioral Risk Factor Surveillance
System (BRFSS) data from the Massachusetts Department of
Public Health (MA DPH), which contains smoking status and
extensive demographic data for 4,348 individuals living in New
Bedford across the five study years. We constructed a multivar-
iable logistic regression to predict smoking status as a function of
demographic variables. We considered as candidate predictors
variables that had previously been associated with smoking in the
literature and were available from ACS-derived synthetic micro-
data, including age, gender, marital status, race, ancestry,
educational attainment, household income, and employment
status. All predictors were constructed to be identical in structure
as the covariates in the synthetic microdata, and both the
regression model and microdata are at the individual level,
allowing for direct model application. While formal validation is
not possible, we predicted smoking prevalence for demographic
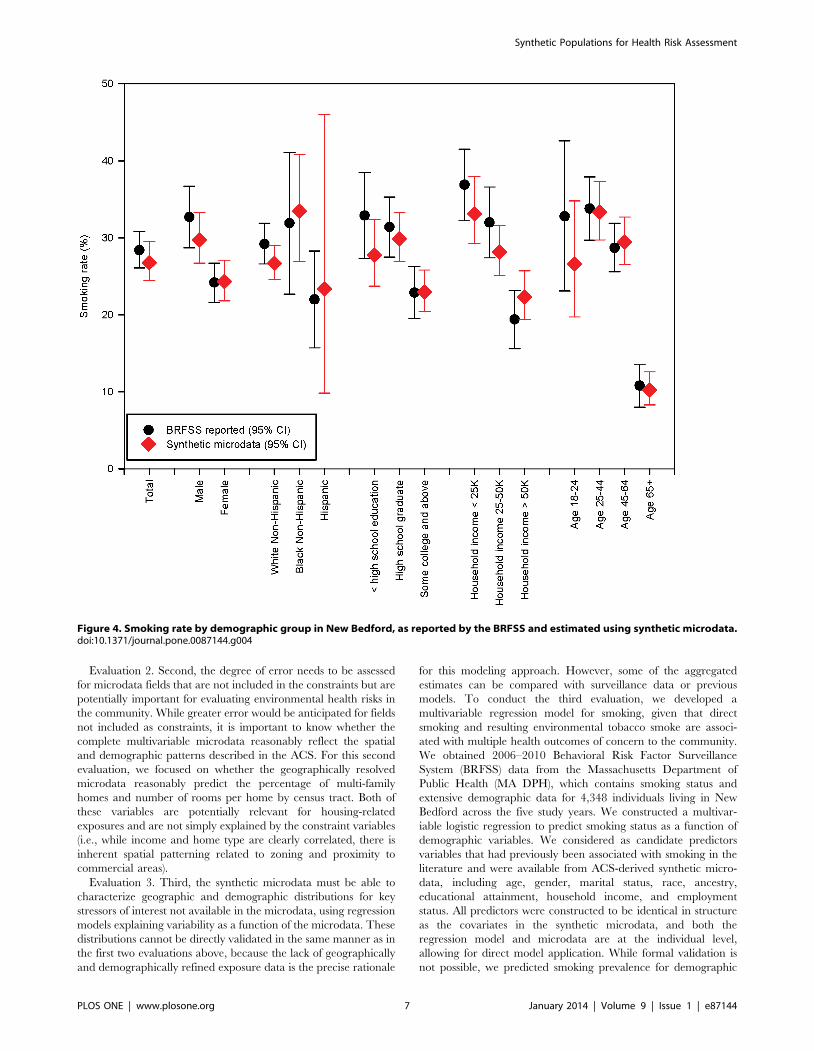
Figure 4. Smoking rate by demographic group in New Bedford, as reported by the BRFSS and estimated using synthetic microdata.doi:10.1371/journal.pone.0087144.g004
Synthetic Populations for Health Risk Assessment
PLOS ONE | www.plosone.org 7 January 2014 | Volume 9 | Issue 1 | e87144

subpopulations described in MA DPH reports [20] and compared
our estimates with reported values, noting that minor discrepan-
cies would be expected given differences in base years.
Because our simulation modeling involved multiple uncertain-
ties, we used Monte Carlo analysis to quantify these uncertainties
in the predicted geographic and demographic patterns of smoking
in New Bedford. We incorporated uncertainty at two levels. First,
we included uncertainty in the smoking regression model by
randomly sampling coefficient values given estimated means and
standard errors, using the variance-covariance matrix to account
for correlations among coefficients. This yields an uncertainty
distribution of smoking probabilities for each individual. Second,
we randomly assigned smoking status to individuals given these
probabilities, so that each individual had a binary (yes/no)
assignment in each of the 5000 realizations. This allowed us to
characterize uncertainties in estimated smoking rates for any
geographic or demographic subpopulation of interest.
Results
Evaluation 1Applying all 13 candidate constraints yielded synthetic micro-
data for New Bedford which perfectly matched all univariate
constraints at the census tract level, with a good overall fit across
all constraints (Table 1). The last three columns in Table 1 are
examples of population characteristics estimated for each census
tract, including % Portuguese, % Cape Verdean, and % age above
25 years with less than high school education.
The overall total absolute error per household was well under 1
in all census tracts, exceeding 0.3 in only one census tract. For all
seven univariate constraints as well as four multivariable
constraints (sex by age, sex by educational attainment, age by
educational attainment, and rent/own by head of household age),
the relative sum of squared Z-scores never exceeded the chi-square
critical value, with zero or near-zero values. Only the two most
complex multifactorial constraints with many categories (sex by
age by educational attainment and household income by head of
household age, with 72 and 65 categories, respectively) displayed
enough error to exceed the chi-square critical value for some of the
census tracts. Examining the fits for those tables, differences were
generally modest and reflected small population numbers in
adjacent cells along at least one dimension. When the number of
constraints was loosened (i.e., by removing two-way person-level
constraints), the degree of error increased across both error
metrics. We therefore concluded that application of all 13
constraints yielded the most accurate synthetic microdata.
Evaluation 2To determine whether the synthetic microdata appropriately
assigned individuals to census tracts, we also evaluated the
percentage of multi-family homes and average number of rooms
per home by census tract, as predicted by the synthetic microdata
and as reported in the ACS. As shown in Figure 3, the synthetic
microdata reasonably reproduced the spatial patterns of these
covariates, with a high correlation by census tract (0.96 for
percentage of multi-family homes, 0.91 for average number of
rooms per home). Some modest bias existed in the estimated
percentage of multi-family homes (69% in the ACS, 61% in our
synthetic microdata), potentially related to the inclusion of some
suburban households outside of New Bedford in the synthetic
microdata. There was no appreciable bias in the number of rooms
per home (mean of 5.3 for both datasets).
Evaluation 3To illustrate the application of the synthetic microdata, we
combined it with a multivariable regression model of smoking to
evaluate the resulting demographic and geographic patterns of
smoking for New Bedford. In our multivariable logistic regression
of smoking, all tested covariates were statistically significant (Table
2). Smoking rates were elevated among individuals who were
male, non-Hispanic, without a college education, unemployed or
out of the labor force, with lower household income, unmarried,
and working age. Age and educational attainment were the two
strongest predictors.
Applying this multivariable regression model to the synthetic
microdata, there was a wide range of predicted probabilities for
individuals, consistent with strong demographic patterning of
smoking behaviors – about 8% of the population had a mean
smoking probability above 50%, while 14% of the population had
a mean smoking probability under 10%. The smoking rates for key
demographic groups corresponded closely with reported surveil-
lance data as derived from the BRFSS (Figure 4), in spite of the
fact that the two sets of estimates are based on slightly different
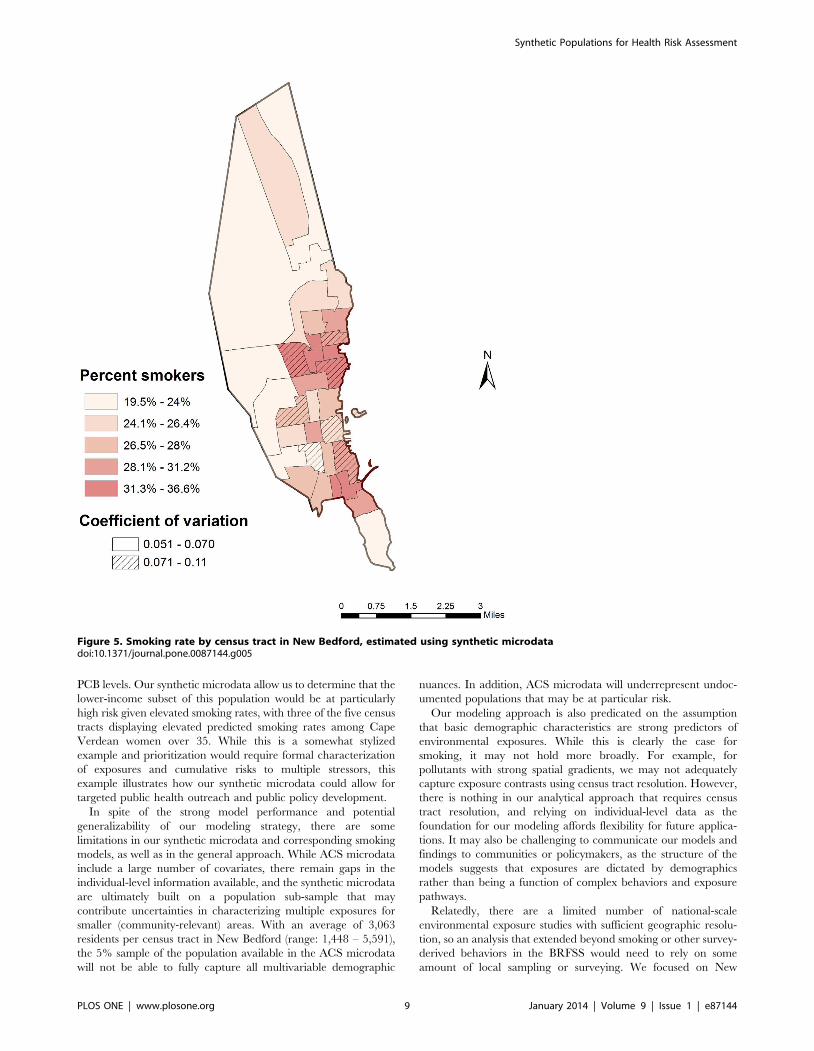
underlying data. The linkage of this regression model with the
synthetic microdata also allowed us to estimate smoking rates by
census tract in New Bedford (Figure 5). Given demographic
patterns that vary across the city, the estimated smoking rates by
census tract ranged from a low of 20% (95% CI: 17%, 22%) to a
high of 37% (95% CI: 30%, 45%).
Discussion
Using simulation methods, we constructed geographically
resolved synthetic microdata for a high-risk community and
demonstrated its utility for predicting geographic and demograph-
ic patterns of smoking. The individual-level microdata were
statistically robust, with only minor misrepresentation of complex
cross-tabulated constraints at census tract resolution. Sensitivity
analyses showed that removing those constraints led to poorer
overall model performance, indicating the value of the cross-
tabulated constraints in providing a more accurate characteriza-
tion of the individual constraint variables. We were able to connect
these microdata with a strong predictive model of smoking
behavior as a function of multivariable demographic characteris-
tics, relying on local data to ensure that demographic variables
retain their local context. For example, general population
smoking regression models [6] would have greatly misrepresented
smoking rates in New Bedford, given some of its unique
demographics (e.g., large Portuguese and Cape Verdean popula-
tions) and its status as a city with high smoking rates located in a
state with low smoking rates. Our resulting small area estimates of
smoking prevalence are consistent with modeled patterns in other
studies [13,21], with significant spatial heterogeneity based on
underlying demographic patterns.
The multivariable demographic information and corresponding
regression models predicting exposures would allow us to rapidly
identify high-risk subpopulations for specific health outcomes. As a
simple example, previously-derived multivariable regression mod-
els constructed from New Bedford data [7] showed that cord
serum PCB levels are elevated among Cape Verdean women over
35 years of age. Our geographically resolved synthetic microdata
can be used to rapidly determine that approximately 0.9% of New
Bedford’s adult population consists of Cape Verdean women over
35 (but of childbearing age), with more than half of these
individuals clustered in five census tracts. Moreover, maternal
smoking has some cardiovascular and neurodevelopmental health
effects in common with PCBs, and smoking status may also predict
Synthetic Populations for Health Risk Assessment
PLOS ONE | www.plosone.org 8 January 2014 | Volume 9 | Issue 1 | e87144
PCB levels. Our synthetic microdata allow us to determine that the
lower-income subset of this population would be at particularly
high risk given elevated smoking rates, with three of the five census
tracts displaying elevated predicted smoking rates among Cape
Verdean women over 35. While this is a somewhat stylized
example and prioritization would require formal characterization
of exposures and cumulative risks to multiple stressors, this
example illustrates how our synthetic microdata could allow for
targeted public health outreach and public policy development.
In spite of the strong model performance and potential
generalizability of our modeling strategy, there are some
limitations in our synthetic microdata and corresponding smoking
models, as well as in the general approach. While ACS microdata
include a large number of covariates, there remain gaps in the
individual-level information available, and the synthetic microdata
are ultimately built on a population sub-sample that may
contribute uncertainties in characterizing multiple exposures for
smaller (community-relevant) areas. With an average of 3,063
residents per census tract in New Bedford (range: 1,448 – 5,591),
the 5% sample of the population available in the ACS microdata
will not be able to fully capture all multivariable demographic
nuances. In addition, ACS microdata will underrepresent undoc-
umented populations that may be at particular risk.
Our modeling approach is also predicated on the assumption
that basic demographic characteristics are strong predictors of
environmental exposures. While this is clearly the case for
smoking, it may not hold more broadly. For example, for
pollutants with strong spatial gradients, we may not adequately
capture exposure contrasts using census tract resolution. However,
there is nothing in our analytical approach that requires census
tract resolution, and relying on individual-level data as the
foundation for our modeling affords flexibility for future applica-
tions. It may also be challenging to communicate our models and
findings to communities or policymakers, as the structure of the
models suggests that exposures are dictated by demographics
rather than being a function of complex behaviors and exposure
pathways.
Relatedly, there are a limited number of national-scale
environmental exposure studies with sufficient geographic resolu-
tion, so an analysis that extended beyond smoking or other survey-
derived behaviors in the BRFSS would need to rely on some
amount of local sampling or surveying. We focused on New
Figure 5. Smoking rate by census tract in New Bedford, estimated using synthetic microdatadoi:10.1371/journal.pone.0087144.g005
Synthetic Populations for Health Risk Assessment
PLOS ONE | www.plosone.org 9 January 2014 | Volume 9 | Issue 1 | e87144
Bedford in part because a long-standing pregnancy cohort study
[7,22,23,24] includes extensive biomarker data from which we can
develop predictive regression models as a function of variables
available in the synthetic microdata, but such data are not
available in all communities.
In spite of these limitations, our modeling approach offers some
significant advantages over other options. Geographically resolved
synthetic microdata provide community-scale detail that would
rarely be available for cumulative risk assessment models,
including exposure predictors and vulnerability attributes. By
building both the microdata and the smoking regression model at
the individual level, we yield robust spatial estimates and avoid
issues such as the modifiable areal unit problem. Subpopulations
at high risk across multiple exposures can be identified and
targeted for public health interventions. Our strategy would also
allow for any exposure characterization study to rapidly yield
community-scale conclusions, provided that the requisite demo-
graphic and geographic data were collected from study partici-
pants.
Conclusions
Our simulation approach provides a method to create detailed
and geographically resolved individual microdata for a low-
income population that can be used in community-wide environ-
mental exposure and risk assessment studies. We applied the
method to a regression model of smoking behavior to illustrate the
applicability of our approach. While our population characteristics
and resulting models were specific to New Bedford, all our
methods and input data generalize to any other city in the US,
providing a powerful mechanism to compare health risk factors
within and between major cities, and allowing for more targeted
public health interventions. In future studies, these microdata will
be connected with comparable regression models for multiple
environmental exposures to provide detailed characterization of
exposure patterns relevant to health outcomes of interest in New
Bedford.
Acknowledgments
We would like to thank Susan Korrick from Brigham and Women’s
Hospital and Maria Rosario, Robert French, Arlene Ayala, Jordan Pina,
and Maria Mojica from Northstar Learning Centers for their collaboration
on this research project.
Author Contributions
Conceived and designed the experiments: JIL MPF JLP. Analyzed the
data: JIL. Contributed reagents/materials/analysis tools: JIL MPF. Wrote
the paper: JIL MPF JLP.
References
1. US Environmental Protection Agency (2003) Framework for Cumulative Risk
Assessment. Washington, DC: Risk Assessment Forum. EPA/630/P-02/001F.2. Committee on Improving Risk Analysis Approaches Used by the U.S. EPA
(2008) Science and Decisions: Advancing Risk Assessment. Washington, DC:
National Academy of Sciences.3. Committee on the Health Risks of Phthalates (2008) Phthalates and Cumulative
Risk Assessment: The Task Ahead. Washington, DC: National Academy ofSciences.
4. Sexton K, Linder SH (2011) Cumulative risk assessment for combined health
effects from chemical and nonchemical stressors. Am J Public Health 101: S81–S88.
5. Mahaffey KR, Clickner RP, Jeffries RA (2009) Adult women’s blood mercuryconcentrations vary regionally in the United States: association with patterns of
fish consumption (NHANES 1999–2004). Environ Health Perspect 117: 47–53.6. Chahine T, Subramanian SV, Levy JI (2011) Sociodemographic and geographic
variability in smoking in the U.S.: a multilevel analysis of the 2006–2007
Current Population Survey, Tobacco Use Supplement. Soc Sci Med 73: 752–758.
7. Choi AL, Levy JI, Dockery DW, Ryan LM, Tolbert PE, et al. (2006) Does livingnear a Superfund site contribute to higher polychlorinated biphenyl (PCB)
exposure? Environ Health Perspect 114: 1092–1098.
8. Miranda ML, Dolinoy DC, Overstreet MA (2002) Mapping for prevention: GISmodels for directing childhood lead poisoning prevention programs. Environ
Health Perspect 110: 947–953.9. Harland K, Heppenstall A, Smith D, Birkin M (2012) Creating realistic synthetic
populations at varying spatial Scales: A comparative critique of populationsynthesis techniques. JASSS 15(1):1. Available: http://jasss.soc.surrey.ac.uk/15/
1/1.html. Accessed 8 August 2012.
10. Hermes K, Poulsen M (2012) A review of current methods to generate syntheticspatial microdata using reweighting and future directions. Comput Environ
Urban Syst 36: 281–290.11. Beckman RJ, Baggerly KA, McKay MD (1996) Creating synthetic baseline
populations. Transport Res A-Pol 30: 415–429.
12. Hanaoka K, Clarke GP (2007) Spatial microsimulation modelling for retailmarket analysis at the small-area level. Comput Environ Urban Syst 31: 162–
187.
13. Smith DM, Pearce JR, Harland K (2011) Can a deterministic spatial
microsimulation model provide reliable small-area estimates of health
behaviours? An example of smoking prevalence in New Zealand. Health &
Place 17: 618–624.
14. US Environmental Protection Agency (2009) EnviroMapper. Available: http://
www.epa.gov/enviro/html/em/. Accessed 31 May 2009.
15. Massachusetts Department of Public Health (2009) BRFSS Special Reports:
Chronic Illness for New Bedford. Boston, MA.
16. Massachusetts Department of Public Health (2009) BRFSS Special Reports:
Risk Factors and Health Behaviors for New Bedford. Boston, MA.
17. Massachusetts Department of Public Health (2009) MassCHIP Kids Count
Profile for New Bedford. Boston, MA.
18. Williamson P, Birkin M, Rees PH (1998) The estimation of population
microdata by using data from small area statistics and samples of anonymised
records. Environ Planning A 30: 785–816.
19. Williamson P (2007) CO code and documentation. Working Paper 2007/1 (v.
07.06.25) ed: Population Microdata Unit, Department of Geography, University
of Liverpool. Available at: http://pcwww.liv.ac.uk/̃william/microdata/
CO%20070615/CO_software.html. Accessed 7 August 2012.
20. Massachusetts Community Health Information Profile (2010) Smoking Report
for New Bedford. Boston, MA: Massachusetts Department of Public Health.
21. Hermes K, Poulsen M (2012) Small area estimates of smoking prevalence in
London. Testing the effect of input data. Health & Place 18: 630–638.
22. Korrick SA, Altshul LM, Tolbert PE, Burse VW, Needham LL, et al. (2000)
Measurement of PCBs, DDE, and hexachlorobenzene in cord blood from
infants born in towns adjacent to a PCB-contaminated waste site. J Expo Anal
Environ Epidemiol 10: 743–754.
23. Sagiv SK, Tolbert PE, Altshul LM, Korrick SA (2007) Organochlorine
exposures during pregnancy and infant size at birth. Epidemiology 18: 120–129.
24. Sagiv SK, Nugent JK, Brazelton TB, Choi AL, Tolbert PE, et al. (2008) Prenatal
organochlorine exposure and measures of behavior in infancy using the
Neonatal Behavioral Assessment Scale (NBAS). Environ Health Perspect 116:
666–673.
Synthetic Populations for Health Risk Assessment
PLOS ONE | www.plosone.org 10 January 2014 | Volume 9 | Issue 1 | e87144
Related Documents