ED 479 827 DOCUMENT RESUME JC 030 404 AUTHOR TITLE INSTITUTION REPORT NO PUB DATE NOTE AVAILABLE FROM PUB TYPE EDRS PRICE DESCRIPTORS IDENTIFIERS Hoachlander, Gary; Sikora, Anna C.; Horn, Laura Community College Students: Goals, Academic Preparation, and Outcomes. Postsecondary Education Descriptive Analysis Reports . National Center for Education Statistics (ED), Washington, DC.; MPR Associates, Berkeley, CA. NCES-2003-164 2003-06-00 88p.; Project Officer, C. Dennis Carroll. For full text: http://nces.ed.gov/pubs2003/2003164.pdf. Numerical/Quantitative Data (110) -- Reports - Research (143) EDRS Price MFOl/PC04 Plus Postage. *Academic Aspiration; Academic Degrees; Associate Degrees; *Community Colleges; Educational Certificates; Student Educational Objectives; Transfer Rates (College); Transfer Students; *Two Year College Students; *Two Year Colleges Beginning Postsecondary Students Long Study; National Center for Education Statistics; National Education Longitudinal Study 1988; National Postsecondary Student Aid Study ABSTRACT This document profiles the goals, preparation, and outcomes of community college students using three data sources: the 1999-2000 National Postsecondary Student Aid Study, the 1996/01 Beginning Postsecondary Students Longitudinal Study, and the National Educational Longitudinal Study of 1988, Fourth Follow-up. This study addresses the following research questions: (1) What percentage of students enrolled in community colleges seek to complete a formal credential? (2) How do different types of community college students differ in their intentions to complete a formal credential? (3) Among those intending to complete a certificate or degree or transfer to a four-year institution, what percentage actually do so, and how do rates of completion vary among different types of students? (4) Among students intending to complete a formal credential, what is the relationship between rates of completion and different levels of postsecondary preparedness? and (5) When students are asked about the impact of their postsecondary education on various aspects of their labor market participation, how do the responses of students who completed a formal credential differ from those of students who left without a certificate or degree? Appended are a glossary of terms and a section with technical notes and information on the study's methodology. (RC) ~ ~~ Reproductions supplied by EDRS are the best that can be made from the original document. J

Welcome message from author
This document is posted to help you gain knowledge. Please leave a comment to let me know what you think about it! Share it to your friends and learn new things together.
Transcript
ED 479 827
DOCUMENT RESUME
JC 030 404
AUTHOR TITLE
INSTITUTION
REPORT NO PUB DATE NOTE AVAILABLE FROM PUB TYPE EDRS PRICE DESCRIPTORS
IDENTIFIERS
Hoachlander, Gary; Sikora, Anna C.; Horn, Laura Community College Students: Goals, Academic Preparation, and Outcomes. Postsecondary Education Descriptive Analysis Reports . National Center for Education Statistics (ED), Washington, DC.; MPR Associates, Berkeley, CA. NCES-2003-164 2003-06-00 88p.; Project Officer, C. Dennis Carroll. For full text: http://nces.ed.gov/pubs2003/2003164.pdf. Numerical/Quantitative Data (110) -- Reports - Research (143) EDRS Price MFOl/PC04 Plus Postage. *Academic Aspiration; Academic Degrees; Associate Degrees; *Community Colleges; Educational Certificates; Student Educational Objectives; Transfer Rates (College); Transfer Students; *Two Year College Students; *Two Year Colleges Beginning Postsecondary Students Long Study; National Center for Education Statistics; National Education Longitudinal Study 1988; National Postsecondary Student Aid Study
ABSTRACT This document profiles the goals, preparation, and outcomes
of community college students using three data sources: the 1999-2000 National Postsecondary Student Aid Study, the 1996/01 Beginning Postsecondary Students Longitudinal Study, and the National Educational Longitudinal Study of 1988, Fourth Follow-up. This study addresses the following research questions: (1) What percentage of students enrolled in community colleges seek to complete a formal credential? (2) How do different types of community college students differ in their intentions to complete a formal credential? (3) Among those intending to complete a certificate or degree or transfer to a four-year institution, what percentage actually do so, and how do rates of completion vary among different types of students? (4) Among students intending to complete a formal credential, what is the relationship between rates of completion and different levels of postsecondary preparedness? and (5) When students are asked about the impact of their postsecondary education on various aspects of their labor market participation, how do the responses of students who completed a formal credential differ from those of students who left without a certificate or degree? Appended are a glossary of terms and a section with technical notes and information on the study's methodology. (RC)
~ ~~
Reproductions supplied by EDRS are the best that can be made from the original document. J
National Center for Education Statistics
PEDAR
U.S. Department of Education Institute of Education Sciences NCES 2003-1 64
Community College Students
Goals, Academic Preparation, and Outcomes
4 w
Postsecondary Education Descriptive Analysis Reports
.-. National Center for Education Statistics
PEDAR
US. Department of Education Institute of Education Sciences NCES 2003-1 64
Community College Students Goals, Academic Preparation, and Outcomes
PQStSeCQrIdary Education Descriptive Analysis Reports
June 2003
Gary Hoachlander Anna C. Sikora Laura Horn MPR Associates, Inc.
C. Dennis Carroll Project Officer National Center for Education Statistics
3
U.S. Department of Education Rod Paige Secretary
Institute of Education Sciences Grover J. Whitehurst Director
National Center for Education Statistics Val Plisko Associate Commissioner
The National Center for Education Statistics (NCES) is the primary federal entity for collecting, analyzing, and reporting data related to education in the United States and other nations. It fulfills a congressional mandate to collect, collate, analyze, and report full and complete statistics on the condition of education in the United States; conduct and publish reports and specialized analyses of the meaning and significance of such statistics; assist state and local education agencies in improving their statistical systems; and review and report on education activities in foreign countries.
NCES activities are designed to address high priority education data needs; provide consistent, reliable, complete, and accurate indicators of education status and trends; and report timely, useful, and high quality data to the US. Department of Education, the Congress, the states, other education policymakers, practitioners, data users, and the general public.
We strive to make our products available in a variety of formats and in language that is appropriate to a variety of audiences. You, as our customer, are the best judge of our success in communicating information effectively. If you have any comments or suggestions about this or any other NCES product or report, we?would like to hear from you. Please direct your comments to:
National Center for Education Statistics Institute of Education Sciences US. Department of Education 1990 K Street NW Washington, DC 20006-5651
June 2003
The NCES World Wide Web Home Page is: http://nces.ed.aov The NCES World Wide Web Electronic Catalog is: http://nces.ed.aov/pubsearch
Suggested Citation
US. Department of Education, National Center for Education Statistics. Community College Students: Goals, Academic Preparation, and Outcomes, NCES 2003-1 64, by Gary Hoachlander, Anna C. Sikora, and Laura Horn. Project Officer: C. Dennis Carroll. Washington, DC: 2003.
For ordering information on this report, write:
US. Department of Education ED Pubs P.O. Box 1398 Jessup, MD 20794-1 398
or call toll free 1 -877-4ED-PUBS: or order online at http://www.edDubs.org
Content Contact: Aurora D'Amico '
Aurora .D' Amico@ed .uov (202) 502-7334
Executive Summary
In 1999-2000,42 percent of all undergraduates were enrolled at public 2-year institutions, commonly known as community colleges (Horn, Peter, and Rooney 2002). The lower fees and open-access policies at community colleges have broadened access to postsecondary education for students facing such barriers to entry as poor academic performance in high school, limited English-language skills or other basic skill deficiencies, or financial hardship (Grubb 1999). Community colleges also serve students seeking additional job skills, technical certification, and enrichment opportunities. However, while access to community colleges is easily attained, research has shown that a significant number of students who enter community colleges do not complete a formal credential (Berkner, Horn, and Clune 2000).
Currently, federal performance measures, as reflected in the Higher Education Act and the Carl D. Perkins Vocational and Technical Education Act, have been primarily limited to completion of formal credentials such as certificates and associate’s degrees. However, because community colleges serve students with a wide range of goals and academic preparation (Berkner, Horn, and Clune 2000), holding community colleges accountable only for student attainment may understate their effectiveness in meeting a variety of objectives. This report provides information on the varying goals, preparation, and outcomes of community college students.
This report uses data from the 1996/01 Beginning Postsecondary Students Longitudinal
Study (BPS:96/01), the National Education Longitudinal Study of 1988 (NELS:88/2000), and the 1999-2000 National Postsecondary Student Aid Study (NPSAS:2000). Each data set provides a different perspective on the major questions of the analysis. BPS is a representative sample of all undergraduates, regardless of when they graduated from high school, who enrolled in postsecondary education for the first time in 1995-96 and were last interviewed in 2001, about 6 years later. This survey provides the latest data on degree attainment and persistence, as well as 4-year college transfer rates and outcomes. The analysis sample used in this report is limited to BPS students whose first postsecondary enrollment was in a community college.
The NELS survey comprises a grade cohort, which means all respondents are in one grade or are about the same age. NELS respondents were first surveyed in 1988 when they were in the eighth grade, and were followed through high school and college. They were last interviewed in 2000, about 8 years after most of the participants had graduated from high school. Unlike the BPS cohort, which includes first-time students regardless of age, the NELS cohort reflects a more “traditional” group of students-those who enroll in postsecondary education soon after high school graduation. In the analysis for this report, only 1992 high school graduates who first enrolled in a community college within 2 years of high school graduation are included. NELS provides several measures of high school academic preparation to determine how students’ academic performance is associated with their college outcomes.
... 111
5

Executive Summary
Finally, the NPSAS survey consists of a representative sample of all students enrolled in postsecondary education at one point in time-the 1999-2000 academic year-including students of all ages as well as students who entered postsecondary education at various points in time and who are at different stages of their studies. NPSAS is used to examine the degree objectives of first-time and continuing community college students enrolled in 1999-2000. Drawing upon these three data sets, this study addresses the following research questions:
1.
2.
3.
4.
5 .
What percentage of students enrolled in community colleges seeks to complete a formal credential, either in a public 2-year institution or through transfer to a 4-year college or university?
How do different types of community college students differ in their intentions to complete a formal credential?
Among those intending to complete a certificate or degree or transfer to a 4-year institution, what percentage actually do so, and how do rates of completion vary among different types of students?
Among students intending to complete a formal credential, what is the relationship between rates of completion and different levels of postsecondary preparedness?
When students are asked about the impact of their postsecondary education on various aspects of their labor market participation, how do the responses of students who completed a formal credential differ from those of students who left without a certificate or degree?
The findings of this study suggest that success rates for community college students, as measured by completion of a formal degree or certificate or transfer to a 4-year institution, are roughly 50 to 60 percent among students who enroll with intentions to earn a credential or transfer.
Community College Students Seeking Formal Credentials
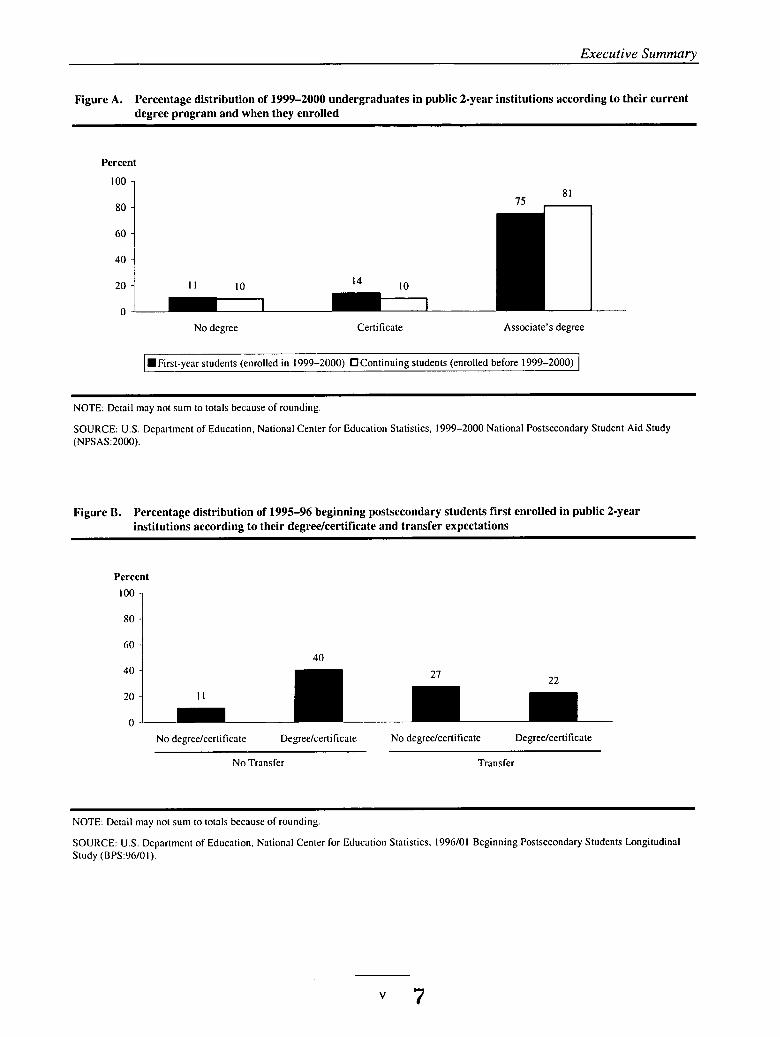
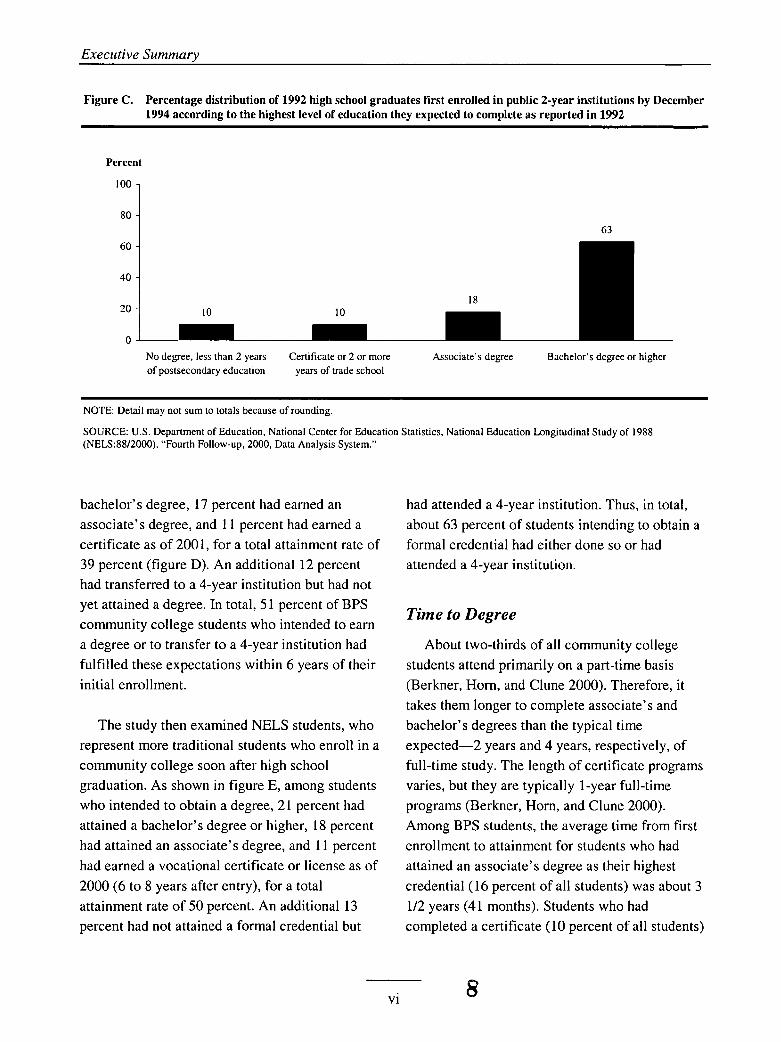
Results from all three data sets suggest that roughly 9-in-10 community college students enroll intending to obtain a formal credential or to transfer to a 4-year institution. As shown in figure A, among all NPSAS undergraduates enrolled in public 2-year institutions in 1999-2000, 11 percent of first-year students and 10 percent of continuing students reported no degree or transfer intentions. Similarly, among BPS students who first enrolled in public 2-year institutions in 1995- 1996, 11 percent reported no intentions of earning a degree or transferring to a 4-year institution (figure B). NELS 1992 high school graduates were asked what their highest degree expectations were when they were in 12th grade. Among those who first enrolled in public 2-year institutions, 10 percent reported that they were not seeking a degree and that they expected to complete less than 2 years of postsecondary education and nearly two-thirds reported that they were seeking a bachelor’s degree or higher (figure C).
Completion and Persistence Rates Among Students Seeking Formal Credentials
This study first examined the outcomes of BPS students whose first enrollment was in a community college. Among students who intended to obtain a formal credential or to transfer to a 4- year institution, 11 percent had attained a
6 iv
Executive Summary
80 -
60 -
40 -
20 -
Figure A. Percentage distribution of 1999-2000 undergraduates in public 2-year institutions according to their current degree program and when they enrolled
81 75
10 14 I I 10
Percent
100 7
No degree Certificate Associate's degree
I First-year students (enrolled in 1999-2000) OContinuing students (enrolled before 1999-2000) 1
NOTE: Detail may not sum to totals because of rounding.
SOURCE: U S . Department of Education, National Center for Education Statistics, 1999-2000 National Postsecondary Student Aid Study (NPSAS:2000).
Figure B. Percentage distribution of 1995-96 beginning postsecondary students first enrolled in public 2-year institutions according to their degredcertificate and transfer expectations
Percent
l oo 1
6o 1 40
22 21 ::I 0
No degreelcertificate Degree/certi ficate No degredcertificate Degredcertificate
No Transfer Transfer
NOTE: Detail may not sum to totals because of rounding
SOURCE: U S . Department of Education. National Center for Education Statistics. 1996/01 Beginning Postsecondary Students Longitudinal Study (BPS:96/01).
Executive Summaw
Figure C. Percentage distribution of 1992 high school graduates first enrolled in public 2-year institutions by December 1994 according to the highest level of education they expected to complete as reported in 1992
Percent
100
8o 1 63 60 -
40 -
18 10 20 -
0 No degree, less than 2 years of postsecondary education
Certificate or 2 or more years of trade school
Associate’s degree Bachelor’s degree or higher
NOTE: Detail may not sum to totals because of rounding.
SOURCE: U.S. Department of Education, National Center for Education Statistics, National Education Longitudinal Study of 1988 (NELS:88/2000). “Fourth Follow-up, 2000, Data Analysis System.”
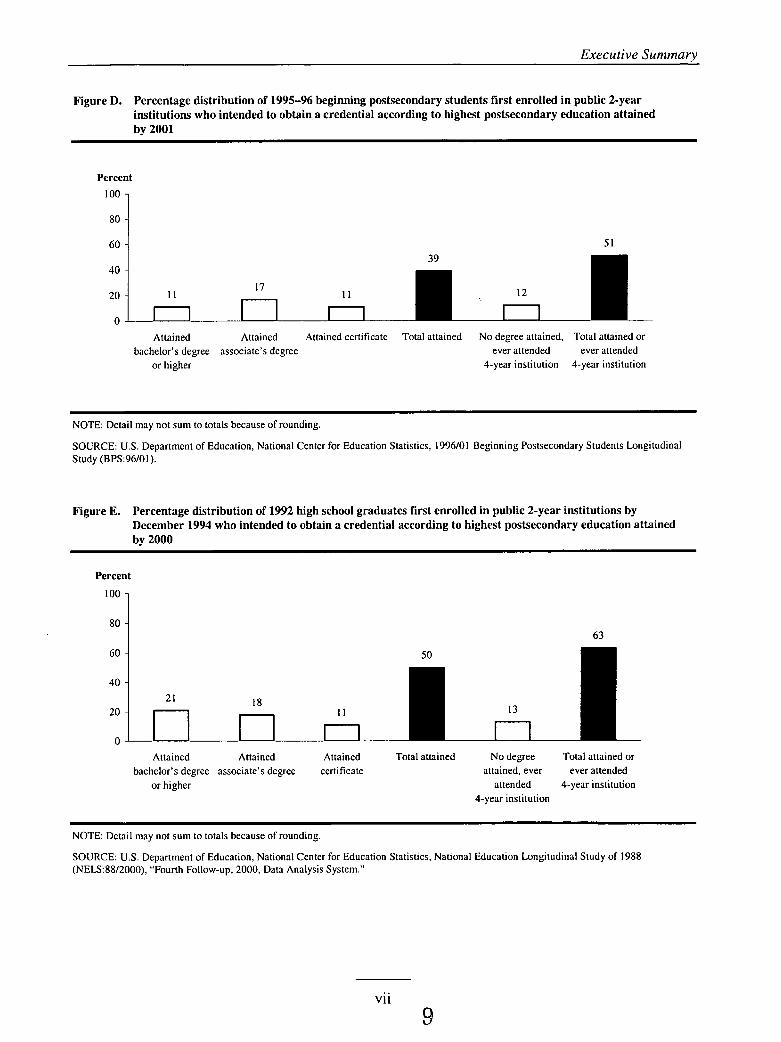
bachelor’s degree, 17 percent had earned an associate’s degree, and 11 percent had earned a certificate as of 2001, for a total attainment rate of 39 percent (figure D). An additional 12 percent had transferred to a 4-year institution but had not yet attained a degree. In total, 5 1 percent of BPS community college students who intended to earn a degree or to transfer to a 4-year institution had fulfilled these expectations within 6 years of their initial enrollment.
The study then examined NELS students, who represent more traditional students who enroll in a community college soon after high school graduation. As shown in figure E, among students who intended to obtain a degree, 21 percent had attained a bachelor’s degree or higher, 18 percent had attained an associate’s degree, and 11 percent had earned a vocational certificate or license as of 2000 (6 to 8 years after entry), for a total attainment rate of 50 percent. An additional 13 percent had not attained a formal credential but
had attended a 4-year institution. Thus, in total, about 63 percent of students intending to obtain a formal credential had either done so or had attended a 4-year institution.
Time to Degree
About two-thirds of all community college students attend primarily on a part-time basis (Berkner, Horn, and Clune 2000). Therefore, it takes them longer to complete associate’s and bachelor’s degrees than the typical time expected-2 years and 4 years, respectively, of full-time study. The length of certificate programs varies, but they are typically I-year full-time programs (Berkner, Horn, and Clune 2000). Among BPS students, the average time from first enrollment to attainment for students who had attained an associate’s degree as their highest credential (16 percent of all students) was about 3 1/2 years (41 months). Students who had completed a certificate (10 percent of all students)
A
Executive Summary
40 -
20 -
Figure D. Percentage distribution of 1995-96 beginning postsecondary students first enrolled in public 2-year institutions who intended to obtain a credential according to highest postsecondary education attained by 2001
39
11 1 1 12 11
Percent
60 -
40 -
20 -
0
100
8o 1
50
13 18 21
11
I I I
51
Attained Attained Attained certificate Total attained No degree attained, Total attained or
or higher 4-year institution 4-year institution bachelor’s degree associate’s degree ever attended ever attended
NOTE: Detail may not sum to totals because of rounding.
SOURCE: U.S. Department of Education, National Center for Education Statistics, 1996/01 Beginning Postsecondary Students Longitudinal Study (BPS:96/01).
Figure E. Percentage distribution of 1992 high school graduates first enrolled in public 2-year institutions by December 1994 who intended to obtain a credential according to highest postsecondary education attained by 2000
Percent
loo 1 1 63
Attained Attained Attained Total attained No degree Total attained or
or higher attended 4-year institution bachelor’s degree associate’s degree certificate attained, ever ever attended
4-year institution
NOTE: Detail may not sum to totals because of rounding
SOURCE: U.S. Department of Education, National Center for Education Statistics, National Education Longitudinal Study of 1988 (NELS:88/2000), “Fourth Follow-up, 2000, Data Analysis System.”
vii 9
Executive Summant
40 -
20 -
took an average of about 2 1/2 years to complete their program. Students who had completed a bachelor’s degree within the 6 years of the survey period (10 percent of all students) took nearly 5 years (56 months) to complete the degree. However, about 8 percent of BPS community college students, or roughly 44 percent of those in bachelor’s degree programs, were still enrolled in a 4-year institution and had not yet completed a degree. These students required more than 6 years to complete their bachelor’s degrees.
I 35 29 I I
0 , B , 8
Transfer Students
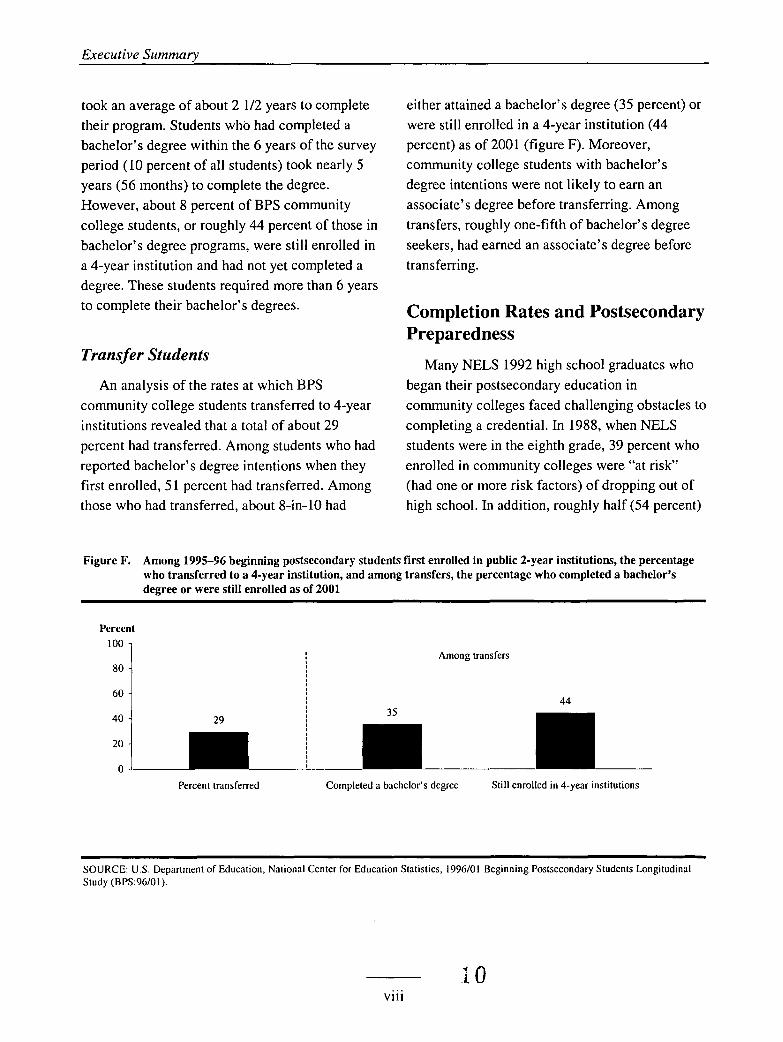
An analysis of the rates at which BPS community college students transferred to 4-year institutions revealed that a total of about 29 percent had transferred. Among students who had reported bachelor’s degree intentions when they first enrolled, 5 1 percent had transferred. Among those who had transferred, about 8-in-10 had
either attained a bachelor’s degree (35 percent) or were still enrolled in a 4-year institution (44 percent) as of 2001 (figure F). Moreover, community college students with bachelor’s degree intentions were not likely to earn an associate’s degree before transferring. Among transfers, roughly one-fifth of bachelor’s degree seekers, had earned an associate’s degree before transferring.
Completion Rates and Postsecondary Preparedness
Many NELS 1992 high school graduates who began their postsecondary education in community colleges faced challenging obstacles to completing a credential. In 1988, when NELS students were in the eighth grade, 39 percent who enrolled in community colleges were “at risk” (had one or more risk factors) of dropping out of high school. In addition, roughly half (54 percent)
Figure F. Among 1995-96 beginning postsecondary students first enrolled in public 2-year institutions, the percentage who transferred to a 4-year institution, and among transfers, the percentage who completed a bachelor’s degree or were still enrolled as of 2001
Percent 100
60
Among transfers
44
Percent transferred Completed a bachelor’s degree Still enrolled in 4-year institutions
SOURCE: U S . Department of Education, National Center for Education Statistics, 1996/01 Beginning Postsecondary Students Longitudinal Study ( B PS:96/0 1 ).
.I 0 ... V l l l
Executive Summary
entered college with one or more characteristics that placed them at risk of not completing their postsecondary education. (See appendix A for details of risk characteristics.)
Proficiency tests scores also showed that many NELS community college students began their postsecondary education with relatively low ability levels in mathematics and reading. Thirty percent of these students entered community college with 12th-grade mathematics proficiency scores at Level 1 or below. These students could perform simple arithmetical operations on whole numbers but could not perform simple operations on decimals, fractions, powers, or roots. In addition, 44 percent of NELS community college students enrolled with 12th-grade reading proficiency scores at Level 1 or below. These students had basic comprehension skills, but they could not make relatively simple inferences from reading a text beyond the author’s main point.
While many NELS 1992 high school graduates entered community college lacking strong academic preparation, about one-third (36 percent) were academically qualified to attend a 4-year institution. These are students who could possibly have enrolled in a 4-year college or university based on several measures of academic preparation, including SAT scores, rank in high school class, NELS achievement tests, and the rigor of their course taking. In addition, 17 percent and 24 percent, respectively, had scored at the highest proficiency levels tested in reading and mathematics as seniors in high school.
Taking into account students’ academic profiles, college students who were better prepared academically to enter postsecondary education tended to complete a certificate or degree or attend a 4-year institution more often than those who were less prepared. For example,
among those who scored at the highest proficiency level tested in mathematics as seniors in high school, about three-quarters had either attained a degree or certificate or had enrolled in a 4-year institution, compared with roughly half (54 percent) of those who scored at the lowest levels. Similarly, among community college students who were academically qualified for enrollment in a 4- year college, roughly three-quarters had eithcr attained a degree (including 36 percent who had attained a bachelor’s degree) or had enrolled in a 4-year institution, .compared with 55 percent of those who were either not qualified or only minimally qualified to attend a 4-year college.
Community College Completion and Employment Outcomes
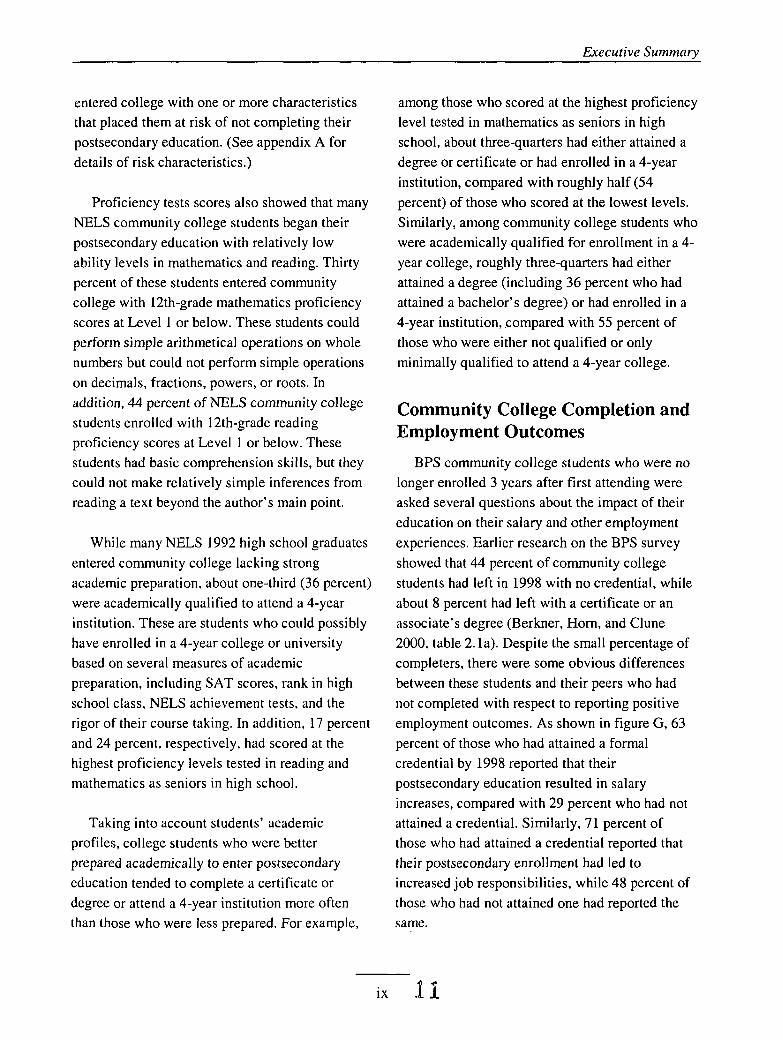
BPS community college students who were no longer enrolled 3 years after first attending were asked several questions about the impact of their education on their salary and other employment experiences. Earlier research on the BPS survey showed that 44 percent of community college students had left in 1998 with no credential, while about 8 percent had left with a certificate or an associate’s degree (Berber, Horn, and Clune 2000, table 2. la). Despite the small percentage of completers, there were some obvious differences between these students and their peers who had not completed with respect to reporting positive employment outcomes. As shown in figure G, 63 percent of those who had attained a formal credential by 1998 reported that their postsecondary education resulted in salary increases, compared with 29 percent who had not attained a credential. Similarly, 71 percent of those who had attained a credential reported that their postsecondary enrollment had led to increased job responsibilities, while 48 percent of those who had not attained one had reported the same.
ix B P
Executive Summary
Figure G. Among 1995-96 beginning postsecondary students first enrolled in public 2-year institutions and who were no longer enrolled, the percentage who reported their enrollment resulted in a salary increase or improved their job responsibilities as reported in 1998, by degree attainment
Perce 100
80
60
40
20
0
63
I 29 I
71 I
48 I
Enrollment improved salary Enrollment improved job responsibilities
I No degree 0 Attained any degree or certificate I SOURCE U.S. Department of Education, National Center for Education Statistics, 1996101 Beginning Postsecondary Students Longitudinal Study (BPS:96/01).
NELS students were also asked about their employment outcomes when they were last interviewed in 2000 (i.e., 6 to 8 years after they had begun their postsecondary education). Community college students who had earned either a certificate or an associate’s degree or had transferred to a 4-year institution were more likely to report positive employment outcomes than those who had left without a credential or had not transferred. In addition, community college students who had transferred to a 4-year institution but had not earned a degree were also more likely than those who had left without transferring to report positive outcomes.
Conclusions Although educational objectives vary among
students enrolled in community colleges, most community college students say that they desire a formal credential, either from the community college or through transfer to a 4-year institution. Nearly 90 percent of students beginning their postsecondary education in public 2-year
institutions express an intent to attain a certificate or degree (including transfer).
In both the NELS and BPS surveys, roughly one-fifth of community college students with any degree or transfer intentions had earned an associate’s degree. However, when success is defined as any degree attainment or 4-year transfer, about one-half (5 1 percent) of all community college students (BPS) and nearly two-thirds (63 percent) of more traditional students (NELS) had achieved successful outcomes.
At the same time, however, because about two- thirds of community college students attend primarily on a part-time basis, the average amount of time to complete an associate’s degree was about 3 1/2 years (as measured by BPS). Those who earned a certificate took about 2 1/2 years to complete the credential, and roughly 44 percent of bachelor’s degree seekers were still enrolled after 6 years.
12 X
Executive Summary
The study also revealed that about 29 percent of all first-time community college students transferred to a 4-year college or university during the 6-year survey period, including about one-half of those with bachelor’s degree intentions. For those who did transfer, about 8-in-10 had either attained a bachelor’s degree or were still working toward that degree 6 years after they first enrolled in a community college.
Finally, while many students who had left community college without completing a credential reported that their postsecondary education favorably affected their employment, students who had earned a credential were more likely to report positive impacts than students who had not earned one.
$ 3 xi
Foreword
This report profiles the goals, preparation, and outcomes of community college students using three data sources: the 1999-2000 National Postsecondary Student Aid Study (NPSAS:2000), the 1996/01 Beginning Postsecondary Students Longitudinal Study (BPS:96/01), and the National Education Longitudinal Study of 1988 (NELS:88/2000), Fourth Follow-up. The Data and Terminology section of this report describes these data sets in detail.
The estimates presented in the report were produced using the NCES Data Analysis System (DAS), a software application that allows users to specify and generate tables for the NPSAS, BPS, and NELS surveys. The DAS produces the design-adjusted standard errors necessary for testing the statistical significance of differences in the estimates. For more information on the DAS, consult appendix B of this report.
xii
Acknowledgments
The authors appreciate the contributions of staff members at MPR Associates, NCES and other U.S. Department of Education offices, and nongovernmental agencies to the production of this report. At MPR Associates, Inc., Susan Choy contributed substantially to the report, lending her extensive knowledge of postsecondary education and policy, as well as her experience with the complexities of the surveys that were the basis of the study. Barbara Kridl, Patti Gildersleeve, and Francesca Tussing supplied expert assistance in the production of the report. Kathryn Rooney and Rachael Berger provided considerable skilled assistance with statistical analysis and content development. Andrea Livingston and Ellen Bradburn provided helpful editorial and substantive reviews.
Outside of MPR Associates, Inc., C. Dennis Carroll at NCES oversaw the production and development of the report through all stages, providing feedback on all drafts. Paula Knepper was the NCES senior technical advisor for the report and Karen O’Conor chaired the adjudication panel. The following individuals also reviewed the final report: Lisa Hudson (NCES), Jeff Owings (NCES), Jim Palmer (Illinois State University), and Kent Phillipe (American Association of Community Colleges). The authors thank all the reviewers for their time and helpful feedback.
Table of Contents
Page
Foreword .................................................................................................................................... xii Acknowledgments ...................................................................................................................... XIII
List of Tables ............................................................................................................................. XVII
... Executive Summary .................................................................................................................. 111
... ..
List of Figures ............................................................................................................................
Introduction ...............................................................................................................................
Data and Terminology .............................................................................................................. Terminology ..........................................................................................................................
Community College Students Seeking Formal Credentials .................................................. Student Characteristics ..........................................................................................................
High School Academic Preparation and Risk ........................................................................
Completion Rates Among Community College Students Seeking Formal Credentials ..... Student Characteristics and Degree Attainment .................................................................... Completion Plus Transfer to 4-Year Institutions ..................................................................
Time to Degree ...................................................................................................................... Transfer Students ...................................................................................................................
Completion Among 1992 High School Graduates Who Enrolled in Community Colleges .......................................................................................................................................
Mu1 tivariate Analysis ............................................................................................................ Postsecondary Outcomes and Academic Preparedness .........................................................
Completion and Employment Outcomes ................................................................................ Community College Completion and Employment Outcomes: BPS .................................... Community College Completion or Transfer and Employment Outcomes: NELS ..............
Summary and Conclusions .......................................................................................................
References ..................................................................................................................................
xix
1
3 4
7 10
19
23 26 27 30 31
33 33 38
43 43 44
47
49
xv 1 6

Table of Contents
Page
Appendix A-Glossary ............................................................................................................. 5 1
Appendix B-Technical Notes and Methodology .................................................................. 63
17 xvi
List of Tables
Table Page
1
2
3
4
5
6
7a
7b
8
Percentage distribution of 1995-96 beginning postsecondary students first enrolled in public 2-year institutions according to their degree expectations, by various student characteristics ..................................................................................................................
Percentage distribution of 1999-2000 undergraduates who were enrolled in public 2-year institutions according to their current degree program and when they enrolled, by gender and age ............................................................................................................
Percentage distribution of 1995-96 beginning postsecondary students first enrolled in public 2-year institutions according to their main purpose for enrolling, by various student characteristics .....................................................................................................
Percentage distribution of 1995-96 beginning postsecondary students first enrolled in public 2-year institutions according to their transfer or degree expectation, by various student characteristics .....................................................................................................
Percentage distribution of 1995-96 beginning postsecondary students first enrolled in public 2-year institutions according to their first degree program, by various student c harac teri s ti cs ..................................................................................................................
Percentage distribution (by columns) of 1992 high school graduates first enrolled in public 2-year institutions by December 1994, by various measures of academic performance and risk of attrition .....................................................................................
Percentage distribution of 1995-96 beginning postsecondary students first enrolled in public 2-year institutions according to highest degree attained through 2001, by various student characteristics.. .......................................................................................
Percentage distribution of 1995-96 beginning postsecondary students first enrolled in public 2-year institutions according to attainment or enrollment in a 4-year institution through 2001, by various student characteristics ............................................................
Percentage of 1995-96 beginning postsecondary students first enrolled in public 2- year institutions who transferred to a 4-year institution, and among transfers, degree attainment and persistence as of 2001 .............................................................................
11
12
13
15
16
20
24
28
30
xvii 18
9a
9b
10
11
12
Percentage distribution of 1992 high school graduates first enrolled in public 2-year institutions by December 1994 according to highest attainment as of 2000, by various student characteristics ..................................................................................................... 34
Percentage distribution of 1992 high school graduates first enrolled in public 2-year institutions by December 1994 according to attainment or attendance at 4-year institutions as of 2000, by various student characteristics .............................................. 36
Among 1992 high school graduates who first enrolled in a community college by December 1994 and who had intentions to earn a formal credential, percentage who had attained a degree or attended a 4-year college by 2000, and least squares coefficients and standard errors, by various student charactenstics ................................ 40
Among 1995-96 beginning postsecondary students first enrolled in public 2-year institutions, and who were employed and not enrolled in 1998, percentage who reported that their enrollment improved their employment outcomes, by degree attainment ........................................................................................................................ 43
Percentage of 1992 high school graduates first enrolled in public 2-year institutions by December 1994 according to whether postsecondary education led to various employment improvements, by attainment as of 2000 .................................................... 44
Appendix
B 1 Variables used in this report with weighted response rates less than 85 percent for the analysis sample (first-time community college students enrolled by 1994) .................... 66
B2 Standard errors for table 2: Percentage distribution of 1999-2000 undergraduates who were enrolled in public 2-year institutions according to their current degree program and when they enrolled, by gender and age .................................................................... 67
1 9 xviii
List of Figures
Figure
Executive Summary
Page
A
B
C
D
E
F
G
Text
1
Percentage distribution of 1999-2000 undergraduates in public 2-year institutions according to their current degree program and when they enrolled ................................ v
Percentage distribution of 1995-96 beginning postsecondary students first enrolled in public 2-year institutions according to their degreekertificate and transfer expectations ..................................................................................................................... v
Percentage distribution of 1992 high school graduates first enrolled in public 2-year institutions by December 1994 according to the highest level of education they expected to complete as reported in 1992 ....................................................................... vi
Percentage distribution of 1995-96 beginning postsecondary students first enrolled in public 2-year institutions who intended to obtain a credential according to highest postsecondary education attained by 2001 ...................................................................... vii
Percentage distribution of 1992 high school graduates first enrolled in public 2-year institutions by December 1994 who intended to obtain a credential according to highest postsecondary education attained by 2000 .......................................................... vii
Among 1995-96 beginning postsecondary students first enrolled in public 2-year institutions, the percentage who transferred to a 4-year institution, and among transfers, the percentage who completed a bachelor’s degree or were still enrolled as of 2001 ............................................................................................................................. V l l l
...
Among 1995-96 beginning postsecondary students first enrolled in public 2-year institutions and who were no longer enrolled, the percentage who reported their enrollment resulted in a salary increase or improved their job responsibilities as reported in 1998, by degree attainment ........................................................................... x
Percentage distribution of 1999-2000 undergraduates in public 2-year institutions according to their current degree program and when they enrolled ................................ 7
xix 20
List of Figures
Figure Page
Percentage distribution of 1995-96 beginning postsecondary students first enrolled in public 2-year institutions according to their specific degree expectations and reported primary purpose for enrolling .......................................................................................... 8
Percentage distribution of 1995-96 beginning postsecondary students first enrolled in public 2-year institutions according to their degree expectations from that college and purpose for enrolling ....................................................................................................... 9
Percentage distribution of 1995-96 beginning postsecondary students first enrolled in public 2-year institutions according to their degreekertificate and transfer expectations ..................................................................................................................... 9
Percentage distribution of 1992 high school graduates first enrolled in public 2-year institutions by December 1994 according to the highest level of education they expected to complete as reported in 1992 ....................................................................... 10
Among 1995-96 beginning postsecondary students who first enrolled in a community college and attained a degree or certificate by 2001, the average number of months enrolled and the average elapsed months since first enrollment for the highest degree attained ............................................................................................................................ 3 1
xx 2 1
Introduction
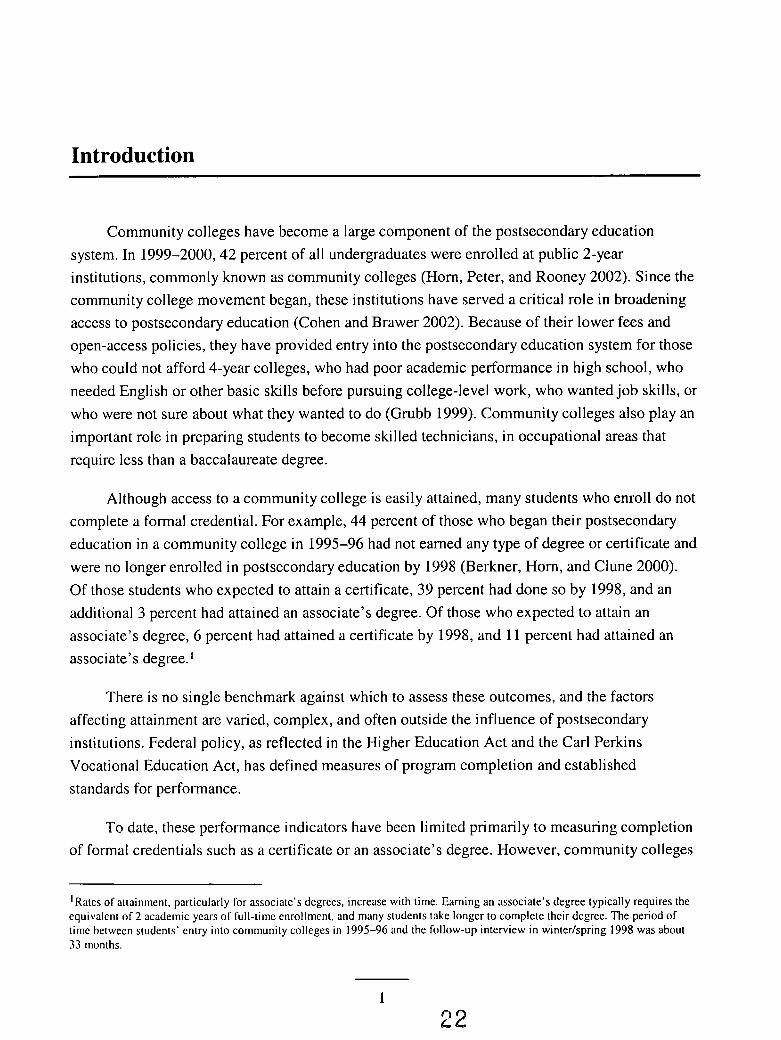
Community colleges have become a large component of the postsecondary education system. In 1999-2000,42 percent of all undergraduates were enrolled at public 2-year institutions, commonly known as community colleges (Horn, Peter, and Rooney 2002). Since the community college movement began, these institutions have served a critical role in broadening access to postsecondary education (Cohen and Brawer 2002). Because of their lower fees and open-access policies, they have provided entry into the postsecondary education system for those who could not afford 4-year colleges, who had poor academic performance in high school, who needed English or other basic skills before pursuing college-level work, who wanted job skills, or who were not sure about what they wanted to do (Grubb 1999). Community colleges also play an important role in preparing students to become skilled technicians, in occupational areas that require less than a baccalaureate degree.
Although access to a community college is easily attained, many students who enroll do not complete a formal credential. For example, 44 percent of those who began their postsecondary education in a community college in 1995-96 had not earned any type of degree or certificate and were no longer enrolled in postsecondary education by 1998 (Berkner, Horn, and Clune 2000). Of those students who expected to attain a certificate, 39 percent had done so by 1998, and an additional 3 percent had attained an associate’s degree. Of those who expected to attain an associate’s degree, 6 percent had attained a certificate by 1998, and 11 percent had attained an associate’s degree.’
There is no single benchmark against which to assess these outcomes, and the factors affecting attainment are varied, complex, and often outside the influence of postsecondary institutions. Federal policy, as reflected in the Higher Education Act and the Carl Perkins Vocational Education Act, has defined measures of program completion and established standards for performance.
To date, these performance indicators have been limited primarily to measuring completion of formal credentials such as a certificate or an associate’s degree. However, community colleges
IRates of attainment, particularly for associate’s degrees, increase with time. Earning an associate’s degree typically requires the equivalent of 2 academic years of full-timc enrollment, and many students take longer to complete their degree. The period of time betwecn students’ entry into community colleges in 1995-96 and the follow-up interview in wintedspring 1998 was about 33 months.
1
22
Introduction
serve students with a wide range of goals, and for some students, attaining a formal credential is not their primary reason for enrolling (Phillipe and Patton 1999). While some students seek an associate’s degree or wish to transfer to a 4-year institution, others are looking for job skills so they can enter the workforce, change jobs, or advance in their careers. Still others seek basic skills such as English language proficiency or personal enrichment opportunities. Thus some community college students attain their personal goals without completing a certificate or degree program.
In addition, some students come prepared for college-level work, but many do not. For example, of 1992 high school graduates beginning their postsecondary education in community colleges by December 1994,64 percent were not qualified or were only minimally qualified to do 4-year college-level work.2 Additionally, 54 percent of these students enrolled with one or more risk factors associated with lower rates of postsecondary persistence and attainment.3
This report uses several data sets to profile community college students and describe their persistence and attainment. The analysis focuses on the following questions:
1. What percentage of students enrolling in community colleges seek to complete a formal credential, either in public 2-year institutions or through transfer to a 4-year college or university?
2. How do different types of community college students vary in their intentions to complete a formal credential?
3. Among those intending to complete a certificate or degree or transfer to a 4-year institution, what percentage actually do so, and how do rates of completion vary among different types of students?
4. Among students intending to complete a formal credential, what is the relationship between rates of completion and different levels of postsecondary preparedness?
5. When students are asked about the impact of their postsecondary education on their labor market participation, how do the responses of students who completed a formal credential differ from those who left without a certificate or degree?
Wherever possible, the analysis takes into account differences in student objectives. While it examines student outcomes mainly with respect to students’ completion of formal credentials- certificates and degrees, along with transfer to 4-year institutions-the analysis concentrates on those students who say that these objectives are their primary reason for enrolling.
2See table 6. 31bid.
2 2 3
Data and Terminology
This report analyzes data from three sources: the 1996/01 Beginning Postsecondary Students Longitudinal Study (BPS:96/01); the National Education Longitudinal Study of 1988 (NELS:88/2000), “Fourth Follow-up, 2000”; and the 1999-2000 National Postsecondary Student Aid Study (NPSAS:2000). Each data set provides a different perspective on the major questions of the analysis. BPS consists of a sample of all undergraduates, regardless of when they graduated from high school, who enrolled in postsecondary education for the first time in 1995- 96 and were last interviewed in 2001, about 6 years later. This survey provides the latest data on degree attainment and persistence 6 years after the students first enrolled as well as their 4-year college transfer rates and the outcomes of these transfers. The sample used in this report was restricted to BPS students whose first enrollment in postsecondary education was in a community college.
NELS tracks a grade cohort over time, meaning the respondents are all in the same grade and about the same age. NELS respondents were first surveyed in 1988 when they were in the eighth grade and then followed through high school and college. They were last interviewed in 2000 about 8 years after most participants graduated from high school. The sample used in this report was restricted to 1992 high school graduates whose first enrollment in postsecondary education was in a community college within 2 years after graduating from high school. Unlike the BPS cohort, which includes first-time students regardless of their age, the NELS cohort reflects a more “traditional” group of students-those who enroll in postsecondary education soon after high school graduation. NELS provides several measures of high school academic performance to determine how students’ academic preparation is associated with their college outcomes.
Finally, NPSAS consists of a sample of all students who were enrolled in postsecondary education during the 1999-2000 academic year. NPSAS includes not only students of all ages but also those who entered postsecondary education at different points in time and who are at different stages of their studies. The data from NPSAS are used to determine the degree goals of community college students who first enrolled in 1999-2000 as well as those of continuing students.
Data and Terminolonv
Terminology
This report examines relationships among students’ objectives for enrolling in community colleges and how well they realized these objectives. In doing so, the study examines the programs of study students pursue, the reasons they give for enrolling, the degree program in which they actually enroll, and the outcomes associated with their enrollment.
Student Objectives
Identifying student objectives is not straightforward. For one thing, students’ responses depend on how a question is asked. When students who first enrolled in a 2-year institution in 1995-96 were asked about the degree they expected to obtain from attending that institution, 16 percent responded “none,” 11 percent said they expected to obtain a certificate, 49 percent anticipated an associate’s degree, and 25 percent intended to transfer to a 4-year institution to pursue a bachelor’s degree.4 However, when asked a different question about their purpose for enrolling, 23 percent said they wanted to acquire “job skills,” 21 percent wanted to obtain a certificate or associate’s degree, 37 percent intended to transfer to a 4-year institution, and 16 percent responded “personal enrichment.”5 Some of these choices are not mutually exclusive, and in fact, 78 percent of those responding “job skills” said they expected to obtain a certificate or associate’s degree or intended to transfer to a 4-year institution when they were asked the separate question about degree expectations.6
Additionally, students were asked both questions during the initial interview shortly after enrolling. Students’ purpose and expectations can change as they learn more about college offerings and experience first hand the content of particular programs of study. For these and other reasons, comparing what students accomplish years later with what they initially indicated was their intent for enrolling may not precisely reflect whether students realize their postsecondary objectives.
Programs of Study
Another approach to gauging student outcomes compares a student’s decision to enroll in a particular program of study with what that student subsequently accomplishes. For example, it may be reasonable to expect that students enrolling in “certificate” programs complete the program by earning a certificate, but it may not be appropriate to expect them to earn an
4 ~ e e figure 2. %ee table 3. 6See figure 3.
4 2 5
Data and Terminology
associate’s degree. However, “program of study” is to some extent an administrative category that does not necessarily have a clear meaning for all students. Consequently, it is an imperfect indicator of student intent .
Student Outcomes
Defining and measuring student outcomes are also problematic. The most common indicator of whether or not students enrolled in community colleges complete a coherent program of study is the award of a formal credential-a certificate or an associate’s degree. Additionally, transfer to a 4-year institution to pursue a bachelor’s degree is also considered a measure of “success” at a 2-year institution. This analysis focuses on whether OJ not students earn a formal credential, certificate, or associate’s degree or transfer to a 4-year institution. While the requirements for earning an associate’s degree are fairly standard across programs of study and institutions-typically requiring 2 years of full-time enrollment-requirements for completing a certificate can vary from a few hours to as much as 2 years of full-time study, with 1 year of full- time study the norm (Berkner, Horn, and Clune 2000). Additionally, programs in fields with formal licensing requirements-such as nursing, real estate, cosmetology, and many of the building trades-are more likely than other programs to offer formal certificates when students complete the program of study.
Not all students enroll in community colleges intending to obtain a credential or transfer. Some enroll to take a specific course or two, to upgrade job skills, or perhaps to satisfy personal enrichment objectives. Some may simply be exploring whether they want to pursue postsecondary education. For these students, completion measured by the award of a formal credential or transfer is not an appropriate indicator of whether they have met their objectives.
5 2 6
Community College Students Seeking Formal Credentials
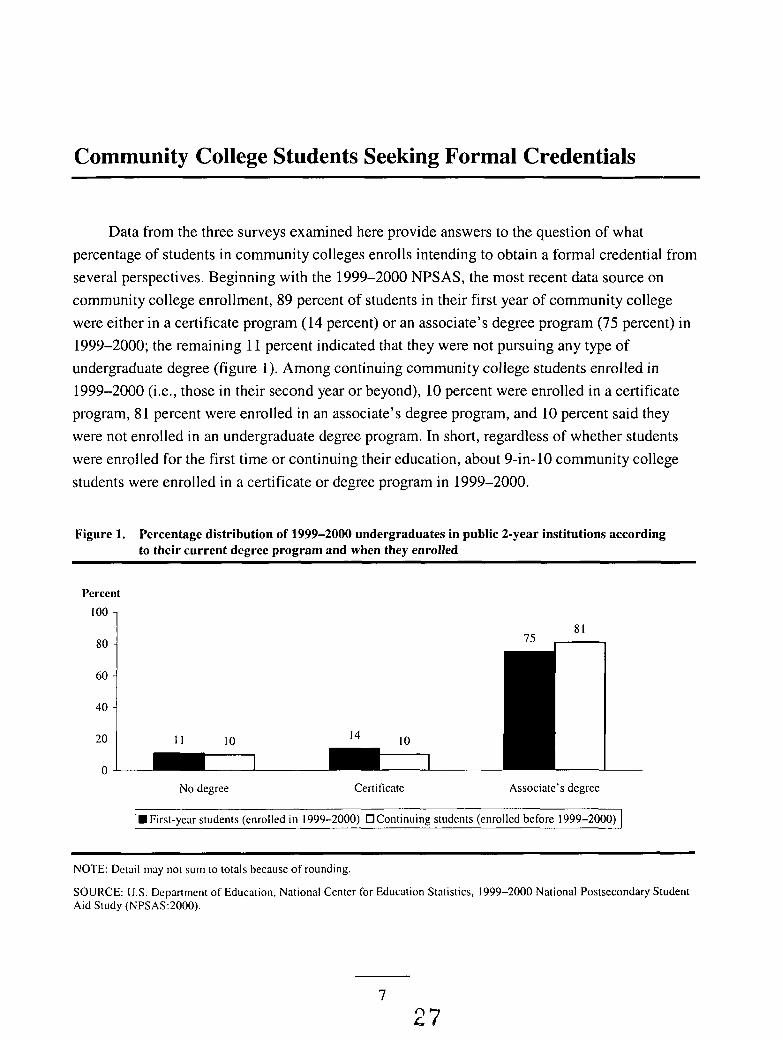
Data from the three surveys examined here provide answers to the question of what percentage of students in community colleges enrolls intending to obtain a formal credential from several perspectives. Beginning with the 1999-2000 NPSAS, the most recent data source on community college enrollment, 89 percent of students in their first year of community college were either in a certificate program (14 percent) or an associate’s degree program (75 percent) in 1999-2000; the remaining 11 percent indicated that they were not pursuing any type of undergraduate degree (figure 1). Among continuing community college students enrolled in 1999-2000 (i.e., those in their second year or beyond), 10 percent were enrolled in a certificate program, 81 percent were enrolled in an associate’s degree program, and 10 percent said they were not enrolled in an undergraduate degree program. In short, regardless of whether students were enrolled for the first time or continuing their education, about 9-in-10 community college students were enrolled in a certificate or degree program in 1999-2000.
Figure 1. Percentage distribution of 1999-2000 undergraduates in public 2-year institutions according to their current degree program and when they enrolled
Percent 100 1
81 75
40
10 14 20 I I 10
0 No degree Certificate Associate’s degree
I First-vear students (enrolled in 1999-2000) OContinuing students (enrolled before 1999-2000) I
~~
NOTE: Detail may not sum to totals because of rounding.
SOURCE: U.S. Department of Education, National Center for Education Statistics, 1999-2000 National Postsecondary Student Aid Study (NPSAS:2000).
7
2 7
Community College Students Seeking Formal Credentials
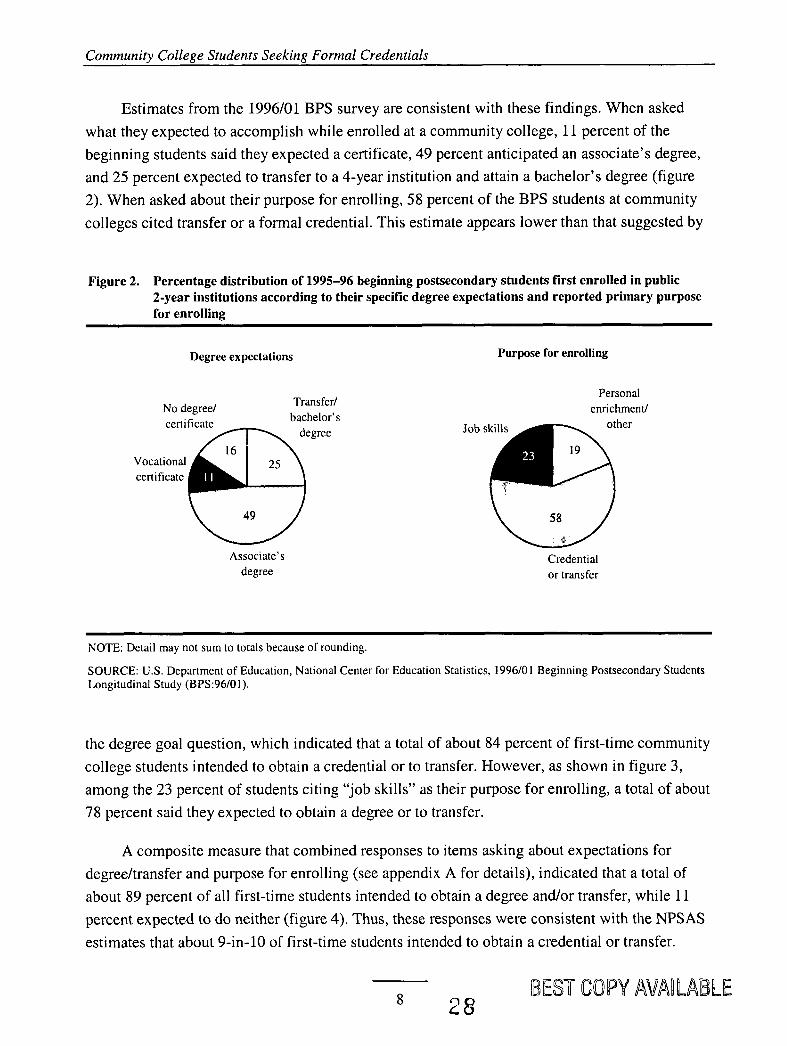
Estimates from the 1996/01 BPS survey are consistent with these findings. When asked what they expected to accomplish while enrolled at a community college, 11 percent of the beginning students said they expected a certificate, 49 percent anticipated an associate’s degree, and 25 percent expected to transfer to a 4-year institution and attain a bachelor’s degree (figure 2). When asked about their purpose for enrolling, 58 percent of the BPS students at community colleges cited transfer or a formal credential. This estimate appears lower than that suggested by
Figure 2. Percentage distribution of 1995-96 beginning postsecondary students first enrolled in public 2-year institutions according to their specific degree expectations and reported primary purpose for enrolling
Degree expectations
Transfer/ bachelor’s
degree
No degree/ certificate
V o c a t i o n a I n certificate
Associate’s degree
Purpose for enrolling
Personal enrichment/
Credential or transfer
NOTE: Detail may not sum to totals because of rounding.
SOURCE: U.S. Department of Education, National Center for Education Statistics, 1996/01 Beginning Postsecondary Students Longitudinal Study (BPS:96/01).
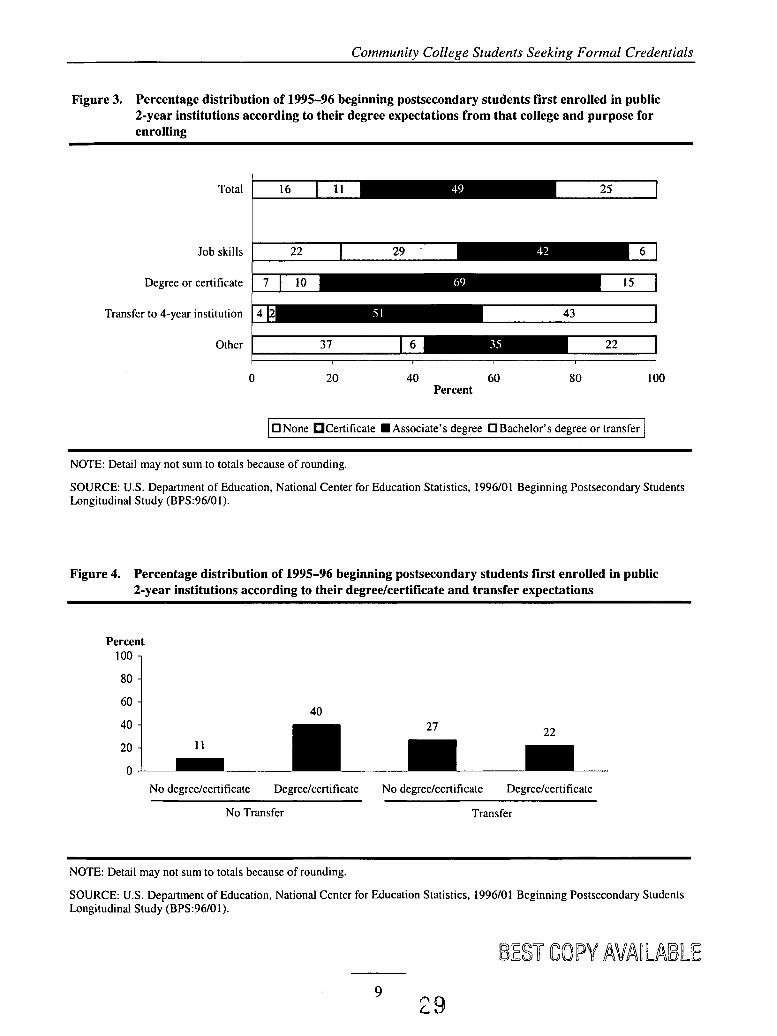
the degree goal question, which indicated that a total of about 84 percent of first-time community college students intended to obtain a credential or to transfer. However, as shown in figure 3, among the 23 percent of students citing “job skills” as their purpose for enrolling, a total of about 78 percent said they expected to obtain a degree or to transfer.
A composite measure that combined responses to items asking about expectations for degreehransfer and purpose for enrolling (see appendix A for details), indicated that a total of about 89 percent of all first-time students intended to obtain a degree andor transfer, while 11 percent expected to do neither (figure 4). Thus, these responses were consistent with the NPSAS estimates that about 9-in-10 of first-time students intended to obtain a credential or transfer.
Community College Students Seeking Formal Credentials
Figure 3. Percentage distribution of 1995-96 beginning postsecondary students first enrolled in public 2-year institutions according to their degree expectations from that college and purpose for enrolling
Total
Job skills
Degree or certificate
Transfer to 4-year institution
Other
0 20 40 60 80 100 Percent
I 0 None Certificate =Associate’s degree 0 Bachelor’s degree or transfer 1
NOTE: Detail may not sum to totals because of rounding.
SOURCE: U S . Department of Education, National Center for Education Statistics, 1996/01 Beginning Postsecondary Students Longitudinal Study (BPS:96/01).
Figure 4. Percentage distribution of 1995-96 beginning postsecondary students first enrolled in public 2-year institutions according to their degreekertificate and transfer expectations
Percent 100
6o i 40
22 40 - 27
No degreekertificate Degreekertificate No degreekertificate Degreeicertificate
No Transfer Transfer
NOTE: Detail may not sum to totals because of rounding.
SOURCE: U.S. Department of Education, National Center for Education Statistics, 1996/01 Beginning Postsecondary Students Longitudinal Study (BPS:96/01).
9 29

Community College Students Seekinn Formal Credentials
60 -
40 -
20 -
Data from the NELS cohort indicated that among those who had first enrolled in a community college by 1994, about 10 percent reported that they had no intentions of obtaining a formal credential (figure 5). Specifically, as seniors in high school, these NELS community college students said that they would attend less than 2 years of college or a trade school without necessarily earning a formal credential. Nearly two-thirds (63 percent) expected to earn a bachelor’s degree or higher.
18 10 10
0 3
In summary, in all three surveys, about 9-in-10 students attending community colleges reported that they intended to earn a formal credential or to transfer to a 4-year institution so that they could pursue a bachelor’s degree. It would appear, therefore, that for most students who first enroll in community colleges, completion as measured by award of a formal credential or by transfer to a 4-year institution is a relevant consideration.
Student Characteristics
Community colleges serve a diverse group of students with different objectives, as well as different capacities for realizing those aims. This section of the report primarily examines the BPS data on first-time community college students to identify the different types of students seelung credentials-in particular, students of different ages and with different risk profiles.
Figure 5. Percentage distribution of 1992 high school graduates first enrolled in public 2-year institutions by December 1994 according to the highest level of education they expected to complete as reported in 1992
Percent
100
63
No degree, less than 2 years of postsecondary education
Certificate or 2 or more years of trade school
Associate’s degree Bachelor’s degree or higher
NOTE: Detail may not sum to totals because of rounding.
SOURCE: U.S. Department of Education, National Center for Education Statistics, National Education Longitudinal Study of I988 (NELS:88/2000), “Fourth Follow-up, 2000, Data Analysis System.”
10 30
Communiw Collene Students Seekinn Formal Credentials
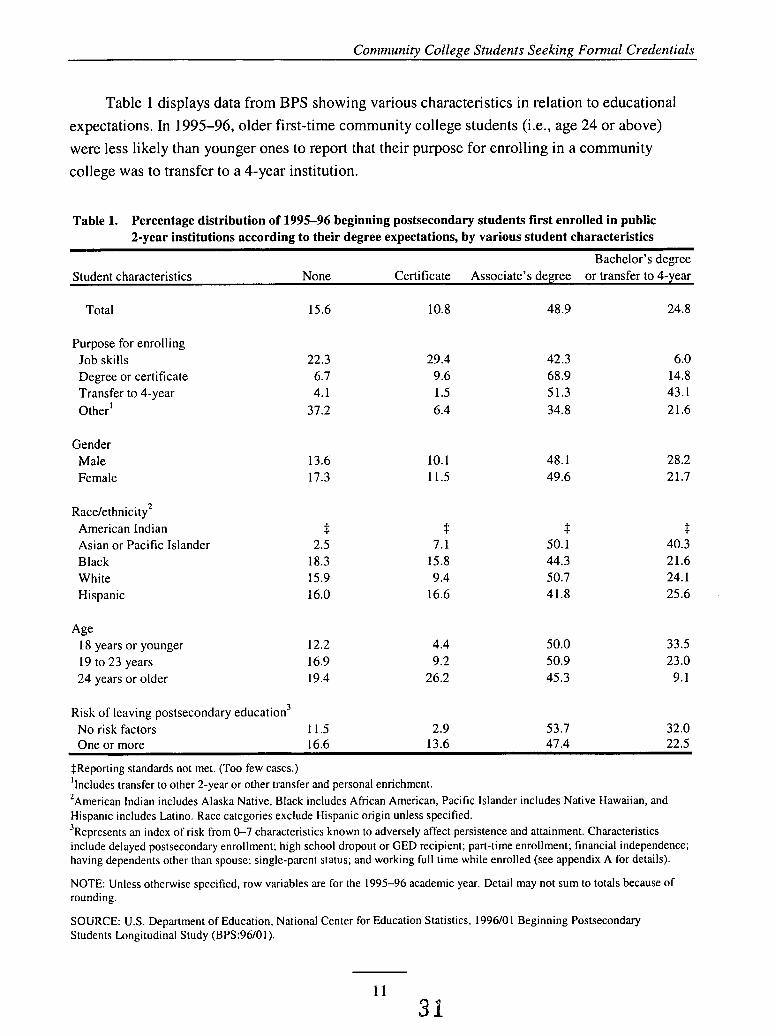
Table 1 displays data from BPS showing various characteristics in relation to educational expectations. In 1995-96, older first-time community college students (i.e., age 24 or above) were less likely than younger ones to report that their purpose for enrolling in a community college was to transfer to a 4-year institution.
Table 1. Percentage distribution of 1995-96 beginning postsecondary students first enrolled in public 2-year institutions according to their degree expectations, by various student characteristics
Bachelor's degree Student characteristics None Certificate Associate's degree or transfer to 4-year
Total 15.6 10.8 48.9 24.8
Purpose for enrolling Job skills Degree or certificate Transfer to 4-year Other'
Gender Male Female
Race/ethnicity2 American Indian Asian or Pacific Islander Black White Hispanic
Age 18 years or younger 19 to 23 years 24 years or older
22.3 6.7 4.1
37.2
29.4 42.3 6.0 9.6 68.9 14.8 1.5 51.3 43.1 6.4 34.8 21.6
13.6 10.1 48.1 28.2 17.3 11.5 49.6 21.7
$ 2.5
18.3 15.9 16.0
12.2 16.9 19.4
$ 7.1
15.8 9.4
16.6
4.4 9.2
26.2
4 $ 50.1 40.3 44.3 21.6 50.7 24.1 41.8 25.6
50.0 33.5 50.9 23.0 45.3 9.1
Risk of leaving postsecondary education3 No risk factors 11.5 2.9 53.7 32.0 One or more 16.6 13.6 47.4 22.5
+Reporting standards not met. (Too few cases.) 'Includes transfer to other 2-year or other transfer and personal enrichment. 'American Indian includes Alaska Native, Black includes African American, Pacific Islander includes Native Hawaiian, and Hispanic includes Latino. Race categories exclude Hispanic origin unless specified. 'Represents an index of risk from 0-7 characteristics known to adversely affect persistence and attainment. Characteristics include delayed postsecondary enrollment; high school dropout or GED recipient; part-time enrollment; financial independence; having dependents other than spouse; single-parent status; and working full time while enrolled (see appendix A for details).
NOTE: Unless otherwise specified, row variables are for the 1995-96 academic year. Detail may not sum to totals because of rounding.
SOURCE: U.S. Department of Education, National Center for Education Statistics, 1996101 Beginning Postsecondary Students Longitudinal Study (BPS:96/01).
1 1
Community College Students Seeking Formal Credentials
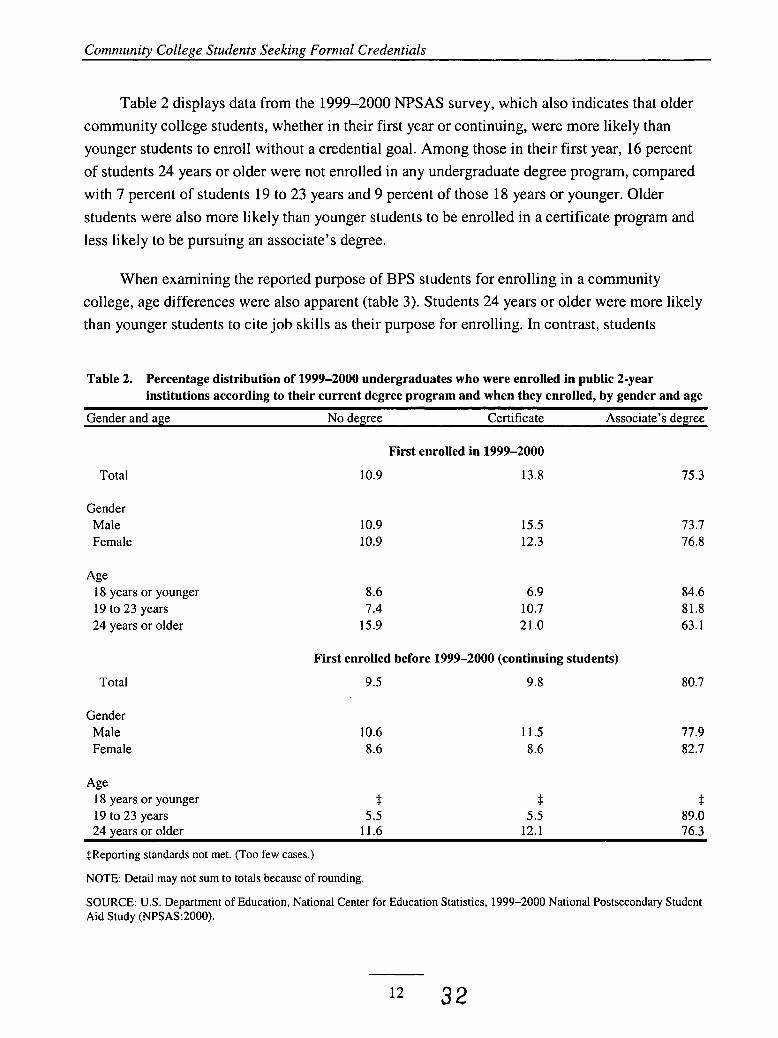
Table 2 displays data from the 1999-2000 NPSAS survey, which also indicates that older community college students, whether in their first year or continuing, were more likely than younger students to enroll without a credential goal. Among those in their first year, 16 percent of students 24 years or older were not enrolled in any undergraduate degree program, compared with 7 percent of students 19 to 23 years and 9 percent of those 18 years or younger. Older students were also more likely than younger students to be enrolled in a certificate program and less likely to be pursuing an associate’s degree.
When examining the reported purpose of BPS students for enrolling in a community college, age differences were also apparent (table 3). Students 24 years or older were more likely than younger students to cite job skills as their purpose for enrolling. In contrast, students
Table 2. Percentage distribution of 1999-2000 undergraduates who were enrolled in public 2-year institutions according to their current degree program and when they enrolled, by gender and age
Gender and age ~~
No degree ~~ ~~~
Certificate Associate’s degree-
Total
Gender Male Female
Age 18 years or younger 19 to 23 years 24 years or older
Total
Gender Male Female
Age 18 years or younger 19 to 23 years 24 Years or older
First enrolled in 1999-2000
10.9 13.8
10.9 10.9
8.6 7.4
15.9
15.5 12.3
6.9 10.7 21.0
75.3
73.7 76.8
84.6 81.8 63.1
First enrolled before 1999-2000 (continuing students)
9.5 9.8 80.7
10.6 8.6
3 5.5
11.6
11.5 8.6
3 5.5
12.1
77.9 82.7
t. 89.0 76.3
$Reporting standards not met. (Too few cases.)
NOTE: Detail may not sum to totals because of rounding.
SOURCE: U.S. Department of Education, National Center for Education Statistics, 1999-2000 National Postsecondary Student Aid Study (NPSAS:2000).
l2 32
Communitv College Students Seekinn Formal Credentials
Table 3. Percentage distribution of 1995-96 beginning postsecondary students first enrolled in public 2-year institutions according to their main purpose for enrolling, by various student characteristics
Transfer Degree or to 4-year Other Personal
Student characteristics Job skills certificate institution transfer enrichment
Total 22.9 20.9 37.2 3.1 15.9
Degree expected at first institution None 33.7 9.2 10.3 13.9 33.0 Any credential or transfer 20.9 22.9 42.2 1.2 12.8 Certificate 64.2 19.1 5.2 0.5 11.1 Associate's degree 19.4 28.9 38.5 1.1 12.1 Transfer to 4-year institution 5.5 12.6 65.3 1.8 14.9
Transfer or degree expectation at first institution No transfer, no degreekertificate 49.4 # # # 50.7 No transfer, degreekertificate 40.5 44.3 # # 15.2 Transfer, no degreekertificate 6.4 # 69.0 9.5 15.2 Transfer, degreekertificate 1.5 16.6 76.5 2.5 3.0
Gender Male Female
Race/ethnicity ' American Indian Asian or Pacific Islander Black White Hispanic
Age 18 years or younger 19 to 23 years 24 years or older
.20.8 16.2 42.1 3.9 17.0 24.8 25.2 32.7 2.5 14.9
t t t t t 11.5 22.6 60.7 # 5.2 29.0 22.3 27.5 1.6 19.6 23.0 20.0 37.3 3.0 16.7 19.9 24.8 38.0 7.2 10.1
13.7 17.8 50.3 4.4 13.8 18.7 23.8 37.5 3.4 16.6 45.2 22.8 12.2 0.4 19.5
Risk of leaving postsecondary education' No risk factors 10.5 15.9 55.3 3.9 14.4 One or more 26.4 22.4 31.8 3.0 16.4
#Rounds to zero. $Reporting standards not met. (Too few cases.) 'American Indian includes Alaska Native, Black includes African American, Pacific Islander includes Native Hawaiian, and Hispanic includes Latino. Race categories exclude Hispanic origin unless specified. 'Represents an index of risk from 0-7 characteristics known to adversely affect persistence and attainment. Characteristics include delayed postsecondary enrollment; high school dropout or GED recipient; part-time enrollment; financial independence; having dependents other than spouse; single-parent status; and working full time while enrolled (see appendix A for details).
NOTE: Unless otherwise specified, row variables are for the 1995-96 academic year. Detail may not sum to totals because of rounding.
SOURCE: U.S. Department of Education, National Center for Education Statistics, 1996/01 Beginning Postsecondary Students Longitudinal Study (BPS:96/01).
3 3 13
Community College Students Seeking Formal Credentials
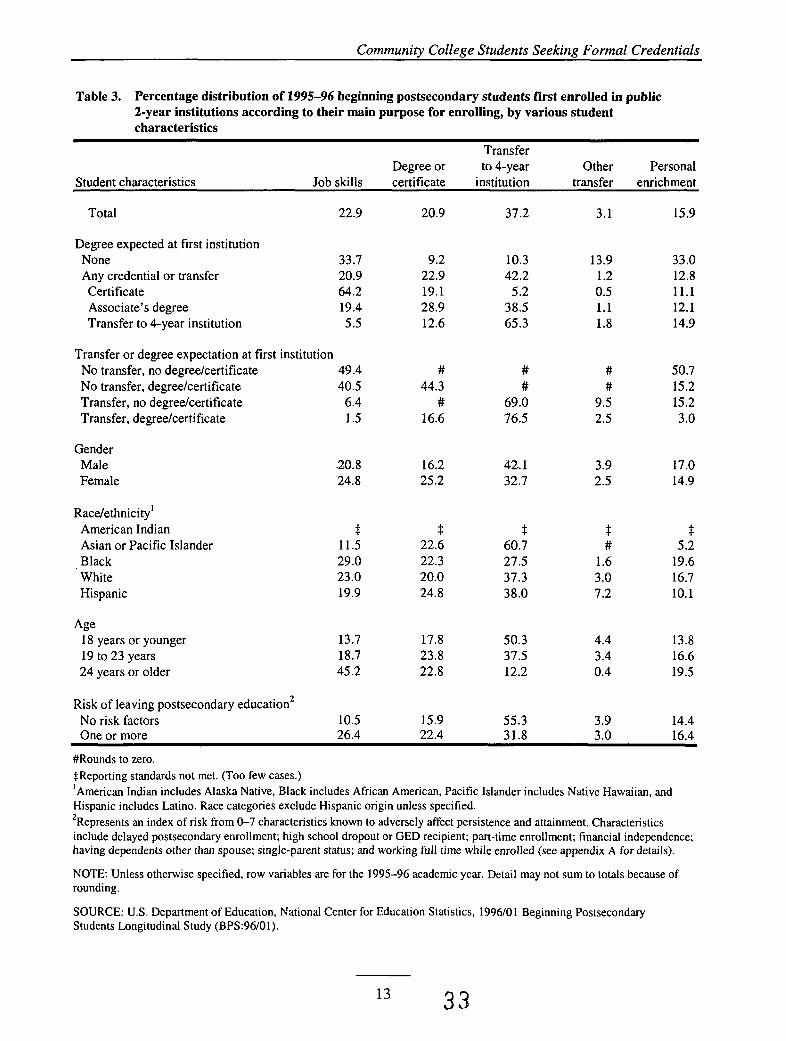
24 years or older were less likely than students 18 or younger to report transfer to a 4-year institution as their purpose for enrolling (12 percent vs. 50 percent).
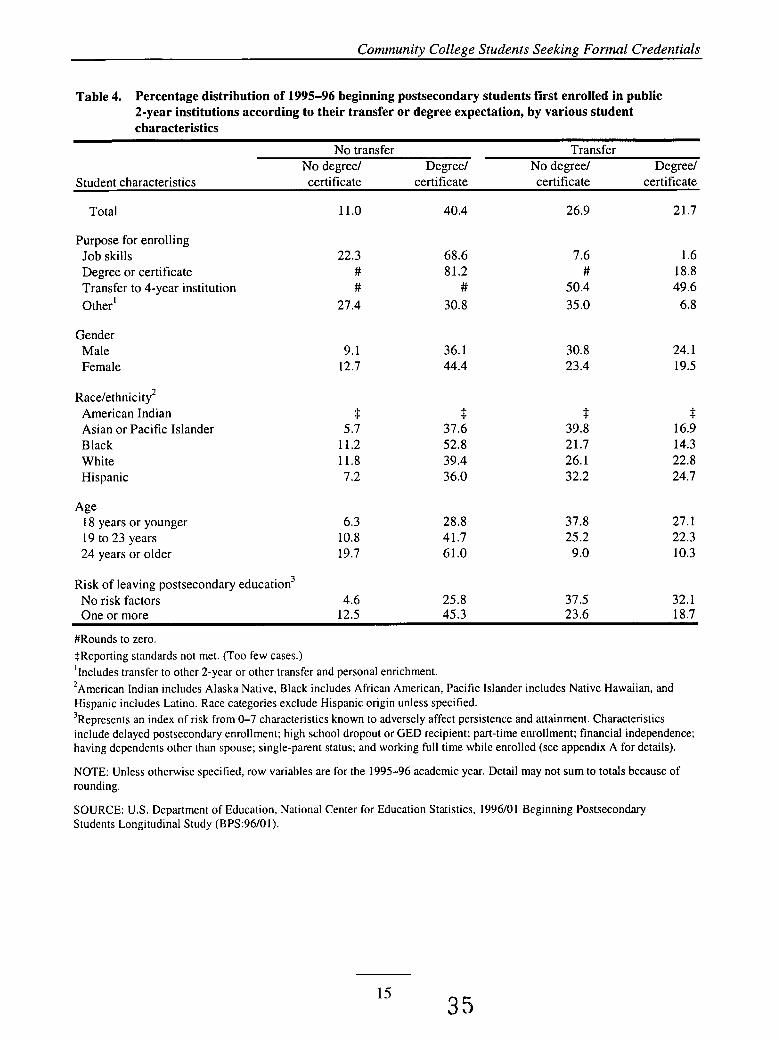
An analysis of differences by gender and racelethnicity among the BPS students revealed that women were more likely than men to report intentions of obtaining a degree or certificate (25 percent vs. 16 percent), while men were more likely to report that they intended to transfer to a 4-year institution (42 percent vs. 33 percent) (table 3). Asian students were more likely than both White and Black students to report intentions of transferring to a 4-year institution (61 percent vs. 37 and 28 percent, respectively).7 Table 4, which combines degree and transfer expectations, indicates that Black students were more likely than White students to report intentions of earning a credential at the community college without transferring (53 percent vs. 39 percent).
Among BPS students with one or more characteristics known to place them at risk of not completing their postsecondary education,* 26 percent said they enrolled in a community college to obtain job skills, compared with 11 percent of students with no risk factors (table 3). A lower percentage of students with one or more risk factors reported that their purpose for enrolling was to transfer to a 4-year institution than their counterparts with no risk factors (32 percent vs. 55 percent). Similarly, in table 4, it is evident that students at risk were more likely to report intentions of earning a credential without transferring (45 percent vs. 26 percent), while students with no risk factors were more likely to report intentions of transferring and earning a credential (32 percent vs. 19 percent).
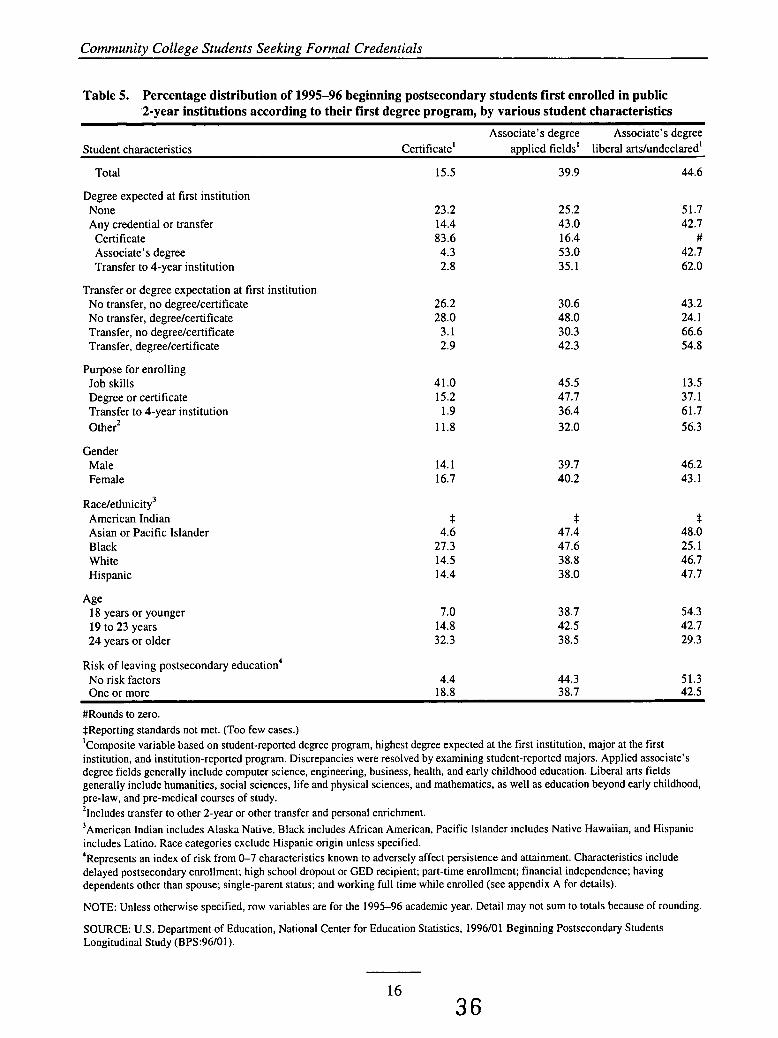
Looking at the actual degree program in which BPS students were enrolled when they first began community college, age differences were also observed (table 5). Older students were less likely than younger students to be enrolled in liberal arts or undeclared programs but were more likely to be enrolled in certificate programs. Students at risk were also more likely than those with no risk factors to be enrolled in certificate programs (19 percent vs. 4 percent).
In summary, the analysis revealed important differences in the characteristics of students with various postsecondary objectives and patterns of enrollment in programs of study. In general, older students are less likely to be expecting a formal credential and are more likely to be seeking job skills. Older students are also more likely to opt for certificate programs than their
7For ease of presentation, raciaVethnic group categories discussed in the text are abbreviated. Any reference to Black includes African American, Asian includes Pacific Islander and Native Hawaiian, and Hispanic includes Latino. Race categories exclude Hispanic origin unless specified. %e risk index consists of seven factors: delayed postsecondary enrollment; high school dropout or GED recipient; part-time enrollment; financial independence; having dependents other than a spouse; single-parent status; and working full time while enrolled.
14 34
Community College Students Seeking Formal Credentials
Table 4. Percentage distribution of 1995-96 beginning postsecondary students first enrolled in public 2-year institutions according to their transfer or degree expectation, by various student characteristics
No transfer Transfer No degree/ Degree/ No degree/ Degree/
Student characteristics certificate certificate certificate certificate
Total 11.0 40.4 26.9 21.7
Purpose for enrolling Job skills Degree or certificate Transfer to 4-year institution Other'
Gender Male Female
Race/ethnicity* American Indian Asian or Pacific Islander Black White Hispanic
Age 18 years or younger 19 to 23 years 24 years or older
22.3 68.6 # 81.2 # #
27.4 30.8
7.6 1.6 # 18.8
50.4 49.6 35.0 6.8
9.1 36.1 30.8 24.1 12.7 44.4 23.4 19.5
$ $ 5.7 37.6
11.2 52.8 11.8 39.4 7.2 36.0
$ $ 39.8 16.9 21.7 14.3 26.1 22.8 32.2 24.7
6.3 28.8 37.8 27.1 10.8 41.7 25.2 22.3 19.7 61.0 9.0 10.3
Risk of leaving postsecondary education3 No risk factors 4.6 25.8 37.5 32.1 One or more 12.5 45.3 23.6 18.7
#Rounds to zero. $Reporting standards not met. (Too few cases.) 'Includes transfer to other 2-year or other transfer and personal enrichment. 'American Indian includes Alaska Native, Black includes African American, Pacific Islander includes Native Hawaiian, and Hispanic includes Latino. Race categories exclude Hispanic origin unless specified. 'Represents an index of risk from 0-7 characteristics known to adversely affect persistence and attainment. Characteristics include delayed postsecondary enrollment; high school dropout or GED recipient; part-time enrollment; financial independence; having dependents other than spouse; single-parent status; and working full time while enrolled (see appendix A for details).
NOTE: Unless otherwise specified, row variables are for the 1995-96 academic year. Detail may not sum to totals because of rounding.
SOURCE: US. Department of Education, National Center for Education Statistics, 1996/01 Beginning Postsecondary Students Longitudinal Study (BPS:96/01).
Community College Students Seeking Formal Credentials
Table 5. Percentage distribution of 1995-96 beginning postsecondary students first enrolled in public '2-year institutions according to their first degree program, by various student characteristics
Associate's degree Associate's degree Student characteristics Certificate' applied fields' liberal artshndeclared'
Total 15.5 39.9 44.6
Degree expected at first institution None Any credential or transfer Certificate Associate's degree Transfer to 4-year institution
Transfer or degree expectation at first institution No transfer, no degreekertificate No transfer, degreekertificate Transfer, no degreelcertificate Transfer, degreelcertificate
Purpose for enrolling Job skills Degree or certificate Transfer to 4-year institution Other'
Gender Male Female
Racdethnicity3 American Indian Asian or Pacific Islander Black White Hispanic
18 years or younger 19 to 23 years 24 years or older
Age
23.2 14.4 83.6 4.3 2.8
26.2 28.0 3.1 2.9
41.0 15.2 1.9
11.8
14.1 16.7
* 4.6
27.3 14.5 14.4
7.0 14.8 32.3
25.2 51.7 43.0 42.7 16.4 # 53.0 42.7 35.1 62.0
30.6 48.0 30.3 42.3
45.5 47.7 36.4 32.0
39.7 40.2
* 47.4 47.6 38.8 38.0
38.7 42.5 38.5
43.2 24.1 66.6 54.8
13.5 37.1 61.7 56.3
46.2 43.1
* 48.0 25.1 46.7 47.7
54.3 42.7 29.3
Risk of leaving postsecondary education4 No risk factors 4.4 44.3 51.3 One or more 18.8 38.7 42.5
#Rounds to zero. $Reporting standards not met. (Too few cases.) 'Composite variable based on student-reported degree program, highest degree expected at the first institution, major at the first institution, and institution-reported program. Discrepancies were resolved by examining student-reported majors. Applied associate's degree fields generally include computer science, engineering, business, health, and early childhood education. Liberal arts fields generally include humanities, social sciences, life and physical sciences, and mathematics, as well as education beyond early childhood, pre-law, and pre-medical courses of study. *Includes transfer to other 2-year or other transfer and personal enrichment. 'American Indian includes Alaska Native, Black includes African American, Pacific Islander includes Native Hawaiian, and Hispanic includes Latino. Race categories exclude Hispanic origin unless specified. 4Represents an index of risk from 0-7 characteristics known to adversely affect persistence and attainment. Characteristics include delayed postsecondary enrollment; high school dropout or GED recipient; part-time enrollment; financial independence; having dependents other than spouse; single-parent status; and working full time while enrolled (see appendix A for details).
NOTE: Unless otherwise specified, row variables are for the 1995-96 academic year. Detail may not sum to totals because of rounding.
SOURCE: U S . Department of Education, National Center for Education Statistics, 1996/01 Beginning Postsecondary Students Longitudinal Study (BPS:96/01).
16 36
Community College Students Seeking Formal Credentials
younger peers. Students with one or more risk factors associated with not completing postsecondary education are also more likely than those with no risk factors to enroll to obtain job skills, or to earn a vocational certificate. Correspondingly, students at risk are also less likely than those with no risk factors to opt for transfer to a 4-year institution.
Nevertheless, these are differences of degree, not kind, and none of these characteristics appear to be a good substitute for student objective or program of study. Consequently, efforts to assess student outcomes with respect to postsecondary objectives are better measured by student intent directly rather than by using demographic or risk characteristics as proxies for student purpose.
17
3 7
High School Academic Preparation and Risk
Whether or not students succeed in postsecondary education is influenced, in part, by how well prepared they are to pursue postsecondary coursework. This section of the report addresses how prepared high school graduates who enroll in a community college are to undertake college- level coursework. Are they at risk of not completing their postsecondary education before they begin? The NELS survey of 1992 high school graduates provides a number of indicators of students’ academic readiness as well as indicators of risk associated with postsecondary attrition. Measures of academic preparation used in this analysis include students’ 12th-grade proficiency test levels in mathematics9 and readinglo and whether they completed the minimum basic curriculum as advocated in A Nation at Risk (National Commission on Excellence in Education 1983). This coursework includes 4 years of English, 3 years of social studies, and 2 years each of mathematics and science. Additionally, students who were academically qualified to attend a 4- year college were also identified.” The analysis also used risk profiles of students to determine whether students were at risk of dropping out of high school,l2 or for those enrolled in college, if they were at risk of not completing their postsecondary education.13
Many of the NELS students who began their postsecondary education in community colleges faced many challenges to completing a credential (table 6) . Thirty percent of these students enrolled with 12th-grade mathematics proficiency scores at Level 1 or below. These students could perform simple arithmetical operations on whole numbers but could not perform simple operations on decimals, fractions, powers, or roots. In addition, 44 percent of the NELS students enrolled with 12th-grade reading proficiency scores at Level 1 or below. Although these
9Five levels of proficiency were determined based on the mathematics test administered in 1992 (Rock, Pollack, and Quinn 1995). See appendix A under entry for “F22XMPRO.” ‘OThree levels of reading proficiency were determined based on the NELS reading test administered in 1992 (Rock, Pollack, and Quinn 1995). See appendix A under entry for “F22XRPRO.” I’The college qualification variable was based on research by Berkner and Chavez (1997) who created the 4-year college qualification index based on several measures including GPA, high school class rank, SATIACT scores, NELS test scores, and the rigor of courses taken in high school (see appendix A for details). I2These factors were determined in eighth grade and include living in a single-parent family, having a parent with no high school diploma, being a student with limited English proficiency, having a family income of less than $15,000, having a sibling who dropped out of high school, and being home alone more than 3 hours a day. 13Characteristics include delaying enrollment between high school graduation and postsecondary enrollment, attending part time, completing high school by certificate or GED, working full time when first enrolled, having children, and becoming a single parent before or during enrollment. Unlike the BPS survey, there is no risk factor for being financially independent because this risk factor primarily applies to adult students 24 or older.
l9 38
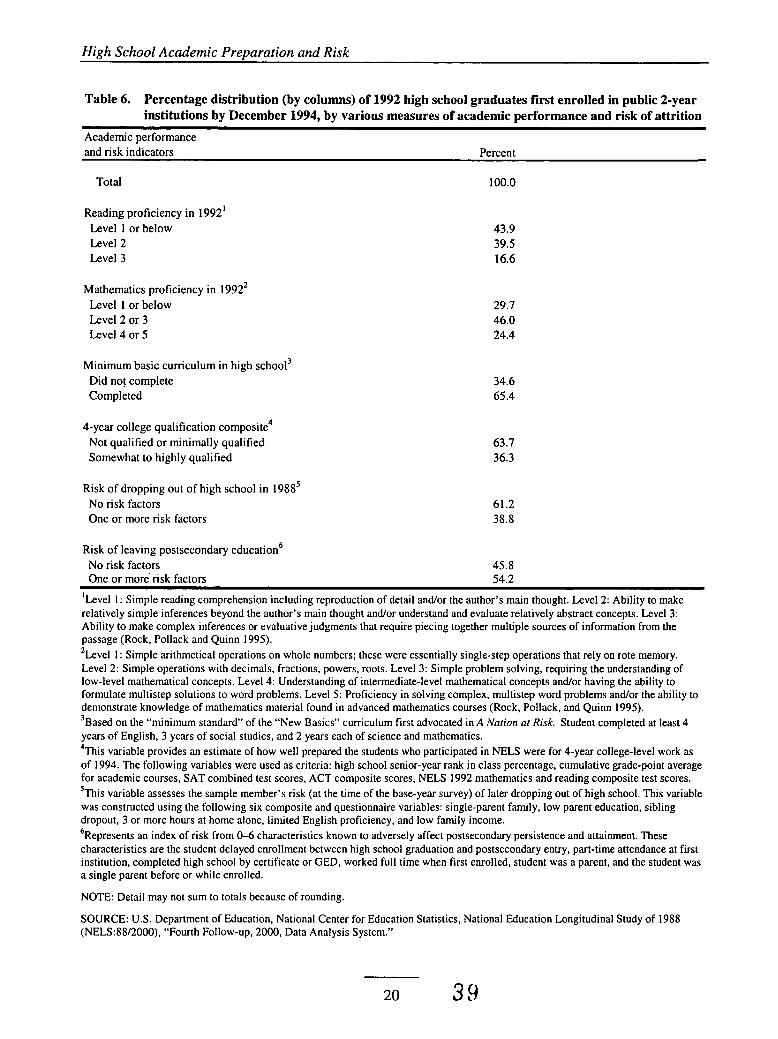
High School Academic Preparation and Risk
Table 6. Percentage distribution (by columns) of 1992 high school graduates first enrolled in public 2-year institutions by December 1994, by various measures of academic performance and risk of attrition
Academic performance and risk indicators Percent
Total 100.0
Reading proficiency in 1992’ Level 1 or below Level 2 Level 3
Mathematics proficiency in 1992’ Level 1 or below Level 2 or 3 Level 4 or 5
Minimum basic curriculum in high school3 Did not complete Completed
4-year college qualification composite4 Not qualified or minimally qualified Somewhat to highly qualified
Risk of dropping out of high school in 1988’ No risk factors One or more risk factors
Risk of leaving postsecondary education6 No risk factors One or more risk factors
43.9 39.5 16.6
29.7 46.0 24.4
34.6 65.4
63.7 36.3
61.2 38.8
45.8 54.2
‘Level 1: Simple reading comprehension including reproduction of detail and/or the author’s main thought. Level 2: Ability to make relatively simple inferences beyond the author’s main thought and/or understand and evaluate relatively abstract concepts. Level 3: Ability to make complex inferences or evaluative judgments that require piecing together multiple sources of information from the passage (Rock, Pollack and Quinn 1995). 2Level I : Simple arithmetical operations on whole numbers; these were essentially single-step operations that rely on rote memory. Level 2: Simple operations with decimals, fractions, powers, roots. Level 3: Simple problem solving, requiring the understanding of low-level mathematical concepts. Level 4: Understanding of intermediate-level mathematical concepts and/or having the ability to formulate multistep solutions to word problems. Level 5 : Proficiency in solving complex, multistep word problems and/or the ability to demonstrate knowledge of mathematics material found in advanced mathematics courses (Rock, Pollack, and Quinn 1995). ’Based on the “minimum standard” of the “New Basics” curriculum first advocated in A Nnfion nf Risk. Student completed at least 4 years of English, 3 years of social studies, and 2 years each of science and mathematics. ‘This variable provides an estimate of how well prepared the students who participated in NELS were for 4-year college-level work as of 1994. The following variables were used as criteria: high school senior-year rank in class percentage, cumulative grade-point average for academic courses, SAT combined test scores, ACT composite scores, NELS 1992 mathematics and reading composite test scores. ’This variable assesses the sample member’s risk (at the time of the base-year survey) of later dropping out of high school. This variable was constructed using the following six composite and questionnaire variables: single-parent family, low parent education, sibling dropout, 3 or more hours at home alone, limited English proficiency, and low family income. 6Represents an index of risk from 0-6 characteristics known to adversely affect postsecondary persistence and attainment. These characteristics are the student delayed enrollment between high school graduation and postsecondary entry, part-time attendance at first institution, completed high school by certificate or GED, worked full time when first enrolled, student was a parent, and the student was a single parent before or while enrolled.
NOTE: Detail may not sum to totals because of rounding.
SOURCE: U.S. Department of Education, National Center for Education Statistics, National Education Longitudinal Study of 1988 (NELS:88/2000), “Fourth Follow-up, 2000, Data Analysis System.”
20 3 9
High School Academic Preparation and Risk
students had basic reading comprehension skills, they could not make relatively simple inferences beyond the author’s main point.
In 1988, when the NEU 1992 high school graduates were in the eighth grade, 39 percent of those who were enrolled in community colleges had been at risk for dropping out of high school. In addition, 54 percent of these NELS students entered community college with one or more characteristics that placed them at risk of not completing their postsecondary education.14
While many of the NELS high school graduates who enrolled in a community college lacked the academic preparation needed to undertake college-level courses, 36 percent were academically qualified to attend a 4-year institution. Similarly, 17 percent and 24 percent, respectively, had scored at the highest proficiency levels tested in reading and mathematics when they were seniors in high school.
I4As a point of comparison, 29 percent of NELS 1992 high school graduates who entered public 4-year institutions had been at risk of dropping out of high school and 35 percent entered college at risk of not completing their postsecondary education. For those who never enrolled in postsecondary education, 82 percent were at risk of dropping out of high school, and if they had enrolled in postsecondary education, 71 percent would have been at risk of not completing.
Completion Rates Among Community College Students Seeking Formal Credentials
The BPS survey provides the most recent national data available to conduct an analysis of student completion rates. Among all BPS students who began postsecondary education at a community college, 36 percent had attained a degree or certificate (table 7a). However, as discussed earlier, not all BPS students had enrolled to obtain a credential. Therefore, it is appropriate to examine outcomes specifically for those who did report intentions of completing a degree or certificate. It is primarily these students for whom completion, as measured by earning a formal award, is a relevant indicator. What, then, were the rates of completion among students for whom a certificate, associate’s degree, or bachelor’s degree through transfer to a 4-year institution was a stated aim?
Among BPS community college students expecting to either complete a formal credential or transfer to a 4-year institution, about 39 percent had attained a credential by 2001 (table 7a). Among those who expected to attain a certificate, 35 percent had done so by the end of 2001, and an additional 7 percent had attained an associate’s degree, and 1 percent a bachelor’s degree. In total, therefore, about 42 percent of students who sought a vocational certificate when they first enrolled had earned a formal credential by 2001.
Among BPS students who expected to attain an associate’s degree, 22 percent had done so by 2001, and an additional 8 percent had attained a bachelor’s degree. About 8 percent of associate’s degree seekers had earned a vocational certificate as their highest attainment. In total, about 38 percent of associate’s degree seekers had earned a formal credential by 2001.
About 23 percent of BPS students seeking to transfer to a 4-year institution had attained a bachelor’s degree within 6 years. In addition, within this time period, 6 percent of bachelor’s degree seekers had earned a certificate as their highest credential, and an additional 11 percent an associate’s degree. In total, after 6 years, 39 percent of bachelor’s degree seekers had earned a formal credential. However, as will be discussed later, about one-fifth of the students seeking a bachelor’s degree had attended a 4-year institution but had not yet earned a degree.
Finally, among BPS students who reported that they did not expect to obtain any formal credential when they first enrolled, about one-fifth had done so by 2001, including 5 percent who had attained a certificate, 11 percent who had attained an associate’s degree, and 6 percent who
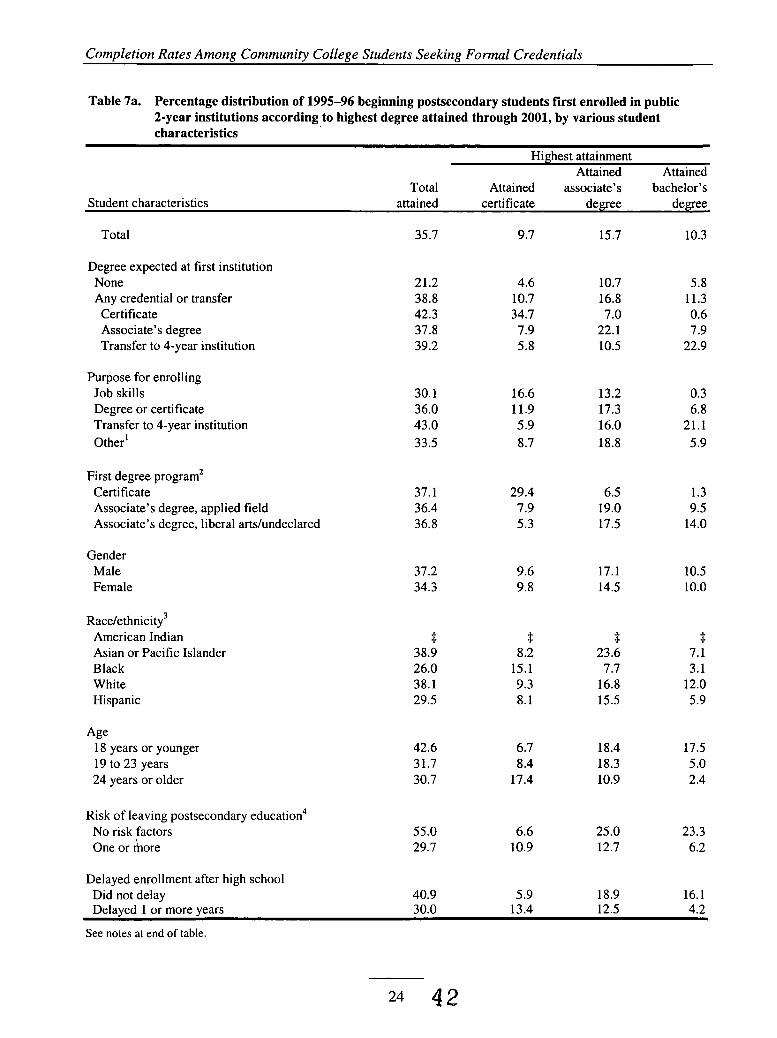
Completion Rates Among Community College Students Seeking Formal Credentials
Table 7a. Percentage distribution of 1995-96 beginning postsecondary students first enrolled in public 2-year institutions according to highest degree attained through 2001, by various student characteristics
Highest attainment Attained Attained
Total Attained associate’s bachelor’s degree Student characteristics attained certificate degree
Total
Degree expected at first institution None Any credential or transfer Certificate Associate’s degree Transfer to 4-year institution
Purpose for enrolling Job skills Degree or certificate Transfer to 4-year institution Other’
First degree program* Certificate Associate’s degree, applied field Associate’s degree, liberal artshndeclared
Gender Male Female
Race/ethnicity3 American Indian Asian or Pacific Islander Black White Hispanic
Age 18 years or younger 19 to 23 years 24 years or older
Risk of leaving postsecondary education4 No risk factors One or inore
Delayed enrollment after high school Did not delav
35.7
21.2 38.8 42.3 37.8 39.2
30.1 36.0 43.0 33.5
37.1 36.4 36.8
37.2 34.3
$‘ 38.9 26.0 38.1 29.5
42.6 31.7 30.7
55.0 29.7
40.9
9.7
4.6 10.7 34.7 7.9 5.8
16.6 11.9 5.9 8.7
29.4 7.9 5.3
9.6 9.8
$‘ 8.2
15.1 9.3 8.1
6.7 8.4
17.4
6.6 10.9
5.9
15.7
10.7 16.8 7.0
22.1 10.5
13.2 17.3 16.0 18.8
6.5 19.0 17.5
17.1 14.5
$‘ 23.6 7.7
16.8 15.5
18.4 18.3 10.9
25 .O 12.7
18.9
10.3
5.8 11.3 0.6 7.9
22.9
0.3 6.8
21.1 5.9
1.3 9.5
14.0
10.5 10.0
$ 7.1 3.1
12.0 5.9
17.5 5 .O 2.4
23.3 6.2
16.1 Delayed 1 or more years 30.0 13.4 12.5 4.2
See notes at end of table.
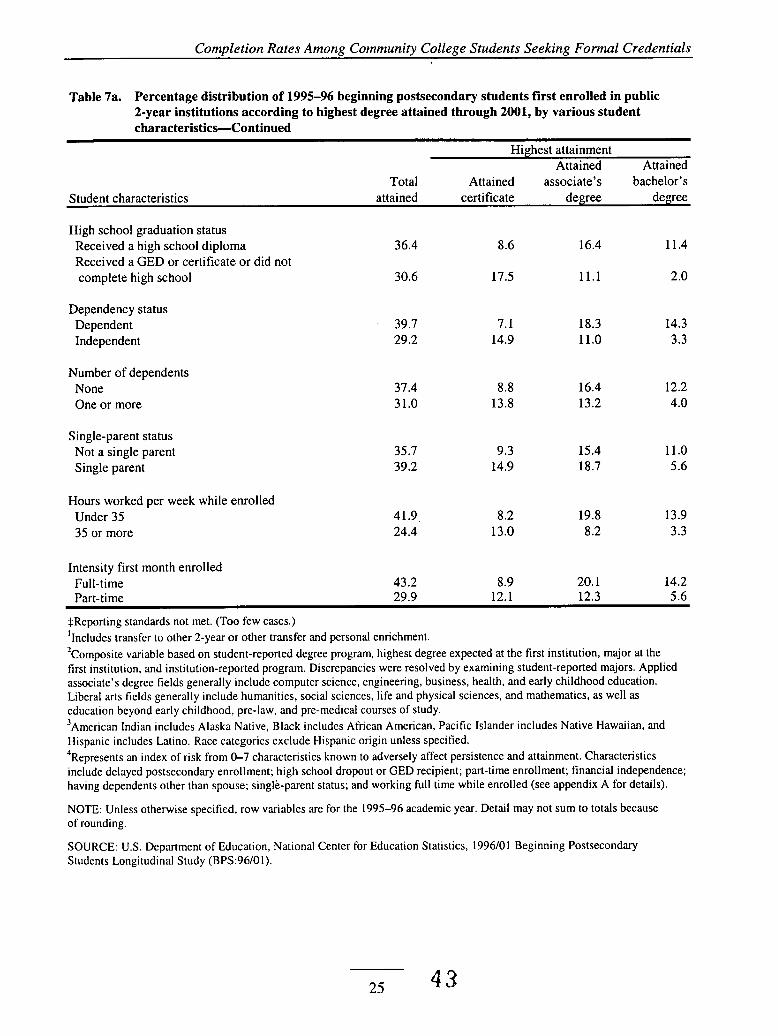
Completion Rates Among Community College Students Seeking Formal Credentials
Table 7a. Percentage distribution of 1995-96 beginning postsecondary students first enrolled in public 2-year institutions according to highest degree attained through 2001, by various student characteristics-Continued
Highest attainment Attained Attained
Total Attained associate’s bachelor’s Student characteristics attained certificate degree degree
High school graduation status Received a high school diploma Received a GED or certificate or did not complete high school
Dependency status Dependent Independent
Number of dependents None One or more
Single-parent status Not a single parent Single parent
Hours worked per week while enrolled Under 35 35 or more
36.4 8.6 16.4 11.4
30.6 17.5 11.1 2.0
39.7 7.1 18.3 14.3 29.2 14.9 11.0 3.3
37.4 31.0
8.8 16.4 12.2 13.8 13.2 4.0
35.7 9.3 15.4 11.0 39.2 14.9 18.7 5.6
41.9 8.2 19.8 13.9 24.4 13.0 8.2 3.3
Intensity first month enrolled Full-time 43.2 8.9 20.1 14.2 Part-time 29.9 12.1 12.3 5.6
$Reporting standards not met. (Too few cases.) ‘Includes transfer to other 2-year or other transfer and personal enrichment. 2Composite variable based on student-reported degree program, highest degree expected at the first institution, major at the first institution, and institution-reported program. Discrepancies were resolved by examining student-reported majors. Applied associate’s degree fields generally include computer science, engineering, business, health, and early childhood education. Liberal arts fields generally include humanities, social sciences, life and physical sciences, and mathematics, as well as education beyond early childhood, pre-law, and pre-medical courses of study. ’American Indian includes Alaska Native, Black includes African American, Pacific Islander includes Native Hawaiian, and Hispanic includes Latino. Race categories exclude Hispanic origin unless specified. 4Represents an index of risk from 0-7 characteristics known to adversely affect persistence and attainment. Characteristics include delayed postsecondary enrollment; high school dropout or GED recipient; part-time enrollment; financial independence; having dependents other than spouse; single-parent status; and working full time while enrolled (see appendix A for details).
NOTE: Unless otherwise specified, row variables are for the 1995-96 academic year. Detail may not sum to totals because of rounding.
SOURCE: U.S. Department of Education, National Center for Education Statistics, 1996/01 Beginning Postsecondary Students Longitudinal Study (BPS:96/01).
25 43
Completion Rates Among Community College Students Seeking Formal Credentials
had attained a bachelor’s degree by 2001. Apparently these students’ educational goals had changed over time.
Student Characteristics and Degree Attainment
Reflecting, in part, their degree goals, BPS students who were 18 years or younger when they first enrolled in a community college were more likely to have earned a formal credential by 2001 than older students (table 7a). In particular, they were more likely to have attained a bachelor’s degree. However, students 24 years or older were more likely than younger students to have completed a certificate. Because older students were more likely to be enrolled in certificate programs, this outcome would be expected.
Community college students with no characteristics that placed them at risk of not completing their postsecondary education were more likely than those with risk factors to have completed an associate’s or bachelor’s degree. An apparent difference was also observed with respect to completing a certificate, but statistical significance could not be confirmed.15 In total, 55 percent of students with no risk factors had earned a formal credential by 2001, while 30 percent of students with one or more risk factors had done so.
When examining each of the seven risk factors individually, the results are similar, though there are some important distinctions, especially with respect to certificate attainment by 2001. Students enrolled full time were more likely than part-time students to have earned a bachelor’s degree (14 percent vs. 6 percent) or an associate’s degree (20 percent vs. 12 percent). However, no difference was detected between full-time and part-time students in their attainment of certificates. Students who did not delay enrollment (i.e., younger students) were more likely than students who did delay to have completed a bachelor’s degree (16 percent vs. 4 percent) or an associate’s degree (19 percent vs. 13 percent), but higher percentages of students who delayed enrollment had completed certificates (13 percent vs. 6 percent).
Differences for students with family responsibilities were also observed for bachelor’s degree attainment rates. Students with dependents were less likely than those without dependents to have attained a bachelor’s degree by 2001 (4 percent vs. 12 percent). However, no differences were detected between students with and without dependents in the rates at which they had attained associate’s degrees or certificates. Students who were financially independent from their parents (for financial aid purposes) had earned certificates at a higher rate than dependent students (15 percent vs. 7 percent), but dependent students were more likely than independent
15The significance is between .05 and .lo, and the observed difference is believed to be real, but due to large standard errors is not significant at p 5 0.05.
26
Completion Rates Among Community College Students Seeking Formal Credentials
students to have earned an associate’s degree (18 percent vs. 11 percent) or a bachelor’s degree (14 percent vs. 3 percent). Students who worked fewer than 35 hours per week were more likely than those who worked 35 or more hours to have earned an associate’s degree (20 percent vs. 8 percent) or a bachelor’s degree (14 percent vs. 3 percent). An apparent difference was observed for certificate completion between students who worked fewer than 35 hours per week and those who worked more hours, but statistical significance could not be confirmed.16
Completion Plus Transfer to 4-Year Institutions
Defining completion as the award of a formal credential may understate the “success” of community colleges in serving students who begin their postsecondary education at these institutions. As was shown in figure 2, about one-quarter of BPS students who first enrolled in community colleges intended to transfer to a 4-year institution and complete their postsecondary instruction there, earning a bachelor’s degree or higher. A degree or certificate is not required for transferring to a 4-year institution, and many community college students make this transition without attaining a formal credential from the community college where they first started. Some of these students earn a bachelor’s degree; some do not. However, if students do transfer to a 4- year institution, even if they subsequently leave without earning a degree, from the community college perspective, the transfer represents a successful outcome.
Among BPS students in community colleges who intended to earn a credential, about 12 percent had not done so but had transferred to a 4-year institution, including 8 percent who were still enrolled (table 7b). When combining the percentages of those who had attained a degree or certificate and those who had transferred, a total of 51 percent had achieved a successful outcome. Among BPS students who sought a bachelor’s degree, about one-fifth (21 percent) had not earned a degree but had transferred, including 14 percent who were still enrolled. Thus taking these transfers into account along with those who had attained a credential-23 percent earned a bachelor’s degree, 11 percent an associate’s degree, and 6 percent earned a certificate (table 7a) -a total of 60 percent of bachelor’s degree seekers had earned a credential or transferred (table 7b).
significance is between .05 and .lo, and the observed difference is believed to be real, but due to large standard errors is not significant at p 5 0.05.
27 45
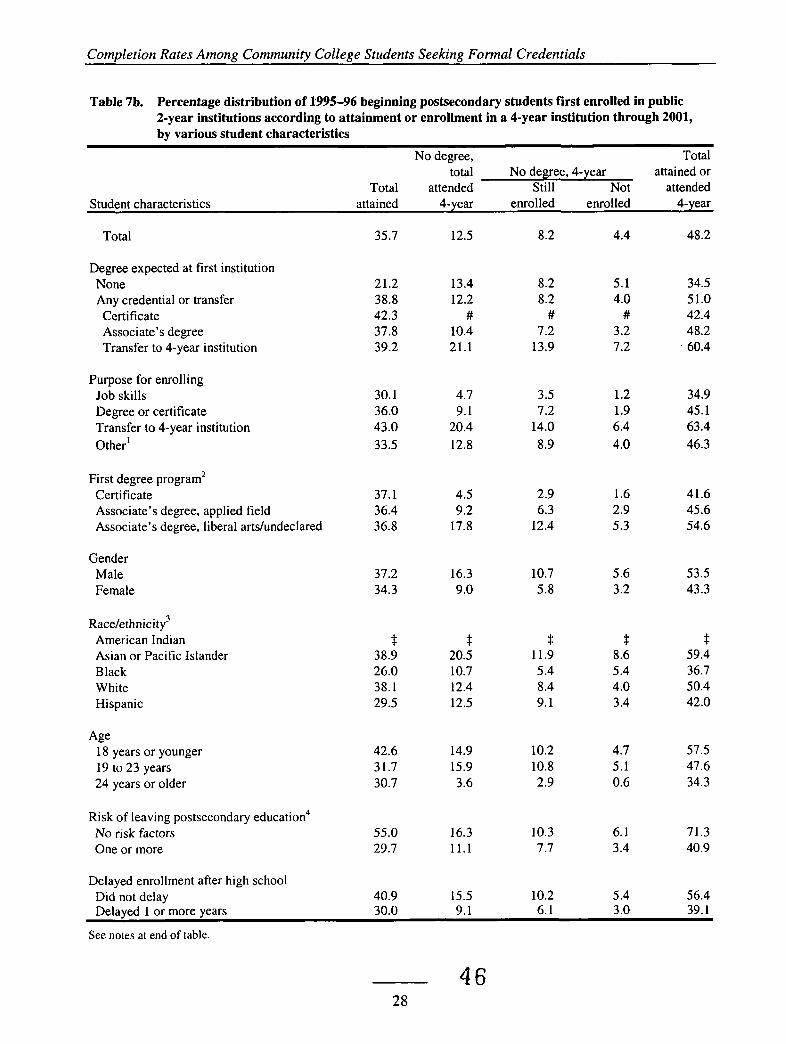
Completion Rates Among Community College Students Seeking Formal Credentials
Table 7b. Percentage distribution of 1995-96 beginning postsecondary students first enrolled in public 2-year institutions according to attainment or enrollment in a 4-year institution through 2001, by various student characteristics
No degree, Total total No degree, 4-year attained or
Total attended Still Not attended Student characteristics attained 4-year enrolled enrolled 4-year
Total
Degree expected at first institution None Any credential or transfer Certificate Associate’s degree Transfer to 4-year institution
Purpose for enrolling Job skills Degree or certificate Transfer to 4-year institution Other‘
First degree program’ Certificate Associate’s degree, applied field Associate’s degree, liberal artshndeclared
Gender Male Female
Ra~elethnicity~ American Indian Asian or Pacific Islander Black White Hispanic
Age 18 years or younger 19 to 23 years 24 years or older
Risk of leaving postsecondary education4 No risk factors One or more
Delayed enrollment after high school Did not delav
35.7
21.2 38.8 42.3 37.8 39.2
30.1 36.0 43.0 33.5
37.1 36.4 36.8
37.2 34.3
t 38.9 26.0 38.1 29.5
42.6 31.7 30.7
55.0 29.7
40.9
12.5
13.4 12.2
# 10.4 21.1
4.7 9.1
20.4 12.8
4.5 9.2
17.8
16.3 9.0
t 20.5 10.7 12.4 12.5
14.9 15.9 3.6
16.3 11.1
15.5 9.1
8.2
8.2 8.2
# 7.2
13.9
3.5 7.2
14.0 8.9
2.9 6.3
12.4
10.7 5.8
$ 11.9 5.4 8.4 9.1
10.2 10.8 2.9
10.3 7.7
10.2
4.4
5.1 4.0
# 3.2 7.2
1.2 1.9 6.4 4.0
1.6 2.9 5.3
5.6 3.2
$ 8.6 5.4 4.0 3.4
4.7 5.1 0.6
6.1 3.4
5.4
48.2
34.5 51.0 42.4 48.2 60.4
34.9 45.1 63.4 46.3
41.6 45.6 54.6
53.5 43.3
t 59.4 36.7 50.4 42.0
57.5 47.6 34.3
71.3 40.9
56.4 6.1 3 .O 39.1 Delayed 1 0; more years 30.0 .~
See notes at end of table.
46 28
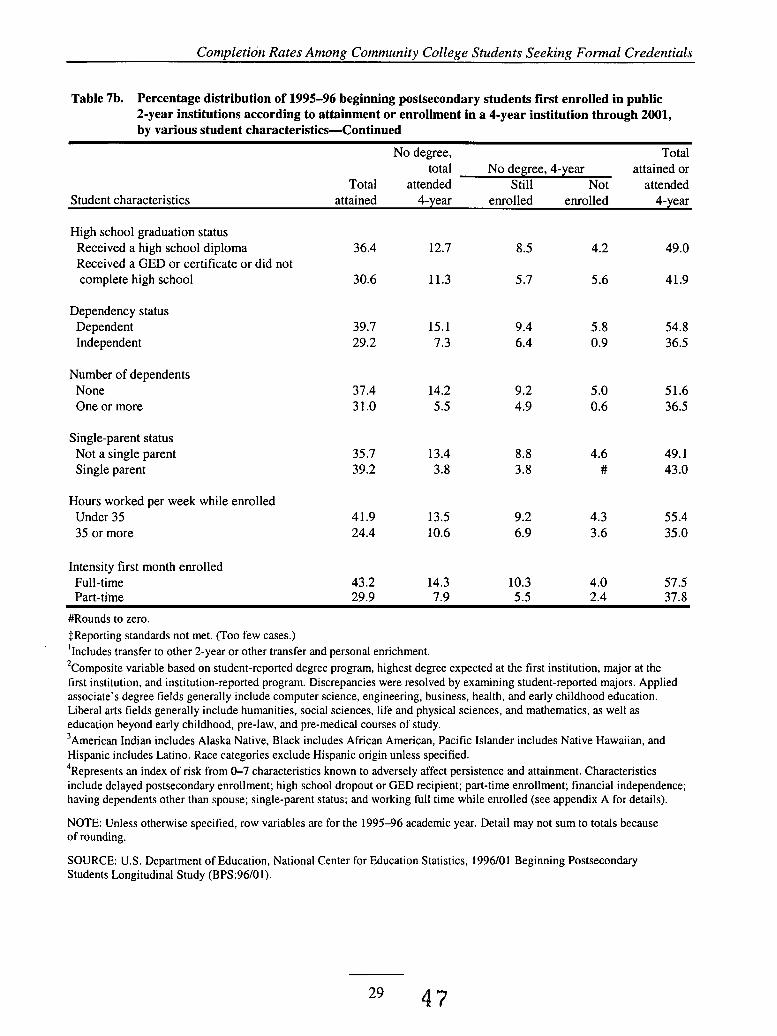
Completion Rates Among Community College Students Seeking Formal Credentials
Table 7b. Percentage distribution of 1995-96 beginning postsecondary students first enrolled in public 2-year institutions according to attainment or enrollment in a 4-year institution through 2001, by various student characteristics-Continued
No degree, Total total N o degree, 4-year attained or
Total attended Still Not attended Student characteristics attained 4-year enrolled enrolled 4-year
High school graduation status Received a high school diploma 36.4 12.7 8.5 4.2 49.0 Received a GED or certificate or did not complete high school 30.6 11.3 5.7 5.6 41.9
Dependency status Dependent 39.7 15.1 9.4 5.8 54.8
7.3 6.4 0.9 36.5 Independent 29.2
Number of dependents None One or more
Single-parent status Not a single parent Single parent
Hours worked per week while enrolled Under 35 35 or more
Intensity first month enrolled Full-time Part-time
37.4 31.0
35.7 39.2
4.2 9.2 5 .O 51.6 5.5 4.9 0.6 36.5
3.4 8.8 4.6 49.1 3.8 3.8 # 43.0
41.9 13.5 9.2 4.3 55.4 24.4 10.6 6.9 3.6 35.0
43.2 14.3 10.3 4.0 57.5 29.9 7.9 5.5 2.4 37.8
#Rounds to zero. $Reporting standards not met. (Too few cases.) 'Includes transfer to other 2-year or other transfer and personal enrichment. Composite variable based on student-reported degree program, highest degree expected at the first institution, major at the
first institution, and institution-reported program. Discrepancies were resolved by examining student-reported majors. Applied associate's degree fields generally include computer science, engineering, business, health, and early childhood education. Liberal arts fields generally include humanities, social sciences, life and physical sciences, and mathematics, as well as education beyond early childhood, pre-law, and pre-medical courses of study. American Indian includes Alaska Native, Black includes African American, Pacific Islander includes Native Hawaiian, and
Hispanic includes Latino. Race categories exclude Hispanic origin unless specified. 4Represents an index of risk from 0-7 characteristics known to adversely affect persistence and attainment. Characteristics include delayed postsecondary enrollment; high school dropout or GED recipient; part-time enrollment; financial independence; having dependents other than spouse; single-parent status; and working full time while enrolled (see appendix A for details).
NOTE: Unless otherwise specified, row variables are for the 1995-96 academic year. Detail may not sum to totals because of rounding.
SOURCE: U.S. Department of Education, National Center for Education Statistics, 1996101 Beginning Postsecondary Students Longitudinal Study (BPS:96/01).
2
3
29 4 7
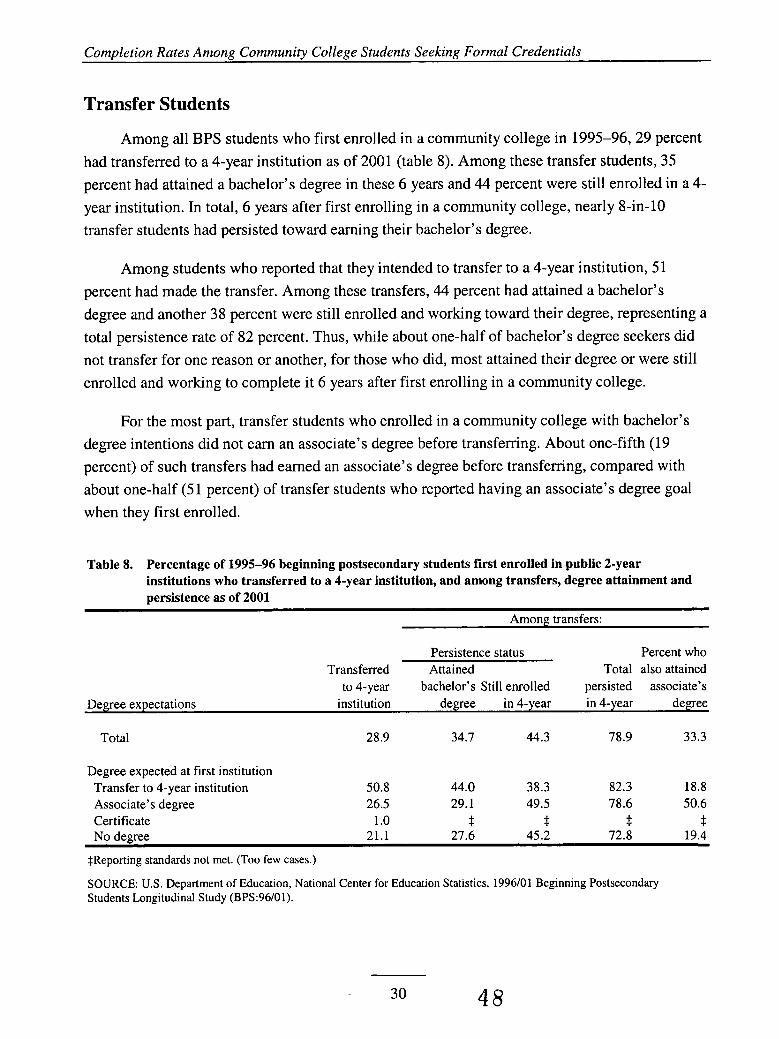
Corntdetion Rates Arnonn Cornrnunitv Collene Students Seekinn Formal Credentials
Transfer Students
Among all BPS students who first enrolled in a community college in 1995-96,29 percent had transferred to a 4-year institution as of 2001 (table 8). Among these transfer students, 35 percent had attained a bachelor’s degree in these 6 years and 44 percent were still enrolled in a 4- year institution. In total, 6 years after first enrolling in a community college, nearly 8-in-10 transfer students had persisted toward earning their bachelor’s degree.
Among students who reported that they intended to transfer to a 4-year institution, 51 percent had made the transfer. Among these transfers, 44 percent had attained a bachelor’s degree and another 38 percent were still enrolled and working toward their degree, representing a total persistence rate of 82 percent. Thus, while about one-half of bachelor’s degree seekers did not transfer for one reason or another, for those who did, most attained their degree or were still enrolled and working to complete it 6 years after first enrolling in a community college.
For the most part, transfer students who enrolled in a community college with bachelor’s degree intentions did not earn an associate’s degree before transferring. About one-fifth (19 percent) of such transfers had earned an associate’s degree before transferring, compared with about one-half (5 1 percent) of transfer students who reported having an associate’s degree goal when they first enrolled.
Table 8. Percentage of 1995-96 beginning postsecondary students first enrolled in public 2-year institutions who transferred to a 4-year institution, and among transfers, degree attainment and persistence as of 2001
Among transfers:
Persistence status Percent who Transferred Attained Total also attained
to 4-year bachelor’s Still enrolled persisted associate’s Degree expectations institution degree in 4-year in 4-year degree
Total 28.9 34.7 44.3 78.9 33.3
Degree expected at first institution Transfer to 4-year institution Associate’s degree Certificate
50.8 44.0 38.3 82.3 18.8 26.5 29.1 49.5 78.6 50.6
1 .o t t $ t
$Reporting standards not met. (Too few cases.)
SOURCE: U.S. Department of Education, National Center for Education Statistics, 1996/01 Beginning Postsecondary Students Longitudinal Study (BPS:96/01).
30 48
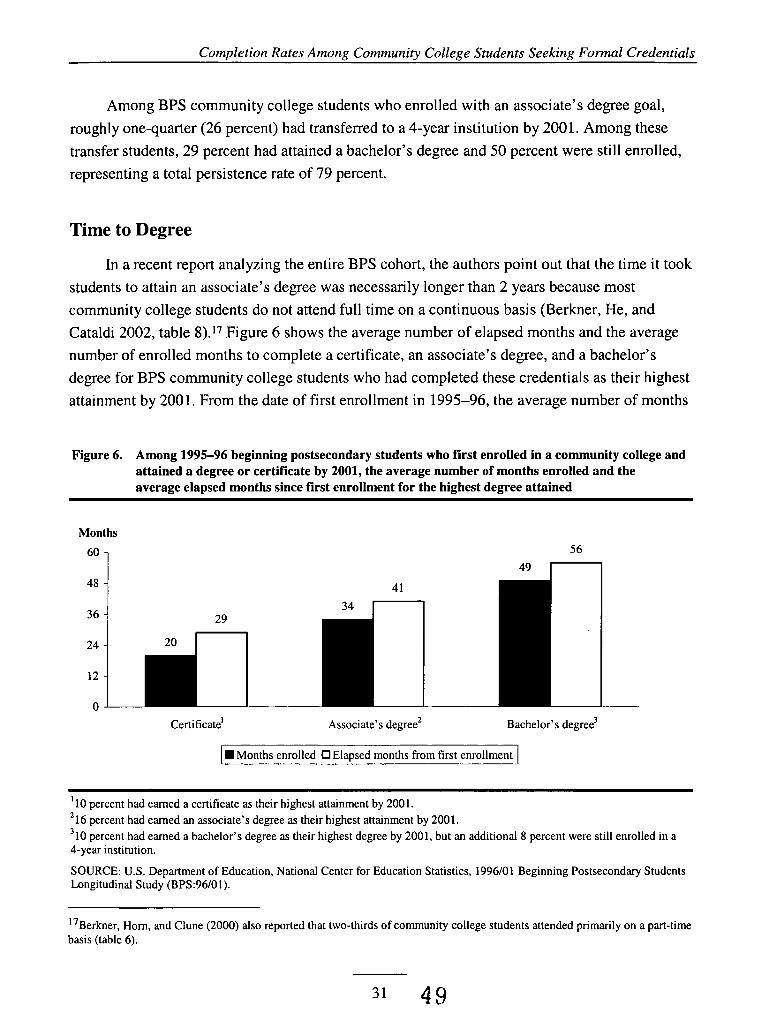
Comuletion Rates Amonn Communitv Collene Students Seekinn Formal Credentials
Among BPS community college students who enrolled with an associate’s degree goal, roughly one-quarter (26 percent) had transferred to a 4-year institution by 2001. Among these transfer students, 29 percent had attained a bachelor’s degree and 50 percent were still enrolled, representing a total persistence rate of 79 percent.
Time to Degree
In a recent report analyzing the entire BPS cohort, the authors point out that the time it took students to attain an associate’s degree was necessarily longer than 2 years because most community college students do not attend full time on a continuous basis (Berkner, He, and Cataldi 2002, table 8).17 Figure 6 shows the average number of elapsed months and the average number of enrolled months to complete a certificate, an associate’s degree, and a bachelor’s degree for BPS community college students who had completed these credentials as their highest attainment by 2001. From the date of first enrollment in 1995-96, the average number of months
Figure 6. Among 1995-96 beginning postsecondary students who first enrolled in a community college and attained a degree or certificate by 2001, the average number of months enrolled and the average elapsed months since first enrollment for the highest degree attained
Months
6o 1 56
49 n 41
29 36 -
24 - 20
Certificate’ Associate’s degree’ Bachelor’s degree3
1. Months enrolled OElapsed months from first enrollment 1
10 percent had earned a certificate as their highest attainment by 2001. 16 percent had earned an associate’s degree as their highest attainment by 2001. 10 percent had earned a bachelor’s degree as their highest degree by 2001, but an additional 8 percent were still enrolled in a
4-year institution.
SOURCE: U.S. Department of Education, National Center for Education Statistics, 1996101 Beginning Postsecondary Students Longitudinal Study (BPS:96/01).
1
2
3
17Berkner, Horn, and Clune (2000) also reported that two-thirds of community college students attended primarily on a part-time basis (table 6) .
31 49
Completion Rates Among Community College Students Seeking Formal Credentials
to associate’s degree attainment was 41. Thus for the 16 percent of BPS students who had attained an associate’s degree as their highest degree by 2001 (as was shown in table 7a), it took them an average of about 3 and half years to complete a degree that is expected to take 2 years of full-time study. Students who earned a certificate (10 percent of all BPS community college students) took about 2 1/2 years (29 months) to complete. While the length of programs leading to a certificate varies, they are most often 1-year programs of full-time study (Berkner, Horn, and Clune 2000). As a point of comparison to the time it took students in community college programs to complete a certificate, BPS students who first enrolled in private for-profit institutions took an average of 14 months to complete a certificate.18
Among the 10 percent of community college students who had attained a bachelor’s degree within 6 years, they took nearly 5 years (56 months) to complete the degree. However, as was shown in table 7b, an additional 8 percent of BPS community college students, or roughly 44 percent of those in bachelor’s degree programs, were still enrolled in a 4-year institution and had not yet completed their degree.19 As a point of comparison, BPS students who began in a 4-year institution took an average of 50 months to complete.20
18Estimate from 1996101 Beginning Postsecondary Students Longitudinal Study (BPS:96/01). I9The 44 percent was calculated by dividing the percentage still enrolled (8 percent) by the total who had attained a bachelor’s degree or were still enrolled (1 8 percent). *Olbid.
32 50
Completion Among 1992 High School Graduates Who Enrolled in Community Colleges
This section of the report presents completion rates for the NELS students who entered community colleges. As previously discussed, these students are of similar ages and enrolled within 2 years after high school graduation. Thus, they represent a more traditional population of students.
Among the NELS 1992 high school graduates who first enrolled in community colleges within 2 years of graduating from high school, about one-half (49 percent) had completed a degree or certificate by 2000 (table 9a). Among those who as seniors in high school reported intentions of earning a vocational certificate or attending a vocational program for more than 2 years, 27 percent had earned a certificate, 26 percent had earned an associate’s degree, and 4 percent had attained a bachelor’s degree. Thus, for those 1992 high school graduates who entered a community college intending to pursue 2 or more years of vocational education, 56 percent had earned a formal credential within 6 to 8 years. In contrast, among those graduates who intended to earn an associate’s degree, a total of 41 percent had earned a formal credential during that time period.
For 1992 high school graduates who entered a community college with bachelor’s degree aspirations or higher, about 27 percent had attained a bachelor’s degree by 2000 (table 9a). About 16 percent of bachelor’s degree seekers had earned an associate’s degree as their highest award, and 8 percent obtained a certificate, for a total attainment rate of 52 percent. However, as shown in table 9b, an additional 15 percent of bachelor’s degree seekers had not earned a degree, but had attended a 4-year institution. If obtaining any formal credential or transferring to a 4-year college is defined as a “successful” outcome for community college students, about two-thirds (67 percent) of 1992 high school graduates who initially enrolled in a community college with intentions of earning a bachelor’s degree had achieved such an outcome.
Postsecondary Outcomes and Academic Preparedness
As might be expected, students who graduated from high school with lower levels of academic preparedness tended to attain postsecondary credentials at lower rates than their peers with higher levels of preparation. For example, two-thirds of students who had completed the
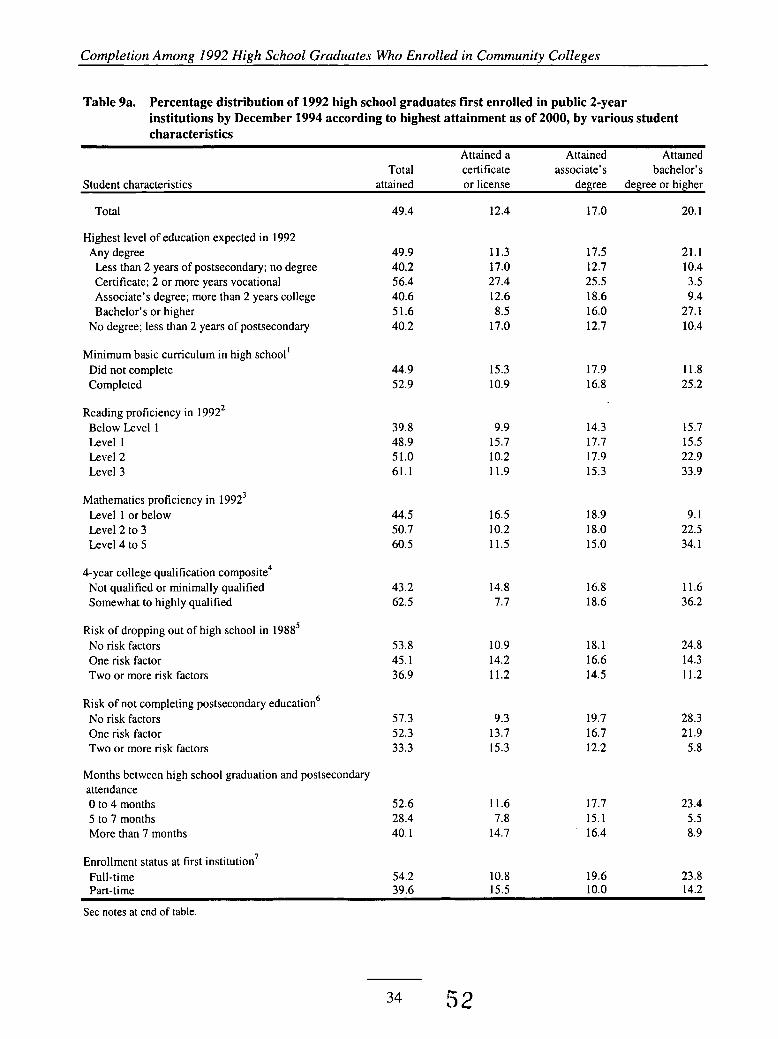
Completion Among I992 High School Graduates Who Enrolled in Community Colleges
Table 9a. Percentage distribution of 1992 high school graduates first enrolled in public 2-year institutions by December 1994 according to highest attainment as of 2000, by various student characteristics
Attained a Attained Attained Total certificate associate’s bachelor’s
Student characteristics attained or license degree degree or higher
Total
Highest level of education expected in 1992 Any degree
Less than 2 years of postsecondary; no degree Certificate; 2 or more years vocational Associate’s degree; more than 2 years college Bachelor’s or higher
No degree; less than 2 years of postsecondary
Minimum basic curriculum in high school’ Did not complete Completed
Reading proficiency in 1992’ Below Level 1 Level 1 Level 2 Level 3
Mathematics proficiency in 19923 Level 1 or below Level 2 to 3 Level 4 to 5
4-year college qualification composite4 Not qualified or minimally qualified Somewhat to highly qualified
Risk of dropping out of high school in 19885 No risk factors One risk factor Two or more risk factors
Risk of not completing postsecondary education6 No risk factors One risk factor Two or more risk factors
Months between high school graduation and postsecondary attendance 0 to 4 months 5 to 7 months More than 7 months
Enrollment status at first institution’ Full-time Part-time
49.4
49.9 40.2 56.4 40.6 51.6 40.2
44.9 52.9
39.8 48.9 51.0 61.1
44.5 50.7 60.5
43.2 62.5
53.8 45.1 36.9
57.3 52.3 33.3
52.6 28.4 40.1
54.2 39.6
12.4
11.3 17.0 27.4 12.6 8.5
17.0
15.3 10.9
9.9 15.7 10.2 11.9
16.5 10.2 11.5
14.8 7.7
10.9 14.2 11.2
9.3 13.7 15.3
11.6 7.8
14.7
10.8
17.0
17.5 12.7 25.5 18.6 16.0 12.7
17.9 16.8
14.3 17.7 17.9 15.3
18.9 18.0 15.0
16.8 18.6
18.1 16.6 14.5
19.7 16.7 12.2
17.7 15.1 16.4
19.6
20.1
21.1 10.4 3.5 9.4
27.1 10.4
11.8 25.2
15.7 15.5 22.9 33.9
9.1 22.5 34.1
11.6 36.2
24.8 14.3 11.2
28.3 21.9 5.8
23.4 5.5 8.9
23.8 15.5 10.0 14.2
See notes at end of table.
34 52
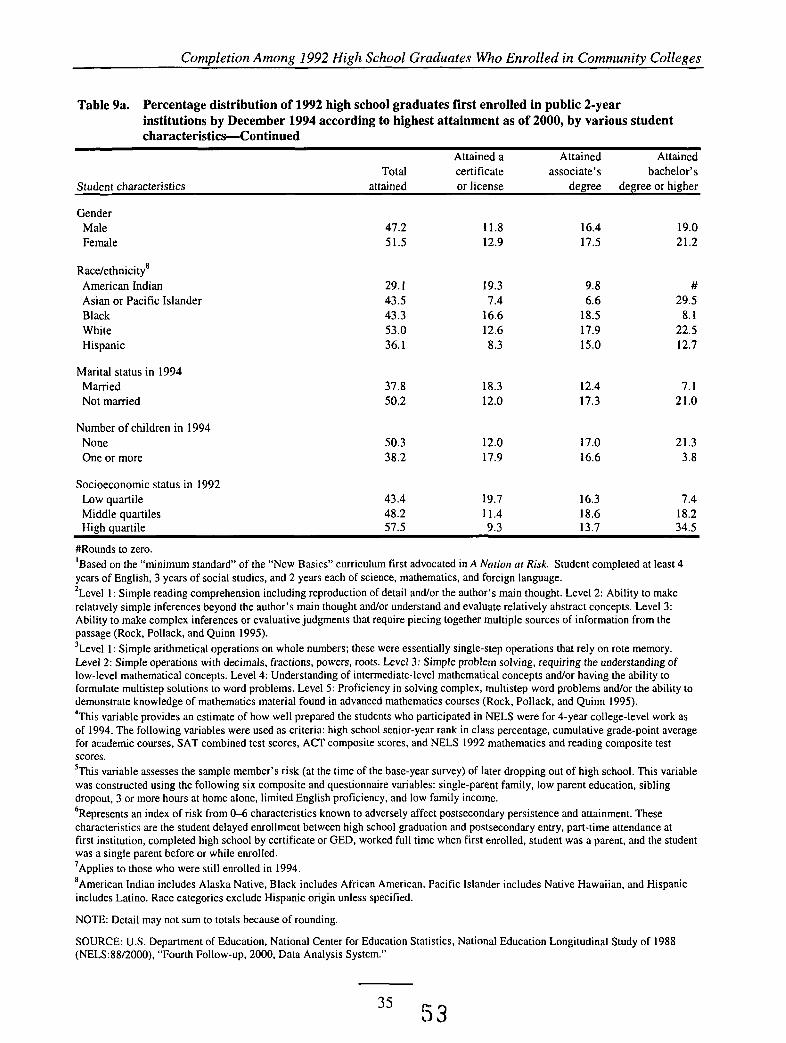
Completion Among 1992 High School Graduates Who Enrolled in Community Colleges
Table 9a. Percentage distribution of 1992 high school graduates first enrolled in public 2-year institutions by December 1994 according to highest attainment as of 2000, by various student characteristics-Continued
Attained a Attained Attained Total certificate associate’s bachelor’s
Student characteristics attained or license degree degree or higher
Gender Male Female
Race/ethnicity’ American Indian Asian or Pacific Islander Black White Hispanic
Marital status in 1994 Married Not married
Number of children in 1994 None One or more
47.2 11.8 16.4 19.0 51.5 12.9 17.5 21.2
29.1 19.3 9.8 # 43.5 7.4 6.6 29.5 43.3 16.6 18.5 8.1 53.0 12.6 17.9 22.5 36.1 8.3 15.0 12.7
37.8 18.3 12.4 7.1 50.2 12.0 17.3 21.0
50.3 12.0 17.0 21.3 38.2 17.9 16.6 3.8
Socioeconomic status in 1992 Low quartile 43.4 19.7 16.3 7.4
High quartile 57.5 9.3 13.7 34.5 Middle quartiles 48.2 11.4 18.6 18.2
#Rounds to zero. ‘Based on the “minimum standard” of the “New Basics’’ curriculum first advocated in A Nation at Risk. Student completed at least 4 years of English, 3 years of social studies, and 2 years each of science. mathematics, and foreign language. ’Level 1 : Simple reading comprehension including reproduction of detail and/or the author’s main thought. Level 2: Ability to make relatively simple inferences beyond the author’s main thought and/or understand and evaluate relatively abstract concepts. Level 3: Ability to make complex inferences or evaluative judgments that require piecing together multiple sources of information from the passage (Rock, Pollack, and Quinn 1995). 3Level 1 : Simple arithmetical operations on whole numbers; these were essentially single-step operations that rely on rote memory. Level 2: Simple operations with decimals, fractions, powers, roots. Level 3: Simple problem solving, requiring the understanding of low-level mathematical concepts. Level 4: Understanding of intermediate-level mathematical concepts and/or having the ability to formulate multistep solutions to word problems. Level 5: Proficiency in solving complex, multistep word problems and/or the ability to demonstrate knowledge of mathematics material found in advanced mathematics courses (Rock, Pollack, and Quinn 1995). 4This variable provides an estimate of how well prepared the students who participated in NELS were for 4-year college-level work as of 1994. The following variables were used as criteria: high school senior-year rank in class percentage, cumulative grade-point average for academic courses, SAT combined test scores, ACT composite scores, and NELS 1992 mathematics and reading composite test scores. ’This variable assesses the sample member’s risk (at the time of the base-year survey) of later dropping out of high school. This variable was constructed using the following six composite and questionnaire variables: single-parent family, low parent education, sibling dropout, 3 or more hours at home alone, limited English proficiency. and low family income. 6Represents an index of risk from 0-6 characteristics known to adversely affect postsecondary persistence and attainment. These characteristics are the student delayed enrollment between high school graduation and postsecondary entry, part-time attendance at first institution, completed high school by certificate or GED, worked full time when first enrolled, student was a parent, and the student was a single parent before or while enrolled. ’Applies to those who were still enrolled in 1994. *American Indian includes Alaska Native, Black includes African American, Pacific Islander includes Native Hawaiian, and Hispanic includes Latino. Race categories exclude Hispanic origin unless specified.
NOTE: Detail may not sum to totals because of rounding.
SOURCE: U.S. Department of Education, National Center for Education Statistics, National Education Longitudinal Study of 1988 (NELS:88/2000), “Fourth Follow-up, 2000, Data Analysis System.”
5 3 35
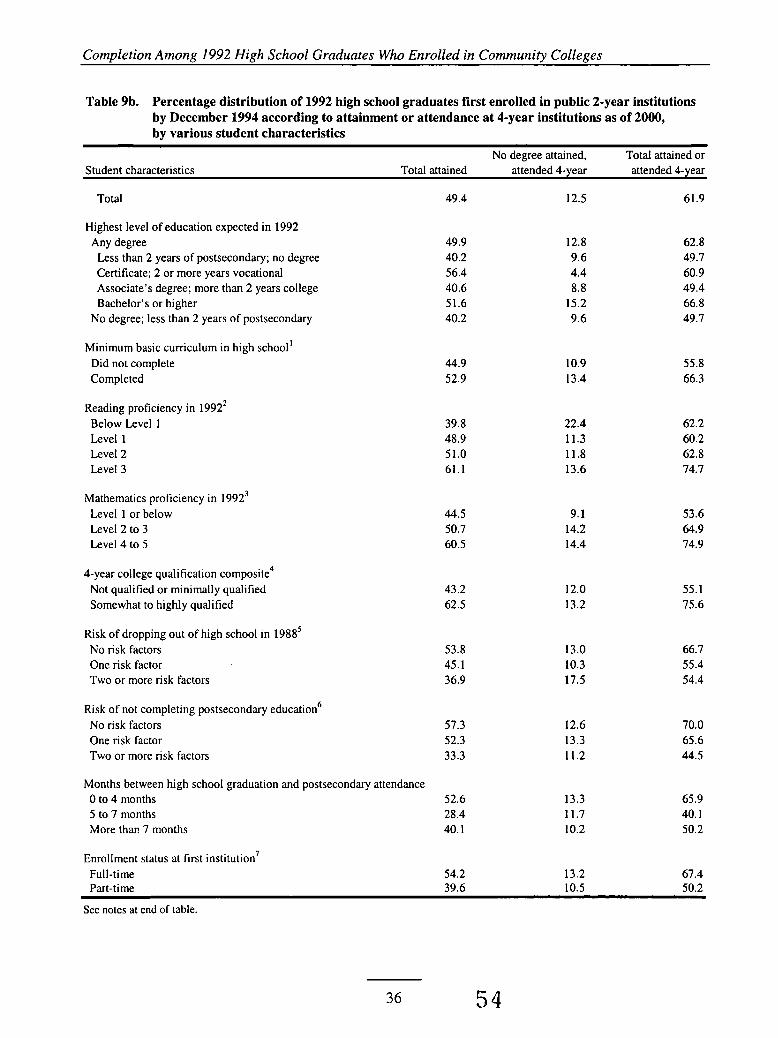
Completion Among 1992 High School Graduates Who Enrolled in Community Colleges
Table 9b. Percentage distribution of 1992 high school graduates first enrolled in public 2-year institutions by December 1994 according to attainment or attendance at 4-year institutions as of 2000, by various student characteristics
No degree attained, Total attained or Student characteristics Total attained attended 4-year attended 4-year
Total 49.4 12.5 61.9
Highest level of education expected in 1992 Any degree
Less than 2 years of postsecondary; no degree Certificate; 2 or more years vocational Associate’s degree; more than 2 years college Bachelor’s or higher
No degree; less than 2 years of postsecondary
Minimum basic curriculum in high school’ Did not complete Completed
Reading proficiency in 1992’ Below Level 1 Level 1 Level 2 Level 3
49.9 40.2 56.4 40.6 51.6 40.2
12.8 9.6 4.4 8.8
15.2 9.6
62.8 49.7 60.9 49.4 66.8 49.7
44.9 52.9
10.9 13.4
55.8 66.3
39.8 48.9 51.0 61.1
22.4 11.3 11.8 13.6
62.2 60.2 62.8 74.7
Mathematics proficiency in 19923 Level 1 or below Level 2 to 3 Level 4 to 5
44.5 50.7 60.5
9.1 14.2 14.4
53.6 64.9 74.9
4-year college qualification composite4 Not qualified or minimally qualified Somewhat to highly qualified
Risk of dropping out of high school in 19885 No risk factors One risk factor Two or more risk factors
43.2 62.5
12.0 13.2
55.1 75.6
53.8 45.1 36.9
13.0 10.3 17.5
66.7 55.4 54.4
Risk of not completing postsecondary education6 No risk factors One risk factor Two or more risk factors
57.3 52.3 33.3
12.6 13.3 11.2
70.0 65.6 44.5
Months between high school graduation and postsecondary attendance 0 to 4 months 52.6 5 to 7 months 28.4 More than 7 months 40.1
13.3 11.7 10.2
65.9 40.1 50.2
Enrollment status at first institution’ Full-time Part-time
54.2 39.6
13.2 10.5
67.4 50.2
See notes at end of table.
36 54
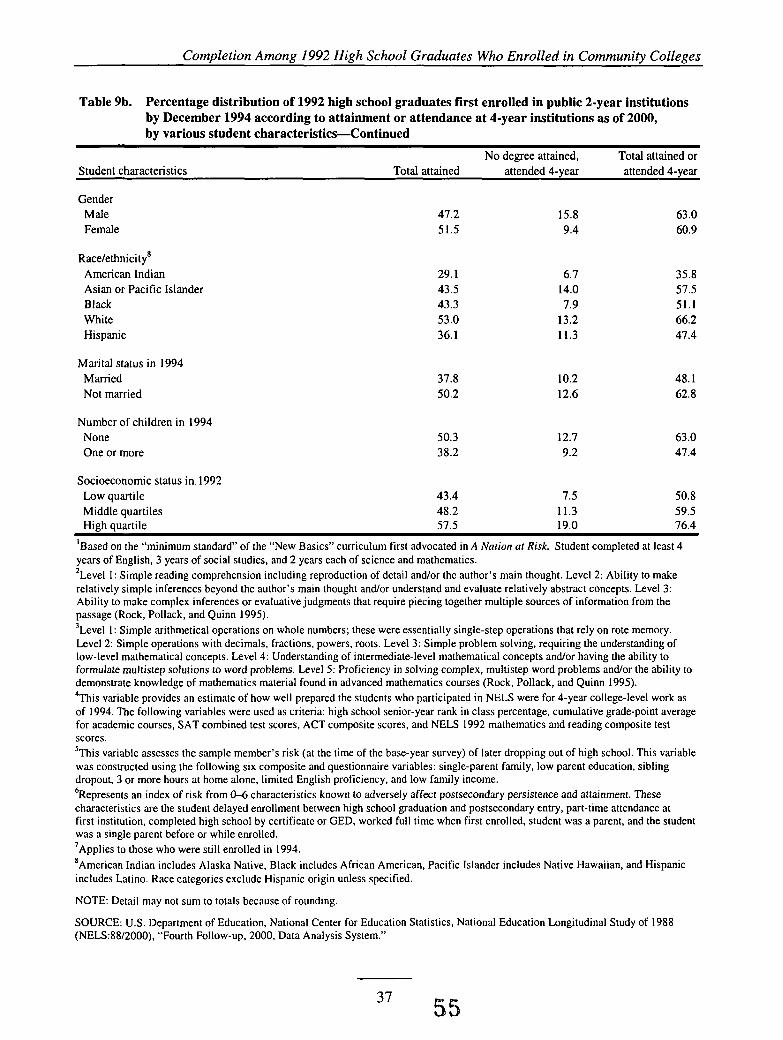
Completion Among 1992 High School Graduates Who Enrolled in Community Colleges
Table 9b. Percentage distribution of 1992 high school graduates first enrolled in public 2-year institutions by December 1994 according to attainment or attendance at 4-year institutions as of 2000, by various student characteristics-Continued
No degree attained, Total attained or Student characteristics Total attained attended 4-year attended 4-year
Gender Male Female
Race/ethnicity* American Indian Asian or Pacific Islander Black White Hispanic
Marital status in 1994 Married Not married
Number of children in 1994 None One or more
47.2 51.5
29.1 43.5 43.3 53.0 36.1
37.8 50.2
50.3 38.2
15.8 9.4
6.7 14.0 7.9
13.2 11.3
10.2 12.6
12.7 9.2
63.0 60.9
35.8 57.5 51.1 66.2 47.4
48.1 62.8
63.0 47.4
Socioeconomic status in 1992 Low quartile 43.4 7.5 50.8
High quartile 57.5 19.0 76.4 Middle quartiles 48.2 11.3 59.5
‘Based on the “minimum standard’ of the “New Basics” curriculum first advocated in A Nation at Risk. Student completed at least 4 years of English, 3 years of social studies, and 2 years each of science and mathematics. *Level 1: Simple reading comprehension including reproduction of detail and/or the author’s main thought. Level 2: Ability to make relatively simple inferences beyond the author’s main thought and/or understand and evaluate relatively abstract concepts. Level 3: Ability to make complex inferences or evaluative judgments that require piecing together multiple sources of information from the passage (Rock, Pollack, and Quinn 1995). 3Level 1 : Simple arithmetical operations on whole numbers; these were essentially single-step operations that rely on rote memory. Level 2: Simple operations with decimals, fractions, powers, roots. Level 3: Simple problem solving, requiring the understanding of low-level mathematical concepts. Level 4: Understanding of intermediate-level mathematical concepts and/or having the ability to formulate multistep solutions to word problems. Level 5: Proficiency in solving complex, multistep word problems and/or the ability to demonstrate knowledge of mathematics material found in advanced mathematics courses (Rock, Pollack, and Quinn 1995). 4This variable provides an estimate of how well prepared the students who participated in NELS were for 4-year college-level work as of 1994. The following variables were used as criteria: high school senior-year rank in class percentage, cumulative grade-point average for academic courses, SAT combined test scores, ACT composite scores, and NELS 1992 mathematics and reading composite test scores. ‘This variable assesses the sample member’s risk (at the time of the base-year survey) of later dropping out of high school. This variable was constructed using the following six composite and questionnaire variables: single-parent family, low parent education, sibling dropout, 3 or more hours at home alone, limited English proficiency, and low family income. 6Represents an index of risk from 0-6 characteristics known to adversely affect postsecondary persistence and attainment. These characteristics are the student delayed enrollment between high school graduation and postsecondary entry, part-time attendance at first institution, completed high school by certificate or GED, worked full time when first enrolled, student was a parent, and the student was a single parent before or while enrolled. ’Applies to those who were still enrolled in 1994. ‘American Indian includes Alaska Native, Black includes African American, Pacific Islander includes Native Hawaiian, and Hispanic includes Latino. Race categories exclude Hispanic origin unless specified.
NOTE: Detail may not sum to totals because of rounding.
SOURCE: U.S. Department of Education, National Center for Education Statistics, National Education Longitudinal Study of 1988 (NELS:88/2000). “Fourth Follow-up. 2000. Data Analysis System.”
37 5%
Completion Among I992 High School Graduates Who Enrolled in Community Colleges
minimum basic high school curriculum had attained or transferred to a 4-year institution, compared with 56 percent of their peers who did not complete that curriculum (table 9b).
Rates of completion were also lower for students scoring at the lowest levels on high school assessments of proficiency in reading and mathematics. For example, about one-half (54 percent) of students who had scored in the lowest proficiency levels of mathematics as seniors in high school had earned a credential or attended a 4-year institution, compared with three-quarters who had scored in the highest levels tested (level 4 or 5). Similarly, students who scored at levels 1 or 2 in reading proficiency were less likely than their peers who scored at level 3 to have attained or transferred (60 and 63 percent vs. 75 percent).21
Among NELS high school graduates who in 1988 had two or more risk factors associated with dropping out of high school, 54 percent of community college students had completed a degree or attended a 4-year institution by 2000, compared with 67 percent of students who had no dropout risk factors. Similarly, 44 percent of 1992 high school graduates who enrolled in a community college with two or more characteristics that placed them at risk of not completing their postsecondary education had completed a credential or attended a 4-year institution by 2000, compared with 70 percent of students with no such risk factors and 66 percent with one risk factor.
How long community college students waited to enroll in postsecondary education after high school graduation was also related to their completion of a degree or transfer. Two-thirds of those who enrolled in a community college within 4 months of high school graduation completed a formal award or attended a 4-year college or university, compared with 40 percent of those who delayed from 5 to 7 months and 50 percent who delayed from 7 to 24 months.
Finally, as previously discussed, roughly one-third of 1992 high school graduates enrolled in a community college even though they may have been able to enroll in a 4-year institution based on their academic qualifications. These students were more likely than their peers who were not qualified or only minimally qualified to have earned a bachelor’s degree by 2000 (36 percent vs. 12 percent) and also more likely to have earned any formal credential (62 percent vs. 43 percent) (table 9a).
Multivariate Analysis
To take into account the interrelationship of academic preparation indicators, risk factors, and demographic characteristics that may influence students’ likelihood of completing a
21There were too few cases who scored below level 1 to find a significant difference between this group and others.
38 56
Completion Among 1992 High School Graduates Who Enrolled in Community Colleges
postsecondary credential, a multivariate analysis was conducted on the NELS data. (See appendix B for a detailed description of the methodology used.) The multivariate method used in this analysis is an approach sometimes referred to as “communality analysis.’’ Multiple linear regression was used to adjust for the covariation among a list of control variables, which were selected based solely on the descriptive analysis rather than on a theoretical model, and the regression model was not reduced. The dependent variable was a dichotomous outcome (yesho) indicating whether a student had either attained a formal credential or attended a 4-year institution.
The least squares regression coefficients, expressed as percentages, are displayed in table 10. Significant coefficients represent the observed differences that remain between the analysis group (such as those with the highest mathematics proficiency scores) and the comparison group (those with lowest level scores) after controlling for the relationships of all the selected independent variables. For example, the least squares coefficient for scoring at level 4 or 5 in mathematics is 14.5. This means that compared with those who scored at level 1 or below, about 15 percent more of the students with high level scores would be expected to have a successful outcome after controlling for the relationships among the other independent variables.
The first column of table 10 contains the unadjusted percentages-that is, the percentages before taking into account the interrelationships among the other variables. Numbers with asterisks indicate that the percentage of students in that category is significantly different from the percentage in the reference category.
After adjusting for the relationships among the independent variables listed in the table, three variables remained significantly associated with degree attainment or 4-year transfer. Students who scored in the highest mathematics proficiency level (vs. the lowest levels), students who completed the minimum basic high school curriculum (vs. not completing), and those who enrolled in college with no characteristics that placed them at risk of not completing their postsecondary education (vs. those with two or more factors) were all more likely than their counterparts to have attained or transferred.22
On the other hand, after controlling for all other variables, the difference between rates of attainment or transfer between the highest and lowest reading proficiency scores was no longer significant.23 Similarly, the difference between students with and without factors that had placed
22The variable indicating students’ qualification for a 4-year college was not included in the model with the NELS proficiency scores and high school coursetaking because the scores and high school coursetaking are components of the qualification composite; therefore, the variables are highly intercorrelated. 23Holding related variables constant typically reduces the magnitude of the differences between the unadjusted percentages. In some cases the difference is no longer significant.
5 7 39
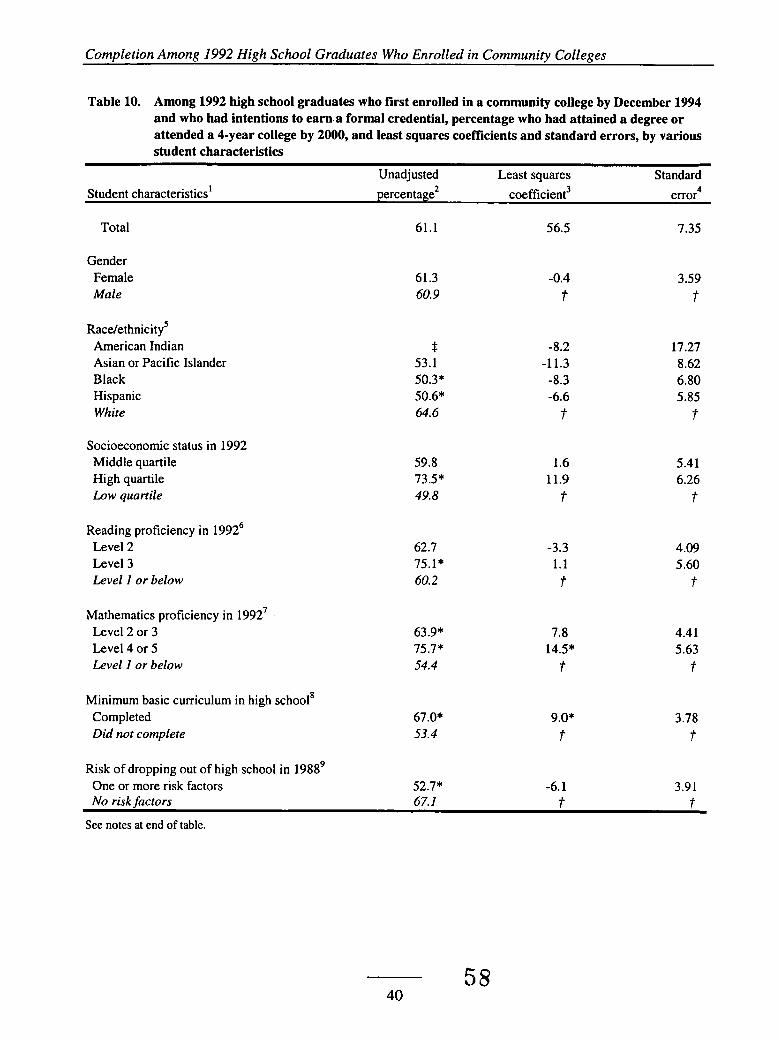
Completion Among I992 High School Graduates Who Enrolled in Communitv Colleges
Table 10. Among 1992 high school graduates who first enrolled in a community college by December 1994 and who had intentions to earn a formal credential, percentage who had attained a degree or attended a 4-year college by 2000, and least squares coefficients and standard errors, by various student characteristics
Unadjusted Least squares Standard 4 Student characteristics’ percentage* coefficient3 error
Total 61.1 56.5 7.35
Gender Female Male
Racdethnicity’ American Indian Asian or Pacific Islander Black Hispanic White
Socioeconomic status in 1992 Middle quartile High quartile Low quartile
Reading proficiency in 19926 Level 2 Level 3 Level I or below
Mat.hematics proficiency in 19927 Level 2 or 3 Level 4 or 5 Level 1 or below
61.3 60.9
-0.4 t
3.59 t
$ -8.2 17.27 53.1 -1 1.3 8.62 50.3* -8.3 6.80 50.6* -6.6 5.85 64.6 t f
59.8 73.5* 49.8
1.6 11.9
t
62.7 -3.3 75.1* 1.1 60.2 t
5.41 6.26
t
4.09 5.60
f
Minimum basic curriculum in high school8 Completed 67.0* Did not complete 53.4
63.9* 7.8 4.4 1 75.7* 14.5* 5.63 54.4 t f
9.0* 3.78 t t
Risk of dropping out of high school in 198g9 One or more risk factors 52.7* -6.1 3.91 No risk factors 67.1 t t
See notes at end of table.
5% 40
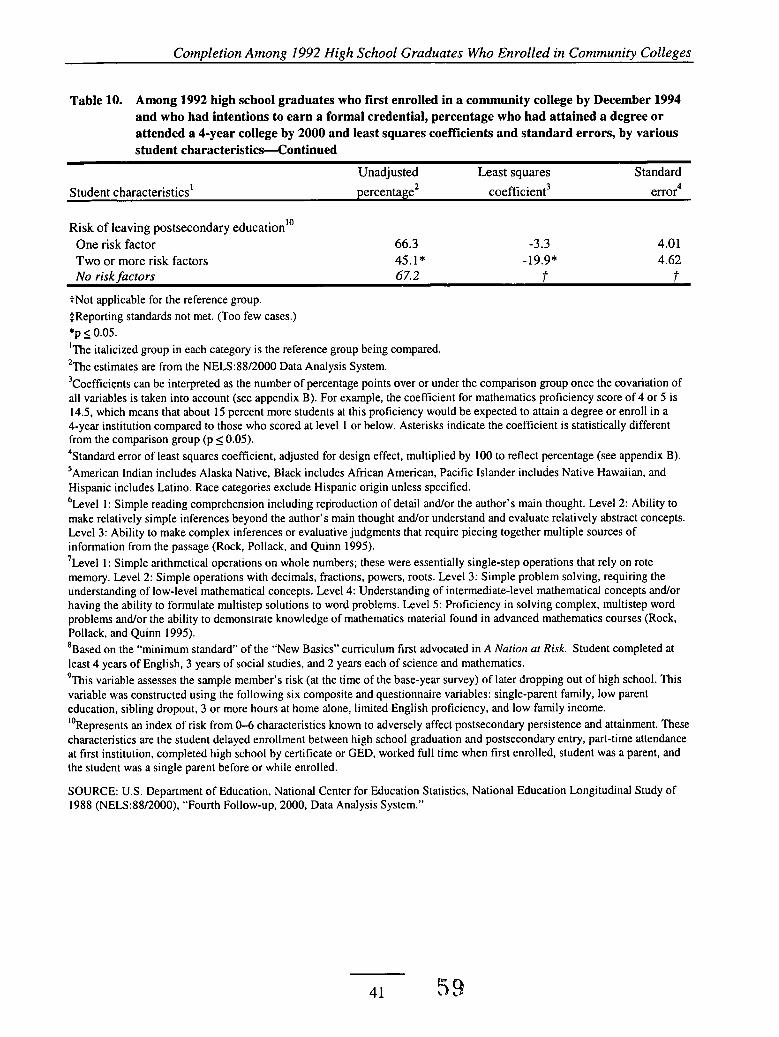
Comdetion Amonn 1992 Hinh School Graduates Who Enrolled in Community Colleges
Table 10. Among 1992 high school graduates who first enrolled in a community college by December 1994 and who had intentions to earn a formal credential, percentage who had attained a degree or attended a 4-year college by 2000 and least squares coefficients and standard errors, by various student characteristics-Continued
Standard Unadjusted Least squares Student characteristics’ percentage 2 coefficient3 error4
Risk of leaving postsecondary education” One risk factor Two or more risk factors No risk factors
66.3 45.1* 67.2
-3.3 -19.9*
t
4.01 4.62
t ?Not applicable for the reference group. $Reporting standards not met. (Too few cases.) *p 5 0.05. ‘The italicized group in each category is the reference group being compared. The estimates are from the NELS:88/2000 Data Analysis System.
3Coefficients can be interpreted as the number of percentage points over or under the comparison group once the covariation of all variables is taken into account (see appendix B). For example, the coefficient for mathematics proficiency score of 4 or 5 is 14.5, which means that about 15 percent more students at this proficiency would be expected to attain a degree or enroll in a 4-year institution compared to those who scored at level 1 or below. Asterisks indicate the coefficient is statistically different from the comparison group (p 5 0.05). 4Standard error of least squares coefficient, adjusted for design effect, multiplied by 100 to reflect percentage (see appendix B). ’American Indian includes Alaska Native, Black includes African American, Pacific Islander includes Native Hawaiian, and Hispanic includes Latino. Race categories exclude Hispanic origin unless specified. keve l 1: Simple reading comprehension including reproduction of detail and/or the author’s main thought. Level 2: Ability to make relatively simple inferences beyond the author’s main thought and/or understand and evaluate relatively abstract concepts. Level 3: Ability to make complex inferences or evaluative judgments that require piecing together multiple sources of information from the passage (Rock, Pollack, and Quinn 1995). ’Level 1: Simple arithmetical operations on whole numbers; these were essentially single-step operations that rely on rote memory. Level 2: Simple operations with decimals, fractions, powers, roots. Level 3: Simple problem solving, requiring the understanding of low-level mathematical concepts. Level 4: Understanding of intermediate-level mathematical concepts and/or having the ability to formulate multistep solutions to word problems. Level 5: Proficiency in solving complex, multistep word problems and/or the ability to demonstrate knowledge of mathematics material found in advanced mathematics courses (Rock, Pollack, and Quinn 1995). *Based on the “minimum standard” of the “New Basics” curriculum first advocated in A Nation at Risk. Student completed at least 4 years of English, 3 years of social studies, and 2 years each of science and mathematics. This variable assesses the sample member’s risk (at the time of the base-year survey) of later dropping out of high school. This
variable was constructed using the following six composite and questionnaire variables: single-parent family, low parent education, sibling dropout, 3 or more hours at home alone, limited English proficiency, and low family income. ‘%epresents an index of risk from 0-6 characteristics known to adversely affect postsecondary persistence and attainment. These characteristics are the student delayed enrollment between high school graduation and postsecondary entry, part-time attendance at first institution, completed high school by certificate or GED, worked full time when first enrolled, student was a parent, and the student was a single parent before or while enrolled.
SOURCE: U.S. Department of Education, National Center for Education Statistics, National Education Longitudinal Study of 1988 (NELS:88/2000), “Fourth Follow-up, 2000, Data Analysis System.”
2
9
41 59
Completion Among 1992 High School Graduates Who Enrolled in Community Colleges
them at risk of dropping out of high school were no longer significant. These results may in part be due to the association between reading scores or high school dropout risk and the presence of characteristics that place students at risk of not completing their postsecondary education; once postsecondary risk was held constant, the association between reading proficiency or high school dropout risk with the outcome diminished.
Finally, before controlling for the relationship among the independent variables, students from families in the highest socioeconomic (SES) quartile were more likely than their peers in the lowest quartile to have attained a credential or transferred to a 4-year institution. Also, Black and Hispanic students were less likely than White students to have attained or transferred. However, once students’ academic preparation and other variables were held constant, the socioeconomic status and race/ethnicity differences no longer remained. One explanation for this result is that low SES students as well as Black and Hispanic students are more likely to be at risk of dropping out of high school and when holding dropout risk constant, the associations between outcomes and SES and race/ethnicity variables diminished. Alternatively, the result suggests that students may be able to overcome such disadvantages with adequate academic preparation.
42 60
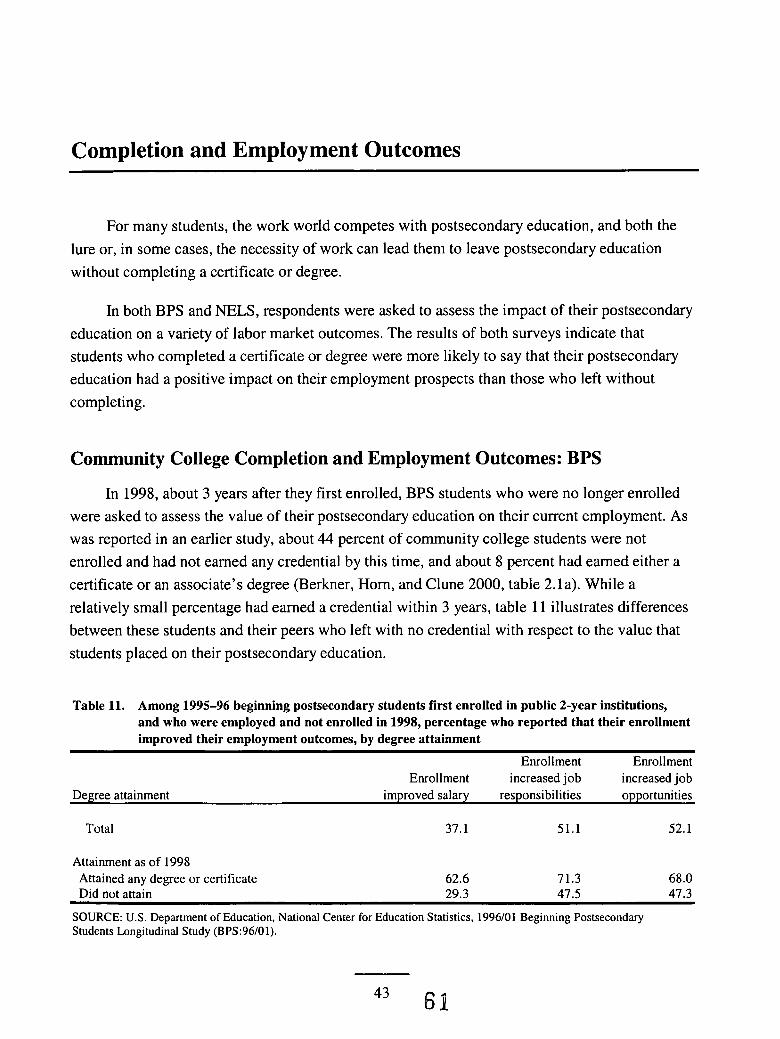
Completion and Employment Outcomes
For many students, the work world competes with postsecondary education, and both the lure or, in some cases, the necessity of work can lead them to leave postsecondary education without completing a certificate or degree.
In both BPS and NELS, respondents were asked to assess the impact of their postsecondary education on a variety of labor market outcomes. The results of both surveys indicate that students who completed a certificate or degree were more likely to say that their postsecondary education had a positive impact on their employment prospects than those who left without completing.
Community College Completion and Employment Outcomes: BPS
In 1998, about 3 years after they first enrolled, BPS students who were no longer enrolled were asked to assess the value of their postsecondary education on their current employment. As was reported in an earlier study, about 44 percent of community college students were not enrolled and had not earned any credential by this time, and about 8 percent had earned either a certificate or an associate’s degree (Berkner, Horn, and Clune 2000, table 2.la). While a relatively small percentage had earned a credential within 3 years, table 11 illustrates differences between these students and their peers who left with no credential with respect to the value that students placed on their postsecondary education.
Table 11. Among 1995-96 beginning postsecondary students first enrolled in public 2-year institutions, and who were employed and not enrolled in 1998, percentage who reported that their enrollment improved their employment outcomes, by degree attainment
Enrollment Enrollment Enrollment increased job increased job
Degree attainment improved salary responsibilities opportunities
Total 37.1 51.1 52.1
Attainment as of 1998 Attained any degree or certificate 62.6 71.3 68.0 Did not attain 29.3 47.5 47.3
SOURCE: U.S. Department of Education, National Center for Education Statistics, 1996101 Beginning Postsecondary Students Longitudinal Study (BPS:96/01).
43 6 %
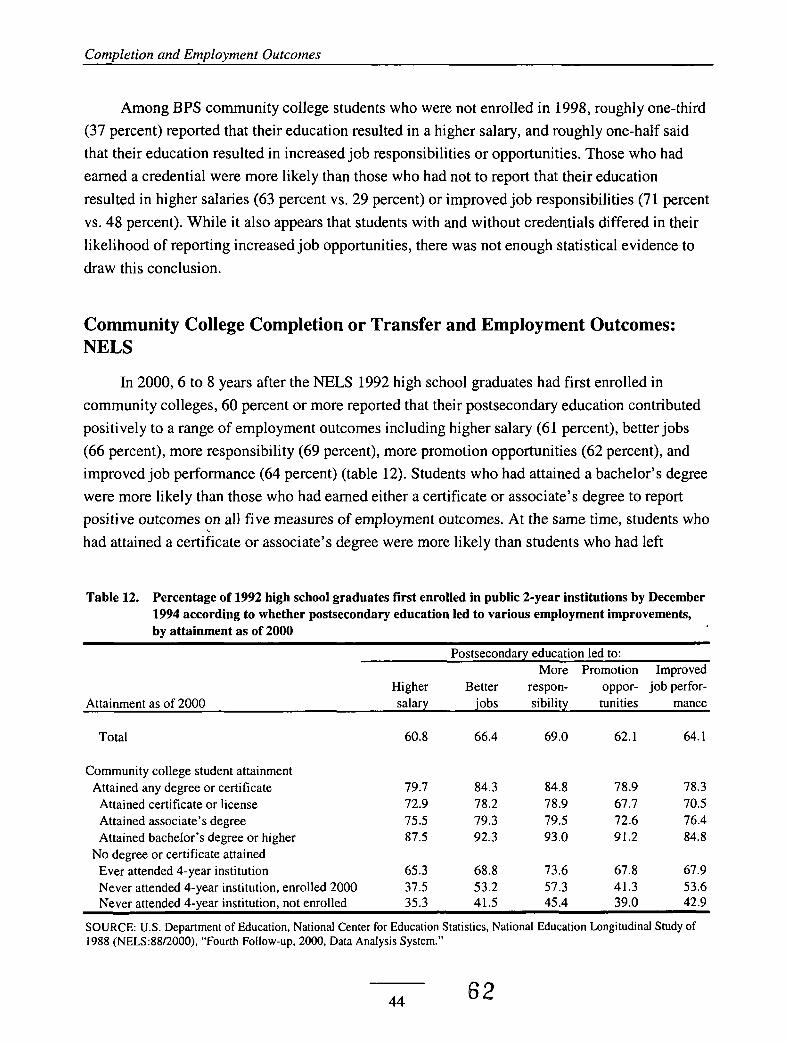
Completion and Employment Outcomes
Among BPS community college students who were not enrolled in 1998, roughly one-third (37 percent) reported that their education resulted in a higher salary, and roughly one-half said that their education resulted in increased job responsibilities or opportunities. Those who had earned a credential were more likely than those who had not to report that their education resulted in higher salaries (63 percent vs. 29 percent) or improved job responsibilities (71 percent vs. 48 percent). While it also appears that students with and without credentials differed in their likelihood of reporting increased job opportunities, there was not enough statistical evidence to draw this conclusion.
Community College Completion or Transfer and Employment Outcomes: NELS
In 2000,6 to 8 years after the NELS 1992 high school graduates had first enrolled in community colleges, 60 percent or more reported that their postsecondary education contributed positively to a range of employment outcomes including higher salary (61 percent), better jobs (66 percent), more responsibility (69 percent), more promotion opportunities (62 percent), and improved job performance (64 percent) (table 12). Students who had attained a bachelor’s degree were more likely than those who had earned either a certificate or associate’s degree to report positive outcomes on all five measures of employment outcomes. At the same time, students who had attained a certificate or associate’s degree were more likely than students who had left
Table 12. Percentage of 1992 high school graduates first enrolled in public 2-year institutions by December 1994 according to whether postsecondary education led to various employment improvements, by attainment as of 2000
Postsecondary education led to: More Promotion Improved
Higher Better respon- oppor- job perfor- Attainment as of 2000 salary jobs sibility tunities mance
Total 60.8 66.4 69.0 62.1 64.1
Community college student attainment Attained any degree or certificate 79.7 84.3 84.8 78.9 78.3
Attained certificate or license 72.9 78.2 78.9 67.7 70.5 Attained associate’s degree 75.5 79.3 79.5 72.6 76.4 Attained bachelor’s degree or higher 87.5 92.3 93.0 91.2 84.8
Ever attended 4-year institution 65.3 68.8 73.6 67.8 67.9 Never attended 4-year institution, enrolled 2000 37.5 53.2 57.3 41.3 53.6 Never attended 4-year institution, not enrolled 35.3 41.5 45.4 39.0 42.9
No degree or certificate attained
SOURCE: U.S. Department of Education, National Center for Education Statistics, National Education Longitudinal Study of I988 (NELS:88/2000), “Fourth Follow-up, 2000, Data Analysis System.”
44 62
Completion and Employment Outcomes
postsecondary education with no credential and had never attended a 4-year institution to report positive impacts. Among students who left without a degree, those who had attended a 4-year institution were more likely than those who had never attended to report positive impacts on employment outcomes.
In summary, students who had attained a formal credential were more likely than students who had left with no degree or certificate to cite a positive effect on employment. However, students who had transferred to a 4-year institution and attended without attaining any credential were more likely than students who had left 2-year institutions without any credential to report that their postsecondary education contributed positively to their employment outcomes.
45 63
Summary and Conclusions
In community colleges, attainment of a certificate or degree (including transfer to a 4-year institution) appears to be an appropriate measure for about 90 percent of students beginning their postsecondary education in public 2-year institutions. Although educational objectives vary among students enrolled in community colleges-older students, for example, are more likely to pursue a certificate while younger students are more likely to seek an associate’s degree-most community college students say that they desire a formal credential, either from the community college or through transfer to a 4-year institution.
Controlling for student objective and ignoring those who do not seek a certificate or degree, between 40 and 50 percent of students who first enrolled in a community college had attained a formal credential within the time frame of the two surveys studied (6 to 8 years). An additional 12 to 13 percent had not attained a credential but had transferred to a 4-year institution.
For students who had completed a degree, it took them longer than might be expected in large part because they attended on a part-time basis. For example, students in associate’s degree programs took an average of 3 1/2 years to complete and many of those in bachelor’s degree programs were still enrolled after 6 years.
The reasons for not completing are complex, including poor academic preparation and a significant time commitment required to complete a credential, as well as other factors such as family responsibilities that increase the risk that students will not achieve their postsecondary education objectives. Better preparation and fewer risk factors were associated with higher rates of completion.
r’inally, while many students who leave community colleges without completing a credential report that their postsecondary experience favorably affected their labor market opportunities, students who completed were more likely to report positive impacts than students who did not.
References
Berkner, L., and Chavez, L. (1997). Access to Postsecondary Education for the 1992 High School Graduates (NCES 98-105). U.S. Department of Education, National Center for Education Statistics. Washington, DC: U.S. Government Printing Office.
Berkner, L.,'He, S., and Cataldi, E. (2002). Descriptive Summary of 1995-96 Beginning Postsecondary Students: Six Years Later (NCES 2003-15 1). U.S. Department of Education, National Center for Education Statistics. Washington, DC: U.S. Government Printing Office.
Berkner, L., Horn, L., and Clune, M. (2000). Descriptive Summary of 1995-96 Beginning Postsecondary Students: Three Years Later (NCES 2000-1 54). U.S. Department of Education, National Center for Education Statistics. Washington, DC: U.S. Government Printing Office.
Cohen, A., and Brawer, F. (2002). The American Community College (4th ed.). San Francisco: Jossey-B ass.
Grubb, N. (1999). Honored But Invisible. New York: Routledge.
Horn, L., Peter, K., and Rooney, K. (2002). Profile of Undergraduates in US. Postsecondary Institutions: 1999-2000 (NCES 2002-168). U.S. Department of Education, National Center for Education Statistics. Washington, DC: U.S. Government Printing Office.
National Commission on Excellence in Education. (1983). A Nation at Risk: The Imperative for Educational Reform. Washington, DC: Author.
Phillipe, K.A., and Patton, M. (1999). National Profile of Community Colleges: Trends and Statistics (3rd ed.). Washington, DC: Community College Press, American Association of Community Colleges.
Rock, D.A., Pollack, J.M., and Quinn, P. (1995). Psychometric Report for the NELS:88 Base Year Through Second Follow-up (NELS 95-382). U.S. Department of Education, National Center for Education Statistics. Washington, DC: U.S. Government Printing Office.
49 65
Appendix A-Glossary
This glossary describes the variables used in this report. The items were taken directly from the NELS:88/2000, the NPSAS:2000, and the BPS:96/01 Data Analysis Systems (DAS), an NCES software application that generates tables from the data (see appendix B for a description of the DAS). The glossary index lists the variables as they appear in the report for each survey. The glossary is in alphabetical order by variable name (displayed along the right-hand column).
GLOSSARY INDEX POSTSECONDARY EDUCATION CHARACTERISTICS
BPS Degree expected at first institution .............. DGEXPY 1 First institution level and control ................... ITNPSAS Enrollment intensity first month enrolled ... ENINFMNP First degree program 1995-96 ........................ PGMlY 1 Purpose for enrolling 1995-96 ...................... .PGM6Y 1 Transfer or degree expectation 1995-96 ......... PGM7Y 1 Enrollment outcome as of 2001 ................... PROUT2B Cumulative persistence outcome
Transfer institution types 2001 ................... TRINTY2B Average months enrolled to degree ........... ENNUHD2B Average elapsed months to degree .............. ELFMHI2B
1997-98 .................................................. PROUTYX3
NELS Enrollment status at first institution ........... ENRLSTAl Community college student attainment ........ .F4CCDEG Date first attended postsecondary education ....................................................... F4EFMY
Sector of first institution attended ................ F4EFSECT Months between high school graduation and postsecondary attendance ..................... HSTOPSE
NPSAS Institution type .............................................. AIDSECT Year first enrolled in postsecondary education.. .................................................. .PSECTYR
EWLOYMENT OUTCOMES BPS Enrollment improved job opportunity .......... JFEOPPB 1 Enrollment increased responsibility ............. JFERESB 1 Enrollment improved salary ......................... IFESALB 1
NELS Postsecondary education impact on salary ........................................................... F4EHSAL
Postsecondary education impact on jobs ........ F4EJOBS Postsecondary education impact on job performance ................................................. F4EPERF
Postsecondary education impact on
Postsecondary education impact on responsibility ............................................... F4ERESP
promotion opportunities ............................. F4EPROM
STUDENT CHARACTERISTICS BPS Age during first month enrolled .................... .SBAGFM Gender ....................................................... SBGENDER Race/ethnicity (including Hispanic) ............... .SBRACE Postsecondary risk index 1995-96 .............. SBRSKlY 1
NELS 1988 risk of dropping out of high school ... BYATRISK 4-year college qualification composite ........ CQCOMV2 Mathematics proficiency 1992 ................... F22XMPRO Reading proficiency 1992 ........................... F22XRPRO Highest level of education expected
1992 ............................................................ RASPIRE Minimum basic curriculum 1992 .............. F2RNWB5A Socioeconomic status ..................................... F2SESlC Marital status 1994 ....................................... F3MARST Race/ethnicity 1994 ......................................... F3RACE Gender as of 1994 .............................................. F3SEX Number of children 1994 .......................... NUMCHILD Postsecondary risk factors in 1988 .............. RISKINDX
NPSAS Age as of 12/3 1/99 ................................................. AGE Gender ............................................................ GENDER
WEIGHT VARIABLES BPS Longitudinal weight 96/2001 ........................ BOlLWT2 Longitudinal weight 96/98 (for employment outcomes) ................................. B98AWT
NELS High school graduate weight 1992 ............. F3QWT92G
NPSAS Study weight ............................................... STUDYWT
6 6 51
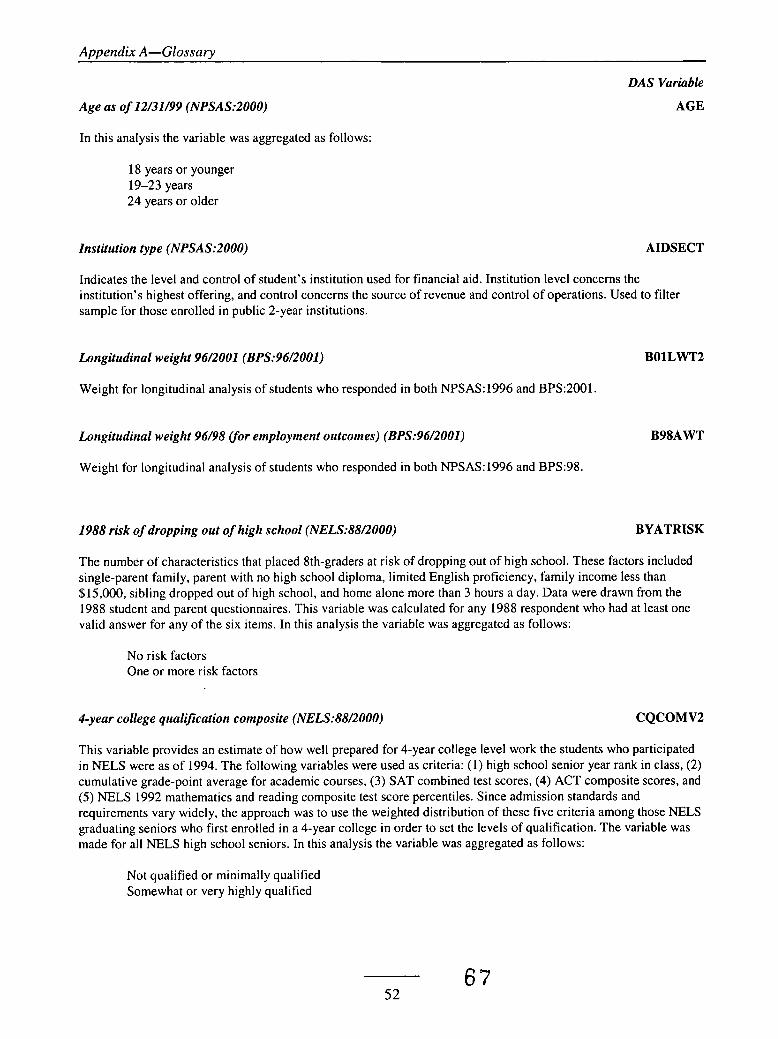
Amendix A-Glossarv
Age as of 12/31/99 (NPSAS:2000)
DAS Variable
AGE
In this analysis the variable was aggregated as follows:
18 years or younger 19-23 years 24 years or older
Institution type (NPSAS:2000) AIDSECT
Indicates the level and control of student’s institution used for financial aid. Institution level concerns the institution’s highest offering, and control concerns the source of revenue and control of operations. Used to filter sample for those enrolled in public 2-year institutions.
Longitudinal weight 96/200I (BPS:96/2001) B01 LWT2
Weight for longitudinal analysis of students who responded in both NPSAS:1996 and BPS:2001.
Longitudinal weight 96/98 lfor employment outcomes) (BPS:96/2001) B98AWT
Weight for longitudinal analysis of students who responded in both NPSAS:1996 and BPS:98.
1988 risk of dropping out of high school (NELS:88/2000) BYATRISK
The number of characteristics that placed 8th-graders at risk of dropping out of high school. These factors included single-parent family, parent with no high school diploma, limited English proficiency, family income less than $15,000, sibling dropped out of high school, and home alone more than 3 hours a day. Data were drawn from the 1988 student and parent questionnaires. This variable was calculated for any 1988 respondent who had at least one valid answer for any of the six items. In this analysis the variable was aggregated as follows:
No risk factors One or more risk factors
4-year college qualification composite (NELS:88/2000) CQCOMV2
This variable provides an estimate of how well prepared for 4-year college level work the students who participated in NELS were as of 1994. The following variables were used as criteria: (1) high school senior year rank in class, (2) cumulative grade-point average for academic courses, (3) SAT combined test scores, (4) ACT composite scores, and (5) NELS 1992 mathematics and reading composite test score percentiles. Since admission standards and requirements vary widely, the approach was to use the weighted distribution of these five criteria among those NELS graduating seniors who first enrolled in a 4-year college in order to set the levels of qualification. The variable was made for all NELS high school seniors. In this analysis the variable was aggregated as follows:
Not qualified or minimally qualified Somewhat or very highly qualified
67’ 52

Appendix A-Glossary
DAS Variable
DGEXPYl Degree expected at first institution (BPS:96/2001)
Highest degree expected at the first institution attended in 1995-96. Responses for any degree of bachelor’s or higher plus those planning to transfer to a 4-year institution were coded as bachelor’s/transfer. Those planning no degree at that institution or planning to transfer from one less-than-4-year institution to another were also coded as having no degree expectation. Responses of higher degrees than were offered at the institution were assumed to be planning to transfer. In this analysis the variable was aggregated as follows:
None Any credential or transfer Certificate Associate’s degree Bachelor’s degree or transfer to 4-year
Average elapsed months to degree (BPS:96/2001) ELFMHI2B
For students who attained a degree or certificate, the average number of months elapsed between first enrollment and the highest degree earned.
Enrollment intensity first month enrolled (BPS:96/2001) ENINFMNP
Enrollment intensity at first institution in the first month enrolled. Derived for all respondents.
Full-time Part-time
Average months enrolled to degree (BPS:96/2001) ENNUHDZB
For students who attained a degree or certificate, the average number of months enrolled between first enrollment and the highest degree earned.
Enrollment status at first institution (NELS:88/2000) ENRLSTAl
Student response to the question “While attending your institution during this period, were you enrolled full-time, half-time but less than full-time, or less than half-time?’ The question was asked of students enrolled in postsecondary education during the 1994 followup. If students were no longer enrolled or they had never enrolled in postsecondary education, they were not asked the question. In this analysis the variable was aggregated as follows:
Full-time Part-time
53 68
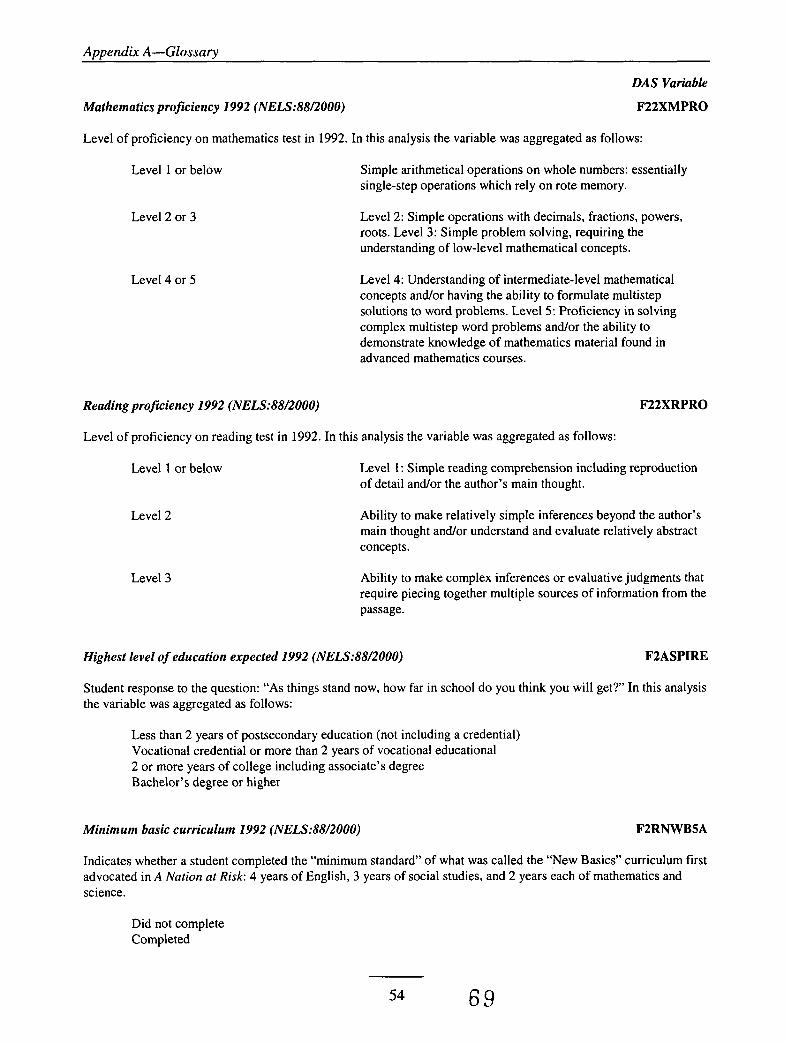
Appendix A-Glossary
DAS Variable
Mathematics proficiency 2992 (NELS:88/2000) F22XMPRO
Level of proficiency on mathematics test in 1992. In this analysis the variable was aggregated as follows:
Level 1 or below
Level 2 or 3
Level 4 or 5
Simple arithmetical operations on whole numbers: essentially single-step operations which rely on rote memory.
Level 2: Simple operations with decimals, fractions, powers, roots. Level 3: Simple problem solving, requiring the understanding of low-level mathematical concepts.
Level 4: Understanding of intermediate-level mathematical concepts and/or having the ability to formulate multistep solutions to word problems. Level 5: Proficiency in solving complex multistep word problems and/or the ability to demonstrate knowledge of mathematics material found in advanced mathematics courses.
Reading proficiency 1992 (NELS:88/2000) F22XRPRO
Level of proficiency on reading test in 1992. In this analysis the variable was aggregated as follows:
Level 1 or below
Level 2
Level 3
Level 1 : Simple reading comprehension including reproduction of detail and/or the author’s main thought.
Ability to make relatively simple inferences beyond the author’s main thought and/or understand and evaluate relatively abstract concepts.
Ability to make complex inferences or evaluative judgments that require piecing together multiple sources of information from the passage.
Highest level of education expected 1992 (NELS:88/2000) F2ASPIRE
Student response to the question: “As things stand now, how far in school do you think you will get?” In this analysis the variable was aggregated as follows:
Less than 2 years of postsecondary education (not including a credential) Vocational credential or more than 2 years of vocational educational 2 or more years of college including associate’s degree Bachelor’s degree or higher
Minimum basic curriculum 1992 (NELS:88/2000) FZRNWBSA
Indicates whether a student completed the “minimum standard” of what was called the “New Basics” curriculum first advocated in A Nation at Risk: 4 years of English, 3 years of social studies, and 2 years each of mathematics and science.
Did not complete Completed
54 6 9

Appendix A-Glossary
DAS Variable
Socioeconomic status (NELS:88/2000) F2SESlC
Socioeconomic status was estimated in 1992 using 1988 parent questionnaire data, 1988 student questionnaire data, or New Student Supplement data from subsequent rounds. In this analysis the percentiles were aggregated as follows:
Low quartile Middle quartiles High quartile
Marital status 1994 (NELS:88/2000) F3MARST
Student response to the question: “Are you currently single; never married; married; divorcedlseparated; widowed; or not married but living in a marriage-like relationship?’ In this analysis the variable was aggregated as follows:
Married Not married
High school graduate weight 1992 (NELS:88/2000) F3QWT92G
Analysis weight used for the NELS sample that represents respondents who received a high school diploma between September 1, 1991 and August 3 1, 1992 or respondents whose diploma receipt date is not known but began their postsecondary education during the period of June 1992 through October 1992.
Race/ethnicity 1994 (NELS:88/2000) F3RACE
Student response to the question: “What is your racial or ethnic background?”
Asian or Pacific Islander
Hispanic, regardless of race
Black, not of Hispanic origin
White, not of Hispanic origin
American IndiadAlaska Native
A person having origins in any of the peoples of the Far East, Southeast Asia, the Indian subcontinent, or the Pacific Islands. This includes people from China, Japan, Korea, the Philippine Islands, India, and Vietnam, and all Pacific Islands, including Hawaii and Samoa.
A person of Mexican, Puerto Rican, Cuban, Central or South American, or other Spanish culture or origin, regardless of race.
A person having origins in any of the black racial groups of Africa.
A person having origins in any of the original peoples of Europe, North Africa, or the Middle East.
A person having origins in any of the original peoples of North America and who maintains cultural identification through tribal affiliation or community recognition.
Other A person having origins in a race not listed above.
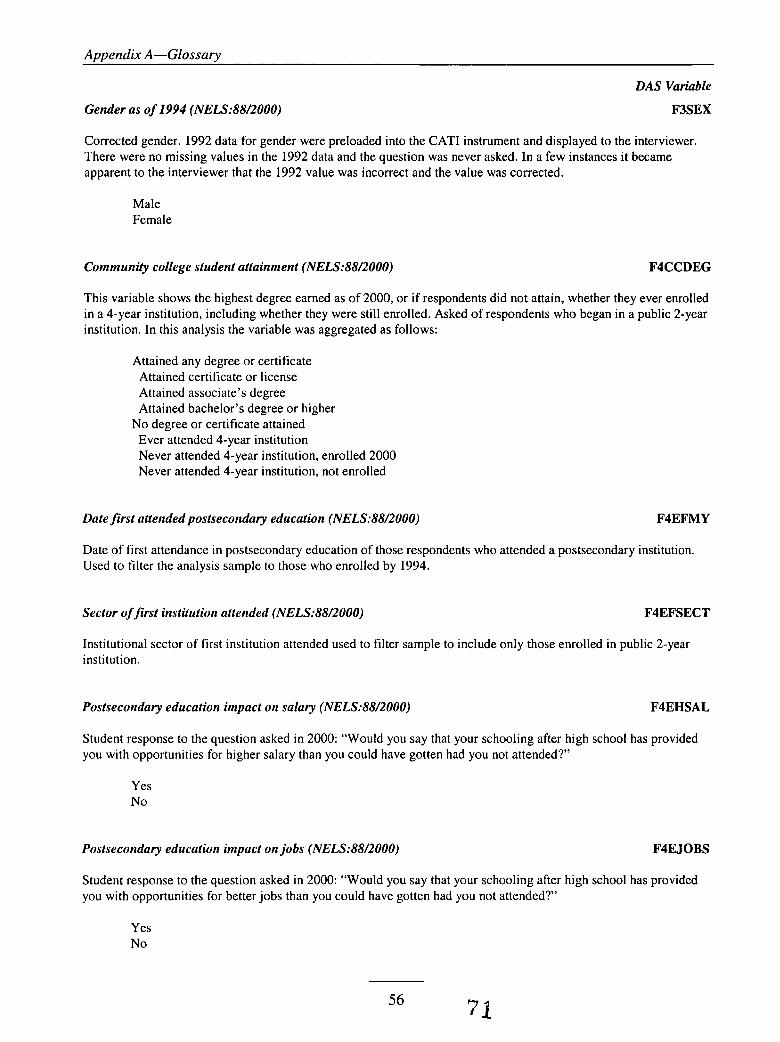
Appendix A-Glossary
DAS Variable
F3SEX Gender as of 1994 (NELS:88/2000)
Corrected gender. 1992 data for gender were preloaded into the CAT1 instrument and displayed to the interviewer. There were no missing values in the 1992 data and the question was never asked. In a few instances it became apparent to the interviewer that the 1992 value was incorrect and the value was corrected.
Male Female
Community college student attainment (NELS:88/2000) F4CCDEG
This variable shows the highest degree earned as of 2000, or if respondents did not attain, whether they ever enrolled in a 4-year institution, including whether they were still enrolled. Asked of respondents who began in a public 2-year institution. In this analysis the variable was aggregated as follows:
Attained any degree or certificate Attained certificate or license Attained associate’s degree Attained bachelor’s degree or higher
No degree or certificate attained Ever attended 4-year institution Never attended 4-year institution, enrolled 2000 Never attended 4-year institution, not enrolled
Date first attended postsecondary education (NELS:88/2000) F4EFMY
Date of first attendance in postsecondary education of those respondents who attended a postsecondary institution. Used to filter the analysis sample to those who enrolled by 1994.
Sector of first institution attended (NELS:88/2000) F4EFSECT
Institutional sector of first institution attended used to filter sample to include only those enrolled in public 2-year institution.
Postsecondary education impact on salary (NELS:88/2000) F4EHSAL
Student response to the question asked in 2000: “Would you say that your schooling after high school has provided you with opportunities for higher salary than you could have gotten had you not attended?”
Yes No
Postsecondary education impact on jobs (NELS:88/2000) F4EJOBS
Student response to the question asked in 2000: “Would you say that your schooling after high school has provided you with opportunities for better jobs than you could have gotten had you not attended?”
Yes No
56

Appendix A-Glossary
DAS Variable
F4EPERF Postsecondary education impact on job performance (NELS:88/2000)
Student response to the question asked in 2000: “Would you say that your schooling after high school has provided you with better job performance than you could have gotten had you not attended?”
Yes No
Postsecondary education impact on promotion opportunities (NELS:88/2000) F4EPROM
Student response to the question asked in 2000: “Would you say that your schooling after high school has provided you with opportunities for more promotions than you could have gotten had you not attended?’
Yes No
Postsecondary education impact on responsibility (NELS:88/2000) F4ERESP
Student response to the question asked in 2000: “Would you say that your schooling after high school has provided you with more responsibility than you could have gotten had you not attended?”
Yes No
Gender (NPSAS:2000) GENDER
Male Female
Months between high school graduation and postsecondary attendance (NELS:88/2000) HSTOPSE
The number of elapsed months between the date of high school graduation and enrollment in postsecondary education. In this analysis the variable was aggregated as follows:
0 to 4 months 5-7 months More than 7 (up to 24 months)
First institution level and control (BPS:96/2001) ITNPSAS
Level and control of the institution used to filter sample to include only those enrolled in public 2-year institutions.
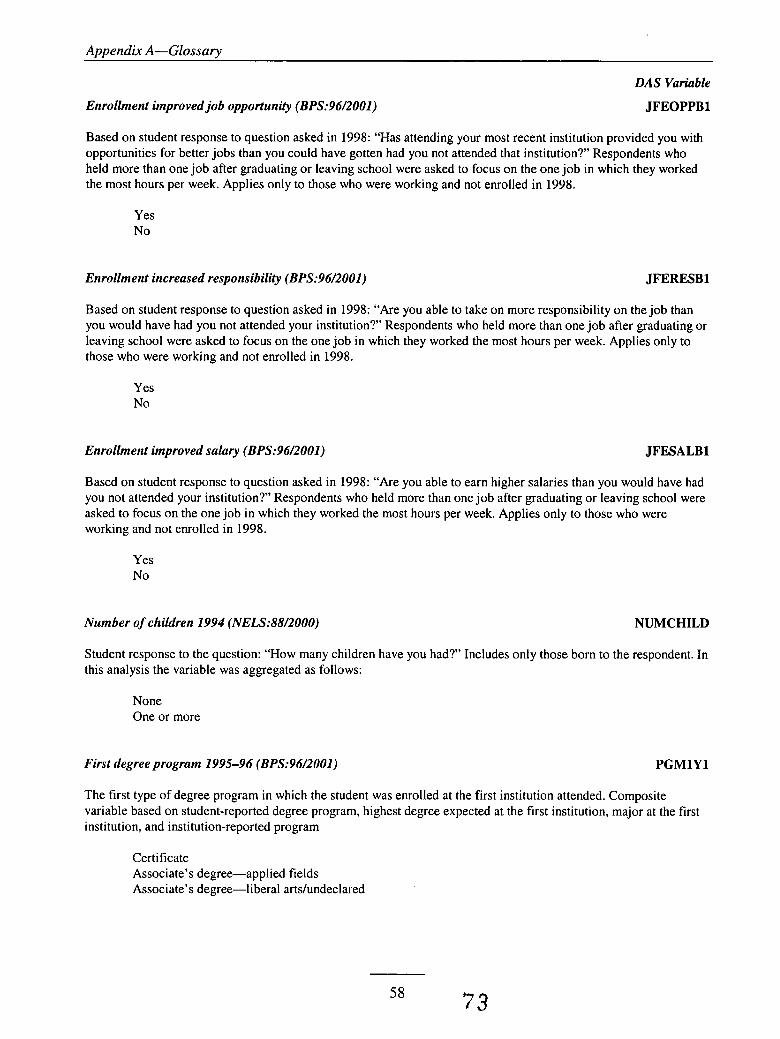
Appendix A-Glossary
DAS Variable
JFEOPPBl Enrollment improved job opportunity (BPS:96/2001)
Based on student response to question asked in 1998: “Has attending your most recent institution provided you with opportunities for better jobs than you could have gotten had you not attended that institution?” Respondents who held more than one job after graduating or leaving school were asked to focus on the one job in which they worked the most hours per week. Applies only to those who were working and not enrolled in 1998.
Yes No
Enrollment increased responsibility (BPS:96/2001) JFERESBl
Based on student response to question asked in 1998: “Are you able to take on more responsibility on the job than you would have had you not attended your institution?” Respondents who held more than one job after graduating or leaving school were asked to focus on the one job in which they worked the most hours per week. Applies only to those who were working and not enrolled in 1998.
Yes No
Enrollment improved salary (BPS:96/2001) JFESA LB 1
Based on student response to question asked in 1998: “Are you able to earn higher salaries than you would have had you not attended your institution?’ Respondents who held more than one job after graduating or leaving school were asked to focus on the one job in which they worked the most hours per week. Applies only to those who were working and not enrolled in 1998.
Yes No
Number of chikiren 1994 (NELS:88/2000) NUMCHILD
Student response to the question: “How many children have you had?” Includes only those born to the respondent. In this analysis the variable was aggregated as follows:
None One or more
First degree program 1995-96 (BPS:96/2001) PGMlYl
The first type of degree program in which the student was enrolled at the first institution attended. Composite variable based on student-reported degree program, highest degree expected at the first institution, major at the first institution, and institution-reported program
Certificate Associate’s degree-applied fields Associate’s degree-liberal artshndeclared
58 73
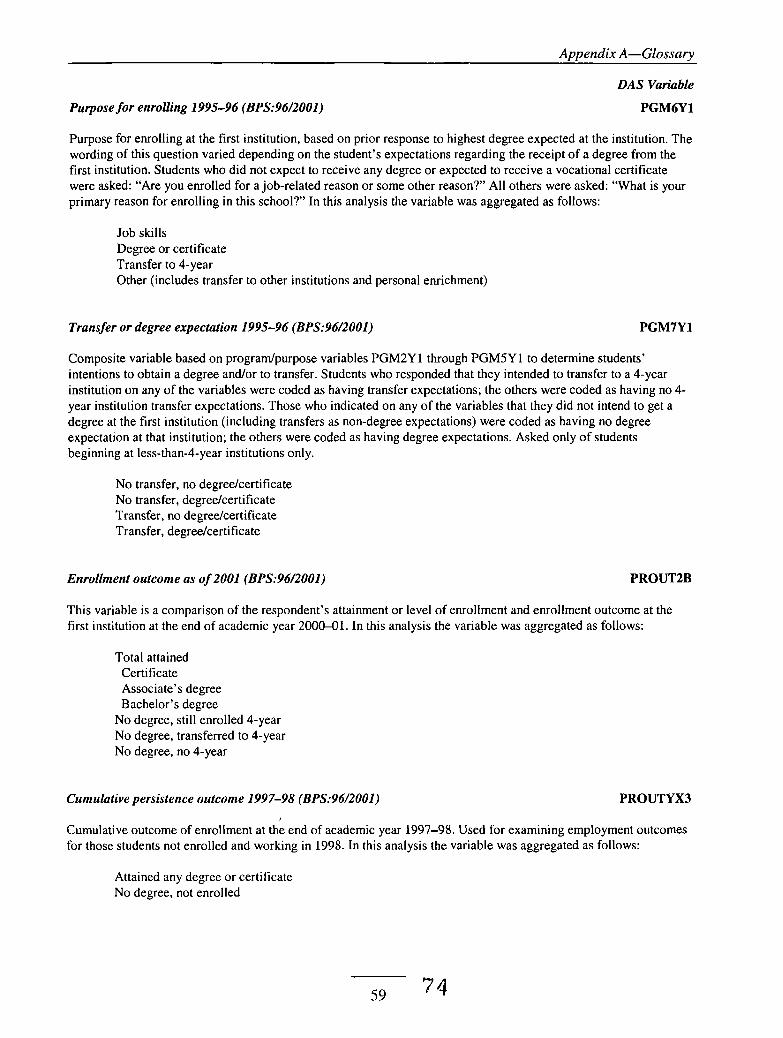
Appendix A-Glossary
Purpose for enrolling 1995-96 (BPS:96/2001)
DAS Variable
PGM6Yl
Purpose for enrolling at the first institution, based on prior response to highest degree expected at the institution. The wording of this question varied depending on the student’s expectations regarding the receipt of a degree from the first institution. Students who did not expect to receive any degree or expected to receive a vocational certificate were asked: “Are you enrolled for a job-related reason or some other reason?” All others were asked: “What is your primary reason for enrolling in this school?” In this analysis the variable was aggregated as follows:
Job skills Degree or certificate Transfer to 4-year Other (includes transfer to other institutions and personal enrichment)
Transfer or degree expectation 1995-96 (BPS:96/2001) PGM7Yl
Composite variable based on progradpurpose variables PGM2Y 1 through PGMSY 1 to determine students’ intentions to obtain a degree and/or to transfer. Students who responded that they intended to transfer to a 4-year institution on any of the variables were coded as having transfer expectations; the others were coded as having no 4- year institution transfer expectations. Those who indicated on any of the variables that they did not intend to get a degree at the first institution (including transfers as non-degree expectations) were coded as having no degree expectation at that institution; the others were coded as having degree expectations. Asked only of students beginning at less-than-4-year institutions only.
No transfer, no degreekertificate No transfer, degreekertificate Transfer, no degreekertificate Transfer, degreekertificate
Enrollment outcome as of 2001 (BPS:96/2001) PROUTZB
This variable is a comparison of the respondent’s attainment or level of enrollment and enrollment outcome at the first institution at the end of academic year 2000-01. In this analysis the variable was aggregated as follows:
Total attained Certificate Associate’s degree Bachelor’s degree
No degree, still enrolled 4-year No degree, transferred to 4-year No degree, no 4-year
PROUTYX3 Cumulative persistence outcome 1997-98 (BPS:96/2001)
Cumulative outcome of enrollment at the end of academic year 1997-98. Used for examining employment outcomes for those students not enrolled and working in 1998. In this analysis the variable was aggregated as follows:
Attained any degree or certificate No degree, not enrolled
Appendix A-Glossary
DAS Variable
PSECTY R Yearfirst enrolled in postsecondary education (NPSAS:2000)
Year that the student first enrolled in postsecondary education. In this analysis the variable was aggregated as follows:
First enrolled before 1999-2000 First enrolled in 1999-2000
Postsecondary risk factors in 1988 (NELS:88/2000) RISKINDX
Represents an index of risk from 0-6 characteristics associated with not completing postsecondary education. Characteristics are delayed enrollment between high school graduation and postsecondary entry, part-time attendance at first institution, completed high school by certificate or GED, worked full time when first enrolled, if respondent has a child, and single parent before or while enrolled. BPS risk variable has an.additional characteristic-being financially independent-which applies primarily to adult students 24 years or older. In this analysis the variable was aggregated as follows:
No risk factors One risk factor Two or more risk factors
Age during first month enrolled (BPS:96/2001) SBAGFM
Respondent’s age, calculated from date of birth and first month enrolled, on the first day of the first month enrolled in postsecondary education. In this analysis the variable was aggregated as follows:
18 years or younger 19-23 years 24 years or older
Gender (BPS:96/2001) SBGENDER
Student gender based on student report, institution-reported gender, or gender reported on the FAFSA.
Male Female
7 5 60
Appendix A-Glossary
DAS Variable
Race/ethnicity (including Hispanic) (BPS:96/2001) SBRACE
Race/ethnicity (including Hispanic). Student response to CAT1 question: “What is your race?”
White, non-Hispanic See F3RACE
Black, nowHispanic See F3RACE
Hispanic See F3RACE
AsiadPacific Islander See F3RACE
American IndiadAlaskan Native See F3RACE
Other See F3RACE
Postsecondary risk index 1995-96 (BPS:96/2001) SBRSKlY 1
Represents an index of risk from 0-7 characteristics associated with not completing postsecondary education. Characteristics include: delayed enrollment, high school dropout or GED recipient, part-time enrollment, financial independence (for financial aid purposes), having dependents other than spouse, single-parent status, and working full time while enrolled (35 hours or more). In this analysis the variable was aggregated as follows:
None One or more
Study weight (NPSAS:2000) STUDYWT
Weight for all students in the study, including those without a telephone interview.
Transfer institution types 2001 (BPS:96/2001) TRINTYZB
Indicates whether or not the respondents had ever transferred: if yes, had they ever transferred to 4-year or public 2- year institutions. Four-year institutions included public, private not-for-profit, and private for-profit institutions. In this analysis the variable was aggregated as follows:
Transferred to 4-year institution Transferred to other institution or no transfer
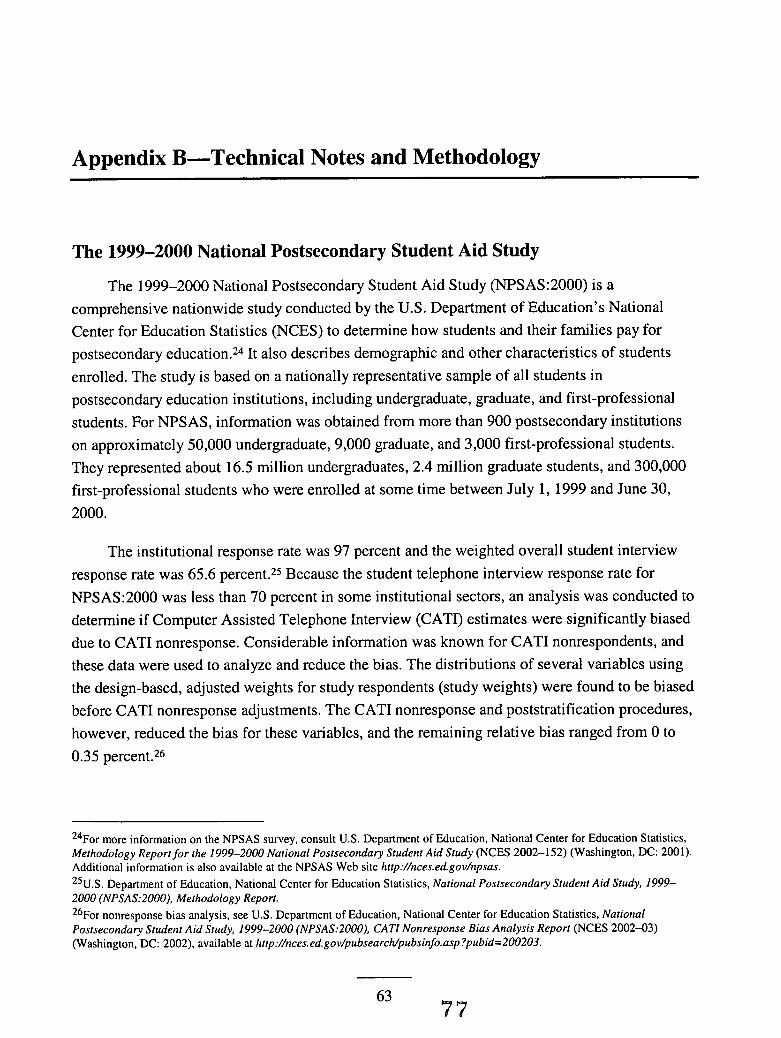
Appendix B-Technical Notes and Methodology
The 1999-2000 National Postsecondary Student Aid Study
The 1999-2000 National Postsecondary Student Aid Study (NPSAS:2000) is a comprehensive nationwide study conducted by the U.S. Department of Education's National Center for Education Statistics (NCES) to determine how students and their families pay for postsecondary education.24 It also describes demographic and other characteristics of students enrolled. The study is based on a nationally representative sample of all students in postsecondary education institutions, including undergraduate, graduate, and first-professional students. For NPSAS, information was obtained from more than 900 postsecondary institutions on approximately 50,000 undergraduate, 9,000 graduate, and 3,000 first-professional students. They represented about 16.5 million undergraduates, 2.4 million graduate students, and 300,000 first-professional students who were enrolled at some time between July 1, 1999 and June 30, 2000.
The institutional response rate was 97 percent and the weighted overall student interview response rate was 65.6 percent.25 Because the student telephone interview response rate for NPSAS:2000 was less than 70 percent in some institutional sectors, an analysis was conducted to determine if Computer Assisted Telephone Interview (CATI) estimates were significantly biased due to CATI nonresponse. Considerable information was known for CATI nonrespondents, and these data were used to analyze and reduce the bias. The distributions of several variables using the design-based, adjusted weights for study respondents (study weights) were found to be biased before CATI nonresponse adjustments. The CATI nonresponse and poststratification procedures, however, reduced the bias for these variables, and the remaining relative bias ranged from 0 to 0.35 percent.26
24F0r more information on the NPSAS survey, consult U.S. Department of Education, National Center for Education Statistics, Methodology Report for the 1999-2000 National Postsecondary Student Aid Study (NCES 2002-152) (Washington, DC: 2001). Additional information is also available at the NPSAS Web site http://nces.ed.gov/npsas. 25U.S. Department of Education, National Center for Education Statistics, National Postsecondary Student Aid Study, 1999- 2000 (NPSAS:2000). Methodology Report. 26For nonresponse bias analysis, see U.S. Department of Education, National Center for Education Statistics, National Postsecondary Student Aid Study, 1999-2000 (NPSAS:2000), CAT1 Nonresponse Bias Analysis Report (NCES 2002-03) (Washington, DC: 2002), available at http://nces.ed.gov/pubsearcWpubsinfo.asp?pubid=200203.
'97 63
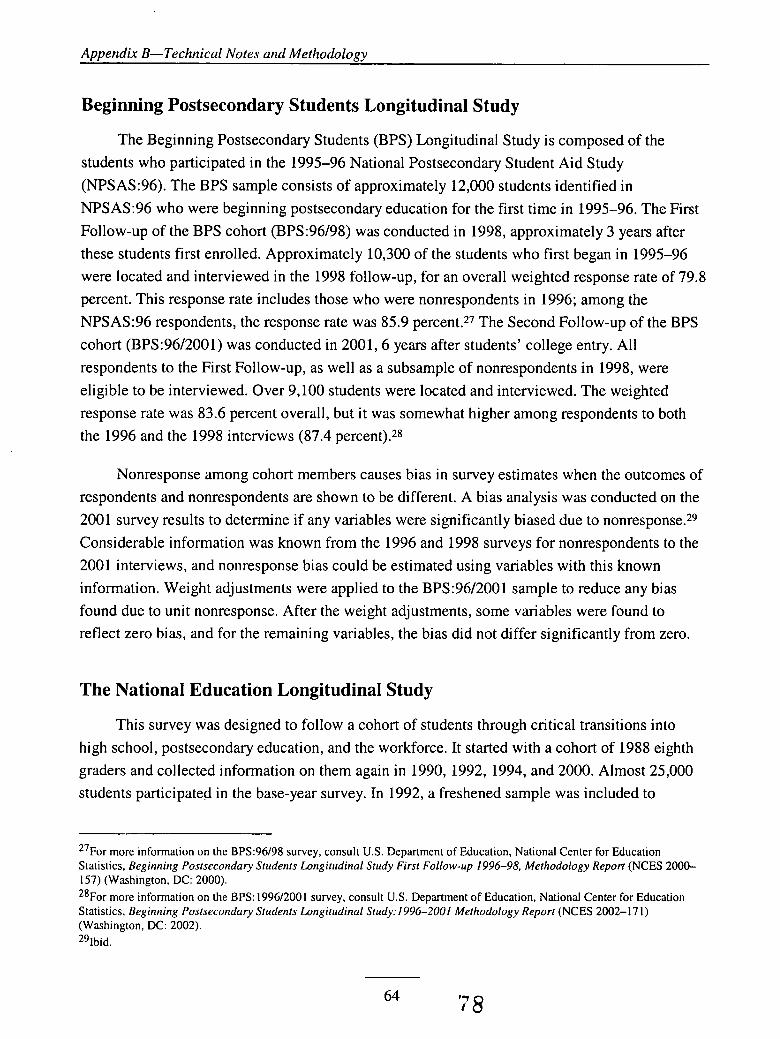
Appendix B-Technical Notes and Methodology
Beginning Postsecondary Students Longitudinal Study
The Beginning Postsecondary Students (BPS) Longitudinal Study is composed of the students who participated in the 1995-96 National Postsecondary Student Aid Study (NPSAS:96). The BPS sample consists of approximately 12,000 students identified in NPSAS:96 who were beginning postsecondary education for the first time in 1995-96. The First Follow-up of the BPS cohort (BPS:96/98) was conducted in 1998, approximately 3 years after these students first enrolled. Approximately 10,300 of the students who first began in 1995-96 were located and interviewed in the 1998 follow-up, for an overall weighted response rate of 79.8 percent. This response rate includes those who were nonrespondents in 1996; among the NPSAS:96 respondents, the response rate was 85.9 percent.27 The Second Follow-up of the BPS cohort (BPS:96/2001) was conducted in 2001,6 years after students' college entry. All respondents to the First Follow-up, as well as a subsample of nonrespondents in 1998, were eligible to be interviewed. Over 9,100 students were located and interviewed. The weighted response rate was 83.6 percent overall, but it was somewhat higher among respondents to both the 1996 and the 1998 interviews (87.4 percent).2*
Nonresponse among cohort members causes bias in survey estimates when the outcomes of respondents and nonrespondents are shown to be different. A bias analysis was conducted on the 2001 survey results to determine if any variables were significantly biased due to nonresponse.29 Considerable information was known from the 1996 and 1998 surveys for nonrespondents to the 2001 interviews, and nonresponse bias could be estimated using variables with this known information. Weight adjustments were applied to the BPS:96/2001 sample to reduce any bias found due to unit nonresponse. After the weight adjustments, some variables were found to reflect zero bias, and for the remaining variables, the bias did not differ significantly from zero.
The National Education Longitudinal Study
This survey was designed to follow a cohort of students through critical transitions into high school, postsecondary education, and the workforce. It started with a cohort of 1988 eighth graders and collected information on them again in 1990, 1992, 1994, and 2000. Almost 25,000 students participated in the base-year survey. In 1992, a freshened sample was included to
27For more information on the BPS:96/98 survey, consult U.S. Department of Education, National Center for Education Statistics, Beginning Postsecondary Students Longitudinal Study First Follow-up 1996-98, Methodology Report (NCES 2000- 157) (Washington, DC: 2000). 28For more information on the BPS: 1996/2001 survey, consult US. Department of Education, National Center for Education Statistics, Beginning Postsecondary Students Longitudinal Study:1996-2001 Methodology Report (NCES 2002-17 1) (Washington, DC: 2002). 291bid.
64 '7 8
Appendix B-Technical Notes and Methodology
achieve a representative sample of high school seniors. The 1992 weighted response rate was 91.0 percent.30
Data collection for the Third Follow-up to NELS occurred between February and August 1994 and obtained information from approximately 16,000 respondents.31 The NELS Third Follow-up had a weighted response rate of 90.9 percent. Of these, approximately 2,700 respondents indicated that the first postsecondary institution in which they enrolled prior to being surveyed in 1994 was a community college. This analysis is based on that subsample, examining responses in 1994 as well as information obtained from these students during the NELS Fourth Follow-up in 2000. The Fourth Follow-up had a weighted response rate of 82.7 percent.
Accuracy of Estimates
The statistics in this report are estimates derived from a sample. Two broad categories of error occur in such estimates: sampling and nonsampling errors. Sampling errors occur because observations are made only on samples of students, not entire populations. Nonsampling errors occur not only in sample surveys but also in complete censuses of entire populations. Nonsampling errors can be attributed to a number of sources: inability to obtain complete information about all students in all institutions in the sample (some students or institutions refused to participate, or students participated but answered only certain items); ambiguous definitions; differences in interpreting questions; inability or unwillingness to give correct information; mistakes in recording or coding data; and other errors of collecting, processing, sampling, and imputing missing data.
Item Response Rates
Weighted item response rates were calculated for all variables used in this report. The weighted item response rates were calculated by dividing the weighted number of valid responses by the weighted population for which the item was applicable. Most of the items had very high response rates (at least 85 percent). For these variables, it is unlikely that reported differences are biased because of missing data. Four variables had weighted item response rates below 85 percent (table Bl); all were from the NELS survey. The response rates were calculated only for the analysis sample used in the study: students first enrolled in a community college by 1994. The four variables included mathematics proficiency score (F22XMPRO), reading proficiency
30For all response rates to the NELS Survey, consult U.S. Department of Education, National Center for Education Statistics, Base-Year 10 Foiirtk Follow-lip Data File User's Muriual (NCES 2002-323) (Washington, DC: 2002). 31Consult U.S. Department of Education, National Center for Education Statistics, National Educatiori Longitudinal Study: 1988-1994 Methodology Report (NCES 9 6 1 7 4 ) (Washington, DC: 1996).
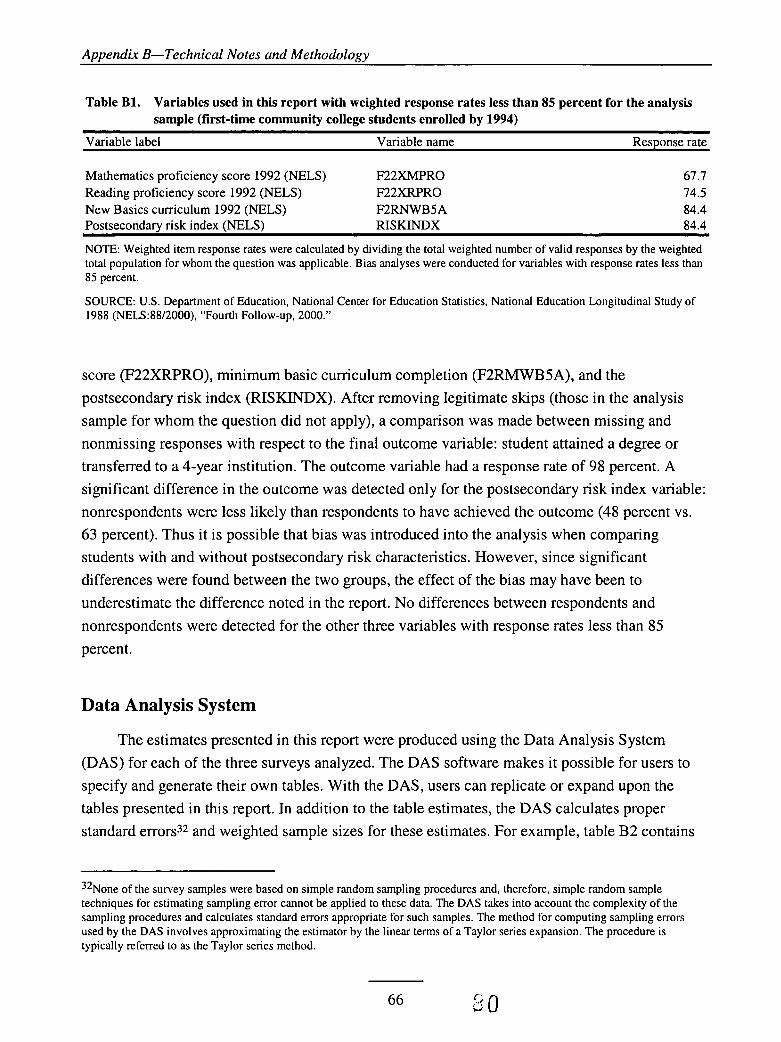
Appendix B-Technical Notes and Methodolonv
Table B1. Variables used in this report with weighted response rates less than 85 percent for the analysis sample (first-time community college students enrolled by 1994)
Variable label Variable name Response rate
Mathematics proficiency score 1992 (NELS) F22XMPRO 67.7
New Basics curriculum 1992 (NELS) F2RNWB 5 A 84.4 Postsecondary risk index (NELS) RISKINDX 84.4
NOTE: Weighted item response rates were calculated by dividing the total weighted number of valid responses by the weighted total population for whom the question was applicable. Bias analyses were conducted for variables with response rates less than 85 percent.
SOURCE: US. Department of Education, National Center for Education Statistics, National Education Longitudinal Study of
Reading proficiency score 1992 (NELS) F22XRPRO 74.5
1988 (NELS:88/2000), “Fourth FO~~OW-UP, 2000.”
score (F22XRPRO), minimum basic curriculum completion (F2RMWB5A), and the postsecondary risk index (RISKINDX). After removing legitimate skips (those in the analysis sample for whom the question did not apply), a comparison was made between missing and nonmissing responses with respect to the final outcome variable: student attained a degree or transferred to a 4-year institution. The outcome variable had a response rate of 98 percent. A significant difference in the outcome was detected only for the postsecondary risk index variable: nonrespondents were less likely than respondents to have achieved the outcome (48 percent vs. 63 percent). Thus it is possible that bias was introduced into the analysis when comparing students with and without postsecondary risk characteristics. However, since significant differences were found between the two groups, the effect of the bias may have been to underestimate the difference noted in the report. No differences between respondents and nonrespondents were detected for the other three variables with response rates less than 85 percent .
Data Analysis System
The estimates presented in this report were produced using the Data Analysis System @AS) for each of the three surveys analyzed. The DAS software makes it possible for users to specify and generate their own tables. With the DAS, users can replicate or expand upon the tables presented in this report. In addition to the table estimates, the DAS calculates proper standard errors32 and weighted sample sizes for these estimates. For example, table B2 contains
32None of the survey samples were based on simple random sampling procedures and, therefore, simple random sample techniques for estimating sampling error cannot be applied to these data. The DAS takes into account the complexity of the sampling procedures and calculates standard errors appropriate for such samples. The method for computing sampling errors used by the DAS involves approximating the estimator by the linear terms of a Taylor series expansion. The procedure is typically referred to as the Taylor series method.
66
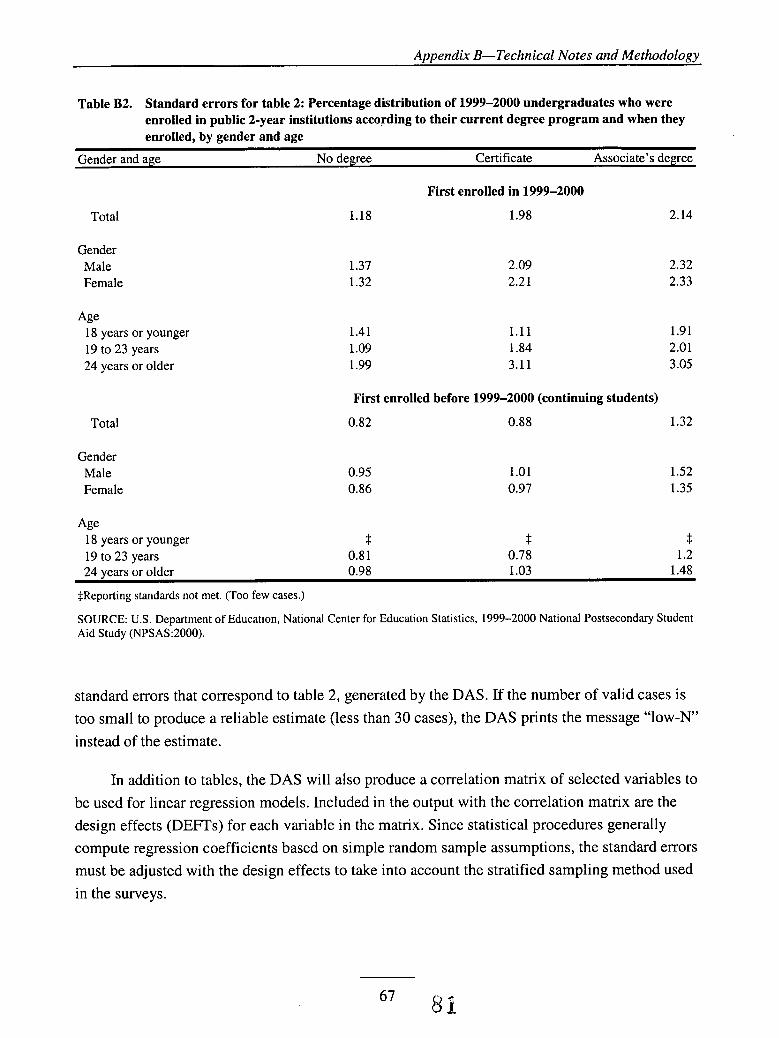
Appendix B-Technical Notes and Methodology
Table B2. Standard errors for table 2: Percentage distribution of 1999-2000 undergraduates who were enrolled in public 2-year institutions according to their current degree program and when they enrolled, by gender and age
Gender and age No degree Certificate Associate’s degree
Total
Gender Male Female
Age 18 years or younger 19 to 23 years 24 years or older
Total
Gender Male Female
Age 18 years or younger 19 to 23 Years
First enrolled in 1999-2000
1.18 1.98 2.14
1.37 1.32
1.41 1.09 1.99
2.09 2.21
1.11 1.84 3.11
2.32 2.33
1.91 2.01 3.05
First enrolled before 1999-2000 (continuing students)
0.82 0.88 1.32
0.95 0.86
t 0.8 1
1.01 0.97
t: 0.78
1.52 1.35
t: 1.2
$Reporting standards not met. (Too few cases.)
SOURCE: US. Department of Education, National Center for Education Statistics, 1999-2000 National Postsecondary Student Aid Study (NPSAS:2000).
standard errors that correspond to table 2, generated by the DAS. If the number of valid cases is too small to produce a reliable estimate (less than 30 cases), the DAS prints the message “low-N” instead of the estimate.
In addition to tables, the DAS will also produce a correlation matrix of selected variables to be used for linear regression models. Included in the output with the correlation matrix are the design effects (DEFTs) for each variable in the matrix. Since statistical procedures generally compute regression coefficients based on simple random sample assumptions, the standard errors must be adjusted with the design effects to take into account the stratified sampling method used in the surveys.
Amendix B-Technical Notes and Methodoloav
For more information about the Data Analysis Systems, consult the NCES DAS web site (nces.ed.gov/das) or contact:
Aurora D’ Amico National Center for Education Statistics 1990 K Street, NW Room 8115 Washington, DC 20006
Internet address: Aur0ra.D ’ Amico @ ed. gov (202) 502-7334
Statistical Procedures
Differences Between Means
The descriptive comparisons were tested in this report using Student’s t statistic. Differences between estimates are tested against the probability of a Type I err0r,~3 or significance level. The significance levels were determined by calculating the Student’s t values for the differences between each pair of means or proportions and comparing these with published tables of significance levels for two-tailed hypothesis testing.
Student’s t values may be computed to test the difference between estimates with the following formula:
El - E2
I=J-
where El and E2 are the estimates to be compared and sel and se2 are their corresponding standard errors. This formula is valid only for independent estimates. When estimates are not independent, a covariance term must be added to the formula:
El - E2 t =
Jse; + sei - 2(r)se, se2
33A Type I error occurs when one concludes that a difference observed in a sample reflects a true difference in the population from which the sample was drawn, when no such difference is present.
8 2 68
Appendix B-Technical Notes and Methodolonv
where r is the correlation between the two e~timates.3~ This formula is used when comparing two percentages from a distribution that adds to 100. If the comparison is between the mean of a subgroup and the mean of the total group, the following formula is used:
where F is the proportion of the total group contained in the subgroup.35 The estimates, standard errors, and correlations can all be obtained from the DAS.
There are hazards in reporting statistical tests for each comparison. First, comparisons based on large t statistics may appear to merit special attention. This can be misleading since the magnitude of the t statistic is related not only to the observed differences in means or percentages but also to the number of respondents in the specific categories used for comparison. Hence, a small difference compared across a large number of respondents would produce a large t statistic.
A second hazard in reporting statistical tests is the possibility that one can report a “false positive” or Type I error. In the case of a t statistic, this false positive would result when a difference measured with a particular sample showed a statistically significant difference when there is no difference in the underlying population. Statistical tests are designed to control this type of error, denoted by alpha. The alpha level of .05 selected for findings in this report indicates that a difference of a certain magnitude or larger would be produced no more than one time out of twenty when there was no actual difference in the quantities in the underlying population. When we test hypotheses that show c values at the .05 level or smaller, we treat this finding as rejecting the null hypothesis that there is no difference between the two quantities. However, there are other cases when exercising additional caution is warranted. When there are significant results not indicated by any hypothesis being tested or when we test a large number of comparisons in a table, Type I errors cannot be ignored. For example, when making paired comparisons among different levels of income, the probability of a Type I error for these comparisons taken as a group is larger than the probability for a single comparison.
When either of the two situations described in the previous paragraph was encountered in this report, comparisons were made when p < . 0 5 / k for a particular pairwise comparison, where that comparison was one of k tests within a family. This guarantees both that the individual
34U.S. Department of Education, National Center for Education Statistics, A Norefrorn rhe ChiefSrafisticiari, no. 2, 1993. 3Slbid.
69 83
Appendix B-Technical Notes and Methodology
comparison would have p 5 . 0 5 and that for k comparisons within a family of possible comparisons, the significance level for all the comparisons will sum to p 2.05.36
For example, in a comparison of the percentages of males and females who expected to earn a certificate at their first institution, only one comparison is possible (males vs. females). In this family, k=l, and the comparison can be evaluated without adjusting the significance level. When respondents are divided into four “purpose for enrolling” categories and all possible comparisons are made, then k=6, and the significance level of each test must be p 5.05/6, or p 5 .008. The formula for calculating family size (k ) is as follows:
j ( j - 1) k = 2 (4)
where j is the number of categories for the variable being tested. In the case of “purpose for enrolling,” there are four groups (Job skills, Degree or certificate, Transfer to 4-yearY Other), so substituting 4 for j in equation 4,
4(4 - 1 ) k = = 6
2
There were a few instances when apparent differences were significant when k=l , but not when the family size adjustment was made. For these comparisons, the significance level is footnoted.
Bivariate Correlations
The strength of the relationships between pairs of variables can be described using a scale of magnitudes as described by Cohen ( 1988),37 who adopted the notion of a scale of small, moderate, and large sized relationships, which allows for a qualitative interpretation of the strength of a relationship through the concept of effect size. Cohen suggested that for a scale of the proportion of variance accounted for (the square of the correlation coefficient, r2), one might use a value of 0.01 to signify a small effect size, 0.09 for moderate, and 0.25 for large. Some latitude is appropriate in determining the scale of effect sizes within the context of the analysis. In the analysis reported here, the outcome variable used in the multivariate analysis (see
36The standard that p I .05/k for each comparison is more stringent than the criterion that the significance level of the comparisons should sum to p I .05. For tables showing the t statistic required to ensure that p I .05/k for a particular family size and degrees of freedom, see Olive Jean Dunn, “Multiple Comparisons Among Means,” Journal ofthe American Statistical Association 56 (1961): 52-64. 37Cohen, Jacob. (1988). Staristical Power Analysis for the Behavioral Sciences, 2nd Edition. Hillsdale, NJ: Lawrence Erlbaum Associates.
70
84
Appendix B-Technical Notes and Methodology
discussion of methods below) was dichotomous (i.e., whether a student attained a degree or transferred to a 4-year institution). While the overall results of linear probability models (such as the one used in this analysis) are comparable to those produced by Iogit and probit models when the probability of the outcome is sufficiently large (as it is here), the r2's are often substantially 10wer.3~ Taking this into consideration, the magnitudes reported here were based on a scale in which the effect is small if r2 is less than 0.04, moderate if r2 is at least 0.04 but less than 0.12, and large if r2 is 0.12 or greater. In this analysis, effect sizes ranged from .01 to .04, signifying small to moderate effects.
Multivariate Analysis
Many of the independent variables included in the analyses in this report are related, and to some extent, the pattern of differences found in the descriptive analyses reflects this covariation. For example, when examining the degree attainment or transfer rates of students by high school academic preparation, it is possible that some of the observed relationship is due to differences among other factors related to the outcome, such as socioeconomic status. However, if nested tables were used to isolate all the influence of all related factors, cell sizes would become too small to identify the significant differences in patterns. When the sample size becomes too small to support controls for another level of variation, other methods must be used to take such variation into account.
The method used in this report is an approach sometimes referred to as communality analysis. For the analysis of NELS attainmendtransfer rates, multiple linear regression was used to adjust for the covariation among a list of control variables.39 The independent or control variables were selected based solely on the descriptive analysis rather than on a theoretical model. The descriptive regression model was not reduced. The least squares regression coefficients displayed in the regression tables are expressed as percentages. Significant coefficients represent the observed differences that remain between the analysis group (such as those with high proficiency) and the comparison group (those with low scores) after controlling for the relationships of all the selected independent variables. For example, in table 10, the least squares coefficient for those who scored at level 4 or 5 in mathematics proficiency is 14.5. This means that compared to those who scored at level 1 or below, about 15 percent more of the
38See table 8.5 on p 338 for comparisons of R2's in G. S . Maddala, Introduction to Econometrics (New York: Macmillan Publishing Company, 1992). 39For more information about least squares regression, see Michael S . Lewis-Beck, Applied Regression: An Introduction, Vol. 22 (Beverly Hills, CA: Sage Publications, Inc., 1980); William D. Berry and Stanley Feldman, Multiple Regression in Practice, Vol. 50 (Beverly Hills, CA: Sage Publications, Inc., 1987).
71 $5
Appendix B-Technical Notes and Methodology
higher proficiency group would be expected to attain a degree or transfer to a 4-year institution after controlling for the relationships among all the other independent variables.
It is possible to conduct a regression analysis using the DAS, because one of the DAS output options is a correlation matrix, computed using painvise missing values. In regression analysis, there are several common approaches to the problem of missing data. The two simplest approaches are pairwise deletion of missing data and listwise deletion of missing data. In pairwise deletion, each correlation is calculated using all of the cases for the two relevant variables. For example, suppose you have a regression analysis that uses variables X1, X2, and X3. The regression is based on the correlation matrix between X1, X2, and X3. In pairwise deletion, the correlation between X1 and X2 is based on the nonmissing cases for X1 and X2. Cases missing on either X1 or X2 would be excluded from the calculation of the correlation. In listwise deletion, the correlation between X1 and X2 would be based on the nonmissing values for X1, X2, and X3. That is, all of the cases with missing data on any of the three variables would be excluded from the analysis.
The correlation matrix can be used by most statistical software packages as the input data for least squares regression. That is the approach used for this report, with an additional adjustment to incorporate the complex sample design into the statistical significance tests of the parameter estimates (described below).
The regression analysis in this study included a dichotomous dependent variable that denoted whether a student had attained a degree or if not, had attended a 4-year institution, and a set of independent dummy variables. Independent variables that were significantly associated with the outcome in the tabular analysis were included in the regression. In addition, student demographic variables (gender, racelethnicity, SES) were also included. These variables explained about 9.6 percent of the variance.
Although the DAS simplifies the process of conducting a linear regression analysis, it also limits the range of procedures that can be used. The least squares regression procedure used in this analysis is sometimes sufficient for binary outcomes (such as the outcome studied here). However, when the proportion of the sample participating in the outcome is very low or very high, logit or probit procedures are preferred.40
Most statistical software packages assume simple random sampling when computing standard errors of parameter estimates. Because of the complex sampling design used for the
40Sec John H. Aldrich and Forrest D. Nelson, “Linear Probability, Logit and Probit Models” (Quunrirufive Applications in Sociol Sciences, Vol. 45) (Beverly Hills, CA: Sage, 1984). Analysts who wish to estimate other types of models can apply for a rcstricted data license from NCES.
72 86
Appendix B-Technical Notes and Methodology
survey, this assumption is incorrect. A better approximation of their standard errors is to multiply each standard error by the design effect associated with the dependent variable (DEFT),41 where the DEFT is the ratio of the true standard error to the standard error computed under the assumption of simple random sampling. It is calculated by the DAS and displayed with the correlation matrix output.
41The adjustment procedure and its limitations are described in C.J. Skinner, D. Holt, and T.M.F. Smith, eds.. Analysis of Complex Surveys (New York: John Wiley & Sons, 1989).
73

U.S. Department of Education ED Pubs 8242-B Sandy Court Jessup, MD 20794-1 398
Official Business Penalty for Private Use, $300
PY AVAILABLE
U.S. POSTAGE PAID U.S. DEPARTMENT OF EDUCATION
PERMIT NO. 6-17
E U S . Department of Education Office of Educational Research and lmprovement (OERI)
National Library of Education (NLE) Educational Resources lnformation Center (ERIC)
tiuwlionol Reams lolnrmlinn Cenier
NOTICE
Reproduction Basis
This document is covered by a signed "Reproduction Release (Blanket)" form (on file within the ERIC system), encompassing all or classes of documents from its source organization and: therefore, does not require a "Specific Document" Release form.
This document is Federally-funded, or carries its own permission to reproduce, or is otherwise in the public domain and, therefore, may be reproduced by ERIC without a signed Reproduction Release form (either "Specific Document" or "Blanket").
EFF-089 (112003)
Related Documents


