Community-based Therapeutic Care: treating severe acute malnutrition in sub- Saharan Africa. Thesis submitted to University College London in part fulfilment of the degree of Ph.D. Kate Sadler Centre for International Health & Development Institute of Child Health, UCL 1

Welcome message from author
This document is posted to help you gain knowledge. Please leave a comment to let me know what you think about it! Share it to your friends and learn new things together.
Transcript

Community-based Therapeutic Care:
treating severe acute malnutrition in sub-
Saharan Africa.
Thesis submitted to University College London in part fulfilment of the degree of
Ph.D.
Kate Sadler
Centre for International Health & Development
Institute of Child Health, UCL
1

Declaration
I, Kate Sadler, confirm that the work presented in this thesis is my own and has not been
previously submitted for any other degree. Where there has been contribution from
anyone other than myself or information has been derived from other sources, I confirm
that this has been indicated in the thesis.
2

3
1 Acknowledgements
Thanks are due to many people. My friends and colleagues at Valid International;
particularly Tanya Khara, Anne Walsh, Nicky Dent, Saul Guerrero, Paluku Bahwere,
Marko Kerac, Al Hallam and Judy Walters; have all been an unfailing support and I
consider this piece of work as much theirs as mine. A very special thanks must go to
Valid’s Director Steve Collins, both friend and mentor, whose passion and dedication to
the plight of the world’s malnourished people has provided the inspiration behind this
work and to me as a public nutritionist working in this field. My supervisors Andrew
Seal and Andrew Tomkins, who have guided me through the minefield of academia, and
provided countless comments on drafts and redrafts of this thesis.
I’d like to acknowledge the contribution of all the Ministry of Health and NGO staff that
have worked on CTC programmes across the world; without their effort and commitment
none of these programmes would ever be possible.
Generous financial and operational support for this research has been provided by
Concern Worldwide, the World Health Organization; the United States Agency for
International Development (USAID) through the Food and Nutrition Technical
Assistance (FANTA) project/Academy for Educational Development (AED); Irish Aid,
Department of Foreign Affairs; Matthew and Sybil Orr and Mark Myatt at Brixton
Health.
Last, but by no means least, I’d like to thank my family; Mum, Dad, Em and Tom who
have given me the grounding, support and constant encouragement to fulfil my potential
– to you a million thanks.

4
2 Abstract Severe acute malnutrition (SAM) affects approximately 13 million children under-five
and is associated with over 1.5 million preventable child deaths each year. Case fatality
rates in hospitals treating SAM remain at 20-30%, and coverage of those affected
remains low. Training and support to improve centre-based management can reduce case
fatality rates. However, an exclusive inpatient approach does not consider the many
barriers to accessing treatment that exist for poor people in the developing world.
Community-based therapeutic care (CTC) is a new approach for the management of
SAM that uses Ready-to-Use Therapeutic Foods (RUTF) and triage to refer cases
without complications to outpatient care and those with complications to inpatient
treatment.
This thesis aims to test the hypotheses that a CTC strategy can treat children with SAM
effectively and can achieve better population treatment coverage than a centre-based
approach. Five studies, using primary data, are presented. The first 3 studies evaluate the
clinical effectiveness of CTC through examination of individual outcome data from
research programmes in Ethiopia and Malawi. The fourth study examines the coverage
of a CTC programme for SAM in Malawi and compares this with coverage of a centre-
based programme. The final study is a multi-country evaluation of 17 CTC programmes
implemented across Africa.
Results from all studies that use the CTC treatment model show that outcomes can meet
the international Sphere standard indicators of < 10% mortality and > 50% coverage.
Coverage of a CTC programme in Malawi was three times that of a centre-based
programme in the same region (73.64% (95% C.I. 66.0%, 81.3%) vs. 24.5% (95% C.I.
17.8%, 31.4%). A number of factors were vital to achieving low mortality and high
coverage in these programmes. These included decentralisation of outpatient treatment
services and community mobilisation techniques to encourage early presentation, and the
use of appropriate triage criteria, to identify children suffering from SAM with no
complications that could be treated safely as outpatients. The use of triage did not appear
to increase mortality (OR 0.51 95% CI 0.28, 0.94). This thesis suggests that CTC does
not increase case fatality rates associated with SAM and could reduce them, and that it
could increase the number of children receiving treatment.

5
TABLE OF CONTENTS
1 Acknowledgements ................................................................................................3
2 Abstract...................................................................................................................4
3 Glossary of Terms and Acronyms......................................................................14
4 Glossary of Definitions ........................................................................................17
5 Hypothesis and Objective....................................................................................18
6 Introduction and Literature Review ..................................................................19
6.1 Background.........................................................................................................19
6.2 Malnutrition ........................................................................................................20
6.2.1 Causes of malnutrition ..............................................................................22
6.3 Severe acute malnutrition ...................................................................................23
6.3.1 A note on history and the nature of the nutritional deficiency .................23
6.3.2 Classification and epidemiology...............................................................25
6.4 The treatment of severe acute malnutrition during emergencies ........................27
6.4.1 Modern management protocols.................................................................28
6.4.2 Delivery of treatment ................................................................................30
6.4.3 Therapeutic Foods.....................................................................................31
6.5 The impact of programmes to treat severe acute malnutrition ...........................33
6.5.1 Recovery and case fatality rates................................................................34
6.5.2 Coverage ...................................................................................................37
6.6 The need for a change in the way we address SAM...........................................39
6.7 Treatment at home and in the community ..........................................................42
6.7.1 Recent introduction of RUTF into outpatient care for SAM. ...................45
7 Nomenclature, Principles & Conceptual Basis of the CTC Approach ...........48
8 Background to the Studies and Core Methods..................................................51
8.1 Background.........................................................................................................51
8.2 Introduction to the studies...................................................................................51

6
8.3 Research and implementing partners ..................................................................52
8.3.1 Valid International ....................................................................................52
8.3.2 Concern Worldwide ..................................................................................52
8.3.3 Other partners............................................................................................53
8.4 Core Research Methods ......................................................................................53
8.4.1 Subjects .....................................................................................................54
8.4.2 Measurements, equipment and precision..................................................54
8.4.3 Data collection and programme monitoring .............................................56
8.4.4 Data coding ...............................................................................................58
8.4.5 Data entry and verification........................................................................60
8.4.6 Data manipulation and creating new variables .........................................61
8.4.7 Data Analysis ............................................................................................62
8.4.8 Ethical approval ........................................................................................63
9 Can CTC Achieve Clinical Effectiveness?.........................................................64
9.1 Introduction.........................................................................................................64
9.2 Study 1, Ethiopia 2000: Can an outpatient model using RUTF for the treatment
of SAM meet Sphere standards?....................................................................................65
9.2.1 Background...............................................................................................65
9.2.2 Objective ...................................................................................................66
9.2.3 Method ......................................................................................................66
9.2.4 Results.......................................................................................................69
9.2.5 Discussion.................................................................................................71
9.3 Study 2, Southern Malawi: the impact of introducing RUTF into a central
hospital with a high HIV caseload. ................................................................................74
9.3.1 Introduction and aims ...............................................................................74
9.3.2 Objective ...................................................................................................74
9.3.3 Background...............................................................................................75
9.3.4 Methods.....................................................................................................76
9.3.5 Results.......................................................................................................80
9.3.6 Discussion.................................................................................................84

7
9.4 Study 3, Central Malawi: the impact of combining decentralised outpatient
treatment with inpatient care and triage on clinical outcomes.......................................89
9.4.1 Introduction and aims ...............................................................................89
9.4.2 Objective ...................................................................................................89
9.4.3 Background...............................................................................................89
9.4.4 Methods.....................................................................................................91
9.4.5 Results.....................................................................................................103
9.4.6 Discussion...............................................................................................122
9.5 Conclusion ........................................................................................................135
10 Can CTC Achieve High Coverage? : Comparing the coverage of CTC and a
centre-based therapeutic feeding programme in Malawi ..........................................137
10.1 Introduction.......................................................................................................137
10.2 Study 4: A new survey method to compare the programme coverage of two
therapeutic feeding interventions implemented in neighbouring districts of Malawi .137
10.2.1 Introduction.............................................................................................137
10.2.2 Objectives ...............................................................................................140
10.2.3 Methods...................................................................................................140
10.2.4 Results.....................................................................................................147
10.2.5 Discussion...............................................................................................151
11 Going to Scale with CTC...................................................................................157
11.1 Introduction.......................................................................................................157
11.2 Study 5, Monitoring CTC 2003-2005: a multi-country evaluation ..................158
11.2.1 Introduction to each programme site ......................................................158
11.2.2 Methods...................................................................................................162
11.2.3 Results.....................................................................................................167
11.2.4 Discussion and lessons learnt..................................................................169
12 Conclusions and Way Forward ........................................................................179
12.1 Effectiveness and impact ..................................................................................179
12.2 The mechanisms of minimising mortality and maximising coverage ..............180

8
12.2.1 Reducing barriers to access to encourage early presentation and maximise
coverage .................................................................................................................180
12.2.2 Defining complicated malnutrition and triage to outpatient or inpatient
care .................................................................................................................181
12.2.3 Decongesting inpatient units...................................................................182
12.3 Conclusions.......................................................................................................182
12.4 The CTC Model ................................................................................................185
12.4.1 Reclassification of severe acute malnutrition .........................................185
12.4.2 Community mobilisation ........................................................................186
12.4.3 Outpatient therapeutic programme .........................................................187
12.4.4 Programme Monitoring...........................................................................188
12.5 Implications for policy and practice .................................................................189
12.5.1 A note on the process of policy change in this context...........................190
12.6 Further work required .......................................................................................191
12.6.1 Strengthening the evidence base for the use of triage in the treatment of
SAM .................................................................................................................191
12.6.2 Follow up and support after discharge from inpatient care ....................191
12.6.3 Long term follow up and relapse after discharge....................................191
12.6.4 Treatment and support for chronically sick and HIV positive children..192
12.6.5 The relationship between distance from treatment (and other barriers to
access) and early presentation.................................................................................192
12.6.6 Redefine standards for expected weight gain and length of stay in
outpatient treatment programmes. ..........................................................................192
12.6.7 Examine the use of MUAC as an independent admission and discharge
criteria .................................................................................................................192
12.6.8 Cost effectiveness of community-based care..........................................193
12.6.9 The effective integration of CTC into the primary health care system...193
13 References...........................................................................................................194
14 Appendices..........................................................................................................208
14.1 Appendix 1: Papers published in peer reviewed journals on which the author is
lead or contributing author...........................................................................................208

9
14.1.1 Management of severe acute malnutrition in children. Lancet 2006......208
14.1.2 The outpatient treatment of severe malnutrition during humanitarian relief
programmes. Lancet 2002.......................................................................................218
14.1.3 Improving the Management of Severe Acute Malnutrition in an Area of
High HIV Prevalence. Journal of Tropical Pediatrics 2008 ...................................226
14.1.4 A field trial of a survey method for estimating the coverage of selective
feeding programmes. Bulletin of the WHO 2003...................................................233
14.1.5 A comparison of the programme coverage of two therapeutic feeding
interventions implemented in neighbouring districts of Malawi. Public Health
Nutrition 2007.........................................................................................................242
14.1.6 Key issues in the success of community-based management of severe
malnutrition. Food and Nutrition Bulletin 2006 .....................................................250
14.2 Appendix 2: Lancet letters discussing TFCs vs. CTC for the treatment of SAM285
14.3 Appendix 3: The monitoring card used in the OTP, Dowa, Malawi ................290
14.4 Appendix 4: OTP weekly report, Dowa Malawi ..............................................292
14.5 Appendix 5: Example of database for data input and a programme monitoring
report, Dowa Malawi. ..................................................................................................293
14.6 Appendix 6: Programme procedures for implementing staff, Dowa Malawi...295
14.7 Appendix 7: RUTF ration chart for the OTP, Dowa ........................................297
14.8 Appendix 8: Medical protocol for the CTC programme, Dowa.......................298
14.9 Appendix 9: Action protocol, OTP Dowa ........................................................299
14.10 Appendix 10: Education message sheet for OTP, Dowa..................................300

10
TABLES
Table 1 Classification of nutrients according to whether the response to a deficiency is a
reduced concentration in the tissues (type I) or a reduced growth rate (type II) ......24
Table 2: Analysis of the worldwide burden of acute malnutrition ...................................27
Table 3: Comparison of the nutritional composition of F100 and RUTF.........................32
Table 4: Reported coverage rates in the national NRU programme in Malawi, April
2003, ten months after the start of emergency interventions. ...................................39
Table 5: Outcome data for children treated in study 1......................................................69
Table 6: A comparison between the Sphere (2000) indicators for therapeutic feeding
programmes and the study results.............................................................................70
Table 7: Admission characteristics of children treated in study 2 ....................................81
Table 8: Outcome by HIV status ......................................................................................81
Table 9 Signs and criteria used to triage children to different levels of treatment in Dowa,
Malawi ......................................................................................................................97
Table 10: Admission characteristics of children treated in study 3 ................................104
Table 11: Outcomes by category of malnutrition ...........................................................106
Table 12: Outcomes against the Sphere standard indicators ..........................................107
Table 13: Outcomes in the NRUs and the OTP..............................................................108
Table 14: Outcomes by category of malnutrition and type of treatment ........................113
Table 15: Observed deaths in direct OTP compared with expected deaths calculated by
the Prudhon Index ...................................................................................................113
Table 16: Outcomes by age group ..................................................................................116
Table 17: Outcomes by age group and type of treatment ...............................................116
Table 18: Proportion of children that presented with each clinical criterion used to triage
children between August and December 2003 .......................................................118
Table 19: Baseline characteristics of the non triaged and the triaged groups.................118
Table 20: Outcomes by non triaged and triaged groups. ................................................119
Table 21: Univariate and multivariate regression analyses for recovery and mortality .121
Table 22: Demographic and socio-economic characteristics of the two target areas for
study 4.....................................................................................................................141
Table 23: Programme inputs provided by supporting agency in the two study areas. ...143
11
Table 24: Data from the Mchinji survey.........................................................................148
Table 25 : Methods, sample sizes, and results for two different surveys .......................154
Table 26: Description of basic protocols for each CTC programme examined in study 5
relative to those used in Dowa, Malawi (Study 3)..................................................163
Table 27 : Outcomes from children presenting to CTC programmes between Feb. 03 and
Dec. 05 (N = 20,418) .............................................................................................167

12
FIGURES
Figure 1: Causes of death among children under 5 years of age, 2000–2003, worldwide.
...................................................................................................................................21
Figure 2: Causes of severe malnutrition adapted from UNICEF 1990.(19) .....................23
Figure 3: Sphere indicators for Therapeutic Feeding Programmes ..................................30
Figure 4: The relationship between coverage, cure rate and met need (impact) in the
treatment of SAM .....................................................................................................38
Figure 5: The potential problems of TFC care..................................................................42
Figure 6: Classification of oedema ...................................................................................58
Figure 7: Bedawacho Woreda, SNNPR Ethiopia .............................................................66
Figure 8: Kaplan-Meier survival curves showing the timing of discharges, deaths,
defaults and transfers in study 1................................................................................70
Figure 9: The trial profile..................................................................................................82
Figure 10: Kaplan-Meier survival curve showing the timing of deaths in the NRU........83
Figure 11: Defaulter outcomes..........................................................................................84
Figure 12: Map of Dowa District showing location of NRUs and OTP sites used in study
3.................................................................................................................................94
Figure 13: Final outcomes of children classified as non responders ..............................107
Figure 14: Final outcomes of children followed up after default ...................................108
Figure 15: Number of inpatients (left hand axis) and number of deaths in the NRUs (right
hand axis) by month................................................................................................110
Figure 16: Number of outpatients (left hand axis) and number of deaths (right hand axis)
in the OTP by month...............................................................................................110
Figure 17: Timing of deaths after direct admission into the outpatient therapeutic
programme (OTP) (n = 7) .......................................................................................111
Figure 18: Timing of deaths after discharge from the NRU into the outpatient therapeutic
programme (OTP) (n = 45) .....................................................................................111
Figure 19: Comparison of impact indicators of CTC and NRU strategies in Malawi
August - December 2002 ........................................................................................124
Figure 20: An example of oedema grade 2: successfully treated directly in outpatient
care..........................................................................................................................127
Figure 21: Formulas 1 and 2 for calculating period and point coverage ........................146

13
Figure 22: Distribution of per-quadrat period coverage in the therapeutic feeding centre
(TFC) programme in Mchinji .................................................................................149
Figure 23 : Distribution of per-quadrat period coverage in the community-based
therapeutic care (CTC) programme in Dowa..........................................................149
Figure 24: Spatial distribution of per-quadrat period coverage in the therapeutic feeding
centre (TFC) programme in Mchinji.......................................................................150
Figure 25: Spatial distribution of per-quadrat period coverage in the community-based
therapeutic care (CTC) programme in Dowa..........................................................151
Figure 26: An outpatient therapeutic programme site in Darfur.....................................161
Figure 27: The relationship between coverage, default and acceptability......................172
Figure 28: Numbers of admissions and exits, OTP Dowa district, August to December
2002.........................................................................................................................174
Figure 29: Two stage screening using MUAC, oedema and weight for height..............176
Figure 30: Reclassification of severe acute malnutrition for use in CTC programmes..186
Figure 31: Elements of community mobilisation: ..........................................................187
Figure 32: OTP procedures.............................................................................................188
14
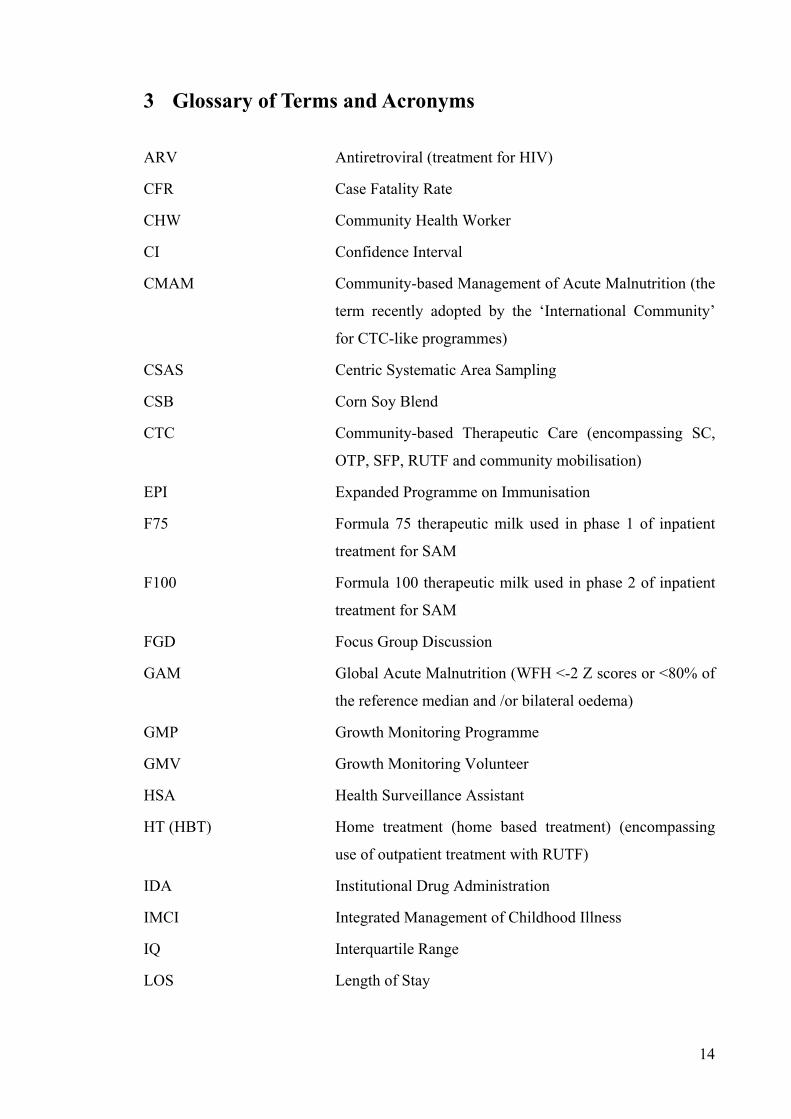
3 Glossary of Terms and Acronyms
ARV Antiretroviral (treatment for HIV)
CFR Case Fatality Rate
CHW Community Health Worker
CI Confidence Interval
CMAM Community-based Management of Acute Malnutrition (the
term recently adopted by the ‘International Community’
for CTC-like programmes)
CSAS Centric Systematic Area Sampling
CSB Corn Soy Blend
CTC Community-based Therapeutic Care (encompassing SC,
OTP, SFP, RUTF and community mobilisation)
EPI Expanded Programme on Immunisation
F75 Formula 75 therapeutic milk used in phase 1 of inpatient
treatment for SAM
F100 Formula 100 therapeutic milk used in phase 2 of inpatient
treatment for SAM
FGD Focus Group Discussion
GAM Global Acute Malnutrition (WFH <-2 Z scores or <80% of
the reference median and /or bilateral oedema)
GMP Growth Monitoring Programme
GMV Growth Monitoring Volunteer
HSA Health Surveillance Assistant
HT (HBT) Home treatment (home based treatment) (encompassing
use of outpatient treatment with RUTF)
IDA Institutional Drug Administration
IMCI Integrated Management of Childhood Illness
IQ Interquartile Range
LOS Length of Stay

15
MAM Moderate Acute Malnutrition (WFH >-3 <-2 Z scores and
or > 70 <80% of the reference median)
MDG Millennium Development Goal
MoH Ministry of Health
MSF Médecins sans Frontières
MUAC Mid-Upper Arm Circumference
NCHS National Centre for Health Statistics
NGO Non Governmental Organisation
NRC Nutrition Rehabilitation Centre
NRU Nutritional Rehabilitation Unit
OTP Outpatient Therapeutic Programme (treatment at home
with weekly follow up)
Direct OTP: encompassing only outpatient treatment with
RUTF
Indirect OTP: encompassing phase 1 inpatient treatment
followed by outpatient treatment with RUTF
PEM Protein energy malnutrition
Phase 1 The first phase of inpatient treatment for children with
severe acute malnutrition
Phase 2 The rehabilitation phase of inpatient treatment for children
with severe acute malnutrition.
PPS Probability Proportional to Size
RCT Randomised control trial
RR Relative Risk
RUTF Ready to Use Therapeutic Food
SAM Severe Acute Malnutrition (WFH <-3 Z scores or <70% of
the reference median and /or bilateral oedema and/or
MUAC < 11cm)
SAU Severe acute undernutrition, defined as SAM, term used to
differentiate from overnutrition
SC Stabilisation Centre
SFP Supplementary Feeding Programme

16
TA Traditional Authority (in Malawi)
TFC Therapeutic Feeding Centre
UNICEF United Nations Children’s Fund
WFH Weight for Height
WHM Weight for Height % of the median
WHZ Weight for Height z score
WHO World Health Organisation

17
4 Glossary of Definitions
Acute malnutrition WFH <-2 Z scores or < 80% of the reference median
and/or bilateral oedema
Categories of SAM Severe Acute Malnutrition (WFH <-3 Z scores or <70% of
the reference median and /or bilateral oedema and/or
MUAC < 11cm)
Marasmus:
WFH <-3 Z scores or <70% of the reference median
Kwashiorkor:
The presence of any bilateral pitting oedema
Marasmic kwashiorkor:
WFH <-3 Z scores or <70% of the reference median and
bilateral pitting oedema
MUAC:
MUAC < 11cm (children > 75cm only)
GAM Global Acute Malnutrition (WFH <-2 Z scores or <80% of
the reference median and /or bilateral oedema)
MAM Moderate Acute Malnutrition (WFH >-3 <-2 Z scores and
or > 70 <80% of the reference median)

18
5 Hypothesis and Objective
The hypotheses investigated in this thesis are:
1. A community-based therapeutic care (CTC) strategy can treat children with
severe acute malnutrition effectively as defined by international quality
indicators.
2. In areas with similar demographic and socio economic profile, a CTC strategy
can achieve better population treatment coverage than a centre-based approach.
The research objective of this work is to evaluate the adequacy of CTC programmes
using standard therapeutic feeding programme quality indicators and to compare
coverage with that of an exclusively centre-based approach.

19
6 Introduction and Literature Review
6.1 Background I (the author) graduated as a public health nutritionist in 1997 and first started working in
the field of emergency nutrition early in 1998. I was sent to Burundi, by the Irish agency
Concern Worldwide, where people were beginning to return to their homes after years of
displacement. Here, my learning curve was steep. I experienced the frustration of trying
to provide care for large numbers of severely malnourished people in centres that were
too small to accommodate them. I heard stories from the people that we were treating of
the distances that they’d had to travel to reach us and the home, fields and family that
they’d had to leave behind. I saw children start to recover from malnutrition only to be
struck down by malaria, which was at epidemic levels in the lowlands where our centres
were based, or infections contracted from others in the overcrowded centres. I remember
a visiting nutrition advisor asking many of the severely malnourished adults in our
centres where they would prefer to be receiving treatment. The majority stated a strong
preference to receive take home rations and were subsequently discharged in to a
programme that enabled this, despite it meaning that they received only the care and food
normally given to those less malnourished.
In Ethiopia, in 2000, I came across Valid International. The Director, Dr Steve Collins,
was discussing the potential of a new ready-to-use-therapeutic-food to deliver treatment
for severely malnourished people in their homes. With Concern, I was setting up
programmes to respond to high levels of severe acute malnutrition against a backdrop of
strong governmental opposition to the set up of new centres and a highly dispersed
population. A programme that might enable us to treat the malnourished at home
seemed to hold the answers to these problems. The resulting programme, implemented
during September to December 2000, was the first implemented under the community-
based therapeutic care (CTC) research programme. This research programme supported
the set up and evaluation of CTC programmes in North and South Sudan, North and
South Ethiopia and Central and Southern Malawi between September 2000 and June
2005. I joined Valid International as a research nutritionist in August 2001 and in
December of the same year registered on a PhD programme to study the impact of CTC.
The work described here forms part of a wider examination of CTC by Valid
International in Africa.

20
6.2 Malnutrition Malnutrition is defined by the standard medical dictionaries as “any disorder resulting
from a deficiency or excess of one or more essential nutrients” (1). In the developing
world this is generally characterised as under-nutrition or protein energy malnutrition
(PEM) whereby there exists varying degrees of deficiencies in essential nutrients. A
child’s body responds to PEM in two ways that can be measured by anthropometry: a
deceleration or cessation of growth, which in the long term results in low height for age
or stunting; and body-wasting and/or nutritional oedema, which are short term responses
to inadequate nutritional intakes that often occur in combination with infection. Wasting
is commonly assessed by weight relative to height (2) and nutritional oedema by the
presence of bi-pedal pitting oedema (3). The indicators height for age and weight for
height thus discriminate between different biological processes and result in different
clinical, bio-chemical and functional characteristics. Under weight or low weight for age
is a composite indicator that conflates stunting and wasting and is used as an official
indicator of progress towards achieving the first Millennium Development Goal (MDG):
eradication of extreme poverty and hunger (4). The most recent UN Standing
Committee for Nutrition’s 5th report on the World Nutrition Situation estimates that the
Latin America and Caribbean region is on track to meet this MDG, Asia is close to
meeting it, but in Africa, the gulf between projected rates and the MDG is widening (5).
It is estimated that 26.5% of children under 5 years of age in developing countries are
stunted or chronically undernourished with the highest levels occurring in sub Saharan
Africa, where on average 34.5% of children are affected. In their State of the World’s
Children Report 2007, UNICEF estimates that wasting affected 10% of children under 5
in developing countries between 1996 and 2005, and whilst it is Asia that has the highest
prevalence, Africa is the only region where wasting continues to rise (6).
It is not, of course, the numbers in themselves that give rise to concern but the effects
that malnutrition has on host populations. Starting with Pelletier’s work in the 90s, many
studies now estimate that malnutrition is an underlying factor in over 50% of the 10-11
million children under 5 years who die each year of preventable causes (see Figure 1) (7-
12).

Figure 1: Causes of death among children under 5 years of age, 2000–2003,
worldwide.
Adapted from Muller et al, 2005. (12)
This malnutrition encompasses stunting, wasting, intra-uterine growth retardation (or low
birth weight) and deficiencies of essential vitamins and minerals (collectively referred to
as micronutrients). It is important to note that the risk of death increases with descending
Z scores for all categories of malnutrition: underweight, stunting, or wasting; as well as
for infants born with low birth weight. Although this thesis focuses on ‘severe acute
malnutrition’ (those children that are severely wasted) the numbers of young children
that are stunted or born low birth weight are of great relevance to the discussion
presented here; not only are they present in much greater numbers across the world, but
children that suffer from these conditions are much more likely to develop severe
wasting than those of normal birth weight and normal height for age (13).
The link between malnutrition and child mortality is brought about by compromised
immunity. Malnutrition and infection are intertwined in a synergistic vicious cycle (14).
Malnutrition reduces immunity and raises the risk of mortality by increasing the
likelihood that the illness will be prolonged or become severe. A more prolonged or
severe illness is more likely to cause and/or aggravate malnutrition by causing appetite
loss, malabsorption, metabolic changes and behavioural changes which affect feeding
21

22
practices and thus deplete body nutrient stores (5). This relationship results in a
potentiating effect on child mortality (15). The WHO discussion paper entitled “Turning
the tide of malnutrition. Responding to the challenge of the 21st century”(16)
summarises the effects of malnutrition worldwide:
− Malnutrition kills, maims, cripples and blinds on a massive scale worldwide.
− Malnutrition affects one in every three people worldwide, afflicting all age
groups and populations, especially the poor and vulnerable.
− Malnutrition plays a major role in half of the 10.4 million annual child deaths in
the developing world; it continues to be a cause and consequence of disease and
disability in the children who survive.
− Malnutrition is not only medical; it is also a social disorder rooted in poverty and
discrimination.
− Malnutrition has economic ripple effects that can jeopardize development
6.2.1 Causes of malnutrition The concept of malnutrition as having multivariate causes has been discussed for many
decades and a number of models have been developed in an attempt to explain them.
Currently, the most widely used of these was first published by UNICEF in 1990, and is
entitled “The Causes of Malnutrition” (see Figure 2). This framework was incorporated
within the original Sphere Project’s minimum standards for humanitarian response as the
conceptual basis for all nutrition-related assessment and analysis in humanitarian
response (17). It therefore remains the basis of a public nutrition approach to assessment
and analysis within nutritionally vulnerable populations (18). It encompasses the
concepts of the primary causes of malnutrition; the synergistic relationship between
inadequate food intake and infectious disease discussed in 6.2 above, which in turn,
result from a combination of three main secondary causes that relate to the nutrition,
social and health environment of the child.

Malnutrition
& death
Inadequate Diseasedietary intake
Inadequate household food
security
Inadequatematernal and
child care
Insufficientservices and
unhealthy environment
Formal and non-formal institutions, political and ideological superstructure
economic structurepotential resources
IMMEDIATE CAUSES
UNDERLYING CAUSES
BASIC CAUSES
Figure 2: Causes of severe malnutrition adapted from UNICEF 1990.(19)
6.3 Severe acute malnutrition
6.3.1 A note on history and the nature of the nutritional deficiency In 1932, Cecily Williams reported her findings about a disease found in very young
children in the Gold Coast (20;21). At about the same time Trowell reported similar
cases from Uganda (21). By the late 1940s, scientists had agreed that the two syndromes
were the same and called it ‘Kwashiorkor’ (literally meaning ‘the disease of the deposed
baby when the next one is born’). At this time the attention of nutritional scientists was
largely concentrated on the vitamins and it was thought that nutritional oedema might be
a manifestation of vitamin B deficiencies. William’s work however showed that
kwashiorkor developed in children weaned on starchy paps and that milk could cure it.
So emerged the ‘protein deficiency’ theory of severe malnutrition and in 1963 Williams
said explicitly:
‘kwashiorkor is a disease primarily due to protein deficiency’ (3)
Quite quickly however, dietary studies began to show that children with both marasmus
and kwashiorkor had inadequate intakes of energy as well as protein. This led to the
concept of a spectrum of combined deficiency called ‘protein energy malnutrition’
(PEM), with protein being most limiting at the kwashiorkor end and energy at the
23

marasmus end (3;22). In the 70s, work in Jamaica demonstrated that children with
kwashiorkor fed a low protein diet improved more rapidly than those fed higher protein
diets and that the rate of loss of oedema was entirely independent of the protein content
of the diet. With this work the early argument that kwashiorkor was the result of protein
deficiency was judged to be fallacious (23) and nutrition scientists began the search for
alternative explanations of the different syndromes seen in malnutrition. Work started by
Waterlow in Jamaica in the 50s and 60s and later developed by Golden in the 80s
suggested that kwashiorkor might be caused by antioxidant depletion as a result of an
imbalance between the production of free radicals and their safe disposal (24). Linked to
this, Golden classified nutrients into those that cause specific clinical signs (type I) and
those that cause growth failure (type II).
Table 1 Classification of nutrients according to whether the response to a deficiency
is a reduced concentration in the tissues (type I) or a reduced growth rate (type II)
Type I Type II Selenium Nitrogen Iodine Sulphur Iron Essential amino acids Copper Potassium Calcium Sodium Manganese Magnesium Thiamine Zinc Riboflavin Phosphorus Ascorbic acid Water Retinol Tocopherol Calciferol Folic acid Cobalamin
Adapted from Golden et al. Oxford Text Book of Medicine (25)
He hypothesised that wasting is caused by a severe deficiency of type II nutrients that
result in tissue catabolism in association with anorexia. Kwashiorkor on the other hand,
according to the free radical theory, occurs when patients lacking type I nutrients suffer
from tissue damage and free radical production. A recent randomised controlled trial in
Malawi that provided antioxidant supplementation to prevent kwashiorkor has cast some
doubt however on the free radical hypothesis (26). It found that antioxidant depletion
may be a consequence rather than a cause of the condition and suggested, as an
alternative hypothesis, that variant isozymes or variations in concentrations of enzymes
24

25
in the metabolic pathways might permit the development of kwashiorkor in some
children with poor diets. Alternative theories propose that the toxic effects of aflatoxins,
directed primarily toward the liver, could account for many of the clinical features of
kwashiorkor (27). However, later papers have discredited this theory (28). Thus, the
explanation of the pathogenesis of kwashiorkor continues to evade us.
6.3.2 Classification and epidemiology Today, the syndrome protein energy malnutrition described by Williams and others is
commonly described as severe acute malnutrition (SAM) in order to differentiate it from
more chronic conditions. It is this term that I have adopted throughout this thesis. Severe
acute undernutrition (SAU), synonymous with the term SAM, is in the process of being
adopted by the United Nations as a more appropriate term to differentiate wasting and
oedema from obesity, a form of malnutrition most common in the developed world. The
causes of SAM are an extension of those discussed above whereby the environment that
has supported the development of malnutrition has been particularly acute or prolonged
in nature. There is an especially high risk of the development of SAM when “disaster
events”, such as acute severe food deprivation and/or infections, occur in an already
chronically malnourished population or individual. The WHO manual for the treatment
of severe acute malnutrition reflects this understanding of causes being multivariate in
nature and refers, in its introductory chapter, to severe malnutrition as being “both a
medical and social disorder” and states that “…the medical problems of the child result,
in part, from the social problems of the home in which the child lives” (29).
SAM is characterised by severe body wasting (marasmus) and/or nutritional oedema
(kwashiorkor). In 1956, Federico Gomez described the clinical profile and the apparent
cause of death of a group of malnourished children admitted to the Nutrition Department
of the children’s hospital in Mexico City (30). Using these data, he described an
indicator (weight-for-age) to classify varying degrees of malnutrition linked to prognosis,
or risk of death. With time, the so-called ‘‘Gomez classification’’ (using a reference
population and different cut-off points, i.e., 80%, 70% and 60% of median weight for
age) was used widely to classify individual children for clinical referral as suffering from
severe malnutrition or marasmus (< 60% of the reference weight for age), moderate
malnutrition, or mild malnutrition. Subsequently however, the indicator weight-for-age
was shown to be a poor discriminator between children that were severely stunted (with
short stature) and those that were severely wasted (with recent weight loss) and several

26
authors identified low weight-for-height (as a measure of recent weight loss) as the
indicator of choice for screening severely malnourished children who are at increased
risk of dying (31),(32). Bern reported that 3 indicators; visible severe wasting, a low
weight for height score and bipedal oedema, were all associated with a significantly
increased mortality risk. These findings, in combination with the threshold effect, first
reported by Chen et al in 1980 (33), whereby mortality increased with worsening
nutritional status when malnutrition was severe, are now used in international protocols
for the identification of children who require special therapeutic attention. The most
recent guidelines from WHO on the management of severe malnutrition (34;35) uses the
following definitions to define the level of severe acute malnutrition that requires
intensive treatment, and it is these definitions therefore, that I have adopted for defining
SAM in this thesis:
− Severe wasting or Marasmus: weight for height less than -3 SD (or z scores) or
less than 70% of the median National Centre for Health Statistics (NCHS)
reference values (36).
− Oedematous malnutrition or Kwashiorkor: symmetrical oedema involving at least
the feet
Many organisations also diagnose SAM when the Middle Upper Arm Circumference
(MUAC) of a child is less than 110mm (37;38). A recent review suggests that MUAC is
a precise, accurate, sensitive and specific indicator for the identification of severe acute
malnutrition and that it is also simple, cheap and acceptable (39). Recently, an informal
scientific committee convened by the WHO concluded that MUAC < 110 mm could be
used as an independent criterion for admission to therapeutic feeding programmes for
children aged 6-59 months (40).
Approximately 2%, which is equivalent to 13 million children living in developing
countries suffer from SAM (41). A recent review paper, on which the author contributed
(see 14.1.1: Appendix 1), estimates that SAM contributes to 1.7 million child deaths per
year. This estimate used the UNICEF global database and applied the epidemiological
approach of Pelletier (42). However other more recent publications have attributed
fewer; 449 000 child deaths, to severe wasting (13). When taken together with the fact
that these figures do not include children who die of oedematous malnutrition, a form of
SAM that in some countries is more common, it is clear that SAM is an important health

problem worldwide. This is made all to clear with a visit to almost any hospital in a
developing country where it is likely that severely malnourished children comprise a
significant proportion of paediatric deaths (43).
Table 2: Analysis of the worldwide burden of acute malnutrition
Adapted from Collins et al. Lancet 2006 (42)
Despite these huge numbers and the high risk of mortality and morbidity that goes with
them, severe acute malnutrition is seldom mentioned in standard child survival
interventions and publications. It is other indicators of malnutrition (low weight for age)
that are used in mortality surveillance data (44) and for the identification of malnutrition
in Growth Monitoring or Integrated Management of Child Illness (IMCI) interventions
across the world (45;46). This means that acute malnutrition in many countries remains
partially hidden and untreated. There is now ongoing discussion of the need for
international agencies such as WHO to differentiate clearly between chronic malnutrition
and acute malnutrition and to prioritise the identification and treatment of SAM within
the child survival agenda (42;47).
6.4 The treatment of severe acute malnutrition during emergencies
The vast majority of cases of SAM can be prevented by economic development and
public health measures designed to increase dietary quantity and quality alone, with no
need for clinical inputs. However, as malnutrition becomes more severe, normal
27
28
physiological mechanisms designed to adapt the organism to differences in food intake
become more pronounced (48-51). These “reductive adaptations” affect every
physiological function in the body mobilising energy and nutrient reserves and
decreasing energy and nutrient demands (3). Initially they are beneficial and allow the
organism to maintain homeostasis. However, as the severity of nutritional insult
increases, adaptations such as those to conserve energy and slow protein turnover
become increasingly damaging (52;53). The organism becomes poikilothermic (49);
loses its ability to produce an acute phase response (54); becomes progressively more
immunosuppressed and loses control of water and electrolyte balance (3). As these
changes progress, treatment must become increasingly intensive and costly if it is to
succeed and units treating SAM are frequently confronted by extremely ill patients who
require intensive medical and nursing care.
6.4.1 Modern management protocols A structured approach to the clinical care of SAM involving ten steps in two phases
(stabilisation and rehabilitation) and taking into account the profound physiological
changes that exist in severe acute malnutrition is now generally accepted as a robust and
effective treatment model (55;56). The current clinical protocols were developed as a
result of a long history of clinical research in the 20th century, particularly prompted by
the spectre of mass starvation associated with each of the world wars (3). International
protocols were first published as a Pan American Health Organisation manual in 1974
and later with minor changes, as the first WHO manual in 1981 (57). This manual
included many of the treatment elements recommended today, such as cautious initial re-
feeding; cautious, predominantly oral, treatment of dehydration with low sodium high
potassium rehydration solutions; enhanced micronutrient content of rehabilitation diets,
and highly energy dense diets to enable catch-up growth. By the end of the 1970s, such
protocols were producing dramatic reductions in case fatality rates in well run, well
resourced units. For example, the children’s nutrition unit in Dhaka Bangladesh, reduced
mortality rates from 20% in 1976 to between 4-7% in 1979 (58). Even in emergency
situations such as Ethiopia and Biafra, the implementation of similar dietary protocols
without the use of systematic antibiotics for all admissions, achieved mortality rates of <
15% (59-61). In 1999, the WHO manual was revised to take into account further
advances in the understanding of the pathophysiology of SAM (29). Changes were made
to reflect new ideas over the role of protein (62-64), the importance of free radicals and

29
antioxidants in the pathogenesis of SAM (65) and the development of the concept of type
1 and type 2 nutrients (25). A growing realisation of the importance of
immunosuppression (14;66) also resulted in the addition of systematic antibiotics for all
cases of SAM. This basic protocol with minor adaptations forms the core of all major
guidelines in use today (34;35;37;67;68) and, with the WHO guidelines for the
management of severe malnutrition in first referral facilities (45), forms part of the
WHO/UNICEF initiative of Integrated Management of Childhood Illness (IMCI) (46).
The essential elements of these guidelines are:
− Prevention or treatment of hypoglycaemia, hypothermia, dehydration and
correction of electrolyte imbalances right at the start of treatment. Rehydrate
more slowly than usual using a rehydration fluid with a lower sodium and higher
potassium content. Use low osmolarity feeds during the initial stages of treatment
to reduce incidence of refeeding diarrhoea.
− Treatment of infection by giving all patients broad-spectrum antibiotics on
admission, paying particular attention to gram negative cover. Treat any patient
suffering from complications with parenteral antibiotics.
− Correction of micronutrient imbalances. Withhold iron supplementation until the
recovery phase of treatment.
− Cautious initial re-feeding, carefully controlling intake to provide just enough
energy and protein to meet basic needs (80-100 kcal kg-1day-1 and 1-1.5g protein
kg-1day-1) in the first phase of treatment.
− Provision of formula diets enhanced with a range of micronutrients to correct
micronutrient imbalance. This method uses a dietary approach to
supplementation, wherein the ratio of all the different nutrients, including energy,
is fixed, as opposed to a medical approach, where supplements are provided as a
dose per kg body weight.
− Transfer to a rehabilitation phase on the stabilisation of vital signs such as
appetite. This indicates that infections are coming under control, the liver is able
to metabolize the diet, and other metabolic abnormalities are improving.
− Provision of 150-220 kcal kg-1day-1 and 4-5 g kg-1day-1 protein in highly energy
dense feeds provided 8 times a day to allow for the metabolic costs of catch-up
growth during the rehabilitation phase of treatment.
− Provision of psycho-social stimulation during rehabilitation.

− Provision of education to carers and a structured follow-up after discharge.
6.4.2 Delivery of treatment During nutritional emergencies when organisations are faced with large numbers of
severely malnourished individuals it is the inpatient therapeutic feeding centre (TFC) or
the paediatric ward that usually provides most of the treatment required (67;69;70).
These centres are often set up and/or supported by external international agencies;
provide high quality individual patient care, and appropriate diets and medical treatments
based on the WHO inpatient management protocols described above and elsewhere
(37;38;71). The widely accepted standards that many organisations use to measure the
quality of care delivered have been developed by the Sphere Project’s Humanitarian
Charter and Minimum Standards in Disaster Response and now, as well as purely
clinical indicators, include others that are more community and socio-economic
orientated (72) (Figure 3).
− Proportion of exits from a therapeutic feeding programme who have died is < 10%
− Proportion of exits from a therapeutic feeding programme who have recovered is > 75%
− Proportion of exits from a therapeutic feeding programme who have defaulted is < 15%
− Minimum mean rate of weight gain (g kg-1 person-1 day-1) is >8g − Nutritional and medical care is provided to people who are severely
malnourished according to clinically proven therapeutic care protocols. − Discharge criteria include non-anthropometric indices such as: good
appetite; no diarrhoea, fever, parasitic infestation or other untreated illness; and no micronutrient deficiencies.
− Nutrition worker to patient ratio is at least 1:10 − All carers of severely malnourished individuals are able to feed and care
for them. In 2003 the following indicators were added to the second edition of the Sphere
Standards:
− Coverage is > 50% in rural areas and >70% in urban areas. In a camp situation coverage is > 90%.
− Breastfeeding and psycho social support are given equal attention as clinical care
Figure 3: Sphere indicators for Therapeutic Feeding Programmes
30

31
6.4.3 Therapeutic Foods As our understanding of severe acute malnutrition and its treatment has advanced so to
have the foods with which we provide treatment become more sophisticated. In TFCs
severely malnourished children are fed a milk based diet that has been developed to meet
their specific requirements for protein, energy and micronutrients (73). Formula 75 (F
75), so called because it contains 75 kcal per 100 ml of product, is used during the first
phase of treatment. It is low in protein and is fed to the patient at maintenance energy
levels in order that the intestine, liver and other organs are not overloaded. Formula 100
(F 100), so called because it contains 100 kcal per 100 ml of product, is used during the
second and third phases of treatment. It is a more nutrient dense product, containing iron
and more protein than F 75 and is provided in quantities that promote rapid weight gain.
Blended foods are often used as a dietary supplement for those in the last phase of
treatment for severe acute malnutrition or for those receiving treatment for malnutrition
at home (71). These foods most commonly contain a mixture of corn and soy flours and
micronutrients. They are given, sometimes with oil and sugar, as a dry take-home ration
and are used to make porridge or bread to supplement household food intake. The same
‘corn soy blend’ (CSB) flour is now produced to WFP standards by many countries
under different names including Lukini phala in Malawi and Famix in Ethiopia.
6.4.3.1 Ready-to-Use Therapeutic Food Because powdered milk, such as F100, is an excellent medium for bacteria, it has to be
prepared before each meal and used by experienced staff. F100 resembles infant formula
and its distribution by nutrition health workers might undermine efforts to discourage
formula feeding and promote breastfeeding. Non milk-based diets could be used to avoid
these problems, but these diets have been described as less effective in the rehabilitation
of children suffering from severe acute malnutrition (74). Until recently this has limited
treatment of SAM to inpatient health facilities which is seen to hold problems of
acceptability and coverage as described above. Therefore, during the past few years,
researchers have developed a new Ready-to-Use Therapeutic Food (RUTF), that is made
from peanuts, dried milk, oil, sugar and micronutrients. It is designed to be nutritionally
equivalent to, but more energy dense than, F100 and can be used easily and stored safely

for several months in a simple pot (75;76). These foods have been vital to the feasibility
and success of the studies described in this thesis.
RUTF is a paste that patients can eat directly from the packet. It has an energy density
that is > 5 times that of F100 (543 kcal/100 g), but a similar ratio of nutrients to energy
(see Table 3). It is produced by replacing part of the dried skim milk used in the F100
formula with peanut butter. Studies have shown that it is at least as well accepted by
children as is F100; that it is effective for rehabilitating severely malnourished children,
and that it promotes faster weight gain than F100. In a study reported by Diop, this was
thought to be because children consumed higher daily amounts of energy during the
same number of meals on a diet of RUTF, than on a diet of F100 (77).
Table 3: Comparison of the nutritional composition of F100 and RUTF
Reproduced from Diop et al, 2003 (77)
32

33
Because RUTF does not require any mixing or cooking before use, and as it contains
almost no water, it is highly resistant to bacterial contamination, and therefore is safer
than powdered milk to send home with mothers.
However, as RUTF was developed as an equivalent to F100, i.e. with amounts of both
macro and micro nutrients suitable for children entering phase II of treatment, its use for
children that had not been through phase I feeds with F75, for children with nutritional
oedema and for particularly small children (> 6months < 4kg) was of concern to many
(76;78).
6.5 The impact of programmes to treat severe acute malnutrition
Impact measurement of programmes to treat SAM has historically focussed on clinical
outcomes such as cure and case fatality rates. This emphasis was underlined by the first
edition of The Sphere Project’s Humanitarian Charter and Minimum Standards in
Disaster Response that gave a number of indicators for monitoring programme quality
that were exclusively centre orientated (17). This focus on improving effectiveness of
interventions and case management at an individual level, rather than a population level,
has not been unusual in child survival interventions and was highlighted in 2003 by the
Bellagio Child Survival group who in their second paper in the series discussed the poor
global coverage of child survival interventions and suggested that “ the child survival
effort had lost its focus” (79). There is now renewed focus on the wider impact of
interventions and, specifically, the effectiveness of interventions to reduce morbidity and
mortality at a population level.
For the purpose of this thesis I will consider impact to include both individual and
population level indicators, these include recovery and case fatality at the individual
level and coverage of interventions at the population level. “Adequacy” of these
outcomes will be measured primarily against the Sphere Standards.

34
6.5.1 Recovery and case fatality rates Although there is good evidence that the implementation of modern management
protocols for the treatment of SAM combined with attention to the quality of care can
substantially decrease CFRs (58;78;80-84) there are many treatment units that continue
to struggle to keep mortality low and recovery high. In humanitarian emergencies across
the world performance of TFCs is varied. Many international agencies often report a case
fatality rate that meets Sphere’s indicator for mortality. Rossi et al recently evaluated the
impact and appropriateness of programmes for the management and treatment of severe
malnutrition in Burundi. They reported average mortality and recovery rates across 20
TFCs in 2004 that exceeded Sphere standards (85). Unfortunately the performance of the
majority of humanitarian nutrition programmes is rarely published, making a thorough
review difficult here. Grellety in her doctoral thesis in 2000, details the largest study of
TFC outcomes to date. This contains data from 11,287 patients (8,484 children) admitted
to 20 TFCs run by a specialised TFC agency between 1993 and 1998. These TFCs
achieved an average mortality of 12% and an average recovery rate of 65% (78), which,
although better than that seen before implementation of standardised protocols, remain
outside the Sphere standard of < 10% for mortality and > 75% for recovery. Other TFC
programmes implemented in nutritional crisis such as that reported by Pecoul et al in
Niger in 1988 report similar outcomes, a recovery rate of 46.2% and mortality of 14.4%,
to Grellety’s (86).
High default rates in emergency therapeutic feeding programmes are often a cause of low
recovery rates, and reduced recovery considerably in the Grellety (default rate of 18%)
and Pecoul (default rate of 18%) studies reported above. The problem of default is an
important one that reduces recovery overall and may, unbeknown to programme
managers, be increasing mortality.
Outside of nutritional emergencies, modern management protocols have not resulted in a
widespread decrease in CFRs in most hospitals in the developing world, many of which
continue to see mortality rates of above 20% (87-90). The persistence of high CFRs is
often attributed to inappropriate case management as a result of poor knowledge and
inadequate training (56;91-93). Although there is good evidence that adequate training of
health staff in the management of SAM is essential if the implementation of the WHO
guidelines is to be effective, the evidence base supporting the view that the wider

35
implementation of the WHO guidelines alone is the key to reducing CFRs, is debated
(42;47;56;89;90;94;95). There have been no published controlled trials looking at the
impact of the use of the WHO protocol in operational settings. Instead, the evidence for
the positive impacts of the WHO protocols comes from observational studies performed
in selected hospitals or well resourced NGO humanitarian operations and there has been
some discussion over the extent to which most of these studies are representative of the
majority of first line rural hospitals or clinics in developing countries (42;88).
Sustained reductions in CFRs to less than 10% have been obtained in large, specialised,
well financed institutions in Dhaka, Bangladesh (58;96). One was the ICCDR-B, an
internationally acclaimed research institution, the other, the Children’s Nutrition Unit in
central Dhaka, Bangladesh, a unit of 60 inpatient beds and 40 day care places, staffed by
seven doctors and twelve nurses. Other positive reports showing the impact of
implementing the WHO guidelines come from South Africa and Brazil (81;97;98),
countries where health staff to population ratios are lower than those in Bangladesh but
considerably higher than those reported in the twenty African countries most affected by
SAM (99). These reports underline the importance of appropriate protocols in effective
management, but indicate that even in these relatively affluent countries, the availability
of resources is also a vital determinant of CFRs. The use of similar protocols and the
addition of a complex mineral vitamin mix in Nutrition Rehabilitation Units (NRUs) in
Malawi have had little impact on CFRs in nutritional rehabilitation units, only reducing
them from 25 to 20% (100). This is likely to be as a result of a combination of factors
including a high prevalence of HIV among the severely malnourished, but also as a result
of these resource constraints (see Study 2, section 9.3.6).
The recent WHO informal consultation reviewing current literature on severe
malnutrition quotes two examples that purport to show the WHO guidelines are feasible
and sustainable even in small district hospitals with limited resources (56). The first,
reports CFRs falling from 46% to 21% and 25% to 18% at two hospitals in South Africa
following the introduction of WHO guidelines. In this study, implementation of the
guidelines required a number of changes in nursing, medical and administrative systems
and additional day to day support. Despite this and the presence of researchers, mortality
rates never fell below 18% and in one of the two hospitals returned to 38% after the
intervention period (92). The other study cited by the consultation assessed the impact of

36
the introduction of the guidelines in a district general hospital in South Africa and a
mission hospital in Ghana. These were the only two hospitals out of sixteen that the
researchers considered suitable for conducting such a study. The introduction of the
protocol was combined with two weeks of specialist paediatric input and the no-cost
provision of a commercial vitamin and mineral complex. The selection criteria for the
hospitals included agreement to provide administrative support for food supply, presence
of essential drugs, provision of free treatment with no cost recovery schemes in place,
the absence of bed space limitations and the presence of staff interested and committed
to improving the management of severe acute malnutrition. These criteria ruled out
fourteen of the sixteen hospitals approached for the study and would rule out the
majority of rural hospitals and clinics in Africa. Staffing levels in both the hospitals were
high, with approximately one nurse to ten paediatric beds in each. Despite this, the
impact on mortality rates was equivocal. In one, the CFR appeared to drop from 35 to
18%; however, concurrent changes to entry criteria resulted in a 400% increase in
admissions and confounded interpretation. In the other hospital, CFRs only dropped
from 21 to 18% (84).
Lastly it is important to note that the severity of illness at presentation for treatment is a
major determinant of CFRs (25;90). A study in Malawi compared CFRs in 1,625 cases
of kwashiorkor treated at central hospitals, district hospitals or rural clinics. Mortality
rates were 30.5%, 25.8% and 7.5% respectively, despite the fact that quality of care was
far superior in the central hospital and worst in the rural clinic (89). In many other
hospitals in Africa, the high prevalence of HIV and tuberculosis, and socio-economic
changes resulting in an increasing severity of illness at presentation, are given as the
main determinants of persistently high CFRs (101-103).
6.5.1.1 Impact of HIV and tuberculosis on mortality An estimated 38.6 million (33.4 million–46.0 million) people worldwide were living
with HIV at the end of 2005. An estimated 4.1 million (3.4 million–6.2 million) became
newly infected with HIV and an estimated 2.8 million (2.4 million–3.3 million) lost their
lives to AIDS (104). Africa remains the global epicenter of this pandemic, where, in
countries like Malawi, HIV/AIDS defining illness can account for as many as three-
quarters of adult medical hospital admissions (105) and among malnourished children,
the HIV prevalence can be as high as 40-45% (106). HIV/AIDS (or wasting syndrome as

37
it is colloquially know) and acute malnutrition are closely linked in the developing
world, with each increasing an individual’s vulnerabilities to the other. It is now widely
recognised that making the link between HIV and nutrition is critical to achieving
progress in prevention and treatment programmes (107). It follows that, by increasing
both the numbers of children admitted to inpatient units with severe acute malnutrition
and by increasing the complexity of the condition at presentation, HIV is making SAM
much harder to treat successfully (101). This is important to consider when examining
the impact of SAM treatment programmes. Without doubt, HIV is making it harder for
many units to achieve international standards even where treatment is provided
according to WHO protocols (103). In addition, widely used models to standardize
mortality in therapeutic feeding programmes such as the Prudhon Index (see 8.4.7.4)
have not considered HIV status as a prognostic indicator. Where HIV is highly prevalent,
this is likely to considerably increase the estimation of ‘excess’ mortality using such
models (108).
6.5.2 Coverage Coverage of basic child survival interventions has long been a key indicator for
measuring the health and nutrition status of the world’s children. The State of the
World’s Children Reports produced annually by UNICEF include coverage indicators
for exclusive breast feeding, vitamin A supplementation, use of iodized salt,
immunization and use of treated bed nets (6). It is a vital determinant of the impact of
any health or nutrition intervention and is recently attracting considerable attention as
such (79;109;110). Figure 4 demonstrates the importance of coverage as an indicator of
impact or met need. High coverage but low cure-rate programs will meet a higher
proportion of need in a population than those with low coverage but high cure rate (111).
In order to maximise impact, programmes must have both high coverage and high cure
rates.
Despite this, the measurement of coverage of programmes that treat severe malnutrition
has, historically, not been standard practice (see 6.5 above) and the importance of
coverage has only recently been acknowledged for emergency selective feeding
interventions with the addition of coverage indicators into the second edition of Sphere
(72). One contributor to the paucity of data on therapeutic feeding programme coverage
has been the absence of a feasible and accurate means of measurement (112).

Figure 4: The relationship between coverage, cure rate and met need (impact) in
the treatment of SAM
Shengelia et al 2005 presents a useful conceptual framework that refers to ‘met need’, as
presented above, as ‘effective coverage’ and argues that effective coverage is only
achieved with a combination of quality (cure rate as we describe it above), utilisation and
actual need (as opposed to perceived need). Utilisation results from a number of factors
that decide access and demand for a service; these include perceived need, distance,
price, opportunity costs of seeking care, cultural acceptability, perceived quality and
economic status (113).
Little coverage data exists from the past 20 years of inpatient programmes that treat
SAM, and there have been few specific studies of coverage. In one of the few published
studies looking at TFC coverage in humanitarian crises, Van Damme estimated coverage
rates for TFC programmes treating severely malnourished refugees in Guinea to be less
than 4% (114). Jha, during a health intervention cost-effectiveness evaluation also in
Guinea estimated the coverage of treatment services for severe malnutrition at 5% (115).
Other data suggest that such low levels of TFC coverage are not unusual. Table 4
presents coverage data from the national Nutritional Rehabilitation Unit (NRU) 38

programme in Malawi. These data, obtained ten months after the start of the emergency
intervention in 2002, show low coverage rates for all the NRUs. The average NRU
coverage of cases of severe acute malnutrition was approximately 18.7% (13.8% rural
and 38.6% urban) with none of the NRUs meeting current Sphere standards for coverage.
Table 4: Reported coverage rates in the national NRU programme in Malawi, April
2003, ten months after the start of emergency interventions.
District Target nos. (SAM), nutritional surveys,
April 2003
No. in NRUs
(April 2003)
% Coverage
Lilongwe Rural 1,459 178 12.2% Ntchisi 270 23 8.5% Kasungu 516 107 20.7% Rumphi 46 8 17.4% Rural totals and average coverage
2,291 316 13.8%
Lilongwe Urban 315 62 19.7% Blantyre 270 164 60.7% Urban total and average coverage
585 226 38.6%
Total and average coverage
2,561 480 18.7%
6.6 The need for a change in the way we address SAM There is no doubt that the intensive care provided by inpatient units for SAM is essential
for the initial phase of treatment of patients with complicated malnutrition associated
with anorexia, septicaemia, hypothermia, hypoglycaemia, or severe dehydration (69),
and, as reviewed in section 6.4.1 above, clinical protocols for the management of these
patients are now capable of reducing case fatality rates to below 5%. However, most of
these units are in the poorest parts of the poorest countries in the world, have severe
resource and staff constraints and are usually centralised, with long distances between
them and many of the malnourished people they need to treat. In addition, the carers of
the malnourished children almost always come from the poorest families and have great
demands on their time in order to maintain their fragile existence. In order to achieve
good impact at a population level, clinical management protocols must take these
geographic and socioeconomic realities into account. This involves balancing the
potentially conflicting demands and ethics of clinical medicine and public health. The
39

40
clinician’s duty to provide the best possible care must be reconciled with the public
health imperative to provide the greatest possible benefit to the largest number of people.
Bryce et al of the Bellagio Child Survival Group brought new focus to this issue in 2003
stating that the distinction between interventions (to improve case management) and
delivery strategies (to reach all that need treatment) is essential for reducing child
mortality (110).
Concerns over the limited capacity to treat and limited impact of the hospital treatment
of SAM are not new. Since the 1960s, the high cost and poor success rates of hospital
inpatient treatment has prompted continued debate over whether hospitals are the best
place to treat such patients (116-119). In 1971 Cook asked the question “Is hospital the
place for the treatment of malnourished children?” (116). His review of published
literature highlighted a number of problems with hospital treatment that are very relevant
to TFC care today.
Firstly, he identified a problem of coverage, where the number of children who qualified
for admission far exceeded the capacity of the hospital. During nutritional emergencies
humanitarian agencies are often faced with numbers of severely malnourished that run in
to the thousands. To provide timely treatment to high numbers of people according to
international Sphere standards for TFC care most often proves impossible. To do so
would require high numbers of centres that quickly become operational and that have a
huge requirement for skilled local and expatriate staff. In many countries this mismatch
of high numbers requiring care to low levels of resources continues well after the
emergency has ended (92;93).
Secondly, Cook discussed problems associated with separating mother from child.
Although in the majority of centre-based programmes today the mother remains with the
child for the duration of treatment this is likely to bring about problems of its own. The
centralised nature of many TFC programmes means that the primary caretaker must
leave home for a considerable length of time. Nobody has studied the effects of this
factor, but given a mother’s importance to household food security and food supply and
the well known clustering effect of malnutrition within families (120), it is likely that the
negative effects are substantial and that the opportunity costs involved of complying with

41
treatment might delay presentation. The absence of a mother could be particularly
damaging for younger siblings, many of whom might also be moderately malnourished.
Thirdly, Cook and others have highlighted the danger of cross infection (121).
Congregation of severely malnourished patients inside centres promotes centre-acquired
infection, a major problem in many TFCs today. Also, as De Waal noted in his book
“Famine that kills” the congregation of communities around feeding centres promotes
breakdowns in public health, an important cause of mortality and morbidity during
famine (122).
To the above issues we can now add others. Collins has discussed the undermining of
local health infrastructures and the process of disempowerment of communities that
takes place during emergencies (69). Often, TFCs are managed by international agencies
in isolation from any local health capacity that does exist, with the only overlap between
the two taking place in the form of skilled staff moving from local structures to better
paid jobs in humanitarian aid. TFC programmes tend to ignore the socio-economic
factors associated with severe malnutrition. This means that at the least they miss
opportunities to build self-reliance for the treatment and prevention of malnutrition in the
future, and at most can create problems for beneficiary families that impact on family
nutritional status.
Finally there is the issue of cost effectiveness. TFCs with their large parallel structures,
long intensive treatment protocol and very high staff:patient ratio are a costly
intervention per child treated. Add to this the problem of chronic cyclical emergencies,
where the need for a treatment facility for severe malnutrition becomes long-term, and
difficult questions arise for aid agencies and international donors regarding the reality of
prolonged costly interventions. Figure 5 attempts to summarise the main concerns with
centre-based TFC care for SAM.
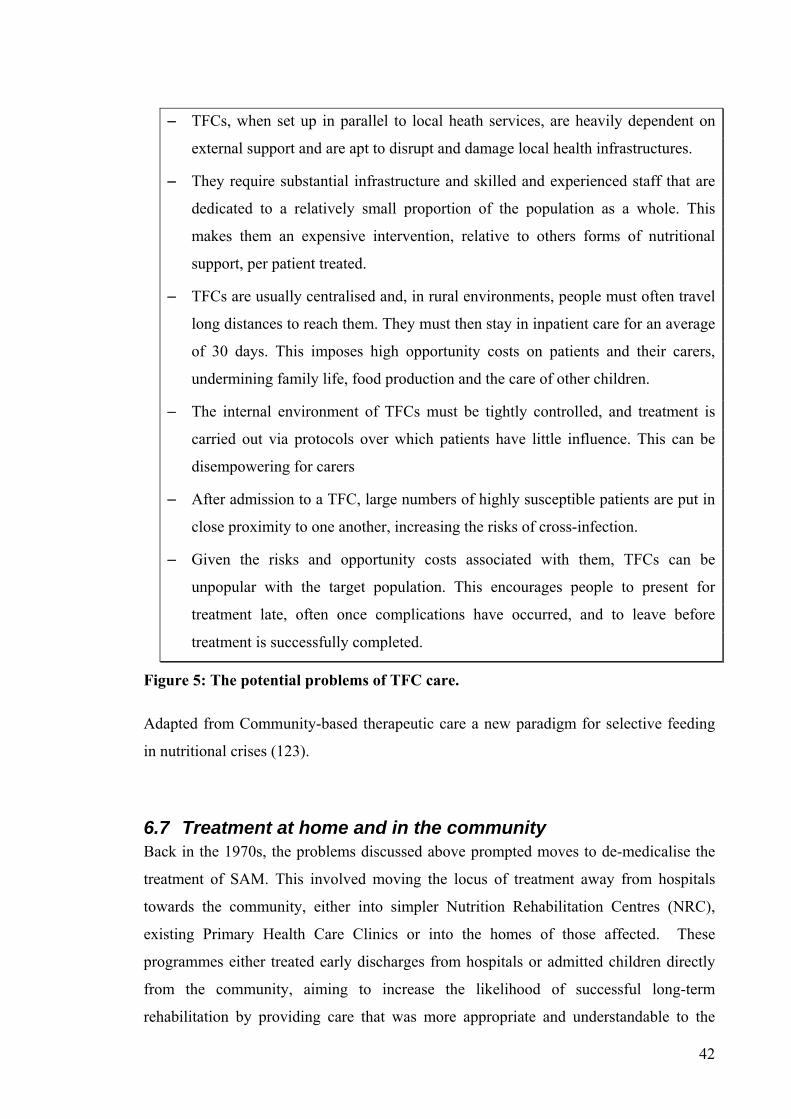
42
− TFCs, when set up in parallel to local heath services, are heavily dependent on
external support and are apt to disrupt and damage local health infrastructures.
− They require substantial infrastructure and skilled and experienced staff that are
dedicated to a relatively small proportion of the population as a whole. This
makes them an expensive intervention, relative to others forms of nutritional
support, per patient treated.
− TFCs are usually centralised and, in rural environments, people must often travel
long distances to reach them. They must then stay in inpatient care for an average
of 30 days. This imposes high opportunity costs on patients and their carers,
undermining family life, food production and the care of other children.
− The internal environment of TFCs must be tightly controlled, and treatment is
carried out via protocols over which patients have little influence. This can be
disempowering for carers
− After admission to a TFC, large numbers of highly susceptible patients are put in
close proximity to one another, increasing the risks of cross-infection.
− Given the risks and opportunity costs associated with them, TFCs can be
unpopular with the target population. This encourages people to present for
treatment late, often once complications have occurred, and to leave before
treatment is successfully completed.
Figure 5: The potential problems of TFC care.
Adapted from Community-based therapeutic care a new paradigm for selective feeding
in nutritional crises (123).
6.7 Treatment at home and in the community Back in the 1970s, the problems discussed above prompted moves to de-medicalise the
treatment of SAM. This involved moving the locus of treatment away from hospitals
towards the community, either into simpler Nutrition Rehabilitation Centres (NRC),
existing Primary Health Care Clinics or into the homes of those affected. These
programmes either treated early discharges from hospitals or admitted children directly
from the community, aiming to increase the likelihood of successful long-term
rehabilitation by providing care that was more appropriate and understandable to the
43
community i.e. treating malnutrition with foods that were recognisable to local people
(116). In the 70s and 80s, NRCs were usually simple treatment centres staffed by an
auxiliary nurse who provided only basic oral medication, ingredients for nutritious meals
and nutrition and health and hygiene education. Children ate on site and the
responsibility for care remained with the mothers who prepared the food using local
ingredients, according to special recipes (124). Many of these programmes provided
support and education to mothers to facilitate them to treat their children at home.
The results from these early outpatient treatment programmes were variable. Some
NRCs achieved low mortality and positive impacts on growth while children were
attending the centres, but usually these benefits were not maintained after discharge
(125;126). In other programmes, mortality and relapse rates both during treatment and
post discharge have been high, and rates of weight gain very low (127-129). Daily
attendance at these centres by caregivers was often unpopular and poor effectiveness was
a result of this spasmodic attendance as well as low nutrient dense meals. In addition
there was often limited opportunity for weight gain as many children were not wasted at
admission; being admitted with low weight for age rather than low weight for height or
MUAC (130).
Ashworth made two thorough reviews of published programmes that implemented
community-based rehabilitation (i.e. outside the inpatient hospital unit) of severely
malnourished children within routine health systems in non emergency settings
(130;131). She used two indicators of effectiveness: a CFR of < 5% and an average
weight gain of >5g/kg/day. In the first review, six (22%) out of the twenty seven studies
reviewed achieved effectiveness by these standards; in the second the success rate had
gone up to 33% (eleven studies out of thirty three) and of the 13 published within the last
10 years 62% (8 studies) were effective. The most common shortcoming was an
inadequate appreciation of the specific nutritional needs of malnourished children, in
particular the need to provide regular, energy and nutrient dense food during
rehabilitation to allow for catch-up growth and recovery. Few of the day care and
residential units provided appropriate nutritional support and several attempted to
rehabilitate severely malnourished children with advice and education alone. Even those
that did provide some nutritional support usually reported few details about foods or
quantities. Other studies achieved low weight gain and low recovery rates despite

44
providing high energy supplements. In some of the programmes, the use of Gomez
weight for age entry criteria probably contributed to low weight gains, as weight for age
overestimates the severity of acute malnutrition in stunted children, thereby decreasing
the potential for rapid catch-up growth. Many of the day care and residential studies were
unpopular with caregivers because of the high opportunity costs of attending treatment.
Of the eleven programmes that did meet Ashworth’s effectiveness criteria in her second
review, two were delivered through well resourced (relative to many centres in Africa)
day care centres in Bangladesh and South Africa, two through health clinics and seven
were home-based. Of the home-based programmes two provided no food at all, but relied
on education and support to mothers for the nutritional care of their children. These
studies took place in Bangladesh where it was feasible for carers to access the kind of
foods required for the rehabilitation of their severely malnourished child. This would not
have been feasible in many of the Africa-based studies. The remaining five home-based
programmes provided RUTF (see section 6.7.1 below). Rates of weight gain in these
programmes varied considerably (12 g/kg/day in Sierra Leone vs. 3-5 in some of the
Malawi studies). Ashworth attributes this variable weight gain to ‘careful training of
caregivers and an effective stabilisation phase’ in Sierra Leone, but there is no mention
of the level of wasting at baseline; the Sierra Leone children were possibly more wasted
at admission (WFH < 70% of the median no oedema) than the Malawi children (mean
WFH z scores -1.9 to -3.4 considerable oedema).
The successful programmes discussed in these reviews tended to share several features:
− All of them aimed to provide, either through the promotion of appropriate local
foods or through the provision of RUTF, a high energy, nutrient dense food that
allowed for good catch up growth and minimal relapse (See Table 3 for
composition of RUTF).
− Those that provided inpatient care did so for less than 4 weeks.
− All programmes considered at least some of the wider social, economic, and
health issues that face poor families.
− Staff were motivated and carefully trained.
− All programmes received some kind of external support, be it staff and technical
assistance in Bangladesh and South Africa or RUTF in Malawi.

45
6.7.1 Recent introduction of RUTF into outpatient care for SAM. The recent development of Ready to Use Therapeutic Food (RUTF) (see section 6.4.3)
has greatly eased the difficulties associated with providing a suitable high energy,
nutrient dense food that is safe to use in outpatient programmes. In a clinical trial in
severely malnourished children undertaken in a therapeutic feeding centre in Senegal,
energy intakes (193 vs. 137 kcal/kg/day P < 0.001), rates of weight gain (15.6 vs. 10.1
g/kg/day P < 0.001) and time to recovery (13.4 vs. 17.3 days P < 0.001) were all
significantly better in those receiving RUTF from phase 2 than in those receiving F100
(77).
6.7.1.1 Evaluation of the efficacy of RUTF for rehabilitating children with SAM from phase two of treatment
Of the seven successful home-based studies that did meet Ashworth’s effectiveness
criteria above, five of them provided RUTF as the nutritional treatment. These included
trials in Malawi which have successfully used RUTF as a take-home ration for children
in the recovery phase of the treatment of SAM. In one, an RUTF take home ration of
175 Kcal/kg/day successfully rehabilitated HIV negative severely malnourished children,
after early discharge from an NRU providing phase one care according to WHO
protocols. Rates of weight gain (5.2 vs. 3.1 g/kg/day) and the proportion of children
recovering to 100% weight for height (95% v 78%, RR 1.2, 95% CI 1.1 to 1.3) were
significantly better in the RUTF groups when compared to groups receiving a larger
amount of energy from corn/soya blend flour supplied by the World Food Programme
(132). In the same trial, 56% of the HIV positive children treated with RUTF also
achieved 100% weight for height (133). In another trial implemented in rural NRUs, 175
Kcal/kg/day of locally made RUTF given during the rehabilitation phase of treatment,
produced significantly better rates of weight gain (3.5 vs. 2.0 g/kg/day), recovery (79%
vs. 46% RR 2.8 95% CI 2.5 to 3.1) and mortality (3.0 vs. 5.4% OR 0.5 95% CI: 0.3, 0.7)
than the standard inpatient treatment using F100, followed by outpatient supplementation
with a large one off ration (50kg) of corn/soya blend flour (134). A study in Sierra Leone
also used RUTF to successfully rehabilitate children with SAM in an outpatient setting
(135).
46
6.7.1.2 Evaluation of the efficacy of RUTF for rehabilitating children with SAM from phase one of treatment
In addition, studies not included in the Ashworth review, in Niger (136) and again in
Malawi (100) have both used RUTF successfully for the rehabilitation of severely
malnourished children from phase one (i.e. no inpatient care with therapeutic milks
provided) of treatment in an outpatient setting, although the Malawi study did not
produce weight gains of > 5g/kg/day. However, it is important to note for this thesis that
both of these studies have made a number of exclusions that make it difficult to evaluate
the potential effect of outpatient care and RUTF at a programmatic level, particularly as
a treatment from phase one of care. These include: recruiting for the study only after all
the sickest children (Malawi) had been through phase 1 in inpatient treatment that used
therapeutic milks; and in Niger excluding oedematous children and children below 1
year of age from direct outpatient treatment (i.e. using RUTF from phase one of
treatment).
It is also important to note that none of the studies discussed above mentioned or
measured coverage of the affected population, although the programme in Niger has
since been extended to many more decentralised sites, is admitting a higher proportion
directly to outpatient treatment and is reporting low default rates which is a good
indication of high acceptability and probably better coverage (personal communication:
Milton Tectonidis, Nutrition and Health Coordinator, MSF France)
Ashworth’s second review described above lists a number of advantages and
disadvantages of treatment at home with RUTF, some of which are only relevant to the
non-emergency setting (130):
Relevant to all settings:
Advantages:
− Independent of home resources
− Needs no cooking
− Liked by caregivers and children; few defaulters
− Responsive to fluctuating numbers
− RUTF contains electrolytes and micronutrients

47
− Free supplies may provide inducement for clinic attendance
Disadvantages:
− High institutional cost
− Requires clinic nearby or community health workers for monitoring progress,
treating illnesses, and distributing RUTF
− Requires efficient transport and distribution networks
− Requires quality control measures if RUTF is to be locally made
Particularly relevant to the non emergency setting:
Advantages:
− Avoids need for formative research as to which home foods to promote
− Avoids need for intensive teaching of caregivers about what foods to give
Disadvantages:
− Little opportunity to learn about good child-feeding practices and malnutrition
prevention
− Risk of dependency

48
7 Nomenclature, Principles & Conceptual Basis of the CTC Approach
The community-based therapeutic care (CTC) model was designed as an integrated
public health response to acute malnutrition, aiming to treat the majority of cases of
SAM solely as outpatients and integrating this treatment with a variety of other
interventions designed to reduce the incidence of acute malnutrition and improve public
health and food security (69). This put the treatment of SAM firmly within the realm of
public nutrition, a concept first used by Mason et al in 1996, to refer to those
programmes that aim to solve nutrition problems in populations rather than those
laboratory and clinical activities aimed at elucidating basic mechanisms for the provision
of individual treatment (137). CTC programme design attempted to take into account the
socio-economic factors, particularly poverty, high workloads for women and the relative
exclusion from health services, that contribute to the late presentation of cases of acute
malnutrition and other conditions (138). Programmes are therefore highly decentralised
to minimise geographical barriers to access and include intensive community
consultation and mobilisation to maximise understanding and participation. This design
aimed to minimise the costs and maximise access for families and individuals requiring
treatment (42).
The CTC approach was thus designed around four core operating principles:
− Maximising coverage and access: to achieve the greatest possible coverage and
make services accessible for the highest possible proportion of a population in
need.
− Timeliness: to start case-finding and treatment before the prevalence of
malnutrition escalates and to catch the majority of cases of acute malnutrition
before serious medical complications occur.
− Appropriate care: to provide simple, effective outpatient care for those who can
be treated at home and inpatient treatment for those who require more intensive
care in order to survive.
− Care for as long as it is needed: by improving access, to ensure that children can
stay in the programme until they have recovered, and by integrating in to existing
health service where possible, to ensure treatment continues to be available for as
long as acute malnutrition is present in the population.

49
The most important conceptual basis of these principals is that the serious physiological
consequences of acute malnutrition appear late in the evolution of the condition (see
section 6.4 above). If programmes can focus on finding and addressing acute
malnutrition early in the progression of the condition, before its metabolic and
immunological aspects become marked, then outpatient treatment could be a feasible and
effective strategy for a large proportion of children. This required that children be
separated in to 2 groups, those with medical complications that need inpatient treatment
and those without medical complications that might be treated directly in outpatient care.
This was discussed in detail by Collins and Yates in a letter to the Lancet in 2003 (139).
To support the earliest identification of acutely malnourished children, programmes need
to be designed to minimise physical, logistical and socio cultural barriers to access.
Understanding of these premises is developed throughout the studies presented in this
thesis.
The iterative nature of this research and programme development has meant that terms
and acronyms attached to CTC programmes in different countries have varied and have
evolved over time. The most important of these however are:
• SC (stabilisation centre) or NRU (nutritional rehabilitation unit)
• OTP (outpatient therapeutic programme)
• SFP (supplementary feeding programme)
• CTC (community-based therapeutic care)
1. Inpatient Treatment
The stabilisation phase takes place in an inpatient unit called a stabilisation centre (SC)
or nutritional rehabilitation unit (NRU) and is the initial phase of treatment for severe
acute malnutrition with complications. Here life-threatening problems are identified and
treated; specific deficiencies are corrected; metabolic abnormalities are reversed and
feeding begins with Formula 75 milk. This treatment follows the phase 1 protocols laid
out by WHO with minor adaptations that replace F100 milk with RUTF at the end of
phase 1 (29).

50
2. Outpatient Treatment
The outpatient therapeutic feeding programme (OTP) requires programme beneficiaries
to make weekly or fortnightly visits to outpatient treatment centres. It includes two
groups of admissions:
i. Directly admitted into OTP (direct OTP)
Children with severe acute malnutrition with no complications are admitted directly
into OTP with no stabilisation phase
ii. Indirectly admitted into OTP (indirect OTP)
Children who previously suffered from severe acute malnutrition with
complications and have first received inpatient treatment in a stabilisation center.
In the OTP beneficiaries receive a take home ration of RUTF and systematic medical
treatment according to WHO protocols for the treatment of severe acute malnutrition.
3. Supplementary Feeding
The supplementary feeding programme (SFP) provides a dry take home supplementary
ration and basic health care for children discharged from the OTP. Where feasible it
ensures that all those that have been severely malnourished receive at least two months
follow up after they have been discharged from the OTP.
4. Community Mobilisation
A community-based therapeutic care (CTC) programme includes all of the above
components with the addition of measures to mobilise the community in order to
encourage early presentation and compliance.
All four of these programme components have developed and evolved over the course of
the studies presented in this thesis and are discussed in detail below.

51
8 Background to the Studies and Core Methods
8.1 Background Since 2001, debate within the international nutrition community regarding the potential
merits and disadvantages of treating severe acute malnutrition during emergencies at
home has been animated (70;140;141). Letters included in appendix 2 section 14.2
describe one exchange that highlighted differing opinion about the numbers of children
that could be successfully treated at home and about the programme design needed to do
this. On the one hand there is a need to provide services that meet all medical and
metabolic requirements for different age groups and severities of malnutrition. On the
other, it is essential from a public health perspective, to set up a level of services that
within resource poor settings, can reach the majority of those who need treatment. Here
lie some difficult choices. How do Health Ministries and International Agencies working
in developing countries match the specialised needs of the severely malnourished with
the high numbers and wide spread of those who need treatment? There has been some
scepticism during this debate that a community based therapeutic care approach to
treating severe acute malnutrition can obtain good coverage of the needy population
whilst providing the quality of care required to keep programme mortality rates low. For
this reason, this research was designed to take place in phases, with results from initial
research projects defining the parameters essential for subsequent phases of the research
programme.
8.2 Introduction to the studies This thesis presents the main findings from several studies that made up the first phase of
the CTC research and development programme. Chapter 8 presents an in depth analysis
of 3 studies that examined the clinical effectiveness of using RUTF to treat cases of
SAM on an outpatient basis. The first of these studies (study 1), a retrospective cohort
study, was a small study in Southern Ethiopia that used RUTF, delivered through health
centres, to provide outpatient treatment to all children suffering from SAM. There was
no inpatient care available during this study. The second study (study 2), introduced
RUTF to discharge children early from an inpatient nutrition unit (an NRU) in a busy
hospital in Southern Malawi. There were no health centres admitting or treating children
as outpatients in this study. The last prospective cohort study in this chapter (study 3)
52
followed a prospective cohort in central Malawi and introduced a number of
anthropometric and clinical triage criteria to refer children suffering from SAM either to
inpatient care or directly to outpatient treatment delivered through health centres.
Chapter 9 examines the issue of coverage of CTC programmes and presents one study
(study 4) that describes a new survey tool for measuring coverage of selective feeding
programmes and, using this tool, compares coverage of the CTC programme in central
Malawi and of a TFC programme in a neighbouring district. Chapter 10 presents study 5
that describes monitoring data from 17 programmes that have used the CTC model of
treatment across Africa and reflects on factors that have impacted on both the clinical
effectiveness and the coverage of these programmes. Chapter 11 draws together the
lessons learnt from preceding studies and goes on to discuss how the results from these
programmes have started to change international thinking on treatment approaches for
severe acute malnutrition during emergencies. This chapter also discusses the way
forward for future work.
8.3 Research and implementing partners
8.3.1 Valid International For the duration of the work described in this thesis, the author was either working with
(as an employee of Concern Worldwide) or for (as an employee) Valid International.
Valid International is a research and consultancy company that was formed in 1999 with
a goal of improving the impact of humanitarian action, through action-orientated
research. In 2001, Valid International established a partnership with Concern Worldwide
to develop and test the CTC model of treatment for SAM. This partnership extended
throughout the period covered by this thesis. The work described here forms part of a
wider examination of CTC by Valid International and Concern in Africa.
8.3.2 Concern Worldwide Concern Worldwide was an implementing partner for a large proportion of the field
research (detailed in chapters 8, 9 and 10) for this thesis. During the fieldwork in
Ethiopia, the author was employed as a nutrition programme manager by Concern
Worldwide. By 2002, the author was an employee of Valid International but worked
closely with Concern Worldwide on study design, implementation and documentation.
Concern is a non-governmental, not-for-profit organisation, based in Dublin Ireland.

53
Emerging out of church relief programmes during the Biafran war in 1967, Concern has
expanded and secularised and now engages in a variety of developmental and relief
work. Their organisational aim is “..to help people living in extreme poverty achieve
major improvements in their lives, which last and spread without ongoing support from
Concern” (142). At the time of writing, they worked in approximately 28 countries.
Historically, Concern have relied on a strong volunteer ethos. However, with the launch
of the Sphere Project in 1999 and subsequent efforts across the international community
to improve the quality of humanitarian assistance, the organisation has prioritised an
operational research agenda that aims to improve the effectiveness of their programming.
It was within this context in 2001 that the partnership with Valid, to develop and test the
CTC model in a number of countries across Africa, was established.
8.3.3 Other partners Queen Elizabeth Central Hospital (QECH) and the College of Medicine in Blantyre,
Malawi were the main implementing partners for study 3 presented in chapter 8 of this
thesis. The College currently has strong links with the Liverpool School of Tropical
Medicine and St Andrew’s university in the UK. QECH houses, among others, a
paediatric ward and a nutritional rehabilitation unit for the inpatient treatment of severe
acute malnutrition which has long been one of the busiest in the country.
In all the countries of work described in this thesis the MoH has been an extremely
important operational partner. Wherever it has been possible, the work described here
has supported the implementation of CTC programmes through existing health structures
and this has meant considerable involvement at both national and sub national levels of
MoH staff to manage, supervise and implement programme activities.
Valid partnered with several NGOs to implement the CTC programmes discussed in
chapter 10 (Going to scale with CTC). These included Save the Children UK, Save the
Children US, Tearfund and World Vision.
8.4 Core Research Methods To avoid repetition in subsequent chapters this section presents some of the core research
methods used in the cohort studies 1, 2, 3 and 5 that examine the outcomes and clinical

54
effectiveness of CTC research programmes. Specifically, which methods were adopted
for each study is indicated in the sections below.
8.4.1 Subjects All subjects were either inpatients or outpatients of CTC programmes that were
supported by the implementing partners described in section 8.3 above.
The admission criteria for each study are reported in the methods section of each study
(see sections 9.2.3.2; 9.4.4.1.5; 9.3.4.1.2; and 11.2.2.1). These admission criteria varied
slightly according to the national protocol in the country of implementation. The
existence and quality of alternative medical care also played an important role in patient
selection, sometimes forcing the programmes to admit some patients who were not
severely malnourished. Their data were excluded from analysis in studies 1, 2 and 3. In
general, only children with a weight for height of < 70% of the NCHS median, a MUAC
< 11cm or those with nutritional oedema were included in the analysis of each of the
cohort studies. Less severely malnourished children were referred to supplementary
feeding programmes. There were some groups of children that were severely
malnourished with a primarily medical cause, these included children of < 6 months and
those with severe disabilities. These children were also excluded from the main analysis
in studies 1, 2 and 3. The potential inclusion of some primarily medical patients in the
analyses is of most relevance in studies 2 and 3 where the impact of HIV infection on
outcomes of children being treated for severe acute malnutrition is discussed in some
detail.
8.4.2 Measurements, equipment and precision All studies were implemented within operational programmes that were not primarily
research sites. Conditions therefore were sometimes disorganised and with high rates of
mortality and morbidity either present or expected, there was some urgency to get
programmes operational quickly. Often at the start of programmes, there were few
trained staff to cope with high levels of admissions. Workloads were therefore high and
time available for supervision low. These conditions will have promoted errors in
precision and accuracy in the assessment of height, weight, MUAC and clinical data.
They also precluded any formalised assessment of inter and intra staff variability in
measurement precision and accuracy. Therefore, for this thesis, some internal validity
was sacrificed in order to maximise external validity (143).

55
However, several attempts were made to reduce and to quantify measurement errors. In
all sites the staff responsible for weighing, measuring and assessing clinical indicators
were literate and were trained before and during the studies. The details of training at
each study site are discussed below and under the relevant studies (see sections 9.2.3.5;
9.4.4.1.1; and 9.3.4.2.2). Random error in data collection (i.e. randomly distributed)
causing systematic bias was minimised with large sample sizes and by the statistical
methods used i.e. the use of standard deviations and confidence intervals around the
mean. Any systematic errors (or bias) arising during data collection were potentially far
more serious and several steps were taken to avoid introducing systematic errors into the
data. These are described below:
All health staff were trained to collect anthropometric measurements according to WHO
guidelines (144;145).
The hanging Salter scales (25kg max weight) were used to take the weight of each child,
in minimal clothing, and measurements were recorded to the nearest 0.1 kg. The reading
was taken by 1 health worker and recorded immediately. For every study the scales were
regularly adjusted to zero and in studies 2 and 3 in Malawi the scales were calibrated
before and after the study using a known 1 kg weight. Scale calibration in Malawi
revealed no systematic errors in accuracy.
Height measurements were taken using calibrated height/length wooden boards with a
close fitting head/foot piece and measurements were recorded to the nearest 0.1 cm. 2
health staff worked together to measure height and check that readings were accurate.
Children less than 24 months of age (<85cm) were measured lying down and children
over 24 months of age (>=85cm) measured standing up. The reading was recorded
immediately.
Mid-upper arm circumference (MUAC) was measured on the left arm, at the mid point
between the shoulder and elbow. It was expressed in cm to the nearest 0.1cm and
recorded immediately after measurement.

56
Bilateral oedema was diagnosed by placing the thumbs on the upper side of each foot
and/or shin and applying medium pressure for three seconds. Oedema was classified as
present if a skin depression remained after the pressure was released.
Age of the study children was determined from health or growth monitoring cards or
directly from mother’s recall. It was recorded in months.
8.4.3 Data collection and programme monitoring For studies implemented after study 1 (the study in Ethiopia) several tools were
developed to assist the standardised collection of study data and for the monitoring of
individual and programme performance.
8.4.3.1 Individual monitoring & data collection Key elements for the data collection and monitoring for each admission were:
1. The routine collection of medical, nutritional and follow-up data, recorded on
individual monitoring cards.
2. A clear numbering system.
8.4.3.1.1 Monitoring card On admission to each programme component (i.e. inpatient and outpatient) every patient
was issued with a monitoring card. These cards were used by trained health workers for
the recording of a unique patient identification number (see below), basic anthropometric
and clinical data over time, all medical and nutritional treatment and of final exit
outcome. Appendix 3: The monitoring card used in the OTP, Dowa, Malawi, gives an
example of the monitoring card used for the outpatient component in study 3, section 9.4.
Where children went through inpatient care clinicians also used medical notes for
recording of diagnosis and treatment prescription. It was these detailed individual data on
cards that was used for the analyses in studies 2 and 3.
8.4.3.1.2 Numbering In all studies subsequent to study 1 a unique registration number was given to each child
on admission to outpatient or inpatient care. Each registration number was made up of
several parts, for example, for the registration number:
NAM / 003 /OTP

57
− NAM refers to the name of the programme site where outpatient or inpatient
treatment was received
− 003 is the sequential number allocated to the child
− OTP refers to the programme component where the child entered the programme.
The full number allocated to a child on admission was retained as s/he moved through
each level of treatment (i.e. inpatient and outpatient) to discharge. This unique number
was recorded on all records concerning the child, i.e. on individual monitoring cards,
registration books, ration cards, transfer slips (for transfer between programme
components) and identity bracelets. Returning defaulters (i.e. those children that had
absconded from treatment before attainment of cure and subsequently returned, several
weeks later, to complete treatment) retained the same number that they were given on
admission and their treatment continued on the same monitoring card. Readmissions
after relapse (i.e. those children that had attained cure in the programme and
subsequently, several weeks later, were readmitted to the programme as malnourished
again) were given a new number and a new card.
8.4.3.2 Programme monitoring For all studies subsequent to study 1, inpatient treatment units and outpatient treatment
sites completed basic reports every week that tallied the number and type of programme
admissions and exits (see section 14.4 Appendix 4: OTP weekly report, Dowa Malawi).
The data from these reports were entered (usually weekly) in to a designed database
(146), which enabled the analysis of:
− total admissions, exits and the number of children in the programme;
− the number of admissions by category and
− the number of exits by category.
This allowed continuous monitoring of admission, exit and outcome trends overall and
by treatment site. These monitoring data were regularly compared to the standard
indicators of quality for therapeutic feeding interventions laid out by Sphere (72). It was
these data that were used for the analysis presented in study 5 and in some of the
discussion in studies 2 and 3. See section 14.5 Appendix 5: Example of database for data
input and a programme monitoring report, Dowa Malawi.
Additional description of data collection and monitoring can be found under each study.

58
8.4.4 Data coding Data from the individual monitoring records were used for analysis in study 1 and
studies 2 and 3. This section describes the core methods for coding these data.
Oedema was coded as present if there was any mention of oedema on the admission
card. Grade of pitting oedema was coded using the classification of Beattie et al. (147),
(0 = absent, 1 = minimal oedema on the foot or ankle that was demonstrable but not
visible, 2 = visible on foot and lower leg, 3 = generalised, including both feet, legs,
hands and face). Pitting oedema, recorded as present but unquantified, was not graded.
Localisation Degree of severity Classification
Both feet/ankles Mild: pitting barely detectable
+ (1)
Both feet plus lower legs Moderate: pitting in between mild and severe
++ (2)
Generalised, including both feet plus legs, hands, arms and face
Severe: skin very tense, pitting deep
+++ (3)
Figure 6: Classification of oedema
Admission criteria is coded according to the following classification:
− Kwashiorkor: the presence of any bilateral pitting oedema
− Marasmus: weight for height ≤ -3 z scores or ≤ 70% of the median NCHS
reference weight-for-height
− Marasmus kwashiorkor: weight for height ≤ -3 z scores or ≤ 70% of the
median NCHS reference weight-for-height and bilateral pitting oedema
− MUAC: none of the above and mid-upper arm circumference ≤ 11cm
(children > 75cm)
Appetite was coded as present when a child was willing and able to eat RUTF or absent
(anorexic) if not.

59
Fever was coded as present where temperature was >39oC and hypothermia as present
where temperature was < 35oC. This was measured with a standard thermometer.
Hypothermia was defined where the mercury level was read at 35 or below.
Acute lower respiratory infection was coded as present when respiration rate was:
− > 60 respirations/minute for under 2 months.
− > 50 respirations/minute from 2 to 12 months.
− > 40 respirations/minute from 1 to 5 year-olds.
− > 30 respirations/minute for over 5 year-olds.
Severe anaemia was coded as present when the child had very pale conjunctiva and
severe palmer pallor and difficulty breathing and/or a haemoglobin count of <7g/100ml.
Severe superficial infection was coded as present where the child presented with ear
discharge or skin that was ulcerating, raw or peeling or with any infection that required
intra muscular treatment.
Severe dehydration was coded as present if the child presented with a recent history of
diarrhoea, vomiting, fever or sweating and with recent appearance of clinical signs of
dehydration including sunken eyes or weak pulse or low urine output.
Outcome data are coded as either recovered, died, default, transfer or non responder. The
definitions of outcomes vary slightly for each study and therefore are given in the
relevant study sections.
Missing data values are coded as missing.
Additional description of data coding can be found under each study (see sections
9.2.3.5; 9.4.4.2.3; and 9.3.4.2.3)

60
8.4.5 Data entry and verification All data for studies 1, 2 and 3 were transferred from the patient record cards into Epiinfo
version 6.04 (148) using the Epidata data entry programme (149). The Epidata
programme contained a number of checks that helped to ensure the validity of the data
during the data entry process. A check file was created for data entry related to studies 1,
2 and 3 and included some or all of the following examples:
Limiting entry of numbers or dates to a specific range:
− Date of admission and discharge limited to the years covered by study for
example 2002-2003
− Age limited to 1-120 months
− Weight limited to 2-40 kg
− Height limited to 50-150 cm
− MUAC limited to 80-180 mm
Forcing an entry to be made in a field
− Registration number
Help messages to the person entering data included labelling key for all coded fields set
to appear in ‘pop up’ boxes, for example:
− Admission criteria: 1 Marasmus
2 Kwash-Maras
3 Kwashiorkor
4 Other
− Oedema grade: 0 NA
1 +
2 ++
3 +++
The author spent considerable time cleaning all data after data entry. All missing data
were verified missing against original card data. If the data were present on the card they

61
were entered in to the database. All quantitative data were examined with range checks.
The following range was defined for each variable as ‘normal’, any data that fell outside
this range were verified against original card data:
− Age: 0-60 months
− Height: 50-120 cm
− Weight: 2-20 kg
− MUAC: 100-170 mm
The frequency distribution of all quantitative data, including age, height, weight, MUAC,
admission and discharge dates, weight gain and length of stay was closely examined for
outliers. Any data that fell outside +/- 3 standard deviations of the mean were verified
against original card data.
8.4.6 Data manipulation and creating new variables Specific procedures were written in EpiInfo to transform the data. In their original form
individual child data for admission and each week of treatment thereafter were stored in
sequential rows in EpiInfo against ID number. To enable analysis of outcomes, this week
by week data needed to be put in to the same row for each child. The core programmes to
do this were written by Dr Steve Collins, originally for his own doctorate, but required
significant adaptation by the author for her own data. Additional programmes to create
new variables and to produce the required analyses were written by the author.
The anthropometric variables weight for height z scores and percentage of the median
were created by EpiNut, part of the EpiInfo version 6.04 software, which uses the NCHS
standard growth curves as the reference population (36).
Programmes were written in EpiInfo to calculate programme length of stay and weight
gain variables.
Individual weight gains are expressed in g kg-1 day-1. In marasmic patients these are
calculated using the formula:
((discharge weight – admission weight) / admission weight) / number of
days stay in programme

62
For those admitted with oedema, rates of weight gain after oedema had disappeared are
used. The lowest weight achieved during the study is taken as synonymous with the
weight of the child at disappearance of oedema:
((discharge weight - lowest weight achieved during the study) / lowest
weight achieved during the study) / number of days between lowest weight
and discharge.
8.4.7 Data Analysis Unless otherwise stated all data analysis was completed using EpiInfo v6.04 (148) and
SPSS v14.0 (150) and graphics were developed using Microsoft Excel V11 2003 (146).
8.4.7.1 The use of means and medians In describing and comparing data such as age, weight-for-height z scores and % median,
length of stay and weight gain a combination of means and medians are used. If the data
distributions approximated to a ‘normal distribution’, population means are quoted and if
the distributions were skewed, population median values were used. Skewness for all
relevant variables was examined in SPSS and a skewness value greater than 1 was used
to signify a significant difference from a normal, symmetric distribution.
8.4.7.2 Use of Pearson and Yate’s corrected chi square test and the Fisher exact test
The Chi square and Fisher Exact tests were used to test for associations between
variables in 2x2 tables. These were used, for example, to test for associations between
different outcomes (i.e. death, recovery etc) and categories of malnutrition (i.e.
kwashiorkor, marasmus etc) at admission.
8.4.7.3 Use of survival curves Kaplan-Meier survival curves were used to show the timing of discharges, deaths,
defaults and transfers during study implementation.
8.4.7.4 Use of the Prudhon Index A short programme in Excel was developed to calculate the likelihood of death or
‘expected mortality’ of the patients (a prognostic index) in study 3 according to the
equations published by Prudhon et al (151). This equation is based on the weight, height
and oedema status of patients and was calculated only for children that recovered or died
and that were aged 6-59 months as this was the population from which the prognostic
index was derived. The expected mortality was compared with the observed mortality

63
using the Fisher’s exact test to assess for significance. (see section 9.4.4.2.4 for more
detail)
8.4.7.5 Use of relative risk Relative risk is used to quantify any significant increased or decreased risk of, for
example, death in one group of malnourished children compared to another. It is also
used to quantify the difference in risk of mortality between that calculated by the
Prudhon index (see above) and that observed in the studies.
Additional description of data analysis techniques used for specific studies can be found
under sections 9.4.4.2.4; 9.3.4.2.3; and 10.2.3.7.
8.4.8 Ethical approval All of the work presented in this thesis was approved by the Great Ormond Street
Hospital for Children NHS Trust / Institute of Child Health Research Ethics Committee
in London, UK. In addition, the individual studies 2, 3 and 4 were formally approved by
the Ministry of Health and Population in Lilongwe, Malawi.

64
9 Can CTC Achieve Clinical Effectiveness?
9.1 Introduction This chapter presents a series of three studies that aimed to test the clinical effectiveness
of the CTC model of care i.e. one that includes inpatient care for children suffering from
SAM with complications, outpatient care for children suffering from SAM with no
complications and community mobilisation to encourage early presentation and
compliance (See Chapter 7). This series of studies were iterative in nature with results
from the first two studies defining the study and programme protocols for the final study.
The first of these studies took place in Southern Ethiopia in 2000 and was a ‘natural
experiment’. Government policy at the time forced a ‘non-standard’, suboptimal
approach that meant that there was no inpatient care available during this study. All
children suffering from SAM were treated as outpatients with RUTF from health centres.
During study implementation, the author was employed by Concern Worldwide in
Ethiopia and led all data collection and compilation; she went on to play a significant
role in the analysis and publication of these data.
To build on and strengthen results found in the first study, the second study was designed
prospectively and used RUTF to discharge children early from a nutrition unit in a busy
hospital in Southern Malawi. It examines the impact of this on programme mortality and
recovery. There were no health centres admitting or treating children as outpatients in
this study. For this study the author led study design in Malawi, supported data collection
through monitoring visits and led data analysis and write up for publication.
The last study in this chapter took place in central Malawi and was the first to implement
the full CTC model of care which used triage to refer children suffering from SAM with
complications to a stabilisation centre and those suffering from SAM with no
complications directly to outpatient treatment delivered through health centres. It
examined the effectiveness of this treatment strategy for a large group of children over
the first year and a half of the 2002 Southern Africa emergency and disaggregates
response to treatment by age group and category and level of malnutrition. For this study
the author lived in Malawi for the first 12 months of study implementation where she led

65
study design and supported data collection through site monitoring visits. The author
subsequently completed all data analysis and write up for this study.
9.2 Study 1, Ethiopia 2000: Can an outpatient model using RUTF for the treatment of SAM meet Sphere standards?
See Appendix 1, section 14.1.2 for published paper (152)
9.2.1 Background During the field work for this programme, the author was employed as the nutrition field
officer by Concern in Ethiopia and was responsible for nutrition programme design, set
up and monitoring. The programme took place in Bedawacho Woreda (district), in the
Southern Nations Nationalities and Peoples Regional Government (SNNPR) of Ethiopia,
350km south of Addis Ababa.
In July 2000, Bedawacho had experienced three consecutive years of drought and failed
harvests, leading to generalised poor food security. In August 2000, Concern started a
dry Supplementary Feeding Programme (SFP), distributing 3.5 kg of a blended food
(maize, soya, sugar and mineral/vitamins) every fortnight, to each child identified as
having a weight for height less than 80% of the reference weight-for-height (WFH).
This ration provided each child with 918 kcal day-1.
During the first few weeks of the SFP, many of the children that presented to the feeding
centres were identified as suffering from severe acute malnutrition. These children were
dispersed across the Woreda and, due to the difficult topography and poor
communications, many were inaccessible. At the time there was considerable opposition
from the regional Government to the setting up of new TFCs and therefore in patient care
was not available. Consequently all children suffering from SAM were treated solely as
outpatients with weekly attendance at clinics or distribution sites.

The resulting programme data was analysed as a retrospective cohort study.
Figure 7: Bedawacho Woreda, SNNPR Ethiopia
9.2.2 Objective To examine the effectiveness, compared with international standards, of outpatient
treatment for severe acute malnutrition during an emergency relief programme in
Southern Ethiopia.
9.2.3 Method
9.2.3.1 Subjects This study analysed data from 170 patients aged between 6 and 120 months old, admitted
to the Concern outpatient therapeutic programme, Bedawacho, Ethiopia, between 16th
October 2000 and 31st January 2001. Criteria for inclusion in the study were a weight for
height (WFH) percentage of less than or equal to 70% of the NCHS (36) reference,
and/or bilateral pitting oedema. There were no exclusion criteria.
9.2.3.2 Admission and Discharge Criteria
66
The severely malnourished were identified at any of the ten SFP distribution points using
anthropometry and an examination for pedal oedema. After identification, they were
registered into the outpatient therapeutic feeding programme (OTP) and underwent a

67
rapid medical screen. Joint SFP and OTP distributions took place once every two weeks
at each of the ten distribution sites, all of which were located at government primary
health clinics or health centres . Once in the programme, each child attended their nearest
distribution site every week where they were medically examined and received a ration
of RUTF and blended food. In between visits, Concern community nutrition workers
followed up patients in their houses once or twice a week. At these visits they checked
the progress of the child and referred any who were ill to the clinic. Patients were
discharged from the OTP to the SFP once the field staff assessed that their WFH was >
75% of the reference median weight-for-height on two consecutive weeks and that they
were free from infective disease. After discharge into the SFP, outreach workers
continued to follow up patients until they were discharged from that programme when
their WFH was > 85% of the reference median weight-for-height on two consecutive
weeks.
9.2.3.3 Dietary Treatment At admission and each visit thereafter, each child received 14 sachets (92g) of RUTF
(total 1.28 kg) regardless of their weight and 7.5 kg of blended food for 1 week together
with medication according to a protocol. This ration provided 1000 kcal of energy and
24.3 g of protein day-1 (protein-energy ratio = 10%). In addition, all patients in the OTP
received 7.5 kg of blended food, providing 1967 kcal of energy and 79 g of protein day-1
(protein-energy ratio = 16%).
9.2.3.4 Medical Treatment At admission, all patients received medication according to a protocol, using drugs
provided by Concern Worldwide. This protocol consisted of a single oral dose of
Vitamin A (100,000 I.U. <12 months age and 200,000 I.U. for all other age groups); a
single oral dose of mebendazole (250mg for children aged between 12 and 24 months
and 500 mg for all other age groups); and a single oral dose of Folic acid (5 mg). All
patients also received a five day course of the broad-spectrum antibiotic cotrimoxazole
(25mg of Sulfamethoxazole + 5mg of Trimethoprim per kg orally every 12 hours). If
considered to be dehydrated by the admitting staff, they were orally rehydrated using
ReSoMal, an oral rehydration solution specifically designed for the treatment of severe
acute malnutrition.
9.2.3.5 Data Collection The study was implemented as part of the day to day operations of an emergency feeding
operation. The situation was difficult with high rates of mortality and morbidity and
68
insecurity that on one occasion resulted in a machine gun attack on a Concern
Worldwide car. The difficulties of implementing a programme in these circumstances
and the pressures of the work meant that some of the data collection was incomplete.
Admission WFH data was collected for 167 and follow up weight change data for 169 of
the 170 admissions.
On presentation to the SFP, patients were weighed, had their height measured by trained
local enumerators and were assessed for the presence of bilateral pitting pedal oedema.
On registration for the OTP, the clinic nurse performed a rapid clinical screen, assessing
degree of pitting oedema and hydration, and the presence or absence of dysentery,
diarrhoea, anaemia and signs of chest infection. At each follow-up visit to the clinic or
SFP, a nurse recorded follow-up weight, extent of pitting oedema and clinical condition.
Follow up weights, clinical complications, grade of pitting oedema according to the
classification given in chapter 7 (see Figure 6) and all drugs prescribed, were recorded on
the patient’s individual treatment card. Outcome (death in the programme, discharge
alive, default or transfer) was also recorded on the patient’s card and in the programme’s
registers.
9.2.3.6 Data Coding Discharge outcomes were defined as:
Death
Death whilst registered on the programme (within two weeks of failing to attend the
OTP).
Recovered
For two consecutive weeks:
− a weight-for-height of more than or equal to 75% of the median NCHS
reference and;
− absence of bilateral pitting oedema;
Default
Failure to attend treatment on two consecutive occasions
Transfer
Transferred out of the programme to hospital

9.2.4 Results
9.2.4.1 Mortality, recovery and default Table 5 presents outcome data. One hundred and forty four patients (85%) recovered,
seven patients (4.1%) died and eight patients (4.7%) defaulted. Table 6 compares
recovery, mortality and default rates with the Sphere standard indicators for therapeutic
feeding. Recovery, mortality and default rates were all within the Sphere indicators. Case
fatality rates were 4.7% for marasmic, 14.3% for marasmic-kwashiorkor and 0.0% for
admissions with kwashiorkor (Table 5).
Table 5: Outcome data for children treated in study 1
n (%) n median (range) n median
(range) n median (range)
overall 106 14 50recovered 144 85 86 10 48died 7 4.1 5 2 0defaulted 8 4.7 6 0 2transferred 11 6.5 9 2 0case fatality rate (%) 4.1 4.7% 14.3% 0.0%
overall 170 42 (28 - 56) 106 42 (28 - 56) 14 56 (35 - 70) 50 42 (28 - 42)recovered 144 42 (28 - 56) 86 42 (28 - 56) 10 56 (42 - 70) 48 42 (28 - 45)died 7 19.2 5 14 (14 - 26) 2 13 (4 - 21)defaulted 8 18.0 6 10.5 (7 - 35) 2 18 (14 - 21)transferred 11 77.8 9 70 (42 - 105) 2 67 (63 - 70)overall 169 2.9 (1.8 - 5.1) 106 3.6 (2.1 - 6.0) 14 2.6 (2.2 - 5.5) 49 2.1 (0.9 - 3.2)recovered 143 3.4 (2.2 - 5.5) 86 4.4 (2.6 - 7.2) 10 3.9 (2.3 - 6.6) 47 2.2 (1.0 - 3.2)died 7 0.0 (0.0 - 0.7) 5 0.0 (0.0 - 0.0) 2 0.3 (0.0 - 0.7)defaulted 8 0.0 (-1.3 - +1.5) 6 0.0 (0.0 - 3.1) 2 -2.5 (-3.9 - -1.1)transferred 11 1.6 (0.8 - 2.2) 9 1.6 (1.1 - 2.0) 2 1.1 (-0.2 - +2.4)
weight gain (g kg-1 day-1)
total
170
kwashiorkor
outcome
length of stay(days)
marasmus marasmic kwashiorkor
* Range = Interquartile range
69

Table 6: A comparison between the Sphere (2000) indicators for therapeutic feeding
programmes and the study results
Key indicator International standard
Study result
Proportion of exits from a therapeutic feeding programme who have died is < 10% 4.1
Proportion of exits from a therapeutic feeding programme who have recovered is > 75% 85
Proportion of exits from a therapeutic feeding programme who have defaulted is < 15% 4.7
Minimum mean rate of weight gain (g kg-1 person-1
day-1) > 8g 2.86
0
20
40
60
80
100
120
140
0 14 28 42 56 70 84 98 112
days in programme
disc
harg
es
0
2
4
6
8
10
12
deat
hs, d
efau
lts &
tran
sfer
s
discharges
dead
defaults
transfers
Figure 8: Kaplan-Meier survival curves showing the timing of discharges, deaths,
defaults and transfers in study 1
9.2.4.2 Length of stay and weight gain Median [IQ range] time to recovery was 42 [28 - 56] days, median time to death 14 [7 -
26] days and median stay in the programme was 14 [7 - 28] days. Median [IQ range]
time to clinical resolution of oedema was 28 [21 – 35] days, 28 [24.5 – 38.5] for
70

71
marasmic-kwashiorkor and 27 [21 – 35] for kwashiorkor patients. Overall, the median
[IQ range] rate of weight gain amongst all admissions was 3.2 [1.9 – 5.6] g kg-1 day-1.
Among patients that recovered the median rates of weight gain were 4.8 [2.9 – 8.1] g kg-1
day-1 for marasmic children, 4.0 [2.7 – 4.3] g kg-1 day-1 for marasmic-kwashiorkor
children, and 2.7 [0.0 – 4.8] g kg-1 day-1 for those with kwashiorkor. Two deaths
occurred during the first two weeks of treatment (Figure 8).
9.2.5 Discussion
9.2.5.1 Mortality, recovery and default The mortality, recovery and default rates in this programme appeared better than
internationally accepted minimum standards for TFCs. This suggested that in this
context, severe acute malnutrition could be treated effectively on an outpatient basis and
that outpatient treatment was acceptable to participants.
9.2.5.2 Appropriateness of dietary regime However, not all patient groups in this study did equally well. Two out of the fourteen
patients with marasmic-kwashiorkor died. One potential cause of their increased
mortality is that the dietary regime was inappropriate for these patients. Patients with
marasmic-kwashiorkor suffer from profound metabolic dys-adaptation, are invariably
infected, often anorexic and have a high risk of death and complications (3). It is for this
group of patients especially that the intensive care and cautious re-feeding regimens
available during phase 1 of TFC treatment is important for the attainment of low case
fatality rates. The dietary regimes provided here may not have been appropriate for these
patients. Conventional treatment guidelines call for an intake of between 80–100 kcal kg-
1 day-1, a protein to energy ratio of about 5%, less than 8mg/kg body weight of sodium
and no iron during the initial phase of treatment; and greater than 200 kcal kg-1 day-1
during the recovery phase of treatment (34). The outpatient treatment regime in this
study provided approximately 43.9mg /kg body weight of sodium, 2.7mg/kg of iron and
an average of 400 kcal kg-1 day-1 right from the start of treatment. In addition,
oedematous patients lost oedema more slowly than is normal during TFC based
treatment using F75, and it is possible that a sub-optimal dietary composition that was
too high in protein contributed to their delayed recovery. This has been seen elsewhere
(153).

72
This study provided a large amount of calories to try to ensure that even if the rations
were shared with other family members, the patient still received sufficient food to
enable adequate catch-up growth. If during the first few days of treatment a severely
malnourished child consumed their entire ration, there was a risk of serious metabolic
imbalance. We felt that such overfeeding was unlikely as previous research into the
supplementary feeding of moderately malnourished children has shown that take home
rations are usually shared with other family members (154). In addition, metabolic
dysfunction sufficient to produce life threatening metabolic imbalance from overfeeding,
is usually associated with anorexia that tends to limit spontaneous intake. Figure 8 shows
that only two of the seven deaths (29%) occurred during the first two weeks of treatment,
the period usually associated with mortality from overfeeding (30), suggesting that
overprovision of calories was not a major contributor to mortality in this study.
9.2.5.3 Length of stay and weight gain Length of stay was longer and rate of weight gain lower than would be expected in a well
run TFC programme (72). This study did not investigate factors influencing the rates of
response. However, in a TFC, where children are given 200 kcal kg-1 day-1 during the
recovery phase of treatment, weight gain would be expected to be in the region of 10g
kg-1 day-1 (29). The low mortality rate seen in this study suggests that children were not
sicker than those that present to many TFC programmes. It is likely therefore that the
low range of weight gain observed was due to sharing of both the RUTF and the blended
food rations. It may also be that the children treated in this study were less wasted than
many seen in TFC programmes. This will also have reduced proportional weight gain. In
a conventional TFC, it is important that patients recover and are discharged as soon as
possible. Severely malnourished patients are immunocompromised and when in a TFC,
are exposed to many foreign pathogens. The risk of nosocomial infection is therefore
high. In an outpatient programme, the severely malnourished are not removed from their
home environments and are not congregated together. The danger of nosocomial
infection is therefore much lower (77). Although it is still preferable that patients recover
quickly, the safer surroundings remove the imperative for patients to recover as fast as
possible. More than 25% of marasmic patients gained weight at greater than 8 g kg-1
day-1. Presumably this was due to a combination of the patient receiving a greater
proportion of the RUTF and supplementary food as well as positive feeding and caring

73
practices. Subsequent studies in this thesis have examined the possibility of using
mechanisms such as follow up at home by CHWs and community group support
networks, for improving home-based support to encourage faster recovery.
9.2.5.4 Population level impact Finally, this study did not collect data on programme coverage (the proportion of the
severely malnourished population that were admitted into the programme), and this was
a serious omission.

74
9.3 Study 2, Southern Malawi: the impact of introducing RUTF into a central hospital with a high HIV caseload.
See Appendix 1, section 14.1.3 for published paper (155)
9.3.1 Introduction and aims The study in Ethiopia demonstrated that outpatient care using RUTF could, in certain
circumstances, attain international standards for recovery mortality and default rates.
However, this study was retrospective in nature, programme data were generated from a
less than ideal research environment and the study was not able to examine the use of
RUTF in an ideal programme setting due to the absence of inpatient care. There
remained therefore many unanswered questions around the clinical effectiveness of using
RUTF for children suffering from SAM in an outpatient setting and around how best to
deliver treatment.
In Malawi in 2002, levels of overcrowding and of mortality related to severe
malnutrition in many centrally located NRUs remained unacceptably high (see Figure 19
below). Therefore it became important to examine alternative, feasible approaches that
could be introduced with relatively little impact on existing resources and protocols,
which could reduce the pressure on inpatient units and that might reduce mortality. This
provided an opportunity to take one step back, and more cautiously and rigorously
examine the effectiveness of using RUTF from phase two of treatment in a more
controlled research setting.
Therefore, this study aimed to prospectively examine an approach that would, within
current resources and structures, decongest a central NRU in Blantyre, Southern Malawi
by discharging children suffering from SAM immediately after phase one treatment to
outpatient care with RUTF.
9.3.2 Objective To assess the operational outcomes of implementing a combined approach to the
treatment of severe acute malnutrition using:
1. an initial inpatient stabilisation phase, based on WHO guidelines,
2. a subsequent outpatient recovery phase with ready-to-use therapeutic food.

75
9.3.3 Background Moyo House NRU is situated within Queen Elizabeth Central Hospital (QECH),
Blantyre. Blantyre District is 2012 km2 and has a population of 809,397 of whom
502,053 live in urban and semi-urban township areas and the remainder in rural areas
(156). The estimated prevalence of HIV among people aged between 15 and 49 years in
Blantyre District is 22.3%, the highest in the country (157). Moyo is Malawi’s biggest
and busiest NRU, regularly admitting over 1200 children each year (unpublished data:
‘Action Against Hunger’ attendance records 2002-4). The mortality rate of children
being treated for severe acute malnutrition in the unit has been high, between 20% and
40%, for many years (89). Many of the children from rural areas have to travel long
distances (up to 40km), often by foot, to reach the unit.
Prior to Malawi’s 2002/3 food emergency, studies implemented from QECH assessed
the use of home based treatment for SAM with RUTF. These studies demonstrated good
weight gains and cure rates of 86% and 75% respectively for HIV negative and positive
children (132;133). However, these encouraging results were recorded in children
recruited after phase 1 treatment and did not address the ongoing high inpatient
mortality. In addition, these studies were able to remunerate travel costs to help sustain
outpatient clinic attendance through to recovery.
In an HIV prevalence study undertaken in the paediatric wards of QECH 40% of the
malnourished children tested positive and HIV infection contributed to over 40% of all
paediatric deaths (106). A further study in Moyo House nutrition unit assessed the
impact of HIV infection on the clinical presentation and case fatality of SAM (101).
HIV sero-prevalence among malnourished children was reported as 34.4% and overall
inpatient mortality was 28%. The same unit had earlier reported a case fatality rate of
30.5% for children with kwashiorkor (89). These last two studies discussed the
difficulties in maintaining food supply lines, accessing suitable training and maintaining
staff motivation. In resource limited settings such as these, improved case management
of both SAM, and especially HIV-related SAM is urgently needed.
In September 2002, as a result of the Food Emergency, an international NGO started
support to the nutrition unit team in Moyo House. Staff were retrained according to latest

76
WHO guidelines, locally produced milk feeds were replaced by pre-packed F75 and
F100 formulae milks (Nutriset, France) and supply lines of drugs, blankets and bed nets
were established. Despite these efforts an audit over the 3 month period December 02-
March 03 showed that the case fatality rate had remained unchanged at 29%, with
HIV/AIDS infection contributing to 32% of deaths, and average inpatient stays were 14
days. Cure rates were 45%. (Geenan, ACF unpublished data 2003). The Ministry of
Health and Population shared concern about the poor outcomes and agreed that a new
treatment approach could be evaluated.
At the time of the study the NRU was staffed by a trained paediatrician, 1-2
paediatricians in training and a rotating intern. There were 6 full time nurses, 2 health
assistants and 2 patient attendants. Just prior to the study, staff received training from
WHO trainers on the inpatient management of SAM followed by training on the use of
RUTF outpatient protocols.
9.3.4 Methods
9.3.4.1 Programme methods This study ran from May 2003, when RUTF was introduced to the unit as a second phase
treatment. The study phase stopped 1 year later, although treatment with RUTF
continued beyond this date.
9.3.4.1.1 Procedures All children that presented at Moyo House were either referred from the paediatric ward
or were self-referred from the community. There was no active community screening for
malnutrition nor any decentralised admission sites. At the NRU children were screened
for severe malnutrition using anthropometry and a brief examination for pedal oedema.
After identification, they underwent a medical screening and started to receive standard
inpatient phase 1 treatment according to WHO (34) and Malawi National protocols. The
child’s medical and nutritional status and food intake was monitored closely throughout
the duration of their inpatient stay. When appetite improved children were transferred to
the recovery phase during which nutrient density of feeds was gradually increased.
When these feeds were well tolerated, appetite was good and infections under control,
milk feeds were replaced with RUTF.

77
HIV testing was intermittently available, dependent on available resources and ongoing
studies at the time. When it was available it was offered after counselling of carers by an
independent team. Results were recorded. HIV treatment programmes for children were
not well established at the time of the study.
After discharge from the NRU each child returned to Moyo House once every two weeks
to attend the outpatient clinic. Later in the study, in October 2003, a second outpatient
clinic was established in Lirangwe, a rural health centre 25 km away from QECH. Any
child living closer to this clinic was referred here to continue their outpatient treatment.
At each visit to an outpatient clinic the child was seen by a doctor and/or nurse,
underwent follow up nutritional and medical examinations and received a 2 week ration
of RUTF and of a locally produced blended flour of maize and soya. The RUTF was
prescribed as a ‘medicine’ for the recovering child and the blended flour was given as a
family ration to try and prevent excessive sharing of the RUTF. In between clinic visits
outreach workers followed up children at home that had defaulted from treatment. At
these visits they checked the nutritional progress of the child and referred any who were
ill or still malnourished back to the clinic.
9.3.4.1.2 Admission and discharge criteria Children were admitted to the programme according to national protocol; if weight for
height was less than or equal to 70% of the median NCHS reference weight-for-height
and/or they presented with bilateral pitting oedema and/or their age was > 6 months and
weight < 4kg. All children completed phase 1 treatment in the NRU. Once the child was
seen to finish a test dose of RUTF s/he was discharged to the outpatient care programme
Children were discharged from the programme once the clinic nurse assessed that their
weight for height was ≥ 85% of the reference weight-for-height on two consecutive
clinic visits and that they were free from oedema and treatable infection.
9.3.4.1.3 Dietary treatment In the NRU inpatient dietary treatment included an initial phase of feeding with Formula
75 at 100 kcal kg-1 day-1 followed by a transitional phase of feeding with Formula 100 at
125 kcal kg-1 day-1. RUTF was gradually introduced at the end of inpatient treatment.
The child was discharged to outpatient care when s/he was eating 175-200 kcal kg-1 day-1
of RUTF. At each outpatient clinic each child received enough RUTF to provide them
with 200-250 kcal kg-1 day-1 until their next clinic visit. In addition, all children in

78
outpatient care received a family ration of 2 kg of blended flour that provided 542 kcal
day-1.
9.3.4.1.4 Medical treatment On admission to the NRU, all patients received medication according to the standard
WHO and Malawi protocol for the treatment of severe malnutrition. This protocol
consisted of a single oral dose of Vitamin A (100,000 I.U. <12 months age and 200,000
I.U. for all other age groups); a single oral dose of mebendazole (250mg for children
aged between 12 and 24 months and 500 mg for all other age groups); and a single oral
dose of Folic acid (5 mg). All patients also routinely received a broad-spectrum
antibiotic. For most children this was amoxicillin 250mg three times daily . Dehydrated
children were treated with ReSoMal, an oral rehydration solution specifically designed
for the treatment of severe malnutrition. At each outpatient clinic children were
reassessed and treated according to clinical findings.
9.3.4.2 Research methods
9.3.4.2.1 Subjects This study analysed data from 1270 children admitted for treatment to Moyo House
nutritional rehabilitation unit. Criteria for inclusion in analysis were:
1. Severe acute malnutrition according to WHO and national protocol classification
(=weight for height less than or equal to 70% or -3 z scores of the NCHS
reference and/or bilateral pitting oedema and/or age>6 months and weight<4kg)
2. Age more than 5 months.
3. Absence of any severe disability.
193 children admitted on to the programme fell outside these criteria for inclusion,
leaving 1077 for the analysis.
9.3.4.2.2 Data Collection This study was implemented as part of the day to day operation of an emergency feeding
programme. The difficulties of implementing a programme in these circumstances and
the pressures of the work meant that some of the data collection was incomplete.
On presentation to the NRU, patients were weighed, had their height measured by trained
local nurses and were assessed for the presence of bilateral pitting pedal oedema. Those
79
with a WFH less than or equal to 70% of the reference weight-for-height and/or with
bilateral pitting oedema, an age > 5 months and absence of any severe disability were
admitted to the study. Other children that fell outside these criteria but were still
considered sick enough to warrant treatment were provided with the full treatment
described above but excluded from study analysis.
On admission to the NRU, a doctor performed a rapid clinical screen, assessing degree of
pitting oedema, hydration, dysentery, diarrhoea, anaemia and signs of chest infection and
filled out a patient monitoring card very similar to that used in Dowa, Malawi. At each
follow-up visit to the outpatient clinic, a nurse recorded follow-up weight, extent of
pitting oedema and clinical condition. Outcome (death in the programme, discharge
alive, and default) was recorded on individual monitoring cards and in the programme’s
registers. An outcome and/or clinical condition for those defaulters that were followed up
and found at home were also recorded on the patient’s cards.
An independent consumer satisfaction survey was led by an MSc student of the
Liverpool School of Tropical Medicine, UK. Data were collected through several
interviews and focus group discussions (FGDs) with mothers of children admitted to the
programme. Respondents were chosen randomly by drawing individual programme
monitoring cards from the file. The interviews were conducted privately, using a
structured questionnaire and lasted for between 20-30 minutes. Notes were made by a
local research assistant who attended each interview. Each FGD included 5-6 mothers,
lasted between 45-60 minutes and was taped on to cassette.
9.3.4.2.3 Data coding HIV status was coded as positive if the test returned a positive result and negative if the
test returned a negative result. Outcome data was coded as ‘recovered’, ‘died’, or
‘defaulted’. Any child that was transferred to another paediatric ward in QECH was
followed up and allocated to one of these three outcomes above.
Discharge outcomes were defined as:
Death
Death whilst registered on the programme (within two weeks of failing to attend the
OTP).
80
Recovered
For two consecutive weeks:
− a weight-for-height of more than or equal to 85% of the median NCHS
reference;
− and a MUAC of > 11cm (children > 75cm);
− and absence of bilateral pitting oedema;
− and absence of treatable infection
Default
Failure to attend treatment on two consecutive occasions
All defaulters were coded as either seen well, seen unwell or lost to follow up.
Missing data values were coded as missing.
Both the interview notes and the discussions on cassette were translated from Chichewa
to English by the local research assistant and then summarised.
For additional research methods that describe measurements, equipment and precision;
data collection; data coding and data analysis techniques see core methods section 8.4.
9.3.5 Results Admission WFH data was recorded for 1044 and follow up weight change data for 791
of the 1077 admissions analysed in this study.
Table 7 presents patient admission profile. The sex distribution was similar (p>0.05),
with 53.7% males and 46.3% females. 843 children (78.3%) suffered from oedematous
malnutrition, (732 [68.0%] kwashiorkor and 111 [10.3%] marasmic-kwashiorkor), and
228 (21.2%) from marasmus.

Table 7: Admission characteristics of children treated in study 2
nmedian
(IQ range) nmedian
(IQ range) nmedian
(IQ range) nmedian
(IQ range) nmedian
(IQ range)overall 1077 24 (17-33) 228 19 (13-25) 111 20 (15-26) 731 25 (19-36) 6 9 (6-13)recovered 626 24 (18-36) 76 19 (14-26) 42 19 (15-27) 506 25 (19-37) 2 11 (8-13)died 276 21 (14-28) 108 20 (13-27) 47 18 (15-28) 117 24 (16-32) 4 8 (6-12)defaulted 174 23 (16-28) 44 18 (12-24) 22 23 (15-25) 108 24 (18-36) 0
mean (SD)
mean (SD)
mean (SD)
mean (SD)
mean (SD)
overall 1044 -2.3 (1.3) 226 -3.7 (0.6) 111 -3.8 (0.6) 705 -1.7 (1.1) 2 -2.9 (0.1)recovered 614 -2.0 (1.2) 76 -3.5 (0.5) 42 -3.7 (0.6) 495 -1.6 (1.0) 1 -2.8died 260 -3.1 (1.2) 107 -3.8 (0.7) 47 -3.9 (0.6) 105 -2.1 (1.0) 1 -3.0defaulted 170 -2.5 (1.3) 43 -3.7 (0.5) 22 -3.7 (0.4) 105 -1.8 (1.1) 0
admission weight for
height (z-scores)
total marasmus marasmic kwashiorkor kwashiorkorVariable
age (months)
> 6month < 4kg
9.3.5.1 Overall outcomes by HIV status Table 8 and Figure 9, the trial profile, presents outcome data stratified by HIV status.
Table 8: Outcome by HIV status
n (%) n (%) n (%) n (%)overall 1077 186 73 818recovered 626 58.1 64 34.4 50 68.5 512 62.6died 277 25.7 92 49.5 11 15.1 174 21.3defaulted 174 16.2 30 16.1 12 16.4 132 16.1
median (IQ range)
median (IQ range)
median (IQ range)
median (IQ range)
overall 1059 38 (17-62) 185 41 (13-85) 73 49 (27-82) 801 37 (17-55)recovered 626 49 (36-70) 64 69 (50-109) 50 63 (41-84) 512 47 (36-64)died 260 7 (3-18) 91 15 (7-49) 11 10 (7-23) 158 5 (2-11)defaulted 173 24 (13-50) 30 36 (24-100) 12 31 (20-83) 131 21 (10-41)overall 791 5.0 (2.7-7.6) 110 3.2 (1.1-5.9) 63 6.2 (3.2-8.4) 618 5.0 (3.0-7.7)recovered 585 5.2 (3.4-7.5) 56 5.0 (3.2-7.0) 45 6.9 (4.4-8.4) 484 5.2 (3.3-7.5)died 69 1.2 (0-5.1) 38 1.1 (0-2.2) 7 3.6 (0-9.3) 24 3.4 (0-13.5)defaulted 137 3.1 (0.8-8.6) 16 2.4 (0.3-5.2) 11 2.5 (0.2-7.9) 110 3.9 (1.0-9.3)
unknown
outcome
length of stay (days)
HIV -
weight gain (g/kg/day)
total HIV +
81

Inpatient care
1077 children eligible
HIV positive 186
HIV negative 73
HIV unknown 818
Died 46 (24.7%)
Recovered 69 (94.5%)
Died 4 (5.5%)
Died 144 (17.6%)
Outpatient care 883 children
HIV positive 140
Died 46 (32.9%)
defaulted 30 (21.4%)
HIV negative 69
HIV unknown 674
Recovered 50 (72.5%)
Recovered 512 (76.0%)
Died 7 (10.1%)
Died 30 (4.5%)
defaulted 12 (17.4%)
defaulted 132 (19.5%)
Recovered 140 (75.3%)
Recovered 674 (82.4%)
Recovered 64 (45.7%)
Figure 9: The trial profile
Overall recovery rate was 58.1%; case fatality rate 25.7%; and default rate 16.2%.
186 children (17.3%) were confirmed HIV seropositive. Confirmed HIV was
significantly higher (p<0.0001) in marasmic children (90/228, 39.5%) than in those
suffering from oedematous malnutrition (94/842, 11.2%).
HIV had significant impact on mortality. Of the total known HIV seropositive children,
92/186(49.5%) died vs. 11/73(15.1%) of known seronegative children (p <0.001). Of
outpatient deaths 46/83(55.4%) were confirmed HIV positive.
82

9.3.5.2 Outcomes by level of treatment The overall case fatality rate was 25.7%, of whom 194/1077(18.0%) died whilst
inpatients and 83/883(9.4%) died as outpatients.
103 (53.1%) of the inpatient deaths occurred within the first 4 days of admission (Figure
10).
0%10%20%30%40%50%60%70%80%90%
100%
adm 1 3 5 7 9 11 13 15 17 19 24 29
days in NRU
deat
hs n
=194
Figure 10: Kaplan-Meier survival curve showing the timing of deaths in the NRU
9.3.5.3 Default Of the 174 defaulters 84 (48.3%) were traced and a final outcome identified (See Figure
11). 90 (8.4%) of the children admitted on to the study were lost to follow up. The
recovery rate rose to 63% when defaulted children who had nutritionally recovered by
follow up were recoded as recovered.
83

52% (90)
5% (9)7% (12)
36% (63)
seen wellseen unwelldied > 1month after exitlost to follow up
Figure 11: Defaulter outcomes
9.3.5.4 Length of stay and weight gain Overall, median [IQ range] length of stay in the programme for those children that
recovered was 49 days [36-70]. Length of stay was longer for confirmed HIV sero-
positive children (69 days [50-109]) than for HIV sero-negative children (63 days [41-
84]) but not significantly so (Table 8). The median inpatient stay was 9 days [7-13] and
outpatient stay was 36 days [28-59]. Overall, the median [IQ range] weight gain in the
programme for children who recovered was 5.2 g kg-1 day-1 [3.4-7.5].
9.3.5.5 Acceptability of care to programme participants RUTF was widely accepted by children, including those with advanced HIV disease, and
was more acceptable than milk based therapeutic feeds. In focus group discussion carers
valued the short hospital stay and ongoing outpatient follow up. Transport costs and
distance to the NRU were however prohibitive for some families.
9.3.6 Discussion Overall programme mortality during this intervention remained high at 25.7% and did
not meet the international standard of less than 10% for therapeutic care.
84

85
9.3.6.1 Contributing factors to mortality There are several factors that are likely to have contributed to this persistently high
mortality rate. The high prevalence of HIV among malnourished children admitted to
QECH and its association with mortality is well documented (101;106). In this study,
46% of inpatient deaths occurred in patients who were known to be HIV positive.
However, as this study did not test for HIV routinely it is likely that at least some of the
mortality in the group with unknown HIV status was also HIV related. Of the children
who died in outpatient care 55.4% were confirmed HIV sero-positive. The programme
mortality rate for confirmed HIV sero-negative children (15.1%) is lower but does not
meet the Sphere international standard of less than 10%. This mortality is complicated
however by the fact that they were particularly sick children that i.e. they had shown
signs of infection that warranted an HIV test.
53.1% of inpatient deaths occurred within the first 4 days of admission (Figure 10). This
suggests that children were very sick on arrival at the unit. Moyo House is a centralized
nutritional rehabilitation unit that covers a large target area. Distance and high
opportunity costs of travelling to and staying at the unit are likely to have delayed
presentation. Qualitative data collected by FGD and interview from mothers of
malnourished children receiving treatment showed a strong preference for more
decentralised treatment to reduce the opportunity costs associated with care. The high
default rates during this study also suggest some problems with acceptability by study
participants. In addition, the study NRU location within a tertiary level referral hospital
meant that a proportion of the unit’s referrals came from the main emergency paediatric
ward where malnutrition was secondary to other serious illness. This is likely to have
resulted in a higher proportion of sicker children presenting here than at a more rural
NRU. In the paediatric unit children did not receive any specialised nutritional treatment
and this is likely to have further increased the time between onset of acute malnutrition
and receiving appropriate treatment. Very sick children require complicated treatment
regimes that increase staff workloads and require significant inputs. Although Queen
Elizabeth Hospital is relatively well resourced compared to other hospitals in Malawi
(89), staffing and resource levels were insufficient to implement certain aspects of the
protocols, such as close 24 hour monitoring, that the WHO require for such children.
Although the unit did decongest in comparison to previous years, early discharge and
shorter inpatient stays did not completely solve the problem of overcrowding, and over
night and at weekends there was often only one patient attendant for 90 children. This

86
finding reflects similar experience elsewhere in Africa where lack of human resources, in
particular skilled staff, has been identified as a major limitation to reducing case fatality
rates (87;92;158). In summary, the combination of high HIV prevalence, complex and
late case presentation and staffing levels insufficient to meet high workloads are
probably the main factors behind the persistently high mortality rate in this unit.
9.3.6.2 Comparison of study outcomes with previous years Several factors complicated comparison of our outcome data with previous years. Some
monitoring data exists from the NRU programme that ran up to the introduction of
RUTF but as there was no concrete definition of ‘cure’, children were discharged when
they were ‘clinically well’ rather than at 80 or 85% weight for height and they were not
followed up in the community. This study, through the outpatient component of the
programme, put substantial resources in to following children up until discharge at 85%.
Therefore, the author feels that in order to compare like with like, any comparison of
these study data with previous monitoring data can only be made, tentatively, by
comparing inpatient programme statistics from each period. In September 2002 an
international NGO providing some technical support to the NRU undertook an audit of
deaths in the unit, employing additional resources to ensure accurate recording of
mortality data. Comparison of these data with data from the same season during our
study, show a fall in mortality from 29% to 18% during our study, a rise in cure rate
from 45% to 63% and a reduced average inpatient length of stay by 5 days. Although
data were not available to control for the level of malnutrition between the two groups,
this fall in mortality might be attributed to a number of plausible factors. During the
period of the death audit in 2002-2003 there was a diarrhoeal epidemic that resulted in
the deaths of 11 children over a 5 day period. During this study there was no outbreak of
any infection recorded. Reduced nosocomial infection therefore, because of less ward
overcrowding, could be one reason for the reduction in mortality. Less inpatients and
decreased workload may also have helped health staff improve quality of care through
better implementation of the WHO protocols on which they were trained. Staff morale
was certainly seen to improve during this study with nursing staff requesting transfer to
the unit at the annual staff rotation meetings: a phenomenon unheard of previously.

87
9.3.6.3 Addressing mortality in the future Although the introduction of ARVs should reduce mortality rates, it is unlikely that the
unit will meet the international standard unless steps are taken to encourage earlier
presentation. The outpatient treatment protocols used differed from those proposed by
the full CTC model where access to services should be decentralised and a proportion of
cases of SAM with no complications treated solely as outpatients. By contrast, the
treatment in this study remained centralised and all cases of SAM were initially admitted
as inpatients. This placed high demands on families accessing care and may have
delayed presentation and increased default rates. Admitting all cases into inpatient care
for phase 1 is also likely to be a contributing factor to overcrowding and cross infection
and probably decreased the degree to which scarce medical and nutritional resources
could be focused on the sickest patients.
In an effort to address some of these problems a rural outpatient clinic in Lirangwe, 25
kms north of QECH was set up 5 months in to the study. Although this did not address
the problem of the high opportunity cost of initial access to treatment and overcrowding
in the inpatient unit, it did reduce the opportunity costs for many mothers of attending
follow up outpatient care. This appears to be reflected in a lower default rate in Lirangwe
(4/44 9.1%) compared to that found overall (16.2%), although numbers are too small to
demonstrate significance (9.1% 95% CI 0.6%, 17.6%). Recovery and mortality rates here
were also much better than that found overall although this may be a reflection of the
lower HIV prevalence rates in rural areas than one of any difference in presentation time.
Promoting earlier presentation and decreasing NRU congestion in Moyo House will need
a change of treatment focus. Instead of designing the programme from the perspective of
the health care provider and simply extending services out from the hospital into the
community, the programme needs to start by building the understanding and
participation of communities. Allowing families to access care in local clinics would
reduce their opportunity costs, and in doing so may encourage earlier presentation and
reduce the proportion who present with medical complications. The use of RUTF as an
outpatient treatment in this study was relatively effective. If children survived inpatient
treatment and were not HIV positive mortality was low: 5.0% (37/743). This suggests
that such a change of treatment focus could be successful. This would subsequently
allow the programme to have a stronger focus on coverage, an aspect of programme

88
impact that was not considered in this study. Treating a smaller proportion of cases as
inpatients would allow scarce hospital inpatient resources to be reserved for the sickest
children who require the intensive treatment provided by the WHO phase 1 protocol in
order to survive. Any decentralised nutrition intervention in a high HIV prevalence area
such as this would need to ensure access to HIV and other diagnostic and treatment
facilities using well defined referral criteria. However, reducing the opportunity costs of
programme attendance is especially important in the context of the HIV epidemic in
Malawi. HIV positive children took, on average, 20 days longer to recover than HIV
negative children in this programme. Spending large amounts of time attending
treatment programmes can have a particularly negative impact on the food and economic
security of this group.

89
9.4 Study 3, Central Malawi: the impact of combining decentralised outpatient treatment with inpatient care and triage on clinical outcomes.
9.4.1 Introduction and aims The results of study two suggest that, HIV disease aside, effectiveness as measured by
recovery and mortality rates might be improved by a change in programme design. Study
three therefore went on to test this hypothesis by implementing the full CTC model i.e.
one that included inpatient phase one care only for those suffering from SAM with
complications; a system of triage to identify these complicated cases and decentralisation
and social mobilisation techniques to encourage early presentation and compliance. This
study took place in central Malawi, an area known to have much lower rates of HIV than
those seen in the south.
It aimed to answer questions around the clinical effectiveness of the CTC model for
different groups of children, how best to deliver treatment, the acceptability of the
treatment approach to participants and communities and to examine how utilisation and
programme coverage could be maximised.
This study (Study 3) focuses particularly on the clinical effectiveness of treatment
provided, whilst Chapter 9 Study 4, an output of the same programme as that presented
here, begins to develop understanding of the issues around maximising coverage and
programme utilisation.
9.4.2 Objective To examine the clinical effectiveness of the CTC model of treatment for different age
groups, degree of malnutrition and by type (direct outpatient or combined
inpatient/outpatient) of treatment.
9.4.3 Background Malawi is one of the poorest countries in the world and has seen a fall in the gross
national income per capita for several years (159).

90
The country has long had a problem with food insecurity and malnutrition. In a “normal”
year, approximately 5% of children under 5 years of age, equivalent to about 117,000,
are acutely malnourished at any point in time (6). Historically, growth monitoring
programmes using weight for age have been the main approach for identification of
malnutrition at community level. Any children identified as suffering from severe acute
malnutrition were referred to nutritional rehabilitation units (NRUs) for inpatient
treatment. These units were regularly very overcrowded and understaffed, commonly
used outdated protocols, and, where data were available, regularly showed high (> 20%)
mortality rates. It was against this background of chronic poverty and poor quality under
resourced health care that in February 2002, the Malawi government declared a national
nutritional emergency and the UN launched an international appeal for emergency
assistance.
In response to the crisis the national Ministry of Health and Population (MoHP) and the
humanitarian community began to develop strategies for the treatment of the large
numbers of children suffering from SAM that were predicted. Nationally, a strategy of
upgrading the 115 NRUs across the country was adopted, with the aim of each NRU
being able to provide centre-based therapeutic treatment according to WHO protocol by
the end of the year. UNICEF and several non-governmental organisations (NGOs)
provided therapeutic products, training and support for this strategy. At the same time,
Valid International presented the community-based therapeutic care approach to the
MoHP as a strategy that could potentially be set up quickly through existing NRUs and
health centres to achieve coverage of the dispersed rural population that existed in
Malawi. As a result, the MoHP gave Concern and Valid permission to pilot CTC in two
districts in the central Region. The author supported design and set up during 2002 from
Sudan and arrived in Malawi as the research nutritionist at the beginning of 2003 to
oversee implementation and data collection. It was agreed that the main focus of the
operational research should be in one of the two Districts, Dowa, and that a process of
programme monitoring and lesson learning in Dowa would be applied directly to the
CTC programme in neighbouring Nkhotakota District.
9.4.3.1 Dowa District Dowa district is 50km to the north east of Lilongwe in the central region of Malawi. It
covers an area of 2,770 sq km, has a population of around 500,000 people, including an

91
estimated 100,000 children under five years of age, and a population density of 135
persons per km2. There are some good tarmaced roads that run east-west and north-south
and many dirt tracks connect most villages that are easily traversed but frequently
become impassable during the height of the rainy season.
The population is almost entirely subsistence farmers cultivating mainly maize, with
some additional cassava, sweet potato, beans and vegetables. HIV/AIDS is an increasing
problem in the District, although it remains more obvious in the few urban and more
densely populated areas. Cholera and Falciparum malaria are also seasonally common
with malaria being the most frequent cause of death at most health facilities.
The district has a weak medical and nutritional referral infrastructure with one 140-bed
district general hospital, 3 small mission hospitals, thirteen health centres and two
dispensaries. Before the CTC programme, facilities for inpatient nutritional
rehabilitation, as in the rest of Malawi, were of poor quality. Nutrition Rehabilitation
Units (NRUs) were rudimentary with only one or two staff members who had no training
in modern techniques of screening and treating severe malnutrition. They had no beds,
little or no equipment; no system of supervision and inappropriate food commodities.
By contrast, community outreach capacity for health was good. In Dowa there were 100
health posts each with two to four Health Surveillance Assistants (HSAs), several growth
monitoring volunteers and substantial numbers of community level hygiene assistants. In
the villages most children had a “health passport” that demonstrated systematic vitamin
A distribution and good vaccination coverage providing evidence of the functionality of
this system. This infrastructure represents an important resource around which this
programme was designed.
9.4.4 Methods
9.4.4.1 Programme Methods The programme started in August 2002. All outpatient and inpatient treatment was
delivered through the existing MoH District Hospital, health centres and NRUs in Dowa.

92
9.4.4.1.1 Staffing For the first 18 months of implementation the programme was supported by one Concern
doctor, one nutritionist and 10 health workers, recruited and trained by the Valid research
staff before programme set up. These workers split in to teams and rotated around the
NRUs and health centres in the District to support Ministry of Health staff to register all
admissions and to deliver inpatient and outpatient treatment. After 18 months the number
of supporting Concern staff and the frequency of their support visits to health facilities
began to reduce. The MoH programme implementing staff included:
− Health assistants, 1 in most health centres, managed health facilities and carried
out many of the outpatient consultations, particularly for the more serious
complicated cases. They were medically trained for 4 years to 1 level below
doctor.
− Nurses, 1 in most health centres and 1-3 in most NRUs, assisted with
management of health facilities, carried out outpatient and inpatient
consultations, patient monitoring in NRUs and ran clinics such as growth
monitoring. They were medically trained for 3 years to 1 level below health
assistant.
− Health surveillance assistant (HSA), 2-4 based at most health facilities, were
responsible for assisting with clinics such as growth monitoring and any
community-based work such as vaccination, tuberculosis surveillance, cholera
prevention and health promotion. Typically they had been through at least 3
months training.
− Home craft workers, 1-3 based at each NRU, were responsible for making up
feeds, supervising meal times and assisting nurses with patient monitoring. They
had typically had some training although this had been irregular.
− Other community-based workers such as growth monitoring volunteers (GMVs)
and hygiene assistants were voluntary workers that assisted the HSAs with their
community-based work. They had typically had some training although this had
been irregular.
At the beginning of this programme, all government workers received two days training
on the treatment of severe malnutrition from Concern and Valid staff and were
supervised on site thereafter.

93
At programme start, 25 paid outreach workers were trained by Concern Worldwide staff
to work at community level and use MUAC to screen and refer children to their nearest
health centre or NRU. Gradually, many of the HSAs and other community workers (eg
growth monitoring volunteers) in the District were also trained in the use of MUAC and
this job was handed over to them. By 6 months in to the programme, 110 HSAs and
community workers had been trained and were using MUAC to screen children as part of
their community-based activities.
9.4.4.1.2 Community Mobilisation About 4 months in to programme implementation, after input from a social anthropology
team, meetings were set up with traditional authority leaders and community health
workers to explain the programme approach and target groups. A message sheet in the
local language (Chichewa) was also produced and was used by traditional leaders to
explain the programme and the signs of severe acute malnutrition to be aware of (recent
weight loss and/or swelling) to their village leaders. This enabled these key individuals at
community level to get involved with referral of children that they considered to be at
risk.
9.4.4.1.3 Procedures (Appendix 6, section 14.6 gives examples of the most important programme procedures
developed for staff implementing CTC in Dowa)
The programme in Dowa supported four referral NRUs (1 located within the District
Hospital) to provide stabilisation centre (SC) protocols according to WHO and Malawi
inpatient phase 1 national protocols (29) and 17 health centres to provide outpatient
therapeutic care according to CTC protocol. Figure 12 shows the location of NRUs that
provided inpatient stabilisation and of health centres that provided outpatient care. For
the first 5 months (1st August-31st December 2002) whilst numbers allowed, all children
admitted to the programme received phase 1 treatment in the hospital or one of the
supported NRUs, followed by outpatient care in the OTP. From 1st January 2003, triage
criteria were introduced that allowed children suffering from severe acute malnutrition
with no complications to be treated directly in the OTP.

Figure 12: Map of Dowa District showing location of NRUs and OTP sites used in study 3
94

95
Children were screened and referred by paid outreach workers or HSAs using MUAC or
by village/community leaders who referred children on the basis of visible wasting and
swelling. When children arrived at an NRU or health centre a health worker, usually a
trained HSA, measured their weight, height, and MUAC and examined for pedal
oedema. A nurse did a medical examination and if severe acute malnutrition was
confirmed registered the child on to the programme. All registered children received a
unique identification number and a monitoring card (see section 8.4.3). At health centres
it was the attending HSAs that performed and recorded the majority of the
anthropometric measurements and gave out the food, and the nursing/health assistant
staff that medically examined the children, administered any treatment and completed
the monitoring card. At the stabilisation centres it was the attending home craft workers
that performed and recorded the majority of the anthropometric measurements and gave
out the food, and the nursing staff that medically examined the children, administered
treatment and filled out the monitoring card.
9.4.4.1.4 Screening criteria Where MUAC was used for screening in villages, any child > 1 year old with a MUAC <
13cm was referred to their nearest health centre for assessment. Referral of children < 1
year was made based on clinical signs of malnutrition. Later in the programme, as
community leaders became more involved in the identification process, children were
also referred on the basis of recent acute weight loss or visible swelling (oedema).
9.4.4.1.5 Admission and Discharge Criteria Admission and discharge criteria followed the Malawi national protocol for the treatment
of SAM as closely as possible. Children more than or equal to 6 months old were
admitted to the programme if:
− their weight for height was less than or equal to 70% of the median NCHS
reference weight-for-height;
− and/or their MUAC was less than or equal to 11cm (children > 75cm)
− and/or they presented with bilateral pitting oedema.
Discharge from the outpatient therapeutic programme (OTP) in to the supplementary
feeding programme (SFP) took place when the child demonstrated all of the following
for two consecutive weeks:
− a weight-for-height of more than or equal to 85% of the median NCHS reference;

96
− and a MUAC of > 11cm (children > 75cm);
− and absence of bilateral pitting oedema;
− and free from serious infective illness.
9.4.4.1.6 Triage and Referral Criteria During the first 5 months of the programme, all children were referred first to one of the
NRUs for phase 1 inpatient treatment. Discharge from the NRU to the OTP occurred
when:
− the child appeared well;
− was eating required amount of RUTF according to OTP protocol or suckling at
mother’s breast with a good appetite;
− oedema was decreasing and only on feet;
− weight was stable or increasing;
− general medical problems such as fever and serious infection were under control.
Triage was introduced from January 2003. This allowed children suffering from SAM
with no complications to be referred directly to OTP treatment and those suffering from
SAM with complications to be referred first to an inpatient unit for stabilisation. Table 9
shows these criteria and means of measurement for each sign that health workers used to
decide the level of treatment that each child required. These criteria were primarily
based on the WHO criteria for moving from the phase 1 diet of F75 in inpatient care to
the rehabilitation diet of F100. The WHO criteria uses the return of appetite as the most
important sign “that infections are coming under control, the liver is able to metabolize
the diet, and other metabolic abnormalities are improving” (34). We therefore adopted
the use of appetite as the most important sign that a child’s clinical condition was
sufficiently stable for treatment in outpatient care with a food of nutritional equivalence
to F100 and the absence of appetite (or anorexia) as the most important sign that a child
required urgent referral to hospital. We also added all of the vital signs (apart from those
referring specifically to the presence of severe acute malnutrition) from the IMCI
guidelines used to indicate the need for immediate referral to a hospital (45;160), these
include: convulsions; unconsciousness or lethargy; and dehydration due to vomiting or
diarrhoea (together referred to as ‘general danger signs’ by IMCI); difficulty breathing
(assessed by respiration rate); fever or hypothermia; and ear discharge (together referred
to as ‘main symptoms’ by IMCI); and severe anaemia. The presence of any one of these
signs was sufficient for referral to an NRU.

Table 9 Signs and criteria used to triage children to different levels of treatment in
Dowa, Malawi
SIGN REFERAL to NRU REFERRAL TO OTPOEDEMA grade +++ or ++ No oedema or grade +AGE <6 months > 5 months
APPETITE/ANOREXIA No appetite or unable to eat Tries RUTF and asks for more
Fever: >= 39oC
Hypothermia: <= 35oC
≥ 60 respirations/minute for under 2-months
≥ 50 respirations/minute from 2 to 12 months
≥ 40 respirations/minute from 1 to 5 years
≥ 30 respirations/minute for over 5 year-olds
As reported by carer: recent history of acute diarrhoea &/or vomiting &/or fever; and no urine output; and no tears; and mouth dry; and eyes recently sunken
Or Fontanelle depressed
< 7 g/100ml Or ≥ 7g/100ml Or
Severe palmar pallor and difficulty breathing Good nail and good eye colour
SUPERFICIAL INFECTIONDischarges from ears; or extensive absesses; or extensive sores No serious infection
Very weak; or apathetic; or unconscious
Fitting/convulsions
AXILLIARY TEMPERATURE > 35oC <39oC
ALERTNESS
ANAEMIA
RESPIRATION RATE Normal range
HYDRATION STATUS Absence of signs of severe dehydration
Alert and conscious
Criteria for discharge from the NRU to the OTP remained the same.
9.4.4.1.7 Dietary Treatment In the 4 stabilisation centres dietary treatment was provided according to WHO protocol
(29) This included phase 1, 24 hour feeding with Formula 75 at 100 kcal kg-1 day-1 using
8 feeds per day. RUTF was introduced when the following conditions were satisfied:
− been on f-75 for 3 days
− good appetite
− oedema reducing
− no serious medical problems i.e. respiratory distress, vomiting, dehydration
97

98
Later in the programme the ‘3 day rule’ i.e. only introducing RUTF after 3 days of F75
was stopped, and health workers relied on the clinical signs listed above. RUTF was
introduced in a transitional phase whereby F75 feeds were continued and the RUTF
given cautiously to ensure acceptability. Once a child was eating the required amount of
RUTF according to OTP protocol F75 feeds were stopped.
RUTF was provided in proportion to a child’s weight (rather then the set quantity
delivered during study 1). The ration size was read from a chart by the health worker and
was calculated to deliver 175-200 kcal kg-1 day-1 and 4-5g protein kg-1 day-1 as
recommended by WHO for the second phase of therapeutic treatment (see 14.7
Appendix 7: RUTF ration chart for the OTP, Dowa). Children also received a 3.75kg
ration of blended flour (corn soya blend) to reduce the risk of sharing of the RUTF. This
provided an additional 984 kcal day-1 of energy.
Any severely malnourished infant less than 6 months old was treated according to WHO
and Malawi national protocol. This included Formula 75 at 100 kcal kg-1 day-1 using 8-10
feeds per day in phase 1 and Formula 100 in phase 2. Every effort was made to re-
establish breastfeeding where this was possible. No infant in this age group was given
RUTF.
Formula 100 was used for any child that did not tolerate the RUTF. This was given
according to WHO protocol (34).
9.4.4.1.8 Medical Treatment All medical treatment followed protocols as specified in the WHO and the Malawi
national protocol for the treatment of SAM (see 14.8 Appendix 8: Medical protocol for
the CTC programme, Dowa). This consisted of a single oral dose of Vitamin A (100,000
I.U. <12 months age and 200,000 I.U. for all other age groups, a single oral dose of Folic
acid (5 mg) and a single oral dose of Fansidar. All patients also routinely received a
broad-spectrum antibiotic. For most children this was amoxycillin 60 mg kg-1 day-1 3
times daily. Dehydrated children were treated with ReSoMal, an oral rehydration
solution specifically designed for the treatment of severe acute malnutrition. A single
oral dose of albendazole (200mg for children aged between 12 and 24 months and 400

99
mg for children > 2 years) was given to each child on discharge to outpatient care or, for
those children admitted directly to outpatient care, on admission. All medication was
administered by either NRU or OTP nursing staff with the exception of the antibiotic
which, for those children that were admitted directly in to the OTP, was administered by
the carer. The OTP nurse instructed each carer on when and how to give the drug. Either
a calibrated spoon or an empty syringe body was provided to each mother to facilitate
dose measurement, i.e. staff marked on the syringe body how much antibiotic needed to
be given each day and demonstrated pulling up the correct amount and administering this
in to the child’s mouth.
9.4.4.1.9 Follow up in the OTP At each return visit to the OTP the child was seen by a nurse, underwent follow up
nutritional and medical examinations and received a 1 week ration of RUTF and of the
corn soya blend mix. OTP staff used the ‘Action Protocol’ described in Appendix 9 (see
section 14.9) to either:
− continue with OTP treatment where the child was responding well;
− to refer back to inpatient treatment for further assessment where the child was not
responding to treatment;
− or to arrange a home visit where closer monitoring seemed necessary.
Trained HSAs or community volunteers/growth monitors followed up children at home
if they defaulted from treatment. At home visits the community worker checked the
nutritional progress of the child and referred any who were ill or still malnourished back
to the nearest OTP treatment site.
9.4.4.1.10 Education There were a number of basic education messages used to promote the recovery of the
child. These messages were discussed with the mother at each OTP visit, usually during
the medical assessment by the OTP nurse or by an attending HSA. At the core of this
education was the importance of prioritising the RUTF for sick children over the blended
flour and other local foods, and the importance of continuation of breastfeeding where
appropriate. (see 14.10 Appendix 10: Education message sheet for OTP, Dowa)

100
9.4.4.2 Research Methods
9.4.4.2.1 Subjects The study population came from 1672 children admitted for treatment to the Dowa CTC
programme between 1st August 2002 and the 31st December 2003. Criteria for inclusion
in analysis were:
− Severe acute malnutrition according to WHO and Malawi national guideline
(WFH less than or equal to 70% or -3 z scores of the NCHS reference and/or
bilateral pitting oedema and/or MUAC < 11cm for children aged > 1 year and/or
age > 6months, weight < 4kg)
− Age more than 5 months.
− Absence of any severe disability
100 children admitted on to the programme fell outside these criteria for inclusion
leaving 1572 for the study analysis.
9.4.4.2.2 Data Collection This study was implemented as part of the day to day operation of an emergency feeding
programme. The difficulties of implementing a programme in these circumstances and
the pressures of the work meant that some of the data collection was incomplete.
On presentation to a NRU or to the OTP site, patients were weighed, had their height
measured by trained health staff and were assessed for the presence of bilateral pitting
pedal oedema. Those that fulfilled the admission criteria were admitted in to the study.
Other children that fell outside these criteria but were still considered sick enough to
warrant treatment were provided with the full treatment described above but excluded
from study analysis.
On admission to the NRU or to the OTP, a nurse performed a rapid clinical screen,
assessing the degree of pitting oedema, hydration, diarrhoea, anaemia and signs of chest
infection and filled out a patient monitoring card (see Appendix 3: The monitoring card
used in the OTP, Dowa, Malawi). At each follow-up visit to the outpatient clinic, a nurse
recorded follow-up weight, extent of pitting oedema and clinical condition. Outcome
(death in the programme, discharge alive, default and non responder) was recorded on
individual monitoring cards and in the programme’s registers. An outcome and or

101
clinical condition for those defaulters that were followed up and found at home were also
recorded on either the patient cards or in register books.
9.4.4.2.3 Data coding Outcome data were coded as either ‘recovered’, ‘died’, ‘default’ or ‘non responder’.
Death
Death whilst registered on the programme (within two weeks of failing to attend the
OTP).
Recovered
Recovery was defined as discharged from the OTP after field staff assessed that the
patient had fulfilled the following criteria for 2 consecutive weeks:
− a weight-for-height of more than or equal to 85% of the median NCHS reference;
− and a MUAC of > 11cm (children > 75cm);
− and absence of bilateral pitting oedema;
− and free from serious infective illness.
Non responder
Failure to attain recovery criteria after 122 days in the programme
Default
Failure to attend treatment on two consecutive occasions
Where ever possible defaulters were followed up at home and were coded in to one of
the following categories:
− Seen well
− Died > 2 weeks < 1 month after default
− Died > 1 month after default
− Moved to an address outside Dowa
− Not found, lost to follow up
Any child that was transferred out of the programme to another medical facility either
returned for treatment to the CTC or was followed up at the facility. In each case they
were coded according to final outcome.

102
9.4.4.2.4 Data analysis Programme outcomes were compared with the international Sphere standards for
therapeutic care. The observed mortality rate was compared with the “expected” case
fatality rate calculated with Prudhon’s index (151) (see section 8.4.7.4). Prudhon’s
equation used to calculate “Prudhon’s index” was calculated in Excel (146) using the
formula:
1/ (1 + EXP (- (20.63 – 9.99*LOG(WT) / (HT*1.74)) +(1.36*OED)))
Where WT = weight; HT = height; OED = the presence (coded 1) or absence
(coded 0) of oedema.
The Yates corrected Chi square test (148) was used to compare proportions, with the
Fisher’s exact test adopted for any comparison that contained a cell < n=5. In describing
and comparing continuous data such as age, WFH z scores and weight gains, a
combination of means and medians were used. If the data distributions approximated to a
‘normal distribution’, population means are quoted and comparisons made with the
students t test (ANOVA). If the distributions were skewed, population median values
were used and comparisons made with the Wilcoxon rank-sum (Mann-Whitney U) test
performed by SPSS.
To control for seasonal variation in outcomes for an examination of the predictors of
mortality and the impact of triage, outcomes from Aug-Dec 2002 (not triaged) are
compared with the same 6 months the following year when children were triaged
(section 9.4.4.1.6). Univariate assessment of factors related to death and recovery were
done with the Fisher's exact test and a two-sided p-value. Odds ratios and 95%
confidence intervals were obtained by the 'crosstabs' function in SPSS. Significant and
borderline significant factors at the level of p < 0.09 from the univariate analysis of
factors related to recovery were included in the multivariate analyses for recovery and, as
a sub analysis, for mortality. To assess the association of clinical features at presentation
and triage, with recovery and mortality, logistic regression analysis was performed by
the ‘enter’ method of the binary logistic function in SPSS.

103
For additional research methods that describe measurement techniques, equipment and
precision; data collection and supplementary data coding and data analysis techniques
see core methods section 8.4.
9.4.5 Results
9.4.5.1 Admission characteristics Admission data is presented in Table 10. Weight for height data was collected for 1527
participants and age for 1539. The participant sex ratio was similar: 50.6% female and
49.4% male. The median [IQ range] age of all participants was 26 [18-36] months. It was
also 26 [19-36] months for girls and 26 [17-36] months for boys. 954 (60.7%) of
admissions were kwashiorkor, 127 (8.1%) marasmic kwashiorkor, 254 (16.2%)
marasmic and 220 (14.0%) children had either low MUAC or were > 6 months and less
than 4kg. Children with kwashiorkor were older than wasted children (32 [24-42] months
vs. 18 [13-24] months p<0.001). Overall, mean [SD] weight for height ratio at
admission, in z scores, was -1.9 [1.3]. Mean scores at admission were -1.2 [1.0] for those
children with kwashiorkor, -3.5 [0.4] for marasmic, -3.4 [0.5] for marasmic kwashiorkor,
-2.5 [0.6] for children with low MUAC and -1.7 [0.6] for children <4kg. The weight for
height score of this last group implies that these children were only mildly wasted, and
likely to be stunted as a result of intra uterine growth retardation. Mean z score at
admission for all survivors was -1.7 [1.3] and for patients who died was -2.2 [1.3].

Table 10: Admission characteristics of children treated in study 3
nmedian (IQ
range) nmedian
(IQ range) nmedian
(IQ range) nmedian
(IQ range) nmedian
(IQ range) nmedian
(IQ range)overall* 1539 26 (18-36) 945 32 (24-42) 248 18 (13-24) 126 23 (17-31) 148 24 (15-29) 65 8 (7-10)recovered 1151 28 (20-36) 777 32 (24-42) 148 18 (13-24) 70 24 (18-31) 101 25 (16-31) 52 8 (7-10)died 111 28 (21-42) 66 36 (24-50) 14 23 (13-25) 16 29 (19-34) 11 21 (13-36) 4 8 (7-9)non responder 141 20 (14-27) 34 28 (20-36) 57 20 (14-26) 22 18 (14-26) 22 17 (13-24) 4 9 (8-10)defaulted 136 24 (14-36) 68 28 (20-36) 29 14 (12-24) 18 23 (17-34) 14 21 (16-31) 5 12 (12-13)
mean (SD) mean (SD) mean (SD) mean (SD) mean (SD) mean (SD)
overall** 1527 -1.9 (1.3) 926 -1.2 (1.0) 254 -3.5 (0.4) 127 -3.4 (0.5) 155 -2.5 (0.6) 65 -1.7 (0.6)recovered 1137 -1.7 (1.3) 770 -1.1 (1.0) 150 -3.5 (0.4) 71 -3.4 (0.5) 106 -2.4 (0.7) 52 -1.6 (0.7)died 105 -2.2 (1.3) 59 -1.5 (1.1) 15 -3.5 (0.4) 16 -3.6 (0.6) 11 -2.6 (0.6) 4 -1.6 (0.4)non responder 139 -2.9 (1.0) 31 -1.7 (1.2) 58 -3.5 (0.4) 22 -3.3 (0.4) 24 -2.7 (0.5) 4 -1.6 (1.0)defaulted 146 -2.4 (1.1) 66 -1.9 (0.8) 31 -3.5 (0.5) 18 -3.5 (0.4) 14 -2.7 (0.5) 5 -2.0 (0.5)
admission weight for height (z-
scores)
total marasmus marasmic kwashiorkor > 6month < 4kgkwashiorkorVariable
age (months)
muac <11cm
* Age not available for 33 out of 1572 children
** Weight and/or height not available for 45 out of 1572 children
104

105
9.4.5.2 Mortality and recovery Table 11 shows outcome data. Overall, 1167 children (74.2%) recovered, with a median
[IQ range] time to recovery of 42 [28-71] days and 115 children (7.3%) died with a
median time to death of 11 [4-28] days.
9.4.5.3 Default 144 children (9.2%) defaulted with a median stay in the programme of 21 [7-42] days. At
baseline children that defaulted were more likely (borderline significance) to have
marasmus kwashiorkor or marasmus (p= 0.05 & 0.07 respectively) and were more
wasted (difference between groups: -0.7 WFH z score p<0.001) than children that
recovered.
9.4.5.4 Non response 146 children (9.3%) were classified as non responders. Their median stay in the
programme was 154 [140-182] days.
9.4.5.5 Outcomes against international standards Table 12 shows study outcomes compared with the Sphere standard indicators (72) for
therapeutic feeding. Both mortality and default rates were considerably better than those
stipulated by Sphere. The study recovery rate was just outside the Sphere standard
indicator.

Table 11: Outcomes by category of malnutrition
n (%) n (%) n (%) n (%) n (%) n (%)overall 1572 100 954 100.0 127 100.0 254 100 155 103 65 102recovered 1167 74.2 784 82.2 71 55.9 150 59.1 106 68.4 52 80.0died 115 7.3 68 7.1 16 12.6 15 5.9 11 10.4 4 7.7non-responder 146 9.3 34 3.6 22 17.3 58 22.8 24 15.5 4 6.2defaulted 144 9.2 68 7.1 18 14.2 31 12.2 14 9.0 5 7.7
median (IQ range)
median (IQ range)
median (IQ range)
median (IQ range)
median (IQ range)
median (IQ range)
overall 1537 42 (28-71) 939 42 (28-56) 126 64 (42-98) 247 70 (42-112) 149 56 (35-84) 63 56 (42-90)recovered 1165 42 (28-69) 782 42 (28-56) 71 63 (42-84) 150 62 (42-84) 106 56 (42-76) 52 56 (42-84)died 109 11 (4-28) 64 11 (4-26) 16 11 (4-27) 14 13 (3-42) 11 25 (12-56) 4 19 (8-35)non-responder 137 154 (140-182) 33 161 (135-182) 22 158 (140-205) 55 154 (140-189) 19 140 (136-166) 4 134 (126-162)defaulted 126 21 (7-42) 60 19 (9-42) 17 37 (29-76) 28 22 (9-55) 13 14 (6-34) 3 21 (4-90)overall 1501 4.8 (2.5-7.5) 904 4.8 (2.3-7.4) 123 5.6 (3.3-8.1) 248 4.8 (2.8-7.9) 154 3.9 (2.0-6.4) 64 6.0 (3.8-8.3)recovered 1128 5.4 (3.4-7.9) 753 5.0 (2.9-7.5) 69 6.6 (5.0-9.6) 147 6.6 (4.4-9.2) 106 4.7 (3.4-7.3) 52 6.2 (4.7-8.3)died 104 0.0 (0-6.1) 58 0 (0-9.9) 16 0.3 (0-7.4) 15 0 (0-5.7) 11 -2.2 (-4.8-3.9) 4 1.1 (-3.5-8.6)non-responder 139 2.6 (1.6-3.5) 31 2.5 (1.4-4.0) 21 3.2 (2.5-4.3) 58 2.7 (1.8-3.5) 24 1.6 (1.0-2.6) 4 3.9 (3.2-6.8)defaulted 130 1.8 (0-8.6) 62 1.3 (0-7.8) 17 5.7 (1.8-7.7) 28 3.1 (0.9-9.2) 13 0.9 (0-2.9) 4 0.8 (0-10.4)
* includes 17 children that were admitted without enough admission data to calculate admission criteria
Marasmus-Kwashiorkortotal* Kwashiorkor Marasmus >6 months <4kg
weight gain (g/kg/day)
outcome
length of stay (days)
MUAC<11cm
106

Table 12: Outcomes against the Sphere standard indicators
Key indicatorSphere
standardStudy result
Proportion of exits from a therapeutic feeding programme who have died < 10% 7.3%Proportion of exits from a therapeutic feeding programme who have recovered > 75% 74.2%Proportion of exits from a therapeutic feeding programme who have defaulted < 15% 9.2%Length of stay (days) 30-40 42Minimum mean rate of weight gain (g/kg/person/day) >8 5.4
131 of the children (89.7%) classified as non responders recovered with follow up of, on
average, an additional 32 days (IQ range: 14-60) of treatment after being classified as a
non responder (see Figure 13). When outcomes from this group of children are included
in overall study outcomes the study recovery rate increases to 82.6% which is
considerably better than the Sphere indicator.
Outcomes of children classified as non responders N = 146
4%
90%
6%
died
recovered
lost to follow up
Figure 13: Final outcomes of children classified as non responders
This study was able to trace 58.8% of the 153 children that defaulted during treatment.
Of these 10.5% had died < 1 month after leaving the programme (Figure 14).
107

Final outcomes of children followed up after default n=153
25%
3%
10%
10%10%
42%
seen well
seen unwell
moved to another area
died > 1 week < 1 month after default
died > 1 month after default
Lost to follow up
Figure 14: Final outcomes of children followed up after default
9.4.5.6 Outcomes in the NRUs and the OTP Table 13 presents outcomes disaggregated by level of treatment (i.e. inpatient or
outpatient). Outcomes at each level of treatment remained within the Sphere standard
indicators for mortality, recovery and default.
Table 13: Outcomes in the NRUs and the OTP
n (%) n (%) n (%)overall 1572 100 792 100.0 1461 100.0recovered 1167 74.2 709 89.5 1139 78.0died 115 7.3 64 8.1 51 3.5non-responder 146 9.3 0 0.0 146 10.0defaulted* 144 9.2 19 2.4 125 8.6
median (IQ range)
median (IQ range)
median (IQ range)
overall 1537 42 (28-71) 744 7 (5-11) 1364 40 (25-67)recovered 1165 42 (28-69) 520 7 (5-10) 1115 38 (25-56)died 109 11 (4-28) 74 8 (3-13) 45 27 (14-41)non-responder 137 154 (140-182) 67 6 (5-10) 133 142 (126-175)defaulted 126 21 (7-42) 83 7 (5-12) 71 28 (20-56)
length of stay (days)
total NRU OTP
outcome
*default in the NRU included children that defaulted from treatment or that were transferred to another
facility and no final outcome was available.
108

109
There was a significantly higher number of deaths observed in the whole programme
than the number of expected deaths calculated by Prudhon’s index (115 vs. 65 RR = 1.26
95% CI 1.1, 1.4 p = 0.001, excess mortality = 3.1%). However, when the Prudhon index
is used to calculate the expected number of deaths in the NRU and OTP separately it
suggests that this excess mortality occurred in the NRU where observed deaths = 64/726
compared to 40/726 expected deaths. In the OTP observed deaths were 51/1217
compared to 60/1217 expected by the Prudhon index.
Figure 15 and Figure 16 present the number of deaths, the number of excess deaths
(calculated using the Prudhon Index) and the number of inpatients or outpatients in the
NRUs and the OTP during the study. The number of both inpatients and outpatients rises
considerably during the rainy season. In the NRUs the number of excess deaths is
significantly positively correlated with the number of inpatients (pearson coefficient:
0.58 p = 0.02). Although, from figure 16, the trend appears similar in the OTP, the
correlation between number of excess deaths and number of outpatients is not significant
(pearson coefficient: 0.45, p = 0.07).

0
50
100
150
200
250
300
Aug-02
Sep-02
Oct-02
Nov-02
Dec-02
Jan-03
Feb-03
Mar-03
Apr-03
May-03
Jun-03
Jul-03
Aug-03
Sep-03
Oct-03
Nov-03
Dec-03
Month
No. i
npat
ient
s
-5
0
5
10
15
20
No. d
eath
s
Number ofinpatients
Number of deaths
Number of excessdeaths
Rainy Season
Triage started
Figure 15: Number of inpatients (left hand axis) and number of deaths in the NRUs
(right hand axis) by month
0
100
200
300
400
500
600
Aug-02
Sep-02
Oct-02
Nov-02
Dec-02
Jan-03
Feb-03
Mar-03
Apr-03
May-03
Jun-03
Jul-03
Aug-03
Sep-03
Oct-03
Nov-03
Dec-03
Month
No. o
utpa
tient
s
-5
0
5
10
15
20
No. d
eath
s
Number ofoutpatients
Number of deaths
Number of excessdeaths
Rainy Season
Triage started
Figure 16: Number of outpatients (left hand axis) and number of deaths (right hand
axis) in the OTP by month
110

9.4.5.6.1 Timing of deaths in the OTP 45 out of 1114 (4.0%) discharged from phase 1 treatment in the NRU into the OTP died.
Fourteen (31%) of these deaths happened in the first two weeks after discharge (Figure
17). Of those that died after being directly admitted in to the OTP, 3 (43%) of them died
in the first two weeks after admission (Figure 18).
0%
10%
20%
30%
40%
50%
60%
70%
80%
90%
100%
adm 1 2 3 4 5 6 7 8 9 10 11 12
weeks in OTP
deat
hs n
=7
Figure 17: Timing of deaths after direct admission into the outpatient therapeutic
programme (OTP) (n = 7)
0%
10%
20%
30%
40%
50%
60%
70%
80%
90%
100%
adm 1 2 3 4 5 6 7 8 9 10 11 12 13
weeks in OTP
deat
hs n
=45
Figure 18: Timing of deaths after discharge from the NRU into the outpatient
therapeutic programme (OTP) (n = 45)
111

112
9.4.5.7 Outcomes by type of treatment and category of malnutrition Table 14 shows overall outcome data according to the type of treatment (direct to OTP or
indirect to inpatient care followed by OTP) that children received. This study admitted
351 (22.3%) of the total participants directly to OTP and 1221 (77.7%) first to phase one
inpatient treatment followed by OTP. Overall, mortality in the group treated directly in
OTP was significantly lower than that in the group that first received inpatient care (χ2 =
17.9 p<0.0001). This is mirrored across all grades of oedema. The number of deaths
overall and for all categories of malnutrition observed in direct treatment was lower than
the expected number of deaths calculated by the Prudhon Index, although this was non
significant (RR 0.63 95% CI 0.34, 1.16 p=0.13) (Table 15).

Table 14: Outcomes by category of malnutrition and type of treatment
Outcome (%)
Direct n=351
Indirect n=1221
Direct n=165
Indirect n=128
Direct n=19
Indirect n=348
Direct n=5
Indirect n=286
Direct n=25
Indirect n=102
Direct n=71
Indirect n=200
Direct n=52
Indirect n=103
Direct n=11
Indirect n=54
Recovered 78.6 73.0 89.1 75.8 100.0 81.0 100.0 80.8 44.0 58.8 57.7 56.5 76.9 64.1 90.9 77.8Died 2.0 8.8 1.8 8.6 0.0 5.2 0.0 12.6 8.0 13.7 1.4 7.5 0.0 10.7 9.1 5.6Non-responder 11.4 8.7 3.6 5.5 0.0 4.3 0.0 2.1 24.0 15.7 28.2 21.0 15.4 15.5 0.0 7.4Defaulted 8.0 9.5 5.5 10.2 0.0 9.5 0.0 4.5 24.0 11.8 12.7 15.0 7.7 9.7 0.0 9.3* includes 3 children with oedema but no grade specifiedDirect: encompassing only outpatient treatment with RUTF Indirect: encompassing phase 1 inpatient treatment followed by outpatient treatment with RUTF
MUAC < 11cm > 6 mths < 4kgAll* Oedema + Oedema ++ Oedema +++ Maras-kwash Marasmus
Table 15: Observed deaths in direct OTP compared with expected deaths calculated by the Prudhon Index
No. DeathsObserved
Prudhon Expected
n nAll 7 15Oedema + 3 4Oedema ++ 0 1Oedema +++ 0 1Marasmus 1 4Maras-kwash 2 3MUAC < 11cm 0 1> 6 mths < 4kg 1 1
113

114
Overall, children with kwashiorkor demonstrated a significantly higher recovery rate
than all groups apart from children >6 months and <4kg (82.2% vs. 55.9% for marasmic
kwashiorkor χ2 = 48.8 p<0.0001, 59.1% for marasmus χ2 = 59.9 p<0.0001 and 68.4% for
children with MUAC<11cm χ2 = 14.1 p<0.001) (see Table 11). Case fatality rates were
68 (7.1%) of 954 for kwashiorkor patients, 16 (12.6%) of 127 for marasmic kwashiorkor
patients, 15 (5.9%) of 254 for patients with marasmus, 11 (10.4%) of 155 for patients
admitted with MUAC < 11cm and 4 (7.7%) of 65 for those children > 6 months and <
4kg. Overall, the case fatality rate was significantly higher (although at borderline level)
in the marasmic kwashiorkor group than that for children with either kwashiorkor or
marasmus (χ2 = 4.0 p=0.0.047 and χ2 = 4.2 p=0.04 respectively) (Table 11). Children
with marasmic kwashiorkor had higher mortality in both direct and indirect treatment
than all other categories of malnutrition (Direct: MK 8.0% vs. All 2.0% and Indirect:
MK 13.7% vs. All 8.8% respectively) (Table 14). Differences in mortality between these
groups were not significant. The mortality rate of 9.1% in direct treatment of the > 6
month < 4kg group relates to 1 child that was referred to the NRU but whose mother
refused admission to inpatient treatment.
Both default and non response were lower in children with kwashiorkor compared to
other groups (see Table 11): both default and non response were significantly higher for
children with marasmus (χ2 = 6.2 p=0.01 and χ2 = 103 p<0.0001 respectively) and
marasmic kwashiorkor (χ2 = 6.7 p=0.009 and χ2 = 40.4 p<0.0001 respectively). The rate
of non response was also significantly higher in children with MUAC < 11cm than for
those with kwashiorkor (χ2 = 35.9 p<0.0001). Table 14 shows that the highest rates of
both non response and default occurred in the marasmic kwashiorkor group that was
treated directly in OTP. They were not however significantly higher than the rates seen
in indirect treatment in the same group.
9.4.5.8 Outcomes by age group Overall, there was no significant difference in age between those that died and those that
recovered (see Table 10). However, Table 16 shows that in Dowa it was not the youngest
age group (6-12 months) but the oldest age group (> 60 months) that had a higher risk of
mortality than other groups (> 60 months vs. 6-12 months χ2 7.1 p=0.008 and > 60 mths
vs. all ages χ2 7.6 p=0.006). Mortality was low in direct OTP across all age groups
(Table 17). The youngest age groups did appear to have a higher risk of both non

115
response and default than many of the older age groups in both direct and indirect
treatment, although in this study differences between age groups for these outcomes were
not significant.

Table 16: Outcomes by age group
Outcome n (%) n (%) n (%) n (%) n (%) n (%) n (%) n (%)overall 1539 100.0 182 100.0 494 100.0 521 100 194 100 85 100 63 100 65 102recovered 1151 74.8 124 68.1 333 67.4 415 79.7 165 85.1 66 77.6 48 76.2 52 80.0died 111 7.2 10 5.5 38 7.7 31 6.0 12 6.2 9 10.6 11 17.5 4 7.7non-responder 141 9.2 27 14.8 66 13.4 40 7.7 3 1.5 5 5.9 0 0.0 4 6.2defaulted 136 8.8 21 11.5 57 11.5 35 6.7 14 7.2 5 5.9 4 6.3 5 7.7
25-36 months > 60 months>6 months
<4kg37-48 months 49-60 monthsTotal 6-12 months 13-24 months
Table 17: Outcomes by age group and type of treatment
Outcome (%)
Direct n=334
Indirect n=1205
Direct n=42
Indirect n=140
Direct n=133
Indirect n=361
Direct n=105
Indirect n=416
Direct n=29
Indirect n=165
Direct n=15
Indirect n=70
Direct n=10
Indirect n=53
Recovered 79.6 73.4 76.2 65.7 69.2 66.8 89.5 77.2 86.2 84.8 86.7 75.7 100.0 71.7Died 1.8 8.7 2.4 6.4 3.0 9.4 1.0 7.2 0.0 7.3 0.0 12.9 0.0 20.8Non-responder 11.4 8.5 14.3 15.0 18.0 11.6 5.7 8.2 3.4 1.2 6.7 5.7 0.0 0.0Defaulted 7.2 9.3 7.1 12.9 9.8 12.2 3.8 7.5 10.3 6.7 6.7 5.7 0.0 7.5Direct: encompassing only outpatient treatment with RUTF Indirect: encompassing phase 1 inpatient treatment followed by outpatient treatment with RUTF
>60 months49-60 monthsTotal 6-12 months 13-24 months 25-36 months 37-48 months
116

117
9.4.5.9 Weight gain and length of stay Overall, median [IQ range] rate of weight gain was 4.8 g kg-1 day-1 [2.5-7.5] and median
[IQ range] length of stay was 42 [28-71] days (see Table 11). Amongst patients who
recovered median weight gain was 5.4 g kg-1 day-1 [3.4-7.9] and length of stay 42 [28-
69] days. Weight gain was significantly lower in those children that died, defaulted or
did not respond to treatment (p < 0.001).
Table 11 shows that children that recovered from kwashiorkor had the lowest weight
gain and shortest length of stay compared to all other recovered groups. For recovered
children with marasmic kwashiorkor, marasmus and those admitted > 6 months and <
4kg weight gain was significantly higher than for those with kwashiorkor (p = 0.007, p<
0.001 and p < 0.001 respectively). All categories of malnutrition (marasmus, marasmic
kwashiorkor, MUAC <11cm and > 6 months < 4kg)) also took significantly longer to
recover than those with kwashiorkor (p< 0.001 for all groups). Median [IQ range] time to
clinical resolution of oedema was 5 days [3-9]: 5 days [3-10] for marasmic kwashiorkor
and 5 days (3-9) for kwashiorkor patients.
Overall, the average weight gain was significantly lower (3.8 g kg-1 day-1 [2.3-6.2] vs.
5.3 g kg-1 day-1 [3.4-7.9] p < 0.0001) for those children that were treated and recovered
directly in the OTP compared to those that first received inpatient care. There was no
significant difference in length of stay for direct OTP compared to indirect (56 [28-84]
days vs. 48 [32-75] days respectively p = 0.5) (not shown in tables).
9.4.5.10 The impact of triage Between August and December 2002 all children (n=343) received phase 1 inpatient
treatment (non triaged) in an NRU. During the same period the following year all
children (n=347) were triaged into either first receiving phase 1 inpatient treatment
(indirect) or going directly to outpatient treatment. Table 18 details the triage profile,
according to the clinical characteristics used to triage, of those children admitted directly
and indirectly in to outpatient care between August and December 2003. Anorexia and
oedema ++ or +++ were the most common reason for referral to inpatient care.

Table 18: Proportion of children that presented with each clinical criterion used to
triage children between August and December 2003
Direct Indirectn 113 234
% %Oedema +++ or ++ 4.4 60.3Marasmic-Kwashiorkor 4.4 7.3Anorexic 3.5 43.2Fever (>39 0c) 0 1.3Hypothermia (<35 0c) 0 1.7LRTI* 1.8 9.8Mod-Sev anaemia*** 0.9 3.8Severe superficial infection**** 1.8 3.8Mod-Sev dehydration** 0 1.3* Measured by standard resp rate definition** Measured by recent history of diarrhoea, vomi*** Pale conjunctiva & breathlessness**** Raw and/or peeling skin
Comparison of the admission characteristics of the triaged and non triaged groups shows
that there were significantly more males in the triaged group (p=0.005), that the triaged
group had a significantly higher mean MUAC at admission than the non triaged group
(p< 0.001) and significantly fewer cases of severe oedemas (p<0.001) (Table 19).
Table 19: Baseline characteristics of the non triaged and the triaged groups
p valueN n n
Median Age (months) 338 339 0.7*(Z score) 337 339 0.4**MUAC (cm) 248 295 <0.001*
341 m f 345 m f150 191 190 155 0.005
341 yes no 345 yes no31 310 26 319 0.6
194 sev mild 254 sev mild81 81 62 192 <0.001
343 good poor 347 good poor226 117 241 106 0.4
* Mann-Whitney (for non normally distributed data)** ANOVA for normally distributed*** sev +++ mild ++ +
Admission appetite
Admission oedema grade ***
Sex
Maras-Kwash
Non-triaged Aug-Dec 02
34326
-2.011.1
Triaged Aug-Dec 03
34725
-1.911.9
118

The programme recovery rate was significantly lower (71.4%) and mortality rate
significantly higher (9.0%) in the non triaged group than that seen in the triaged group
(79.8% p=0.01 and 5.2% p=0.04 respectively) (see Table 20). There was no difference
in the expected number of deaths using Prudhon’s index and the number of deaths
observed for either the non triaged (Expected: 20 vs. Observed: 31 RR = 1.2 95% CI
0.96, 1.56 p = 0.2) or the triaged group (Expected:15 vs. Observed:18 RR = 1.1 95% CI
0.8, 1.5 p = 0.7).
Table 20: Outcomes by non triaged and triaged groups.
Non-triaged Aug-Dec 02
Triaged Aug-Dec 03 p value
N n 343 n 347Dead 276 31 295 18 0.04Recovered 343 245 347 277 0.01Non responder 343 41 347 19 0.004Defaulted 343 26 347 33 0.4
median (IQ range) median (IQ range)LOS (recovered) 281 56.0 (37-84) 292 42.0 (31-63) < 0.001Weight gain (recovered) 279 5.5 (3.8-8.3) 276 4.8 (2.4-7.3) 0.01
Programme
9.4.5.11 Predictors of mortality Admission characteristics that were significantly associated with reducing odds of
recovery across both the triaged and non triaged groups were (in order of strength of
association) MUAC ≤ 11cm, marasmic-kwashiorkor, weight for height ≤ -3 z scores and
anorexia (See Table 21). Only triage was significantly associated with increasing odds of
recovery. In univariate analyses only MUAC ≤ 11cm was significantly associated with
increasing odds of mortality and triage significantly associated with lowering odds of
mortality. Severe oedema appeared to have a borderline significant association with both
increased recovery and a (less significant) association with increased mortality.
In multivariate analyses using recovery and mortality as the dependent factors, the only
significant factors independently associated with recovery were MUAC ≤ 11cm and the
presence of anorexia that reduced the odds of recovery by 0.6 (p=0.03) and 0.4
(p<0.0001) respectively. The only significant independent risk factor that remained for
death was MUAC ≤ 11cm that increased the odds of death by 2.6 (p=0.03). There was a
119

120
borderline significant association of mortality with severe oedema in the direction of a
2.4 increase in odds of death in the presence of severe oedema (p=0.06) and with triage
which reduced the odds of death in the direction of half (p=0.07) (Table 21).
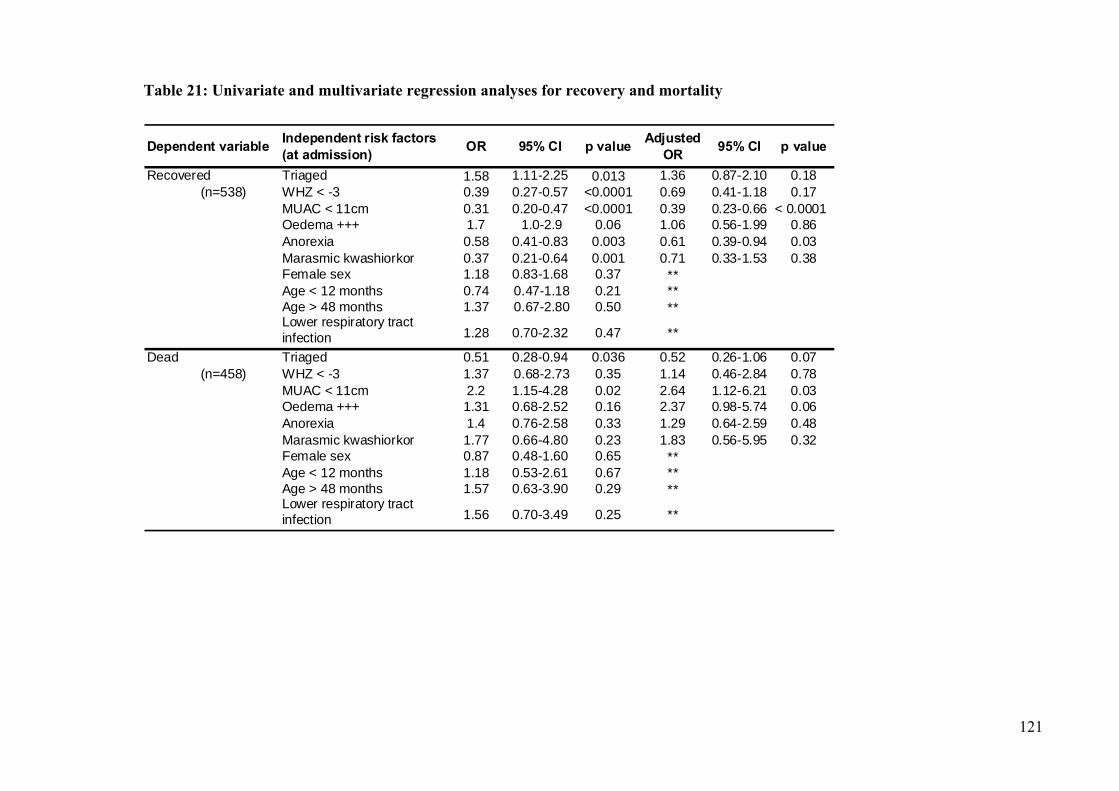
Table 21: Univariate and multivariate regression analyses for recovery and mortality
Dependent variable Independent risk factors (at admission) OR 95% CI p value Adjusted
OR 95% CI p value
Recovered Triaged 1.58 1.11-2.25 0.013 1.36 0.87-2.10 0.18 (n=538) WHZ < -3 0.39 0.27-0.57 <0.0001 0.69 0.41-1.18 0.17
MUAC < 11cm 0.31 0.20-0.47 <0.0001 0.39 0.23-0.66 < 0.0001Oedema +++ 1.7 1.0-2.9 0.06 1.06 0.56-1.99 0.86Anorexia 0.58 0.41-0.83 0.003 0.61 0.39-0.94 0.03Marasmic kwashiorkor 0.37 0.21-0.64 0.001 0.71 0.33-1.53 0.38Female sex 1.18 0.83-1.68 0.37 **Age < 12 months 0.74 0.47-1.18 0.21 **Age > 48 months 1.37 0.67-2.80 0.50 **Lower respiratory tract infection 1.28 0.70-2.32 0.47 **
Dead Triaged 0.51 0.28-0.94 0.036 0.52 0.26-1.06 0.07 (n=458) WHZ < -3 1.37 0.68-2.73 0.35 1.14 0.46-2.84 0.78
MUAC < 11cm 2.2 1.15-4.28 0.02 2.64 1.12-6.21 0.03Oedema +++ 1.31 0.68-2.52 0.16 2.37 0.98-5.74 0.06Anorexia 1.4 0.76-2.58 0.33 1.29 0.64-2.59 0.48Marasmic kwashiorkor 1.77 0.66-4.80 0.23 1.83 0.56-5.95 0.32Female sex 0.87 0.48-1.60 0.65 **Age < 12 months 1.18 0.53-2.61 0.67 **Age > 48 months 1.57 0.63-3.90 0.29 **Lower respiratory tract infection 1.56 0.70-3.49 0.25 **
121

122
9.4.6 Discussion This study presents outcomes from an integrated inpatient/outpatient programme that
adopted the principles of the CTC approach as described in chapter 7. It referred the
majority (78%) of severely malnourished children first for phase one treatment in
inpatient care, for an average of 7 days, and then to outpatient care for recovery. It also
utilised triage criteria to refer a small proportion (22%) of children directly to outpatient
care. All treatment was administered through existing primary health care structures and
MoH staff with support from an external NGO, Concern.
9.4.6.1 Mortality & Recovery Overall, the mortality rate was significantly lower than the Sphere Standard indicator for
this outcome (p=0.009). This suggests that this model of treatment can deliver care of
adequate quality as defined by Sphere. The recovery rate was just below the Sphere
standard for this indictor.
9.4.6.2 Default The default rate met the Sphere Standard indicator for this outcome. This indicator is
generally used to monitor the level of accessibility (for example, distance of treatment
from the community) and acceptability (for example, the perceived quality of treatment)
of the treatment provided in selective feeding programmes. The low levels of default
seen here suggest that treatment was accessible and acceptable to most participants. This
is discussed further in relation to the programme’s coverage in the next chapter.
9.4.6.2.1 Follow up of defaulters Follow up was attempted of all children that defaulted from treatment and 58.8% of them
were found. At baseline, children that defaulted were more likely to have marasmic
kwashiorkor or marasmus and were more wasted than children that recovered. This is
reflected in a seemingly higher < 1 month mortality rate at follow up (10.5%) (Figure 14)
than the mortality rate in the whole programme (7.3%) although this difference is not
significant. If we take 10.5% of all defaulters and add these deaths to ‘within programme
mortality’ the programme case fatality rate rises to 8.3% (131/1572). This remains within
the Sphere standard indicator for mortality of therapeutic feeding programmes.

123
9.4.6.3 Non response 9.3% of children had a length of stay of more than 122 days and were classified as ‘non
responders’. However treatment in the programme continued for all of these children
until final outcome. A particularly long length of stay such as this can occur as a result of
a number of factors; recurrent episodes of acute illness such as diarrhoea, chronic illness
such as HIV or TB, socio-economic factors at home that interfere with recovery (for
example poor care environment or destitution). It is likely that a combination of these
factors contributed to the rate of non recovery in Dowa, although this was not examined
specifically. Most of these children recovered eventually, and when the final outcomes of
these children are included in the overall programme outcomes, the programme recovery
rate rises to meet the Sphere standard.
9.4.6.4 Mid study outcomes compared to the National TFC programme At the time of this study the National NRU strategy was also scaling up to treat severe
malnutrition in Districts outside Dowa and Nkhotakota. Figure 19 compares these data
with CTC programme data up to the end of December 2002, the period for which the
National data were available. This shows that at this point, the Dowa programme had
superior cure, mortality and default rates compared to the National centre based
programme. More recent data, discussed by Linneman et al 2007, have suggested that
high mortality and default rates in the national TFC programme continued well in to
2006 (100). Comparison of these results must remain tentative as there is no way of
adjusting for the severity of malnutrition at admission. However, it is possible that the
clinical outcomes from the CTC strategy in Dowa were considerably better than those
produced by the National NRU strategy. In addition, although confined to only one of
the 25 districts in Malawi, the programme in Dowa had admitted a similar number of
patients by December 2003 (n=342) to the nationwide NRU strategy (n=379). This
suggests a far superior coverage of the target population (see chapter 10 below for a
discussion of the coverage of this programme) by the CTC programme.

0%
10%
20%
30%
40%
50%
60%
70%
c ure death default o therd istrib u tio n ro u n d
num
bers
TF C n = 3 29 C TC n = 21 1
Figure 19: Comparison of impact indicators of CTC and NRU strategies in Malawi
August - December 2002
9.4.6.5 Outcomes in the NRUs and the OTP Recovery, mortality and default rates all remain within Sphere standard indicators when
they are disaggregated to those that occurred in the inpatient (NRU) and in the OTP
components of the programme.
9.4.6.5.1 Mortality in the NRUs and the OTP Mortality is, unsurprisingly, significantly higher in the NRUs than in the OTP (8.1% vs.
3.5% χ2 21.4 p<0.0001). This is because the most complicated cases were always treated
in inpatient care and children are usually at higher risk of mortality at the beginning of
treatment. When OTP and NRU mortality is compared to the expected mortality
calculated by the Prudhon index, although differences are not significant, mortality in
NRU treatment is in the direction of a 2.2% excess (expected: 5.5% observed: 7.7%) and
mortality in OTP treatment is less than that expected (expected: 4.9% observed: 4.1%).
Figure 15 and Figure 16 show that both the NRUs and the OTP experienced a similar
pattern of excess mortality over the rainy season when the number of inpatients was
highest. However, whilst excess mortality is significantly correlated with numbers of
inpatients in the NRUs there is no significant correlation between these variables in the
OTP. Despite direct admission being in place from January 2003, staff were cautious
124

125
with its use (only 22% were referred directly to the OTP Jan-Dec 2003). This resulted in
70% of the children still passing through NRUs (compared to many subsequent CTC
programmes that referred up to 90% of children directly to the OTP – see chapter 11
Going to Scale with CTC) and was not sufficient, especially during the rainy season, to
alleviate problems associated with poorly resourced units struggling to cope with the
high numbers requiring treatment. When the number of inpatients is very high the staff :
patient ratio reduces considerably and the patient density in NRUs increases. As a result
it is more difficult for staff to deliver high quality care and the risk of cross infection
increases. This may have contributed to the excess mortality seen and is comparable with
other findings from large TFC studies that have attributed excess mortality to under
resourced centres being unable to implement protocols to a high enough standard for
large numbers of patients (78) (see also section 6.5).
However, this does not explain the similar pattern of mortality seen in the OTP and in
this study we have not controlled for differences in case severity between seasons. Cases
of diarrhoea and acute respiratory infections, common complications of SAM, often
increase during the rainy season. This may also have increased ‘difficult to treat’
malnutrition over this time and may have contributed to the excess mortality seen. It is
also possible however, that malnutrition outside the rainy season in Malawi is less likely
to be a direct cause of food shortage and more likely to occur as a result of chronic
disease, such as HIV, and/or particularly poor socio economic circumstances at home.
This also can make malnutrition ‘difficult to treat’. This would need further study.
9.4.6.6 Outcomes by type of treatment Table 14: Outcomes by category of malnutrition and type of treatment, presents the
outcomes of children treated during this study disaggregated by whether they received
only direct outpatient treatment or a combination of initial inpatient treatment followed
by early discharge into outpatient treatment (indirect). A direct comparison between
these two groups is inappropriate as the children admitted into inpatient care were, from
January 2003, those whom the staff considered to be most sick. However, Table 14
suggests that children with SAM including those with grades one or two oedema, who
are not suffering from additional serious medical complications, can be treated
successfully with outpatient treatment alone. The number of deaths that occurred for all
categories of malnutrition in direct treatment was lower than the expected number

126
calculated by the Prudhon Index, although, due to small numbers, at a non significant
level. This suggests that, with these triage criteria, there is no excess mortality attached
to direct treatment in outpatient care for any category of malnutrition. These results
concur with other more recent studies in Malawi and elsewhere that have also found low
mortality among oedematous children with good appetite treated directly in outpatient
care (100;132) and suggest that the caution adopted by others that have used, for
example, the presence of oedema as criteria for referral to inpatient treatment, may not
be necessary (136).
9.4.6.7 Outcomes by category of malnutrition
9.4.6.7.1 Kwashiorkor It is important to note that children suffering from kwashiorkor made up the majority
(60.7%) of admissions in this study. This is typical for Malawi where oedematous
malnutrition (including marasmic-kwashiorkor) accounts for 75% of all admissions to
NRUs across the country (89). The Ethiopian study discussed in section 9.2 treated a
much higher proportion of wasting with a low case fatality rate, but it is important that
the findings here are repeated in large scale operational studies in populations with
higher rates of wasting, before any broad statements about the effectiveness of the
approach are made (see discussion chapter 11).
In this study it is children with kwashiorkor that had the highest recovery rate;
significantly more so than all groups apart from those children <4kg, and one of the
lowest case fatality rates (significantly lower than children with marasmic kwashiorkor).
They also had lower rates of non response and default than that seen among the children
that were wasted. Kwashiorkor, in this context, appears to demonstrate better outcomes
than other categories of malnutrition. Why might this be so, when the condition is so
often described in the literature as being characterised by anorexia, irritability and
ulceration and presented as complex and ‘difficult’ to treat? (20;26;89). It is likely that
the reason for this comes back to the design of the CTC programme, which, by
improving access to and reducing opportunity costs of treatment, encouraged much
earlier presentation. During this study many children presented with mild nutritional
oedema and did not suffer from the additional complications so often associated with the
condition. It seems that many mothers, instead of waiting until their children were very
sick were presenting at treatment sites almost as soon as swelling (or oedema) was noted.

This allowed the majority of oedematous grade
I cases (165/293, 56%) to be treated directly in
outpatient care with very low mortality (1.8%).
This concurs with recent findings of other
home-based treatment programmes that also
treated the majority of oedematous patients at
home with low mortality (100) but contradicts
previous observation in Malawi by Brewster et
al that kwashiorkor in the Malawi region is
more severe than in other regions of the world.
They speculated that this was an important
contributor to the poor outcomes in their study
(89).
Figure 20: An example of oedema grade 2: successfully treated directly in
outpatient care.
The evidence presented here would suggest that more importantly, encouraging earlier
presentation of the condition might result in very different and less complicated cases for
treatment.
9.4.6.7.2 Treatment of oedema To address, in part, a concern of study 1 that providing RUTF to oedematous children
was the cause, through encouraging metabolic imbalance, of longer than usual time for
oedema resolution (76;161) this study provided RUTF as a quantity proportional to a
child’s weight (rather then the set quantity delivered during study 1) according to WHO
protocol. The number of days to clinical resolution of oedema was significantly less in
this study than that seen in Ethiopia (5 days [3-9] vs. 28 days [21-35] p < 0.01) and this
may be due in part to the provision of more appropriate diets. However, this comparison
does not control for the grade of oedema which may have been more severe in Ethiopia.
9.4.6.7.3 Marasmic kwashiorkor Children with marasmic kwashiorkor are the only group that demonstrate a mortality rate
that falls outside the Sphere standard. This group often suffers from profound metabolic
dys-adaptation, are invariably infected and often anorexic (3). As a result of the Ethiopia
127

128
study findings, any child with marasmic kwashiorkor, should have been referred for
inpatient treatment and not treated directly in the OTP. Twenty five children with
marasmic kwashiorkor in this study were referred in to direct treatment either because
mothers refused to go to an NRU or because anorexia and other signs of complications
were not present. The results presented here show that although there does not appear to
be any increased risk of mortality (8% in direct OTP vs. 13.7% in indirect treatment), nor
any excess mortality with direct treatment in this group, an increased risk of both non
response and default can not be ruled out. The numbers of children suffering from
marasmic kwashiorkor treated here are also small and therefore, until larger studies are
implemented, marasmic kwashiorkor should remain as a characteristic that defines
‘complicated malnutrition’ for referral to inpatient care.
9.4.6.7.4 Marasmus Children with marasmus also presented with more complications in this study: only 26%
of wasted children were admitted directly to OTP as having malnutrition with no
complications compared to 56% with oedema grade I. It is probable that one of the
reasons for this is that wasting is now closely associated with HIV and other chronic
conditions such as TB in Africa which in turn are associated with a poor response to
treatment of malnutrition (101). A recent study by Bahwere et al showed that HIV
infected children that were treated in the CTC programme in Dowa were more likely to
be admitted with MUAC < 110 mm and less likely to have oedema than uninfected
children (162). This was also observed in the previous study described in section 9.3 that
found HIV prevalence to be significantly higher among wasted children than
oedematous. Alternatively, it is possible that weight loss is less likely to be noticed by
mothers and health workers than swelling or oedema early on in the progression of
malnutrition and hence, at presentation, it is more complicated to treat. Probably as a
result of these chronic complications the marasmic group experienced a higher rate of
non response and default than those in the kwashiorkor group (see Table 11). Possible
causes include reduced intake due to poor appetite, nutrient malabsorption, increased
incidence of infections that were unresponsive to the broad-spectrum antibiotics used,
and increased nutrient requirements due to HIV (163). This has resulted in their recovery
rate falling outside the international standard.

129
The longer length of stay demonstrated by wasted children may also be one of the
reasons for the high rate of default in this group (marasmic kwashiorkor: 14.2% and
marasmic: 12.2%) as the opportunity costs of prolonged treatment outweigh carer’s
perceived benefit of treatment (see Table 11). In addition, this study traced 52.7%
(78/148) of children that defaulted and from these final outcome data (Figure 14) it
seems that raised mortality after default (10.8% in the marasmus kwashiorkor group and
16.7% in the marasmic group vs. 7.9% in the kwashiorkor group p > 0.05) may also have
contributed to a proportion of the raised rate of default in the wasted group, although, as
numbers are so small, these differences are not significant. A raised mortality after
default in a group with a higher prevalence of HIV would concur with other work in
Dowa that also showed higher mortality after programme exit in HIV positive children
(162).
In the context of HIV where recovery rates from conditions such as SAM are likely to be
prolonged, treatment and support programmes such as CTC need to further examine
ways of improving effectiveness and reducing the beneficiary’s perceived opportunity
cost of treatment. HIV positive children may need more RUTF than HIV negative
children to achieve similar rates of recovery and improvements in other nutritional
indices. Increasing the amount of daily energy offered to HIV infected children may
improve their weight gain and reduce their length of stay in the programme. In addition,
where HIV is prevalent, adapting CTC routine antibiotic treatment to the epidemiology
of HIV-associated infections and inclusion of routine prophylactic cotrimoxazole for
HIV-positive children, as currently recommended by WHO, may improve outcomes in
this group (162;164). As discussed above in study 2 section 9.3.6.3, it will also be vital
that CTC programmes are linked to HIV diagnostic and treatment facilities using well
defined referral criteria.
Consideration needs to be given as to whether the high rate of non response in the wasted
group is strong enough evidence to include marasmus as a criteria for inpatient referral.
Firstly, treating wasted children in direct OTP with the triage criteria used in this study
does not appear to increase the risk of non response in this group (χ2 = 1.2 p=0.3). Also,
it does not seem to have led to higher default in this group (compared to indirect
treatment) suggesting that direct treatment remains an acceptable option for many and
does not lead to significant death outside the programme (Table 14). Secondly, if long

130
length of stay in this group is related to chronic illness such as HIV, unless malnutrition
is complicated by signs that may lead to increased risk of mortality such as anorexia,
treatment of immunocompromised patients in the community, rather than in crowded
inpatient units, may be preferable. It is easily integrated in to home-based care
programmes that are a common support mechanism for HIV positive people in the
developing world and are generally accepted to be more appropriate for long term
support strategies (165).
9.4.6.8 Outcomes by age group There have been concerns that CTC would not be suitable for very young children (i.e. in
the 6-12 month category) as they have tended to experience higher mortality as a result
of SAM . Particularly, there were concerns about treating this group directly in outpatient
care with no inpatient treatment. Table 16 and Table 17 shows that overall in Dowa it
was not the youngest age group (6-12 months) but the oldest age group (> 60 months)
that suffered higher mortality than other groups. It is not unusual to see older children
suffer from malnutrition that is secondary to chronic illness other than HIV, which is
more common among the younger age groups. In this study for example children > 60
months with complicated malnutrition were 2.2, 3.5 and 4.9 times more likely to be
suffering from LRTI than the three youngest groups respectively, a condition very often
indicative of TB (20/33 vs. 23/123 p=0.007, 42/327 p<0.001 and 32/387 p<0.001 in the
three youngest age groups). To reduce mortality further for these children, better referral
and a higher standard of treatment for conditions such as TB might improve response to
treatment.
Despite appearing to demonstrate a higher risk of mortality overall in this study, treating
the older or the younger age groups directly in OTP appeared to carry no additional risk
of mortality (Table 17). This would suggest that any child of > 6 months suffering from
malnutrition with no complications can be safely treated directly in outpatient care.
9.4.6.9 Weight gain and length of stay Overall, the average rate of weight gain of children that recovered during this study was
5.4 g kg-1 day-1 [3.4-7.9], lower than those stipulated in the Sphere standards and lower
than those seen in well functioning TFCs. Average length of stay was correspondingly
longer (42 [28-71] days) than the target in the Sphere guidelines. In comparison with

131
weight gains seen in the Ethiopian study however, there does seem to be some
improvement. The Ethiopian study observed a weight gain among recovered children of
3.7 [2.3-6.3] g kg-1 day-1 , significantly lower than that seen in this study (p=0.003).
Adapting the ration size of RUTF to mirror more closely the WHO protocol and the
provision of more community support to participant families through community health
workers and volunteers during this study may have contributed to this improvement.
As seen in the Ethiopia study, slower rates of recovery than stipulated by international
standards did not result overall in high mortality rates in the programme, supporting the
view that treatment in the OTP entails little if any increased risk to the malnourished
child (see discussion section 9.2.5.3). The high proportion of oedematous children in
this population, many of whom, at the point of oedema loss, were not wasted, will almost
certainly have reduced weight gain overall and is consistent with other outpatient
programmes that have treated a large proportion of oedematous children (100;132).
Other CTC and outpatient programmes that have had a lower proportion of oedematous
children making up admissions have achieved higher weight gains (see Chapter 10,
Table 27 : Outcomes from children presenting to CTC programmes between Feb. 03 and
Dec. 05 (N = 20,418): Ethiopia Harage and Ethiopia Sidama and references (135;136)).
It is likely that community-based programmes, particularly those treating very high
numbers of oedematous children, will rarely achieve the rates of weight gain laid out in
the Sphere standards and this should be considered when evaluating such programmes. A
recent review of community-based treatment programmes used weight gain of > 5g kg-1
day-1 as an indicator of programme effectiveness (130) and this may be a more realistic
target for such programmes .
It is important to note however that low weight gain and slower recovery rates will
impact on the costs of programme delivery. This would need to be balanced against the
costs of delivering care through an equivalent number of inpatients units that includes the
increased opportunity costs borne by the programme participants. This requires further
study.
As the results of the Ethiopia study and other work have suggested, this lower weight
gain (vs. the Sphere standards indicator) is also likely to be, in part, caused by sharing of
the RUTF ration with other children in the household or community not registered on the

132
programme (134). In Dowa this was confirmed during work carried out by sociologists
and anthropologists. Many mothers questioned acknowledged that rations were shared
between children (166). Sharing of rations is often seen as a ‘negative’ aspect of home-
based care programmes (130;167). However, this work also highlighted that having food
to share in the house (and this included the blended food ration given out with the
RUTF) was seen as a very positive aspect of the CTC programme by carers of
malnourished children. From their perspective it helped to ensure that no child would
starve to death during a time when many households were suffering particularly acute
food insecurity and it helped to strengthen family cohesion, by ensuring that there was
enough good quality food to share and eat together at family meal times. In the light of
these findings, is it appropriate that emergency feeding programmes put large amounts of
resources in to preventing sharing of rations? This is a question that can not be answered
by this thesis, but it is possible that it might be more culturally appropriate to incorporate
the possibility of sharing in to CTC programme design.
9.4.6.10 The need for follow up and support at home Study 1 suggested that forming community groups might help, as a support strategy, to
improve response rates in outpatient programmes. This was not possible in Malawi due
to the geographical dispersion of households with a severely malnourished child in the
programme. There were rarely more than 1-2 children from the same village in the
programme at any one time. Forming groups that met in between OTP visits therefore
was not feasible. This will be a problem for most programmes dealing with a relatively
rare event such as SAM. In Malawi, the use of community outreach was a more feasible
form of providing ad hoc support in the home to those that needed it. However, Figure
17 and Figure 18 show that 31% of the mortality experienced by children that were
discharged from the NRU in to the OTP, and 43% of the mortality that occurred among
those treated directly in the OTP happened in the first two weeks of OTP treatment.
These data are difficult to interpret as there are many unknowns. The causes of death in
the OTP, the proportion of cases that were voluntary discharges by carers taking very
sick children home to die or that, despite fulfilling NRU referral criteria refused inpatient
care; the proportion of these deaths that could have been avoided with prolonged
inpatient care and the proportion of children who would have acquired infections and
died had they been referred to or kept longer in the NRU are all unknown. It is clear
however, that a high proportion of the mortality in the OTP tends to occur in the first two

133
weeks of treatment and thereafter is low. This has implication for follow-up and in
future the CTC action protocol should better reflect the need for more consistent follow
up at home during the first two weeks after admission into the OTP.
9.4.6.11 The use and impact of triage In 2002 there was concern in the international nutrition community that using triage
criteria to treat severely malnourished children directly in outpatient care would be
dangerous in some contexts (70). Initially, the nutrition community in Malawi were
concerned about the potential risk of treating severely malnourished children as
outpatients and the NRU facilities has sufficient space to take all children for phase 1
treatment. Therefore, for the first 5 months of the programme (1st August-31st December
2002) whilst numbers allowed, all children admitted to the programme received phase 1
treatment in the hospital or one of the supported NRUs, followed by outpatient care in
the OTP. During this first 6 months programme monitoring clearly showed that there
was no increased mortality risk attached to outpatient care and that, as admissions
increased, the NRUs were getting very overcrowded. Therefore, from 1st January 2003,
triage criteria were introduced that allowed children suffering from severe acute
malnutrition with no complications to be treated directly in the OTP.
In order to control for the influence of season on mortality and to examine the impact of
using triage in the treatment of SAM, outcomes from two subgroups of the whole study
population were compared. The first group (non triaged) were treated between August
and December 2002 and the second (triaged) between August and December 2003. A
comparison of mortality and recovery in the triaged and non triaged groups suggests that
triage may increase the chance of recovery and reduce the risk of mortality (see Table
20). However, the non triaged group had lower MUAC and more severe oedema at
admission than the triaged (see Table 19). When triage is entered in to the multivariate
analysis of risk factors for mortality and non recovery, the use of triage does not reduce
recovery nor increase mortality during treatment, and may reduce mortality in the
direction of half (p=0.07). The case fatality in each group when compared with the
expected case fatality using the Prudhon index shows no significant differences, but does
indicate a trend towards higher excess mortality in the non triaged group. Reduced
mortality in the triaged group could be due to less overcrowding in inpatient units that
allows staff to focus resources on those at highest risk of mortality and/or a reduction in

134
acquired infection, a common problem in busy inpatient settings that treat
immunocompromised patients (121;168).
However, the triaged group in this study was treated 1 year later than the non triaged
group and, although this gives some control for the influence of season on clinical
outcome, we could not control for increasing staff experience in implementing treatment
protocols over time. More experienced staff may have improved the quality of care given
and therefore the clinical effectiveness of treatment. In addition, the operational nature of
these data and the fact that the use of triage was new in Malawi and therefore adopted
with some caution, may have introduced error in to the triage process. It is likely for
example, that if there was any doubt at all of the suitability of a child for direct outpatient
care, staff are likely to have acted ‘safely’ and referred to inpatient treatment first. This
may mean that risk of mortality in those children admitted directly to OTP in this
programme was lower than other programmes that might use triage less cautiously. Both
of these factors limit the interpretation of these results. However, the mortality seen in
the direct outpatient group (2.0% in the whole programme: Table 14) is comparable to
other programmes that have used triage more widely and which have used similar
outpatient protocols using RUTF. Linneman et al in 2007 for example reported a
mortality rate of 1.4% (95% CI 0.9, 2.0) among children that were admitted directly to
outpatient care in Southern Malawi (100).
9.4.6.12 Predictors of mortality and defining SAM with complications Table 21 shows that WFH ≤-3 z scores, MUAC ≤ 11cm and the presence of marasmic
kwashiorkor or anorexia were all strong predictors of a poor outcome i.e. non recovery;
MUAC ≤ 11cm was also associated with increased risk of death. Severe oedema
appeared to have a borderline significant association with both increased recovery and a
(less significant) association with increased mortality. This is likely to be due to the
significantly higher chance of default among other grades of oedema (++ and +) ( OR =
5.66 p=0.001) which reduced the recovery rate in this group and bought it closer to that
of the recovery rate in the severe oedema group.
The association between many of these indicators and poor outcome has been
documented previously (169-171). In this study, a combination of these indicators in a
multivariate model strengthened the association between MUAC ≤ 11cm, the presence of

135
anorexia and the presence of severe oedema with mortality and/or non recovery. This
suggests that a combination of anthropometric and clinical indicators (MUAC ≤ 11cm
with anorexia for example) as used in this study is a more effective mechanism for the
selection of children that have a high risk of mortality and therefore require more
intensive inpatient treatment than the use of a single indicator such as MUAC ≤ 11cm.
9.5 Conclusion The title of this chapter asked the question ‘Can CTC achieve clinical effectiveness?’ and
went on to present an in depth analysis of the clinical outcomes of 2819 children with
SAM that were treated in the first outpatient programmes in Ethiopia and Malawi.
Overall, the data presented provide evidence that CTC can be a highly effective model of
nutritional intervention in humanitarian emergencies and can provide substantial
advantages over inpatient treatment modalities. Where the full CTC model was
implemented study outcomes indicated average mortality rates that were considerably
lower than the minimum international standard stipulated by Sphere and that compared
favourably with those TFC outcomes reported by Grellety (78), the Malawi inpatient
programme and by many of the inpatient studies reported in the literature (see section
6.5.1). In study 2, where the model of decentralised outpatient treatment was not used,
mortality remained significantly higher than the indicator given by Sphere. One reason
for this is likely to be because the children treated in this study presented much later for
treatment and were therefore considerably sicker than those treated in studies 1 and 3.
Another reason is that the HIV prevalence in the group treated in study 2 was much
higher than that treated in study 3. CTC programmes need to further examine
mechanisms for improving effectiveness of treatment in this group.
Importantly, the examination of the use of triage as an independent risk factor for
recovery and mortality in study 3 suggested that the use of triage does not reduce the
chance of recovery and may reduce the risk of mortality, although this would need
further study. The number of deaths that occurred for all categories of malnutrition and
all age groups in direct outpatient treatment (i.e. where no inpatient care was provided)
in study 3 was low and was lower than the expected number of deaths calculated by the
Prudhon index. This suggests that, with the right triage criteria, there is no excess
mortality attached to direct treatment in outpatient care for any category of malnutrition.

136
However, kwashiorkor made up the majority of the admissions to this study and only a
relatively small proportion of children were treated directly in outpatient care. For this
reason, it was important that the findings presented here were tested more widely in
populations with higher rates of wasting, and in programmes where direct treatment in
outpatient care was used less cautiously, before any broad statements about the
effectiveness of the approach were made. Chapter 10 goes some way towards doing this.
Results presented in this chapter do suggest that outpatient treatment will slow the rate of
recovery compared to that seen in well resourced inpatient units. None of the studies
reported here achieved the international standard for weight gain stipulated by Sphere of
8g kg-1 day-1 nor the standard for length of stay of 30 days. This will impact on
programme costs and needs to be studied further.

137
10 Can CTC Achieve High Coverage? : Comparing the coverage of CTC and a centre-based therapeutic feeding programme in Malawi
10.1 Introduction One of the core principals of CTC programmes is that treatment should be decentralised,
improving access to multiple treatment sites and thus facilitating high coverage of target
populations. The measurement of programme coverage during this research was therefore
vital for the assessment of the overall effectiveness and impact of CTC interventions.
This chapter first describes the basis for previous coverage survey methods and their
important limitations. The development of a novel coverage survey method is then
explained, a process in which the author played a significant role as a member of the
research team. The developed method was then piloted in Malawi by the author and
subsequently used to examine the level of coverage achieved by the CTC programme in
Dowa Malawi in comparison to that achieved by a centre-based therapeutic feeding
programme in a neighbouring District. This chapter describes the survey results and
discusses the major factors affecting access to, and utilisation of, the CTC programme in
Dowa.
10.2 Study 4: A new survey method to compare the programme coverage of two therapeutic feeding interventions implemented in neighbouring districts of Malawi
See Appendix 1 sections 14.1.4 and 14.1.5 for published articles (112;172)
10.2.1 Introduction
10.2.1.1 The need for a new technique to measure coverage In 2004, specific coverage indicators for selective feeding programs were included in the
Sphere project's humanitarian guidelines for the first time (72). Traditionally, approaches to
estimate therapeutic feeding programme coverage have relied on taking data from the

138
‘standard’ nutrition survey used to estimate the prevalence of acute malnutrition in a
programme area. The survey method usually adopted is an adaptation of the WHO
Expanded Programme on Immunisation (EPI) coverage survey method (173-175). This is a
two-stage cluster sampling approach which begins by dividing a population into geographic
sections for which population estimates are available. A set of clusters is allocated to these
sections in the first sampling stage. The probability of a particular cluster being allocated to
a section is proportional to the size of the population in that section. Sections with large
populations are more likely to be allocated clusters than those with small populations. This
sampling procedure, called probability proportional to size (PPS), helps to ensure that
individuals in the programme area have an equal chance of being sampled when a quota
sample is taken in the second stage of the survey (176). In recognition of the difficulties of
drawing a random sample in many developing countries (177), the EPI method uses a
quasi-random sampling method in the second stage. The most commonly used second stage
sampling method is a proximity technique. The first household to be sampled is chosen by
selecting a random direction from the centre of the cluster, counting the houses along that
route, and picking one at random. Subsequent households are sampled by their physical
proximity to the previously sampled household. Sampling continues until a fixed sample
size has been collected (quota sampling) or until a set number of households have been
visited. Sampling is simple and requires neither mapping nor enumeration of households. It
is, consequently, usually both quicker and cheaper than using simple random sampling in the
second stage of the survey (178).
Once data are collected coverage is estimated either directly using survey data or indirectly
using survey data, programme enrolment data, and population estimates. Interpretation of
the results of both methods usually assume that coverage is similar throughout the entire
survey area and both can provide only a single wide-area coverage estimate.
The EPI method does, however, have problems. The PPS approach is unsatisfactory
because:
− The bulk of data are collected from the most populous communities. This may leave
areas of low population density (i.e. those areas consisting of communities likely to
be distant from health facilities, feeding centres, and distribution points)

139
unrepresented in the sample. This may cause surveys to evaluate coverage as being
adequate even when coverage is poor or non-existent in areas out side of urban
centres.
− There is no guarantee of an even spatial sampling. This is true even when the
population of the survey area is evenly distributed. Again, PPS will usually leave
some areas unrepresented in the sample.
− It relies on population estimates which may be inaccurate in emergency contexts,
particularly if population displacement, migration, or high mortality has occurred in
the target population.
− The sample size used in these surveys is usually 900 children collected in thirty
clusters . This sample size allows the prevalence of acute malnutrition to be
estimated with reasonable precision, but when the aim of the survey is to estimate the
coverage of a feeding programme for severe acute malnutrition, the sample size will
usually be too small to estimate coverage with reasonable precision. There is a
similar problem with calculating coverage indirectly. Survey sample sizes are
usually too small to estimate the prevalence of severe acute malnutrition with useful
precision. This results in prevalence estimates with confidence intervals that are wide
relative to the magnitude of the estimate, leading to similarly imprecise estimates of
programme coverage.
− The proximity method is unlikely to return a representative sample at the level of the
cluster. It is not possible to estimate coverage reliably for a cluster without taking a
representative sample from the cluster location (section).
− Even if a representative sample were taken at the cluster level, the normal within-
cluster sample size is too small to estimate coverage at the cluster level with
reasonable precision.
Thus, when applied to the problem of assessing the coverage of selective feeding
programmes, the EPI method has important limitations.
This study presents a trial of an alternative method of measuring therapeutic feeding
programme coverage and, using this new method, compares the coverage achieved by a

140
centre-based therapeutic feeding programme and a CTC programme operating in
neighbouring Districts in Malawi during 2003.
10.2.2 Objectives To test a survey method applicable to estimating the coverage of selective feeding
programmes in humanitarian emergencies and to use this method to compare therapeutic
feeding programme coverage for severely malnourished children achieved by a Community-
based Therapeutic Care (CTC) programme and a Therapeutic Feeding Centre (TFC)
programme operating in neighbouring Districts in Malawi.
10.2.3 Methods
10.2.3.1 Trial Location See section 9.4.3.1 for background to the nutritional emergency in Malawi in 2002.
In March 2003, seven months into implementation of the national TFC strategy and the CTC
programme in Dowa District, we implemented a study to compare the coverage of the CTC
programme in Dowa and of a centre-based therapeutic feeding program for the treatment of
severe malnutrition in a similar neighbouring District to Dowa, Mchinji. Both districts are
located in the central region of Malawi and had been subject to prolonged food shortages
(179). The high national prevalence of HIV further aggravated this situation, resulting in
elevated levels of acute malnutrition.
Dowa and Mchinji districts are similar in their demographic and socio-economic profiles
(see Table 22).

141
Table 22: Demographic and socio-economic characteristics of the two target areas for
study 4.
Dowa Mchinji
Size (km sq) 3041 3156
Population 411,000 324,941
Under five population 73,980 58,489
Main religion > 90% Christian > 90% Christian
Percentage population in formal employment 1% 8%
Percentage land under cultivation 47% 62%
Prevalence of global acute malnutrition (weight-for-height z-score < -2)
4.5% (Feb 03) 2.9% (Dec 02)
Average population per health centre 20,360 26,839
Average population per doctor 101,000 348,903
Leading cause of mortality Malaria Malaria
Hospital beds per 1000 population 0.9 1.1
General ration distribution start date June 2002 June 2002
General ration distribution target population (no. households)
20,218 10,232
In accordance with the national strategy for the treatment of acute malnutrition, an
international NGO provided training and support in Mchinji for two NRUs, based at
government health facilities, to provide inpatient TFC treatment for children with severe
malnutrition. An additional NRU, at a mission hospital run by the Christian Health
Association of Malawi (CHAM), was also given some support. All supported NRUs
provided phase 1, 2 and 3 inpatient care for severely malnourished children according to
WHO and National protocols. In addition, a supplementary feeding programme (SFP) was
supported at each treatment site. The Mchinji programme typified the level of support being
provided under the national strategy for the treatment of acute malnutrition.
In Dowa the CTC intervention, described in study 3, established four stabilisation centres for
the treatment of severe malnutrition with complications within mission and government run
hospitals and NRUs. These provided phase 1 inpatient care according to WHO and National

142
protocols for those children that needed it. In addition, 18 outpatient treatment sites were
established within health centres across the district. Each outpatient treatment site
implemented an outpatient therapeutic programme (OTP) and a SFP. NGO staff made up
mobile support teams which rotated around treatment points and supported the MoH staff
with service delivery.
Programmes in both Districts were established within existing Ministry of Health structures
and therapeutic care was delivered by Ministry of Health staff in health centres and NRUs.
Table 23 describes the additional inputs provided by each NGO and UN organisations to
support the Ministry of Health staff during programme implementation.

143
Table 23: Programme inputs provided by supporting agency in the two study areas.
CTC programme Dowa TFC programme Mchinji
NGO staff: Direct patient care
1x nutritionist (expatriate) Health centre/community support: 2x team leaders 2x nurses 2x registration staff 2x community educators 2x drivers NRU support: 2x nurses 2x feeding attendants
1x doctor/nutritionist (expatriate) 1x nurse 1x nutritionist 1x driver
Consultant staff: CTC development and monitoring *
1x doctor (expatriate) 1x nutritionist (expatriate) 1x anthropologist (expatriate)
Food To all health centres and NRUs: Ready-to-use therapeutic food (RUTF) Corn-soya blend (from WFP) To all NRUs: Therapeutic milks (from UNICEF)
To all NRUs: Therapeutic milks (from UNICEF) Corn-soya blend (from WFP)
Medicines IDA drug kits that include the routine medicines required to treat severe malnutrition provided to each treatment site (a proportion from UNICEF)
IDA drug kits that include the routine medicines required to treat severe malnutrition provided to each treatment site (from UNICEF)
Non food items Soap
Transport 2x four wheel drive vehicle 1x four wheel drive vehicle
Method of motivation for partner MoH staff in health centres, NRUs and community.
Training and ongoing support from programme staff during programme implementation
Training and ongoing support from programme staff during programme implementation
* Consultant staff were research staff on short term support visits.

144
Around the time of the surveys reported here (March 2003) the prevalence of severe acute
malnutrition among children < 5 years in Mchinji was estimated to be 2.9% and in Dowa to
be 4.5% (180;181).
10.2.3.2 Survey Design Two surveys were implemented simultaneously, one in Dowa District and one in Mchinji
District. The surveys used a stratified design with strata defined using the centric systematic
area sample method (182). This method involves dividing the survey area into non-
overlapping squares of equal area (quadrats) and sampling the community or communities
located closest to the centre of each quadrat. A 1:50,000 scale map of each district was
available from the 1998 Malawi national census. A ten-by-ten kilometre grid was overlaid
onto each map. All quadrats with more than half of their area inside the district were
sampled. Thirty 100 km2 quadrats were sampled. The selected quadrats covered
approximately 3000 km2 in each district. That’s 89.4% of the 3356 km2 total land area of
Mchinji district and 98% of the 2770 km2 total land area of Dowa district. Communities
located closest to the centre of each quadrat were then sampled using a case-finding
approach. The number of communities sampled from each quadrat was limited by the
number of communities in that quadrat which could be sampled by a survey team in a single
day. This varied between quadrats and depended on the size of each community (in terms of
both population and physical extent) and the distances between communities. Once
sampling started in a community, it continued until no further cases could be found. No
communities were partially sampled. The location of the centre of each quadrat was
identified by reference to the map. A list of communities to be sampled from each quadrat
was made prior to the survey team visiting the quadrat. The order of this list (which was also
the order in which the communities were sampled) was determined by the proximity of each
community to the centre of the quadrat, with the community closest to the centre of the
quadrat being sampled first.
10.2.3.3 Sample Size The sample size was calculated using EpiInfo v6.04d (148) and was based on an estimated
feeding programme coverage of 55.5% and 35.5% and an estimated prevalence of severe
malnutrition of 4.5% and 2.9% for Dowa and Mchinji Districts respectively. These estimates
were based on previous nutritional surveys in the two study areas. The population in each

145
study District was estimated using data from the 1998 Population and Housing Census and
village populations were supplied by each District Assemblies Office (156). An α risk
(significance) of 0.05 and β (power) of 0.8 were used. This gave a required sample size of
106 severely malnourished children in each District.
10.2.3.4 Case-finding For the within-community samples, a case-finding approach was adopted. Two methods
were investigated. These were:
1. Screening of all children in a single community at a central location in their home
community.
2. Screening, in their homes, of children identified as thin, sick, or oedematous by the
community health worker. Additional children were also identified by mothers in
each of the screened households.
Each method identified the same children. The second method was considerably more
efficient than the first, allowing a survey team to screen up to six communities in one day,
and was adopted as the case-finding method for the trial survey.
10.2.3.5 Case-definitions Cases were defined as children aged under five years with < 70% of the weight-for-height
median of the NCHS reference population or bilateral pitting oedema. This was also the
entry criteria used for the therapeutic feeding programme. Receipt of treatment was
ascertained by the child's presence in a therapeutic feeding centre, confirmed by visiting the
centre at the end of the day, or by documentary evidence (i.e. possession of a programme
card or identity bracelet).
The surveys used two different definitions of coverage. The first definition was used to
provide an estimation of coverage for the recent period preceding the survey (period
estimate, see formula 1, Figure 21). This definition is equivalent to that traditionally used by
agencies such as WHO and MSF (37) to estimate coverage in centre based programmes and
to that used in coverage standards laid out by the Sphere Project (72). It included all those
cases that were malnourished at the time of the survey and in addition, it included all
children registered in a therapeutic feeding programme. This definition therefore included
children registered in the programme who were no longer severely malnourished but had not

yet attained the treatment programme discharge criteria. In this definition cases were defined
as children aged under five years with ≤ 70% of the weight-for-height median of the NCHS
reference population or bilateral pitting oedema plus any children registered in a therapeutic
feeding programme.
The second definition was used to provide an estimation of coverage at the exact point in
time of the survey (point estimate, see formula 2, Figure 21). This definition included only
cases that were malnourished at the time of the survey. Cases were defined as children aged
under five years with ≤ 70% of the weight-for-height median of the NCHS reference
population or bilateral pitting oedema.
1. Period coverage is calculated using the following formula: number attending the feeding programme ____________________________________________________X 100 number of cases not attending the feeding programme + number attending the feeding programme 2. Point coverage is calculated using the following formula: number of cases attending the feeding programme _______________________________________________X 100 total number of cases
Figure 21: Formulas 1 and 2 for calculating period and point coverage
10.2.3.6 Programme Coverage Coverage in each quadrat was estimated in two ways, a period estimate that used the first
definition of coverage and a point estimate that used the second definition. For each
estimate, coverage was calculated as the ratio of cases receiving treatment found in the
sample to the total number of cases found in the sample. Overall coverage was estimated by
treating each quadrat as a stratum in a stratified sample (183) with sample weights derived
from the population of the communities sampled in each quadrat.
10.2.3.7 Data handling Data were entered, checked, cleaned and analysed using Excel (146). An excel based CSAS
coverage calculator was developed by a consultant epidemiologist employed to support the
development of the methodologies used for these surveys. It was this calculator that was
146

147
used by the author to perform the stratified analysis for calculation of the overall coverage
estimates (weighted by population), the coverage in each quadrat and to present the spatial
distribution of coverage with histograms and mesh maps (184). The mesh maps were then
exported by the author in to the programme Microsoft ‘Paint’ for further revision (185).
10.2.4 Results The survey method proved relatively simple to implement and data collection took three
survey teams ten days to complete in each District. An example of data collected from the
Mchinji survey are shown in Table 24.
10.2.4.1 Period estimation of coverage Overall the period coverage was 24.6% (95% C.I. 17.8%, 31.4%) in Mchinji and 73.6%
(95% C.I. 66.0%, 81.3%) in Dowa. The distribution of per-quadrat coverage for each
District is shown in Figure 22 and Figure 23. Coverage ranged between zero (in five
quadrats) and fifty percent (in two quadrats) in Mchinji and between zero (in one quadrat)
and one hundred percent (in ten quadrats) in Dowa.
10.2.4.2 Point estimation of coverage Overall the point coverage was 20.0% (95% C.I. 13.8%, 26.3%) in Mchinji and 59.9% (95%
C.I. 51.4%, 68.5%) in Dowa. Coverage ranged between zero (in nine quadrats) and fifty
percent (in one quadrat) in Mchinji and between zero (in four quadrats) and one hundred
percent (in ten quadrats) in Dowa.
10.2.4.3 Patterns of coverage The spatial distribution of per-quadrat period coverage for each District is shown in Figure
24 and Figure 25. Full grey squares represent 100% coverage, whilst an empty, white square
represents 0% coverage. The approximate locations of the nutritional rehabilitation units in
each District are marked and thin black lines indicate the approximate location of major
roads. The spatial distribution of per-quadrat point coverage for each District is very similar
to that shown for the period coverage in Figure 24 and Figure 25 and therefore is not
presented here. Both period and point coverage appeared more uniform in Dowa than in
Mchinji. In Mchinji, five quadrats (13%) had zero period coverage and only two quadrats
(7%) met the Sphere coverage standard. In Dowa, period coverage met the Sphere Project
standard in twenty-seven out of thirty (90%) quadrats and in only one quadrat (3%) was it

zero. In Mchinji, nine quadrats (30%) had zero point coverage and in only one quadrat (3%)
was coverage > 50%. In Dowa, point coverage was > 50% in twenty-one out of thirty (70%)
quadrats and in only four quadrats (13%) was it zero.
Table 24: Data from the Mchinji survey
Quadrat*
x y
CommunitiesVisited
Population < 5 years
Children Screened
Cases Found
Cases Covered
Point Cover (%)
3 7 6 433 55 7 2 28.6% 4 5 5 362 46 4 0 0.0% 4 6 5 233 43 4 1 25.0% 4 7 6 346 53 3 1 33.3% 4 8 5 186 53 3 1 33.3% 4 9 4 246 39 5 1 20.0% 5 3 5 256 36 3 0 0.0% 5 4 6 270 53 2 0 0.0% 5 5 5 175 52 3 0 0.0% 5 6 3 138 37 3 1 0.0% 5 7 5 268 48 5 2 40.0% 5 8 6 301 57 2 0 0.0% 5 9 4 274 36 4 1 25.0% 5 10 6 351 52 5 0 0.0% 6 4 5 358 51 5 2 0.0% 6 5 3 391 29 8 1 12.5% 6 6 4 276 35 6 0 0.0% 6 7 6 366 49 6 1 16.7% 6 8 4 189 38 3 1 33.3% 6 9 5 385 51 5 1 20.0% 6 10 5 173 46 6 2 33.3% 7 4 6 237 53 5 1 20.0% 7 5 5 227 48 3 1 33.3% 7 6 5 262 47 4 0 0.0% 7 7 5 287 48 6 3 50.0% 7 8 6 268 55 4 0 0.0% 8 3 6 380 50 8 2 25.0% 8 4 6 345 57 5 2 40.0% 8 6 3 345 37 6 1 16.7% 8 7 6 231 49 3 1 33.3%
* Specified as west to east (x) and south to north (y) co-ordinates in the sampling grid
148

Figure 22: Distribution of per-quadrat period coverage in the therapeutic feeding
centre (TFC) programme in Mchinji
Figure 23 : Distribution of per-quadrat period coverage in the community-based
therapeutic care (CTC) programme in Dowa
149

Figure 24: Spatial distribution of per-quadrat period coverage in the therapeutic
feeding centre (TFC) programme in Mchinji
150

Figure 25: Spatial distribution of per-quadrat period coverage in the community-based
therapeutic care (CTC) programme in Dowa
10.2.5 Discussion
10.2.5.1 Appropriateness of the survey methodology
151
Centric systematic area sampling is widely used in ecology to ascertain the spatial
distribution of abundance of plant and animal species over wide areas, and in human
geography to investigate point phenomena such as the distribution of specific types of retail
businesses (182;186). Its principal advantages are reported to be simplicity of use in the
field, the ability to sample evenly across a wide area, simplicity of data handling (183), and
the addition of a spatial dimension to survey data (182). In practice, the method proved
simple to use in the field although this may not be the case if useful maps are not available.
Even spatial sampling is virtually guaranteed by the use of a sampling grid and is only likely
to be compromised when, for example, poor security prevents some quadrats from being
sampled. The terrain of the trial survey location made it feasible to define quadrats by
overlaying a simple grid onto a map of the programme area. More difficult terrains (for
example programme areas divided by impassable rivers, gorges, or front-lines) may require
more imaginative quadrat location strategies.

152
Entry and management of data was considerably quicker than for a two-stage cluster
sampled survey since data analysis procedures require only summary data for each quadrat.
Data handling procedures are simple enough to be performed using a spreadsheet package,
such as excel, although charting the spatial distribution of per-quadrat coverage is likely to
require more versatile charting functions than are available in such packages; ‘Paint’ was
used for the mesh maps produced here. The use of case-finding, as opposed to probability
sampling, in the second stage provides a sample that is designed to be exhaustive. The case
finding approach is likely to identify all, or nearly all, cases in sampled communities. This
allows per-quadrat coverage to be calculated precisely and meaningful comparisons of per-
quadrat coverage to be made. The ability to calculate per-quadrat coverage allows a spatial
assessment of coverage, providing information useful for programme management: In
Mchinji District for example, the survey results would cause action to be taken to address
the zero coverage in the south-west corner of the programme area. In different contexts it
may be necessary to develop and test case-finding procedures in order to ensure exhaustive
within-community samples.
The method may prove to be less useful for estimating the coverage of less restrictive
programmes (for example supplementary feeding programmes) where case-finding
procedures may provide a less exhaustive sample than proved possible in the trial survey.
This may be addressed by estimating the exhaustiveness of case-finding procedures using
capture-recapture methods and using this estimate to correct for under-reporting (187).
Estimating the exhaustiveness of the case-finding procedure would also enable the method
to yield estimates of both prevalence and coverage from a single survey. The trial survey
estimated the prevalence of severe acute malnutrition as 1.6% in Mchinji District and 0.8%
in Dowa District, calculated as the ratio of the number of cases found in the sample to the
total population under five years in the sampled communities and assuming a completely
exhaustive case-finding procedure. This estimate is broadly in line with that reported by
nutrition surveys of the same populations implemented around the same time as this study
(180;181).

153
There are potential problems with the proposed survey method. The centric systematic area
sampling method, like any systematic sampling method, can produce biased estimates if
there is periodic geographic variation in coverage and the sampling locations tend to
coincide with this. This is difficult to control against without prior knowledge of the periodic
variation although simple checks, such as ensuring that sampling locations are not (for
example) all in valleys or all on hilltops and adjusting the grid position accordingly, should
help to minimise this problem. The trial survey used a proximity method to select the
centrally located communities to be sampled in each quadrat. A more rigorous sampling
procedure such as selecting communities at random in each quadrat or using a finer grid and
selecting a single central community from each quadrat could be adopted but this would
increase the cost of surveys and is likely to yield little increase in the accuracy (183). The
proposed survey method assumes homogeneity of coverage within quadrats. The area of
each quadrat is, however, considerably smaller than the programme area (approximately
one-thirtieth of the programme area in the case of the trial surveys) making this assumption
more plausible than that of homogeneity over an entire programme area that often underlies
EPI-derived methods. Census population estimates were used to derive sample weights. It
has already been noted that census data may be unreliable in some emergency contexts. The
method is, however, likely to be robust to such unreliability and, when accurate population
estimates are not available, data may be analysed as arising from a simple random sample
[21] i.e. there is no need to weight by population.
An advantage of the proposed method is that it is likely to sample considerably more
communities than would usually be sampled in an EPI-derived survey. The trial survey
sampled 151 communities compared to the maximum of 30 communities usually sampled in
EPI-derived surveys. It should be noted that the PPS procedure often causes more than one
cluster to be sampled from larger communities causing many EPI-derived surveys to sample
fewer than the maximum 30 communities. Table 25 compares the results of the trial survey
in Mchinji with the results of a survey of Mchinji district using an EPI-derived method
undertaken in December 2002 (181). The trial survey method screened more children from
more communities and found more cases than the EPI-derived method, resulting in a more
precise estimate of programme coverage. The trial method was able to identify areas of low

or zero coverage whereas the EPI-derived method was limited to providing a single district-
wide estimate.
Table 25 : Methods, sample sizes, and results for two different surveys
EPI-derived survey Trial survey Design Cluster Stratified
First-stage sampling PPS Centric systematic area Second stage sampling Proximity Exhaustive (case-finding) Communities sampled 30 151
Children screened 1025 1403Staff required (person-days)* 81 123
Cases found 10 136Cases covered 1 29
Cover (%) 10.0% 20.0%95% confidence interval 0.2%, 44.5% 13.8%, 26.3%
Prevalence (%) 0.98% 1.59%95% confidence interval 0.47%, 1.79% NA
*Includes training, supervision, survey days, data-entry, and data analysis but excludes testing and evaluation
of case-finding methods for the trial survey
The trial survey took longer to complete than the EPI-derived survey. This is because one
survey team took one day to sample one quadrat whereas a survey team can usually sample
two clusters per day in an EPI-derived survey. The proposed survey method could, however,
be as efficient as EPI-derived methods in higher prevalence situations and in less compact
survey areas. Importantly, active case-finding is central to both successful programme
implementation and the proposed survey method. This means that the estimate of coverage
could be integrated with programme outreach, although this would need to be confirmed by
more operational research. This would allow continued estimation of coverage and
prevalence as part of routine programme activity, removing the need for expensive and
repeated cross-sectional surveys.
This new survey method addressed many of the shortcomings of EPI-derived methods as
applied to the problem of estimating coverage in selective feeding programmes. Particularly,
it allows identification of areas with poor coverage within a programme area. The results
indicate that the method should be used, in preference to EPI-derived survey methods, for
estimating the coverage of selective feeding programmes. It should also be considered when
154
155
evaluating the coverage of other selective entry programmes or when coverage is likely to
be spatially inhomogeneous.
10.2.5.2 Coverage of the TFC and the CTC programme Using both the period and point definitions of coverage, the coverage of the CTC
programme in Dowa was substantially higher than that found in the TFC programme in
Mchinji. Period coverage, the measure that is comparable with existing international
measures of coverage, in Dowa falls well within the Sphere standard of > 50% for rural
areas. In Mchinji however the period coverage does not meet this standard.
Both period and point coverage were also more homogenous in Dowa than in Mchinji. In
Mchinji for example, there was great variation in the coverage rates with 4 quadrats (13%)
having zero period coverage and only 2 quadrats (7%) meeting the Sphere coverage standard
of > 50%. By contrast, in Dowa, there was less variation in coverage rates across the district.
Here, programme period coverage meets the Sphere Project standard of > 50% in 27 out of
30 (90%) quadrats and in only one quadrat (3%) is it zero. In Mchinji, coverage is highest
around the NRUs and follows the main routes of communication. In Dowa, where coverage
is much higher, service delivery was far more decentralised, the distances that people had to
travel to attend treatment centres were much lower and the length of stay in inpatient care
much shorter. This suggests that the ease of geographic accessibility to treatment and the
lower opportunity cost that this implies for the carer is a major determinant of programme
coverage and hence impact of this CTC programme.
It is important to note however, that the active case finding and referral employed by the
CTC programme in Dowa, through MoH HSAs, is likely to have been an additional
important factor affecting coverage of this programme compared to the centre-based
programme in Mchinji that did not use active case finding in this way.
However, despite the active case finding and the higher level of support and inputs given to
the CTC programme (shown in Table 23), figure 25 above does show that there were other
important factors that are very likely to have influenced the coverage of the CTC
programme. These factors; including easier geographic access and lower opportunity costs

156
attached to treatment as a result of shorter distances to travel and less time spent away from
home; could not have been addressed in the TFC programme with the addition of case
finding and more resources and it is likely therefore that the improved geographic access to
services and the reduced opportunity cost to carers and not the level of resourcing, was an
important determinant of both higher coverage and a more equitable spread of coverage
through the district. Putting additional resources into the set up of new NRUs across Mchinji
and in to active case finding might have served to increase geographic accessibility to
services and increase the number of referrals made to TFCs, but would not have reduced the
opportunity cost associated with inpatient care and the barriers to seeking and complying
with treatment that this presents to the families of malnourished children.

157
11 Going to Scale with CTC
11.1 Introduction The results of studies one to four helped to define certain conditions in which the
outpatient treatment of SAM could be both clinically effective and achieve high
coverage of a target population. They showed that decentralisation of treatment, and
understanding and participation of beneficiary communities were vital to encourage early
presentation of children suffering from SAM and for achieving high coverage of a target
population. They also helped to define, in the particular circumstances in which the
studies occurred, the clinical profile of a child suffering from SAM with no
complications that could be safely treated in outpatient care alone with no increased risk
of mortality
The original intention of this thesis was to use the initial research projects in Ethiopia
and Malawi to define parameters for a final randomised controlled trial that compared
outcomes of an inpatient-based (or TFC) programme and a CTC programme. However,
as the CTC research project in Malawi developed (Study 3) it became clear that a
randomised controlled study design to compare TFC and CTC programmes would be
difficult to implement. Participants in the CTC programme in Malawi had voiced a
strong preference for outpatient care and the common societal value, that to be fair each
member should receive similar treatment (known locally as communitarianism but
common across sub Saharan Africa) would have made any randomization difficult (132).
This, together with papers from authors such as Habicht and Victora that have
questioned the value of RCTs in evidence-based public health (143) and developed
frameworks within which non randomised, adequacy trials could be reported with rigour
(188), allowed the author and colleagues to take the decision against an RCT. Instead, it
was necessary to demonstrate adequate outcomes of CTC programmes within many
different populations and epidemiological contexts. The ‘research and development’
phase of CTC therefore continued with 17 programmes implemented subsequent to the
Malawi Dowa programme presented above. These programmes used a very similar
treatment model to that used in Dowa (with slight variations according to national
protocols) and all were monitored closely by the Valid International CTC research and
158
development team which included the author. The monitoring data for these programmes
were collected and compiled by the author and are presented here.
11.2 Study 5, Monitoring CTC 2003-2005: a multi-country evaluation
See Appendix 1, section 14.1.6 for paper (189)
11.2.1 Introduction to each programme site This section provides a brief background explaining the need for a programme that
treated SAM, and the epidemiological, population and geographic profile for each of the
programme areas for which data is presented.
11.2.1.1 Malawi, Dowa District Section 9.4.3.1 above presents an introduction to this programme and section 9.4.5
detailed data analysis from the first year and a half of implementation (August 2002 –
December 2003). The research programme went on to run until July 2005 and the data
for this latter phase of the programme are included in Table 27.
11.2.1.2 Malawi, Nkhotakota District Nkhotakota district is in the central region of Malawi and is similar in environment and
epidemiological profile to Dowa. It has an area of 7,500 km2 of which half is covered by
Lake Malawi and the remainder lies at between 50 and 1000 metres above sea level. The
District’s population is around 230,000 of whom the majority live in a predominantly
rural locality and rely mainly on subsistence agriculture to survive. It is bordered in the
east with Lake Malawi and therefore fishing also forms an important source of food and
income. Population density is thought to be around 114 persons per km2. Like Dowa,
most of the District is fairly accessible, especially outside the rainy season. As in Dowa,
Concern Worldwide started working in the District in 2002 in response to the national
nutritional emergency. The CTC intervention for the treatment of children suffering from
SAM started in July 2003.
11.2.1.3 Ethiopia, Dessie Zuria and Kalu Districts, South Wollo Zone South Wollo Zone is in Amhara Region in the Northern Highlands of Ethiopia. The vast
majority of the 450,000 people that live across the two districts are subsistence farmers
and live in rural villages. The population density in the area is 183 people per km2. The
region is extremely mountainous; the altitude ranges from 1,700 to 3,807 metres above
sea level. The infrastructure is poor: there are some roads but most of these require a

159
four-wheel drive vehicle. Many villages can only be reached on foot or by mule (up to 6
hours walk from the closest road).
In December 2002, nutrition surveys carried out by Concern Worldwide, in collaboration
with Amhara Region Disasters, Preparedness and Prevention Bureau (DPPB), reported
global acute malnutrition levels of 17.2% and 3.1% severe acute malnutrition across both
districts. At the same time a multi agency crop assessment reported the harvest to be
25% below normal and identified half of the population to be in need of food aid. In
response to these findings, the CTC programme started at the beginning of 2003.
11.2.1.4 Ethiopia, Damot Weyde District, Wolayita Zone Wolayita is situated in the north-eastern corner of the North Omo Zone of the Southern
Nations, Nationalities and Peoples’ Region (SNNPR). It is 385 kilometres south of
Addis Ababa and, due to the relatively high population density of between 125-742
people per km2 pressures on land and the consequent agricultural practices make the area
unique in Ethiopia. The population of the District is estimated at 170,114 people
(Concern census, 2001) of which circa 90% are subsistence farmers. The area is
characterised by a rugged, mountainous topography together with large plains, valleys
and gorges. The altitude ranges from 1,250 to 1,800 metres above sea level. The soil in
the area is dominantly sandy loam with poor fertility and dramatic soil erosion is a
prominent feature.
Damot Weyde has suffered a history of drought: most famously in 1984 and then again
from 1997 to 2000 and 2002 to 2004. In this period the people of Damot Weyde have
faced repeated and significant harvest losses. Due to small land holdings, poor soil
fertility, low productivity and erratic rainfall, the area consistently fails to meet food
needs. Concern started a CTC intervention in April 2003 in response to increasing levels
of GAM and SAM and deteriorating food security.
11.2.1.5 Ethiopia, Awassa Zuria District, Sidama Zone Sidama zone, located in SNNPR in the southern part of Ethiopia, was also affected by
the severe drought between 2002 and 2004. The area has a similar demographic and
geographic profile to Wolayita and suffers the same population pressure. A SC US CTC

160
intervention started here in 2003 in response to increasing levels of acute malnutrition
and rapidly deteriorating food security.
11.2.1.6 South Sudan, Aweil North/West counties, Bahr el Ghazal Region (BEG) Northern Bahr el Ghazal is one of the most food insecure regions in southern Sudan. It is
inhabited mainly by the Dinka people, who make their living through subsistence
farming and nomadic cattle herding. High population density forces people to farm the
same small plots of land over and over again, exhausting the soil and producing yields
that provide food for just a few months of each year. The rural economy was destroyed
during the long civil war, and agricultural practices are very rudimentary. Lack of access
to clean water and the nearly total absence of primary healthcare aggravate a very fragile
food security situation. Year after year, disease-induced malnutrition rates in northern
Bahr el Ghazal are among the worst in south Sudan: rates of acute malnutrition of >20%
are chronic in the region between May and August. The area is very remote and the few
roads into the area are cut off during the rainy season. This results in very little trade to
complement people's diets. In response to these high levels of acute malnutrition and
ongoing poor food security Concern and Tearfund, with Valid International, started CTC
here in mid-2003.
11.2.1.7 North Sudan, Darfur Region Darfur Region is 1000 km to the west of Khartoum and one of the most food insecure
regions in Sudan. It is an area the size of France but inhabited by only 6 million people,
divided into three federal states; north Darfur, west Darfur and south Darfur. The
population comprises nomadic tribes, mainly Arab and Zaghawa, and farming tribes,
mainly Fur. Much of the region is characterised by low hills of sandy soils, known as
goz, sandstone hills and desert. The area has a long history of severe food shortages
caused by rainfall shortage and political and economic marginalisation by the federal
government. Access to health care in the Region is extremely limited. In 2003, in
response to increasing levels of acute malnutrition and a poor food security outlook
Concern, Goal and Caritas, in partnership with Valid International, set up CTC
programmes in targeted locations in the northern and western States.

Figure 26: An outpatient therapeutic programme site in Darfur
11.2.1.8 Niger, Maradi Niger is ranked last on the United Nations Development Programme Human
Development Index (159). Life expectancy at birth is 44.3 years and 54 percent are
without access to a clean water source. The majority of the population is engaged in
subsistence farming, which is vulnerable to drought, desertification and locust
infestations, whilst a smaller proportion, coming mainly from the Tuareg and Fulani
tribes, are nomadic. In 2005, Niger experienced the second worst food crisis in its
modern history, and a third of the population was threatened by famine. Poor harvests in
2004 due to insufficient rain and locust infestations meant that most households ran out
of supplies. Although food was available, prices more than doubled, putting it out of
reach of the majority of the population (190). The epicenter of this crisis was Maradi
region, where MSF with support from Valid International set up a large CTC programme
in 2005.
161

162
11.2.2 Methods
11.2.2.1 Programme methods Describing each of the 17 programmes and their protocols in detail goes beyond the
scope of this thesis. Therefore, I have summarised the main differences between the
protocol used in each programme and that used in the Malawi CTC programme (section
9.4.4.1) in Table 26.

163
Table 26: Description of basic protocols for each CTC programme examined in study 5 relative to those used in Dowa, Malawi (Study 3)
Dowa, MalawiNkhotakota Malawi South Wollo Ethiopia
Wolayita Ethiopia Sidama Ethiopia
Community mobilisation & referral
Paid outreach by MoH and NGO community agents followed by series of meetings with key community leaders and community health workers to encourage their long term involvment (unpaid) in screening and referral
same as Dowa
as Dowa + use of regular FGDs in the community to monitor reasons for non attendance. Soap given as 'compensation' for those referred to programme sites by CHW but not admitted
same as S Wollo
Community leaders and community health and nutrition workers (unpaid)
Screening criteria MUAC < 13cm and/or visible signs of SAM same as Dowa same as Dowa same as
Dowa same as Dowa
Admission and discharge criteria
Admission : WFH < 70% of the median and/or pitting oedema and/or MUAC < 11cm (if height > 75cm or age > 1 year) and/or (age >6 months & weight <4kg) Discharge: WFH >= 85% of the median and no oedema and MUAC > 11cm and no serious illness for 2 visits
same as Dowa
as dowa apart from admission criteria did not include > 6 mths < 4kg and where SFP present discharge criteria WFH > 80% of the median
same as S Wollo same as S Wollo
Referral to inpatient care*
Age < 6 months; oedema ++ or +++; anorexic; temp >= 390c or <= 350c; resp rate outside normal range; severe dehydration; severe anaemia; serious superficial infection; general signs of serious illness
same as Dowa
Criteria for referral as Dowa apart from: oedema +++ (NOT ++)
same as S Wollo same as Dowa
Nutritional treatment in inpatient care
Phase 1: formula 75 at 100 kcal kg-1 day-1 by 8 feeds per day; cautious introduction of RUTF
same as Dowa same as Dowa same as
Dowa same as Dowa
Nutritional treatment in outpatient care
RUTF at 175-200 kcal kg-1 day-1 and 3.75kg of blended flour fortnightly
same as Dowa same as Dowa same as
Dowa same as Dowa
Medical treatmentαFor all children: Vitamin A; folic acid; fansidar; amoxycillin; albendazole. Further medical treatment prescribed according to symptoms
same as Dowa same as Dowa same as
Dowa same as Dowa
Followup in the OTP Weekly medical and nutritional assessment same as Dowa same as Dowa same as
Dowa same as Dowa
Followup at homeβHome visit by community health worker arranged if child defaulted from treatment or if child not recovering as expected. Support given adhoc
same as Dowa
as Dowa + some home visit support provided by mothers of recovered children to other mothers with children in the programme. Visits were more structured than Dowa, with community health workers using checklists of issues to observe including appetite and signs of infection.
same as S Wollo same as S Wollo

Table 26 contd.
Hararge Ethiopia BEG South SudanW Darfur North Sudan N Darfur North Sudan Awassa Ethiopia Maradi Niger
Community mobilisation & referral
Community leaders and community health and nutrition workers (unpaid)
community health and nutrition workers (unpaid)
community health and nutrition workers (unpaid)
community health and nutrition workers (paid phased in to unpaid)
community health and nutrition workers (unpaid)
Outreach by MoH community agents and community health workers: small paid incentive provided
Screening criteria same as Dowa same as Dowa same as Dowa same as Dowa same as DowaMUAC < 12.5cm and/or visible signs of SAM
Admission and discharge criteria
as S Wollo apart from admission/discharge criteria did not include MUAC
same as S Wollo same as S Wollo
as S Wollo apart from discharge criteria included MUAC > 12cm
as S Wollo + 2nd twin and MUAC < 11cm for age > 11 months
as Dowa apart from admission criteria did not include > 6 mths < 4kg
Referral to inpatient care* same as S Wollo same as S Wollo same as S Wollo same as S Wollo same as S Wollo same as S Wollo
Nutritional treatment in inpatient care same as Dowa asDowa apart from
6 feeds per day
as Dowa apart from 6 feeds per day
as Dowa apart from 6 feeds per day same as Dowa same as Dowa
Nutritional treatment in outpatient care same as Dowa
as Dowa apart from 4kg blended flour fortnightly
as BEG
as BEG apart from no blended flour given as family ration for first phase of programme
same as Dowaas Dowa apart from 3.3 kg blended flour fortnightly
Medical treatmentα same as Dowa same as Dowa same as Dowa same as Dowa same as Dowa same as Dowa
Followup in the OTP same as Dowa same as Dowa same as Dowa same as Dowa same as Dowa same as Dowa
Followup at homeβ same as Dowa same as Dowa same as Dowa same as Dowa same as Dowa
Consistent followup of defaulters by community agents and health workers.
164

Notes on table:
WFH = weight for height; Nkk = Nkhotakota
* see table 8 for detailed description of clinical signs
α see appendix 8 section 14.8 for a detailed description of the medical protocol
β See appendix 9 section 14.9 for a detailed description of the action protocol for home visits
165
166
11.2.2.2 Research methods
11.2.2.2.1 Subjects Outcomes are presented from all children admitted to the CTC programmes listed in
Table 26 between the dates specified. There were no exclusions.
11.2.2.2.2 Data Collection These data were collected as part of routine programme monitoring. Outcome data i.e.
numbers of children recovered, died, defaulted, transferred and non-recovered were
recorded on reports as described in section 8.4.3.2 and appendix 4, section 14.4. All
programmes maintained a database similar to that shown in appendix 5, section 14.5
from which the outcome data presented in Table 27 were extracted.
All available mid term and final programme evaluation narrative reports were reviewed.
Any important lessons learnt, particularly in relation to maximizing demand and
minimizing barriers to accessing treatment were recorded and are referred to below in the
discussion.
11.2.2.2.3 Data coding Outcome data were coded as either ‘recovered’, ‘died’, ‘default’, transfer or ‘non
responder’. Definitions of ‘recovered’ for each programme are listed in Table 26. For
most programmes this was defined as discharged from the OTP after field staff assessed
that the patient had fulfilled the following criteria for 2 consecutive weeks:
− a weight-for-height of more than or equal to 85% of the median NCHS reference;
− and a MUAC of > 11cm (children > 75cm);
− and absence of bilateral pitting oedema;
− and free from serious infective illness.
In all programmes, patients who failed to attend the OTP on two consecutive weeks were
recorded as a defaulter. Where ever possible, defaulters were followed up at home,
although these follow up data was not available for this thesis.
Any child that was transferred out of the programme to another medical facility was
coded as a transfer and any child that had not been discharged recovered by 120 days
was coded as a ‘non responder.

167
11.2.3 Results Table 27 : Outcomes from children presenting to CTC programmes between Feb. 03 and Dec. 05 (N = 20,418)
Country Figures for Period
No. SAM treated (OTP + SC)*
Direct OTP Admissions
Coverage ^
Recovery Default Death Transfer** Non-responder┼
Comment^^ Rate wt gain g/kg/d
LOS***
Malawi - Dowa+ Jan 04 - Dec 04 1,553 45% 72% ^ 72.4 16.2 7.2 4.1 0.2 5.7Malawi - Dowa Jan 05 - Jul 05 1
46,696 63% - 80.5 12.5 4.2 2.7 0.1 5.8
Malawi - Nkhotakota July 03 - Nov 03 105 27% - 58.9 27.8 10.0 3.3Malawi - Nkhotakota Mar 04 - Dec 04 501 55% - 61.9 23.2 8.9 1.4 4.6Malawi - Nkhotakota Jan 05 - Jul 05 1
45
,021 70% - 76.7 16.3 6.0 0.9 -Ethiopia - South Wollo Feb 03 - Dec 03 590 95% 78% ^ 74.6 9.7 7.5 - 8.3 4.5 (M)/4.0 (K)Ethiopia - South Wollo Jan 04 - Dec 04 1
80,359 92% - 82.7 4.2 4.9 - 8.2 3 8
Ethiopia - South Wollo Jan 05 - May 05 856 96% 77%^ 83.4 6.0 4.6 - 5.6 3.2Ethiopia - Wolayita Apr 03 - Dec 03 194 24% - 69.6 5.2 7.3 10.5 - 4 registered on closureEthiopia - Wolayita **** Jan 04 - Dec 04 460 91% - 83.9 5.4 1.9 8.9 - no SC data availableEthiopia - Wolayita Jan 05 - Jun 05 245 100% - 92.9 5.6 1.6 - -Ethiopia - Sidama Sept 03 - Aug 04 1
285
,497 85% 78% ^ 84.8 5.9 1.2 2.9 5.2 6.8 (M)/5.5 (K) 45 (M), 41 (K)Ethiopia – Hararge Apr 03 - Jan 04 232 99% 81% ^ 85.8 6.0 4.9 3.3 - 49 registered on closureSouth Sudan - BEG Jun 03 - Jan 04 610 92% - 73.4 17.3 1.4 4.2 3.7 39 registered on closureSouth Sudan - BEG Apr 04 - Dec 04 439 80% 82% ^ 76.8 8.7 4.8 3.0 6.7South Sudan - BEG Jan 05 - Jun 05 387 88% - 61.5 14.5 2.5 4.5 16.5South Sudan - BEG (2) Jul 03 - Nov 03 696 71% - 81.8 15.4 1.4 1.4 - 58 registered on closureEthiopia - Hararge Mar 04 - Oct 04 1,086 89% 56% ^ 76.0 18.0 2.0 3.7 0.4 241 registered on handover 6.6 (M)/4 (K) 44 (M), 38Ethiopia - Harage (2) Mar 04 - Oct 04 381 93% 56% ^ 69.5 24.3 2.4 3.7 - 7 registered on handover 6.0 (M)/2.0 (K) 60 (M), 44Ethiopia - W.Hararge Feb 04 - Oct 04 1
(K) (K)
,377 71% 61% ^ 88.0 6.8 3.4 1.1 -Ethiopia - Wolayita (2) Feb 04 - Oct 04 539 no data - 90.4 2.4 1.4 3.4 2.4North Sudan - West Darfur Aug 04 - Jul 05 1,684 97% 75% ^ 80.0 13.9 1.4 5.0 -North Sudan - West Darfur (2) Sept 04 - May 05 115 86% - 58.6 36.2 3.4 - 1.4North Sudan - North Darfur Dec 04 - Sept 05 172 90% - 65.7 12.9 7.9 - 13.6Ethiopia - Awassa Jun 05 - Oct 05 353 92% - 95.0 3.9 1.1 0.0 0.0Niger - Maradi Aug 05 - Dec 05 2,270 96% - 87.7 4.3 2.6 4.6 0.4Total 20,418 74% 80.3% 10.8% 3.6% 2.9% 2.4%
Outcomes: outpatient & inpatient treatment bi d
Adapted from Key Issues in the Success of Community-based Management of Severe Malnutrition. Collins S. Sadler K. et al (189)

Notes on Table:
(2) indicates a second programme running concurrently in the same area.
* For ongoing programmes total treated includes children still registered in the programme and for closed programmes those still registered
on closure. For programmes that run up to year end and continue in January the following year the total does not include children registered
in programme at the end of the year as they are included in the next year data.
** This represents transfers out of the programme, to another agency TFC or a hospital, for which no final outcome was available.
*** LOS: length of stay
**** No SC data available - therefore transfer percentage includes those transferred to SC
^^ Children still registered on programme closure are not included in the outcome calculations
^ calculated using centric systematic sampling design and ‘optimally biased sampling’ and using a recent period coverage calculation (see
below)
+ Initially the Dowa programme in Malawi had to follow the Malawi national protocols that stipulated inpatient care for all severely
malnourished children. It was only when the inpatient centres became over-crowded the CTC programme started direct admissions into
OTP. Once direct admission into OTP was perceived by local people as successful restrictions on direct admission into OTP were relaxed.
168

169
The monitoring data presented in Table 27 include outcomes from 20,418 cases of severe
acute malnutrition treated in 17 CTC programmes implemented in Malawi, Ethiopia,
North & South Sudan and Niger between 2003 and 2005. Overall, these programmes
achieved an average (range) recovery rate of 80.3% (58.6-95.0), mortality rate of 3.6%
(1.1-10.0) and default rate of 10.8% (2.4-36.2). Transfer and non-recovery rates were
2.9% and 2.4% respectively. The proportion of severely malnourished children who
were treated solely as outpatients was 74%, ranging from 27% to 100% and programme
coverage, where it was measured, ranged between 56% and 82%. Rate of weight gain
ranged between 3.0-6.8 g kg-1 day-1 with an average of 4.8 kg-1 day-1 and length of stay
ranged between 38-85 days with an average of 55 days.
11.2.4 Discussion and lessons learnt
11.2.4.1 Overall clinical effectiveness Overall the recovery rate (80.3%) case fatality rate (3.6%) and default rate (10.8%)
exceed international standards for therapeutic care; in particular mortality rates are under
half the Sphere minimum standards (72). Mortality is also three to four times lower than
that presented in the large TFC study discussed in section 6.5.1 (78) and 4-5 times lower
than those often achieved by hospitals providing inpatient care to cases of SAM (87).
These data suggest that, overall, the approach is effective for populations that have both
a large proportion of oedematous malnutrition (as seen in Malawi, study 3) and of
wasting. Over 50% of admissions to programmes in Ethiopia, Niger and South and North
Sudan were wasted.
However, these were highly pragmatic studies for which recovery rates may be elevated
by the discharge criteria set at > 80% of the reference median (rather than > 85%) for
most studies. Also, the Prudhon adjusted mortality has not been calculated for these data
as it was for study 3. This limits analysis of any excess mortality risk that may have
occurred in the scale up of CTC programmes.
11.2.4.2 Direct outpatient care On average, the programmes presented in Table 26 treated 74% of cases directly in
outpatient care. These data strengthen the evidence presented in Study 3 that, with

170
appropriate triage criteria, children with uncomplicated SAM can be successfully treated
in outpatient care alone. In Dowa and Nkhotakota, a relatively small proportion of cases
of SAM (only 45% and 27% respectively), were admitted directly in to outpatient care.
This was due to the MoH being cautious with direct referral to the OTP at the beginning
of the programme and the inclusion of oedema +++ and ++ in the definition of
‘complicated malnutrition’. Subsequently, programmes used only oedema +++ in the
definition of ‘complicated malnutrition’, all other grades were found to respond well in
direct outpatient treatment as long as no other signs of complications were identified.
This helped programmes in countries like Ethiopia and Sudan, where access to inpatient
care was extremely limited, to achieve high coverage.
11.2.4.3 Coverage Coverage was not measured in all programmes due to resource constraints. Where it was
measured the average coverage in these programmes was 73%, substantially higher than
the 50% coverage standard for rural populations stipulated in the second edition of the
Sphere standards (191), and considerably higher than coverage rates reported for
humanitarian centre-based therapeutic feeding programmes (114;192). However, there
are a number of programmes, where coverage was not measured, that may not have
reached this standard (see discussion section 11.2.4.5 below).
11.2.4.4 Limitations There are a number of limitations to these data. The clinical outcome data are from day
to day programme monitoring and subject to all the errors discussed in section 8.4.2 and
more. As there was no analysis at the individual level there was no way to verify that all
children included in Table 27 were suffering from SAM according to definitions
presented in this thesis. It is likely that some were not. These data have not been verified
in the same way as the data in studies 1, 2 and 3 and are therefore likely to contain
recording error and misclassification. However, the training given to all implementing
staff and the supervision of each programme by the CTC research and development team
reduces the chance of any error being systematic. The author can not however rule out
the possibility of systematic error or measurement bias having occurred. The random
errors introduced to these data are unlikely to significantly alter the proportion of
children that died, recovered or defaulted in each programme.

171
Programme protocols were standardized across countries as far as possible. There are
some differences however. These arose from the need to adapt protocols according to the
country level (MoH or UN) protocols for the treatment of SAM that were in use at the
time. Data collected did not allow for any control of health, nutrition, environmental or
seasonal confounding factors that may have affected outcomes. All of these factors make
it impossible to directly compare outcomes from the different programmes and countries.
Although the mortality rate of every programme, apart from one in Nkhotakota Malawi,
falls within the international standard of < 10%, there is considerable variation in the
default rates and, as a result of this, recovery rates between programmes. Default follow
up data for all these programmes were not available for analysis for this thesis. It is not
possible therefore to say with certainty that mortality was not an important cause of
default, although there is some discussion of causes of default, gathered during
programme monitoring and evaluation activities, below. This may increase the rate of
mortality for those programmes that had high default rates. Coverage also varies
considerably between programmes and coverage data are available for only two of the
programmes with a high default rate (> 15%). It is these programmes (Ethiopia, Harage
and Harage 2) that show the lowest coverage (56%).
11.2.4.5 Increasing coverage and reducing default by maximising demand and acceptability
It is likely that programme coverage and default rates are often linked through the
concept of ‘acceptability’ i.e. the more acceptable a programme is to clients the more
likely they are to present for and comply with treatment until discharge (see Figure 27).
It is possible, due to this relationship, that the programmes with high default rates in
Table 27 will also have lower coverage than those with low default rates.

Figure 27: The relationship between coverage, default and acceptability.
Monitoring of these CTC programmes has confirmed that maximising both demand for
(through knowledge about the programme and perceived need for services) and
acceptability of CTC programmes (through minimising barriers to access) is vital to
maximize coverage and minimize default from treatment.
11.2.4.5.1 Maximising demand In several programmes the problem of primary caretakers not recognising SAM as
requiring treatment, delayed and/or prevented carers presenting with their sick children
at OTP sites. Low awareness among target communities about the existence or purpose
of a CTC programme was also a problem in some areas. This underlines the need for
CTC programmes to prioritise the use of activities like community sensitisation to
provide clear messages about the target population; using local disease nomenclature and
drawing attention to the visible characteristics of eligible children (swollen hands and
feet, ‘baggy trousers skin’, recent weight loss etc.). Community sensitization should also
define the nature of CTC services; the location of sites and admission procedures. Much
has been learnt during this research programme about appropriate channels for this
community sensitisation. Often these include the traditional authority networks and the
traditional health workers.
172

173
In Dowa, Malawi for example, programme monitoring showed that simply decentralising
treatment sites and reducing the opportunity costs to participating families of accessing
treatment was not enough to achieve high coverage. During the planning stages of the
CTC in Malawi, a poor understanding of the local ‘definitions’ of malnutrition,
insufficient communication with existing formal structures and the initial omission of
more informal or 'traditional' structures and community figures from programme
planning and sensitisation activities had a substantial impact on initial programme
coverage and uptake. The project's limited understanding of local understanding about
the causes and consequences of malnutrition and of the perceptions of the programme
delayed recognition of the communities' distrust of using unfamiliar ‘weight for height’
measurements to target assistance to a sub-group of children. This, coupled with an
initial failure to inform and involve 'traditional' structures, such as Traditional
Authorities (TAs) and Village Headmen, reduced initial attendance and programme
coverage during the first three months of implementation. In response to the slow uptake
of CTC services, investigation at community level has offered valuable insight into the
perceptions of the beneficiary communities regarding CTC, while simultaneously
highlighting some of these shortcomings. Changes in programme design and
prioritisation based on these findings, in particular the more active and positive
involvement of 'traditional' community structures in helping communities understand
how to recognise malnutrition, and the objectives and target groups for the CTC
programme, resulted in a rapid increase in the number of new cases of severe
malnutrition presenting for treatment (see Figure 28 below).

0
50
100
150
200
250
300
350
1 2 3 4 5 6 7 8 9 10 11 12 13 14 15distribution round (2 weekly)
num
bers
ADMISSIONS EXITS TOTAL IN PROGRAMME
measures to inform and mobilise population
70% coverage
Figure 28: Numbers of admissions and exits, OTP Dowa district, August to
December 2002.
11.2.4.5.2 Minimising barriers to access
Distance and physical barriers
Although decentralisation is a vital component of CTC programmes to improve access,
the choice of location of decentralised sites has been important. Some CTC programmes
used sites that were easiest for health staff to access (i.e. near major towns and roads)
rather than developing a spread of sites that maximised access for the largest number of
beneficiaries. For example, CTC programmes serving local and Internally Displaced
Persons (IDPs) populations in South Darfur encountered significant problems when local
health structures were selected as distribution points as they were not equally accessible
for both groups. This is likely to have reduced coverage and been a contributing factor to
default.
Choosing treatment sites that are accessible for nomadic populations presents a particular
challenge, and although some success has been achieved by choosing sites without
174

175
physical infrastructure but with a strong socio-economic tradition (for example sites
traditionally used for food distribution during food insecurity), this remains a difficulty
for many programmes. This was highlighted as one of the causes of the relatively high
default rates in the South and North Sudan programmes.
Topography has also been an important consideration. The CTC programme in Bahr-El-
Ghazal, South Sudan, had to consider the boat-owner fees for crossing the multiple rivers
that lay between potential beneficiaries and treatment sites. Dialogue with community
leaders and arrangements with local boat owners to provide services free of charge
during distribution days helped to overcome this challenge.
Time spent away from home
The anthropological work in Dowa, Malawi (166) identified many reasons, related to
reducing the time they spent away from their home and families, why carers preferred
that their children received treatment in outpatient rather then inpatient care (see Error!
Reference source not found.). These issues were important among target populations in
all the programmes described here.
Poor perceived quality
An important factor in determining programme uptake for many programmes has been
the initial experience of the caretakers during screening, either on site or by outreach
workers in the community. In all supplementary and therapeutic feeding programmes,
whether outpatient or inpatient, there has been a lack of technical coherence between
diagnostic indicators for referral and for admission. Referrals have traditionally been
made with an adequately sensitive MUAC threshold for screening (i.e. a MUAC
threshold of 13 or 12.5 cm that is likely to identify all or almost all persons meeting
WFH-based admission criteria for SFP or TFP) or from growth monitoring programmes
based on a weight-for-age indicator. Many of the CTC programmes listed in Table 26
used these screening criteria and this resulted in many patients being referred for care
who were then refused treatment because they did not meet the WFH admission criteria.
As a result mothers with children suffering from SAM have reported not returning for
subsequent screening, even when their child’s condition had deteriorated or they had
been referred again.

Figure 29: Two stage screening using MUAC, oedema and weight for height
The impact of ‘negative feedback’ on programme coverage is considerable. Data
provided by coverage surveys suggests that negative feedback is an important factor
limiting programme uptake. Results from coverage survey questionnaires reveal that
previous rejection is responsible for 45% of non-attendance in the CTC programme in
Bahr-el-Ghazal (South Sudan), 44% in South Wollo (Ethiopia) and 30% in Maradi
(Niger) (193). In some programmes the problem of rejected referrals was solved by
moving towards a unified MUAC-based referral and admission criteria. In other
situations, where there was institutional resistance to the use of the same MUAC cut off
for referral and admission, the problem of rejected referrals was partially solved by
instituting a system of incentive payments for carers of referred children (39).
Another problem with the two stage referral and admission process described in Figure
31 is that it tends to lead to crowding and long waits at treatment sites for potential
beneficiaries. Long waits at treatment centres negatively impacts upon the community's
perception of programmes which can reduce coverage (123;194). Again this problem
could be addressed by the use of a unified (i.e. single-stage) referral and admission
system.
11.2.4.5.3 Weight gain, length of stay and cost effectiveness Weight gain and length of stay was not routinely reported in this monitoring data. From
the data available rates of weight gain in OTP programmes were between 3.0-6.8 g kg-1 176

177
day-1. As reported for the Dowa study these are lower than those recommended in the
Sphere standards and lower than those seen in well functioning TFCs. Mean length of
stay in these OTP programmes were also correspondingly longer, between 38-85 days,
than that recommended by Sphere. From the data available, it is the children in CTC
programmes in South Wollo, Ethiopia that have strikingly (compared with Malawi and
other regions of Ethiopia) low weight gains (3.0-4.5 g kg-1 day-1) and long stays (80-85
days). Programme monitoring suggests that at least part of the reason for this was poor
adherence to discharge protocols with staff tending to keep children in the programme
past discharge criteria. Reports of this programme also identified particularly poor
ongoing food security, poor water sources, endemic malaria, and sub-optimal caring
practices at household level, all of which are likely to have contributed to the slow
recovery rates. All these issues are common challenges of CTC programmes in sub
Saharan Africa.
An important implication of slow recovery is the impact that it has on programme cost
effectiveness. This has not been examined in this thesis but, as programmes move
towards longer term interventions and integration of services within primary health care
delivery this will be a vital area for further study.
11.2.4.6 Conclusion These results have confirmed those presented in chapters 8 and 9 and show that the
outpatient treatment of SAM is feasible in a variety of epidemiological and geographic
contexts and can achieve adequate outcomes when compared with international
standards for recovery, mortality and coverage. However, the quality of engagement with
target communities is a vital determinant of the success of a community-based
therapeutic care programme. Community mobilisation is crucial for effective early case-
finding and early case finding and the quality of OTP service provision are the two most
important determinants of programme effectiveness and coverage. Further examination
of the causes and outcomes of defaulting is necessary to strengthen CTC programme
outcome date.
More work is required to elucidate aspects of slow recovery and programme costs,
especially where length of stay is considerably longer than those stipulated by
international standards. This will be important as some of the programmes described here

178
are integrated in to standard primary health care settings. Further development and
evaluation of a unified (i.e. single-stage) referral and admission system will also be
important to achieve maximum impact of future programming.

179
12 Conclusions and Way Forward
12.1 Effectiveness and impact
The hypotheses of this work were that
1) A CTC strategy can treat children with severe acute malnutrition effectively as
defined by international quality indicators
2) In areas with similar demographic and socio economic profile, a CTC strategy can
achieve better population treatment coverage than a centre-based approach.
This thesis presents an in depth analysis of clinical outcomes of 2189 children with SAM
who were treated in the first CTC programmes in Ethiopia and Malawi as well as
programme monitoring and coverage data from an additional 17 programmes and 20,418
children. Overall, the data presented provide evidence that CTC can be a highly effective
model of nutritional intervention in humanitarian emergencies and can provide
substantial advantages over treatment modalities that use inpatient care alone. Without
exception, study outcomes support average mortality rates that are considerably lower
than the minimum international standard stipulated by Sphere and that compare
favourably with those TFC outcomes reported by Grellety (78), the Malawi inpatient
programme and by many of the inpatient studies reported in the literature (see section
6.5.1). Low mortality is shown in populations with both a high prevalence of oedematous
malnutrition (Malawi) and of wasting (Ethiopia). Coverage rates are higher than
international standards and, in Malawi, were seen to be significantly higher than that
achieved by the inpatient NRU programme. In Malawi the approach was reported to be
considerably more popular among the carers and families of programme beneficiaries
than inpatient treatment alone. This is reflected in considerably lower default rates than
international minimum standards and than reported in many TFC programmes.
Outpatient treatment has however slowed the rate of recovery compared to that seen in
well resourced inpatient units. None of the studies reported here achieved the
international standard for weight gain stipulated by Sphere of 8g kg-1 day-1 nor the
standard for length of stay of 30 days. This is particularly true in programmes in Ethiopia
where a combination of a high discharge criteria (85% WFH) and very poor prevailing
food security with little general food available prolonged lengths of stay to > 80 days.

180
In Malawi, over 40% of the outpatient mortality occurred during the first two weeks or
treatment, suggesting the need for some follow up mechanism at this stage of treatment.
Neither children with oedema grade I or II nor children of any particular age group
showed an increased risk of mortality in direct outpatient care. The examination of triage
as an independent risk factor for recovery and mortality suggested that the use of triage
does not reduce the chance of recovery and may reduce the risk of mortality, although
this would need further study.
12.2 The mechanisms of minimising mortality and maximising coverage
Evidence presented in this thesis suggests how the design of the programme has
supported the effectiveness of treatment.
12.2.1 Reducing barriers to access to encourage early presentation and maximise coverage
Early presentation of SAM was evident in both studies 3 and 5 of this thesis. 69% of the
oedematous cases in the Dowa programme (study 3) presented for treatment as either
grade I or II and, of the grade I cases, the majority were without medical complications
and were treated directly in outpatient care with low mortality. Study 5 presents data
from 20,418 children suffering from SAM of whom an average of 74% did not have
medical complications and were treated directly in outpatient care again without raising
mortality above minimum standards. This could only occur with early presentation of
SAM and both the Dowa study and those programmes presented in study 5 were
designed to minimise barriers to accessing treatment. They were highly decentralised to
reduce geographical barriers to access and did not require long stays away from home
which minimised opportunity costs. They also included considerable community
consultation and mobilisation to maximise understanding and participation. In contrast,
the mortality rate in Study 2, even among HIV negative children, remained above
international standards. Here, treatment was not decentralised and it seems likely that
severity of illness, in part due to late presentation because of the opportunity costs of
travelling to receive treatment, played some part in this high CFR.

181
These aspects of programme design also played a vital role in achieving high programme
coverage. Study 4 in Dowa showed that decentralisation of outpatient treatment services
played a vital role in achieving both high and homogenous coverage of the target
population through reducing the distance that families had to travel to access care, by
reducing the opportunity costs (i.e. time and effort) of attending treatment and by
increasing the cultural acceptability of treatment (i.e. reducing time spent away from
spouses and enabling continuation of other social responsibilities).
The Dowa study also showed that community understanding and demand for a
programme is essential for good uptake, and that this ‘community mobilisation’ process
could be supported by thoughtful engagement with traditional leaders and health
workers. Ongoing monitoring of the programmes presented in study 5 confirmed that
both maximising demand and reducing barriers to access, such as perceived poor
programme quality, is vital for good programme uptake and compliance.
12.2.2 Defining complicated malnutrition and triage to outpatient or inpatient care
The use of outpatient treatment within CTC programmes required that there was some
way of separating out those children that suffered from SAM with no complications,
from those that did have complications and needed inpatient stabilisation in an SC. In
Dowa, the use of a set of criteria including the presence or absence of appetite and other
clinical signs based on those adopted by the WHO’s IMCI guidelines were used for the
first time to triage children in to either inpatient or outpatient treatment. A combination
of the indicators used was shown to be a better predictor of risk of mortality than a single
indicator. The low mortality (2%) and the absence of any excess mortality calculated
using the Prudhon index in the outpatient component of the programme would suggest
that this combination of criteria was effective in choosing the group of children for
whom outpatient care was appropriate. Although study 3 used only oedema grade I in the
definition of SAM with no complications, a number of oedema grade II cases were
misclassified as uncomplicated and this presented the opportunity to examine the impact
of direct outpatient care on this group. They responded well in direct OTP, and the
subsequent role out of CTC programmes included oedema grade II in the model for
defining SAM with no complications. This did not appear to increase mortality overall
and will have considerably reduced the numbers referred to inpatient care.

182
The advantages of triage discussed in this thesis include reduced opportunity costs for
participants, reduced overcrowding in inpatient units and increased resources available in
inpatient units for the sickest patients. The finding that triage does not appear to increase
the risk of poor outcome in a malnourished population suggests that triage could be a
useful strategy for therapeutic feeding programmes across sub Saharan Africa. This is
consistent with evidence from other recent operational studies (100;136). However, a
recent publication has continued to question the evidence base behind community-based
therapeutic care and other similar treatment strategies (195). Without data from a
randomised controlled trial that formally demonstrates the impact of triage on the CFR of
children treated for SAM, this critique can not be fully addressed. It would be extremely
beneficial therefore, for such an RCT that compared outcomes of a programme that
triaged children suffering from SAM to outpatient or inpatient care against a programme
that admitted all children to inpatient care for phase 1, to be completed and published.
12.2.3 Decongesting inpatient units Study 3 showed excess mortality in the NRU during the busy hungry season. This
suggested that, through reducing cross infection and increasing quality of care,
decongesting inpatient units further might go some way towards reducing mortality in
these units. The results of Study 2 also suggested that less overcrowding led to reduced
nosocomial infection and, in turn, to an increase in the quality of care delivered. This
may, to some extent, have played a part in reducing inpatient mortality.
12.3 Conclusions The development and testing of CTC has highlighted a number of key factors that are
important to achieving maximum programme impact. The first is that if malnourished
people access nutritional care early in the evolution of their condition, and remain in a
nutritional programme until they have recovered, then success rates are high.
Conversely, if people access care late and/or they are deterred from staying in a
nutritional programme for as long as they need to, then success rates are limited.
The basis of this understanding is that malnutrition is the result of a complex interaction
of economic, social, political, nutritional and public health factors. The clinical course of

183
malnutrition is a gradual decline in nutritional status from normal adaptation towards
metabolic complication, immunosuppression, infection that further complicates
metabolism, increased immunosuppression, more infection and eventual death. The
severity of the condition is primarily a function of the stage of its evolution. As these
changes progress, treatment must become increasingly intensive (and costly) if it is to
succeed, and units treating severe acute malnutrition are frequently confronted by
extremely ill patients who require intensive medical and nursing care. However, most of
these units are in the poorest parts of the poorest countries in the world, and have severe
resource and staff constraints. In addition, the carers of the malnourished patients almost
always come from the poorest families, have great demands on their time and cannot
afford to leave home for long periods to stay with their malnourished child during
treatment.
However, if the condition is caught in the early stages, the technical aspects of treatment
are simple: all that is required is a balanced diet of sufficient quantity and quality. The
composition of such diets is now well researched and as long as the patient has appetite
they are easy to administer in the form of RUTFs. This helps to improve success rates
and keep opportunity costs for treatment low. In practice, this means that finding and
treating cases of acute malnutrition early in the progression of their condition, as well as
the quality of treatment provided, becomes a major determinant of a successful
programme.
A second important factor is that in order to present early and comply with treatment,
people must understand, accept and participate in the programmes. To be effective,
community-based programmes must involve the target populations. This is not unique to
CTC or other SAM treatment approaches but should be integral to all community-based
health and nutrition programmes. In practice, there are several important features of
programme design that are required to promote participation. The first is to minimise
barriers to access. Physical and logistical barriers to presentation can be overcome by
providing access to services close to where the target population live. In the
developmental setting, this involves delivering the OTP for children with SAM through
primary health care structures such as local clinics, health posts or temporary EPI
vaccination points. In humanitarian responses it often involves creating new temporary
OTP access points.

184
Social and cultural barriers to access although more subtle are equally important. These
must be overcome by a range of measures. Foremost is the need for service providers to
make initial investments into understanding the socio-cultural milieu in which CTC
programmes will operate. These investments are not necessarily expensive or
particularly time consuming, but they have to be planned properly and have sufficient
appropriate resources allocated to them. Even in MoH health care systems that employ
“local” staff, there will still be socio-cultural issues that need to be explored if issues of
vital importance to the target population are to be adequately addressed in programme
design. Reducing socio-cultural barriers also requires sensitisation of the population to
ensure that people understand the services that are available to them, and consultation to
enable people to participate in programme development and implementation. This is
vital in order to ensure that issues of importance to potential programme clients are
factored into programme design. In particular, it is essential that programme designs take
into account the socio-economic barriers (opportunity costs) of attendance, to enable
people to access treatment easily and stay in treatment with the minimum of costs to
them and their families.
The evidence presented in this thesis shows that, by designing programmes to maximise
demand, encourage early presentation and reduce the opportunity costs of accessing
treatment, many children suffering from severe acute malnutrition with no medical
complications can be treated successfully as outpatients with RUTF. Admitting children
with severe acute malnutrition without complications in to TFCs can have adverse
consequences, both for patients and the management of emergency nutrition
programmes. It needlessly exposes them to additional risks of cross infection and forces
the caregiver to spend valuable time away from family and household activities. It can
also lead to overcrowding in inpatient units and, potentially, this could decrease the
quality of care provided there. On the other hand, not admitting cases of SAM with
complications to inpatient care is very likely to increase mortality and decrease the
impact of emergency nutrition programmes. On this basis the final model of CTC is
developed.

185
12.4 The CTC Model The basic components of the CTC model of treatment: principles of treatment; treatment
of SAM with complications in inpatient care in a stabilisation centre (SC) or NRU;
treatment of SAM without complications in outpatient care in an outpatient therapeutic
feeding programme (OTP) and community mobilisation were described very briefly in
chapter 6. The data presented in this thesis have enabled a detailed description of both
the principles of treatment of CTC, and the approach and protocols for each programme
component, in an evidence-based field guide: “Community-based Therapeutic Care: A
Field Manual” published by Valid International (196). Sections of this manual to which
this thesis has contributed considerable evidence include:
12.4.1 Reclassification of severe acute malnutrition The existing WHO manual for the treatment of severe acute malnutrition requires that all
children defined as such be treated in inpatient care (29). This thesis tested a new
classification of severe acute malnutrition that includes two categories: SAM with
complications and SAM without complications. The new classification is used to decide
whether a child needs inpatient or outpatient treatment. It ensures that all those who can
be treated as outpatients are treated as outpatients, and only those who need inpatient
care are treated in inpatient centres (139).

Figure 30: Reclassification of severe acute malnutrition for use in CTC
programmes.
Adapted from Community-based Therapeutic Care: A Field Manual (196)
12.4.2 Community mobilisation In the manual the term ‘community mobilisation’ refers to a range of activities designed
to help implementers understand affected communities, build a relationship with them
186
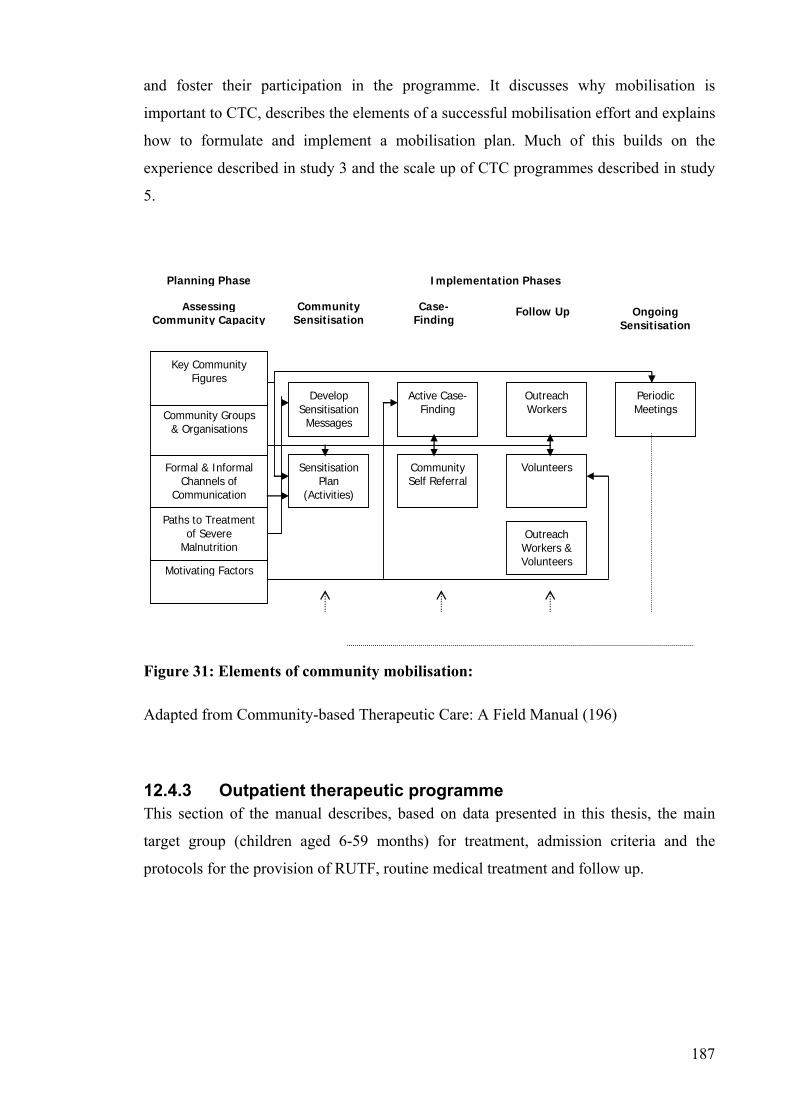
and foster their participation in the programme. It discusses why mobilisation is
important to CTC, describes the elements of a successful mobilisation effort and explains
how to formulate and implement a mobilisation plan. Much of this builds on the
experience described in study 3 and the scale up of CTC programmes described in study
5.
Motivating Factors
Paths to Treatment of Severe
Malnutrition
Formal & Informal Channels of
Communication
Sensitisation Plan
(Activities)
Community Self Referral
Outreach Workers & Volunteers
Volunteers
Develop Sensitisation
Messages
Active Case-Finding
Outreach Workers
Periodic Meetings Community Groups
& Organisations
Assessing Community Capacity
Community Sensitisation
Case-Finding
Follow Up Ongoing Sensitisation
Implementation Phases Planning Phase
Key Community Figures
Figure 31: Elements of community mobilisation:
Adapted from Community-based Therapeutic Care: A Field Manual (196)
12.4.3 Outpatient therapeutic programme This section of the manual describes, based on data presented in this thesis, the main
target group (children aged 6-59 months) for treatment, admission criteria and the
protocols for the provision of RUTF, routine medical treatment and follow up.
187

Figure 32: OTP procedures.
Adapted from Community-based Therapeutic Care: A Field Manual (196)
12.4.4 Programme Monitoring The manual recommends use of the individual monitoring cards, the programme weekly
report and the programme monitoring database (annexes 3-5, section 14.3-14.5) which 188
189
were developed as programme monitoring tools for the work described in this thesis.
Coverage is highlighted as one of the most important indicators of how well a
programme is meeting need, and recommends the survey methodology developed and
tested in study 4 to do this.
12.5 Implications for policy and practice Eradication of extreme poverty and hunger is the first of the eight UN MDGs, and
reducing child mortality the fourth (4). In response to findings of high mortality in TFC
studies, authors have advocated for staff training and support mechanisms to improve the
quality of inpatient treatment delivery across developing nations (see section 6.5 of
literature review) and for the adaptation of inpatient protocols to include, for example,
different dietary regimes for different categories of malnutrition (78). Recently Jackson
et al stated that “If all hospitals in developing countries followed the WHO case
management guidelines for severe malnutrition, perhaps a million or more lives would be
saved” (43). Unfortunately, with such low coverage rates achieved by inpatient treatment
facilities that implement these guidelines, it is unlikely that they will reach enough
severely malnourished children to achieve this goal (see section 6.5.2 of literature
review).
As a result of this thesis, and work ongoing by others, the author would suggest that the
roll out of the WHO guidelines alone is not the solution within the resource constraints
of many inpatient units across the world. In addition to improved training and resources,
simple treatment delivery through outpatient units that is designed to promote early
presentation and easy access and reduce the caseload for inpatient care is likely to
improve the effectiveness of response.
During the last 6 years, with the dissemination of findings presented in this thesis, many
agencies that were opposed to this model of care only five years ago (see section 8.1),
have now started to develop their own protocols for community and home-based
treatment of the severely malnourished (135;197). In response to these advances, the
WHO, UNICEF and the UN Standing Committee on Nutrition recently convened an
informal consultation on the community-based management of severe malnutrition in
children (40). This meeting began the process of incorporating these techniques into the

190
WHO guidelines, and at the beginning of 2007 a joint UN statement endorsed the use of
community-based management techniques for the management of SAM (198):
“The community-based approach involves timely detection of severe acute
malnutrition in the community and provision of treatment for those without
medical complications with ready-to-use foods (cut)… at home. If properly
combined with a facility-based approach (cut) ….community-based
management of severe acute malnutrition could prevent the deaths of hundreds
of thousands of children.”
This is a first step towards an effective treatment for SAM becoming more central to
health care agendas in developing countries. It is this that has the potential to support
progress towards MDGs one and four.
12.5.1 A note on the process of policy change in this context There are interesting lessons to be taken from the way in which this work has changed
international policy and practice. Traditionally, the gold standard of research, the
randomised controlled trial (RCT), has been one of the only ways to introduce new
approaches and products in to public health policy and practice. These are essential for
evaluating the efficacy of clinical interventions where the causal chain between the agent
and the outcome is relatively short and simple and where results may be safely
extrapolated to other contexts (143). Demonstrating the effectiveness and impact of CTC
however, used much simpler study designs that showed adequacy against international
standards and, to some extent, plausibility of increased impact compared to inpatient
programmes by the use of a non randomised control in the comparison of programme
coverage, and by the use of historical TFC data. Scaling up the intervention and showing
similar outcomes in many different contexts was also an important mechanism for
demonstrating effectiveness. Wide and timely dissemination of results, through
international research meetings, UN and INGO presentations and a variety of peer
reviewed and practitioner journals, encouraged ongoing debate and opinion on the
approach. This allowed organisations to adopt the treatment model when they were ready
and, in doing so, to add to the effectiveness data available. It has been 6 years between
the first CTC programme in Ethiopia in September 2000 and the release of the UN joint
statement on community-based management of SAM at the beginning of 2007 (198).

191
This, for international policy change, is relatively rapid progress and has been achieved
without the need for expensive and complicated RCTs.
12.6 Further work required There are a number of questions and areas that require further investigation concerning
the design and impact of CTC programmes. These are summarised briefly below.
12.6.1 Strengthening the evidence base for the use of triage in the treatment of SAM
The release of the UN joint statement on community-based management of acute
malnutrition (CMAM) in 2007, now means that service providers have the support of
these UN agencies to continue to provide treatment for children suffering from
uncomplicated forms of severe acute malnutrition directly from outpatient health
services with ready-to-use foods (198). However, a randomised controlled trial, that
compared outcomes of a programme that triaged children suffering from SAM to
outpatient or inpatient care with that of a programme that admitted all children to
inpatient care for phase 1, would serve to strengthen the evidence base for the CMAM
model of treatment vs. inpatient models of treatment.
12.6.2 Follow up and support after discharge from inpatient care The need for follow up and support at home for the first two weeks after discharge from
the SC in to the OTP, is now included in the CTC action protocols as published in the
manual referred to above (196). The mechanisms that are most effective at providing this
support differ between contexts and countries. These need further investigation and
documentation.
12.6.3 Long term follow up and relapse after discharge The majority of children discharged from the OTP in all studies presented in this thesis
were followed up for at least 3 months in the supplementary feeding programme. Their
recovery during this period and after discharge from the SFP is an important indicator of
the effectiveness of programmes that treat SAM. Many studies have shown a continued
risk of morbidity and mortality well after discharge from treatment (199;200). Analysis
of these data however was beyond the remit of this work and follow up after discharge
from the SFP was not routinely done. However, a retrospective study implemented in
2004 by Valid International in Malawi followed up all children that had been through the
programme in 2002-2003 with the aim of looking at HIV and nutritional status. Very few

192
of the HIV negative children re-measured had relapsed into acute malnutrition. By
contrast, a greater proportion of the HIV positive children had relapsed (162). These are
interesting results and this issue of relapse, and the most effective treatment regimes to
prevent relapse, requires further examination.
12.6.4 Treatment and support for chronically sick and HIV positive children
In the context of high HIV prevalence where length of time to recovery from SAM is
likely to be prolonged, treatment and support programmes such as CTC need to develop
mechanisms of improving effectiveness and reducing the beneficiary’s perceived
opportunity cost of treatment. Approaches such as introducing a system of support and
structured follow-up post discharge, ensuring good linkages with HIV counselling,
testing and treatment services, increasing the amount of daily energy offered to HIV
infected children, adapting CTC routine antibiotic treatment to the epidemiology of HIV-
associated infections and inclusion of routine prophylactic cotrimoxazole for HIV-
positive children may improve both short and longer term outcomes in this group.
12.6.5 The relationship between distance from treatment (and other barriers to access) and early presentation.
This thesis discusses the relationship between a number of barriers to access and the
timing of presentation of children suffering from SAM. This relationship could be
quantified further by, for example, the use of geographic positioning system (GPS)
technology to quantify distances from home to treatment that are then linked to severity
of SAM at admission and outcomes at discharge.
12.6.6 Redefine standards for expected weight gain and length of stay in outpatient treatment programmes.
International Sphere standard indicators for length of stay and weight gain for
therapeutic feeding programmes are unrealistic for many community-based programmes.
These need to be revised in light of the range of weight gain and length of stay outcomes
that are now seen in outpatient programmes, and linked with functional outcomes such as
relapse after discharge.
12.6.7 Examine the use of MUAC as an independent admission and discharge criteria
MUAC has been identified as one of the best (with good precision, specificity and
sensitivity) case-detection methods for identifying children with a high risk of mortality
for admission into programmes treating SAM. It has also been shown to be simple and

193
cheap to use within primary health care settings (39). It has recently been adopted by
WHO, WFP, UN SCN and UNICEF as the preferred method of identifying children that
require community-based management of severe acute malnutrition (198). Using MUAC
as an independent admission criteria for treatment programmes does however raise a
number of questions about which discharge criteria to use. Continuing to use weight for
height based indicators for discharge has been shown to cause confusion, and
programmes have therefore been using weight and length of stay for monitoring and
discharge. Ideally, a MUAC-based discharge criteria would be used, but we currently
know little about how it responds to nutritional support, nor about appropriate thresholds
that would ensure adequate functional outcomes after discharge such as low risk of
mortality and relapse.
12.6.8 Cost effectiveness of community-based care We now have considerable effectiveness data from programmes implemented during
nutritional emergencies when there are often increased resources available. Many of
these programmes are implemented in populations chronically vulnerable to acute
malnutrition. We now need to examine how good quality treatment can be sustained
through primary health services in the longer term, both in terms of capacity building of
local health services, and effectiveness and cost effectiveness of programmes. Any
attempt at policy change and resource allocation to increase access to treatment is not
served well by the absence of good cost effectiveness data for programmes that treat
acute malnutrition (vs. other child survival programmes that are able to give accurate
cost-benefit data for their interventions) (201).
12.6.9 The effective integration of CTC into the primary health care system
With the adoption of the UN joint statement on community-based management of acute
malnutrition, it is now imperative to explore the effective integration of this approach in
to standard child survival initiatives such as the IMCI and growth monitoring
programmes. Until now these initiatives have not included any effective indicator of
SAM, and this means that a huge number of acutely malnourished children with a high
risk of mortality in marginalized communities have not been identified and referred for
treatment. The development and field testing of simple tools and protocols for the
identification, referral and treatment of acute malnutrition in community-based settings is
vital to reduce the prevalence of this condition and to meet the MDGs (particularly MDG
1) laid out by the International Community.

194
13 References Reference List
(1) Wiley J, & sons. International Dictionary of Medicine and Biology. London: Churchill Livingstone, 1986.
(2) de Onis M. Measuring nutritional status in relation to mortality. Bull World Health Organ 2000; 78(10):1271-1274.
(3) Waterlow JC. Protein energy malnutrition. 1 ed. London: Edward Arnold, 1992.
(4) United Nations UN Millenium Development Goals http://www.un.org/millenniumgoals/ (accessed on 1-12-0007)
(5) UN Standing Committee on Nutrition. 5th Report on the World Nutrition Situation: Nutrition for Improved Development Outcomes. 5. 2004. Geneva, UN System Standing Committee on Nutrition.
(6) UNICEF. The State of the World's Children 2007. 2006. New York, UNICEF. (7) Pelletier DL, Frongillo EA, Jr., Schroeder DG, Habicht JP. The effects of
malnutrition on child mortality in developing countries. Bull World Health Organ 1995; 73(4):443-448.
(8) Black RE, Morris SS, Bryce J. Where and why are 10 million children dying every year? Lancet 2003; 361(9376):2226-2234.
(9) Caulfield LE, de Onis M, Blossner M, Black RE. Undernutrition as an underlying cause of child deaths associated with diarrhea, pneumonia, malaria, and measles. Am J Clin Nutr 2004; 80(1):193-198.
(10) Rice AL, Sacco L, Hyder A, Black RE. Malnutrition as an underlying cause of childhood deaths associated with infectious diseases in developing countries. Bull World Health Organ 2000; 78(10):1207-1221.
(11) Pelletier DL, Frongillo EA. Changes in child survival are strongly associated with changes in malnutrition in developing countries. J Nutr 2003; 133(1):107-119.
(12) Muller O, Krawinkel M. Malnutrition and health in developing countries. CMAJ 2005; 173(3):279-286.
(13) Black RE, Allen LH, Bhutta ZA, Caulfield LE, de Onis M, Ezzati M et al. Maternal and child undernutrition: global and regional exposures and health consequences. Lancet 2008; 371(9608):243-260.
(14) Tomkins A, Watson F. Malnutrition and infection. A review. 1989. Geneva, WHO. Advisor committee on coordination/Subcommittee on nutrition.

195
(15) Pelletier DL, Frongillo EA, Jr., Habicht JP. Epidemiologic evidence for a potentiating effect of malnutrition on child mortality. Am J Public Health 1993; 83(8):1130-1133.
(16) NHD/WHO. Turning the Tide of Malnutrition: responding to the challenge of the 21st century. 2000. Geneva, WHO.
(17) SPHERE project team. The Sphere Project: Humanitarian charter and Minimum
Standards in Disaster Response. 1 ed. Geneva: The Sphere Project, 1999.
(18) Young H. Public nutrition in emergencies: an overview of debates, dilemmas and decision-making. Disasters 1999; 23(4):277-291.
(19) UNICEF. Strategy for improved nutrition of children and women in developing countries. 1990. Geneva, A UNICEF policy review.
(20) Williams CD. Kwashiorkor: A nutritional disease of children associated with a
maize diet. Lancet 1935; 2:1151-1152.
(21) Trowell HC. 'Infantile pellagra'. Trans R Soc Trop Med Hyg 1941; 33:389-404.
(22) Waterlow JC. Marasmus and kwashiorkor: pathology and metabolic patterns. In: McCance RA, Widdowson EM, editors. Calorie Deficiencies and Protein Deficiencies. London: Churchill, 1968: 61-73.
(23) Golden MH. The development of concepts of malnutrition. J Nutr 2002; 132(7):2117S-2122S.
(24) Golden MHN, Ramdath D. Free radicals in the pathogenesis of kwashiorkor. Proceedings of the Nutrition Society 1987; 46:53-68.
(25) Golden MHN. Severe Malnutrition. In: Weatherall DJ, Ledington JGG, Warrell DA, editors. The Oxford Textbook of Medicine (3rd ed.). Oxford: Oxford University Press, 1996: 1278-1296.
(26) Ciliberto H, Ciliberto M, Briend A, Ashorn P, Bier D, Manary M. Antioxidant supplementation for the prevention of kwashiorkor in Malawian children: randomised, double blind, placebo controlled trial. BMJ 2005; 330(7500):1109-1114.
(27) Hendrickse RG. Kwashiorkor: 50 years of myth and mystery. Do aflatoxins provide a clue? Acta Leiden 1985; 53:11-30.
(28) Househam KC, Hundt HK. Aflatoxin exposure and its relationship to kwashiorkor in African children. J Trop Pediatr 1991; 37(6):300-302.
(29) WHO. Management of severe malnutrition : a manual for physicians and other senior health workers. Geneva: World Health Organization, 1999.
(30) Gomez F, Ramos-Galvan R. Mortality in second and third degree malnutrition. J Trop Pediatr 1956; 2:77-83.

196
(31) Trowbridge FL. Anthropometric criteria in malnutrition. Lancet 1979; 2(8142):589-60.
(32) Bern C, Zucker JR, Perkins BA, Otieno J, Oloo AJ, Yip R. Assessment of potential indicators for protein-energy malnutrition in the algorithm for integrated management of childhood illness. Bull World Health Organ 1997; 75 Suppl 1:87-96.
(33) Chen LC, Chowdhury A, Huffman SL. Anthropometric assessment of energy-protein malnutrition and subsequent risk of mortality among preschool aged children. Am J Clin Nutr 1980; 33(8):1836-1845.
(34) World Health Organization. Management of severe malnutrition : a manual for physicians and other senior health workers. Geneva: World Health Organization, 1999.
(35) Ashworth A, Khanum S, Jackson A, Schofield C. Guidelines for the inpatient treatment of severely malnourished children. Geneva: WHO, 2003.
(36) National Centre for Health Statistics (NCHS). NCHS growth curves for children birth to 18 years. 1979. Washington, US Department of Health, Education and Welfare, Government Printing Office.
(37) Boelaert M, Davis A, Le Lin B, Michelet M, Ritmeijer K, Van Der Kam S et al.
Nutrition guidelines. 1 ed. Paris: Medecins sans Frontieres, 1995.
(38) UNHCR. Handbook for emergencies. 2 ed. Geneva: UNHCR, 1999.
(39) Myatt M, Khara T, Collins S. A review of methods to detect cases of severely malnourished children in the community for their admission into community-based therapeutic care programs. Food Nutr Bull 2006; 27(3 (supplement)).
(40) WHO Report of an informal consultation on the community-based management of severe malnutrition in children http://www.who.int/child-adolescent-health/New_Publications/NUTRITION/CBSM/Meeting_report_CBSM.pdf (accessed on 1-8-2007)
(41) UNICEF Global Database on Child Malnutrition. http://www.childinfo.org/areas/malnutrition/wasting.php . 2006.
(42) Collins S, Dent N, Binns P, Bahwere P, Sadler K, Hallam A. Management of
severe acute malnutrition in children. Lancet 2006; 368(9551):1992-2000.
(43) Jackson AA, Ashworth A, Khanum S. Improving child survival: Malnutrition Task Force and the paediatrician's responsibility. Arch Dis Child 2006; 91(8):706-710.
(44) The Bellagio Child Survival Study Group. The child survival series. Lancet 2003; 361(9351):1-38.
(45) WHO. Management of the child with a serious infection or severe malnutrition : guidelines for care at the first-referral level in developing countries. [Geneva] : World Health Organization, 2000.

197
(46) WHO. Improving child health. IMCI: the integrated approach. Geneva: World Health Organization, 1997.
(47) Collins S. Treating severe acute malnutrition seriously. Arch Dis Child 2007; 92(5):453-461.
(48) Waterlow JC. Metabolic adaptation to low intakes of energy and protein. [Review]. Annual Review of Nutrition 1986; 6:495-526.
(49) Keys A. The biology of human starvation. 1 ed. Minosota: Minnosota press, 1950.
(50) McCance RA, Widdowson EM. Studies in undernutrition, Wuppertal 1946-9. 1 ed. London: Medical Research Council, 1951.
(51) Cahill GF, Jr. Survival in starvation. Am J Clin Nutr 1998; 68(1):1-2.
(52) Golden MH, Waterlow JC, Picou D. Protein turnover, synthesis and breakdown before and after recovery from protein-energy malnutrition. Clin Sci Mol Med 1977; 53(5):473-477.
(53) Golden M. The effects of malnutrition in the metabolism of children. Trans R Soc Trop Med Hyg 1988; 82(1):3-6.
(54) Reid M, Badaloo A, Forrester T, Morlese JF, Heird WC, Jahoor F. The acute-phase protein response to infection in edematous and nonedematous protein-energy malnutrition. Am J Clin Nutr 2002; 76(6):1409-1415.
(55) Ashworth A, Jackson A, Khanum S, Schofield C. Ten steps to recovery. Child Health Dialogue 1996;(3-4):10-12.
(56) WHO informal consultation. Informal consultation to review current literature on severe malnutrition. 1. 2004. Geneva, WHO.
(57) WHO. The treatment and management of severe protein energy malnutrition.
Geneva: WHO, 1981.
(58) Khanum S, Ashworth A, Huttly SR. Controlled trial of three approaches to the treatment of severe malnutrition. Lancet 1994; 344:1728-1732.
(59) Mason JB, Hay RW, Leresche J, Peel S, Darley S. Treatment of severe malnutrition in relief. Lancet 1974; 1(7853):332-335.
(60) Ifekwunigwe AE. Recent field experiences in eastern Nigeria. Symposia of the Swedish nutrition foundation 1971; 9:144-154.
(61) Ifekwunigwe AE. Emeregncy treatment of large numbers of children with severe protein-calorie malnutrition. Am J Clin Nutr 1975; 28:79-83.
(62) Golden BE. Primary protein energy malnutrition. Garrow JS, James WPT, editors. Human nutrition and dietetics. 9[30], 440-455. 1993. London, Churchill Livingstone.

198
(63) Golden MHN. Protein deficiency, energy deficiency and the oedema of malnutrition. Lancet 1982; 1:1261-1265.
(64) Golden MHN, Briend A. Treatment of severe child malnutrition in refugee camps [letter]. Lancet 1993; 342(8867):360.
(65) Golden MHN, Ramdath D, Golden BE. Free radicals and malnutrition. In: Dreosti IE, editor. Trace elements, micronutrients and free radicals. Clifton, New Jersey: Humana Press, 1994.
(66) Cunningham-Rundles S. Effects of nutritional status on immunological function. Am J Clin Nutr 1982; 35:1202-1210.
(67) WHO, UNHCR, WFP, IFRC. The management of nutrition in major emergencies. Geneva: WHO, 2000.
(68) Ashworth A, Burgess AP. Caring for severely malnourished children. 1 ed. Oxford: Macmillan & Talc, 2003.
(69) Collins S. Changing the way we address severe malnutrition during famine. Lancet 2001; 358(9280):498-501.
(70) Navarro-Colorado C, Fournier S, Verdenal L, Ververs M. Therapeutic Feeding Centres for severe malnutrition (letter). Lancet 2002; 359(9302):259-260.
(71) WFP, UNHCR. Guidelines for selective feeding programmes in refugee and emergency situations. 1999. Geneva.
(72) SPHERE project team. The Sphere Project: Humanitarian charter and Minimum
Standards in Disaster Response. 2 ed. Geneva: The Sphere Project, 2004.
(73) Briend A. Dietary management of severe protein-calorie malnutrition in children. Ann Med Interne (Paris) 2000; 151(8):629-634.
(74) Brewster DR, Manary MJ, Menzies IS, Henry RL, O'Loughlin EV. Comparison of milk and maize based diets in kwashiorkor. Arch Dis Child 1997; 76(3):242-248.
(75) Briend A, Golden MH. Treatment of severe child malnutrition in refugee camps. Eur J Clin Nutr 1993; 47(10):750-754.
(76) Briend A, Lacsala R, Prudhon C, Mounier B, Grellety Y, Golden MHN. Ready-to-use therapeutic food for treatment of marasmus [letter]. Lancet 1999; 353(9166):1767-1768.
(77) Diop EHI, Dossou NI, Ndour MM, Briend A, Wade S. Comparison of the efficacy of a solid ready to use food and a liquid milk-based diet for the rehabilitation of severely malnourished children: a randomized trial. Am J Clin Nutr 2003;(78):302-307.
(78) Grellety Y. The management of severe malnutrition in Africa. University of Aberdeen, 2000.

199
(79) Jones G, Steketee RW, Black RE, Bhutta ZA, Morris SS. How many child deaths can we prevent this year? Lancet 2003; 362(9377):65-71.
(80) Ahmed T, Ali M, Ullah MM, Choudhury IA, Haque ME, Salam MA et al. Mortality in severely malnourished children with diarrhoea and use of a standardised management protocol. Lancet 1999; 353(9168):1919-1922.
(81) Chopra M, Wilkinson D. Treatment of malnutrition. Lancet 1995; 345:788-791.
(82) Wilkinson D, Scrase M, Boyd N. Reduction in in-hospital mortality of children with malnutrition. J Trop Pediatr 1996; 42:114-115.
(83) Puoane T, Sanders D, Chopra M, Ashworth A, Strasser S, McCoy D et al. Evaluating the clinical management of severely malnourished children--a study of two rural district hospitals. S Afr Med J 2001; 91(2):137-141.
(84) Deen JL, Funk M, Guevara VC, Saloojee H, Doe JY, Palmer A et al. Implementation of WHO guidelines on management of severe malnutrition in hospitals in Africa. Bull World Health Organ 2003; 81(4):237-243.
(85) Rossi L, Verna D, Villeneuve SL. The humanitarian emergency in Burundi: evaluation of the operational strategy for management of nutritional crisis. Public Health Nutr 2007;1-7.
(86) Pecoul B, Soutif C, Hounkpevi M, Ducos M. Efficacy of a therapeutic feeding centre evaluated during hospitalization and a follow-up period, Tahoua, Niger, 1987-1988. Ann Trop Paediatr 1992; 12(1):47-54.
(87) Schofield C, Ashworth A. Why have mortality rates for severe malnutrition remained so high? Bull World Health Organ 1996; 74(2):223-229.
(88) Briend A. Management of severe malnutrition: efficacious or effective? J Pediatr Gastroenterol Nutr 2001; 32(5):521-522.
(89) Brewster DR, Manary MJ, Graham SM. Case management of kwashiorkor: an intervention project at seven nutrition rehabilitation centres in Malawi. Eur J Clin Nutr 1997; 51(3):139-147.
(90) Brewster D. Improving quality of care for severe malnutrition [letter]. Lancet 2004; 363(9426):2088-2089.
(91) Bhan MK, Bhandari N, Bhal R. Management of the severely malnourished child: perspective from developing countries. BMJ 2003; 326:146-151.
(92) Ashworth A, Chopra M, McCoy D, Sanders D, Jackson D, Karaolis N et al. WHO guidelines for management of severe malnutrition in rural South African hospitals: effect on case fatality and the influence of operational factors. Lancet 2004; 363(9415):1110-1115.
(93) Karaolis N, Jackson D, Ashworth A, Sanders D, Sogaula N, McCoy D et al. WHO guidelines for severe malnutrition: are they feasible in rural African hospitals? Arch Dis Child 2007; 92(3):198-204.

200
(94) Heikens GT. How can we improve the care of severely malnourished children in Africa? PLoS Med 2007; 4(2):e45.
(95) Duke T, Campbell H, Ayieko P, Opiyo N, English M, Kelly J et al. Accessing and understanding the evidence. Bull World Health Organ 2006; 84(12):922-928
(96) Ahmed T, Begum B, Badiuzzaman, Ali M, Fuchs G. Management of severe malnutrition and diarrhea. Indian J Pediatr 2001; 68(1):45-51.
(97) Puoane T, Sanders D, Ashworth A, Chopra M, Strasser S, McCoy D. Improving the hospital management of malnourished children by participatory research. Int J Qual Health Care 2004; 16(1):31-40.
(98) Cavalcante AA, Pinheiro LM, Monte C, Guimaraes AR, Ashworth A. Treatment of malnutrition in Brazil: simple solutions to common problems. Trop Doct 1998; 28(2):95-97.
(99) WHO WHO Global Health Atlas - Human Resources for Health 2005 http://www.who.int/globalatlas/dataQuery
(100) Linneman Z, Matilsky D, Ndekha M, Manary MJ, Maleta K, Manary MJ. A large-scale operational study of home-based therapy with ready-to-use therapeutic food in childhood malnutrition in Malawi. Matern Child Nutr 2007; 3(3):206-215.
(101) Kessler L, Daley H, Malenga G, Graham S. The impact of the human immunodeficiency virus type 1 on the management of severe malnutrition in Malawi. Ann Trop Paediatr 2000; 20(1):50-56.
(102) Ticklay IM, Nathoo KJ, Siziya S, Brady JP. HIV infection in malnourished children in Harare, Zimbabwe. East Afr Med J 1997; 74(4):217-220.
(103) Maitland K, Berkley JA, Shebbe M, Peshu N, English M, Newton CR. Children with severe malnutrition: can those at highest risk of death be identified with the WHO protocol? PLoS Med 2006; 3(12):e500.
(104) UNAIDS. 2006 report on the global AIDS epidemic : Executive summary. 2006. Geneva, UNAIDS.
(105) Lewis DK, Callaghan M, Phiri K, Chipwete J, Kublin JG, Borgstein E et al.
Prevalence and indicators of HIV and AIDS among adults admitted to medical and surgical wards in Blantyre, Malawi. Trans R Soc Trop Med Hyg 2003; 97(1):91-96.
(106) Rogerson SR, Gladstone M, Callaghan M, Erhart L, Rogerson SJ, Borgstein E et al. HIV infection among paediatric in-patients in Blantyre, Malawi. Trans R Soc Trop Med Hyg 2004; 98(9):544-552.
(107) Consultation on nutrition and HIV/AIDS Evidence, lessons and recommendations for action Bangkok, 8 to 11 October, 2007. Bangkok Thailand: 2007.
(108) Bunn J, Kerac M, Nyirongo V. Prudhon Index: need for revision in the light of local data? presented at the Blantyre, Malawi Technical Review Workshop:

201
Improving the management of severely malnourished children with HIV in sub-Saharan Africa. 2007.
(109) Dye C, Watt CJ, Bleed D. Low access to a highly effective therapy: a challenge
for international tuberculosis control. Bull World Health Organ 2002; 80(6):437-444.
(110) Bryce J, el Arifeen S, Pariyo G, Lanata C, Gwatkin D, Habicht JP. Reducing child mortality: can public health deliver? Lancet 2003; 362(9378):159-164.
(111) Sadler K, Myatt M, Feleke T, Collins S. A comparison of the programme coverage of two therapeutic feeding interventions implemented in neighbouring districts of Malawi. Public Health Nutr 2007;1-7.
(112) Myatt M, Feleke T, Collins S, Sadler K. A field trial of a survey method for estimating the coverage of selective feeding programs. Bull World Health Organ 2005; 83(1):20-26.
(113) Shengelia B, Tandon A, Adams OB, Murray CJ. Access, utilization, quality, and effective coverage: an integrated conceptual framework and measurement strategy. Soc Sci Med 2005; 61(1):97-109.
(114) Van Damme W, Boelaert M. Medical assistance to self-settled refugees. Guinea (letter). Lancet 2002; 359:260-261.
(115) Jha P, Bangoura O, Ranson K. The cost-effectiveness of forty health interventions in Guinea. Health Policy Plan 1998; 13(3):249-262.
(116) Cook R. Is hospital the place for the treatment of malnourished children? J Trop Pediatr Environ Child Health 1971; 17(1):15-25.
(117) Sadre M, Donoso G. Treatment of malnutrition. Lancet 1969; 2(7611):112-114
(118) Lawless J, Lawless MM. Admission and mortality in a children's ward in an urban tropical hospital. Lancet 1966; 2:1175-1176.
(119) Jeliffe DB, Jeliffe EF. The children's ward as a lethal factor? J Pediatr 1970; 77(5):895-899.
(120) Griffiths P, Matthews Z, Hinde A. Gender, family, and the nutritional status of children in three culturally contrasting states of India. Soc Sci Med 2002; 55(5):775-790.
(121) Isaack H, Mbise RL, Hirji KF. Nosocomial bacterial infections among children with severe protein energy malnutrition. East Afr Med J 1992; 69(8):433-436.
(122) De Waal A. Famine that kills: Darfur Sudan, 1984-1985 (Oxford Studies in African Affairs). 1 ed. Oxford: Clarendon Press, 1989.
(123) Collins S. Community-based therapeutic care - A new paradigm for selective feeding in nutritional crises. Humanitarian Policy Network, editor. Network paper No 48. 2004. London, Overseas Development Institute. HPN Network Papers.

202
(124) Bengoa JM. Nutrition rehabilitation centres. J Trop Pediatr 1967; 13(4):169-176.
(125) Beghin ID, Viteri FE. Nutritional rehabilitation centres: an evaluation of their performance. J Trop Pediatr Environ Child Health 1973; 19(4):403-416.
(126) Beaudry-Darisme M, Latham MC. Nutrition rehabilitation centers--an evaluation of their performance. J Trop Pediatr Environ Child Health 1973; 19(3):299-332.
(127) do Monte CM, Ashworth A, Sa ML, Diniz RL. Effectiveness of nutrition centers in Ceara state, northeastern Brazil. Rev Panam Salud Publica 1998; 4(6):375-382.
(128) Brown RC, Brown JE, Teeter RA. Evaluation of a nutrition center program in rural Africa. J Trop Pediatr 1980; 26(1):37-41.
(129) Chapko MK, Prual A, Gamatie Y, Maazou AA. Randomized clinical trial comparing hospital to ambulatory rehabilitation of malnourished children in Niger. J Trop Pediatr 1994; 40(4):225-230.
(130) Ashworth A. Efficacy and effectiveness of community-based treatment of severe malnutrition. Food Nutr Bull 2006; 27(3 Suppl):S24-S48.
(131) Ashworth A. Community-based rehabilitation of severely malnourished children: a review of successful programmes. 2001. London, London School of Hygiene and Tropical Medicine.
(132) Manary MJ, Ndkeha MJ, Ashorn P, Maleta K, Briend A. Home based therapy for
severe malnutrition with ready-to-use food. Arch Dis Child 2004; 89(6):557-561.
(133) Ndekha MJ, Manary MJ, Ashorn P, Briend A. Home-based therapy with ready-to-use therapeutic food is of benefit to malnourished, HIV-infected Malawian children. Acta Paediatr 2005; 94(2):222-225.
(134) Ciliberto MA, Sandige H, Ndekha MJ, Ashorn P, Briend A, Ciliberto HM et al. Comparison of home-based therapy with ready-to-use therapeutic food with standard therapy in the treatment of malnourished Malawian children: a controlled, clinical effectiveness trial. Am J Clin Nutr 2005; 81(4):864-870.
(135) Navarro-Colorado C, Mckenney P. Home-based rehabilitation in severe malnutrition vs. inpatient care in a post-emergency setting. A randomised clinical trial in Sierra Leone. Presented at an Interagency Workshop Dublin 8-10 October 2003. 2003. Oxford, UK, Emergency Nutrition Network.
(136) Gaboulaud V, Dan-Bouzoua N, Brasher C, Fedida G, Gergonne B, Brown V.
Could nutritional rehabilitation at home complement or replace centre-based therapeutic feeding programmes for severe malnutrition? J Trop Pediatr 2007; 53(1):49-51.
(137) Mason JB, Habicht JP, Greaves JP, Jonsson U, Kevany J, Martorell R et al. Public nutrition. Am J Clin Nutr 1996; 63(3):399-400.
(138) Victora CG, Wagstaff A, Schellenberg JA, Gwatkin D, Claeson M, Habicht JP. Applying an equity lens to child health and mortality: more of the same is not enough. Lancet 2003; 362(9379):233-241.

203
(139) Collins S, Yates R. The need to update the classification of acute malnutrition [letter]. Lancet 2003; 362(9379):249.
(140) Collins S. Authors reply to Navarro et Al. [letter]. Lancet 2002; 359:260.
(141) Boelaert M, Van Damme W. Theraeputic feeding centres for severe malnutrition [letter]. Lancet 2002; 359:260-261.
(142) Concern worldwide Concern's Mission (accessed on 10-3-2008)
(143) Victora CG, Habicht JP, Bryce J. Evidence-based public health: moving beyond randomized trials. Am J Public Health 2004; 94(3):400-405.
(144) WHO. Use an interpretation of anthropometric indicators of nutritional status. WHO Bulletin 1986; 64 (6):929-941.
(145) WHO. Physical status: the use and interpretation of anthropometry. Report of a WHO expert committee. 854. 1995. Geneva, WHO. Technical Report Series.
(146) Excel. Windows. Redmond, Washington: Microsoft corporation, 1994.
(147) Beattie J, Herbert PH, Bell DJ. Famine oedema. Brit J Nutr 1948; 2:47-65.
(148) EpiInfo version 6: A word processing, database, and statsitics program for public health on IBM-compatible microcomputers. Atlanta, USA: Centres for Disease Control and Prevention, 1995.
(149) EpiData, version 2.1. An extended tool for validated entry and documentation of data. Odense Denmark: The EpiData Association, 2001.
(150) SPSS. Statistical data analysis. Chicago, USA: SPSS Inc., 1990.
(151) Prudhon C, Golden MH, Briend A, Mary JY. A model to standardise mortality of severely malnourished children using nutritional status on admission to therapeutic feeding centres. Eur J Clin Nutr 1997; 51(11):771-777.
(152) Collins S, Sadler K. The outpatient treatment of severe malnutrition during humanitarian relief programmes. Lancet 2002; 360:1824-1830.
(153) Collins S, Myatt M, Golden BE. Dietary treatment of severe malnutrition in adults. Am J Clin Nutr 1998; 68:193-199.
(154) Beaton G, Ghassemi H. Supplementary feeding programmes for young children in developing countries. Am J Clin Nutr 1982; 35:864-916.
(155) Sadler K, Kerac M, Collins S, Khengere H, Nesbitt A. Improving the Management of Severe Acute Malnutrition in an Area of High HIV Prevalence. J Trop Pediatr 2008.
(156) National Statistical Office ZM. Population and Housing Census. 1998. Zomba, Malawi, Ministry of Health and Population.

204
(157) National Statistical Office ZM. Demographic and Health Survey 2004. 2005. Maryland, USA, ORC Macro.
(158) Karaolis N, Jackson D, Ashworth A, Sanders D, Sogaula N, McCoy D et al.
WHO guidelines for severe malnutrition: are they feasible in rural African hospitals? Arch Dis Child 2006.
(159) UNDP. Human Development Report 2006: beyond scarcity: power, poverty and the global water crisis. 2006. New York, USA, Palgrave Macmillan. Human Development Reports.
(160) Benguigui Y, Stein F. Integrated management of childhood illness: an emphasis
on the management of infectious diseases. Semin Pediatr Infect Dis 2006; 17(2):80-98.
(161) Grellety Y. Nutrition assessment SCF Sudan North East Darfur 4 December – 13 December 2001. 2002.
(162) Bahwere P, Joshua MC, Sadler K, Tanner C, Piwoz E, Guerrero S et al. Uptake
of HIV testing and outcomes within a Community-based Therapeutic Care (CTC) programme to treat Severe Acute Malnutrition in Malawi: a descriptive study. Biomed Central. In press.
(163) WHO. Nutrient requirements for people living with HIV/AIDS: report of a technical consultation. 2003. Geneva.
(164) Madhi SA, Cutland C, Ismail K, O'Reilly C, Mancha A, Klugman KP.
Ineffectiveness of trimethoprim-sulfamethoxazole prophylaxis and the importance of bacterial and viral coinfections in African children with Pneumocystis carinii pneumonia. Clin Infect Dis 2002; 35(9):1120-1126.
(165) WHO. Community home-based care in resource-limited settings: a framework for action. 2002. Geneva.
(166) Bandawe CR, Kabwazi N. Cultural and ethical considerations of Community
Therapeutic Care (CTC). In: Report of an Interagency Workshop on community-based approaches to managing severe malnutrition. 2003. Oxford, Emergency Nutrition Network.
(167) Mcnaughton J. Nutrition intervention programmes: pitfalls and potential. Ceres
1983; 16(2):28-33.
(168) Berkowitz FE. Bacteremia in hospitalized black South African children. A one-year study emphasizing nosocomial bacteremia and bacteremia in severely malnourished children. Am J Dis Child 1984; 138(6):551-556.
(169) Briend A, Dykewicz C, Graven K, Mazumder RN, Wojtyniak B, Bennish M. Usefulness of nutritional indices and classifications in predicting death of malnourished children. BMJ (Clin Res Ed) 1986; 293(6543):373-375.

205
(170) Pelletier DL. The relationship between child anthropometry and mortality in developing countries: implications for policy, programs and future research. J Nutr 1994; 124(10 Suppl):2047S-2081S.
(171) Van den BJ, Eeckels R, Vuylsteke J. Influence of nutritional status on child mortality in rural Zaire. Lancet 1993; 341(8859):1491-1495.
(172) Sadler K, Myatt M, Feleke T, Collins S. A comparison of the programme coverage of two therapeutic feeding interventions implemented in neighbouring districts of Malawi. Public Health Nutr 2007;1-7.
(173) Henderson RH, Sundaresan T. Cluster sampling to assess immunization coverage: a review of experience with a simplified sampling method. Bull World Health Organ 1982; 60(2):253-260.
(174) Lemeshow S, Robinson D. Surveys to measure programme coverage and impact: a review of the methodology used by the expanded programme on immunization. World Health Stat Q 1985; 38(1):65-75.
(175) Kok PW. Cluster sampling for immunization coverage. Soc Sci Med 1986; 22(7):781-783.
(176) Moser CA, Kalton G. Survey Methods in Social Investigation. 2 ed. London: Heinemann Educational Books, 1979.
(177) Ekanem EE. Field epidemiology: Methodological constraints and limitations in the developing world. Public Health 1985; 99(1):33-36.
(178) Katz J, Yoon SS, Brendel K, West KP, Jr. Sampling designs for xerophthalmia prevalence surveys. Int J Epidemiol 1997; 26(5):1041-1048.
(179) Malawi National Vulnerability Assessment Committee, SADC FANR Vulnerability Assessment Committee. Malawi Emergency Food Security Assessment Report. 1-20-2003. Lilongwe, Malawi.
(180) Concern worldwide, Malawi Ministry of Health. Nutrition and Mortality Survey
Report: Dowa District Malawi. 2003. (181) Save the Children (UK), Malawi Ministry of Health. Nutrition Survey Report:
Salima District and Mchinji District. 2003. (182) Krebs CJ. Ecological Methodology. 2 ed. Menlo Park: Addison Wesley
Longman, 1999.
(183) Milne A. The centric systematic area sample treated as a random sample. Biometrics 1959; 15:270-297.
(184) CSAS coverage calculator. UK: Brixton Health, 2003.
(185) Paint. USA: Microsoft Corporation, 2001.

206
(186) Cole RG, Healy TR, Wood ML, Foster DM. Statistical analysis of spatial pattern. A comparison of grid and hierarchical sampling approaches. Coastal Marine Group, editor. 2000. New Zealand, University of Waikato.
(187) Hubert B, Desenclos JC. Evaluation of the exhaustivity and representativeness of
a surveillance system by the capture-recapture method. Application to surveillance of meningococcal infections in France in 1989 and 1990. Epid et Sante Publique 1993; 41:241-249.
(188) Des J, Lyles C, Crepaz N. Improving the reporting quality of nonrandomized evaluations of behavioral and public health interventions: the TREND statement. Am J Public Health 2004; 94(3):361-366.
(189) Collins S, Sadler K, Dent N, Khara T, Guerrero S, Myatt M et al. Key issues in the success of community-based management of severe malnutrition. Food Nutr Bull 2006; 27(3):S49-S82.
(190) IRIN Niger: humanitarian country profile http://www.irinnews.org/ (accessed on 4-5-2007)
(191) SPHERE project team. The SPHERE Humanitarian Charter and Minimum Standards in Disaster Response. 2 (Draft) ed. Geneva: The SPHERE Project, 2003.
(192) Van Damme W. Medical assistance to self-settled refugees. Guinea 1990 - 1996. 1-249. 1998. Antwerp, ITG Press.
(193) Guerrero S. Impact of non-admission on CTC programme coverage. Field
Exchange , 28-30. 2007. Oxford, UK, Emergency Nutrition Network. (194) Khara T, Collins S. Community-based Therapeutic Care (CTC). Valid
International, editor. 2. 2004. Oxford, Emergency Nutrition Network. Special Supplement Series.
(195) Bhutta ZA, Ahmed T, Black RE, Cousens S, Dewey K, Giugliani E et al. What
works? Interventions for maternal and child undernutrition and survival. Lancet 2008; 371(9610):417-440.
(196) Valid International. Community-based Therapeutic Care (CTC): A Field Manual. 1st ed. Oxford UK: Valid International, 2006.
(197) Tectonidis M. Crisis in Niger - Outpatient Care for Severe Acute Malnutrition. N Eng J Med 2006; 354(3):224-227.
(198) WHO, WFP, UNSCN, and UNICEF Community-based management of severe acute malnutrition: A Joint Statement by the World Health Organization, the World Food Programme, the United Nations System Standing Committee on Nutrition and the United Nations Children's Fund http://www.who.int/nutrition/topics/Statement_community_based_man_sev_acute_mal_eng.pdf

207
(199) Khanum S, Ashworth A, Huttly SR. Growth, morbidity, and mortality of children in Dhaka after treatment for severe malnutrition: a prospective study. Am J Clin Nutr 1998; 67(5):940-945.
(200) Chevalier P, Sevilla R, Sejas E, Zalles L, Belmonte G, Parent G. Immune recovery of malnourished children takes longer than nutritional recovery: implications for treatment and discharge. J Trop Pediatr 1998; 44(5):304-307.
(201) Edejer TT, Aikins M, Black R, Wolfson L, Hutubessy R, Evans DB. Cost effectiveness analysis of strategies for child health in developing countries. BMJ 2005; 331(7526):1177-1185

208
14 Appendices
14.1 Appendix 1: Papers published in peer reviewed journals on which the author is lead or contributing author.
14.1.1 Management of severe acute malnutrition in children. Lancet 2006

209

210

211

212

213

214

215

216

217

218
14.1.2 The outpatient treatment of severe malnutrition during humanitarian relief programmes. Lancet 2002

219

220

221

222

223

224

225
226
14.1.3 Improving the Management of Severe Acute Malnutrition in an Area of High HIV Prevalence. Journal of Tropical Pediatrics 2008

227

228

229

230

231

232

233
14.1.4 A field trial of a survey method for estimating the coverage of selective feeding programmes. Bulletin of the WHO 2003

234

235

236

237

238

239

240

241

242
14.1.5 A comparison of the programme coverage of two therapeutic feeding interventions implemented in neighbouring districts of Malawi. Public Health Nutrition 2007

243

244

245

246

247

248

249

250
14.1.6 Key issues in the success of community-based management of severe malnutrition. Food and Nutrition Bulletin 2006

251

252

253

254

255

256

257

258

259

260

261

262

263

264

265

266

267

268

269

270

271

272

273

274

275

276

277

278

279

280

281

282

283

284

285
14.2 Appendix 2: Lancet letters discussing TFCs vs. CTC for the treatment of SAM

286

287

288

289
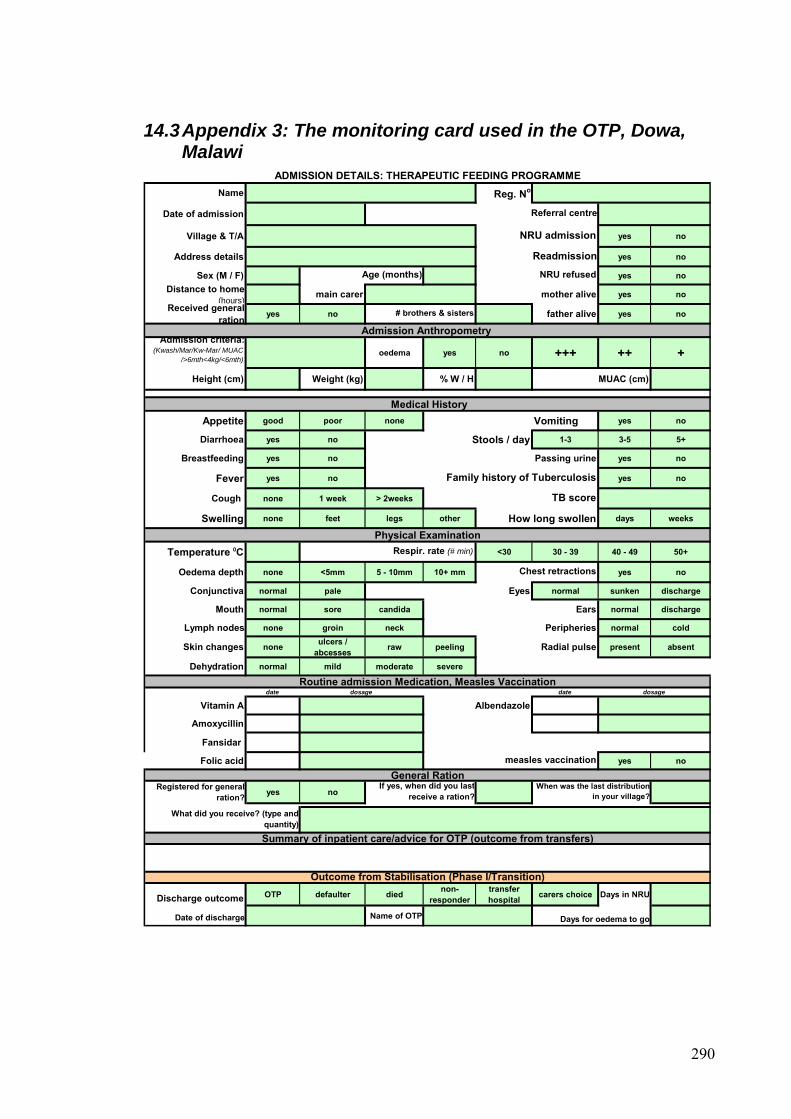
14.3 Appendix 3: The monitoring card used in the OTP, Dowa, Malawi
Name Reg. No
Date of admission
Village & T/A yes no
Address details yes no
Sex (M / F) yes noDistance to home
(hours)main carer mother alive yes no
Received general ration yes no father alive yes no
Admission Anthropometry Admission criteria:
(Kwash/Mar/Kw-Mar/ MUAC />6mth<4kg/<6mth)
oedema yes no +++ ++ +
Height (cm) Weight (kg) % W / H MUAC (cm)
Medical HistoryAppetite good poor none Vomiting yes no
Diarrhoea yes no Stools / day 1-3 3-5 5+
Breastfeeding yes no Passing urine yes no
Fever yes no yes no
Cough none 1 week > 2weeks
Swelling none feet legs other How long swollen days weeks
Physical ExaminationTemperature 0C <30 30 - 39 40 - 49 50+
Oedema depth none <5mm 5 - 10mm 10+ mm yes no
Conjunctiva normal pale Eyes normal sunken discharge
Mouth normal sore candida Ears normal discharge
Lymph nodes none groin neck Peripheries normal cold
Skin changes none ulcers / abcesses raw peeling Radial pulse present absent
Dehydration normal mild moderate severe
Routine admission Medication, Measles Vaccinationdate dosage date dosage
Vitamin A Albendazole
Amoxycillin
Fansidar
Folic acid yes no
General RationRegistered for general
ration? yes no
Summary of inpatient care/advice for OTP (outcome from transfers)
Discharge outcome OTP defaulter died non- responder
transfer hospital carers choice Days in NRU
Date of discharge Name of OTP
Family history of Tuberculosis
TB score
measles vaccination
If yes, when did you lastreceive a ration?
When was the last distributionin your village?
ADMISSION DETAILS: THERAPEUTIC FEEDING PROGRAMME
Referral centre
Readmission
NRU admission
Outcome from Stabilisation (Phase I/Transition)
Respir. rate (# min)
Chest retractions
Days for oedema to go
What did you receive? (type andquantity)
Age (months) NRU refused
# brothers & sisters
290

NAMEWeek discharge 1 2 3 4 5 6 7 8 9 10 11 12 13 14 15 16
Date
OTP / HC Anthropometry
Weight
Weight loss * (Y/N)
Height (cm)
Wt/Ht (%)
MUAC (cm)Oedema
(+ ++ +++)History
Diarrhoea(# days)
Vomiting(# days)
Fever(# days)
Cough(# days)
Extra HC visits (#)
Appetite (good/poor)
Physical examinationPlumpynut Test
(good/poor)
Temp. 0C
Resp. Rate(# / min)
Dehydrated (Y/N)
Anaemia (Y/N)
SuperficialInfection (Y/N)
other problems /
comm
entsadditional m
edicines
Plumpynut (# sachets)
PROBLEM (Y/N)
Outcome **
name examiner
Transfers: Died YES NO Cause
HS A CGM CNV
FOLLOW UP: OUTPATIENT THERAPEUTIC FEEDING PROGRAMME
** OUTCOME: A=absent D=defaulter (2 consecutive visits) R=readmission NRU H=Hospital D=died SFP=discharged cured
* WEIGHT CHANGES FOR MARASMICS: if below admission WT on week 3 refer to NRU If no WT gain by week 5 refer to NRU
Named community worker
REG No
If yes, days until died
291

292
Health Centre
OTP Week 1 2 3 4 5 6 7 8 9 10 11 12 13 14 15 16
DATE
New Admission
Re-admission
Returned transfer
Recovered
Died
Default
Transfer
NUMBER IN PROGRAMME
EXIT
SA
DMIS
SIO
NS
Outpatient Therapeutic Programme (OTP) Malawi: Health centre weekly tally sheet
14.4 Appendix 4: OTP weekly report, Dowa Malawi

14.5 Appendix 5: Example of database for data input and a programme monitoring report, Dowa Malawi.
Dist. Team HC name
TOTAL
MONTH New adm.
Adm. from SFP
Adm. from NRU
Re-adm. from SFP
returned NRU
readm.
returned from
hospital
returned after
default
moved from other OTP
disch.cured to SFP
died default refer hosp.
re-refer NRU
refer to other OTP
TOTAL ADM'D
TOTAL EXITS
TOTAL END LAST
DISTR.
TOTAL IN OTP
3 east DOWA HOSPITAL SEP 0 0 3 0 0 0 0 0 0 0 0 0 0 0 3 0 3
0 0 0
3 0 0
4 0 3
5 1 0
0 0 0
4 0 0
3 0 0
0
7 0 0
5 0 0
5 0 0
11 0 0
7 0 0
0
0
0
0 0 6
0 0 0
1 1 3
1 1 7
1 0 4
2 0 0
1 0 4
0 0 3
0
3 0 7
1 0 5
1 1 5
6 6 11
0 1 7
0
0
0
6
3 east CHANKHUNGU SEP 0 0 0 0 0 0 0 0 0 0 0 0 0 0 -
3 east THONJE SEP 0 0 3 0 0 0 0 0 0 0 0 0 0 0 3
3 east MTENGOWATHENGA SEP 1 0 3 0 0 0 0 0 0 0 0 0 0 0 7
3 east MSAKAMBEWA SEP 0 0 5 0 0 0 0 0 0 0 0 0 1 0 4
3 east NALUNGA SEP 0 0 0 0 0 0 0 0 0 0 0 0 0 0 -
3 east MATEKENYA SEP 2 0 2 0 0 0 0 0 0 0 0 0 0 0 4
3 east MVERA MISSION SEP 0 0 3 0 0 0 0 0 0 0 0 0 0 0 3
3 east MADISI 0 0 -
3 west NAMBUMA SEP 0 0 7 0 0 0 0 0 0 0 0 0 0 0 7
3 west DZOOLE SEP 0 0 5 0 0 0 0 0 0 0 0 0 0 0 5
3 west KAYEMBE SEP 1 0 4 0 0 0 0 0 0 0 0 0 0 0 5
3 west CHISEPO SEP 0 0 11 0 0 0 0 0 0 0 0 0 0 0 11
3 west MPONELA SEP 1 0 6 0 0 0 0 0 0 0 0 0 0 0 7
3 west CHAKHAZA 0 0 -
3 west CHINKHWILI 0 0 -
3 west BOWE 0 0 -
4 east DOWA HOSPITAL SEP 0 0 0 0 0 0 0 0 0 0 0 0 0 0 6
4 east CHANKHUNGU SEP 0 0 0 0 0 0 0 0 0 0 0 0 0 0 -
4 east THONJE SEP 0 0 1 0 0 0 0 0 0 0 0 0 1 0 3
4 east MTENGOWATHENGA SEP 0 0 1 0 0 0 0 0 0 0 1 0 0 0 7
4 east MSAKAMBEWA SEP 0 0 0 0 1 0 0 0 0 0 0 0 0 0 5
4 east NALUNGA SEP 0 0 2 0 0 0 0 0 0 0 0 0 0 0 2
4 east MATEKENYA SEP 0 0 1 0 0 0 0 0 0 0 0 0 0 0 5
4 east MVERA MISSION SEP 0 0 0 0 0 0 0 0 0 0 0 0 0 0 3
4 east MADISI 0 0 -
4 west NAMBUMA SEP 0 0 3 0 0 0 0 0 0 0 0 0 0 0 10
4 west DZOOLE SEP 0 0 1 0 0 0 0 0 0 0 0 0 0 0 6
4 west KAYEMBE SEP 0 0 1 0 0 0 0 0 0 0 1 0 0 0 5
4 west CHISEPO SEP 0 0 6 0 0 0 0 0 6 0 0 0 0 0 11
4 west MPONELA SEP 0 0 0 0 0 0 0 0 0 0 1 0 0 0 6
4 west CHAKHAZA 0 0 -
4 west CHINKHWILI 0 0 -
4 west BOWE 0 0 -
DOWA OTP DATABASE, MALAWI
ADMISSIONS EXITS CHILDREN
293

Admissions, Exits & Total in OTP Programme, Dowa (Aug 02 - Feb 03)
0
50
100
150
200
250
300
350
1 2 3 4 5 6 7 8 9 10 11 12 13 14 15
Distribution round
Num
ber b
enef
icia
ries
ADMISSIONSEXITSTOTAL IN PROGRAMME
OTP ADMISSIONS (Aug 02 - Feb 03)
11%
82%
2%
1% 1%3%
New admissionsAdm.from-SFPAdm.from-NRURe-adm.from-SFPReturned NRU-readm.Returned from-hospitalReturned after-defaultMoved from other-OTP
OTP EXITS (Aug 02 - Feb 03)
74%
4%
3%9%
10% Disch.cured-to SFP
Died.
Default.
Refer hosp
Re-refer to NRU
Refer to-other OTP
294

14.6 Appendix 6: Programme procedures for implementing staff, Dowa Malawi
STEP 1: ADMISSIONMeasure weight, height, MUAC and oedemaCalculate the admission criteriaAssign ID number, record on red bracelet and attach to child's wrist
STEP 2: ASSESSMENTComplete the front page of the monitoring card:
- Take medical history- Complete physical examination
- If 'YES' refer child to the closest NRU
STEP 3: ALLOCATE FOLLOW UP PERSONNEL
STEP 4: MAKE NEXT APPOINTMENT
All children returning home with a Plumpynut ration should be put in contact with a community worker. A community worker can be any person who has received training in conducting home support visits. This might be an HSA, a community volunteer/growth monitor, a TBA or a mother whose child has been successfully treated in the programme.
Decide whether child needs NRU stabilisation (see 'Rapid Examination Checklist')
Before returning home, each mother should be given an appointment at the health centre for the same time the following week.
Outpatient Therapeutic Programme (OTP) Malawi: Procedures for Health Centre Staff
ON ADMISSION
The community worker to discuss each message on the basic education message sheet with the mother.
- If 'NO' give admission medication, 1 week supply of Plumpynut and 1 week supply Lukini Phala (or equivalent)
295

STEP 1: ASSESSMENT
- Anthropometry- Medical history- Physical examination
STEP 2: HIGHLIGHT PRIORITIES FOR FOLLOW UP
STEP 3: IDENTIFY NON RESPONDERS AND ACTION
STEP 1: DISCHARGE
STEP 1: WEEKLY
File all admission and discharge cardsSTEP 2: MONTHLY
A referral to hospital for tests (such as for TB) may be necessary. Where referral is made follow up of test results and any treatment prescribed will be necessary. As STEP 2, with the community worker, highlight areas for special attention during home visits. This might include an assessment of caring capacity/food security to help assess the risk of the Plumpynut being shared among household members. Advice, discussion and links with other community based support programmes can all be utilised to reduce this risk.
} Use 'Checklist for Rapid Examination'
Complete each section of the follow-up section on the monitoring card
Record any action taken and/or medication given in response to any health problemsDiscuss with the mother/carer any action taken and advice for home care.
FOLLOW UP VISITS TO HEALTH CENTRE
After each distribution fill in the weekly tally sheet report from the monitoring cards
At the end of each month fill in the monthly health centre reporting format
Discharge according to criteria and admit for supplementary feeding support for 3 months
REPORTING
ON DISCHARGE
Refer back to an NRU if condition deteriorates significantly to fit criteria as listed on the 'checklist for rapid examination'
Look at each monitoring card with the relevant community worker and highlight areas for special attention during home visits.
A child in the programme for 5 weeks with no weight gain or weight fluctuating between small gains and losses should be considered as a non responder. Pay special attention to these children during medical assessment and prescribe a second line antibiotic where appropriate
296

14.7 Appendix 7: RUTF ration chart for the OTP, Dowa RUTF per Week RUTF per Day
Sachets Pots Sachets Pots
4.0 - 4.4 10 4 1.5 0.5
4.5 - 4.9 11 4 1.5 0.5
5.0 - 5.4 13 5 2 0.75
5.5 - 5.9 14 5 2 0.75
6.0 - 6.4 15 6 2 0.75
6.5 - 6.9 16 6 2.5 1.0
7.0 - 7.4 17 6 2.5 1.0
7.5 - 7.9 19 7 3 1.0
8.0 - 8.4 20 7 3 1.0
8.5 - 8.9 21 8 3 1.0
9.0 - 9.4 22 8 3 1.0
9.5 - 9.9 24 9 3.5 1.25
10.0 - 10.4 25 9 3.5 1.25
10.5 - 10.9 26 9 4 1.5
11.0 - 11.4 27 10 4 1.5
11.5 - 11.9 28 10 4 1.5
12.0 - 12.4 30 11 4.5 1.5
12.5 - 12.9 31 11 4.5 1.5
13.0 - 13.4 32 12 4.5 1.5
13.5 - 13.9 33 12 5 1.75
14.0 - 14.4 35 13 5 1.75
14.5 - 14.9 36 13 5 1.75
37 13 5.5 2.0> 15.0
Weight of child
(kg)
297

14.8 Appendix 8: Medical protocol for the CTC programme, Dowa NAME OF PRODUCT
ADMISSION AGE PRESCRIPTION POSOLOGY LENGTH OF TREATMENT
< 6 months 50 000 IU 1 drops (1/4 capsule)
6 months to < 1 year 100 000 IU 3 drops (1/2 capsule)> = 1 year, adolescent(>8kg) 200 000 IU 6 drops (one capsule)
FOLIC ACID YES All beneficiaries 5 mg Single dose Single dose at admission
< 1 year DO NOT USE NOTHING XXX1 to < 2 years 200 mg Single dose
> = 2 years 400 mg Single dose
* IF USING MEBENDAZOLE: <1 year: nothing 1 - <2 years: 250mg >=2 years: 500mg unique dose
IRON: This should NOT
EXCEPT
less than 4 kg
(curative dose
Do not repeat the dosage of vitamin A if the child is readmitted or has already received curative dose of Vitamin A during the LAST 30 days
EXCEPT under 2 kg
be given immediately as contained in RUTF.
If child is diagnosed with anaemia then treat from week 3 of admission according to the MoH protocol for the treatment of anaemia.
Single dose
One dose at admission, day 2 and day 14
7 days (or 10 days if needed)
Single dose at admission
AMOXYCILLIN YES
All beneficiaries
3 times / day
VITAMIN A )
Single dose at discharge from NRU or immediately on admission if OTP
direct
25 mg/kg
ALBENDAZOLE* YES
YES
60 mg/kg/dayAll beneficiaries
FANSIDAR YES
298

299
RAPID EXAMINATION Action REFERAL CRITERIA to NRU CAUTION: arrange home visit if possible OKAY: CONTINUE CTC
CRITERIA OF ADMISSION GRADE OEDEMA grade +++ or ++ grade + No oedemaAGE <6 months
APPETITE / ANOREXIC OBSERVE CHILD EATING TRIAL DOSE RUTF
Refuses to eat or has difficulty taking/swallowing the RUTF Eats with encouragement Tries and asks for more
Fever: >= 39oC Between (36.5oC and 39oC)Hypothermia: < 35oC (under-arm) Between (35oC and 35.5oC)
> 60 respirations/minute for under 2-months
> 50 respirations/minute from 2 to 12 months
> 40 respirations/minute from 1 to 5 years
> 30 respirations/minute for over 5 year-olds
No urine output, no tears
Fontanelle depressed
Mouth dry, Eyes recently sunken
History of acute diarrhoea & vomiting
Hb READING < 7 g/100ml Between 7 and 9 g/100ml >9 g/100ml
CHECK NAILS, EYES Very pale, difficulty breathing Slightly pale - prescribe ferrous-folate Colouration
SUPERFICIAL INFECTIONCHECK EARS, BODY FOR DISCHARGE/PUS, INFECTION, ABCESS
Discharges from ears, extensive absesses, extensive sores
Slight skin irritations eg scabies, small abcess easy to drain, small sores not associated wth oedema
No infections
Very weak, apathetic, unconscious
Fitting/convulsionsAlert, conscious
CONSIDER LAST 3 WEIGHTS Weight gained
Normal range
Normal urine, mouth not dry
WEIGHT CHANGES
AXILLIARY TEMPERATURE Normal range (35.5 - 36.5oC)TEMPERATURE
RESPIRATION RATE (rr) RR FOR ONE MINUTE
HYDRATION STATUS
CHECK URINE OUTPUT, RECENT D&V, FONTANELLE, MOUTH DRY, RECENT EYE CHANGES
ANAEMIA
mouth a little dry
Static weight or weight fluctuating bewteen small gains and loss
Drowsy, quietALERTNESS REGARD BEHAVIOUR
weight loss for 3 consecutive weeks or static weight for 5 consecutive weeks
14.9 Appendix 9: Action protocol, OTP Dowa

300
14.10 Appendix 10: Education message sheet for OTP, Dowa
EDUCATION MESSAGE SHEET FOR COMMUNITY THERAPEUTIC CARE *
1. Thin/sick child + RUTF = Fat/healthy child – RUTF is a medicine for sick
children.
2. Sick children don’t like to eat. Give small regular meals of RUTF and encourage
the child to eat often and during the night.
3. For young children continue breast feeding on demand.
4. Always offer plenty of water (boiled) to drink, while eating RUTF.
5. Always use soap for child’s hands and face before feeding. Keep food clean and
covered.
6. Sick children get cold quickly. Always keep the child covered and warm.
7. With diarrhoea NEVER stop feeding. Give EXTRA food and EXTRA water.
* This sheet includes the basic essential messages only and should be expanded to
include more detail and more messages if time/capacity allows.
Related Documents