Community Action Plan for Redding, California LOCAL FOODS, LOCAL PLACES TECHNICAL ASSISTANCE December 2020

Welcome message from author
This document is posted to help you gain knowledge. Please leave a comment to let me know what you think about it! Share it to your friends and learn new things together.
Transcript

Community Action Plan for Redding, California LOCAL FOODS, LOCAL PLACES TECHNICAL ASSISTANCE
December 2020
For more information about Local Foods, Local Places visit: https://www.epa.gov/smartgrowth/local-foods-local-places
CONTACT INFORMATION: U.S. Environmental Protection Agency Project Contact: Andrew Moiseff Office of Community Revitalization U.S. Environmental Protection Agency 1200 Pennsylvania Ave. NW (MC 1807T) Washington, DC 20460 Phone: (202) 564-3007 Email: [email protected]
Redding Contact: Mary Messier Shasta County Health and Human Services Agency 2650 Breslauer Way Redding CA 96001 Phone: (530) 245-6639 Email: [email protected]
Cover photo credits: Top row and bottom right, screen captures from the Viva Downtown Local Foods, Local Places virtual tour video. https://youtu.be/Dze_d1E-E2k Bottom left: Redding Farmers Market Facebook page.

LOCAL FOODS, LOCAL PLACES COMMUNITY ACTION PLAN Redding, California
1
COMMUNITY STORY
The City of Redding is located at the northwestern end of the Central Valley, where the Valley meets the foothills of the Cascades Mountain Range. The city is the county seat of Shasta County and lies along the Sacramento River. Redding received its name from Benjamin Redding, a land agent for the Central Pacific Railroad, who purchased the land the city sits on for the northern terminus of the rail line in 1868. In the process of building the terminus, the railroad also built the town that was officially incorporated in 1887.1 The city’s economic trajectory has followed various booms and declines. Its location near copper and iron mines led to the town’s expansion in the early 20th century, to be followed by construction of the Shasta Dam in 1944 and the subsequent boom in tourism, and the boom and decline of the timber industry into the late 20th century.2
The region surrounding Redding has been inhabited by the indigenous Winnemem Wintu peoples for more than 6,000 years. Their name translates to “The Middle Water People”, as their lands were bordered by the McCloud, Upper Sacramento, and Pit Rivers and was a thriving area of commerce and trade.3 In the early 1800s, there were approximately 12,000-15,000 members of the Wintun Tribe. The first Europeans began arriving with Spanish settlers by 1808, and the Hudson Bay Company trappers arrived sometime before 1832. In 1844, much of their tribal lands were taken by the Mexican Land Grant given to Pierson B. Reading.4 Followed by the influx of European-Americans and the introduction of cattle, hogs, and sheep, the construction of dams, and mineral processing plants in the 1880s and early 1900s, the Wintun suffered heavily. Today there are over 2,500 people of Wintun
1 Shasta County Historical Society: https://shastahistorical.org/how-redding-got-its-name/. Accessed October 30, 2020. 2 City of Redding History: https://www.cityofredding.org/about-us/brief-history-of-redding. Accessed October 30, 2020. 3 Winnemem Wintu Tribal Website: http://www.winnememwintu.us/who-we-are/. Accessed November 2, 2020.4 City of Redding History. Accessed November 2, 2020.
Figure 1 - Top context map of downtown Redding, Shasta County. Bottom Market Street (color) closed to cars and historic (black and white). Credit: City of Redding, Downtown Plan, Placeworks, Shasta Historical Society.
LOCAL FOODS, LOCAL PLACES COMMUNITY ACTION PLAN Redding, California
2
descent with many living on the Round Valley Reservation, and on the Colusa, Cortina, Grindstone Creek, Redding, and Rumsey rancherias.5
The development of the copper and iron ore industries brought significant growth to Redding in the early 20th century. However, the subsequent decline in mineral extraction caused a significant decline in population by 1920. It was not until the development of the Shasta Dam on the Sacramento River beginning in the 1930’s and completed in 1944 that Redding saw its population double. The Shasta Dam brought an influx of construction workers, followed by tourism surrounding the newly formed Lake Shasta. Redding continued to grow with the development of the lumber industry throughout the 1950’s and the construction of two new dams: Whiskeytown and Keswick.6 The lakes created by these dams, as well as access to Mt. Shasta, Mt. Lassen, and the Trinity Alps helped make Redding a center for regional tourism. Moreover, Interstate 5, running North-South along the city, was completed in the 1970’s, adding additional benefits for trade, commerce and tourism with the increased access for travelers and businesses to the area. Nevertheless, with the decline of the timber industry in the 1970’s, the City of Redding experienced another economic slump leading to the closure of lumber mills and the loss of well-paid jobs. Due to Redding’s designation as the county seat for Shasta County and its central geographic location, Redding’s retail, commerce, health care, education, tourism, and government services sectors came to the forefront of economic activity by the 1990’s.7
Much of this development followed a pattern that began in the 1960’s with development of malls and shopping centers outside of the downtown area. This pattern was reinforced with much of the new commercial development occurring along the Interstate 5 corridor. As a result, Redding’s downtown core suffered from increased vacancies and accompanying low employment and higher poverty rates.
The City of Redding began a concerted effort to revitalize downtown through the development of transportation gateways and improvements by the Redding Redevelopment Agency in the 1990’s. These efforts were followed by the adoption of the Downtown Specific Plan in 2001 that created development guidelines and regulations for creating greater economic vitality downtown. These efforts led to various
5 California Indians and Their Reservations, San Diego State University.
http://infodome.sdsu.edu/research/guides/calindians/calinddictty.shtml. Accessed November 2, 2020. 6 City of Redding History. Accessed November 2, 2020.7“Downtown Redding Specific Plan Update, April 2018. https://www.cityofredding.org/home/showdocument?id=5529. Accessed November 2, 2020.
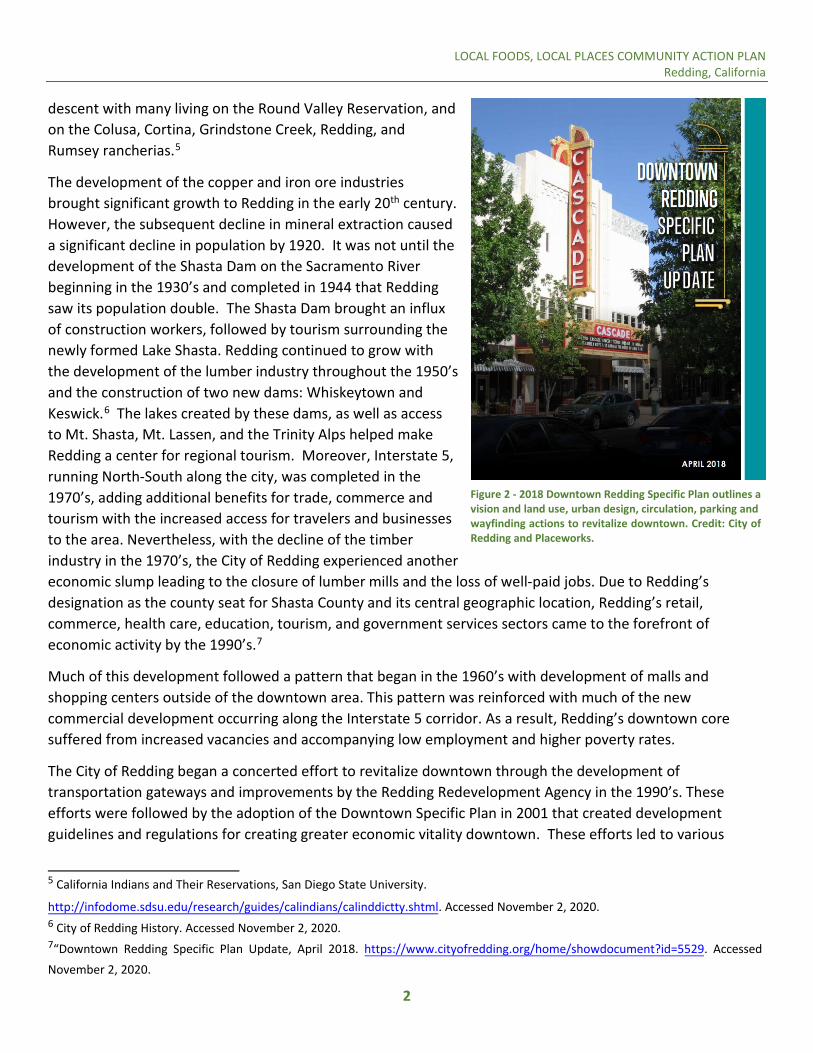
Figure 2 - 2018 Downtown Redding Specific Plan outlines a vision and land use, urban design, circulation, parking and wayfinding actions to revitalize downtown. Credit: City of Redding and Placeworks.

LOCAL FOODS, LOCAL PLACES COMMUNITY ACTION PLAN Redding, California
3
improvements in the downtown streetscapes and core commercial and residential developments. The plan was updated in 2018 to address the changes to date and assess new opportunities.8 Yet, the updated plan had not addressed the challenges and potential for incorporating local food access and infrastructure as a driver of economic vitality in the downtown core.
By 2019, Redding’s population had increased to approximately 90,000. Yet, even with the efforts to date, its downtown core had a population of only 1500, marked by poverty, with extremely low average household incomes ($16,689) and low employment with only 36% of adults employed in this Census Tract9. This Census Tract has one of the shortest average life expectancies in all of Shasta County and a lower “California Healthy Places Index” (which considers community conditions that predict life expectancy) than 98% of Census Tracts in California.10
As revitalization efforts continue, Redding’s community champions have placed increased emphasis on utilizing opportunities in the local food system to advance downtown revitalization, support local entrepreneurs, and increase access to local and healthy foods for its residents. With two new mixed-use developments nearing completion and two additional projects underway to bring much needed affordable and market rate housing to downtown in 2020-202111, Redding is focused on incorporating local food access and opportunities to existing and new residents. This focus on local foods made Redding a good match with the federal Local Foods, Local Places technical assistance program. In 2019, the City of Redding and community partners requested assistance for Redding through Local Foods, Local Places to develop an action plan for building the local food system, enlivening the city’s downtown core, improving food access, and supporting a healthier and more vibrant Redding.
The goals of the Local Foods, Local Places program are to:
▪ Improve coordination and collaboration within and across the local food and downtownredevelopment efforts.
▪ Ensure access to affordable, fresh and healthy food for people who live or work downtown.
8 Ibid. Pages 16-18. 9 American Community Survey: Census Tract 101 Shasta County: https://data.redding.com/american-community-survey/block_group_2_census_tract_101_shasta_county_california/population/total-population/yty/15000US060890101002/, Accessed November 5, 2020. 10 Ibid. 11 City of Redding. https://www.cityofredding.org/departments/redevelopment.
Steve Bade, City of Redding Trisha Funk, Women's Business Center at JEDI Janessa Hartmann, Public Health Rachel Hatch, The McConnell Foundation April Jurisich, Shasta County Health & Human Services Agency Mary Messier, Healthy Shasta (primary point of contact) Amy Pendergast, Healthy Shasta John Truitt, Viva Downtown Redding
Local Foods, Local Places Local Planning Committee
Figure 3 - Local planning committee for the workshop, a full list of workshop participants is available in Appendix B.
LOCAL FOODS, LOCAL PLACES COMMUNITY ACTION PLAN Redding, California
4
▪ Evaluate and enhance the local food system andeconomy as a driver of downtown revitalization.
The Local Foods, Local Places program is supported by the U.S. Environmental Protection Agency and the U.S. Department of Agriculture. Redding is one of 16 communities across the United States selected to participate in the program in 2020 from more than 70 applications.
The Local Foods, Local Places steering committee formed in Redding for this technical assistance award is comprised of a variety of community partners (see Figure 3). They were supported by a technical assistance team of consultants and multiple federal and state agency partners (Figure 4). The Steering Committee decided to focus its technical assistance process on building the local food system, enlivening the city’s downtown core, improving food access, and increasing communication and collaborations.
The remainder of this report and appendices document the technical assistance engagement process, the workshop activities, and most importantly, the outcome: a community action plan to achieve Redding’s goals.
ENGAGEMENT The technical assistance engagement process for Local Foods, Local Places has three phases, illustrated in Figure 5 below. The plan phase consists of three preparation conference calls with the steering committee and technical assistance team to clarify goals and arrange workshop logistics. The convene phase includes the effort’s capstone event—a two and a half-day intensive workshop, typically held in person, but in 2020 because of the COVID-19 pandemic travel restrictions, the event pivoted to a virtual format. The act phase includes three follow up conference calls to finalize a community action plan and strategize on how to maintain momentum generated during the workshop.
The Redding workshop was held as an interactive, virtual Figure 4 - Technical assistance team.
workshop with seven video conferencing sessions of 1.5 hours over a three-day period on October 13-15, 2020. Seventy-eight people registered to participate,
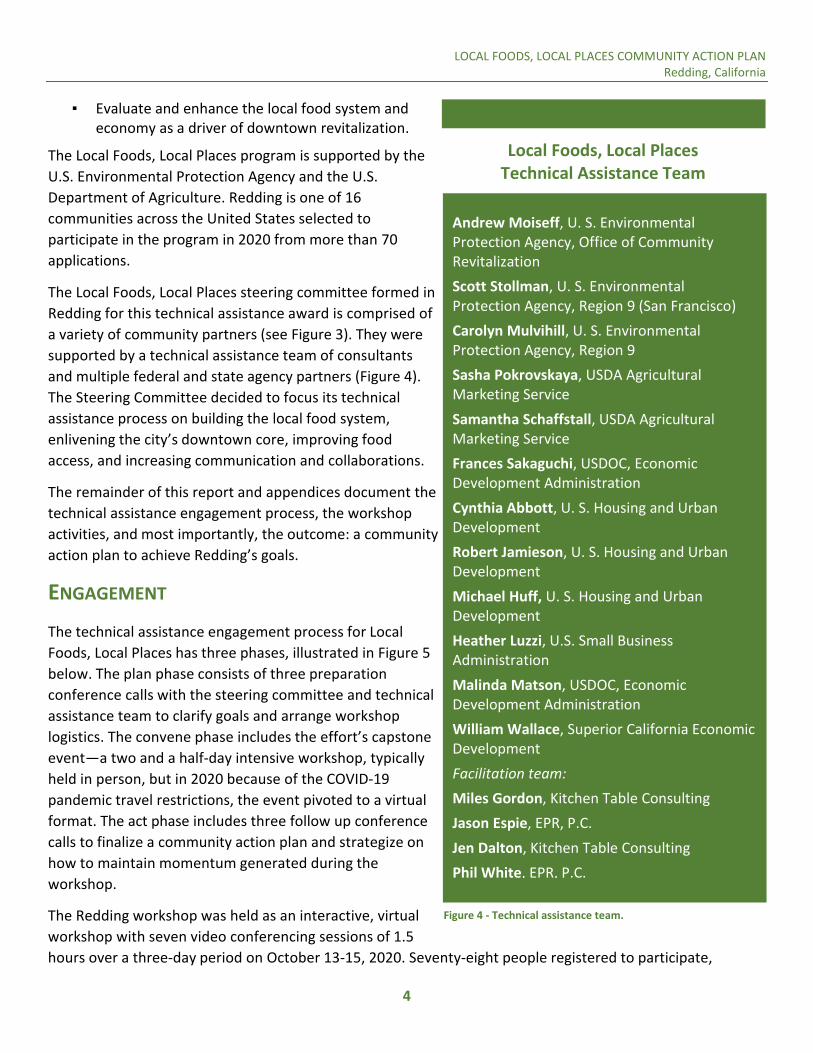
Andrew Moiseff, U. S. Environmental Protection Agency, Office of Community Revitalization Scott Stollman, U. S. Environmental Protection Agency, Region 9 (San Francisco) Carolyn Mulvihill, U. S. Environmental Protection Agency, Region 9 Sasha Pokrovskaya, USDA Agricultural Marketing Service Samantha Schaffstall, USDA Agricultural Marketing Service Frances Sakaguchi, USDOC, Economic Development Administration Cynthia Abbott, U. S. Housing and Urban Development Robert Jamieson, U. S. Housing and Urban Development Michael Huff, U. S. Housing and Urban Development Heather Luzzi, U.S. Small Business Administration Malinda Matson, USDOC, Economic Development Administration William Wallace, Superior California Economic Development Facilitation team: Miles Gordon, Kitchen Table Consulting Jason Espie, EPR, P.C. Jen Dalton, Kitchen Table Consulting Phil White, EPR, P.C.
Local Foods, Local Places Technical Assistance Team

LOCAL FOODS, LOCAL PLACES COMMUNITY ACTION PLAN Redding, California
5
representing the Redding community and various local organizations, and together with fourteen federal partners, participated in one or more workshop sessions. Attendance high was at session one, at around sixty, and participation thereafter averaged 30-40 per session. Figure 7 shows a screenshot of some of the workshop participants. The activities from these sessions are described below. Workshop exercise results are summarized in Appendix A, a list of workshop attendees is provided in Appendix B, a data profile in Appendix C, funding resources in Appendix D, general references in Appendix E, and a list of federal agency descriptions is in Appendix F.
Figure 5 - Local Foods, Local Places technical assistance process diagram.
VISION AND VALUES The opening session of the virtual workshop focused on identifying a vision and articulating values for local foods and placemaking in Redding. Rachel Hatch, Program Officer for Community Vitality at the McConnell Foundation welcomed everyone. After recognizing community partners in producing the workshop and introductions, the technical assistance team gave a short presentation on the Local Foods, Local Places program. Viva Downtown Redding then presented a virtual video tour of Redding to establish a common understanding among participants for moving forward through the technical assistance process. The tour highlighted unique aspects
Figure 6 - The Downtown Redding Virtual Tour video produced for theworkshop. Credit: Viva Downtown. https://youtu.be/Dze_d1E-E2k

LOCAL FOODS, LOCAL PLACES COMMUNITY ACTION PLAN Redding, California
6
of downtown Redding’s history and touched on the successes, challenges, and opportunities within the downtown core, redevelopment, and the food system. Included were the recent opening and relocations of the Shasta College Health Sciences and University Center, the Redding Cultural Arts District, the Riverfront Playhouse, the Redding Food Truck Park, and Enjoy The Store, which are all bringing new energy, attractions, and business opportunities to downtown Redding.
Figure 7 - Group zoom photo, session one.
LOCAL FOODS, LOCAL PLACES COMMUNITY ACTION PLAN Redding, California
7
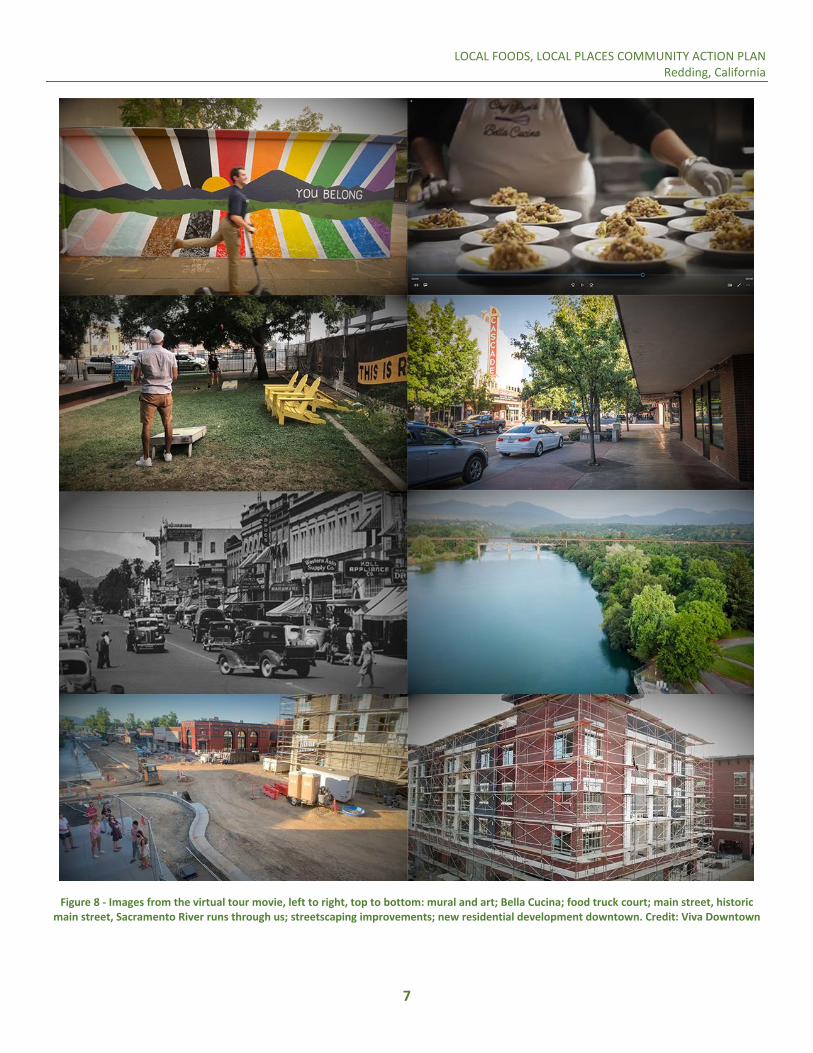
Figure 8 - Images from the virtual tour movie, left to right, top to bottom: mural and art; Bella Cucina; food truck court; main street, historic main street, Sacramento River runs through us; streetscaping improvements; new residential development downtown. Credit: Viva Downtown
LOCAL FOODS, LOCAL PLACES COMMUNITY ACTION PLAN Redding, California
8
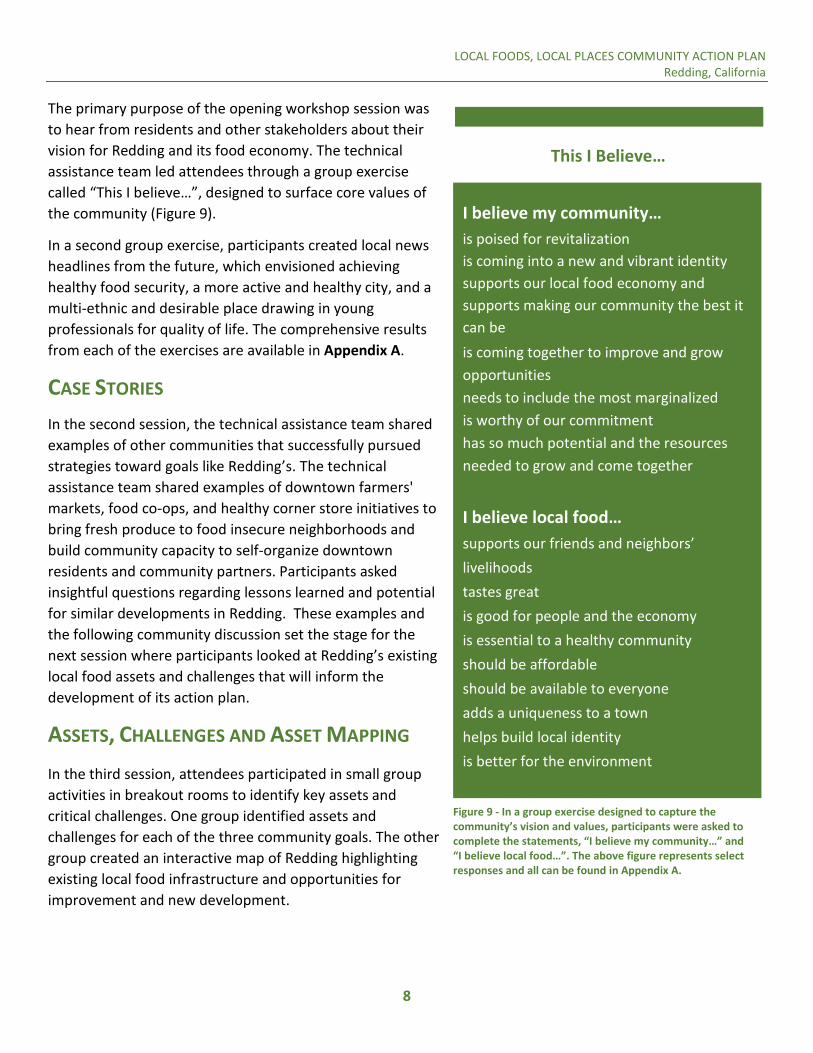
The primary purpose of the opening workshop session was to hear from residents and other stakeholders about their vision for Redding and its food economy. The technical assistance team led attendees through a group exercise called “This I believe…”, designed to surface core values of the community (Figure 9).
In a second group exercise, participants created local news headlines from the future, which envisioned achieving healthy food security, a more active and healthy city, and a multi-ethnic and desirable place drawing in young professionals for quality of life. The comprehensive results from each of the exercises are available in Appendix A.
CASE STORIES In the second session, the technical assistance team shared examples of other communities that successfully pursued strategies toward goals like Redding’s. The technical assistance team shared examples of downtown farmers' markets, food co-ops, and healthy corner store initiatives to bring fresh produce to food insecure neighborhoods and build community capacity to self-organize downtown residents and community partners. Participants asked insightful questions regarding lessons learned and potential for similar developments in Redding. These examples and the following community discussion set the stage for the next session where participants looked at Redding’s existing local food assets and challenges that will inform the development of its action plan.
ASSETS, CHALLENGES AND ASSET MAPPING In the third session, attendees participated in small group activities in breakout rooms to identify key assets and critical challenges. One group identified assets and challenges for each of the three community goals. The other group created an interactive map of Redding highlighting existing local food infrastructure and opportunities for improvement and new development.
I believe my community… is poised for revitalization is coming into a new and vibrant identity supports our local food economy and supports making our community the best it can be is coming together to improve and grow opportunities needs to include the most marginalized is worthy of our commitment has so much potential and the resources needed to grow and come together
I believe local food… supports our friends and neighbors’ livelihoods tastes great is good for people and the economy is essential to a healthy community should be affordable should be available to everyone adds a uniqueness to a town helps build local identity is better for the environment
This I Believe…
Figure 9 - In a group exercise designed to capture the community’s vision and values, participants were asked to complete the statements, “I believe my community…” and “I believe local food…”. The above figure represents select responses and all can be found in Appendix A.

LOCAL FOODS, LOCAL PLACES COMMUNITY ACTION PLAN Redding, California
9
The City of Redding’s new downtown mixed-use and affordable and market-based housing developments were identified as assets for bringing new residents and businesses into the downtown core. The addition of over 200 units in 2020 was noted as a key area to work with new managers and residents to identify issues affecting food access and preferences for potential food businesses. Additionally, the foundational work provided by the Downtown Community Collaborative (a network of organizations/agencies) was identified as an asset to further develop collaboration between policy makers, downtown businesses and elements of the local food groups.
Balancing the financial needs of farmers and the cost of purchasing local food was identified as a barrier. This barrier has been compounded by a lack of communication between local farmers and local purchasers, such as restaurants and markets to begin the work of overcoming this challenge. A full list of results from this exercise is provided in Appendix A.
Participants also identified assets and opportunities on an interactive map. Several sites for a potential farmers' market, pop-up markets and events were identified, with an immediate focus on developing a Plantable Nursery and Cafe for local food production training and sales. The Food Truck Park and various cultural destinations were also identified as key downtown assets. The full mapping results are provided in Appendix A.
Lack of coordination between downtown redevelopment policy makers and local food community
Getting buy in from local restaurants and market to purchase local
Lack of communication between producers and purchasers of local food
Balancing the viability of local farmers with the cost of purchasing local food
Challenges
Figure 11 - A sampling of some challenges identified during the workshop exercises.
New housing developments creating new demand for food businesses
Thriving food delivery during COVID
Pedestrian scale downtown
Engaged community partners with Downtown Community Collaborative
Potential pop-up market and event spaces in empty lots
Existing farmers' market and motivated farmers for new markets
Assets and Opportunities
Figure 110 - A sampling of assets and opportunities identified during the workshop exercises.
LOCAL FOODS, LOCAL PLACES COMMUNITY ACTION PLAN Redding, California
10
ACTION PLAN
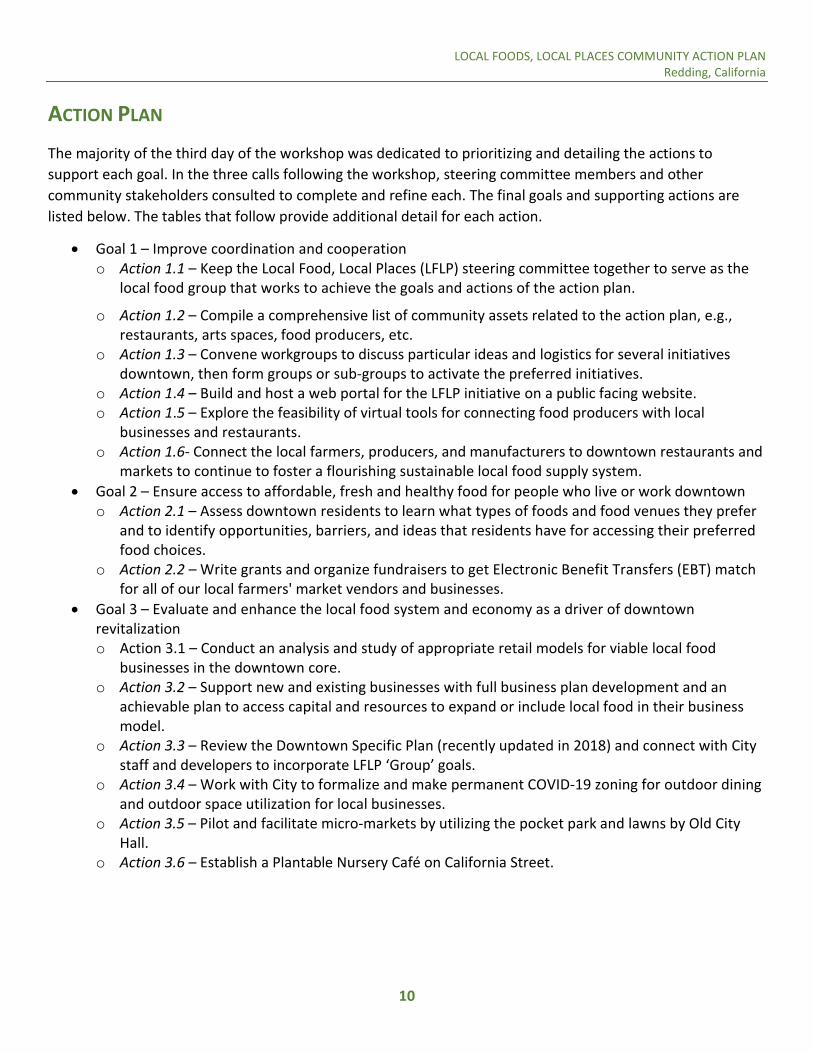
The majority of the third day of the workshop was dedicated to prioritizing and detailing the actions to support each goal. In the three calls following the workshop, steering committee members and other community stakeholders consulted to complete and refine each. The final goals and supporting actions are listed below. The tables that follow provide additional detail for each action.
• Goal 1 – Improve coordination and cooperationo Action 1.1 – Keep the Local Food, Local Places (LFLP) steering committee together to serve as the
local food group that works to achieve the goals and actions of the action plan.
o Action 1.2 – Compile a comprehensive list of community assets related to the action plan, e.g., restaurants, arts spaces, food producers, etc.
o Action 1.3 – Convene workgroups to discuss particular ideas and logistics for several initiatives downtown, then form groups or sub-groups to activate the preferred initiatives.
o Action 1.4 – Build and host a web portal for the LFLP initiative on a public facing website.o Action 1.5 – Explore the feasibility of virtual tools for connecting food producers with local
businesses and restaurants.o Action 1.6- Connect the local farmers, producers, and manufacturers to downtown restaurants and
markets to continue to foster a flourishing sustainable local food supply system.• Goal 2 – Ensure access to affordable, fresh and healthy food for people who live or work downtown
o Action 2.1 – Assess downtown residents to learn what types of foods and food venues they prefer and to identify opportunities, barriers, and ideas that residents have for accessing their preferred food choices.
o Action 2.2 – Write grants and organize fundraisers to get Electronic Benefit Transfers (EBT) match for all of our local farmers' market vendors and businesses.
• Goal 3 – Evaluate and enhance the local food system and economy as a driver of downtown revitalizationo Action 3.1 – Conduct an analysis and study of appropriate retail models for viable local food
businesses in the downtown core.o Action 3.2 – Support new and existing businesses with full business plan development and an
achievable plan to access capital and resources to expand or include local food in their business model.
o Action 3.3 – Review the Downtown Specific Plan (recently updated in 2018) and connect with City staff and developers to incorporate LFLP ‘Group’ goals.
o Action 3.4 – Work with City to formalize and make permanent COVID-19 zoning for outdoor dining and outdoor space utilization for local businesses.
o Action 3.5 – Pilot and facilitate micro-markets by utilizing the pocket park and lawns by Old City Hall.
o Action 3.6 – Establish a Plantable Nursery Café on California Street.
LOCAL FOODS, LOCAL PLACES COMMUNITY ACTION PLAN Redding, California
11
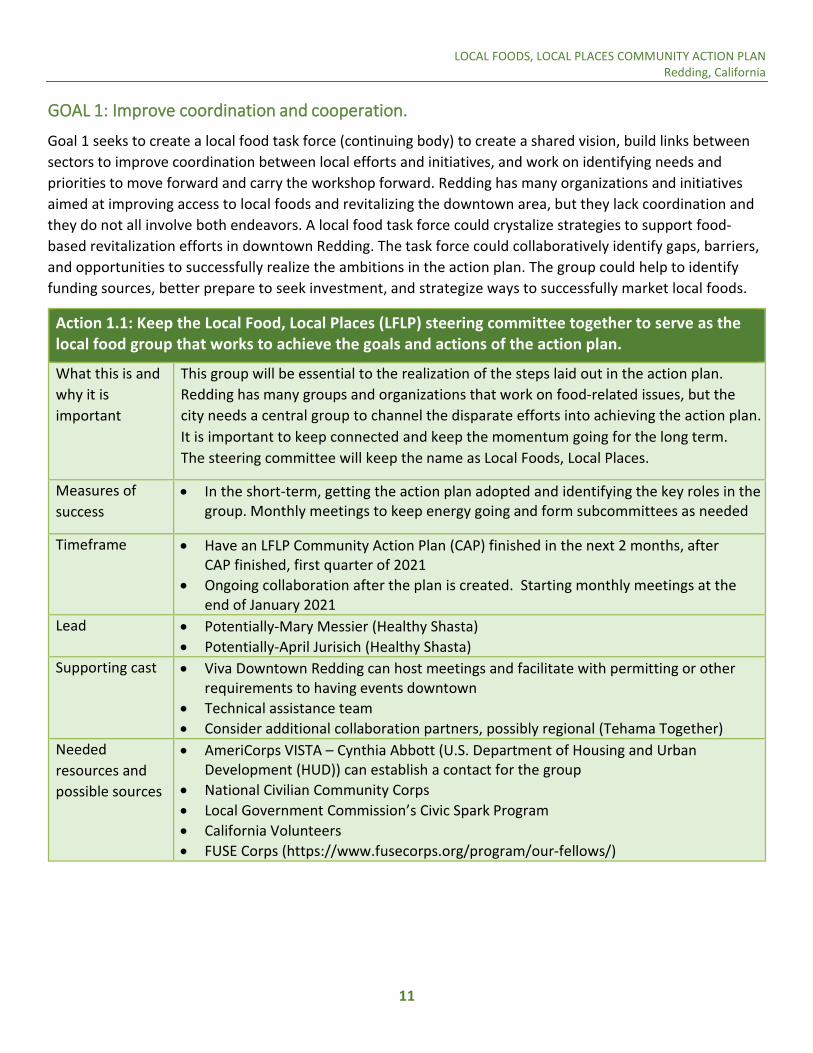
GOAL 1: Improve coordination and cooperation.
Goal 1 seeks to create a local food task force (continuing body) to create a shared vision, build links between sectors to improve coordination between local efforts and initiatives, and work on identifying needs and priorities to move forward and carry the workshop forward. Redding has many organizations and initiatives aimed at improving access to local foods and revitalizing the downtown area, but they lack coordination and they do not all involve both endeavors. A local food task force could crystalize strategies to support food-based revitalization efforts in downtown Redding. The task force could collaboratively identify gaps, barriers, and opportunities to successfully realize the ambitions in the action plan. The group could help to identify funding sources, better prepare to seek investment, and strategize ways to successfully market local foods.
Action 1.1: Keep the Local Food, Local Places (LFLP) steering committee together to serve as the local food group that works to achieve the goals and actions of the action plan.
What this is and why it is important
This group will be essential to the realization of the steps laid out in the action plan. Redding has many groups and organizations that work on food-related issues, but the city needs a central group to channel the disparate efforts into achieving the action plan. It is important to keep connected and keep the momentum going for the long term.The steering committee will keep the name as Local Foods, Local Places.
Measures of success
• In the short-term, getting the action plan adopted and identifying the key roles in thegroup. Monthly meetings to keep energy going and form subcommittees as needed
Timeframe • Have an LFLP Community Action Plan (CAP) finished in the next 2 months, after CAP finished, first quarter of 2021
• Ongoing collaboration after the plan is created. Starting monthly meetings at the end of January 2021
Lead • Potentially-Mary Messier (Healthy Shasta)• Potentially-April Jurisich (Healthy Shasta)
Supporting cast • Viva Downtown Redding can host meetings and facilitate with permitting or otherrequirements to having events downtown
• Technical assistance team• Consider additional collaboration partners, possibly regional (Tehama Together)
Needed resources and possible sources
• AmeriCorps VISTA – Cynthia Abbott (U.S. Department of Housing and UrbanDevelopment (HUD)) can establish a contact for the group
• National Civilian Community Corps• Local Government Commission’s Civic Spark Program• California Volunteers• FUSE Corps (https://www.fusecorps.org/program/our-fellows/)
LOCAL FOODS, LOCAL PLACES COMMUNITY ACTION PLAN Redding, California
12
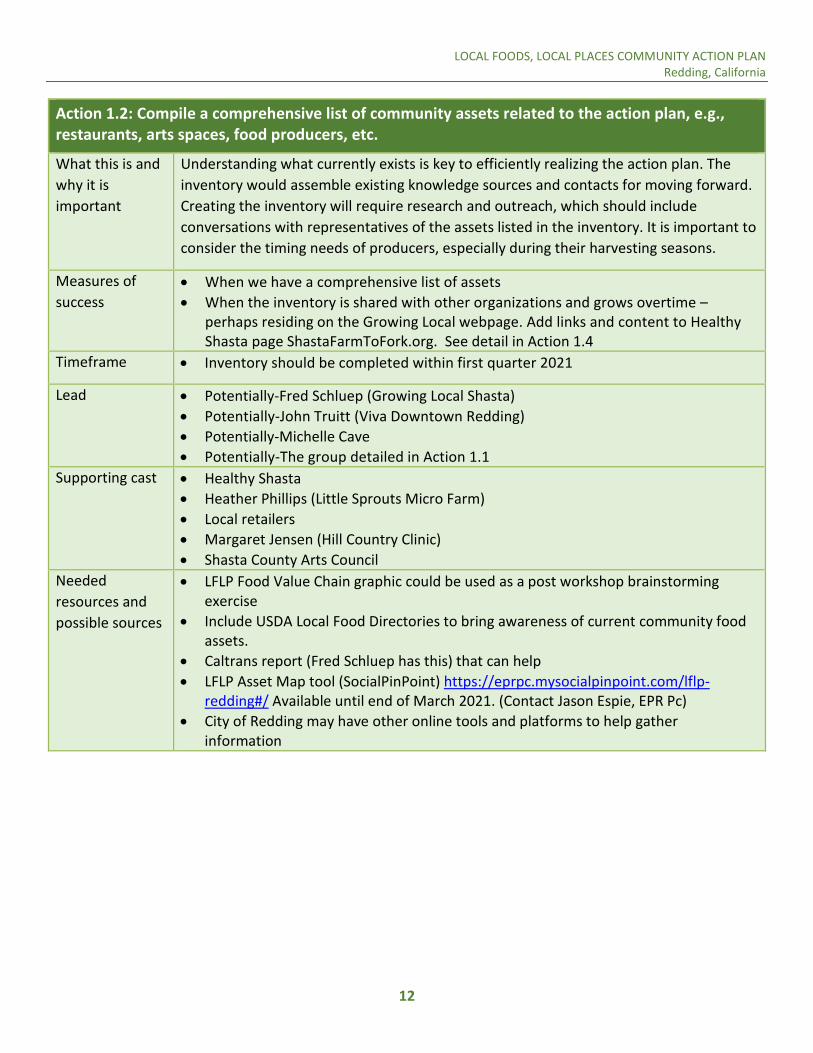
Action 1.2: Compile a comprehensive list of community assets related to the action plan, e.g., restaurants, arts spaces, food producers, etc.
What this is and why it is important
Understanding what currently exists is key to efficiently realizing the action plan. The inventory would assemble existing knowledge sources and contacts for moving forward. Creating the inventory will require research and outreach, which should include conversations with representatives of the assets listed in the inventory. It is important to consider the timing needs of producers, especially during their harvesting seasons.
Measures of success
• When we have a comprehensive list of assets• When the inventory is shared with other organizations and grows overtime –
perhaps residing on the Growing Local webpage. Add links and content to HealthyShasta page ShastaFarmToFork.org. See detail in Action 1.4
Timeframe • Inventory should be completed within first quarter 2021
Lead • Potentially-Fred Schluep (Growing Local Shasta)• Potentially-John Truitt (Viva Downtown Redding)• Potentially-Michelle Cave• Potentially-The group detailed in Action 1.1
Supporting cast • Healthy Shasta• Heather Phillips (Little Sprouts Micro Farm)• Local retailers• Margaret Jensen (Hill Country Clinic)• Shasta County Arts Council
Needed resources and possible sources
• LFLP Food Value Chain graphic could be used as a post workshop brainstormingexercise
• Include USDA Local Food Directories to bring awareness of current community foodassets.
• Caltrans report (Fred Schluep has this) that can help• LFLP Asset Map tool (SocialPinPoint) https://eprpc.mysocialpinpoint.com/lflp-
redding#/ Available until end of March 2021. (Contact Jason Espie, EPR Pc)• City of Redding may have other online tools and platforms to help gather
information

LOCAL FOODS, LOCAL PLACES COMMUNITY ACTION PLAN Redding, California
13
Action 1.3: Convene workgroups to discuss particular ideas and logistics for several initiatives downtown, then form groups or sub-groups to activate the preferred initiatives.
What this is and why it is important
There is desire for a number of initiatives downtown, for example, pop-up markets, an alternative farmers' market, or farm-to-table events. A group is needed to flesh out the details of realizing these initiatives, such as space requirements. A questionnaire for the public to gauge the desire for various activities could help steer the group’s discussions. Assess our opportunities and goals, and then determine groups or subgroups to make these happen.
Measures of success
• Whether the contacts listed in the inventory in Action 1.2 participate in thediscussions
• When food elements are incorporated into the Viva Downtown Main Streettransformative plan
• When activities are initiatedTimeframe • Host a meeting within 6 months, or second quarter of 2021
• Host additional meetings with representatives listed in the inventory detailedin Action 1.2
Lead • Potentially-Donna Hale (Plantable Nursery & Café) https://plantableredding.org/, and volunteers to explore options for markets and food events downtown
• Could have multiple future leads depending on the initiativesSupporting cast • Steve Bade (City of Redding) and Downtown Redding Plan
• Nikki Reeves (The Living Water Studio)• Viva Downtown Redding can host the meetings• Healthy Shasta• Anne Thomas (Shasta Living Streets)• Made in Shasta create a subcommittee
Needed resources and possible sources
• United State Department of Agriculture Agricultural Marketing Service (USDA AMS)Architectural and Design services as needed for new venues or facilities
• Add to overall Viva Downtown Plan
Action 1.4: Build and host a website for the LFLP initiative on a public facing website.
What this is and why it is important
A website that will be a clearinghouse of information on all things LFLP related, to allow for greater participation in the efforts. The portal could host the inventory in Action 1.2.Eventually, the portal could serve as a clearinghouse for coordination and information. This could be a directory to connect information and partners. The URL could includeneighboring counties (Tehama, etc), but also keep a localized focus on downtownRedding. It should be all about food, Redding and the region. It needs to be something exciting that people go to.

LOCAL FOODS, LOCAL PLACES COMMUNITY ACTION PLAN Redding, California
14
Action 1.4: Build and host a website for the LFLP initiative on a public facing website.
Measures of success
• When the website is created, populated and used• Decided to restart Growing Local. Add links/content to HS ShastaFarmtoFork.org
Timeframe • 6-12 months, or by mid-2021
Lead • Potentially Fred Schluep, Growing Local with support from Healthy Shasta
Supporting cast • Everyone to contribute to make the portal robust and useful• Michelle Cave to support• Identify some key contributors to keep it relevant and up-to-date, will take a team
Needed resources and possible sources
• Create a subcommittee to put together the local food assets from 1.2, so they areposted in one place
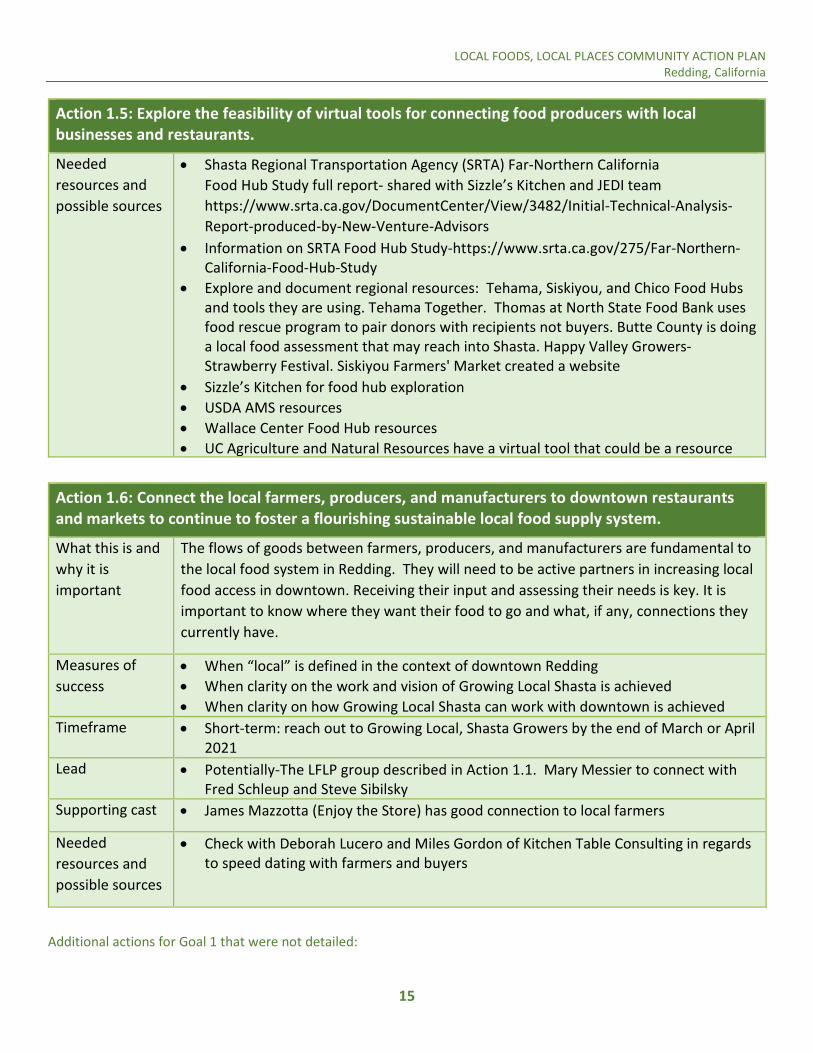
Action 1.5: Explore the feasibility of virtual tools for connecting food producers with local businesses and restaurants.
What this is and why it is important
This action could be an extension of action 1.4 and the main website for all things local food, Redding and Shasta. The concept behind this is that farmers are pressed for time with their production work and do not necessarily have the capacity to market and sell their food. An online platform could facilitate connections between producers and buyers. The platform could ensure that local production is aligned with local demand. Some tools already exist in neighboring counties or region, like Tehama, and they need to be explored and possibly connected to and utilized.
Measures of success
• Development of an online platform for connections between producers and buyers
Timeframe • On-going exploration and discussion by the LFLP Committee• Maybe 1-2 years, late 2021 or 2022
Lead • Potentially-Fred Schluep (Growing Local Shasta)• Potentially-William Wallace (Superior California Economic Development)• Lead and supporting cast from Action 1.4
Supporting cast • Trisha Funk (Women's Business Center at JEDI) has a connection with a group in Happy Valley that did a similar project
• Mary Messier to reach out to Jake and Rachelle Gouldhttp://www.fieldtoforktehama.com/ to explore and build on existing connections
• Trisha Funk - Mt Shasta's online platform http://e-jedi.org/farmers-market/
LOCAL FOODS, LOCAL PLACES COMMUNITY ACTION PLAN Redding, California
15
Action 1.5: Explore the feasibility of virtual tools for connecting food producers with local businesses and restaurants.
Needed resources and possible sources
• Shasta Regional Transportation Agency (SRTA) Far-Northern CaliforniaFood Hub Study full report- shared with Sizzle’s Kitchen and JEDI teamhttps://www.srta.ca.gov/DocumentCenter/View/3482/Initial-Technical-Analysis-Report-produced-by-New-Venture-Advisors
• Information on SRTA Food Hub Study-https://www.srta.ca.gov/275/Far-Northern-California-Food-Hub-Study
• Explore and document regional resources: Tehama, Siskiyou, and Chico Food Hubs and tools they are using. Tehama Together. Thomas at North State Food Bank uses food rescue program to pair donors with recipients not buyers. Butte County is doing a local food assessment that may reach into Shasta. Happy Valley Growers-Strawberry Festival. Siskiyou Farmers' Market created a website
• Sizzle’s Kitchen for food hub exploration• USDA AMS resources• Wallace Center Food Hub resources• UC Agriculture and Natural Resources have a virtual tool that could be a resource
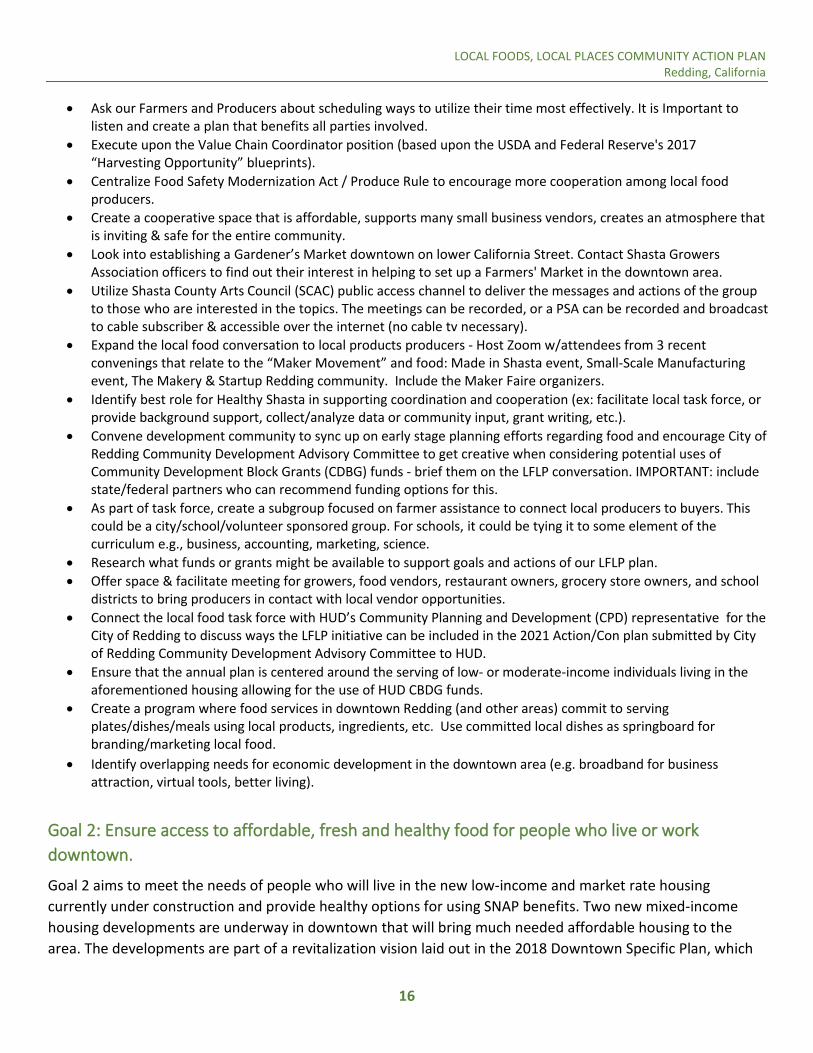
Action 1.6: Connect the local farmers, producers, and manufacturers to downtown restaurants and markets to continue to foster a flourishing sustainable local food supply system.
What this is and why it is important
The flows of goods between farmers, producers, and manufacturers are fundamental to the local food system in Redding. They will need to be active partners in increasing local food access in downtown. Receiving their input and assessing their needs is key. It is important to know where they want their food to go and what, if any, connections they currently have.
Measures of success
• When “local” is defined in the context of downtown Redding• When clarity on the work and vision of Growing Local Shasta is achieved• When clarity on how Growing Local Shasta can work with downtown is achieved
Timeframe • Short-term: reach out to Growing Local, Shasta Growers by the end of March or April2021
Lead • Potentially-The LFLP group described in Action 1.1. Mary Messier to connect withFred Schleup and Steve Sibilsky
Supporting cast • James Mazzotta (Enjoy the Store) has good connection to local farmers
Needed resources and possible sources
• Check with Deborah Lucero and Miles Gordon of Kitchen Table Consulting in regardsto speed dating with farmers and buyers
Additional actions for Goal 1 that were not detailed:
LOCAL FOODS, LOCAL PLACES COMMUNITY ACTION PLAN Redding, California
16
• Ask our Farmers and Producers about scheduling ways to utilize their time most effectively. It is Important to listen and create a plan that benefits all parties involved.
• Execute upon the Value Chain Coordinator position (based upon the USDA and Federal Reserve's 2017“Harvesting Opportunity” blueprints).
• Centralize Food Safety Modernization Act / Produce Rule to encourage more cooperation among local food producers.
• Create a cooperative space that is affordable, supports many small business vendors, creates an atmosphere that is inviting & safe for the entire community.
• Look into establishing a Gardener’s Market downtown on lower California Street. Contact Shasta Growers Association officers to find out their interest in helping to set up a Farmers' Market in the downtown area.
• Utilize Shasta County Arts Council (SCAC) public access channel to deliver the messages and actions of the group to those who are interested in the topics. The meetings can be recorded, or a PSA can be recorded and broadcast to cable subscriber & accessible over the internet (no cable tv necessary).
• Expand the local food conversation to local products producers - Host Zoom w/attendees from 3 recent convenings that relate to the “Maker Movement” and food: Made in Shasta event, Small-Scale Manufacturing event, The Makery & Startup Redding community. Include the Maker Faire organizers.
• Identify best role for Healthy Shasta in supporting coordination and cooperation (ex: facilitate local task force, or provide background support, collect/analyze data or community input, grant writing, etc.).
• Convene development community to sync up on early stage planning efforts regarding food and encourage City of Redding Community Development Advisory Committee to get creative when considering potential uses of Community Development Block Grants (CDBG) funds - brief them on the LFLP conversation. IMPORTANT: include state/federal partners who can recommend funding options for this.
• As part of task force, create a subgroup focused on farmer assistance to connect local producers to buyers. This could be a city/school/volunteer sponsored group. For schools, it could be tying it to some element of the curriculum e.g., business, accounting, marketing, science.
• Research what funds or grants might be available to support goals and actions of our LFLP plan.• Offer space & facilitate meeting for growers, food vendors, restaurant owners, grocery store owners, and school
districts to bring producers in contact with local vendor opportunities.• Connect the local food task force with HUD’s Community Planning and Development (CPD) representative for the
City of Redding to discuss ways the LFLP initiative can be included in the 2021 Action/Con plan submitted by City of Redding Community Development Advisory Committee to HUD.
• Ensure that the annual plan is centered around the serving of low- or moderate-income individuals living in the aforementioned housing allowing for the use of HUD CBDG funds.
• Create a program where food services in downtown Redding (and other areas) commit to servingplates/dishes/meals using local products, ingredients, etc. Use committed local dishes as springboard for branding/marketing local food.
• Identify overlapping needs for economic development in the downtown area (e.g. broadband for business attraction, virtual tools, better living).
Goal 2: Ensure access to affordable, fresh and healthy food for people who live or work downtown.
Goal 2 aims to meet the needs of people who will live in the new low-income and market rate housing currently under construction and provide healthy options for using SNAP benefits. Two new mixed-income housing developments are underway in downtown that will bring much needed affordable housing to the area. The developments are part of a revitalization vision laid out in the 2018 Downtown Specific Plan, which

LOCAL FOODS, LOCAL PLACES COMMUNITY ACTION PLAN Redding, California
17
centers on improving the downtown neighborhood by increasing walkability and bikeability. This goal will integrate healthy food access into the revitalization efforts. Access to healthy, affordable food is crucial to the downtown community, as its census tract currently has a lower California Healthy Places Index score than 98% of census tracts in the state. The emphasis on healthy food will bolster the health impacts of the revitalization efforts in downtown Redding.
Action 2.1: Assess downtown residents to learn what types of foods and food venues they prefer and to identify opportunities, barriers, and ideas that residents have for accessing their preferred food choices.
What this is and why it is important
An assessment is key to understanding the food-related needs of new and existing downtown residents. The assessment could take the form of a survey, forum, focus groups, or events. An assessment could reveal gaps in food access for downtown residents, workers, and people visiting the nearby Shasta Community Health Center. An assessment could also illuminate the cultural preferences that underly choices about food consumption in downtown. An important first step is to come up with the questions to ask in the assessment (will need a group effort to come up with a good list).
Measures of success
• The number of responses and the demographics of the respondents
Timeframe • Draft the questions from January-February 2021• Conduct the assessment during March-April 2021
Lead • Potentially-Healthy Shasta• Potentially-Shasta County Public Health Department (SCPHD)• Multi-agency outreach with one coordinator to be identified by LFLP group• Potentially-Rachel Hatch-connect with managers of new housing regarding residents
Supporting cast • Facility managers- City of Redding (Steve Bade) can assist with connecting to newdevelopment and outreach
• Epidemiology department of SCPHD• Redding Chamber of Commerce• Viva Downtown Redding, First 5 Shasta•Needed
resources and possible sources
• Developing the survey would require multiple agencies, with one of them collectingand analyzing the data
LOCAL FOODS, LOCAL PLACES COMMUNITY ACTION PLAN Redding, California
18
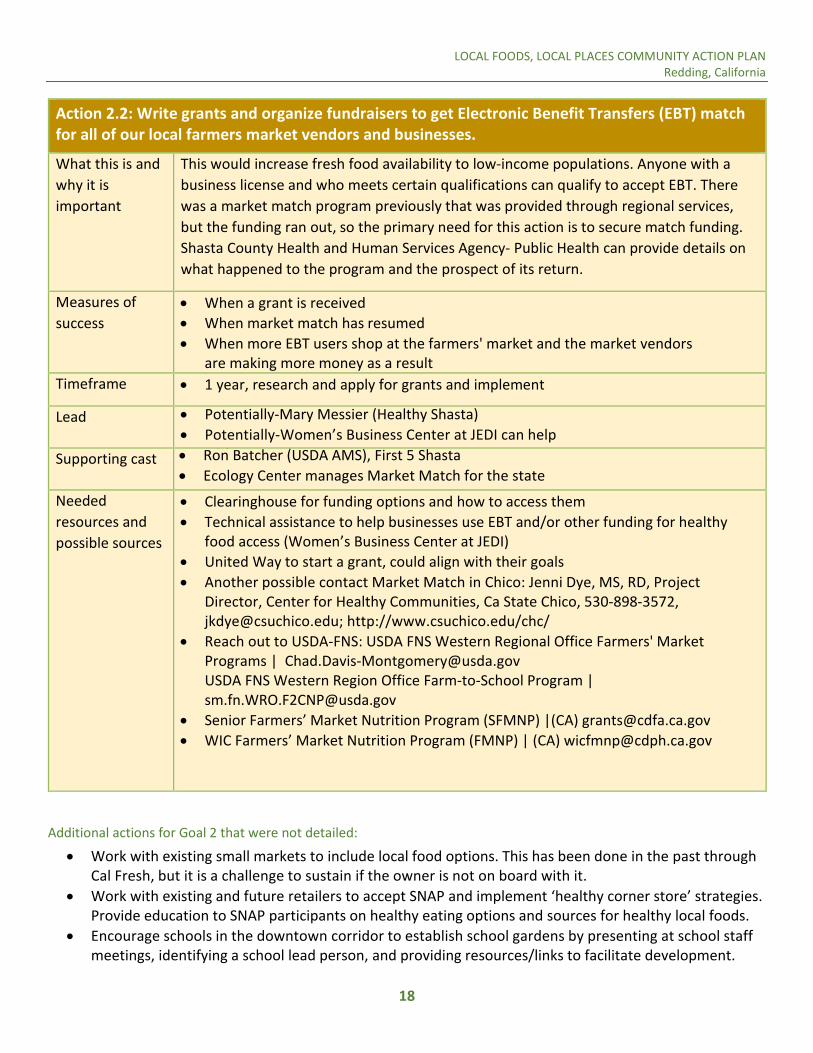
Action 2.2: Write grants and organize fundraisers to get Electronic Benefit Transfers (EBT) match for all of our local farmers market vendors and businesses.
What this is and why it is important
This would increase fresh food availability to low-income populations. Anyone with a business license and who meets certain qualifications can qualify to accept EBT. There was a market match program previously that was provided through regional services, but the funding ran out, so the primary need for this action is to secure match funding. Shasta County Health and Human Services Agency- Public Health can provide details on what happened to the program and the prospect of its return.
Measures of success
• When a grant is received• When market match has resumed• When more EBT users shop at the farmers' market and the market vendors
are making more money as a resultTimeframe • 1 year, research and apply for grants and implement
Lead • Potentially-Mary Messier (Healthy Shasta)• Potentially-Women’s Business Center at JEDI can help
with outreachSupporting cast • Ron Batcher (USDA AMS), First 5 Shasta• Ecology Center manages Market Match for the state
Needed resources and possible sources
• Clearinghouse for funding options and how to access them• Technical assistance to help businesses use EBT and/or other funding for healthy
food access (Women’s Business Center at JEDI) • United Way to start a grant, could align with their goals• Another possible contact Market Match in Chico: Jenni Dye, MS, RD, Project
Director, Center for Healthy Communities, Ca State Chico, 530-898-3572, [email protected]; http://www.csuchico.edu/chc/
• Reach out to USDA-FNS: USDA FNS Western Regional Office Farmers' Market Programs | [email protected] FNS Western Region Office Farm-to-School Program |[email protected]
• Senior Farmers’ Market Nutrition Program (SFMNP) |(CA) [email protected]• WIC Farmers’ Market Nutrition Program (FMNP) | (CA) [email protected]
Additional actions for Goal 2 that were not detailed:
• Work with existing small markets to include local food options. This has been done in the past throughCal Fresh, but it is a challenge to sustain if the owner is not on board with it.
• Work with existing and future retailers to accept SNAP and implement ‘healthy corner store’ strategies.Provide education to SNAP participants on healthy eating options and sources for healthy local foods.
• Encourage schools in the downtown corridor to establish school gardens by presenting at school staffmeetings, identifying a school lead person, and providing resources/links to facilitate development.

LOCAL FOODS, LOCAL PLACES COMMUNITY ACTION PLAN Redding, California
19
• Create and implement a comprehensive educational and promotional program for local food anddestinations in downtown Redding.
Goal 3: Evaluate and enhance the local food system and economy as a driver of downtown revitalization.
Goal 3 aims to identify and work to develop or enhance missing pieces of the local food system/food economy that create a more vibrant, walkable downtown. It also aims to establish successful food related destinations that draw people into the area and utilize existing vacant space. The City of Redding has been revitalizing its downtown. The revitalization efforts present an excellent opportunity to increase healthy food access for the existing and future residents of the downtown area in a way that stimulates the local economy.
Action 3.1: Conduct an analysis and study of appropriate retail models for viable local food businesses in the downtown core.
What this is and why it is important
This can help expand the market for healthy, local food in downtown without drawing business away from the farmers' market. The study could focus on consumers who do not frequent the farmers' market, along with the future residents at the new housing developments. This would require a market analysis of the customers who go and those who do not go to the farmers' market. A gap analysis can determine what type of retail services are needed.
Measures of success
• When a study is completed that determines a location that draws residents ofdowntown and beyond, one that is locally owned, and establishes goals andcriteria for tenancy
• When a business model has been created• When stakeholders are identified
Timeframe • Could begin by December 2020 or early 2021, and would likely be a 6-9 monthprocess
Lead • Potentially-Fred Schluep (Growing Local Shasta)• Potentially-Michelle Cave
Supporting cast • Kirkwood Hale• April Jurisich (Healthy Shasta)

LOCAL FOODS, LOCAL PLACES COMMUNITY ACTION PLAN Redding, California
20
Action 3.1: Conduct an analysis and study of appropriate retail models for viable local food businesses in the downtown core.
Needed resources and possible sources
• Business models to vet that explore straight market-based criteria and those withcommunity benefit/subsidies
• Center for Cooperative Development• National Co+op Grocers https://www.ncg.coop/• Shasta’s Business District• Farmers Market Promotion Program,
https://www.ams.usda.gov/services/grants/fmpp• Farmers Market Coalition, https://farmersmarketcoalition.org/• Ron Batcher (USDA MS), https://www.ams.usda.gov/services/local-regional/
facility-design• Local Food Promotions Program USDA,
https://www.ams.usda.gov/services/grants/lfpp
Action 3.2: Support new and existing businesses with full business plan development and an achievable plan to access capital and resources to expand or include local food in their business model.
What this is and why it is important
Local businesses do not need to reinvent the wheel – they could benefit greatly from assistance in planning their development. The assistance could incorporate the “Made in Shasta” and “Buy Local” branding campaigns. The assistance could also include coordination with farmers and business owners. Will start with a planning meeting.
Measures of success
• Guides for working with the City of Redding• A convening of local farmers, restaurants and food related producers to capture
needs.Timeframe • Evaluate what the residents/businesses want through assessments by end of 2021
• Schedule local discussion with local farmers, restaurants and food related producers by spring of 2021 to capture needs
Lead • Potentially-Trisha Funk (Women’s Business Center at JEDI)
Supporting cast • Reach out to Karen at Sizzle’s Kitchen (already a shared kitchen, serving food trucksand catering)
• Made in Shasta Coalition• Fred Schluep• Jake Mangas and Erin Hull (Redding Chamber of Commerce)• Tod Jones (Shasta Economic Development Corporation’s Startup Redding)
Needed resources and possible sources
• Look at “Made in Humboldt” as a successful model• Meet with Shasta College to discuss Made in Shasta-need more information
LOCAL FOODS, LOCAL PLACES COMMUNITY ACTION PLAN Redding, California
21
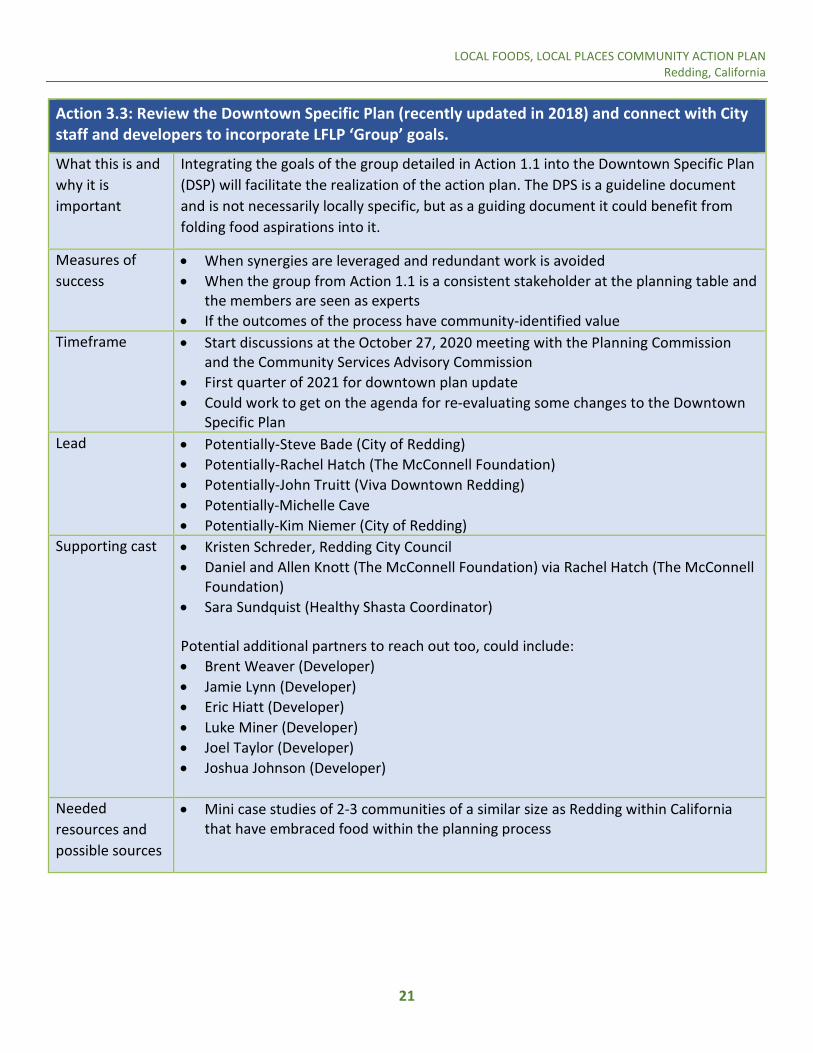
Action 3.3: Review the Downtown Specific Plan (recently updated in 2018) and connect with City staff and developers to incorporate LFLP ‘Group’ goals.
What this is and why it is important
Integrating the goals of the group detailed in Action 1.1 into the Downtown Specific Plan (DSP) will facilitate the realization of the action plan. The DPS is a guideline document and is not necessarily locally specific, but as a guiding document it could benefit from folding food aspirations into it.
Measures of success
• When synergies are leveraged and redundant work is avoided• When the group from Action 1.1 is a consistent stakeholder at the planning table and
the members are seen as experts• If the outcomes of the process have community-identified value
Timeframe • Start discussions at the October 27, 2020 meeting with the Planning Commissionand the Community Services Advisory Commission
• First quarter of 2021 for downtown plan update• Could work to get on the agenda for re-evaluating some changes to the Downtown
Specific PlanLead • Potentially-Steve Bade (City of Redding)
• Potentially-Rachel Hatch (The McConnell Foundation)• Potentially-John Truitt (Viva Downtown Redding)• Potentially-Michelle Cave• Potentially-Kim Niemer (City of Redding)
Supporting cast • Kristen Schreder, Redding City Council• Daniel and Allen Knott (The McConnell Foundation) via Rachel Hatch (The McConnell
Foundation)• Sara Sundquist (Healthy Shasta Coordinator)
Potential additional partners to reach out too, could include: • Brent Weaver (Developer)• Jamie Lynn (Developer)• Eric Hiatt (Developer)• Luke Miner (Developer)• Joel Taylor (Developer)• Joshua Johnson (Developer)
Needed resources and possible sources
• Mini case studies of 2-3 communities of a similar size as Redding within Californiathat have embraced food within the planning process

LOCAL FOODS, LOCAL PLACES COMMUNITY ACTION PLAN Redding, California
22
Action 3.4: Work with City to formalize and make permanent COVID zoning for outdoor dining and outdoor space utilization for local businesses.
What this is and why it is important
The pandemic has presented unique hurdles for the service industry and has pushed cities to rapidly adapt their dining regulations to expand spaces dedicated for outdoor dining. Beyond meeting the needs of producers and food retail establishments, outdoor dining provides an amenity and attraction for people living within and outside of downtown.
Measures of success
• Codified zoning designation in the City ordinance
Timeframe • Get started by the end of 2020, keep it going in 2021• An on-going effort
Lead • Potentially-Jake Mangas (Redding Chamber of Commerce)• Potentially-John Truitt (Viva Downtown Redding)• Potentially-Anne Thomas (Shasta Living Streets)• Potentially-Steve Bade (City of Redding)• Potentially-Rachel Hatch (The McConnell Foundation)
Supporting cast • Redding Police Department & others who have contacts at Alcohol & BeverageControl
• Julie Heleniak, owner of Carnegie’s where there is the first permanent parklet foroutdoor dining in downtown, on Oregon Street
• City Council members who are business advocatesNeeded resources and possible sources
• Model case studies of similar-sized California cities that have donethis
Action 3.5: Pilot and facilitate micro-markets by utilizing the pocket park and lawns by Old City Hall, and then possibly expand to other locations downtown.
What this is and why it is important
The minimal investment required for such markets will allow the city to quickly and easily test different options to see what residents prefer. This would be weather-dependent, but the sites are high visibility and there is ample parking nearby. The markets could involve craft goods in addition to food. It should be noted that permitting may be an issue with the sale and provision of food and beverages.
Measures of success
• When 8-10 vendors participate in the micro-markets• When recurring micro-markets are held on a consistent basis
Timeframe • Could be done from April through October when there is decent weather• Start planning in January 2021 to hold the first markets in April 2021• Acquire permits as needed

LOCAL FOODS, LOCAL PLACES COMMUNITY ACTION PLAN Redding, California
23
Action 3.5: Pilot and facilitate micro-markets by utilizing the pocket park and lawns by Old City Hall, and then possibly expand to other locations downtown.
Lead • Agata Maruszewski (Shasta County Arts Council (SCAC))• John Truitt (Viva Downtown) to reach out and support SCAC
Supporting cast • Shasta County Department of Resource Management Environmental Health Division• City of Redding• Fred Schluep (Growing Local Shasta) knows a local chef in Tehama County, CA who
did the Local Food to Table Tehama• Jeramie Sabelman (Japanese Blossoms & Synergy Foods) can assist and bridge gaps
Needed resources and possible sources
• Permitting for food and alcohol service
Action 3.6: Establish a Plantable Nursery Café on California Street.
What this is and why it is important
The café would be a non-profit to provide a training center for marginalized individuals and a space for a community market. The market could be held in an open, community space on the lower level of the café. Will need to define who this is serving, what the purpose is, which populations are being targeted for service. Have an empty lot that they want to develop for events. https://plantableredding.org/
Measures of success
• Open sales of plants by Spring of 2021• Open up part of California Street as farmers' market or gardener’s market by end of
2021Timeframe • Soft opening in March or April of 2021 for plants
Lead • Donna and Kirkwood Hale
Supporting cast • LFLP group to get involved and be supportive• Good News Rescue Mission-mentoring for individuals that want job skills• Shasta College for horticulture• Incorporate planters in downtown and work with those in training program
to maintain and bring beauty to downtown• Riverfront Playhouse
Needed resources and possible sources
• Garden of Hope
Additional actions for Goal 3 that were not detailed:
LOCAL FOODS, LOCAL PLACES COMMUNITY ACTION PLAN Redding, California
24
• Serve on steering committees for organizations who are helping to promote and launch new food system opportunities.
• Integrate a formalized Farm to Food Pantry (F2FP) program to dovetail with direct to consumer and retail sales. F2FP will provide additional wholesale markets (food banks) and incentivize additional small farm food production
• Create year-round co-op grocery store.• Zoom call with the folks from Corbin, Kentucky whose Farmers' Market case study we heard from during
workshop. Include city council members.• Engage the City of Redding in a planning process to consider zoning or other policies that might affect
the ability for food manufacturers to do small-batch manufacturing in downtown Redding, and County Environmental Health.
• Work with the local planning office to identify barriers to walkability and how the streetscape may be improved through plantings, traffic speed evaluation, etc. Identify zoning challenges that may be barriers to utilizing vacant space.
• Ensure local and regional food businesses, farmers' markets, and producers utilize the USDA Local Food Directories to bring awareness of current community food assets.
• Work with city and county to determine sales tax generated for annual report. This will help make the case to some of the return on investment for local food investments.
• Encourage and train farmers to utilize financial metrics to improve their return on investment.
IMPLEMENTATION AND NEXT STEPS
Following the workshop, the steering committee, community collaborators, and technical assistance team held three more calls to finalize the action plan and report. During each call, updates related to the action plan or an outcome of the workshop were shared. In some instances, new information gathered resulted in modifications to actions within the plan. Early progress and connections as a result of this process include:
• Members of the Steering Committee met with the Planning Commission and the CommunityServices Advisory Commission on October 27th, 2020 to discuss incorporating the LFLP workshopgoals in the Downtown Specific Plan.
• The initial organizing for a March 11, 2021 Food Forum bringing together farmers and foodproducers with restaurants and food retailers to begin a community conversation on needs andnext steps.
• The Community Foundation of the North State conveyed to the Steering Committee that there areseveral funds they administer that are good fits for potential food-related projects.
• The Made in Shasta group is meeting to discuss rekindling its activities to promote local foods andproduce.
• There has been continued media interest after the workshop on Channels 12 and 7 – bringingrenewed attention to the possibilities and opportunities of bringing local foods businesses andactivities to downtown Redding.
LOCAL FOODS, LOCAL PLACES COMMUNITY ACTION PLAN Redding, California
25
• New possibilities of sharing resources and building a more regional food economy are beginningwith discussions between the Steering Committee and Tehama Together, as well connecting withorganizations in Butte and Siskiyou Counties.
• On November 11th, met with Tehama Together and shared Shasta LFLP updates, will plan tomeet with them again in January 2021.
APPENDICES • Appendix A – Workshop Exercise Results
o What are you excited about for this workshopo This I believe about community and foodo Making Headlineso Assets, Opportunities, Challenges, Barrierso Asset Mapping: Social PinPoint legend and mapso Action Brainstorming and Voting results
• Appendix B – Workshop Participants• Appendix C – Community Data Profile• Appendix D – Funding Resources• Appendix E – References• Appendix F – Federal Agencies Descriptions

LOCAL FOODS, LOCAL PLACES COMMUNITY ACTION PLAN Redding, California
Appendix D: Workshop Feedback and Documentation
Appendix A:
Workshop Exercise Results What are you excited about for this workshop This I believe about community and food Making Headlines Assets, Opportunities, Challenges, Barriers Asset Mapping: Social PinPoint legend and maps Action Brainstorming and Voting results

LOCAL FOODS, LOCAL PLACES COMMUNITY ACTION PLAN Redding, California
Page 1 Appendix A: Workshop Exercise Results
Responses to the question, “What are you excited about for this workshop?” • local affordable healthy food• sharing ideas• locally grown food!• downtown culture arts• being a federal employee to help visions and dreams• outside expertise looking at community vitality• economic opportunity• local affordable healthy food• food as a destination in downtown• local food, creating synergy, and a vibrant downtown!• walking and biking to access local healthy food• excited to see families in downtown Redding• seeing more connections with the farmers' market and farmers to
restaurants• increased opportunity for healthy affordable food for children and families• helping Redding create a more vibrant downtown• seeing possibilities downtown• collaborating with everyone• more and greater options for local healthy food• all about local food, sustainability, food education• bring locally sourced food downtown• economic viability of operations• need healthy food options downtown for our children!• see how this project can help a CSA were doing this fall• new creative ideas to deliver to our rural communities• excited to learn, share resources and knowledge from across the country• excited about the Kirkwood's project!• organic farm produce into restaurants• to learn from residents of Redding on how to support their needs• excited about local agriculture• like to see Redding thrive• connect growers with people• support organic farmers, food is medicine, support local food in restaurants• to have more access to local produce for families in Redding

LOCAL FOODS, LOCAL PLACES COMMUNITY ACTION PLAN Redding, California
Page 2 Appendix A: Workshop Exercise Results
• excited how LFLP will enhance our local downtown districts andbusinesses
• new relationship and new opportunities• excited about downtown growth and local food opportunities• to bring healthy food into Redding• opportunities for inclusion and accessibility• hearing some great ideas and connecting folks with grant opportunities• architecture for agriculture• excited to be a part of it• being able to align federal resources with Redding• be part of effort to develop food system in Redding, CA• no cost arch design services, get to know you

LOCAL FOODS, LOCAL PLACES COMMUNITY ACTION PLAN Redding, California
Page 3 Appendix A: Workshop Exercise Results
Responses to finishing the sentence, “I believe local food…” • supports our friends' and neighbors’ livelihoods• tastes great• is good for people and the economy• is essential to a healthy community• mitigates single source disruptions• makes the place special• is the heart of a community• should be grown locally whenever possible• is important for the community• should be affordable• should be available to everyone• tastes great and supports local people• should be offered everywhere and easily accessible!• can add a uniqueness to a town• helps build local identity• is better for the environment• is an opportunity to help define our community and connect producers with local and
visiting consumers• tastes better!• acknowledges the seasons and weather• creates local jobs• can put us on the map!• is participatory, gardening at home and in dispersed clusters is a socially strengthening path• supports our whole community & farms, health and wellness• attracts more farmers• is good for the farmer, good for the body, good for the earth• lowers carbon footprint by reducing the amount of transportation that occurs• makes us feel connected to each other as humans and to the environment

LOCAL FOODS, LOCAL PLACES COMMUNITY ACTION PLAN Redding, California
Page 4 Appendix A: Workshop Exercise Results
Responses to finishing the sentence, “I believe my community…” • is poised for revitalization• is ready for change• is transitioning into a greater place to live• is coming into a new and vibrant identity• supports our local food economy and supports making our community the best it can be• is coming together to improve and grow opportunities• needs to include the most marginalized• is worthy of our commitment to it• has so much potential and the resources needed to grow as well as the need for it• is ready to come together• is in need of better *social infrastructure* (connections between people who are working on
similar things…there is already a lot of focus on *physical* infrastructure, but we need to alsocontinue to foster the *social* infrastructure
• is broader than chain restaurants and fast food• could benefit from stronger partnerships between different economic, cultural, and policy
actors• has the natural resources and producers that need to be utilized much more• is a great place with even greater potential

LOCAL FOODS, LOCAL PLACES COMMUNITY ACTION PLAN Redding, California
Page 5 Appendix A: Workshop Exercise Results
Making Headlines Participants were asked to brainstorm a headline from the future. Something positive has happened in Redding, write a headline for that and let’s talk about what the impact was and how it came to be.
• Redding California is the next Napa Valley. We have everything growing at our fingertips, we have products from Shasta County, Butte County and Tehama County. We have grapes, nuts, produce, grass fed beef, bison, pork, lots of organic farms, and we have so many people that love food.
• The success of downtown Redding extends around the County.• Creativity floods downtown: new local restaurants, plant nurseries, walking, biking, and theatre
abound for all in downtown Redding.• Downtown Redding Farmers' Market breaks attendance records!• Local Organic Farmers are thriving in Redding! Local food options are booming downtown.• Downtown is not dead -- many people now live, work, and play downtown.• Farmers Take the Lead on Starting a Successful Downtown FM!• Redding wins national livability award on 3rd anniversary of their dynamic downtown farmers'
market, located in a walkable hub of local food and vibrant public spaces.• Redding wins award for building model distribution chains to get producers to markets -
promoting direct marketing channels, working to create farm to institution (schools, restaurants, hospitals) supply chains, and educating farmers on how to grow to scale.
LOCAL FOODS, LOCAL PLACES COMMUNITY ACTION PLAN Redding, California
Page 6 Appendix A: Workshop Exercise Results
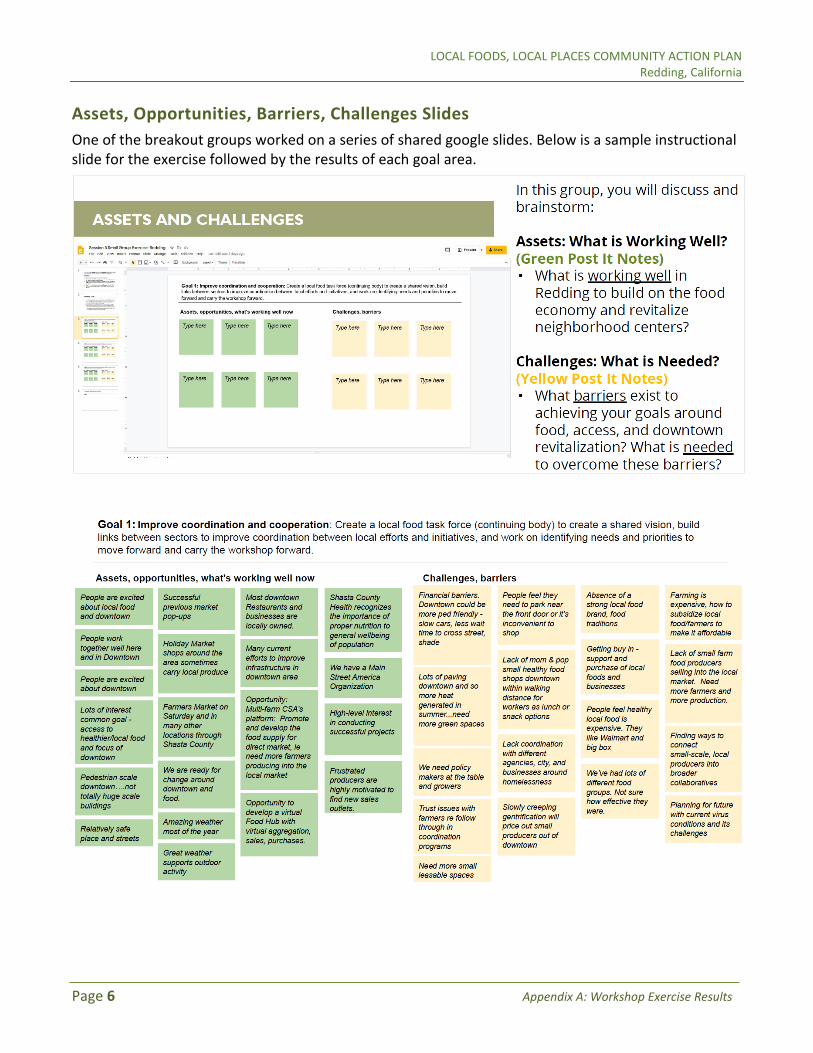
Assets, Opportunities, Barriers, Challenges Slides One of the breakout groups worked on a series of shared google slides. Below is a sample instructional slide for the exercise followed by the results of each goal area.

LOCAL FOODS, LOCAL PLACES COMMUNITY ACTION PLAN Redding, California
Page 7 Appendix A: Workshop Exercise Results
LOCAL FOODS, LOCAL PLACES COMMUNITY ACTION PLAN Redding, California
Page 8 Appendix A: Workshop Exercise Results
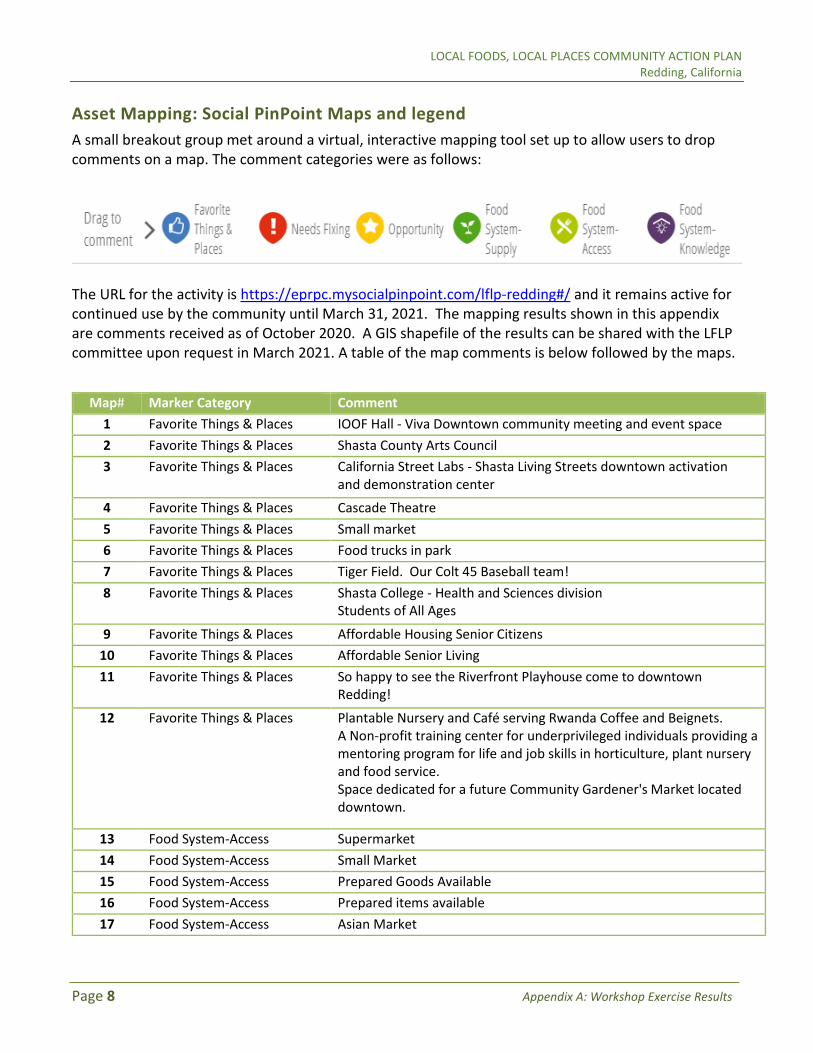
Asset Mapping: Social PinPoint Maps and legend A small breakout group met around a virtual, interactive mapping tool set up to allow users to drop comments on a map. The comment categories were as follows:
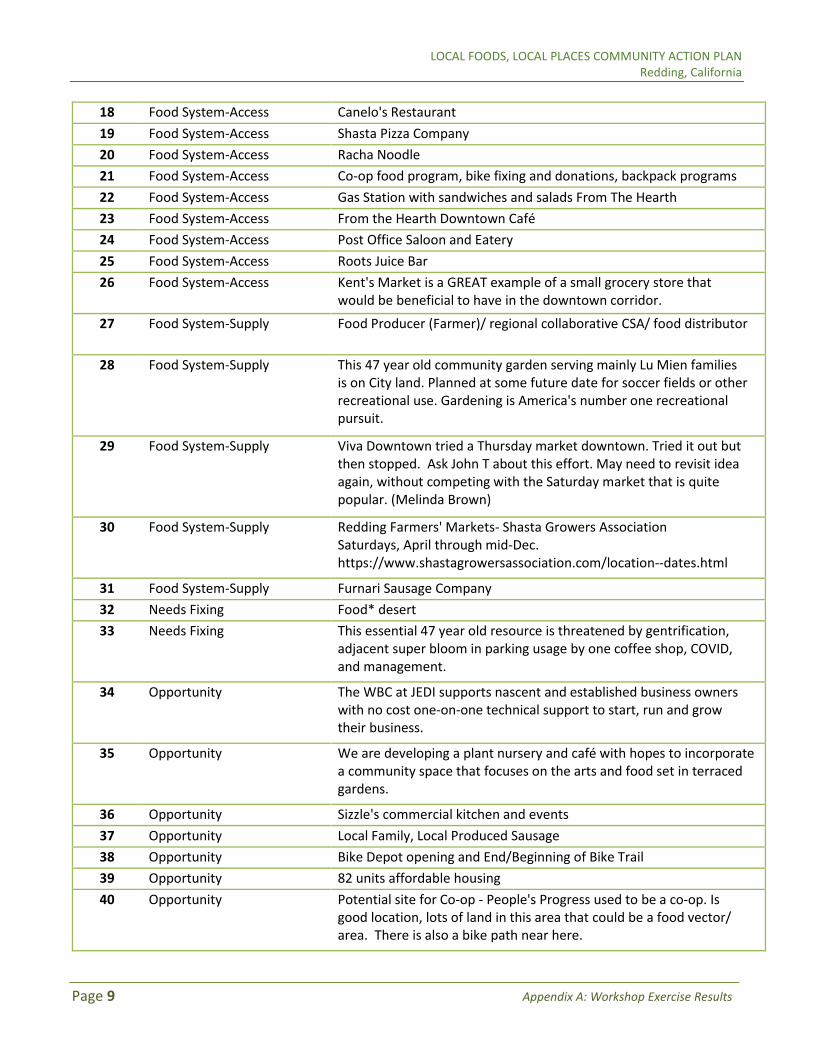
The URL for the activity is https://eprpc.mysocialpinpoint.com/lflp-redding#/ and it remains active for continued use by the community until March 31, 2021. The mapping results shown in this appendix are comments received as of October 2020. A GIS shapefile of the results can be shared with the LFLP committee upon request in March 2021. A table of the map comments is below followed by the maps.
Map# Marker Category Comment 1 Favorite Things & Places IOOF Hall - Viva Downtown community meeting and event space 2 Favorite Things & Places Shasta County Arts Council 3 Favorite Things & Places California Street Labs - Shasta Living Streets downtown activation
and demonstration center
4 Favorite Things & Places Cascade Theatre 5 Favorite Things & Places Small market 6 Favorite Things & Places Food trucks in park 7 Favorite Things & Places Tiger Field. Our Colt 45 Baseball team! 8 Favorite Things & Places Shasta College - Health and Sciences division
Students of All Ages
9 Favorite Things & Places Affordable Housing Senior Citizens 10 Favorite Things & Places Affordable Senior Living 11 Favorite Things & Places So happy to see the Riverfront Playhouse come to downtown
Redding!
12 Favorite Things & Places Plantable Nursery and Café serving Rwanda Coffee and Beignets. A Non-profit training center for underprivileged individuals providing a mentoring program for life and job skills in horticulture, plant nursery and food service. Space dedicated for a future Community Gardener's Market located downtown.
13 Food System-Access Supermarket 14 Food System-Access Small Market 15 Food System-Access Prepared Goods Available 16 Food System-Access Prepared items available 17 Food System-Access Asian Market
LOCAL FOODS, LOCAL PLACES COMMUNITY ACTION PLAN Redding, California
Page 9 Appendix A: Workshop Exercise Results
18 Food System-Access Canelo's Restaurant 19 Food System-Access Shasta Pizza Company 20 Food System-Access Racha Noodle 21 Food System-Access Co-op food program, bike fixing and donations, backpack programs 22 Food System-Access Gas Station with sandwiches and salads From The Hearth 23 Food System-Access From the Hearth Downtown Café 24 Food System-Access Post Office Saloon and Eatery 25 Food System-Access Roots Juice Bar 26 Food System-Access Kent's Market is a GREAT example of a small grocery store that
would be beneficial to have in the downtown corridor.
27 Food System-Supply Food Producer (Farmer)/ regional collaborative CSA/ food distributor
28 Food System-Supply This 47 year old community garden serving mainly Lu Mien families is on City land. Planned at some future date for soccer fields or other recreational use. Gardening is America's number one recreational pursuit.
29 Food System-Supply Viva Downtown tried a Thursday market downtown. Tried it out but then stopped. Ask John T about this effort. May need to revisit idea again, without competing with the Saturday market that is quite popular. (Melinda Brown)
30 Food System-Supply Redding Farmers' Markets- Shasta Growers Association Saturdays, April through mid-Dec. https://www.shastagrowersassociation.com/location--dates.html
31 Food System-Supply Furnari Sausage Company 32 Needs Fixing Food* desert 33 Needs Fixing This essential 47 year old resource is threatened by gentrification,
adjacent super bloom in parking usage by one coffee shop, COVID, and management.
34 Opportunity The WBC at JEDI supports nascent and established business owners with no cost one-on-one technical support to start, run and grow their business.
35 Opportunity We are developing a plant nursery and café with hopes to incorporate a community space that focuses on the arts and food set in terraced gardens.
36 Opportunity Sizzle's commercial kitchen and events 37 Opportunity Local Family, Local Produced Sausage 38 Opportunity Bike Depot opening and End/Beginning of Bike Trail 39 Opportunity 82 units affordable housing 40 Opportunity Potential site for Co-op - People's Progress used to be a co-op. Is
good location, lots of land in this area that could be a food vector/ area. There is also a bike path near here.
LOCAL FOODS, LOCAL PLACES COMMUNITY ACTION PLAN Redding, California
Page 10 Appendix A: Workshop Exercise Results
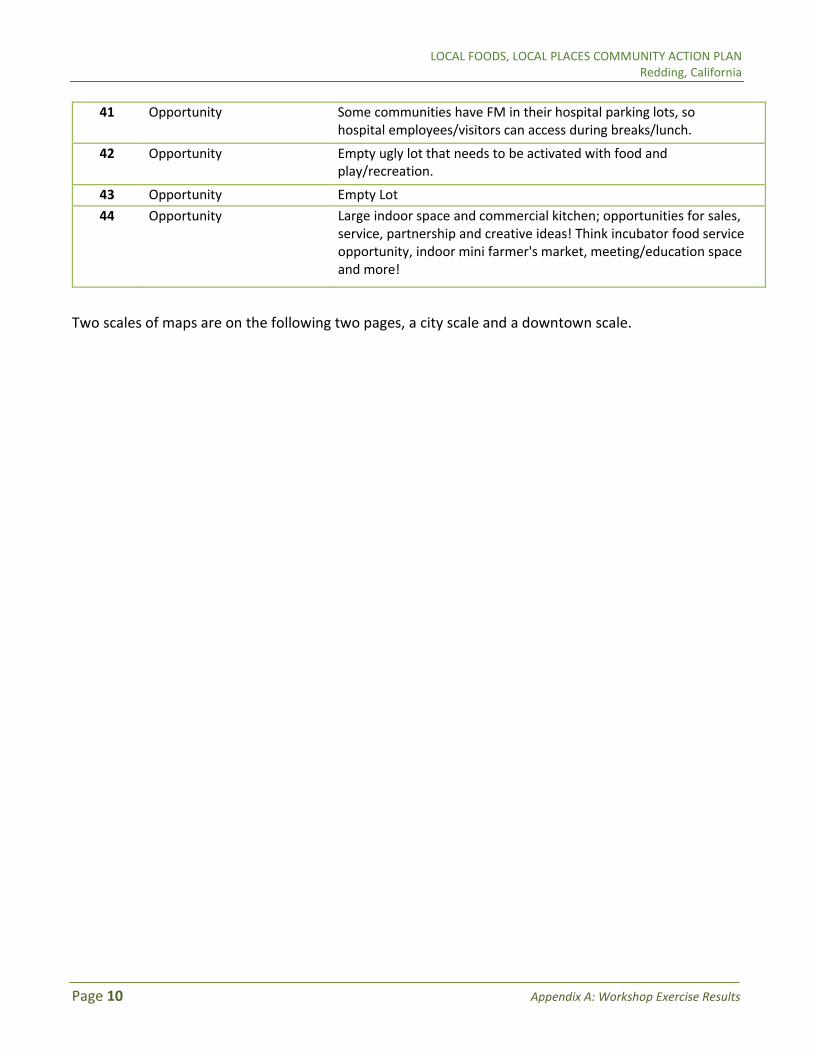
41 Opportunity Some communities have FM in their hospital parking lots, so hospital employees/visitors can access during breaks/lunch.
42 Opportunity Empty ugly lot that needs to be activated with food and play/recreation.
43 Opportunity Empty Lot 44 Opportunity Large indoor space and commercial kitchen; opportunities for sales,
service, partnership and creative ideas! Think incubator food service opportunity, indoor mini farmer's market, meeting/education space and more!
Two scales of maps are on the following two pages, a city scale and a downtown scale.

12
3
57
10
1112
13
1416
1720
21
22
26
28
29
33
Sources: Esri, HERE, Garmin, Intermap, increment P Corp., GEBCO, USGS, FAO, NPS, NRCAN,GeoBase, IGN, Kadaster NL, Ordnance Survey, Esri Japan, METI, Esri China (Hong Kong), (c)OpenStreetMap contributors, and the GIS User Community
0 21Miles
REDDING, CA (CITY)LOCAL FOODS, LOCAL PLACES
Redding, CA Favorite Things & Places Food System-Access Food System-Supply Needs Fixing Opportunity

1
23
45
6
7
8
9
1011
12
13
14
1516
1718 1920
21
22
23
24
25
27
28
29
30
31
32
33
34
35
36
38
39
40
41
42
4344
Sources: Esri, HERE, Garmin, Intermap, increment P Corp., GEBCO, USGS, FAO, NPS, NRCAN,GeoBase, IGN, Kadaster NL, Ordnance Survey, Esri Japan, METI, Esri China (Hong Kong), (c)OpenStreetMap contributors, and the GIS User Community
0 0.50.25Miles
REDDING, CA (DOWNTOWN)LOCAL FOODS, LOCAL PLACES
Redding, CA Favorite Things & Places Food System-Access Food System-Supply Needs Fixing Opportunity
LOCAL FOODS, LOCAL PLACES COMMUNITY ACTION PLAN Redding, California
Page 13 Appendix A: Workshop Exercise Results
Action Brainstorming and Voting results The action planning process is described in the report. This appendix contains the final brainstormed actions, categorized by group, and with the voting results included.

Goal 1: Improve coordination and cooperation: Create a local food task force (continuing body) to create a shared vision, build
links between sectors to improve coordination between local efforts and initiatives, and work on identifying needs and priorities to move forward and carry the workshop forward.
Look into establishing a Gardener’s Market downtown on lower California Street. Contact Shasta Growers Association officers to find out their interest in helping to set up a Farmers' Market in downtown area. Kirkwood and Donna Hale
Create a cooperative space that is affordable, supports many small business vendors, creates an atmosphere that’s inviting & safe for the entire community. A multi-use space that supports many vendors (being mindful of competing with other existing small food businesses).
Michelle Cave
Ask our Farmers and Producers about scheduling ways to utilize their time most effectively. Important to listen and create a plan that benefits all parties involved.
Blake Fisher
Centralize Food Safety Modernization Act / Produce Rule to encourage more cooperation among local food producers.
Fred Schluep
Melinda Brown
Work toward building a LFLP resource page on the Healthy Shasta website that could be used in a way that would best serve everyone involved. A clearinghouse of info for LFLP related initiatives.
Mary Messier
Explore the feasibility of virtual tools for coordinating food needs of businesses and restaurants with local producers so that local production is aligned with local demand (or tourism demand). William Wallace
Execute upon the Value Chain Coordinator position (based upon the USDA and Federal Reserve's 2017 “Harvesting Opportunity” blueprints”).
Fred Schluep
Continue to be the connector to the resources that are available to our makers, manufacturers and growers in the community with resources that are available to them to help them optimize their revenue. Trisha Funk
Improve food value chain and regulation
safety
Learn, listen, research, seek to understand,
assemble info
Study/evaluate cooperative concepts
and opportunities
Share, host, distribute information and data
Expand the local food conversation to local products producers - Host Zoom w/attendees from 3 recent convenings that relate to the “Maker Movement” and food: Made in Shasta event Small-Scale Manufacturing event, The Makery & Startup Redding community. Include the Maker Faire organizers.
Rachel Hatch
LEGEND# = votes from the prioritization exercise in Google Forms (Session 4)
Seek to be efficient and 10 understand what currently exists. Assemble existing knowledge and lists of contacts and likely partners. Consult with Growing Local to understand what's going on and not duplicate efforts.
44
7
6
8
9
10
5
Utilize SCAC’s public access channel to deliver the 1messages and actions of the group to those who are interested in the topics. The meetings can be recorded or PSA can be recorded and broadcast to cable subscriber & accessible over the internet (no cable tv necessary).Agata Maruszewski
8

Goal 1, p2:
Brainstorm and then reach out and have conversations with various groups and people.
- Set up a meeting withothers to discuss specifics tohow to get gardeners marketor food co-op downtown. …MIchelle Cave and HeatherPhillips with hopes todedicate some of our spaceat 2018 California St.- Set up meeting withSamantha to see how we can partner with USDA to help set up a Community Market on California Street - Contact City's Kim Neimerto see how the city may help with setting up another Gardener's market at the end of California Street- Activity - Host conveningand regular meetings ofresidents to determine needs,desires.
John Truit, Kirkwood and Donna Hale
Convene development community to sync up on early stage planning efforts regarding food and encourage City of Redding Communtiy Development Advisory Committee to get creative when considering potential uses of CDBG funds brief them on the LFLP conversation. IMPORTANT: include state/federal partners who can recommend funding options for this.
Rachel Hatch
Research what funds or grants might be available to support goals and actions of our LFLP plan.
Michelle CaveIdentify best role for Healthy Shasta in supporting coordination and cooperation. (ex: facilitate local task force, or provide background support, collect/analyze data or community input, grant writing, or ??).
Amy Pendergast
Create a program where food services in downtown Redding (and other areas) commit to serving plates/dishes/meals using local products, ingredients, etc. Use committed local dishes as springboard for branding/marketing local food.
William Wallace
Connect the local food task force with HUD’s CPD Rep for the City of Redding to discuss ways the LFLP initiative can be included in the 2021 Action/Con plan submitted by City of Redding Community Development Advisory Committee to HUD.
Robert Jamieson
Identify overlapping needs for economic development in the downtown area (e.g. broadband for business attraction, virtual tools, better living).
William Wallace
Goal 1Identify what is currently produced locally and how that can be used in local food industry
William Wallace
As part of task force, create a subgroup focused on farmer assistance to connect or facilitating local producers to buyers.This could be city/school/volunteer sponsored group. For schools, it could be, tying it to some element of the curriculum e.g business, accounting, marketing, science.
Andrew Moiseff
Create or nominate an existing group/org/ committee to coordinate local food efforts in near term, mid, long. Determine a lead agency or facilitator to coordinate logistics. Identify who will reach out to personally invite the additional partner(s).
- April Jurisich, Michelle Cave
Create a Local Food Taskforce to present/participate in downtown events- e.g. kick off for new housing, the new Dieselhorse to downtown trail, and connect with existing downtown groups to identify contacts and support events (ongoing).
- Janessa Hartman, Scott Stollman
Offer space & facilitate meeting for growers, food vendors, restaurant owners, grocery store owners, school districts to bring producers in contact with local vendor opportunities. Agata Maruszewski
Utilize SCAC’s public access channel to deliver the messages and actions of the group to those who are interested in the topics. The meetings can be recorded or PSA can be recorded and broadcast to cable subscriber & accessible over the internet (no cable tv necessary). Agata Maruszewski
Ensure that the annual plan is centered around the serving of LMI individuals living in the aforementioned housing allowing for the use of HUD CBDG funds.
Institutional and organizational roles and responsibilities (tasks forces, committees, needed conversations, etc)
Other, funding, programs, initiatives
1 1 6
8
6
0
5
0
38
4
9

Goal 2: Ensure access to affordable, fresh and healthy food for people who live or work downtown: Meet the needs of
people who will live in the new low-income and market rate housing currently under construction and provide healthy options for using SNAP benefits.
Facilitate micro-markets by utilizing the pocket park and lawns by Old City Hall. This is weather-dependent but good visibility and good parking options in vicinity.
Agata Maruszewski
Work with existing and future retailers to accept SNAP and implement ‘healthy corner store’ strategies. Provide education to SNAP participants on healthy eating options and sources for healthy local foods.
Amy Pendergast
Connect the local farmers to downtown restaurants and markets to create a sustainable food supply system.
Steve Bade
Work with existing small markets to include local food options. This has been done in the past through Cal Fresh, but it is a challenge to sustain if the owner isn’t on board with it.
Mary Messier
Encourage schools in the downtown corridor to establish school gardens by presenting at school staff meetings, identifying a school lead person, and providing resources/links to facilitate development. Suzanne Wall
New Uses in the Downtown
Write grants and/or organize fundraisers to get EBT match for all of our local farmers markets as a sustainable option that our low-income community members can rely on to bolster their affordability to more local, healthy options.
Trisha Funk
Develop Farmer Connections with
Markets/Restaurants
Expand EBT and Match Programs
Utilization Downtown
Downtown and Local Foods Promotion and Education
Assess (survey, forum focus groups, and organize events, etc) new residents of downtown to: learn what types of foods/food venues they prefer; and learn opportunities, barriers, and ideas of residents for accessing their preferred/cultural food choices.
William Wallace, April Jurisich and Sara Sundquist
Communicate local food preferences to local markets and vendors and work with them to help meet resident preferences.
Sara Sundquist
Create and implement a comprehensive educational and promotional program for local food and destinations in downtown Redding.
Elements may include: display literature, print media, wayfinding signs, and materials, shelf tags identifying farmers.
Possible target audiences: MBS property management and residents, new and existing residents, all income levels, local businesses and workers in downtown, Redding Cultural District audience.
Example destinations to promote: Farmers' Markets, new stores, fairs, food banks, Sizzle's Kitchen, restaurants, local food markets, food truck court, etc.
Rachel Hatch, Melinda Brown, Steve Bade, AmyPendergast
Andrew Moiseff, Mary Messier,,Janessa Hartmann, Agata Maruszewski, Sara
Sundquist, and John Truitt
Establish a Plant Nursery Café on California Street.... a non-profit to provide a training center for marginalized individuals and a space for Community Market.
Donna Hale
3
12
8
4
5
5
8
7
1
10
LEGEND# = votes from the prioritization exercise in Google Forms (Session 4)
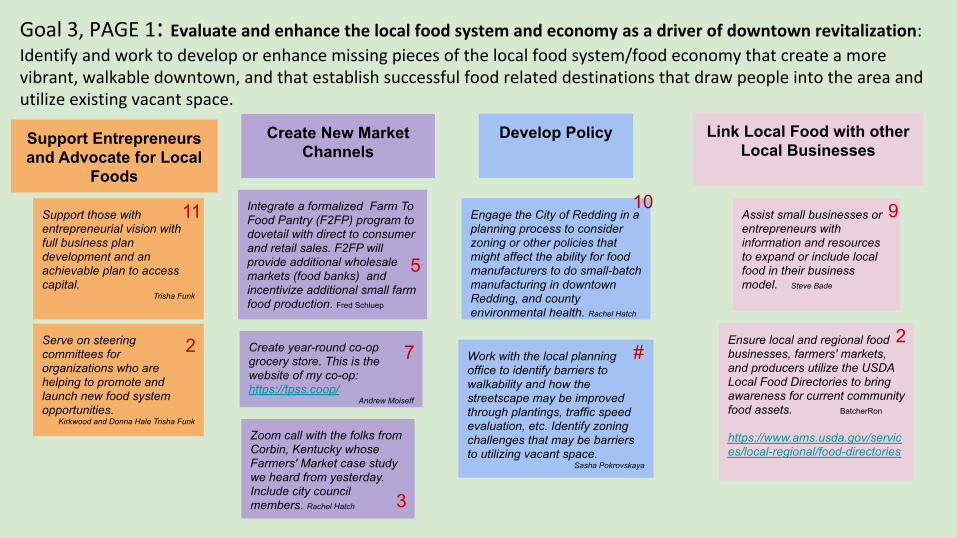
Goal 3, PAGE 1: Evaluate and enhance the local food system and economy as a driver of downtown revitalization:
Identify and work to develop or enhance missing pieces of the local food system/food economy that create a more vibrant, walkable downtown, and that establish successful food related destinations that draw people into the area and utilize existing vacant space.
Ensure local and regional food businesses, farmers' markets, and producers utilize the USDA Local Food Directories to bring awareness for current community food assets. BatcherRon
https://www.ams.usda.gov/servic es/local-regional/food-directories
Support those with entrepreneurial vision with full business plan development and an achievable plan to access capital.
Trisha Funk
Assist small businesses or entrepreneurs with information and resources to expand or include local food in their business model. Steve Bade
Engage the City of Redding in a planning process to consider zoning or other policies that might affect the ability for food manufacturers to do small-batch manufacturing in downtown Redding, and county environmental health. Rachel Hatch
Link Local Food with other Local Businesses
Develop Policy
Create year-round co-op grocery store. This is the website of my co-op: https://tpss.coop/
Andrew Moiseff
Support Entrepreneurs and Advocate for Local
Foods
Serve on steering committees for organizations who are helping to promote and launch new food system opportunities.
Kirkwood and Donna Hale Trisha Funk
Create New Market Channels
Integrate a formalized Farm To Food Pantry (F2FP) program to dovetail with direct to consumer and retail sales. F2FP will provide additional wholesale markets (food banks) and incentivize additional small farm food production. Fred Schluep
Zoom call with the folks from Corbin, Kentucky whose Farmers' Market case study we heard from yesterday. Include city council members. Rachel Hatch
Work with the local planning office to identify barriers to walkability and how the streetscape may be improved through plantings, traffic speed evaluation, etc. Identify zoning challenges that may be barriers to utilizing vacant space.
Sasha Pokrovskaya
2
9
#
10
5
7
3
11
2
LEGEND# = votes from the prioritization exercise in Google Forms (Session 4)

Goal 3, PAGE 2: Evaluate and enhance the local food system and economy as a driver of downtown revitalization: Identify and work to develop or enhance missing pieces of the local food system/food economy that create a more vibrant, walkable downtown, and that establish successful food related destinations that draw people into the area and utilize existing vacant space.
Work with city and county to determine sales tax generated for annual report. Will help make the case to some of the ROI on local food investments. John Truitt
Encourage and train farmers to utilize financial metrics to improve ROI. Fred Schluep
Conduct an analysis or feasibility study to determine what (co-op, farmers' market, healthy corner stores) is most viable downtown and where it should be located. The relationship with the existing farmers' market near City Hall should also be studied.(and/or) Investigate/study possible blended site use, and examine co-located uses for co-op and foodshed/hub on a mini-campus model as part of study. Examining locations should be part of this. Steve Bade, Scott Stollman, Michelle Cave, Mellinda Brown, April Jurisich and Amy Pendergrast
Developing and Using Metrics
Feasibility Studies for Local Food Infrastructure
124
4

Parking lot: Value statements, other ideas, funding and research opportunities, etc
Goal 2 resourceUSDA Food and Nutrition Service SNAP program resources.https://www.fns.usda.gov/snap/supplemental-nutrition-assistance-program Ron Batcher
Goal 2 and 3 resourceFarmers Market Promotion Programhttps://www.ams.usda.gov/services/grants/fmpp
ESTABLISH CLEAR VISION Every plan needs a clear path forward with reasonable goals, both short term & long term.
Michelle Cave
Year round with a set schedule and location.
Take account what residents, workers, and businesses will utilize the program.
Blake Fisher
Downtown Core
Centralized program in the most walkable and vibrant section of downtown.
Benefit local downtown residents, bring people downtown and support surrounding local restaurants/businesses.
Consistent Programing
Blake Fisher
Education and make it fun
Most Redding establishments serve bar food, burgers, fried.
Educate and teach more about local healthy food and how easy it is to produce and cook.
Make it Fun! Sizzle's Kitchen.
Blake Fisher
Goal 2Take full advantage of USDA farmers' market services, from design and marketing to WIC and senior benefits.
Research “New Farms for New Americans” program from burlington Vt. https://www.aalv-vt.org/farms
Andrew Moiseff
Goal 2 or 3Inventory what promotion is being done for downtown and/or the greater Redding area to determine where the gaps are, prioritize new outreach/marketing ideas, and identify possible new partners to promote the area’s unique food assets.
Scott Stollman
Goal 2 or 3More actively promote Downtown Redding and the local area’s unique food assets. Consider exploring local campaigns, local food guide, website, partner with tourism officials, develop a local brand, and others.
Scott Stollman Contact Riverfront Play House, Gold Street Liquors, and the
Gymnastics building on Waldon about possibly sharing vision for
downtown market and parking.
Kirkwood & Donna Hale
Goal 1 and 3 resourceLocal Food Promotion Programhttps://www.ams.usda.gov/services/grants/lfpp
Ron Batcher
LOCAL FOODS, LOCAL PLACES COMMUNITY ACTION PLAN Redding, California
Appendix B: Workshop Participants and Contact List
Appendix B: Workshop Participants
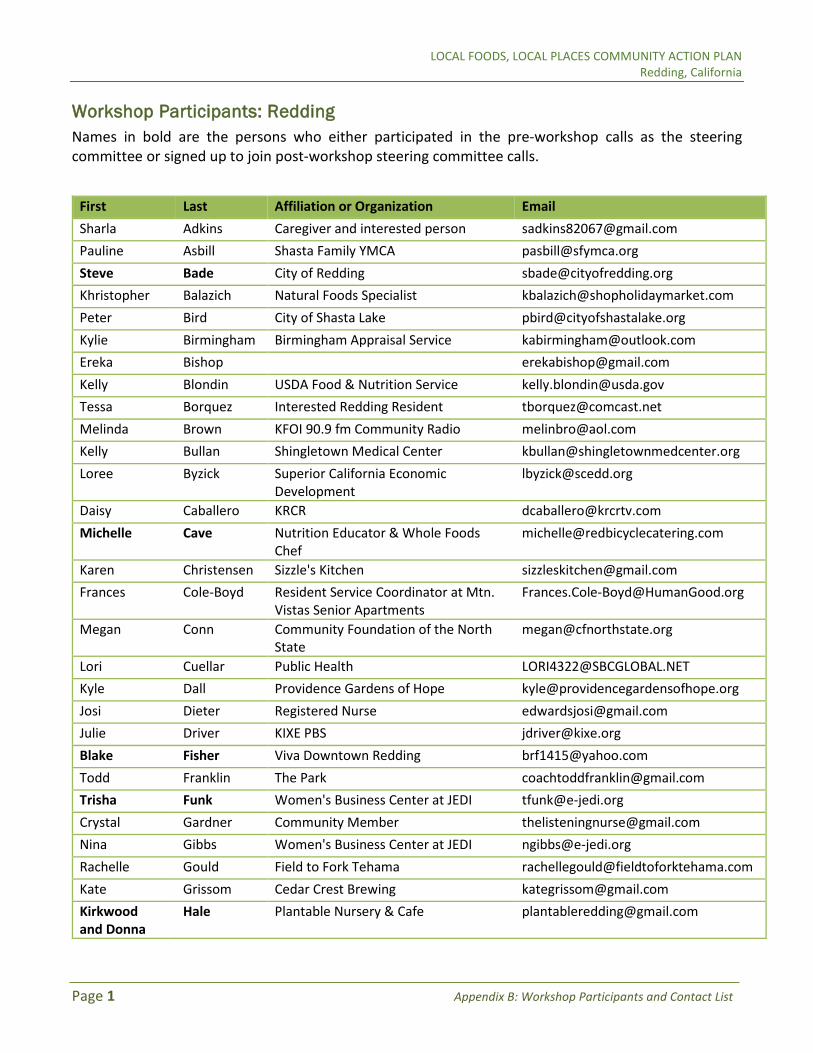
LOCAL FOODS, LOCAL PLACES COMMUNITY ACTION PLAN Redding, California
Page 1 Appendix B: Workshop Participants and Contact List
Workshop Participants: Redding Names in bold are the persons who either participated in the pre-workshop calls as the steering committee or signed up to join post-workshop steering committee calls.
First Last Affiliation or Organization Email Sharla Adkins Caregiver and interested person [email protected] Pauline Asbill Shasta Family YMCA [email protected] Steve Bade City of Redding [email protected] Khristopher Balazich Natural Foods Specialist [email protected] Peter Bird City of Shasta Lake [email protected] Kylie Birmingham Birmingham Appraisal Service [email protected] Ereka Bishop [email protected] Kelly Blondin USDA Food & Nutrition Service [email protected] Tessa Borquez Interested Redding Resident [email protected] Melinda Brown KFOI 90.9 fm Community Radio [email protected] Kelly Bullan Shingletown Medical Center [email protected] Loree Byzick Superior California Economic
Development [email protected]
Daisy Caballero KRCR [email protected] Michelle Cave Nutrition Educator & Whole Foods
Chef [email protected]
Karen Christensen Sizzle's Kitchen [email protected] Frances Cole-Boyd Resident Service Coordinator at Mtn.
Vistas Senior Apartments [email protected]
Megan Conn Community Foundation of the North State
Lori Cuellar Public Health [email protected] Kyle Dall Providence Gardens of Hope [email protected] Josi Dieter Registered Nurse [email protected] Julie Driver KIXE PBS [email protected] Blake Fisher Viva Downtown Redding [email protected] Todd Franklin The Park [email protected] Trisha Funk Women's Business Center at JEDI [email protected] Crystal Gardner Community Member [email protected] Nina Gibbs Women's Business Center at JEDI [email protected] Rachelle Gould Field to Fork Tehama [email protected] Kate Grissom Cedar Crest Brewing [email protected] Kirkwood and Donna
Hale Plantable Nursery & Cafe [email protected]

LOCAL FOODS, LOCAL PLACES COMMUNITY ACTION PLAN Redding, California
Page 2 Appendix B: Workshop Participants and Contact List
First Last Affiliation or Organization Email Tricia Hamelberg healthy hiker [email protected] Whitney Hancock Redding City Dance Company [email protected] Janessa Hartmann Public Health [email protected] Rachel Hatch Program Officer for Community
Vitality with The McConnell Foundation
Shad Herrera [email protected] Lilly Honey Pastor, Agape Family Fellowship [email protected] Stephanie Hughes [email protected] Orle Jackson Tehama County Community Food
Alliance [email protected]
Angie James Downtown business owner [email protected] Margaret Jensen Hill Country clinics and farmer [email protected] Tammy Jones VIVA Downtown [email protected] April Jurisich Shasta County Health & Human
Services Agency [email protected]
Ashley Krueger Fusion Lounge [email protected] Sadie Krueger Gardens is Hope/Providence
International [email protected]
Chelsie Landon K2 Development Companies [email protected] Sue Lang Viva Downtown Redding [email protected] James Leedy Enterprise High School [email protected] Jake Mangas Redding Chamber of Commerce [email protected] Agata Maruszewski Shasta County Arts Council [email protected] Leona McCoach Merchants Bank of Commerce [email protected] Carmelita Meigs Redding Rancheria Senior nutrition
cook [email protected]
Mary Messier Healthy Shasta (LFLP primary point of contact)
Eythana Miller Shasta Family YMCA [email protected] Bob Nash SCEDD [email protected] Marla O'Brien soon-to-be downtown Redding
resident [email protected]
Sally Paoli After school Site Coordinator [email protected] Amy Pendergast Healthy Shasta [email protected] Heather Phillips Little Sprouts Micro Farm & Gather
Redding Collaborative CSA [email protected]
Nikki Reeves The Living Water Studio [email protected] Alexis Ross Dignity Health - Mercy Medical Center
Redding [email protected]

LOCAL FOODS, LOCAL PLACES COMMUNITY ACTION PLAN Redding, California
Page 3 Appendix B: Workshop Participants and Contact List
First Last Affiliation or Organization Email Bruce Ross Office of Senator Brian Dahle [email protected] Jeramie Sabelman Japanese Blossoms & Synergy Foods [email protected]
Fred Schluep Growing Local Shasta [email protected] Kristen Schreder Redding City Council [email protected]
Julie Schroeder Shasta Family YMCA [email protected] Jackie Scott First 5 Shasta [email protected] Shawnice Sellers CalFresh Healthy Living, University of
California Cooperative Extension [email protected]
Colleen Shelly School CAFE (culinary action for education)
Steve Sibilsky Growing Local [email protected] Megan Smith Shasta Community Health Center [email protected] Ronica Sowers community member [email protected] Carrie Stevens Good News Rescue Mission [email protected] Sara Sundquist Healthy Shasta Coordinator [email protected] Marianne Sweetwood Shasta Familiy YMCA [email protected] Susan Tangeman veterinarian/farmer [email protected] John Truitt Viva Downtown Redding ("Main Street
America" Organization) [email protected]
Paul Truong [email protected] Suzanne Wall Burney Gardener [email protected]
Cristina Wallace [email protected]
Federal and State Agency Partners
First Last Organization Email Cynthia Abbott Department of Housing and Urban
Development - San Francisco Region IX (Sacramento, CA)
Ron Batcher USDA AMS Transportation and Marketing (Washington DC)
Michael Huff Department of Housing and Urban Development
Robert Jamieson Department of Housing and Urban Development
Patrick Kelly USDA Agricultural Marketing Service [email protected] Heather Luzzi U.S. Small Business Administration [email protected] Malinda Matson US Economic Development Administration [email protected]

LOCAL FOODS, LOCAL PLACES COMMUNITY ACTION PLAN Redding, California
Page 4 Appendix B: Workshop Participants and Contact List
Andrew Moiseff EPA HQ Office of Community Revitalization (Washington DC)
Carolyn Mulvihill EPA Region 9 [email protected] Sasha Pokrovskaya AMS Transportation and Marketing
(Washington DC) [email protected]
Frances Sakaguchi Economic Development Administration [email protected] Samantha Schaffstall USDA AMS Transportation and Marketing
(Portland, OR) [email protected]
Scott Stollman EPA Region 9 (San Francisco, CA) [email protected]
Planning Assistant Consultants/Facilitators
First Name Last Name Affiliation/Org (if applicable) Email Jen Dalton Kitchen Table Consulting [email protected]
Jason Espie EPR, P.C. [email protected]
Miles Gordon Kitchen Table Consulting [email protected]
Phil White EPR, P.C. [email protected]
William Wallace Superior California Economic Development [email protected]

LOCAL FOODS, LOCAL PLACES COMMUNITY ACTION PLAN
Redding, California
Appendix C: Community Data Profile
Appendix C: Community Data Profile
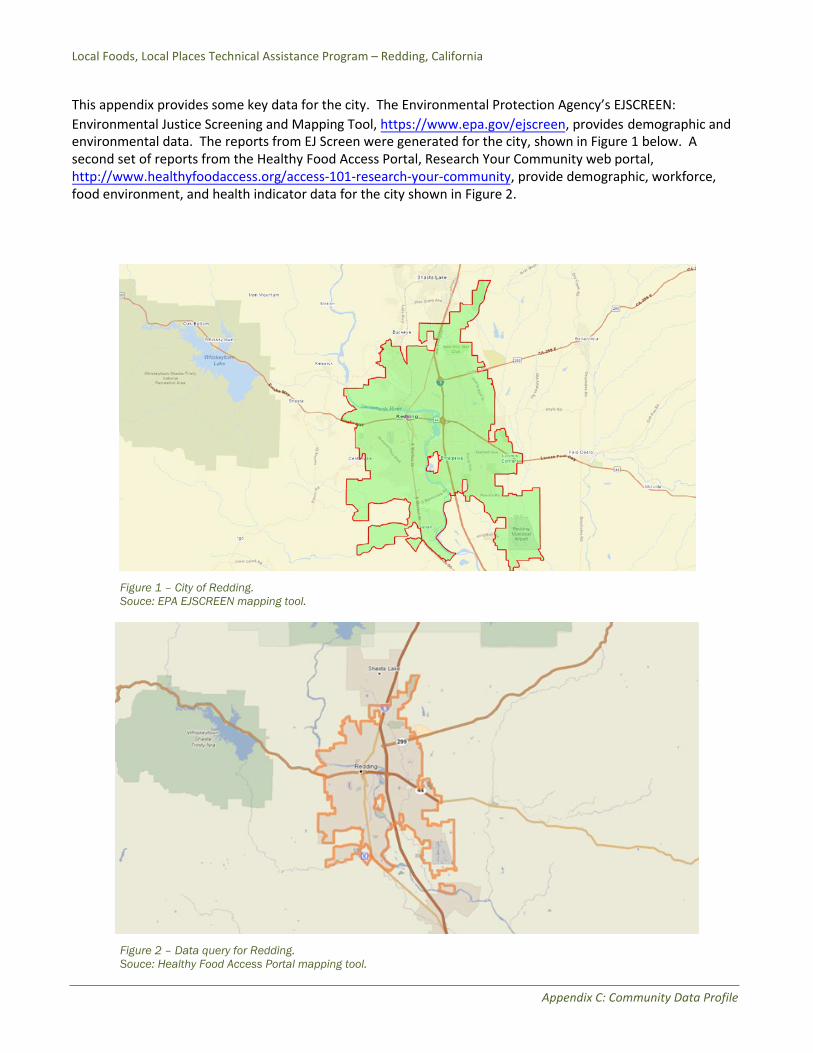
Appendix C: Community Data Profile
Local Foods, Local Places Technical Assistance Program – Redding, California
This appendix provides some key data for the city. The Environmental Protection Agency’s EJSCREEN: Environmental Justice Screening and Mapping Tool, https://www.epa.gov/ejscreen, provides demographic and environmental data. The reports from EJ Screen were generated for the city, shown in Figure 1 below. A second set of reports from the Healthy Food Access Portal, Research Your Community web portal, http://www.healthyfoodaccess.org/access-101-research-your-community, provide demographic, workforce, food environment, and health indicator data for the city shown in Figure 2.
Figure 1 – City of Redding. Souce: EPA EJSCREEN mapping tool.
Figure 2 – Data query for Redding. Souce: Healthy Food Access Portal mapping tool.
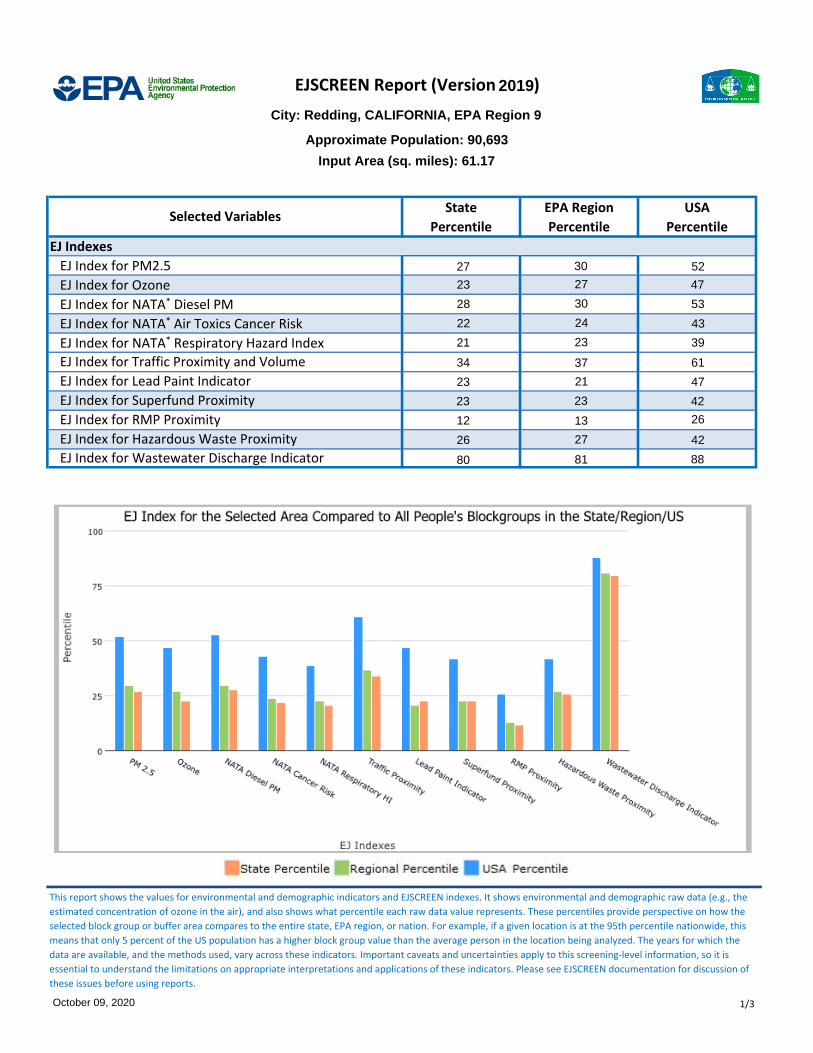
State
Percentile
EPA Region
Percentile
USA
Percentile
1/3
Selected Variables
EJ Index for PM2.5
EJ Index for Ozone
EJ Index for NATA* Diesel PM
EJ Index for Wastewater Discharge Indicator
EJ Indexes
This report shows the values for environmental and demographic indicators and EJSCREEN indexes. It shows environmental and demographic raw data (e.g., the estimated concentration of ozone in the air), and also shows what percentile each raw data value represents. These percentiles provide perspective on how the selected block group or buffer area compares to the entire state, EPA region, or nation. For example, if a given location is at the 95th percentile nationwide, this means that only 5 percent of the US population has a higher block group value than the average person in the location being analyzed. The years for which the data are available, and the methods used, vary across these indicators. Important caveats and uncertainties apply to this screening-level information, so it is essential to understand the limitations on appropriate interpretations and applications of these indicators. Please see EJSCREEN documentation for discussion of these issues before using reports.
EJ Index for NATA* Air Toxics Cancer Risk
EJ Index for NATA* Respiratory Hazard Index
EJ Index for Traffic Proximity and Volume
EJ Index for Lead Paint Indicator
EJ Index for Superfund Proximity
EJ Index for RMP Proximity
EJ Index for Hazardous Waste Proximity
EJSCREEN Report (Version )
22
28
23
27
21
34
23
80
26
12
23
24
30
27
30
23
37
21
81
27
13
23
43
53
47
52
39
61
47
88
42
26
42
City: Redding, CALIFORNIA, EPA Region 9
Approximate Population: 90,693
October 09, 2020
Input Area (sq. miles): 61.17
2019

2/3
EJSCREEN Report (Version )
Superfund NPLHazardous Waste Treatment, Storage, and Disposal Facilities (TSDF)
Sites reporting to EPA
City: Redding, CALIFORNIA, EPA Region 9
Approximate Population: 90,693
October 09, 2020
Input Area (sq. miles): 61.17
2019
00
zhuangv
Highlight

EJSCREEN Report (Version )
Value State
Avg.
%ile in
State
EPA
Region
Avg.
%ile in
EPA
Region
USA
Avg.
%ile in
USA
3/3
RMP Proximity (facility count/km distance)Hazardous Waste Proximity (facility count/km distance)Wastewater Discharge Indicator (toxicity-weighted concentration/m distance)
Demographic Index
Population over 64 years of age
Minority PopulationLow Income PopulationLinguistically Isolated PopulationPopulation With Less Than High School EducationPopulation Under 5 years of age
Demographic Indicators
EJSCREEN is a screening tool for pre-decisional use only. It can help identify areas that may warrant additional consideration, analysis, or outreach. It does not provide a basis for decision-making, but it may help identify potential areas of EJ concern. Users should keep in mind that screening tools are subject to substantial uncertainty in their demographic and environmental data, particularly when looking at small geographic areas. Important caveats and uncertainties apply to this screening-level information, so it is essential to understand the limitations on appropriate interpretations and applications of these indicators. Please see EJSCREEN documentation for discussion of these issues before using reports. This screening tool does not provide data on every environmental impact and demographic factor that may be relevant to a particular location. EJSCREEN outputs should be supplemented with additional information and local knowledge before taking any action to address potential EJ concerns.
For additional information, see: www.epa.gov/environmentaljustice
Selected Variables
Environmental Indicators
Particulate Matter (PM 2.5 in µg/m3)Ozone (ppb)NATA* Diesel PM (µg/m3)NATA* Cancer Risk (lifetime risk per million)NATA* Respiratory Hazard IndexTraffic Proximity and Volume (daily traffic count/distance to road)Lead Paint Indicator (% Pre-1960 Housing)Superfund Proximity (site count/km distance)
* The National-Scale Air Toxics Assessment (NATA) is EPA's ongoing, comprehensive evaluation of air toxics in the United States. EPA developed the NATA to prioritize air toxics, emission sources, and locations of interest for further study. It is important to remember that NATA provides broad estimates of health risks over geographic areas of the country, not definitive risks to specific individuals or locations. More information on the NATA analysis can be found at: https://www.epa.gov/national-air-toxics-assessment.
Demographic Indicators
City: Redding, CALIFORNIA, EPA Region 9
Approximate Population: 90,693
October 09, 2020
Input Area (sq. miles): 61.17
2019
48.5
5.87
0.208
0.15
0.26
0.61
0.059
0.16
520
0.71
44
31%
22%
19%
6%
8%
1%
39%
48.2
9.78
0.468
17
3.4
1.1
0.18
0.29
2000
0.55
36
48%
62%
34%
9%
18%
6%
13%
47%
59%
34%
8%
17%
6%
14%
36%
39%
33%
4%
13%
6%
15%
48.9
9.21
0.479
31
2.9
0.99
0.15
0.24
1700
0.53
35
43
8.3
0.479
14
4
0.74
0.13
0.28
750
0.44
32
52
3
15
83
19
51
36
45
35
90
89
25
8
62
19
35
47
79
27
11
62
24
37
47
78
51
41
65
51
44
51
73
46
6
<50th
84
25
56
42
53
43
90-95th
80-90th
87
5
<50th
91
40
64
48
47
69
95-100th
90-95th
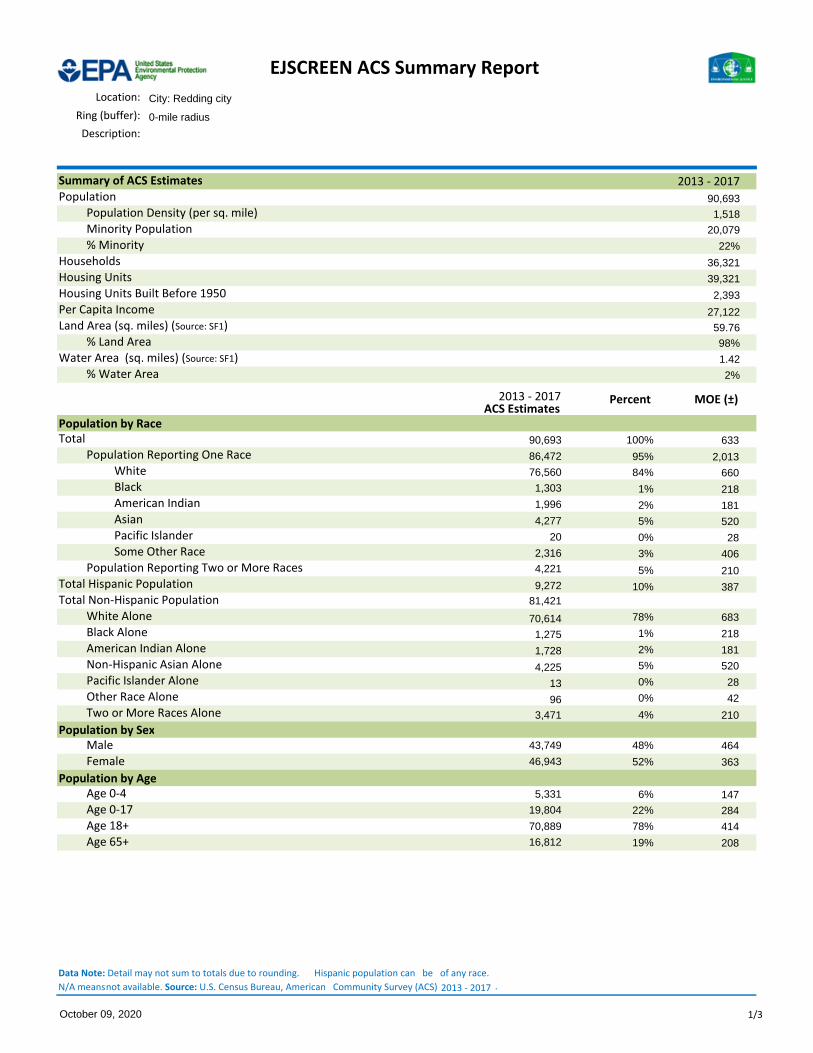
ACS EstimatesPercent MOE (±)
Population by Race
Population Density (per sq. mile)
EJSCREEN ACS Summary Report
Summary of ACS Estimates
Population
Population Reporting One Race
Minority Population
% Minority
Households
Housing Units
Housing Units Built Before 1950
Per Capita Income
Land Area (sq. miles) (Source: SF1)
% Land Area
Water Area (sq. miles) (Source: SF1)
% Water Area
Total
White
Black
American Indian
Asian
Population by Sex
Population by Age
American Indian Alone
Asian
Pacific Islander
Some Other Race
Population Reporting Two or More Races
Total Hispanic Population
Total Non-Hispanic Population
White Alone
Black Alone
Non-Hispanic Asian Alone
Pacific Islander Alone
Other Race Alone
Two or More Races Alone
Male
Female
Age 0-4
Age 0-17
Age 18+
Age 65+
Data Note: Detail may not sum to totals due to rounding. Hispanic population can be of any race. N/A means not available. Source: U.S. Census Bureau, American Community Survey (ACS) .
1/3
Location:Ring (buffer):
Description:
City: Redding city
0-mile radius
2013 - 2017
2013 - 2017
90,693
1,518
20,079
22%
36,321
39,321
2,393
27,122
59.76
98%
1.42
2%
90,693 633
86,472 95% 2,013
76,560 84% 6601,303 1% 2181,996 2% 181
4,277 5% 520
20 0% 28
2,316 3% 4064,221 5% 2109,272 10% 387
81,421
70,614 78% 683
1,275 1% 218
1,728 2% 181
4,225 5%
13 0%
520
28
96 0% 42
100%
3,471 4% 210
43,749 48% 464
46,943 52% 363
5,331 6% 14719,804 22% 284
70,889 78% 414
16,812 19% 208
October 09, 2020
2013 - 2017
zhuangv
Highlight
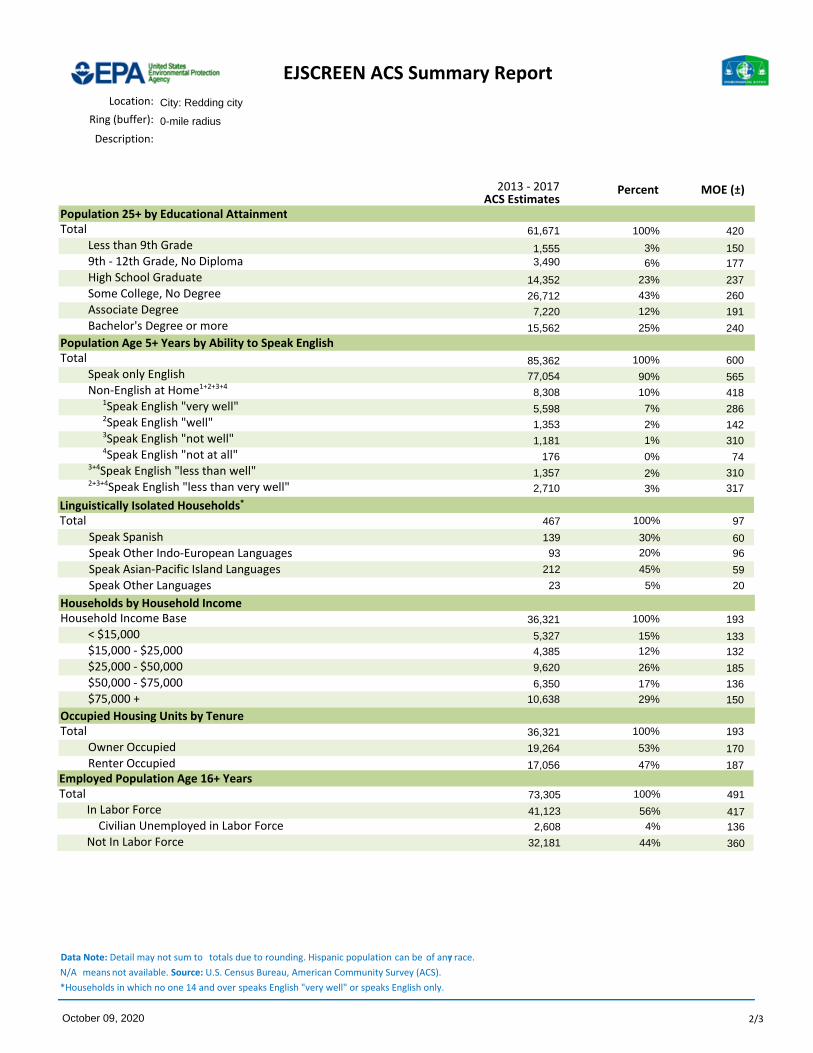
ACS EstimatesPercent MOE (±)
Population 25+ by Educational Attainment
2+3+4Speak English "less than very well"
Non-English at Home1+2+3+4
High School Graduate
Some College, No Degree
Associate Degree
Population Age 5+ Years by Ability to Speak English Total
Speak only English
1Speak English "very well"2Speak English "well"3Speak English "not well"4Speak English "not at all"
3+4Speak English "less than well"
Bachelor's Degree or more
Total
Less than 9th Grade
9th - 12th Grade, No Diploma
Occupied Housing Units by Tenure
$50,000 - $75,000
$75,000 +
Total
Owner Occupied
Households by Household Income
Household Income Base
< $15,000
$15,000 - $25,000
$25,000 - $50,000
EJSCREEN ACS Summary Report
2/3
Linguistically Isolated Households* Total
Speak SpanishSpeak Other Indo-European LanguagesSpeak Asian-Pacific Island LanguagesSpeak Other Languages
Location:Ring (buffer):
Description:
In Labor Force Civilian Unemployed in Labor Force Not In Labor Force
Renter Occupied
Employed Population Age 16+ Years Total
Data Note: Detail may not sum to totals due to rounding. Hispanic population can be of any r race. N/A means not available. Source: U.S. Census Bureau, American Community Survey (ACS).*Households in which no one 14 and over speaks English "very well" or speaks English only.
City: Redding city
0-mile radius
2013 - 2017
October 09, 2020
61,671 100% 420
1,555 3% 1503,490 6% 177
14,352 23% 237
26,712 43% 260
7,220 12% 191
15,562 25% 240
85,362 100% 600
77,054 90% 565
8,308 10% 418
5,598 7% 286
1,353 2% 142
1,181 1% 310
176 0% 74
1,357 2% 310
2,710 3% 317
467 100% 97
139 30% 6093 20% 96
212 45% 59
23 5% 20
36,321 100% 193
5,327 15% 1334,385 12% 132
9,620 26% 185
6,350 17% 13610,638 29% 150
36,321 100% 193
19,264 53% 170
17,056 47% 187
73,305 100% 491
41,123 56% 4172,608 4% 136
32,181 44% 360

ACS EstimatesPercent MOE (±)
English
Spanish
French
French Creole
Italian
Portuguese
German
Yiddish
Other West Germanic
Scandinavian
Greek
Russian
Polish
Serbo-Croatian
Other Slavic
Armenian
Persian
Gujarathi
Hindi
Urdu
Other Indic
Other Indo-European
Chinese
Japanese
Korean
Mon-Khmer, Cambodian
Hmong
Thai
Laotian
Vietnamese
Other Asian
Tagalog
Other Pacific Island
Navajo
Other Native American
Hungarian
Arabic
Hebrew
African
Other and non-specified
Total Non-English
.
Data Note: Detail may not sum to totals due to rounding. Hispanic popultion can be of any race. N/A means not available. Source: U.S. Census Bureau, American Community Survey (ACS)*Population by Language Spoken at Home is available at the census tract summary level and up.
Population by Language Spoken at Home* Total (persons age 5 and above)
EJSCREEN ACS Summary Report
3/3
Location:Ring (buffer):
Description:
City: Redding city
0-mile radius
2013 - 2017
October 09, 2020
2013 - 2017
83,689 100% 596
75,685 90% 6263,725 4% 336
227 0% 280N/A N/A N/AN/A N/A N/AN/A N/A N/A457 1% 92N/A N/A N/AN/A N/A N/AN/A N/A N/AN/A N/A N/AN/A N/A N/AN/A N/A N/AN/A N/A N/AN/A N/A N/AN/A N/A N/AN/A N/A N/AN/A N/A N/AN/A N/A N/AN/A N/A N/AN/A N/A N/A
302271N/A36
N/AN/AN/AN/A80
915 1%
217
709 1%
111
N/A N/A
N/A
79 0%
N/A
N/A N/A
N/A
N/A N/A
N/A
N/A N/A
144
N/A N/A
N/A
130 0%
N/A
997 1%
44
243 0%
864
N/A N/AN/A N/AN/A N/AN/A N/A166 0%N/A N/AN/A N/A117 0%
8,004 10%

October 9, 2020
Accessing healthy food is a challenge for some Americans- particularly those living in low-income neighborhoodsand communities of color. Research has shown that, if aperson is Black, Hispanic or living in a low-income blockgroup they are more likely to live in an area with limitedaccess to a full service supermarket.
Current estimates show that the area has steadily grownsince 2000 and the total population is 91,327 people.According to 2014-2018 American Community Survey(ACS) data, the population of a minority race was 21.88%and 10.35% were of Hispanic ethnicity. In terms of age,21.87% were children under age 18, while 18.93% wereover age 65.
Demographics in Redding, CA
Redding 2000 2010 2014-2018
Total Population 81,198 89,861 91,327
Pct. Hispanic 5.5% 8.7% 10.3%
Pct. Minority 14.5% 18.7% 21.9%
Pct. < 18 Years 26.2% 22.8% 21.9%
Pct. 65 or Older 15.5% 16.4% 18.9%
Median Household Income
Redding California
Median Household Income (2014-2018) $50,579 $71,228
Source: Census 2000, Census 2010, Census ACS 2014-2018
Some communities look to improve access to food for existingresidents by meeting both the demands from the daytime population(workforce) and the residential population. The table at right shows thenumber of people in the workforce that are employed within the areaand the number of people who reside in the area who are part of theworkforce. This data tells us that 39,818 people work in Redding, while29,667 workers reside in Redding according to the Local Employer-Household Dynamics data. Increasing the number of healthy foodretailers can lead to jobs and may be a force of revitalizingeconomically distressed communities.
Local Employment in Redding
Resident Employed
Total Workers (2015) 29,667 39,818
Source: Bureau of Labor Statistics, Local Employment-Household Dynamics
Research Your Community
Report for Redding, CAThis report provides information about the population living within the city andtheir food environment.
Demographics
Workforce and Unemployment

Redding's unemployment rate is 4.5%,compared to the statewide unemployment rateof 4.3%. The Supplemental NutritionAssistance Program (SNAP) is the largestdomestic hunger safety net program(according to the USDA). It serves many low-income people, including those who arecurrently unemployed.
Within Shasta County, 13.98% of peoplereceived SNAP benefits in 2011, amounting to$40,511,000 in benefits to programparticipants.
Source: Bureau of Labor Statistics, Local Employment-Household Dynamics
Determining if a community is underserved by healthy food retailers can be acomplicated process that includes a variety of factors including populationdensity, car ownership rates, and the quality and location of supermarkets, grocerystores and farmers markets. Researchers have produced many studies and onlinetools to help communities to identify areas with limited access to supermarketsand sources of healthy food. Methods and measures vary but two studies andnational online data tools are Reinvestment Fund's Limited Supermarket Access(LSA) Study and the U.S. Department of Agriculture (USDA) Food Access ResearchAtlas. These studies seek to provide guidance on how to understand whether anew supermarket, an expansion of an existing store, or a farmer's market is theappropriate strategy to pursue.
In 2016, there were 15 full service supermarkets located in Redding. There are 10Limited Service stores located within the study area, and 5 farmers' markets. SNAPbenefits are accepted at 96 participating stores, farmer's markets, social serviceagencies or other non retail providers in this community.
According to the USDA, 13 of 31 census tracts in Redding are Low-Income, Low-Access tracts. (Show/hide list of USDA Low-Income, Low-Access Tracts)
Food Retailers in Redding
Full Service Supermarkets 15
Limited Service Stores 10
SNAP Retailers 96
Farmers' Markets 5
Fast-food and Takeout Restaurants N/A
Source: USDA ERS Food Access, Census County Business Patterns, USDAAgricultrual Marketing Service, Reinvestment Fund Study of Low
Supermarket Access
Based on Reinvestment Fund's 2014 analysis, there are 0LSA areas within Redding.
Food Environment
Annual Unemployment
2004 2005 2006 2007 2008 2009 2010 2011 2012 2013 2014 2015 2016 2017 2018
0
5
10
15
20
Redding California

The Centers for Disease Control (CDC) provides surveydata about the health of the residents within an area. Thechart at right displays the Body Mass Index (BMI)classification for adults in Redding. It reports that 38.74%of the population is considered overweight and 25.74% isconsidered obese.
Source: CDC Behavioral Risk Factor Surveillance System 2013, ACS 2009-2013
According to the CDC, fruits and vegetables are critical topromoting good health. Most adults need to increase theamount of fruits and vegetables they currently eat to getthe amount that's recommended every day. The CDCreports that the recommended level of consumptiondepends upon an individual's age, weight and current levelof physical activity. Visit ChooseMyPlate.gov for specificson how many servings to eat. Of the adult residents inRedding, 86% reported eating fewer than 5 fruits andvegetables per day, and 14% report eating five or more perday.
Source: CDC Behavioral Risk Factor Surveillance System 2013, ACS 2009-2013
Areas within Redding may be targeted for economic development orcommunity development activities. By working within these areas,community development entities or commercial operators may be ableto seek grants or loans to finance intervention strategies that addressthe community's lack of food access. Some certified CommunityDevelopment Financial Institutions (CDFIs) operate specific programsdesigned to finance food retailers that choose to locate in an area thatotherwise lacks healthy food access. The New Markets Tax Credit(NMTC) Program is another federal incentive structure that can providefinancing to large commercial developments in eligible areas.
Community Development Block Grant (CDBG) eligible block groups areplaces that the Department of Housing and Urban Development (HUD)has designated for targeted resources. Within this target area, there are26 CDBG eligible block groups and 17 NMTC eligible tracts. There are92 CDFIs working to improve distressed areas of the state. (See list ofcertified CDFIs in California)
Federal Program and Investment Dollars in Redding, CA
New Markets Tax Credit Investments (QLICI) 2013-2017 $0
CDFI Loans/Investments 2008-2017 $0
Source: CDFI Fund, HUD
Health
Fruit and Vegetable Consumption
Federal Programs & Investments
BMI Classification in 2013, Redding
Obese
Overweight
Not Overweight or Obese
25.7%
38.7%
35.5%
Number of Fruits/Vegetables Consumed per day in 2013, Redding
Fewer than 1
1 to 2
3 to 4
5 or more9%
46%
30%
14%
LOCAL FOODS, LOCAL PLACES COMMUNITY ACTION PLAN Redding, California
Appendix D: Funding Resources
Appendix D: Funding

LOCAL FOODS, LOCAL PLACES COMMUNITY ACTION PLAN Redding, California
Page 1 Appendix D: Funding Resources
Contents USDA Agricultural Marketing Service ..................................................................................................... 2
USDA Rural Development ....................................................................................................................... 4
USDA National Institute of Food and Agriculture ................................................................................... 5
USDA Natural Resources Conservation Service ...................................................................................... 6
USDA Farm Service Agency ..................................................................................................................... 7
USDA Food and Nutrition Service ........................................................................................................... 7
U.S. Environmental Protection Agency ................................................................................................... 8
U.S. Department of Housing and Urban Development ........................................................................ 10
U.S. Small Business Administration ...................................................................................................... 11
Appalachian Regional Commission ....................................................................................................... 11
Others ................................................................................................................................................... 12
Private Grant Funding ........................................................................................................................... 13

LOCAL FOODS, LOCAL PLACES COMMUNITY ACTION PLAN Redding, California
Page 2 Appendix D: Funding Resources
Cities and towns can strengthen their local food systems through a variety of federal, state, local, and philanthropic projects and programs. USDA and other federal agencies help support local food systems by working with producers, engaging with communities, financing local processing and distribution, or helping retailers develop local food connections. Below are some of the resources available.
USDA Agricultural Marketing Service The information below reflects information from the FY2020 Request for Application (RFA). This information could change in the FY2021 RFA.
Farmers Market Promotion Program
The program aims to increase domestic consumption of and access to locally and regionally produced agricultural products, and to develop new market opportunities for farm and ranch operations serving local markets. This program can support the development, improvement, and expansion of farmers' markets, agritourism activities, and other direct producer-to-consumer market opportunities. There are two type of FMPP grants: Capacity Building (CB) and Community Development Training and Technical Assistance (CTA). CB projects are intended to assist applicants to achieve its mission and build long-term organizational capacity in the development, coordination, and expansion of domestic farmers' markets, roadside stands, CSA programs, agritourism activities, online sales, or other direct producer-to-consumer (including direct producer-to-retail, direct producer-to-restaurant and direct producer-to-institutional marketing) market opportunities. CTA projects are intended to assist applicants’ efforts to provide outreach, training, and technical assistance to farm and ranch operations serving local markets and other interested parties for developing, coordinating, and expanding domestic farmers' markets, roadside stands, CSA programs, agritourism activities, online sales, or other direct producer-to-consumer (including direct producer-to-retail, direct producer-to-restaurant and direct producer-to-institutional marketing) market opportunities. The program requires cost sharing or matching 25 percent of the grant.
Project Type Duration (Months) Minimum Award Maximum Award CB 36 $50,000 $250,000 CTA 36 $100,000 $500,000
https://www.ams.usda.gov/services/grants/fmpp
Local Food Promotion Program
The program offers grant funds to support the development and expansion of local and regional food business enterprises to increase domestic consumption of, and access to, locally and regionally produced agricultural products, and to develop new market opportunities for farm and ranch operations serving local markets. Planning grants fund the planning stages of establishing or expanding a local and regional food business enterprise. Activities can include but are not limited to market research, feasibility studies, and business planning. Implementation grants help establish, improve, or expand local and regional food business enterprises. Activities can include but are not limited to training and technical assistance for the business enterprise and/or for producers working with the business enterprise; outreach and

LOCAL FOODS, LOCAL PLACES COMMUNITY ACTION PLAN Redding, California
Page 3 Appendix D: Funding Resources
marketing to buyers and consumers; and non-construction infrastructure improvements to business enterprise facilities or information technology systems. The program requires cost sharing or matching 25 percent of the grant.
Project Type Duration (Months) Minimum Award Maximum Award Planning 18 $25,000 $100,000 Implementation 36 $100,000 $500,000
https://www.ams.usda.gov/services/grants/lfpp
Organic Certification Cost Share Programs
Two Organic Certification Cost Share Programs help certified organic operations defray the costs associated with organic certification. Organic operations can be reimbursed for 50 percent of their certification costs up to $500. https://www.ams.usda.gov/services/grants/occsp
Regional Food System Partnerships
The Regional Food System Partnerships (RFSP) program supports partnerships that connect public and private resources to plan and develop local or regional food systems. Effort is focused on building and strengthening local or regional food economy viability and resilience by alleviating unnecessary administrative and technical barriers for participating partners. RFSP is implemented through two project types: Planning and Designand Implementation and Expansion. Planning and Design projects support partnerships in the early stages of convening, envisioning, and planning processes for developing local or regional food systems. Implementation and Expansion projects support partnerships building on prior or ongoing efforts within a local or regional food system. The program requires cost sharing or matching 25 percent of the grant.
Project Type Duration (Months) Minimum Award Maximum Award Planning & Design 24 $100,000 $250,000 Implementation & Expansion
36 $250,000 $1,000,000
https://www.ams.usda.gov/services/grants/rfsp
USDA Programs in the Local Food Supply Chain
The Agricultural Marketing Service created a fact sheet to help identify which USDA grants and programs apply to you depending on your place in the local and regional food system. https://www.ams.usda.gov/sites/default/files/media/FoodSupplyChainFactSheet.pdf

LOCAL FOODS, LOCAL PLACES COMMUNITY ACTION PLAN Redding, California
Page 4 Appendix D: Funding Resources
USDA Rural Development USDA Rural Development Summary of All Programs
USDA Rural Development is committed to helping improve the economy and quality of life in rural America. Through our programs, we help rural Americans in many ways. We offer loans, grants and loan guarantees to help create jobs and support economic development and essential services such as housing; health care; first responder services and equipment; and water, electric and communications infrastructure. The page below is a landing page for all programs and the PDF “program matrix” offers a useful summary of all programs. This funding appendices for Local Foods, Local Places indentifes below some specific Rural Development grant and loan offerings that specifically mention local food systems.
https://www.rd.usda.gov/page/all-programs https://www.rd.usda.gov/files/RD_ProgramMatrix.pdf
Rural Development COVID-19 Response
USDA Rural Development has taken a number of immediate actions to help rural residents, businesses, and communities affected by the COVID-19 outbreak. Rural Development will keep our customers, partners, and stakeholders continuously updated as more actions are taken to better serve rural America. Below are three sites, the landing page for USDA RD COVID-19, a COVID-19 Federal Rural Resrouce Guide (PDF), and an Immediate Actions Fact Sheet.
https://rd.usda.gov/coronavirus https://rd.usda.gov/sites/default/files/USDA_COVID-19_Fed_Rural_Resource_Guide.pdf https://rd.usda.gov/sites/default/files/USDA_RD_SA_COVID19_ProgramImmediateActions.pdf
Community Facilities Direct Loan and Grant Program
This program provides funding to develop essential community facilities in rural areas with no more than 20,000 residents. Funds can be used to purchase, construct, and/or improve local food system facilities such as community gardens, food pantries, community kitchens, food banks, food hubs, and greenhouses. The program offers grants of up to 75 percent of eligible project costs, low-interest loans, and loan guarantees. http://www.rd.usda.gov/programs-services/community-facilities-direct-loan-grant-program
Economic Impact Initiative Grant Program
Funding for essential community facilities is also available through this program for communities with extreme unemployment and severe economic depression. An essential community facility is one that provides an essential service to the local community, is needed for the orderly development of the community, serves a primarily rural area, and does not include private, commercial or business undertakings. http://www.rd.usda.gov/programs-services/economic-impact-initiative-grants

LOCAL FOODS, LOCAL PLACES COMMUNITY ACTION PLAN Redding, California
Page 5 Appendix D: Funding Resources
Rural Business Development Grants
These grants fund technical assistance, training, and other activities leading to the development or expansion of small businesses in rural areas with no more than 50,000 residents. Generally, grants range from $10,000 up to $500,000 and do not require cost sharing. The program can support activities such as training and technical assistance; acquisition or development of land; construction or renovation of buildings, equipment, roads, and utilities; capitalization of revolving loan funds; rural transportation improvements; feasibility studies and business plans; and rural business incubators. http://www.rd.usda.gov/programs-services/rural-business-development-grants
Rural Microentrepreneur Assistance Program
This micro-loan program can fund agriculture production activities. Potential loan recipients would need to find out if there is an existing loan fund in their geographic area, or an experienced lending organization could apply to Rural Develpent to start a loan fund. https://www.rd.usda.gov/programs-services/rural-microentrepreneur-assistance-program
Value-Added Producer Grants
These grants help agricultural producers with the processing and marketing of value-added products. The program aims to generate new products, create and expand marketing opportunities, and increase producer income. Planning grants of up to $75,000 can be used for activities such as conducting feasibility studies and developing business plans for processing and marketing a value-added product. Working capital grants of up to $250,000 can be used for processing costs, marketing and advertising expenses, and some inventory and salary expenses. The grants require matching funds of 50 percent of total project costs. http://www.rd.usda.gov/programs-services/value-added-producer-grants
USDA National Institute of Food and Agriculture Beginning Farmer and Rancher Development Program
This program provides grants to collaborative partnerships of public or private entities for education, mentoring, and technical assistance initiatives for beginning farmers or ranchers. https://nifa.usda.gov/program/beginning-farmer-and-rancher-development-program-bfrdp
Community Food Projects Competitive Grant Program
This program helps private nonprofit entities fight food insecurity by funding community food projects that help promote the self-sufficiency of low-income communities. Community food projects are designed to increase food security in communities by bringing the whole food system together to assess strengths, establish linkages, and create systems that improve the self-reliance of community members over their food needs. Preferred projects develop linkages between two or more sectors of the food system, support the development of entrepreneurial projects, develop innovative linkages between the for-profit and nonprofit food sectors, encourage long-term planning activities, and build long-term

LOCAL FOODS, LOCAL PLACES COMMUNITY ACTION PLAN Redding, California
Page 6 Appendix D: Funding Resources
capacity of communities to address the food and agricultural problems of communities. Grants range from $10,000 to $400,000 and require a dollar-for-dollar match in resources. https://nifa.usda.gov/program/community-food-projects-competitive-grant-program-cfpcgp
Food Insecurity Nutrition Incentive Grant Program
This program supports projects to increase the purchase of fruits and vegetables among low-income consumers participating in the Supplemental Nutrition Assistance Program by providing incentives at the point of purchase. It funds pilot projects at up to $100,000 over one year; multi-year, community-based projects at up to $500,000 over no more than four years; and multi-year, large-scale projects of more than $500,000 over no more than four years. USDA gives priority to projects that provide locally or regionally produced fruits and vegetables. https://nifa.usda.gov/program/food-insecurity-nutrition-incentive-fini-grant-program
Office of Urban Agriculture and Innovative Production Competitive Grants
The Office of Urban Agriculture and Innovative Production competitive grants. The competitive grants will support the development of urban agriculture and innovative production projects through two categories, Planning Projects and Implementation Projects. There will be $1 million for Planning Projects that initiate or expand efforts of farmers, gardeners, citizens, government officials, schools and other stakeholders in urban areas and suburbs. Projects may target areas of food access, education, business and start-up costs for new farmers and development of policies related to zoning and other needs of urban production. There will be $2 million for Implementation Projects that accelerate existing and emerging models of urban, indoor and other agricultural practices that serve multiple farmers. Projects will improve local food access and collaborate with partner organizations and may support infrastructure needs, emerging technologies, educational endeavors and urban farming policy implementation.
https://www.farmers.gov/manage/urban/opportunities
Community Compost and Food Waste Reduction Project Cooperative Agreements
These cooperative agreements intend to solicit applications and fund pilot projects in no fewer than 10 states. The primary goal is to assist local and municipal governments with projects that develop and test strategies for planning and implementing municipal compost plans and food waste reduction plans. Implementation activities will increase access to compost for agricultural producers, improve soil quality and encourages innovative, scalable waste management plans that reduce and divert food waste from landfills.
https://www.farmers.gov/manage/urban/opportunities
USDA Natural Resources Conservation Service Environmental Quality Incentives Program
The program provides financial and technical assistance to agricultural producers to plan and implement conservation practices that improve soil, water, plant, animal, air, and related natural resources on agricultural land. Producers are eligible for payments totaling up to $450,000 for completed high tunnel

LOCAL FOODS, LOCAL PLACES COMMUNITY ACTION PLAN Redding, California
Page 7 Appendix D: Funding Resources
systems that can extend the growing season for high-value crops in an environmentally safe manner. The program can also provide up to $20,000 per year for organic producers and those transitioning to organic to address natural resource concerns and meet requirements for the National Organic Program. http://www.nrcs.usda.gov/wps/portal/nrcs/main/national/programs/financial/eqip/
USDA Farm Service Agency Farm Storage Facility Loan Program
This program provides low-interest financing so producers can build or upgrade permanent facilities to store commodities. Eligible facilities include cold storage facilities for fruits, vegetables, dairy, and meat products. Producers may borrow up to $500,000. http://www.fsa.usda.gov/programs-and-services/price-support/facility-loans/farm-
storage/index
Microloan Program
The Microloan Program helps finance small, beginning, niche, and non-traditional farm operations; farms participating in direct marketing and sales such as farmers markets; and farms using hydroponic, aquaponic, organic, and vertical growing methods. Eligible uses of funds include to make a down payment on a farm; build, repair, or improve farm buildings; purchase hoop houses, tools, and equipment; gain GAP (Good Agricultural Practices), GHP (Good Handling Practices), and organic certification; and market and distribute agricultural products. The maximum loan amount is $50,000. http://www.fsa.usda.gov/programs-and-services/farm-loan-programs/microloans/index
USDA Food and Nutrition Service Farm to School Grant Program
These grants support farm-to-school programs that improve access to local foods in schools.
• Implementation grants of $50,000 to $100,000 help state and local agencies, schools, or schooldistricts scale or further develop existing farm-to-school initiatives.
• Planning grants of $20,000 to $50,000 help schools or school districts just getting started onfarm-to-school activities organize and structure their efforts for maximum impact byembedding known best practices into early design considerations.
• Training grants of $20,000 to $50,000 help state and local agencies, Indian tribal organizations,agricultural producers, and nonprofit entities support trainings that strengthen farm-to-schoolsupply chains or provide technical assistance in local procurement, food safety, culinaryeducation, and/or integration of an agriculture-based curriculum.
http://www.fns.usda.gov/farmtoschool/farm-school-grant-program https://www.fns.usda.gov/cfs/farm-school-resources

LOCAL FOODS, LOCAL PLACES COMMUNITY ACTION PLAN Redding, California
Page 8 Appendix D: Funding Resources
Senior Farmers’ Market Nutrition Program
This program, similar to the WIC Farmers’ Market Nutrition Program, awards grants to state agencies and Indian Tribal organizations to provide low-income seniors with coupons for fruits and vegetables at farmers markets. The state agencies provide nutrition education to participants and authorize farmers markets to accept the benefits. For a list of state program contacts, visit: https://www.fns.usda.gov/sfmnp/senior-farmers-market-nutrition-program
Supplemental Nutrition Assistance Program (SNAP)
SNAP offers nutrition assistance to low-income individuals and families. Benefits can be used to purchase many of the foods sold at farmers markets, including fruits and vegetables, dairy products, breads and cereals, and meat and poultry. The Food and Nutrition Service works with state agencies, nutrition educators, and neighborhood and faith-based organizations to help that those eligible for nutrition assistance access benefits. The Food and Nutrition Service also has resources for farmers markets and retailers interested in accepting SNAP benefits. http://www.fns.usda.gov/snap/supplemental-nutrition-assistance-program-snap
WIC Farmers’ Market Nutrition Program
The program is associated with the Special Supplemental Nutrition Program for Women, Infants and Children, popularly known as WIC. It awards grants to state agencies and Indian Tribal organizations to provide coupons for fresh, unprepared, locally grown fruits and vegetables to WIC participants for use at farmers markets. The state agencies provide nutrition education to participants and authorize farmers markets to accept the benefits. For a list of state program contacts, visit: https://www.fns.usda.gov/fmnp/wic-farmers-market-nutrition-program
U.S. Environmental Protection Agency Brownfields Multipurpose Grants
Multipurpose (MP) Grants provide funding to carry out a range of eligible assessment and cleanup activities with a proposed target area, such as a neighborhood, a number of neighboring towns, a district, a corridor, a shared planning area or a census tract. The target area may not include communities that are located in distinctly different geographic areas. The performance period for these grants is five years, and applicants can apply for up to $800,000. https://www.epa.gov/brownfields/brownfields-multipurpose-grants
Brownfields Assessment Grants
Assessment grants provide funding to inventory, characterize, assess, and conduct planning and community involvement related to sites potentially contaminated by hazardous substances, pollutants, contaminants, or petroleum. The maximum grant amount is $350,000. https://www.epa.gov/brownfields/brownfields-assessment-grants

LOCAL FOODS, LOCAL PLACES COMMUNITY ACTION PLAN Redding, California
Page 9 Appendix D: Funding Resources
Brownfields Cleanup Grants
Cleanup grants provide funding to carry out cleanup activities at sites contaminated by hazardous substances, pollutants, contaminants, or petroleum. The maximum grant amount is $200,000 per site. Awardees must contribute 20 percent of the amount of funding provided by EPA, although waivers of this requirement are available. An applicant must own the site for which it is requesting funding at time of application. https://www.epa.gov/brownfields/brownfields-cleanup-grants
Environmental Justice Collaborative Problem-Solving Cooperative Agreement Program
This program provides financial assistance to organizations for projects that address local environmental and/or public health issues in their communities using EPA's Environmental Justice Collaborative Problem-Solving Model. The program helps recipients build collaborative partnerships to help them understand and address environmental and public health concerns in their communities. https://www.epa.gov/environmental-justice/environmental-justice-collaborative-problem-
solving-cooperative-agreement-0
Environmental Justice Small Grants
This grant program supports and empowers communities working on solutions to local environmental and public health issues. The program is designed to help communities understand and address exposure to multiple environmental harms and risks and funds projects up to $30,000. Previously funded projects include Educating South Florida’s Residents on Hydroponic Urban Gardening; Promoting Sustainable Agriculture and Healthy Food Production in Athens, Georgia; Creating Safe Soil for Healthy Gardening; and Promoting Urban Agriculture and Food Sustainability in Brooklyn, New York. https://www.epa.gov/environmentaljustice/environmental-justice-small-grants-program
Targeted Brownfields Assessments
This program helps states, tribes, and municipalities minimize the uncertainties of contamination often associated with brownfields. This program supplements other efforts under the Brownfields Program to promote the cleanup and redevelopment of brownfields. Services include site assessments, cleanup options and cost estimates, and community outreach. Services are for an average of $100,000. The sites for this program are selected locally, once a year. Applicants should currently have redevelopment plans for the contaminated property. https://www.epa.gov/brownfields/targeted-brownfields-assessments-tba
Technical Assistance to Brownfields Communities Program
This program funds three organizations who—with their extensive team of subgrantees, contractors, partners, and other network contacts—provide technical assistance to communities and other stakeholders. The program helps communities tackle the challenge of assessing, cleaning up, and
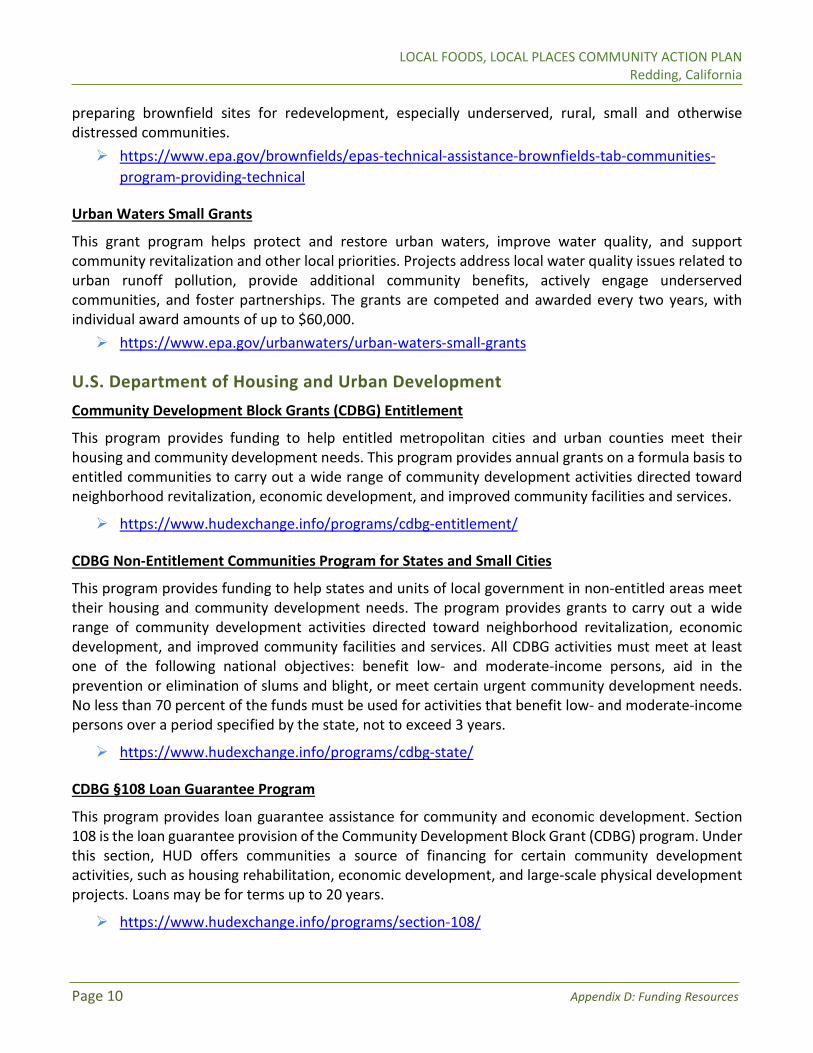
LOCAL FOODS, LOCAL PLACES COMMUNITY ACTION PLAN Redding, California
Page 10 Appendix D: Funding Resources
preparing brownfield sites for redevelopment, especially underserved, rural, small and otherwise distressed communities. https://www.epa.gov/brownfields/epas-technical-assistance-brownfields-tab-communities-
program-providing-technical
Urban Waters Small Grants
This grant program helps protect and restore urban waters, improve water quality, and support community revitalization and other local priorities. Projects address local water quality issues related to urban runoff pollution, provide additional community benefits, actively engage underserved communities, and foster partnerships. The grants are competed and awarded every two years, with individual award amounts of up to $60,000. https://www.epa.gov/urbanwaters/urban-waters-small-grants
U.S. Department of Housing and Urban Development Community Development Block Grants (CDBG) Entitlement
This program provides funding to help entitled metropolitan cities and urban counties meet their housing and community development needs. This program provides annual grants on a formula basis to entitled communities to carry out a wide range of community development activities directed toward neighborhood revitalization, economic development, and improved community facilities and services.
https://www.hudexchange.info/programs/cdbg-entitlement/
CDBG Non-Entitlement Communities Program for States and Small Cities
This program provides funding to help states and units of local government in non-entitled areas meet their housing and community development needs. The program provides grants to carry out a wide range of community development activities directed toward neighborhood revitalization, economic development, and improved community facilities and services. All CDBG activities must meet at least one of the following national objectives: benefit low- and moderate-income persons, aid in the prevention or elimination of slums and blight, or meet certain urgent community development needs. No less than 70 percent of the funds must be used for activities that benefit low- and moderate-income persons over a period specified by the state, not to exceed 3 years.
https://www.hudexchange.info/programs/cdbg-state/
CDBG §108 Loan Guarantee Program
This program provides loan guarantee assistance for community and economic development. Section 108 is the loan guarantee provision of the Community Development Block Grant (CDBG) program. Under this section, HUD offers communities a source of financing for certain community development activities, such as housing rehabilitation, economic development, and large-scale physical development projects. Loans may be for terms up to 20 years.
https://www.hudexchange.info/programs/section-108/

LOCAL FOODS, LOCAL PLACES COMMUNITY ACTION PLAN Redding, California
Page 11 Appendix D: Funding Resources
Programs of HUD
This 2017 document provides a complete listing of all HUD programs including major mortgage, grants, assistance, and regulatory programs.
https://www.hud.gov/hudprograms
U.S. Small Business Administration Small Business Resource Guide
The Indiana District Resource Guide provides localized information and contacts for the SBA’s local business assistance, funding programs and contracting programs.
https://www.sba.gov/document/support-indiana-district-resource-guide
Business Guide
The SBA’s online Business Guide provides 24/7 access to free information to help plan, launch, manage and grow small businesses.
https://www.sba.gov/business-guide
Local Assistance
The Small Business Administration works with a number of local partners to counsel, mentor and train small businesses including SCORE mentors, Small Business Development Centers, Veteran’s Business Outreach Centers, and Women’s Business Centers.
https://www.sba.gov/local-assistance
Loans
Loans guaranteed by the Small Business Administration range from $500 to $5.5 million and can be used for most business purposes, including long-term fixed assets and operating capital. Businesses must be for-profit, do business in the United States, have invested equity, and have exhausted financing options. Even those with bad credit may qualify for startup funding. Lender Match is a free online tool that connects small businesses with SBA-approved lenders.
https://www.sba.gov/funding-programs/loans
Federal Contracting
Small businesses can learn how to find and win contracts with the federal government and gain a competitive advantage with help from the SBA’s business development programs.
https://www.sba.gov/federal-contracting

LOCAL FOODS, LOCAL PLACES COMMUNITY ACTION PLAN Redding, California
Page 12 Appendix D: Funding Resources
Appalachian Regional Commission ARC’s Area Development Program
ARC’s Area Development program makes investments in two general areas: critical infrastructure and business and workforce development. Critical infrastructure investments mainly include water and wastewater systems, transportation networks, broadband, and other projects anchoring regional economic development. Business and workforce investments primarily focus on entrepreneurship, worker training and education, food systems, leadership, and other human capital development.
https://www.arc.gov/area-development-program/
ARC’s POWER Initiative
The POWER (Partnerships for Opportunity and Workforce and Economic Revitalization) Initiative targets federal resources to help communities and regions that have been affected by job losses in coal mining, coal power plant operations, and coal-related supply chain industries due to the changing economics of America’s energy production. The POWER Initiative supports efforts to create a more vibrant economic future for coal-impacted communities by cultivating economic diversity, enhancing job training and re-employment opportunities, creating jobs in existing or new industries, and attracting new sources of investment. POWER grants have been used to support farmers and producers to develop local food economies. One examples is listed below, Refresh Appalahcia.
https://www.arc.gov/arcs-power-initiative/ https://coalfield-development.org/refresh-appalachia/
Others National Endowment for the Arts Our Town Grant Program
Our Town supports creative placemaking projects that integrate arts and culture into community revitalization work—placing arts at the table with land use, transportation, economic development, education, housing, infrastructure, and public safety strategies. Projects require a partnership between a nonprofit organization and a local government entity, with one of the partners being a cultural organization. Matching grants range from $25,000 to $200,000. In 2016, the American Dance Institute and the village of Catskill, New York, received an Our Town grant to renovate a former lumberyard and associated buildings into a permanent home for the institute’s artist residency, which will include a theater, artist housing, and an open interior courtyard for performances, visual arts displays, and the local farmers market. https://www.arts.gov/grants-organizations/our-town/introduction
Racial and Ethnic Approaches to Community Health (REACH)

LOCAL FOODS, LOCAL PLACES COMMUNITY ACTION PLAN Redding, California
Page 13 Appendix D: Funding Resources
REACH is a national program administered by the Centers for Disease Control and Prevention to reduce racial and ethnic health disparities. Through REACH, recipients plan and carry out local, culturally appropriate programs to address a wide range of health issues among African Americans, American Indians, Hispanics/Latinos, Asian Americans, Alaska Natives, and Pacific Islanders. REACH gives funds to state and local health departments, tribes, universities, and community-based organizations. Recipients use these funds to build strong partnerships to guide and support the program’s work. Along with funding, CDC provides expert support to REACH recipients.
https://www.cdc.gov/nccdphp/dnpao/state-local-programs/reach/index.htm
Surface Transportation Block Grant Program Transportation Alternative Set Aside
This program provides set-aside funding for programs and projects defined as transportation alternatives (including on- and off-road pedestrian and bicycle facilities, infrastructure projects for improving non-driver access to public transportation and enhanced mobility, community improvement activities such as historic preservation and vegetation management, and environmental mitigation related to stormwater and habitat connectivity); recreational trail projects; safe routes to school projects; and projects for planning, designing, or constructing boulevards and other roadways largely in the right-of-way of former divided highways. Funds are allocated to state departments of transportation, which select projects through a competitive process. Local governments, school districts, and nonprofit organizations responsible for the administration of local transportation safety programs are among the entities eligible to apply for funding. http://www.fhwa.dot.gov/environment/transportation_alternatives/guidance/guidance_2016.
cfm
Private Grant Funding While funding programs of individual foundations can change from year to year, these resources are good starting points to look for philanthropic and other private support:
AARP Community Challenge Program
AARP provides small grants for quick-action projects to improve housing, transportation, public space, smart cities and other community elements.
https://www.aarp.org/livable-communities/community-challenge/
Aetna Foundation
The Aetna Foundation funds community groups that are advancing healthy eating and active living in homes, schools, and neighborhoods. A major part of this effort is connecting people of limited means with fresh fruits and vegetables through community gardens, urban farms, and farmers markets. https://www.aetna-foundation.org/grants-partnerships/health-eating-living.html
America Walks Community Challenge Program
LOCAL FOODS, LOCAL PLACES COMMUNITY ACTION PLAN Redding, California
Page 14 Appendix D: Funding Resources
The America Walks Community Challenge grant program works to provide support to the growing network of advocates, organizations, and agencies using innovative, engaging, and inclusive programs and projects to create places where all community members have safe, accessible, equitable, and enjoyable places to walk and be physically active.
https://americawalks.org/community-change-grants/
Farmers' Market Coalition
The Farmers' Market Coalition website includes funding resources for farmers' markets and other community food projects. Pure funding examples are restricted to members of the coalition, but they also offer a state-based resource that announces funding opportunities specific to a state. https://farmersmarketcoalition.org/education/funding-opportunities/ https://farmersmarketcoalition.org/state-map/
Healthy Food Access Portal
The Healthy Food Access portal was created by PolicyLink, The Food Trust, and Reinvestment Fund to better support communities seeking to launch healthy food retail projects. Among the resources and tools is a guide to find funding and policy efforts by state. https://www.healthyfoodaccess.org/resources-tools-find-money-policy-efforts-by-state
Kids Gardening
Kids Gardening provides their own grant programs and maintains a list of additional grant opportunities that support school and youth garden programs.
https://kidsgardening.org/grant-opportunities/
Kresge Foundation
Annually, the Kresge Foundation makes more than 400 grants to nonprofits and cities. Kresge programs work both independently and in collaboration to award single-year and multiyear grants that fund general operating, projects and planning activities advancing strategic objectives. Most often, applicants are invited, but ccasionally, program teams issue an open call for letters of interest (LOIs) within a focus area. For initiatives, programs typically use an open request-for-proposals process. https://kresge.org/grants-social-investments/
Robert Wood Johnson Foundation
The Robert Wood Johnson Foundation supports research and programs to help build a national culture of health. Projects that link local foods assets such as community gardens and farmers markets with recreation and alternative transportation projects that seek to improve access to healthy foods could fit with the foundation’s giving. The foundation has programs that help to transform local environments in ways that remove health barriers and make it easier for people to lead healthier lives. https://www.rwjf.org/en/how-we-work/grants-and-grant-programs.html

LOCAL FOODS, LOCAL PLACES COMMUNITY ACTION PLAN Redding, California
Page 15 Appendix D: Funding Resources
The foundation also has programs to increase the ability to provide more free fresh produce in low-income communities, raise public awareness about food insecurity, and encourage healthier eating. http://www.rwjf.org/en/library/collections/healthy-food-access.html
Walmart Community Grant Program
The Walmart Foundation provides community grants of $500 to $5,000 to nonprofits, government entities, educational institutions, and faith-based organizations for projects that benefit the service area of a Walmart facility (Walmart Store, Sam's Club, or Logistics Facility). Funding areas include hunger relief and healthy eating, health and human service, quality of life, education, community and economic development, diversity and inclusion, public safety, and environmental sustainability.
http://giving.walmart.com/walmart-foundation/community-grant-program
W.K Kellogg Foundation
The W.K. Kellogg Foundation helps communities transform school food systems, improve community access to good food, and create environments for active living. The foundation accepts grant applications from organizations and institutions throughout the year. https://wrm.wkkf.org/uWebRequestManager/UI/Application.aspx?tid=24bf1841-48f7-4971-
b7a7-96bd78992f62&LanguageID=0
LOCAL FOODS, LOCAL PLACES COMMUNITY ACTION PLAN Redding, California
Appendix E: References
Appendix E: References
LOCAL FOODS, LOCAL PLACES COMMUNITY ACTION PLAN Redding, California
Page 1 Appendix E: References
Additional resources available are grouped into the following categories:
I. Local Food Systems Response to COVID-19 .................................................................................... 1
II. Bicycle and Pedestrian Connectivity ................................................................................................ 1
III. Community Gardens ........................................................................................................................ 2
IV. Community Kitchens ........................................................................................................................ 3
V. Farm to School ................................................................................................................................. 4
VI. Farmer's Markets ............................................................................................................................. 4
VII. Food Co-ops ..................................................................................................................................... 6
VIII. Food Hubs ........................................................................................................................................ 6
IX. Food Waste ...................................................................................................................................... 7
X. Healthy Living ................................................................................................................................... 8
XI. Smart Growth and Placemaking ...................................................................................................... 9
XII. Urban Agriculture .......................................................................................................................... 10
XIII. General ........................................................................................................................................... 11
I. Local Food Systems Response to COVID-19
Local Food Systems Response to COVID
USDA Agricultural Marketing Service (AMS) along with the cooperating research team led by the University of Kentucky seek to enrich existing efforts within local and regional food system communities of practice who provide support to local food producers by documenting and disseminating innovations and best practices developed on the ground and framing research on COVID-related shifts in local and regional food markets with the aim of supporting long term resilience. https://lfscovid.localfoodeconomics.com/
II. Bicycle and Pedestrian Connectivity
Case Studies in Delivering Safe, Comfortable and Connected Pedestrian and Bicycle Networks
This 2015 Federal Highway Administration document provides an overview of pedestrian and bicycle network principles and highlights examples from communities across the country. https://www.fhwa.dot.gov/environment/bicycle_pedestrian/publications/network_report/

LOCAL FOODS, LOCAL PLACES COMMUNITY ACTION PLAN Redding, California
Page 2 Appendix E: References
Design Guidance
The National Center for Bicycling & Walking compiled resources that provide design guidance for bicycling and pedestrian facilities. http://www.bikewalk.org/thepractice.php
Guidebook for Developing Pedestrian and Bicycle Performance Measures
This 2016 Federal Highway Administration document helps communities develop performance measures that can fully integrate pedestrian and bicycle planning in ongoing performance management activities. http://www.fhwa.dot.gov/environment/bicycle_pedestrian/publications/performance_measur
es_guidebook
Resources for Implementing Built Environment Recommendations to Increase Physical Activity
The Centers for Disease Control and Prevention has created a 2017 compilation of real world examples, a 2018 Implementation Resource Guide, and a 2018 Visual Guide to help communities implement recommendations for built environment approaches that combine one or more interventions to improve transportation systems (activity-friendly routes) with one or more land use and community design interventions (everyday destinations) to increase physical activity. https://www.cdc.gov/physicalactivity/community-strategies/beactive/index.html
Safety Demonstration Projects: Case Studies From Orlando, FL, Lexington, KY, And South Bend, IN
The National Complete Streets Coalition helped three cities build skills in safer street design, creative placemaking, and community engagement, and then put those skills into practice. This 2018 report includes case studies of local demonstration projects in Orlando, Florida; Lexington, Kentucky; and South Bend, Indiana where communities transformed their streets, intersections, and neighborhoods into slower, safer places for people. https://smartgrowthamerica.org/resources/safety-demonstration-projects-case-studies-from-
orlando-fl-lexington-ky-and-south-bend-in/?fbclid=IwAR0qTdwv8j1H1NUiC9LLg-j7m0K3ozRSKFeBOQkPj3t9GDHcxY0Y6JRbi9c
Small Town and Rural Multimodal Networks
This 2016 Federal Highway Administration document helps small towns and rural communities support safe, accessible, comfortable, and active travel for people of all ages and abilities. It provides a bridge between existing guidance on bicycle and pedestrian design and rural practice, encourages innovation in the development of safe and appealing networks for bicycling and walking, and shows examples of project implementation. https://www.fhwa.dot.gov/environment/bicycle_pedestrian/publications/small_towns/fhwahe
p17024_lg.pdf
III. Community Gardens
Cultivating Community Gardens
LOCAL FOODS, LOCAL PLACES COMMUNITY ACTION PLAN Redding, California
Page 3 Appendix E: References
The Local Government Commission created a fact sheet on the role of local government in supporting community gardens, including case studies, best management practices, resources, and tools for policy-makers. https://www.lgc.org/community-gardens/
Elder-Accessible Gardening: A Community Building Option for Brownfields Redevelopment
This 2011 EPA document provides a tip sheet for starting a community garden accessible to people of all age groups and physical activity levels. It includes guidance on starting a garden on a brownfield property. https://www.epa.gov/brownfields/brownfields-elder-accessible-gardening
Garden Organizer Toolkit
The Vermont Community Garden Network provides tools to help organizers, managers, coordinators, and supporters of community-based gardens, including resources for starting, organizing, and learning in community-based gardens. http://vcgn.org/garden-organizer-toolkit/
EPA Pollinator Program Resources
EPA’s Bee Advisory Label: https://www.epa.gov/sites/production/files/2013-11/documents/bee-label-info-graphic.pdf
EPA’s Read the Label First, Protect Your Garden:https://www.epa.gov/sites/production/files/2016-02/documents/garden.pdf
University of Nebraska Lincoln’s “Creating a Solitary Bee Hotel”:https://entomology.unl.edu/scilit/Creating%20a%20Solitary%20Bee%20Hotel.pdf
University of Nebraska Lincoln’s “Bee Aware: Protecting Pollinators from Pesticides”:https://entomology.unl.edu/scilit/Protecting-pollinators-from-pesticides.pdf
IV. Community Kitchens
The Shared Kitchen Toolkit: A Practical Guide to Planning, Launching, and Managing a Shared-Use Commercial Kitchen
The Food Corridor, Fruition Planning and Management, and Purdue Extension Services co-created this 2018 toolkit that delivers guidance on feasibility and planning for new kitchen projects, as well as management practices for the day-to-day operations of shared-use kitchens. It also provides an overview of emerging kitchen models and highlights opportunities for kitchens to expand their community impact and enhance financial sustainability. http://www.thefoodcorridor.com/announcing-the-shared-kitchen-toolkit/

LOCAL FOODS, LOCAL PLACES COMMUNITY ACTION PLAN Redding, California
Page 4 Appendix E: References
Commercial Kitchen Guide
The Minnesota Institute for Sustainable Agriculture published a guide that provides information on policies and regulations for those looking to open or operate in a community commercial kitchen. http://www.misa.umn.edu/publications/commercialkitchenguide
Culinary Incubator Map
CulinaryIncubator.com is a nonprofit website to help small food businesses locate commercial kitchens. It includes an interactive map with descriptions of commercial kitchens across the United States. http://www.culinaryincubator.com/maps.php
V. Farm to School
Farm to School Resources
The National Farm to School Network has compiled resources for communities working to bring local food sourcing, school gardens, and food and agriculture education into schools and early care and education settings. http://www.farmtoschool.org/resources
The USDA Farm to School Planning Toolkit
The USDA Food and Nutrition Service created a guide of questions to consider and helpful resources to reference when starting or growing a farm-to-school program. It is designed for use by schools, school districts, and community partners. https://www.fns.usda.gov/sites/default/files/f2s/F2S-Planning-Kit.pdf
Farm to Child Nutrition Programs Planning Guide
The USDA Office of Community Food Systems created a guide that directs you through questions to consider when starting or growing a farm to school, farm to child care, for farm to summer program. It includes guiding questions, a planning template, and a sample of a completed planning guide. https://www.fns.usda.gov/farmtoschool/farm-school-resources
VI. Farmer's Markets
Creating a Farmer's Market Living Lab: Lessons Learned in Growing a Farmer's Market
This booklet from the Historic Lewes Farmer's Market is the result of asking the question: What can we do to increase sales and attendance at our market? It is a summary of lessons learned. https://www.historiclewesfarmersmarket.org/living-lab-report/
Local and Regional Market News
LOCAL FOODS, LOCAL PLACES COMMUNITY ACTION PLAN Redding, California
Page 5 Appendix E: References
USDA Market News works with state departments of agriculture and local and regional food systems to provide prices, volume, and other information on agricultural commodities sold at local and regional markets throughout the United States. https://www.ams.usda.gov/market-news/local-regional-food
Market Makeover: 25 Best Practices for Farmer's Markets
This report from the Appalachian Sustainable Agriculture Project provides guidance for making market improvements and dealing with common issues in the areas of management, regulations, risk management, food safety, improving vendor sales, and marketing. http://asapconnections.org/downloads/market-makeover-25-best-practices-for-farmers-
markets.pdf
National Farmers Market Directory
The USDA Agricultural Marketing Service maintains a directory of information about farmers markets, including locations, directions, operating times, product offerings, and accepted forms of payment. https://www.ams.usda.gov/local-food-directories/farmersmarkets
National Farmers Market Managers Survey
Nearly 1,400 farmers market managers responded to this national survey that the USDA Agricultural Marketing Service conducted in 2014. https://www.ams.usda.gov/file/2014-farmers-market-managers-survey-summary-report-final-
july-24-2015pdf
Supplemental Nutrition Assistance Program (SNAP) at Farmers Markets: A How-To Handbook
This 2010 report from the USDA Agricultural Marketing Service, USDA Food and Nutrition Service, and Project for Public Spaces, Inc. describes how to accept SNAP benefits at farmers markets, including what equipment is required, how to install electronic benefit transfer (EBT) systems, and how to make SNAP EBT succeed at farmers markets. https://www.ams.usda.gov/sites/default/files/media/SNAPat%20Farmers%20Markets%20Hand
book.pdf
Sharing the Harvest: A Guide to Bridging the Divide between Farmers Markets and Low-Income Shoppers
This 2012 report from the Appalachian Sustainable Agriculture Project provides tips and tools to improve the accessibility of local markets and increase consumption of healthy local produce. http://asapconnections.org/downloads/asap-farmers-market-access-guide.pdf
Understanding the Link Between Farmers’ Market Size and Management Organization
This 2007 report by the Oregon State University Extension Service examines common management tools and structures for farmers markets of different sizes to guide strategic planning and resource
LOCAL FOODS, LOCAL PLACES COMMUNITY ACTION PLAN Redding, California
Page 6 Appendix E: References
allocation for new markets and for established markets confronting growth or other significant changes. https://catalog.extension.oregonstate.edu/sr1082
VII. Food Co-ops
Capital Campaign Workbook
The Food Co-op Initiative’s 2016 workbook helps consumer-owned food co-ops design and implement successful capital campaigns that effectively engage their owners and meet their capital needs. http://www.foodcoopinitiative.coop/sites/default/files/Capital%20Campaign%20Workbook%2
0Food%20Co-op%20Initiative%20March%202016.pdf
The FCI Guide to Starting a Food Co-op
This 2017 updated guide from the Food Co-op Initiative provides organizers, board members, and development centers with an introduction to starting a food co-op and an overview of the basic steps and procedures. https://www.fci.coop/sites/default/files/Startup%20guide-02.2017.pdf
How to Start a Food Co-op Manual
The Cooperative Grocers’ Information Network created a guide in 2010 that provides an overview of the basic steps and procedures for starting a food co-op. http://www.cooperativegrocer.coop/library/start-a-food-coop
Publications for Cooperatives
USDA Rural Development provides publications, reports, and educational materials for cooperatives, including Cooperative Information Reports that provide descriptive information about the cooperative form of business and various cooperative topics, research reports, and service reports that include USDA's annual compilation of farm cooperative statistics. https://www.rd.usda.gov/publications/publications-cooperatives
VIII. Food Hubs
Findings of the 2017 National Food Hub Survey
This document by the Michigan State University Center for Regional Food Systems in cooperation with the Wallace Center at Winrock International details the scope and scale of food hub activities, their challenges, and their regional influence based on a survey of more than 100 food hubs across the country. https://www.canr.msu.edu/resources/2017-food-hub-survey

LOCAL FOODS, LOCAL PLACES COMMUNITY ACTION PLAN Redding, California
Page 7 Appendix E: References
Moving Food Along the Value Chain: Innovations in Regional Food Distribution
This 2012 report from the USDA Agricultural Marketing Service shares lessons learned and best practices from eight producer networks and their partners distributing locally or regionally grown food to retail and food service customers. https://www.ams.usda.gov/sites/default/files/media/Moving%20Food%20Along%20the%20Val
ue%20Chain%20Innovations%20in%20Regional%20Food%20Distribution.pdf
Regional Food Hub Resource Guide
This 2012 report from the USDA Agricultural Marketing Service examines the role of food hubs in regional food systems and compiles information on the resources available to support them. https://www.ams.usda.gov/sites/default/files/media/Regional%20Food%20Hub%20Resource%
20Guide.pdf
Running a Food Hub series
USDA Rural Development developed a technical report series in partnership with Virginia Foundation for Agriculture, Innovation and Rural Sustainability and Matson Consulting that offers new and existing food hubs information on how to plan for success, address challenges, and achieve viability. Vol 1 – Lessons Learned from the Field (2015)
https://www.rd.usda.gov/files/SR_77_Running_A_Food_Hub_Vol_1.pdf Vol 2 – A Business Operations Guide (2015)
https://www.rd.usda.gov/files/SR_77_Running_A_Food_Hub_Vol_2.pdf Vol 3 – Assessing Financial Viability (2016)
https://www.rd.usda.gov/files/publications/SR%2077%20FoodHubs%20Vol3.pdf Vol 4 – Learning from Food Hub Closures (2017)
https://www.rd.usda.gov/files/publications/SR77_FoodHubs_Vol4_0.pdf
IX. Food Waste
Excess Food Opportunities Map
EPA created the Excess Food Opportunities Map, a national, interactive map that identifies more than 500,000 potential generators of excess food and estimated generation quantities, as well as over 4,000 potential recipients of excess food. The map can help users identify potential sources of food for rescue; potential feedstocks for compost and anaerobic digestion; potential infrastructure gaps for managing excess food; and, alternatives to sending food to landfill. This resource is intended to give users the tools to understand the potential magnitude of excess food in their communities and help make connections between generators and recipients such that more food is diverted from landfills and put toward beneficial uses. https://www.epa.gov/sustainable-management-food/excess-food-opportunities-
map?fbclid=IwAR1rCQWWKbR6yYZqxnE-fRRWNyWarqvKtoRbP7m1AKGeinRFGJm7uuAdMns
Food Recovery Challenge

LOCAL FOODS, LOCAL PLACES COMMUNITY ACTION PLAN Redding, California
Page 8 Appendix E: References
As part of EPA's Food Recovery Challenge, organizations pledge to improve their sustainable food management practices and report their results. Food Recovery Challenge participants and endorsers include groups such as grocers, educational institutions, restaurants, faith organizations, sports and entertainment venues, and hospitality businesses. Participants can reduce their environmental footprint, help their community, receive recognition, and get free technical assistance. https://www.epa.gov/sustainable-management-food/food-recovery-challenge-frc
Tools for Preventing and Diverting Wasted Food
EPA offers a variety of wasted-food assessment tools to suit a food service establishment’s specific circumstances. Several of the tools are described below. https://www.epa.gov/sustainable-management-food/tools-preventing-and-diverting-wasted-
food
A Guide to Conducting and Analyzing a Food Waste Assessment
Retail, food service, and other food management establishments can use EPA’s 2014 guidebook to learn how to take a "snapshot in time" of their wasted food by either manually sorting through materials in a garbage sample or visually observing and estimating waste.
https://www.epa.gov/sustainable-management-food/tools-preventing-and-diverting-wasted-food#assessguide
Toolkit for Reducing Wasted Food and Packaging
This 2014 toolkit is designed to help food service establishments and commercial kitchens save money by reducing wasted food and packaging with suggested strategies, templates, and case studies. It includes a tool to track the daily amount, type of, and reason for wasted food and packaging. Users enter information into a spreadsheet, which automatically creates graphs and data summaries to help identify patterns of waste generation. Based on these patterns, a business can make strategic changes to its operation to maximize waste reductions and cost savings.
https://www.epa.gov/sustainable-management-food/tools-preventing-and-diverting-wasted-food#packaging
X. Healthy Living
Community Health Online Resource Center
The Centers for Disease Control and Prevention created this database of webinars, model policies, toolkits, guides, fact sheets, and other practical materials to help implement changes to prevent disease and promote healthy living. Content areas include healthy and safe physical environments and healthy eating. https://www.cdc.gov/nccdphp/dch/online-resource/
https://www.epa.gov/sustainable-management-food/tools-preventing-and-diverting-wasted-food#packaging
LOCAL FOODS, LOCAL PLACES COMMUNITY ACTION PLAN Redding, California
Page 9 Appendix E: References
Making the Business Case for Prevention Video Series
This series from the Centers for Disease Control and Prevention shows how healthy living initiatives can help businesses increase profits, bring in more customers, and build goodwill. The series includes videos about healthy food programs, city planning, and community partnerships. https://www.cdc.gov/nccdphp/dnpao/multimedia/videos.html
SNAP-Ed Evaluation Framework and Interpretative Guide
The USDA Food and Nutrition Service created this 2016 guide to measure the success of SNAP-Ed programs. It provides information on evidence-based obesity prevention interventions and policy, systems, and environmental change interventions. It also provides information on outcome indicators’ background and context, outcome measures, surveys and data collection tools, and more. https://snaped.fns.usda.gov/evaluation/evaluation-framework-and-interpretive-guide
XI. Smart Growth and Placemaking
The Built Environment: An Assessment Tool and Manual
The Centers for Disease Control and Prevention’s 2015 assessment tool helps communities measure the core features and qualities of the built environment that affect health, including walkability, bikeability, and access to grocery stores, convenience stores, and farmers markets. https://www.cdc.gov/nccdphp/dch/built-environment-assessment/
Creative Placemaking on Vacant Properties: Lessons Learned from Four Cities
This Center for Community Progress 2018 report offers practical guidance for communities curious about how to leverage the power of creative placemaking to transform vacant properties. It includes a creative placemaking primer and key takeaways based on work conducted over the course of two years. It also explores emerging practices in four communities: Kalamazoo, Michigan; Wilkinsburg, Pennsylvania; Newburgh, New York; and Macon, Georgia. http://action.communityprogress.net/p/salsa/web/common/public/signup?signup_page_KEY=
11388&fbclid=IwAR3Xx0Md0abEeL0VNfIHJbSdgCKIiwV9h0C5qeIc7ydsxiPRne1bQp4GsJ0
Growing Food Connections
This website from the American Planning Association provides planning and policy briefs and other resources to help increase food security in vulnerable areas, strengthen the sustainability and economic resilience of urban and rural communities, and support farms engaged in local and regional food systems that use sustainable practices. https://www.planning.org/research/foodconnections/
Smart Growth
EPA’s smart growth website provides publications, tools, and other information on a range of development and conservation strategies that help protect our health and natural environment and make our communities more attractive, economically stronger, and more diverse.

LOCAL FOODS, LOCAL PLACES COMMUNITY ACTION PLAN Redding, California
Page 10 Appendix E: References
https://www.epa.gov/smartgrowth
XII. Urban Agriculture
Aquaponics Business Plan User Guide
This 2016 EPA document is modeled after the Urban Farm Business Plan Handbook (see below) and provides an outline and guidance for the development of a business plan for an aquaponic farm. https://www.epa.gov/land-revitalization/aquaponics-business-plan-user-guide
Brownfields and Community Supported Agriculture
EPA’s Brownfields program provides information on community supported and urban agriculture projects on brownfield properties. https://www.epa.gov/brownfields/brownfields-and-community-supported-agriculture
Brownfields and Urban Agriculture: Interim Guidelines for Safe Gardening Practices
This EPA document is a condensation of the input of 60 experts from academia, state, and local government, and the nonprofit sector who gathered in Chicago on October 21 and 22, 2010 to outline the range of issues which need to be addressed in order to safely grow food on former brownfields sites. https://www.epa.gov/brownfields/brownfields-and-urban-agriculture-interim-guidelines-safe-
gardening-practices
How Does Your Garden Grow? Brownfields Redevelopment and Local Agriculture
This 2009 EPA document provides some insight on how best grow safe food during brownfields redevelopment. https://www.epa.gov/brownfields/how-does-your-garden-grow-brownfields-redevelopment-
and-local-agriculture
Industrial Properties Renewed Through Agriculture: Reusing Land to Support Agriculture and Food Systems
This 2010 EPA document discusses reusing industrial brownfields that might serve a wide variety of agriculture-related reuses, including important public health considerations as well as environmental and planning and zoning considerations. https://www.epa.gov/brownfields/brownfields-industrial-properties-renewed-through-
agriculture
Steps to Create a Community Garden or Expand Urban Agriculture
EPA’s Brownfields Program offers information on how to create a community garden or expand urban agriculture, particularly in areas that might be at risk from potential contaminants. https://www.epa.gov/brownfields/steps-create-community-garden-or-expand-urban-
agriculture
LOCAL FOODS, LOCAL PLACES COMMUNITY ACTION PLAN Redding, California
Page 11 Appendix E: References
Urban Agriculture Toolkit
This 2016 toolkit from USDA lays out the common operational elements that most urban farmers must consider as they start or grow their operations. It also contains a section on resources for developing indoor growing operations, such as aquaponic facilities. For each element, the toolkit identifies technical and financial resources from federal, state, and local partners. https://www.usda.gov/sites/default/files/documents/urban-agriculture-toolkit.pdf
Urban Farm Business Plan Handbook
This 2011 document from EPA, the U.S. Department of Housing and Urban Development, and the U.S. Department of Transportation provides guidance for developing a business plan for the startup and operation of nonprofit and for-profit urban farms. https://www.epa.gov/brownfields/urban-farm-business-plan-handbook
The associated Urban Farm Business Plan Worksheets provide a framework in which to compile and organize the information needed to draft a business plan. https://www.epa.gov/brownfields/urban-farm-business-plan-worksheets
XIII. General
Local Food Systems Response to COVID – Building Better Beyond
USDA Agricultural Marketing Service (AMS) along with the cooperating research team led by the University of Kentucky seek to enrich existing efforts within local and regional food system communities of practice who provide support to local food producers by documenting and disseminating innovations and best practices developed on the ground and framing research on COVID-related shifts in local and regional food markets with the aim of supporting long term resilience. https://lfscovid.localfoodeconomics.com/
Communities for Healthy Food: The Toolkit – A Practical Guide for Integrating Healthy Food Access and Social Justice into Community Development
This 2018 toolkit from LISC NYC helps community organizations use healthy food access strategies and food justice principles to enhance their community development efforts. The toolkit presents a flexible and comprehensive approach to planning, designing, and implementing a portfolio of programs to ensure low-income communities and communities of color have access to healthier food options, a voice in the food movement, and economic opportunities. http://www.lisc.org/media/filer_public/bd/63/bd6327a3-8841-45b0-9eba-
1b9fa3f90ce6/lisc_nyc_communities_for_healthy_food_toolkit_march_2018.pdf?fbclid=IwAR3njWOP1Nz3eHGBOQ8wKuehF5z7NvH1XVnWACLbWQ6LcEM7Pn2gmtIkEro
The Economics of Local Food Systems: A Toolkit to Guide Community Discussions, Assessments and Choices

LOCAL FOODS, LOCAL PLACES COMMUNITY ACTION PLAN Redding, California
Page 12 Appendix E: References
This 2016 toolkit produced by the USDA Agriculture Marketing Service helps guide and enhance the capacity of local organizations to make more deliberate and credible measurements of local and regional economic activity and other ancillary benefits. https://www.rd.usda.gov/files/ILAMSToolkit.pdf
The Economics of Local Food: An Emerging Community of Practice
Colorado State University hosts a website aimed to help communities understand agriculture and food enterprise viability, market dynamics, and other key socio-economics metrics of local and regional food systems. https://localfoodeconomics.com/
Farmland Access Legal Toolkit
The Center for Agriculture and Food Systems at Vermont Law School created this online resource to help farmers and landowners affordably access, transfer, and conserve farmland. The toolkit explains legal arrangements that provide farmers more affordable and equitable farmland access and help landowners balance earning income for retirement with making their land affordable to the next generation of farmers. https://farmlandaccess.org/?fbclid=IwAR12aAoLz84nRya9R-vdPBjFg9pjSHKQzyMsZuk0BlCcmR
_ab5K6eFPrk8A
Food Value Chains: Creating Shared Value to Enhance Marketing Success
This 2014 report by the USDA Agricultural Marketing Service provides guidance on how food value chains are initiated and structured, how they function, and the benefits they provide to participants. https://www.ams.usda.gov/services/local-regional/food-value-chain
Good Agricultural Practices (GAP) & Good Handling Practices (GHP) Auditing and Accreditation Programs
The USDA Agricultural Marketing Service provides voluntary audit and accreditation programs that let producers and suppliers of agricultural products assure customers of their ability to provide consistent quality products or services. The programs are paid through hourly user fees. https://www.ams.usda.gov/services/auditing/gap-ghp
Harvesting Opportunity: The Power of Regional Food System Investments to Transform Communities
The Federal Reserve Bank of St. Louis, the Board of Governors of the Federal Reserve System, and the U.S. Department of Agriculture's agencies of Rural Development and the Agricultural Marketing Service published a 2017 book that focuses on regional food systems as a means for enhancing economic opportunity. It explores recent findings; highlights models for collaboration between policymakers, practitioners, and the financial community; and discusses research, policy, and resource gaps that, if addressed, might contribute to the success of regional food systems strategies.
https://www.stlouisfed.org/community-development/publications/harvesting-opportunity

LOCAL FOODS, LOCAL PLACES COMMUNITY ACTION PLAN Redding, California
Page 13 Appendix E: References
Local Food Compass Map
The USDA Agricultural Marketing Service hosts the Local Food Compass Map to provide a quick way for farmers, ranchers, market managers, consumers, and others to learn more about local and regional food projects in their communities and across the United States. The searchable map can be filtered and selected by state or tailored regions to see farmers markets, food hubs, and assets like meat processors and farm to school programs. The map also includes local food projects and programs funded through USDA and other federal agencies. www.ams.usda.gov/local-food-sector/compass-map
Local Food Directories
USDA's voluntary Local Food Directories help producers and customers locate farmers markets, on-farm markets, CSAs, and food hubs across the country. These listings can help potential vendors, partners, and customers find local food market opportunities. www.ams.usda.gov/services/local-regional/food-directories
Local Food Research & Development
The USDA Agriculture Marketing Service produces research-based publications on a range of local food market channels to help producers, market managers, planners, and others better understand the impact of these outlets on local economic development, food access, and farm profitability. https://www.ams.usda.gov/services/local-regional
Measuring Rural Wealth Creation: A Guide for Regional Development Organizations
This 2016 document by the National Association of Development Organizations introduces concepts of measuring progress in rural wealth creation for regional development organizations that are involved in a range of community and economic development within their regions. The guide includes information on developing a measurement plan, measuring multiple forms of community capital beyond jobs, measuring inclusiveness and local ownership of assets, and more strategies and tips for measuring and communicating progress. https://www.nado.org/measuring-rural-wealth-creation-a-guide-for-regional-development-
organizations/
National Good Food Network - Webinar Archive
The Wallace Center Winrock International supports the National Good Food Network, which offers monthly interactive webinars to learn and connect with on-the-ground practitioners and experts. Topic areas include: aggregation/distribution; business/finance; certification; farm to school; farming; food hubs; food safety; funding; infrastructure; metrics/evaluation; policy; processing/value add; retail/foodservice; social justice/food access; training/education; value chains; food hubs; food safety; research. http://ngfn.org/resources/ngfn-cluster-calls/ngfn-cluster-calls
https://www.nado.org/measuring-rural-wealth-creation-a-guide-for-regional-development-organizations/

LOCAL FOODS, LOCAL PLACES COMMUNITY ACTION PLAN Redding, California
Page 14 Appendix E: References
Pesticide Environmental Stewardship Program
EPA’s Pesticide Environmental Stewardship Program is a voluntary membership program that promotes the adoption of innovative, alternative pest control practices such as integrated pest management. It publicly recognizes members who have demonstrated their commitment to environmental stewardship and made progress in reducing pesticide risk. Members can receive technical support for transitioning to lower-risk pest management practices and developing integrated pest management strategies. https://www.epa.gov/pesp
Wholesale Markets and Facility Design
The USDA Wholesale Markets and Facility Design Team provides technical assistance on the construction or remodeling of wholesale markets, farmers markets, public markets, and food hubs. https://www.ams.usda.gov/services/local-regional/facility-design
Green Infrastructure
Green infrastructure is a cost-effective, resilient approach to managing wet weather impacts that provides many community benefits. Learn more about green infrastructure elements that can be woven into a community, from small-scale elements integrated into sites to larger scale elements spanning entire watersheds.
https://www.epa.gov/green-infrastructure/what-green-infrastructure Downspout Disconnection Rainwater Harvesting Rain Gardens Planter Boxes Bioswales Permeable Pavements Green Streets and Alleys Green Parking Green Roofs Urban Tree Canopy Land Conservation

LOCAL FOODS, LOCAL PLACES COMMUNITY ACTION PLAN
Appendix F: Federal Agency Descriptions
Appendix F: Federal Agency Descriptions

Local Foods Local Places (LFLP) Redding, CA October 2020
FEDERAL PARTNERS AND CONTACT INFORMATION
The U.S. Small Business Administration (SBA) is the only cabinet-level federal agency fully dedicated to small businesses. The SBA empowers entrepreneurs and small business owners with the resources and support (e.g. business guide, funding programs, local assistance) they need to start, grow or expand their businesses, or recover from a declared disaster. The SBA delivers services through an extensive network of field offices, Resource Partners such as SCORE, Small Business Development Centers (SBDC), Veterans Business Outreach Centers and Women’s Business Centers.
Contact: Heather Luzzi | District Director, Sacramento District Office | (916) 735-1709 | [email protected]
The Economic Development Administration (EDA) is a small agency within the U.S. Department of Commerce that provides a big impact by helping to make it easier for businesses to start and grow in the United States. We do this by working hand-in-hand with local economic development partners to advance their locally developed projects that are in turn tied to their region's long-term, sustainable economic development strategy. EDA grants can support planning and feasibility studies, entrepreneurship, business growth and retention, and economic resilience.
Contact: Malinda Matson | Economic Development Representative for Northern CA | 916-235-0088 | [email protected]
Local Foods Local Places (LFLP) Redding, CA October 2020
Superior California Economic Development (SCED) provides commercial real estate loans and refinancing, business loans and economic development planning services in close partnership with the U.S. Economic Development Agency (EDA). SCED received a grant from EDA to develop an economic resiliency plan for the region - Shasta, Siskiyou, Modoc, and Trinity counties – that includes (but is not limited to) food security and economic diversification and operates one of EDA’s loan programs that lend to small businesses that might not qualify for SBA or bank loans. SCED can help identify projects that would be eligible for EDA and other federal funding, help with applications, conduct planning activities, and provide capacity support for communities.
Contact: William Wallace | Economic Resilience Coordinator | (530) 225-2760, ext. 209 | [email protected]
The U.S. Department of Agriculture’s (USDA) Agricultural Marketing Service (AMS) works to improve domestic and international opportunities for U.S. growers and producers. The Marketing Services Division and its team of economists, architects and agricultural marketing specialists conduct research and provide direct technical assistance to enable business creation and growth within the local and regional food system while increasing consumer access to fresh, healthy foods in communities nationwide.
The division manages USDA’s Local Food Directories, a set of online resources that are designed to provide customers with convenient access to information about farmers market, CSAs, on-farm markets and food hubs locations, directions, hours, product offerings, and accepted forms of payment. The Wholesale Markets and Facility Design team provides no-cost technical assistance to stakeholders that want to construct new structures or remodel existing ones in support of further developing the local and regional food system. These facilities include wholesale markets, farmers markets, public markets, incubator kitchens, and food hubs. AMS also manages numerous grant programs that include:
• Acer Access and Development Program• Dairy Business Initiative• Farmers Market and Local Food Promotion Program (implemented as FMPP and LFPP)• Federal State Marketing Improvement Program
Local Foods Local Places (LFLP) Redding, CA October 2020
• Micro Grants for Food Security Program• Regional Food System Partnerships• Sheep Production and Marketing Grant Program• Specialty Crop Block Grant Program (implemented as SCBGP and SCMP)
Contact: Ken Keck | Director, Marketing Services Division | [email protected] Sasha Pokrovskaya | Architect | [email protected] Ron Batcher | Architect | [email protected] Samantha Schaffstall | Agricultural Marketing Specialist | [email protected]
The Food and Nutrition Service (FNS) works to end hunger and obesity through the administration of 15 federal nutrition assistance programs including WIC, Supplemental Nutrition Assistance Program (SNAP), and school meal programs.
In partnership with state and tribal governments, our programs serve one in four Americans during the course of a year. Working with our public, private and non-profit partners, our mission is to increase food security and reduce hunger by providing children and low-income people access to food, a healthful diet and nutrition education in a way that supports American agriculture and inspires public confidence.
USDA FNS Western Regional Office Farmers Market Programs | [email protected] USDA FNS Western Region Office Farm-to-School Program | [email protected] Senior Farmers’ Market Nutrition Program (SFMNP) |(CA) [email protected] WIC Farmers’ Market Nutrition Program (FMNP) | (CA) [email protected]
The U.S. Department of Housing and Urban Development’s (HUD) Community and Development Programs provide annual grants on a formula basis to states, cities, and counties (like Redding and Shasta county) to develop viable urban communities by providing decent housing and a suitable living

Local Foods Local Places (LFLP) Redding, CA October 2020
environment, and by expanding economic opportunities, principally for low- and moderate-income persons. Our programs include:
• Community Development Block Grants (CDBG) Entitlement Program -- Guides, tools, webinars,and other resources are provided to assist grantees and program partners in designing andimplementing programs.
• CDBG-CV: CARES Act Program -- Congress provided $5 billion in the CARES Act for theCommunity Development Block Grant (CDBG) program to states, metropolitan cities, urbancounties, and insular areas
• CDBG §108 Loan Guarantee Program -- This program provides loan guarantee assistance forcommunity and economic development. Section 108 is the loan guarantee provision of theCommunity Development Block Grant (CDBG) program.
Contact: Nicholas Nordahl | Community Planning and Development Representative for Northern CA | [email protected] Robert Jamieson | Program Analyst | Office of Field Policy and Management | [email protected]
Related Documents


