Communication Through Soil in Wireless Underground Sensor Networks – Theory and Practice M. Can Vuran and Agnelo R. Silva Abstract Wireless Underground Sensor Networks (WUSNs) constitute one of the promising application areas of the recently developed wireless sensor networking techniques. WUSN is a specialized kind of WSN that mainly focuses on the use of sensors at the subsurface region of the soil, that is, the top few meters of the soil. For a long time, this region has been used to bury sensors, usually targeting irrigation and environment monitoring applications, although without wireless communica- tion capability; WUSNs promise to fill this gap and to provide the infrastructure for novel applications. The main difference between WUSNs and the terrestrial WSNs is the communication medium. In fact, the differences between the propagation of electromagnetic (EM) waves in soil and in air are so significant that a complete characterization of the underground wireless channel was only available recently. This chapter presents advanced channel models that were developed to characterize the underground wireless channel considering the characteristics of the propagation of EM waves in soil and their relation with the frequency of these waves, the soil composition, and the soil moisture. Additional important aspects such as the burial depth, the reflection, the refraction, and multi path fading effects on the EM waves are also considered. The results from the field experiments in conjunction with the simulation results, both considering the path loss and the bit error rate, prove the feasibility of WUSNs. The chapter concludes with an outlook on potential research topics that are essential for the realization of WUSNs. 1 Introduction Wireless Underground Sensor Networks (WUSNs), which consist of wireless sen- sors buried underground, are a natural extension of the wireless sensor network phenomenon and have been considered as a potential field that will enable a wide variety of novel applications that were not possible before. Compared to the M.C. Vuran (B) Department of Computer Science and Engineering, University of Nebraska-Lincoln, Lincoln, NE 68588, USA e-mail: [email protected] G. Ferrari (ed.), Sensor Networks, Signals and Communication Technology, DOI 10.1007/978-3-642-01341-6 12, C Springer-Verlag Berlin Heidelberg 2010 309

Welcome message from author
This document is posted to help you gain knowledge. Please leave a comment to let me know what you think about it! Share it to your friends and learn new things together.
Transcript
Communication Through Soil in WirelessUnderground Sensor Networks – Theoryand Practice
M. Can Vuran and Agnelo R. Silva
Abstract Wireless Underground Sensor Networks (WUSNs) constitute one of thepromising application areas of the recently developed wireless sensor networkingtechniques. WUSN is a specialized kind of WSN that mainly focuses on the use ofsensors at the subsurface region of the soil, that is, the top few meters of the soil. Fora long time, this region has been used to bury sensors, usually targeting irrigationand environment monitoring applications, although without wireless communica-tion capability; WUSNs promise to fill this gap and to provide the infrastructure fornovel applications. The main difference between WUSNs and the terrestrial WSNsis the communication medium. In fact, the differences between the propagation ofelectromagnetic (EM) waves in soil and in air are so significant that a completecharacterization of the underground wireless channel was only available recently.This chapter presents advanced channel models that were developed to characterizethe underground wireless channel considering the characteristics of the propagationof EM waves in soil and their relation with the frequency of these waves, the soilcomposition, and the soil moisture. Additional important aspects such as the burialdepth, the reflection, the refraction, and multi path fading effects on the EM wavesare also considered. The results from the field experiments in conjunction with thesimulation results, both considering the path loss and the bit error rate, prove thefeasibility of WUSNs. The chapter concludes with an outlook on potential researchtopics that are essential for the realization of WUSNs.
1 Introduction
Wireless Underground Sensor Networks (WUSNs), which consist of wireless sen-sors buried underground, are a natural extension of the wireless sensor networkphenomenon and have been considered as a potential field that will enable awide variety of novel applications that were not possible before. Compared to the
M.C. Vuran (B)Department of Computer Science and Engineering, University of Nebraska-Lincoln, Lincoln,NE 68588, USAe-mail: [email protected]
G. Ferrari (ed.), Sensor Networks, Signals and Communication Technology,DOI 10.1007/978-3-642-01341-6 12, C© Springer-Verlag Berlin Heidelberg 2010
309
310 M.C. Vuran and A.R. Silva
current underground sensor networks, which use wired communication methodsfor data retrieval, WUSNs have several remarkable merits, such as concealment,ease of deployment, timeliness of data, reliability and coverage density [2]. Therealization of wireless underground communication and networking techniques willlead to potential applications in the fields of agriculture, border patrol, assistednavigation, sports field maintenance, intruder detection, and infrastructure mon-itoring. Many of these novel applications will be possible because WUSNs canprovide localized and real-time data about a specific soil region and its surroundingarea.
Despite its potential advantages, several open research problems exist to makeWUSNs feasible. The main challenge is the realization of efficient and reliableunderground wireless communication between buried sensors. Aspects such as tem-perature, weather, soil composition, soil moisture, and soil homogeneity directlyimpact the connectivity and communication success. In fact, underground commu-nication is one of the few fields where the environment has a significant and directimpact on the communication performance. In addition to these factors, the burialdepth and the frequency of the EM wave also have strong effect over the wirelessunderground communication. Hence, characterization of the wireless undergroundchannel is essential for the proliferation of communication protocols for WUSNs.
In this chapter, we introduce theoretical models to characterize the undergroundwireless channel. The models developed in this chapter characterize not only thepropagation of EM wave in soil, but also other effects on the communication relatedto multi path effects, soil composition, water content, and burial depth. The resultsobtained from this formalization reveal that underground communication is severelyaffected by frequency and soil properties, and more specifically by the volumetricwater content (VWC) of soil. Moreover, the effects of weather and season changesare investigated by considering two soil types as examples. Such theoretical modelsare essential for laying out the foundations for efficient communication in this envi-ronment. In particular, the 300–900 MHz frequency band, which is suitable for smallsize antenna and sensor development, is investigated and the results of field experi-ments realized at 433 MHz are compared with the theoretical models. Moreover, therealization of field experiments also revealed important issues not considered in thetheoretical models, such as the effects of the antenna orientation. Finally, challengesfor the feasibility of WUSNs are highlighted.
The rest of this chapter is organized as follows. In Sect. 2, an overview on thewireless underground communication is provided along with a classification for theunderground networks. In Sect. 3, some recent WSN solutions related to the under-ground enviroment are presented. The propagation characteristics of 300–900 MHzEM waves in soil are analyzed in Sect. 4.1. In Sects. 4.2 and 4.3, the characteristicsof the underground channel in soil are modeled taking in consideration the effects ofthe reflection of surface as well, the multi path fading, and the volumetric water con-tent in soil. The results of the underground-to-underground communication exper-iments, at 433 MHz, are presented in Sect. 5. Then, in Sect. 6, the challenges inWUSN design are summarized according to the outcomes from the simulationsbased on the theoretical model and also from the experimental results.

Communication Through Soil in WUSNs 311
2 Classification of Underground Communication Networks
As shown in Fig. 1, Wireless Underground Communication Networks (WUCNs)can be mainly classified into two: wireless communication networks for minesand tunnels and wireless underground sensor networks (WUSNs). There exist sev-eral solutions that focus on underground communication in mines and/or tunnels[7, 16, 21, 32]. In this context, although the network is located underground, thecommunication takes place through the air, i.e., through the voids that exist under-ground. Consequently, even though the communication in these voids are more chal-lenging than that in terrestrial WSNs, the channel characteristics exhibit similaritieswith the terrestrial WSNs.
Fig. 1 Classification of wireless underground communication networks (WUCNs)
This chapter focuses on WUSNs, which have components, i.e. the sensors, thatare buried underground and that communicate through soil. The majority of theapplications for WUSNs – intelligent agriculture, environmental monitoring, andsecurity – restricts the buried sensors at the subsurface of the soil, which is definedas the top few meters of the soil. This region of the soil has generally been classifiedinto two regions [17]:
• The topsoil region, which refers to the first 30 cm of soil, or the root growth layer,whichever is shallower.
• The subsoil region, which refers to the region below the topsoil, i.e., usually the30-100 cm region.
The characteristics of the soil for the topsoil and subsoil regions not only presentdifferent agricultural characteristics but also present distinct scenarios for WUSNsapplications due to two main reasons:
• These soil regions may be distincts in terms of soil texture and water content [17],which are significant parameters that affect the wireless communication channel,as we will see in Sect. 4. Moreover, the nodes buried at the topsoil region maytake better advantage of the reflection effect from the surface of ground.
• The plowing and similar mechanical activities occur exactly at the topsoil region.Hence, for certain agriculture applications, such as crop irrigation management,the burial depth must be higher than the topsoil region, which may be differentfor other applications, such as border patrol. In other words, for certain WUSNapplications, the sensors must be buried at the subsoil region.

312 M.C. Vuran and A.R. Silva
Fig. 2 Classification of communication in WUSNs
Accordingly, as shown in Fig. 1, WUSNs can be classified as a function of thedeployment region: Topsoil WUSN, if the WUSN is deployed in the topsoil region,or Subsoil WUSN, if deployed in the subsoil region.
In addition to nodes buried underground, the existence of aboveground nodesis also necessary for WUSN due to data retrieval purposes. Accordingly, twocommunication types coexist in WUSNs as shown the Fig. 2. Underground-to-underground communication refers to the information exchange between buriedsensors for network management and data relay purposes. The data in the network isthen collected through underground-to-aboveground communication. This type ofcommunication also includes command and control information from abovegroundstations to underground. The classification in Fig. 2 also highlights significant differ-ences on the challenges related to each option. Underground-to-aboveground com-munication presents better quality compared to underground-to-underground sincecertain portion of the communication takes place over the air [30]. On the otherhand, underground-to-underground communication usually presents more difficultchallenges for the design and the deployment of WUSNs. In this chapter, we focuson underground-to-underground communication for WUSNs.
3 Recent Developments
In this section, recent developments related to wireless communication for theunderground environment are presented. The majority of such developments arenot actually WUSN applications or, at least, do not present the same challengesdiscussed in this chapter. However, the following examples supply an overall visionabout the challenges in this area and also present potential applications for WUSNs.
Wireless sensor networks have been used to monitor underground mines to guar-antee the safety of mine workers [8, 16]. Similarly, the characteristics of the wirelesschannel in tunnels are been investigated [4, 32]. As mentioned in Sect. 2, althoughthe mine is underground, the communication among the sensors is through the airin the mine or tunnel.
A shallow depth WSN was used for predicting landslides [28]. This networkconsists of MICA2 motes [10] that are interfaced with stain gauges and can operateat low depths (25–30 cm). In this design, although the sensors are buried under-ground, the communication takes place over the air. Another similar example is asensor network that is constructed to detect the volcano activities. The antenna ofthe sensors has to be placed above ground to create reliable links [38].

Communication Through Soil in WUSNs 313
Structural health monitoring (SHM) is another application that has gained inter-est in wireless sensor networks community. Two examples of such WSN applica-tion is Wisden, a data acquisition system for SHM [24, 40] and Duranode [25].Although underground systems such as sewers also require structural monitoring,these approaches only work with communication through air techniques.
The largest residential water management project in Europe uses sensors togather information for inspection and cleaning systems in the Emscher sewer system[12]. Similarly, a sensor network is used in other sewer system where the manholecover is converted into the slot antenna and the underground sensors can communi-cate with the aboveground nodes through radiation from it [21]. Again, although thesystem resides underground, the communication between the sensors is performedthrough air.
A glacier monitoring network, based on sensor network, was deployed in Nor-way [20]. This system aims to measure the parameters of ice caps and glaciers usingsensors beneath the glaciers. To avoid wet ice, the base stations are connected to twowired transceivers 30 m below the surface. Using high transmit powers (100 mW),these underice sensors can finally communicate with the sensors that are placedat deeper locations (up to 80 m from the surface). This application is not a typ-ical underground scenario, however it presents challenges similar to the ones forWUSNs.
In addition to these applications, there are several experimental work focusing onthe EM wave propagation through soil and rock. As part of the first studies relatedto the wireless communication through soil, the electromagnetic field principles ofa vertical electric dipole in a conducting half-space over the frequency range from1 to 10 MHz is analyzed [35]. Similarly, the communication through soil is regardedas an electromagnetic wave transfer through the transmission line and experimentsat the frequency range of 1–2 GHz are realized, providing a propagation model [37].
Moreover, experiments using ground-penetrating radars were performed [11, 22,35, 37]. This specific research area is called Microwave Remote Sensing [6, 9] andpart of the theoretical model presented in Sect. 4 is based on the results from thisresearch area. As an example of the use of the principles of the surface-penetratingradar, an experiment was done for determining the attenuation and relative per-mittivity values of various materials, including soil, at 100 MHz [11]. A typicalapplication for Microwave Remote Sensing is the detection of landmines based ondifferences between the dielectric constants of soil and the landmine. For instance,it was shown that the soil composition has significant effects on the Ground Pene-trating Radar (GPR) detection of landmines [22].
Although significant insight in EM wave propagation through soil can be gath-ered from these works, none of the existing work provides a complete characteriza-tion of underground communication. More specifically, neither the channel charac-teristics nor the multi path effects due to obstacles in soil or the nonhomogeneousfeature of soil have been analyzed before. In the following section, these importantissues are addressed aiming the establishment of the foundations for undergroundwireless networks.
314 M.C. Vuran and A.R. Silva
4 Underground Channel Model: The Theory
In this section, a brief introduction about the physical properties of the soil is pre-sented. Also the effects of these physical properties on the underground wirelesscommunication are explained. The soil is a dielectric material, characterized by adielectric constant. The propagation of EM waves is directly related to the dielectricconstant of the material. More specifically, a smaller value of the dielectric con-stant basically implies better conditions for the propagation of EM waves. The soilmedium behaves as a dielectric material composed of air, bound water, free water,and bulk soil. If the soil presents small density and high porosity, the performance ofthe propagation of EM waves is better due to the high quantity of air. However, thepresence of water in soil has a contrary effect on the communication. The quantity ofwater in the soil, which is usually measured as the volumetric water content (VWC)of the soil, is the main factor that contributes to the EM wave attenuation [19].
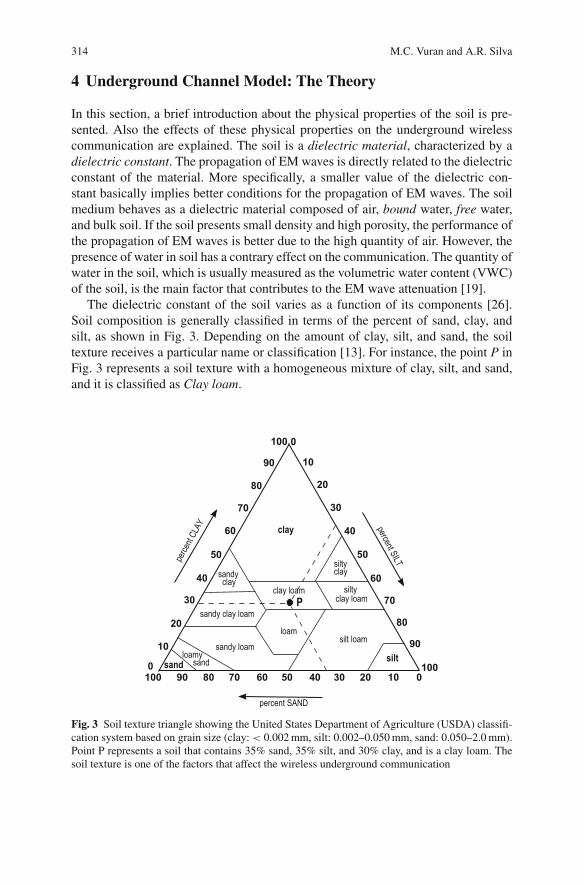
The dielectric constant of the soil varies as a function of its components [26].Soil composition is generally classified in terms of the percent of sand, clay, andsilt, as shown in Fig. 3. Depending on the amount of clay, silt, and sand, the soiltexture receives a particular name or classification [13]. For instance, the point P inFig. 3 represents a soil texture with a homogeneous mixture of clay, silt, and sand,and it is classified as Clay loam.
Fig. 3 Soil texture triangle showing the United States Department of Agriculture (USDA) classifi-cation system based on grain size (clay: < 0.002 mm, silt: 0.002–0.050 mm, sand: 0.050–2.0 mm).Point P represents a soil that contains 35% sand, 35% silt, and 30% clay, and is a clay loam. Thesoil texture is one of the factors that affect the wireless underground communication

Communication Through Soil in WUSNs 315
Besides clay, silt, and sand, the soil also contains water. The VWC of the soilrepresents the fraction of water in the soil. However, the water can be classified intotwo: the bound water, which corresponds to water molecules tightly held to the sur-face of the soil particles, and the free water, which corresponds to water moleculesfree of action of soil particles [6, 9]. As a result, for the same VWC, a sample ofsoil can contain more free water depending on the soil texture. More specifically,the quantity and also the type of clay determine the amount of bounded water in thesoil. As will be explained later in Sects. 4.1 and 5.5, the dielectric properties of thebounded water are different from the free water. Therefore, the attenuation of theEM waves and the change in the signal velocity varies as a function of the amountof bounded water and the amount of free water. In this way, it is clear that the VWCparameter alone is not sufficient to characterize the propagation of EM waves, butthe parameters related to the soil texture are also necessary to complement the VWCinformation.
Besides the VWC, the frequency of the signal also affects the propagation ofthe EM signal through the soil. It is well known that the dielectric constant of thesoil is a non-linear function of the frequency. In other words, it is not simple tocharacterize the EM signal propagation as a function of frequency. Therefore, manystudies were performed, for different frequency ranges, in order to determine theeffects in the signal propagation for a specific frequency range. It was shown thatfrequency values around 1 GHz present reasonable soil dielectric constant values forwireless communication and microwave remote sensing applications [26, 19, 15].Frequency values smaller than 300 MHz could result in smaller attenuation for theEM signal. However, when the frequency decreases, its wavelength increases andthe size of antenna would also increase. Hence, usually the use of frequency valuessmaller than 300 MHz for WUSN scenarios is impractical.
The main difference between the well established techniques in terrestrial wire-less sensor networks and WUSNs is the communication medium, which preventsa straightforward characterization of underground wireless channel. The main chal-lenges related to the use of soil as a communication medium are summarized below:
• Attenuation. EM waves encounter much higher attenuation in soil compared to airand this fact severely hampers the communication quality. As an example, effi-cient communication between sensors nodes above and below ground is shownto be possible only at the distance of 0.5 m when the 2.4 GHz frequency is used[30].
• Reflection. The ground surface may cause the reflection effect, which can havepositive or negative effects over the communication.
• Multi path fading. Unpredictable obstacles in soil such as rocks and roots oftrees make EM waves being refracted and scattered also cause problems in thecommunication.
Since underground communication and networking are primarily affected by thewireless channel capabilities, advanced models and techniques are necessary tocompletely characterize the underground wireless channel and lay out the foun-
316 M.C. Vuran and A.R. Silva
dations for efficient communication through soil. In Sect. 4.1, a basic model forthe underground wireless channel that mainly considers the frequency of the EMwaves, the soil composition, the soil density, and static values for VWC is present.In Sect. 4.2, the previous model is enhanced with the effects of multi path fadingand reflection from ground surface. Finally, the effects of VWC variations in soilare considered in Sect. 4.3.
4.1 Signal Propagation Through Soil
The study of the propagation of EM waves through the soil begins with the basicmodel of the propagation of EM waves over-the-air, followed by the addition of thepath loss factor specifically considering the properties of soil. From Friis equation[29], it is well known that the received signal strength (RSS) in free space at adistance r from the transmitter is expressed in logarithmic form as
Pr = Pt + Gr + Gt − L0 , (1)
where Pt is the transmit power, Gr and Gt are the gains of the receiver and trans-mitter antennae, and L0 is the path loss in free space in dB, which is given by
L0 = 32.4 + 20 log(d) + 20 log( f ) . (2)
where d is the distance between the transmitter and the receiver in kilometers, andf is the operation frequency in Mhz.
For the propagation in soil, an additional factor should be included in Friis equa-tion (1) due the attenuation of the EM wave caused by the soil medium. As a result,the received signal is expressed as [19]:
Pr = Pt + Gr + Gt − L0 − Ls , (3)
where Ls stands for the additional path loss caused by the propagation in soil, whichis calculated by considering the following two main differences of EM wave propa-gation in soil compared to that in air:
• The signal velocity, and hence, the wavelength λ, is different.• The amplitude of the wave will be attenuated according to the frequency.
Therefore, the additional path loss, Ls , in soil is composed of two components:
Ls = Lβ + Lα , (4)
where Lβ is the attenuation loss due to the difference of the wavelength of thesignal in soil, λ, compared to the wavelength in free space, λ0, and Lα is thetransmission loss caused by attenuation with attenuation constant α. Consequently,Lβ = 20 log(λ0/λ) and Lα = e2αd .
Communication Through Soil in WUSNs 317
Considering that in soil, the wavelength is λ = 2π/β and in free space λ0 = c/ f ,where β is the phase shifting constant, c = 3 × 10⁸ m/s, and f is the operatingfrequency in Hz, then, Lβ and Lα can be represented in d B as follows:
Lβ = 154 − 20 log( f ) + 20 log(β) , Lα = 8.69αd . (5)
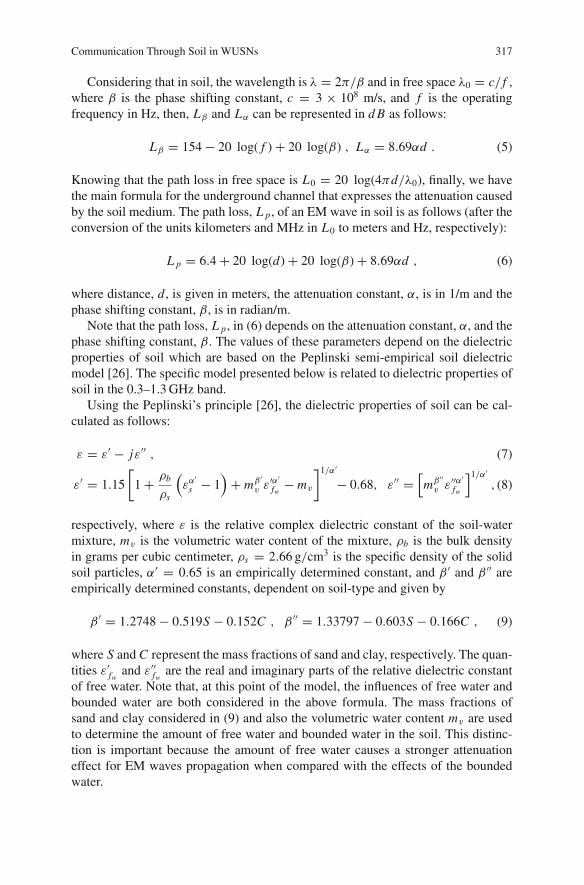
Knowing that the path loss in free space is L0 = 20 log(4πd/λ0), finally, we havethe main formula for the underground channel that expresses the attenuation causedby the soil medium. The path loss, L p, of an EM wave in soil is as follows (after theconversion of the units kilometers and MHz in L0 to meters and Hz, respectively):
L p = 6.4 + 20 log(d) + 20 log(β) + 8.69αd , (6)
where distance, d, is given in meters, the attenuation constant, α, is in 1/m and thephase shifting constant, β, is in radian/m.
Note that the path loss, L p, in (6) depends on the attenuation constant, α, and thephase shifting constant, β. The values of these parameters depend on the dielectricproperties of soil which are based on the Peplinski semi-empirical soil dielectricmodel [26]. The specific model presented below is related to dielectric properties ofsoil in the 0.3–1.3 GHz band.
Using the Peplinski’s principle [26], the dielectric properties of soil can be cal-culated as follows:
ε = ε′ − jε′′ , (7)
ε′ = 1.15
[1 + ρb
ρs
(εα′
s − 1)
+ mβ ′v ε′α′
fw − mv
]1/α′
− 0.68, ε′′ =[mβ ′′
v ε′′α′fw
]1/α′
, (8)
respectively, where ε is the relative complex dielectric constant of the soil-watermixture, mv is the volumetric water content of the mixture, ρb is the bulk densityin grams per cubic centimeter, ρs = 2.66 g/cm3 is the specific density of the solidsoil particles, α′ = 0.65 is an empirically determined constant, and β ′ and β ′′ areempirically determined constants, dependent on soil-type and given by
β ′ = 1.2748 − 0.519S − 0.152C , β ′′ = 1.33797 − 0.603S − 0.166C , (9)
where S and C represent the mass fractions of sand and clay, respectively. The quan-tities ε′
fwand ε′′
fware the real and imaginary parts of the relative dielectric constant
of free water. Note that, at this point of the model, the influences of free water andbounded water are both considered in the above formula. The mass fractions ofsand and clay considered in (9) and also the volumetric water content mv are usedto determine the amount of free water and bounded water in the soil. This distinc-tion is important because the amount of free water causes a stronger attenuationeffect for EM waves propagation when compared with the effects of the boundedwater.
318 M.C. Vuran and A.R. Silva
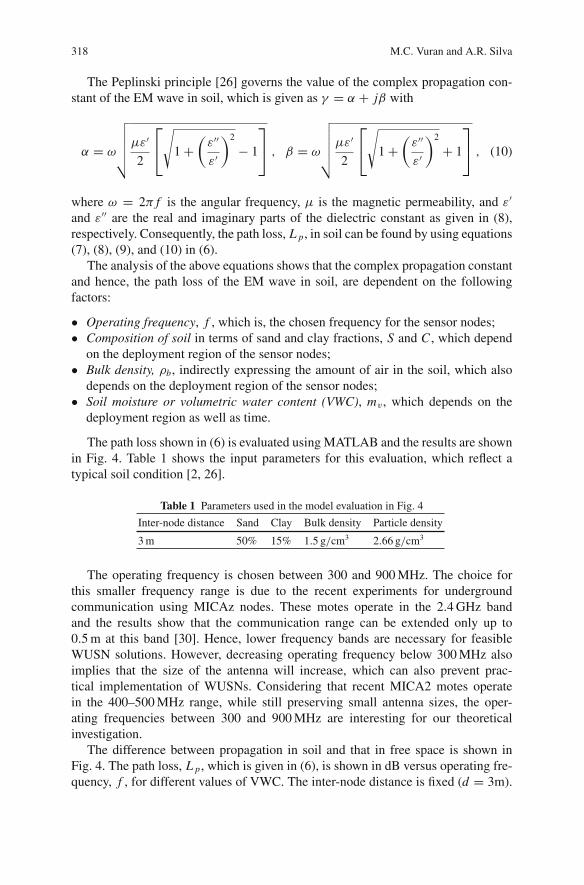
The Peplinski principle [26] governs the value of the complex propagation con-stant of the EM wave in soil, which is given as γ = α + jβ with
α = ω
√√√√√
με′
2
⎡
⎣
√
1 +(
ε′′
ε′
)2
− 1
⎤
⎦ , β = ω
√√√√√
με′
2
⎡
⎣
√
1 +(
ε′′
ε′
)2
+ 1
⎤
⎦ , (10)
where ω = 2π f is the angular frequency, μ is the magnetic permeability, and ε′
and ε′′ are the real and imaginary parts of the dielectric constant as given in (8),respectively. Consequently, the path loss, L p, in soil can be found by using equations(7), (8), (9), and (10) in (6).
The analysis of the above equations shows that the complex propagation constantand hence, the path loss of the EM wave in soil, are dependent on the followingfactors:
• Operating frequency, f , which is, the chosen frequency for the sensor nodes;• Composition of soil in terms of sand and clay fractions, S and C , which depend
on the deployment region of the sensor nodes;• Bulk density, ρb, indirectly expressing the amount of air in the soil, which also
depends on the deployment region of the sensor nodes;• Soil moisture or volumetric water content (VWC), mv , which depends on the
deployment region as well as time.
The path loss shown in (6) is evaluated using MATLAB and the results are shownin Fig. 4. Table 1 shows the input parameters for this evaluation, which reflect atypical soil condition [2, 26].
Table 1 Parameters used in the model evaluation in Fig. 4
Inter-node distance Sand Clay Bulk density Particle density
3 m 50% 15% 1.5 g/cm3 2.66 g/cm3
The operating frequency is chosen between 300 and 900 MHz. The choice forthis smaller frequency range is due to the recent experiments for undergroundcommunication using MICAz nodes. These motes operate in the 2.4 GHz bandand the results show that the communication range can be extended only up to0.5 m at this band [30]. Hence, lower frequency bands are necessary for feasibleWUSN solutions. However, decreasing operating frequency below 300 MHz alsoimplies that the size of the antenna will increase, which can also prevent prac-tical implementation of WUSNs. Considering that recent MICA2 motes operatein the 400–500 MHz range, while still preserving small antenna sizes, the oper-ating frequencies between 300 and 900 MHz are interesting for our theoreticalinvestigation.
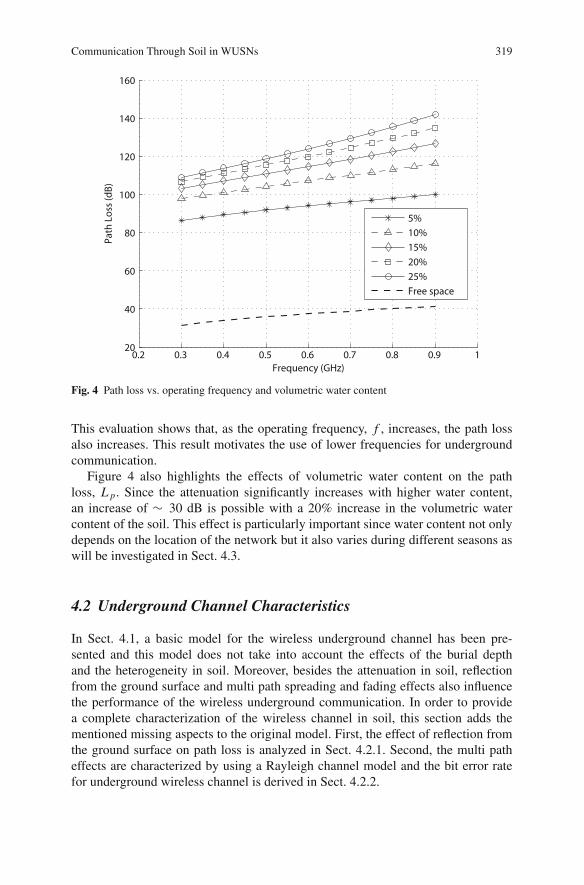
The difference between propagation in soil and that in free space is shown inFig. 4. The path loss, L p, which is given in (6), is shown in dB versus operating fre-quency, f , for different values of VWC. The inter-node distance is fixed (d = 3m).
Communication Through Soil in WUSNs 319
0.2 0.3 0.4 0.5 0.6 0.7 0.8 0.9 120
40
60
80
100
120
140
160
Path
Los
s (d
B)
Frequency (GHz)
5%10%15%20%25%Free space
Fig. 4 Path loss vs. operating frequency and volumetric water content
This evaluation shows that, as the operating frequency, f , increases, the path lossalso increases. This result motivates the use of lower frequencies for undergroundcommunication.
Figure 4 also highlights the effects of volumetric water content on the pathloss, L p. Since the attenuation significantly increases with higher water content,an increase of ∼ 30 dB is possible with a 20% increase in the volumetric watercontent of the soil. This effect is particularly important since water content not onlydepends on the location of the network but it also varies during different seasons aswill be investigated in Sect. 4.3.
4.2 Underground Channel Characteristics
In Sect. 4.1, a basic model for the wireless underground channel has been pre-sented and this model does not take into account the effects of the burial depthand the heterogeneity in soil. Moreover, besides the attenuation in soil, reflectionfrom the ground surface and multi path spreading and fading effects also influencethe performance of the wireless underground communication. In order to providea complete characterization of the wireless channel in soil, this section adds thementioned missing aspects to the original model. First, the effect of reflection fromthe ground surface on path loss is analyzed in Sect. 4.2.1. Second, the multi patheffects are characterized by using a Rayleigh channel model and the bit error ratefor underground wireless channel is derived in Sect. 4.2.2.
320 M.C. Vuran and A.R. Silva
4.2.1 Reflection from Ground Surface
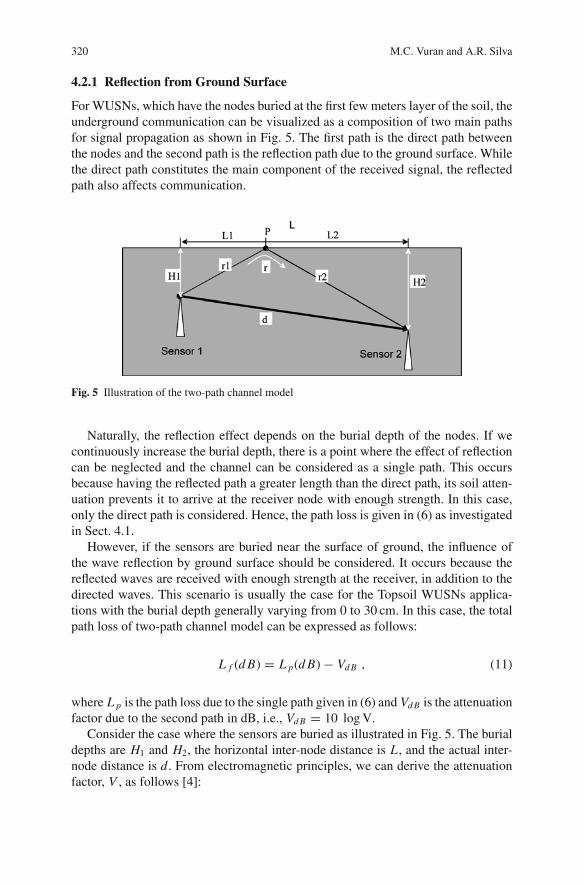
For WUSNs, which have the nodes buried at the first few meters layer of the soil, theunderground communication can be visualized as a composition of two main pathsfor signal propagation as shown in Fig. 5. The first path is the direct path betweenthe nodes and the second path is the reflection path due to the ground surface. Whilethe direct path constitutes the main component of the received signal, the reflectedpath also affects communication.
Fig. 5 Illustration of the two-path channel model
Naturally, the reflection effect depends on the burial depth of the nodes. If wecontinuously increase the burial depth, there is a point where the effect of reflectioncan be neglected and the channel can be considered as a single path. This occursbecause having the reflected path a greater length than the direct path, its soil atten-uation prevents it to arrive at the receiver node with enough strength. In this case,only the direct path is considered. Hence, the path loss is given in (6) as investigatedin Sect. 4.1.
However, if the sensors are buried near the surface of ground, the influence ofthe wave reflection by ground surface should be considered. It occurs because thereflected waves are received with enough strength at the receiver, in addition to thedirected waves. This scenario is usually the case for the Topsoil WUSNs applica-tions with the burial depth generally varying from 0 to 30 cm. In this case, the totalpath loss of two-path channel model can be expressed as follows:
L f (d B) = L p(d B) − Vd B , (11)
where L p is the path loss due to the single path given in (6) and Vd B is the attenuationfactor due to the second path in dB, i.e., Vd B = 10 log V.
Consider the case where the sensors are buried as illustrated in Fig. 5. The burialdepths are H1 and H2, the horizontal inter-node distance is L , and the actual inter-node distance is d. From electromagnetic principles, we can derive the attenuationfactor, V , as follows [4]:

Communication Through Soil in WUSNs 321
0 0.5 1 1.5 280
90
100
110
120
130
140
Path
Los
s (d
B)
Depth (m)
300MHz400MHz500MHz600MHz700MHz
Fig. 6 Two-path channel model: path loss vs. depth for different operating frequencies
V 2 = 1 + (Γ · exp (−αΔ(r )))2 − 2Γ exp (−αΔ(r )) cos
(π −
(φ − 2π
λΔ(r )
)),
(12)
where, Γ and φ are the amplitude and phase angle of the reflection coefficient atthe reflection point P, Δ(r ) = r − d, is the difference of the two paths, λ is thewavelength in soil, and α is the attenuation as given in (10).
In Figs. 6 and 7, the path loss is shown as a function of depth, H , operatingfrequency, and volumetric water content. The evaluations are using (12) in (11). Inthese figures, we assume that the sensors are buried at the same depth, i.e., H1 =H2 = H and hence d = L . Table 2 shows the input parameters for this evaluation.
Table 2 Parameters used in the model evaluation in Fig. 6
Inter-node distance Sand Clay Bulk density Particle density VWC
3 m 50% 15% 1.5 g/cm3 2.66 g/cm3 5%
In Fig. 6, the path loss is shown as a function of burial depth, H , for variousoperating frequency, f . It can be observed that for the two-path model, the operatingfrequency, f , has a higher impact on the communication channel and the degree ofthe effect depends on the bury depth, H . It occurs because the operating frequencyf indirectly appears, as parameter λ, in the formula for the attenuation factor,V , in (12).

322 M.C. Vuran and A.R. Silva
As shown in Fig. 6, for a particular operating frequency, it is possible to deter-mine what is the optimum burial depth where the path loss is minimized. This resultis particularly important for the topology design of WUSNs, where the burial depthof the nodes could be tailored to the operating frequency of these devices. In Fig. 6, itcan also be observed that the effects of reflection, and hence, the fluctuations in pathloss, diminish as the bury depth, H , increases. More specifically, the undergroundchannel exhibits a single-path characteristic when the burial depth is higher thana threshold value. As shown in Fig. 6, this threshold value is near 2 m. However,this value of 2 m is specific for the parameters used in this evaluation and differentvalues can be provided by the evaluation of the model with different parameters,such as VWC and soil composition. It is important to observe that, considering theusual burial depth proposed by many Subsoil WUSNs, it is expected the adoptionof the two-path channel model for all the Topsoil WUSNs and the majority of theSubsoil WUSNs.
Comparing the results of this model in Fig. 6 with the single-path model resultsfor the inter-node distance of 3 m, shown in Fig. 4, it is observed that the two pathmodel presents a slightly smaller path loss, despite the fluctuations based on depthand volumetric water content. These results highlights that the reflection effects aregenerally positive for the underground communication.
The effects of frequency and the volumetric water content are shown in Fig. 7and the input parameters are listed in Table 3. As shown in Fig. 7, the path lossfluctuates according to both operating frequency and volumetric water content. Thisfluctuation is due to the constructive or destructive interference of the second pathbased on the operating frequency and the VWC. This result suggests that dynamic
510
1520
25
0.2
0.4
0.6
0.8
180
90
100
110
120
130
140
150
Volumetric Water Content (%)Frequency (GHz)
Path
loss
(dB)
Fig. 7 Two-path channel model: path loss vs. operating frequencies and VWC

Communication Through Soil in WUSNs 323
Table 3 Parameters used in the model evaluation in Fig. 7
Inter-node distance Sand Clay Bulk density Particle density Depth (H1 = H2)
3 m 50% 15% 1.5 g/cm3 2.66 g/cm3 0.5 m
frequency operation may be necessary in WUSNs, where the operating frequencycould be determined as a function of changes on the volumetric water content. Cog-nitive radio techniques [1] may be used to allow the adaptation of the WUSN tosuch changes normally related to changes on the environmental conditions.
4.2.2 Multi Path Fading and Bit Error Rate
In Sect. 4.2.1, it was presented an enhanced model for the wireless undergroundchannel that considers the main propagation characteristics of EM waves and alsothe effects from the reflected waves. Moreover, the reflection is an aspect thatdepends on the burial depth of the nodes. However, the heterogeneity of soil canstill interfere with the communication channel in two ways. First, the surface of theground is not smooth and, hence, not only causes reflection, but also refraction. Sec-ond, the presence of rocks and roots of plants in soil is generally not homogeneousand results in non-deterministic behavior. Therefore, multi path fading should alsobe considered in addition to the basic two-path channel model.
The existence of fixed and mobile obstacles also results in fluctuation and ran-dom refraction of EM waves in air. Therefore, the amplitude and the phase of thereceived signal exhibit a random behavior with time. The multi path fading hasbeen extensively investigated for the over-the-air wireless communication [29]. Itwas observed that, in general, this multi path channel obeys Rayleigh or log-normalprobability distribution.
However, the underground environment for wireless communication does notpresent random refractions of the EM waves with time. As will be shown inSect. 5.4, the wireless underground channel between two nodes is relatively stable.On the other hand, the roots of trees, rocks, clay particles and other objects in soilcan still incur reflection and refraction for EM waves similar to the obstacles doin air. Consider the scenario where the transmitter node has the same inter-nodedistance related to multiple receivers that are placed at different locations, at thesame burial depth. It is highly probable that different signal levels will be observedat the receivers. It occurs because the signal travels through different multi paths.Therefore, randomness in underground environment is due to the locations of thenodes rather than time, but it still obeys the Rayleigh probability distribution, wherethe variable is location instead of time. Accordingly, we consider that each path inthe underground channel is Rayleigh distributed such that the envelope of the signalfrom each path is modeled as an independent Rayleigh distributed random variable,χi , i ∈ {1, 2}. Consequently, for the one-path model, the received energy per bit pernoise power spectral density is given by r = χ2 Eb/No, which has a distributionas f (r ) = 1/r0 exp(−r/r0), where r0 = E[χ2]Eb/No and Eb/No can be directlyfound from the signal-to-noise ratio (SNR) of the channel.
324 M.C. Vuran and A.R. Silva
For the two-path model case, in a similar way, it is assumed that the receivedsignal is the sum of two independent Rayleigh fading signals. This model is denotedas location dependent Rayleigh multi path channel. Consequently, the compositeattenuation constant, χ , in multi path Rayleigh channel is:
χ2 = χ21 + (χ2 · Γ · exp (−αΔ (r )))2
−2χ1χ2Γ exp (−αΔ(r )) cos
(π −
(φ − 2π
λΔ(r )
)), (13)
where χ1 and χ2 are two independent Rayleigh distributed random variables of twopaths, respectively. Γ and φ are the amplitude and phase angle of the reflectioncoefficient at the reflection point P, Δ(r ) = r − d, is the difference of the two pathsand α is the attenuation constant.
Based on the above model, the goal of this section is to investigate the bit errorrate (BER) characteristics of the underground channel. The results from these eval-uations will supply guidelines to efficiently deal with the underlying challenges inthe design of WUSNs.
It is well known that the BER of a communication system depends mainly onthree factors: the channel model, the signal to noise ratio (SNR), and the modulationtechnique used by the system. Considering the channel model derived in Sect. 4.2.1,the signal to noise ratio (SNR) is given by SNR = Pt − L f − Pn , where Pt is thetransmit power, L f is the total path loss given in (11), and Pn is the energy of noise.In order to determine the noise power Pn , field experiments were performed usingthe BVS YellowJacket wireless spectrum analyzer [41]. The average noise level isfound to be −103 dBm at 30 cm depth, using the YellowJacket [19]. Although thisnoise Pn may change depending on the properties of the soil, this value is a repre-sentative value that can be used to represent the properties of underground BER.
For the evaluations, PSK modulation is considered. More specifically, adoptingthe 2PSK modulation scheme, the BER can be represented as a function of SNR asBER = 0.5erfc(
√SNR), where erfc(·) is the error function and SNR is the signal to
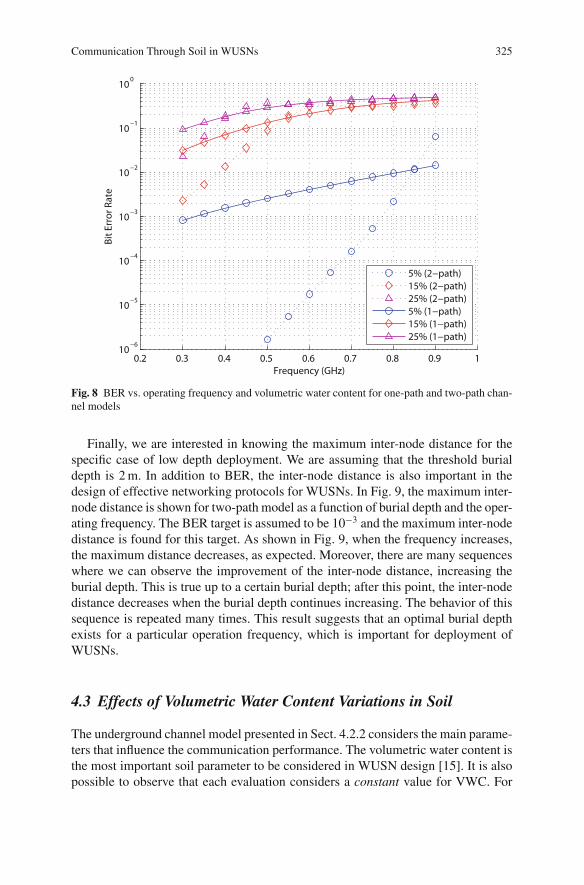
noise ratio.In Fig. 8, the evaluation for single- and two-path models are shown as a function
of operating frequency for different VWC levels. It can be observed that the VWChas an important impact on the BER compared to other parameters. As shown inFig. 8, when the VWC increases from 5 to 15%, the BER also increases more thanone order of magnitude. Moreover, the values of BER for the single path modelare higher than the BER values for the two-path model. This shows the positiveeffects of the reflected path from the ground surface on BER. As already explainedin Sect. 4.2.1, the two-path Rayleigh fading model is suitable for burial depths lessthan a threshold value. For the scenario considered in the evaluations in Sect. 4.2.1,this threshold value was found to be H = 2 m.
The effect of VWC in the two-path model is also shown in Fig. 8. One can verifythat, even with a high VWC of 25%, it is possible to have a BER <20%, when a lowdepth deployment (dual-path model) is adopted with a low operating frequency.
Communication Through Soil in WUSNs 325
0.2 0.3 0.4 0.5 0.6 0.7 0.8 0.9 110
−6
10−5
10−4
10−3
10−2
10−1
100
Bit E
rror
Rat
e
Frequency (GHz)
5% (2−path)15% (2−path)25% (2−path)5% (1−path)15% (1−path)25% (1−path)
Fig. 8 BER vs. operating frequency and volumetric water content for one-path and two-path chan-nel models
Finally, we are interested in knowing the maximum inter-node distance for thespecific case of low depth deployment. We are assuming that the threshold burialdepth is 2 m. In addition to BER, the inter-node distance is also important in thedesign of effective networking protocols for WUSNs. In Fig. 9, the maximum inter-node distance is shown for two-path model as a function of burial depth and the oper-ating frequency. The BER target is assumed to be 10−3 and the maximum inter-nodedistance is found for this target. As shown in Fig. 9, when the frequency increases,the maximum distance decreases, as expected. Moreover, there are many sequenceswhere we can observe the improvement of the inter-node distance, increasing theburial depth. This is true up to a certain burial depth; after this point, the inter-nodedistance decreases when the burial depth continues increasing. The behavior of thissequence is repeated many times. This result suggests that an optimal burial depthexists for a particular operation frequency, which is important for deployment ofWUSNs.
4.3 Effects of Volumetric Water Content Variations in Soil
The underground channel model presented in Sect. 4.2.2 considers the main parame-ters that influence the communication performance. The volumetric water content isthe most important soil parameter to be considered in WUSN design [15]. It is alsopossible to observe that each evaluation considers a constant value for VWC. For

326 M.C. Vuran and A.R. Silva
0 0.5 1 1.5 2
3.8
3.6
3.4
3.2
3
2.8
2.6
2.4
2.2
2
1.8
Max
imum
Dis
tanc
e (m
)
Depth (m)
300MHz400MHz700MHz
Fig. 9 Maximum inter-node distance vs. depth
instance, in Fig. 9, the simulations assumed that VWC is constant throughout the soilat different depths. However, experimental results reveal that VWC can also changewith depth [14, 18, 42, 9]. Besides the variation of the VWC related to the soil depth,significant VWC variations are also observable as a function of weather, period ofthe year, and time of the day. Consequently, VWC changes for different depths andtimes and so the dielectric constant of soil, causing variations on path loss and BER.This section investigates the long-term and transient effects of VWC variations atdifferent depths and times over the wireless underground communication.
4.3.1 Long-Term VWC Effects
Site measurements reveal that the volumetric water content does not linearly changewith the depth [14, 18, 42, 9]. Generally, VWC increases with the depth first andthen decreases with it. However, the variation characteristics as well as the specificdepths where VWC starts to decrease also depend on, among other factors:
• the type of the soil;• the type of the existent vegetation;• the nature of the artificial watering process.
Therefore, it is important to know how these VWC variations change the originalresults from the model in Sect. 4.2.2.
To investigate the relation of wireless underground communication quality withthe burial depth, experimental data in [42, 18] is used. Two different sites were
Communication Through Soil in WUSNs 327
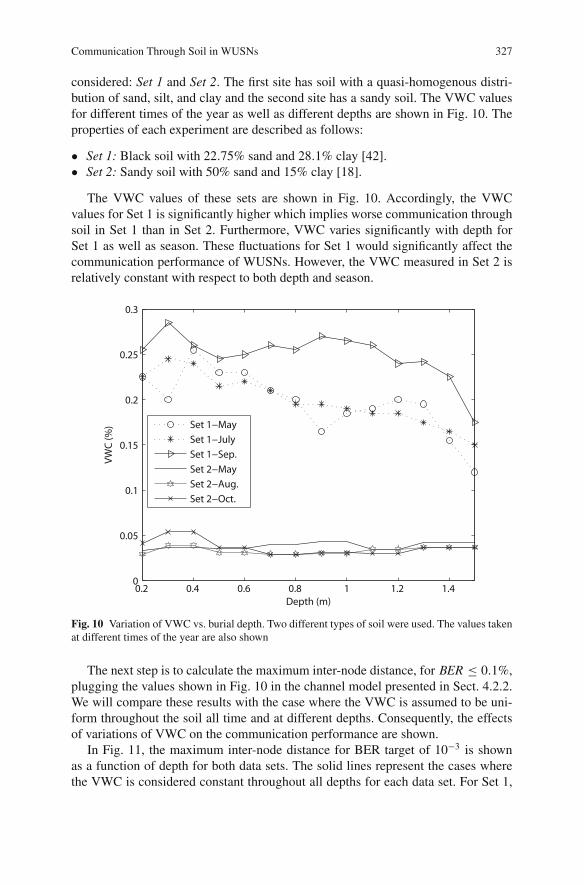
considered: Set 1 and Set 2. The first site has soil with a quasi-homogenous distri-bution of sand, silt, and clay and the second site has a sandy soil. The VWC valuesfor different times of the year as well as different depths are shown in Fig. 10. Theproperties of each experiment are described as follows:
• Set 1: Black soil with 22.75% sand and 28.1% clay [42].• Set 2: Sandy soil with 50% sand and 15% clay [18].
The VWC values of these sets are shown in Fig. 10. Accordingly, the VWCvalues for Set 1 is significantly higher which implies worse communication throughsoil in Set 1 than in Set 2. Furthermore, VWC varies significantly with depth forSet 1 as well as season. These fluctuations for Set 1 would significantly affect thecommunication performance of WUSNs. However, the VWC measured in Set 2 isrelatively constant with respect to both depth and season.
0.2 0.4 0.6 0.8 1 1.2 1.40
0.05
0.1
0.15
0.2
0.25
0.3
Depth (m)
VWC
(%) Set 1−May
Set 1−JulySet 1−Sep.Set 2−MaySet 2−Aug.Set 2−Oct.
Fig. 10 Variation of VWC vs. burial depth. Two different types of soil were used. The values takenat different times of the year are also shown
The next step is to calculate the maximum inter-node distance, for BER ≤ 0.1%,plugging the values shown in Fig. 10 in the channel model presented in Sect. 4.2.2.We will compare these results with the case where the VWC is assumed to be uni-form throughout the soil all time and at different depths. Consequently, the effectsof variations of VWC on the communication performance are shown.
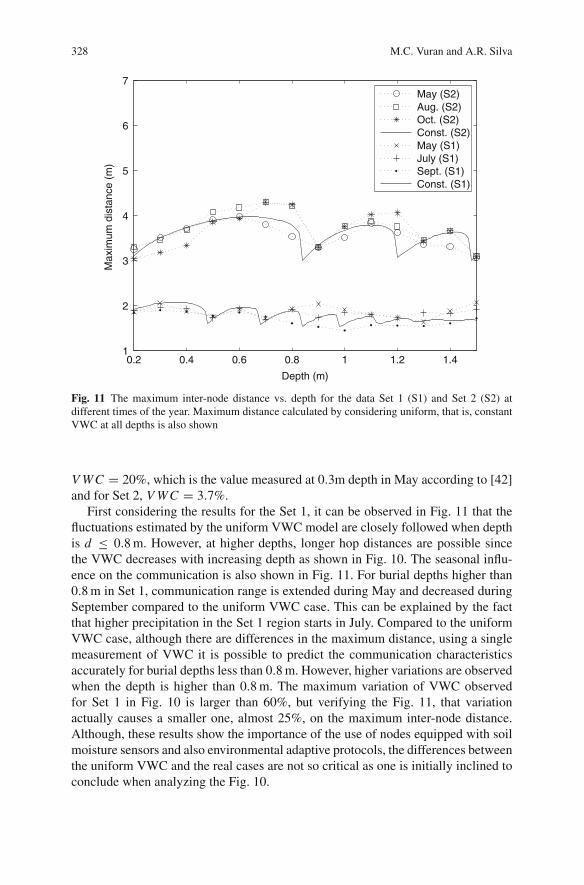
In Fig. 11, the maximum inter-node distance for BER target of 10−3 is shownas a function of depth for both data sets. The solid lines represent the cases wherethe VWC is considered constant throughout all depths for each data set. For Set 1,
328 M.C. Vuran and A.R. Silva
0.2 0.4 0.6 0.8 1 1.2 1.41
2
3
4
5
6
7
Depth (m)
Max
imum
dis
tanc
e (m
) May (S2)Aug. (S2)Oct. (S2)Const. (S2)May (S1)July (S1)Sept. (S1)Const. (S1)
Fig. 11 The maximum inter-node distance vs. depth for the data Set 1 (S1) and Set 2 (S2) atdifferent times of the year. Maximum distance calculated by considering uniform, that is, constantVWC at all depths is also shown
V WC = 20%, which is the value measured at 0.3m depth in May according to [42]and for Set 2, V WC = 3.7%.
First considering the results for the Set 1, it can be observed in Fig. 11 that thefluctuations estimated by the uniform VWC model are closely followed when depthis d ≤ 0.8 m. However, at higher depths, longer hop distances are possible sincethe VWC decreases with increasing depth as shown in Fig. 10. The seasonal influ-ence on the communication is also shown in Fig. 11. For burial depths higher than0.8 m in Set 1, communication range is extended during May and decreased duringSeptember compared to the uniform VWC case. This can be explained by the factthat higher precipitation in the Set 1 region starts in July. Compared to the uniformVWC case, although there are differences in the maximum distance, using a singlemeasurement of VWC it is possible to predict the communication characteristicsaccurately for burial depths less than 0.8 m. However, higher variations are observedwhen the depth is higher than 0.8 m. The maximum variation of VWC observedfor Set 1 in Fig. 10 is larger than 60%, but verifying the Fig. 11, that variationactually causes a smaller one, almost 25%, on the maximum inter-node distance.Although, these results show the importance of the use of nodes equipped with soilmoisture sensors and also environmental adaptive protocols, the differences betweenthe uniform VWC and the real cases are not so critical as one is initially inclined toconclude when analyzing the Fig. 10.

Communication Through Soil in WUSNs 329
The two sets present distinct types of soils. The black soil considered in Set 1 hasmore clay particles than the sandy soil considered in Set 2. As a result, the black soilholds more water compared to sandy soil, which negatively affects the communica-tion. On the other hand, the sandy soil considered in Set 2, having lower volumetricwater content, has the potential to improve the communication significantly. Thisfact is visible in Fig. 11. As shown in Fig. 10, the VWC for the data Set 2 doesnot vary significantly by depth or season. As a result, uniform VWC model closelymatches the maximum distance achieved through actual VWC measurements, asshown in Fig. 11. Moreover, since the VWC of Set 2 is significantly lower thanSet 1, the communication range is almost doubled. Intuitively, we can conclude thatsandy soil is practically exempt from issues related to VWC variations. However,this assumption is not completely true as we will see later at the end of this section.
Considering the intense influence of VWC over the underground wireless com-munication, it is important to consider the relation between the variations in VWCand the corresponding changes in communication range in more details. This eval-uation for the Set 1 is shown in Fig. 12, which relates a change in VWC with themaximum inter-node distance for BER target of 10−3. The x-axis shows the changein percentage in VWC based on the measured data in Set 1 and the y-axis shows thecorresponding change in maximum inter-node distance. The actual values as wellas the fitted lines for three different months are given in Fig. 12. It is shown that anincrease in VWC results in decrease in communication range. Although quadraticfitting is used, the relationship is linear. Moreover, the rate of change in distancewith VWC (the line slope), depends on the season. For instance, a 20% decrease inVWC corresponds to a 10% increase in communication range in July, whereas, inSeptember, this corresponds to a 4% increase in communication range.
4.3.2 Transient VWC Effects
The temporal analysis of the VWC presented so far considers seasonal changes andburial depths, i.e., long term changes in VWC. However, there are also transientscenarios that should be considered. For instance, the effects of a 5 min intensiverain on the communication are important for network operation. To understand howthe dielectric constant of soil varies under these extreme scenarios, it is important toanalyze the physical properties of soil in more detail.
Basically, if no watering process occurs frequently, the VWC of the soil is relatedto the capacity of the soil to hold the water, which depends on the surface area ofits particles. Clay particles with a diameter smaller than 0.002 mm have a surfacearea of 8, 000, 000 cm2 per gram. On the other hand, sand particles, with a diameterlarger than 0.05 mm, have a surface area of only 227 cm2 per gram [13]. Consideringthat water absorption is a function of the surface area, high values of VWC areexpected for clay soils and low values for sandy soils.
The discussion in Sect. 4 shows that the water in the soil is usually classifiedinto two based on its interaction with the soil particles. The bound water is tightlybounded to the surface of the soil particles. The free water is the remaining water inthe soil, free of action of any particle [6]. Both kinds of water cause the elevation of

330 M.C. Vuran and A.R. Silva
− 50 − 40 − 30 − 20 − 10 0 10 20 30− 20
− 15
− 10
− 5
0
5
10
15
20
25
30
Error in VWC (%)
Cha
nge
in M
ax. D
ista
nce
(%)
MayMay (fit)JulyJuly (fit)Sept.Sept. (fit)
Fig. 12 Relationship between change in VWC and change in maximum inter-node distance
the soil dielectric constant, causing problems to the underground wireless commu-nication. However, the dielectric constant of bounded water is between the dielectricconstants of liquid water and ice. In other words, the effects of the bounded waterare not positive for the EM wave propagation, but the effects of free water are evenworse.
In general, for clay dominant soils, the majority of the VWC is related to thebound water. In a completely dry soil (VWC=0), the addition of water first causesthe formation of bound water, followed by the formation of free water. From thepoint of view of the dielectric constant of the soil, as the VWC is increasing, onecan see, first, a slow elevation of the dielectric constant due to the bounded waterwhich is being formed. At a certain value of the VWC, called transition level [9],the slope of the dielectric constant drastically changes, and the dielectric constantassumes higher values more quickly. This second effect occurs because the boundwater capacity of the soil is reached and the free water starts its formation, causingan abrupt increase in the dielectric constant. The transition point is smaller for sandysoils than for clay soils [6, 9]. Consequently, an abrupt elevation of the VWC cancause a higher variation of the dielectric constant of the sandy soil than the variationfor a clay soil. Usually this scenario is temporary, for instance, for some minutes,due the fact that sandy soils will not absorb the same amount of water than claysoil and normally the majority of free water quickly infiltrates through the soil. Thisanalysis also shows the importance for WUSN design to consider the use of somenodes equipped with soil moisture sensors.

Communication Through Soil in WUSNs 331
As shown is this section, the model in Sect. 4.2.2 can be applied to real worldeven with the homogeneous VWC distribution assumption. Nonetheless, the spatio-temporal variability of the VWC must be controlled. For WUSN design, the adop-tion of some nodes equipped with soil moisture sensors is necessary. With thesereal-time measurements, cross-layer protocols could dynamically adjust the pre-sented model considering both minor errors caused by the non-homogeneity of theVWC and also the temporal variation of VWC caused by environment factors.
5 Underground Experiments – The Practice
The characteristics of the underground channel in soil are modeled in Sect. 4 consid-ering the effects of the reflection of surface and the multi path fading. Moreover, thetheoretical analysis also considers different VWC levels and different frequencies atthe range 300–900 MHz. As shown in Fig. 6, the model highlights the advantagesof using the 300–400 MHz frequency range in terms of better values for path lossand smaller impact of the VWC over the communication. This section presents a setof field experiments that were realized to confirm such theoretical assumptions andalso to provide a proof-of-concept of the feasibility of using commodity terrestrialWSN sensors in wireless underground applications. Finally, the experimental resultsalso expose additional aspects to be carefully considered in a practical WUSN appli-cation.
The underground experiments were carried out in Lincoln, NE, USA duringAugust-November 2008 period [31]. The experiment site is shown in Fig. 13(a).The analysis of the soil texture is shown in Table 4 according to laboratory analysis[36]. MICA2 nodes operating at 433 MHz [10] were used in the experiments. Asalready discussed in Sect. 4, this operating frequency was chosen since it exhibitsbetter propagation characteristics than higher frequencies typically adopted for ter-restrial sensor nodes, e.g. 2.4 GHz. The experiment site was prepared as follows: 10holes of 8 cm-diameter, with depths varying from 70 to 100 cm, were dug with anelectric auger. A paper pipe with an attached MICA2 node is injected to each holeat different depths.
Table 4 Soil analysis report
Sample depth Organic matter Texture %Sand %Silt %Clay
0–15 cm 6.4 Loam 27 45 2815–30 cm 2.6 Clay Loam 31 40 2930–45 cm 1.5 Clay Loam 35 35 30
For the experiments, a software suite called Small Grid Testbed for WSN Exper-iments (S-GriT) based on Java and TinyOS 1.1x [33] was developed. This appli-cation was developed to allow many number of the nodes acting as receivers. TheS-GriT allows configuration of multiple experiments without physically accessingthe buried nodes. More specifically, the following parameters are controlled: numberof messages for each experiment, number of bytes per message, delay between the
332 M.C. Vuran and A.R. Silva
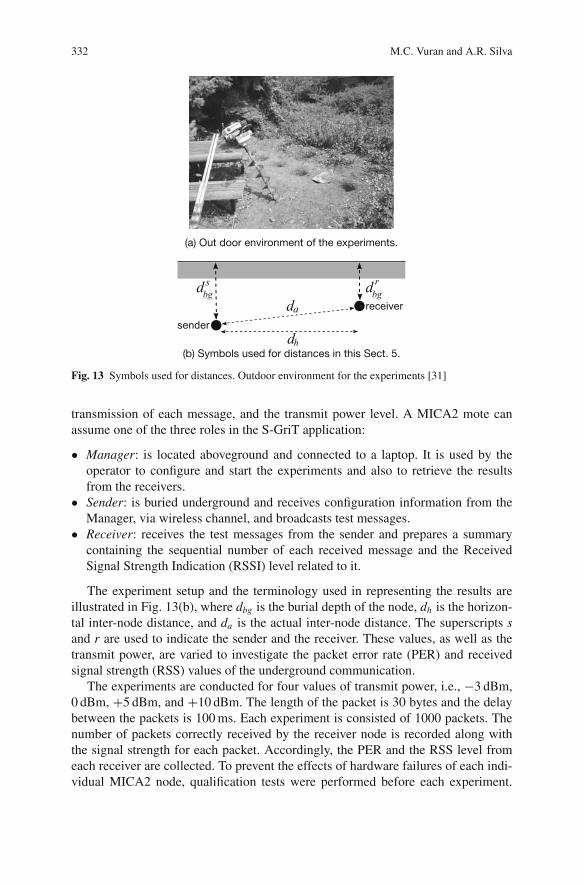
(b) Symbols used for distances in this Sect. 5.
(a) Out door environment of the experiments.
Fig. 13 Symbols used for distances. Outdoor environment for the experiments [31]
transmission of each message, and the transmit power level. A MICA2 mote canassume one of the three roles in the S-GriT application:
• Manager: is located aboveground and connected to a laptop. It is used by theoperator to configure and start the experiments and also to retrieve the resultsfrom the receivers.
• Sender: is buried underground and receives configuration information from theManager, via wireless channel, and broadcasts test messages.
• Receiver: receives the test messages from the sender and prepares a summarycontaining the sequential number of each received message and the ReceivedSignal Strength Indication (RSSI) level related to it.
The experiment setup and the terminology used in representing the results areillustrated in Fig. 13(b), where dbg is the burial depth of the node, dh is the horizon-tal inter-node distance, and da is the actual inter-node distance. The superscripts sand r are used to indicate the sender and the receiver. These values, as well as thetransmit power, are varied to investigate the packet error rate (PER) and receivedsignal strength (RSS) values of the underground communication.
The experiments are conducted for four values of transmit power, i.e., −3 dBm,0 dBm, +5 dBm, and +10 dBm. The length of the packet is 30 bytes and the delaybetween the packets is 100 ms. Each experiment is consisted of 1000 packets. Thenumber of packets correctly received by the receiver node is recorded along withthe signal strength for each packet. Accordingly, the PER and the RSS level fromeach receiver are collected. To prevent the effects of hardware failures of each indi-vidual MICA2 node, qualification tests were performed before each experiment.
Communication Through Soil in WUSNs 333
Accordingly, through-the-air tests, which consists of 200 packets of 30 bytes, wereperformed to (1) determine compliant nodes and (2) confirm that the battery level ofa node is above a safe limit. A node is labeled compliant with a given set of nodesif (1) its PER varies within 10% of the average PER calculated for the set of nodesand (2) its RSS average varies, at maximum, ±1 dBm from the average RSS for theset of nodes. The safe limit for the battery level has been determined as 2.5V for theMICA2 nodes. We observed that, in general, only 50% of the 11 nodes used werequalified for each experiment.
We present the results of these experiments to highlight important parameters thataffect the wireless underground communication. In Sect. 5.1, the effects of antennaorientation, not previously considered in Sect. 4, are presented. The influence ofthe burial depth is shown in Sect. 5.2. In Sect. 5.3, the results related to the inter-node distance parameter are investigated, showing the actual limitations of usingcommodities WSN sensors in WUSN applications. The temporal characteristics ofthe wireless underground communication channel are analyzed in Sect. 5.4. Finally,the effects of VWC over the communication are presented in Sect. 5.5. The maingoal of this section is to verify if the experimental results agree with the theoreticalwireless underground communication models presented in the Sect. 4. Additionally,we will see how field experiments can reveal hidden aspects not considered in thetheoretical study.
5.1 Antenna Orientation
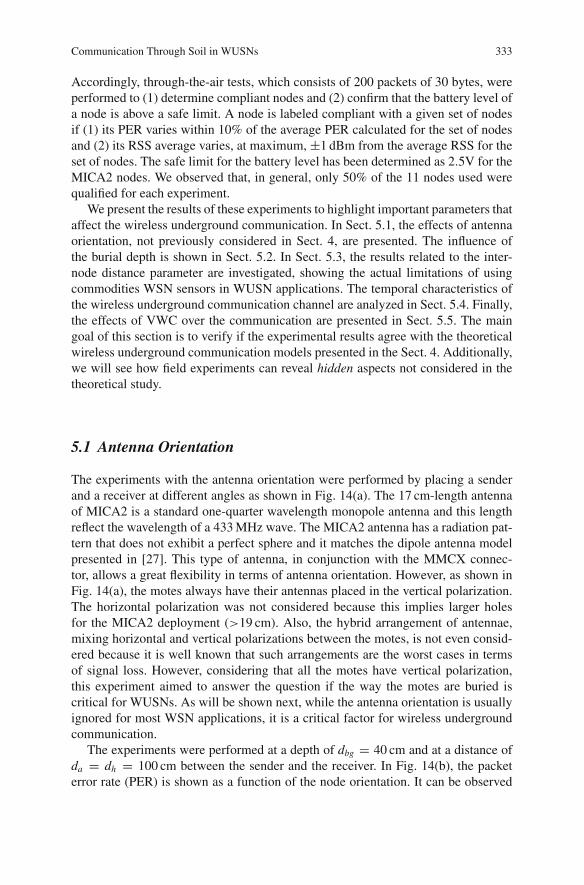
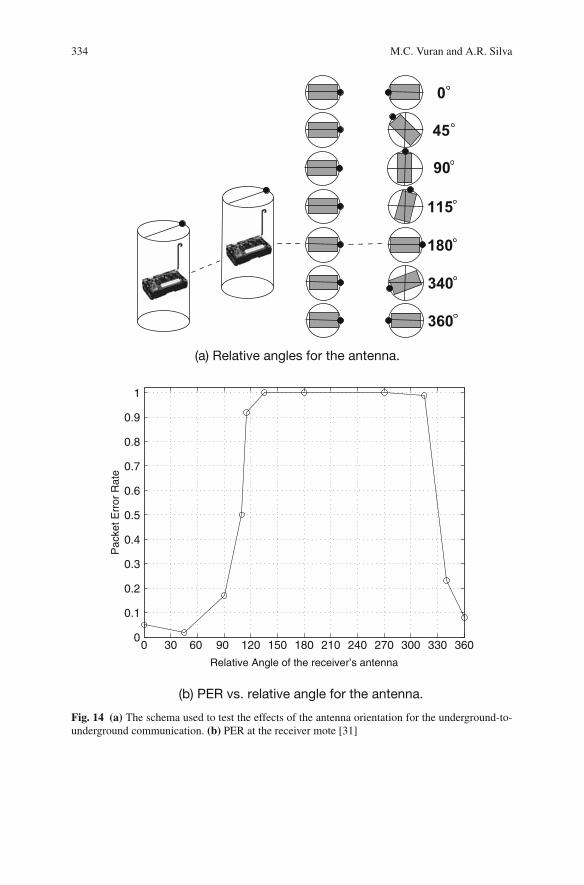
The experiments with the antenna orientation were performed by placing a senderand a receiver at different angles as shown in Fig. 14(a). The 17 cm-length antennaof MICA2 is a standard one-quarter wavelength monopole antenna and this lengthreflect the wavelength of a 433 MHz wave. The MICA2 antenna has a radiation pat-tern that does not exhibit a perfect sphere and it matches the dipole antenna modelpresented in [27]. This type of antenna, in conjunction with the MMCX connec-tor, allows a great flexibility in terms of antenna orientation. However, as shown inFig. 14(a), the motes always have their antennas placed in the vertical polarization.The horizontal polarization was not considered because this implies larger holesfor the MICA2 deployment (>19 cm). Also, the hybrid arrangement of antennae,mixing horizontal and vertical polarizations between the motes, is not even consid-ered because it is well known that such arrangements are the worst cases in termsof signal loss. However, considering that all the motes have vertical polarization,this experiment aimed to answer the question if the way the motes are buried iscritical for WUSNs. As will be shown next, while the antenna orientation is usuallyignored for most WSN applications, it is a critical factor for wireless undergroundcommunication.
The experiments were performed at a depth of dbg = 40 cm and at a distance ofda = dh = 100 cm between the sender and the receiver. In Fig. 14(b), the packeterror rate (PER) is shown as a function of the node orientation. It can be observed
334 M.C. Vuran and A.R. Silva
(a) Relative angles for the antenna.
0 30 60 90 120 150 180 210 240 270 300 330 3600
0.1
0.2
0.3
0.4
0.5
0.6
0.7
0.8
0.9
1
Relative Angle of the receiver’s antenna
Pac
ket E
rror
Rat
e
(b) PER vs. relative angle for the antenna.
Fig. 14 (a) The schema used to test the effects of the antenna orientation for the underground-to-underground communication. (b) PER at the receiver mote [31]
Communication Through Soil in WUSNs 335
that the best results (PER<0.1) were obtained in the configuration usually calledback-to-back [27], which is where the angle equals to 0◦. It can also be observedthat when the relative angle varies from 90◦ to 340◦, the PER drastically increases.If the antenna orientation is between 120◦ and 300◦, virtually no communication ispossible. This issue occurs because of two factors:
• The radiation pattern of the MICA2 antenna is not perfectly symmetric in alldirections.
• When the receiver mote is rotated, besides the antenna orientation, the inter-node distance also varies. This variation is minimum (<8 cm), but for wirelessunderground communication, this small change in the inter-node distance maybe critical.
The implications of this result are not trivial for the WUSN design and implemen-tation. For instance, consider the case of three MICA2 nodes A, B, and C, linearlydeployed at the same burial depth. Also, the inter-node distance between A and B isthe same as the distance between B and C and the node B is broadcasting. Depend-ing on the chosen inter-node distance, the quality of the signal from the sender Bwill not be the same from the viewpoints of the nodes A and C. Moreover, it isalso possible to have the case where A can communicate with B, but C cannot. Theantenna orientation is also an issue for the WUSN implementation because it impliesthat the deployment of the motes is not a trivial burial process. The mote must beburied with its antenna aligned to a specific direction with a minimum deviation. Inaddition to the challenges presented in chapter “Deployment Techniques for SensorNetworks”, soil medium introduces additional challenges for WUSN deployment.
Although this antenna orientation problem is serious, it will only occur for somecritical inter-node distances. Moreover, the kind of transceiver and antenna usedby the nodes may also minimize the problem. However, the conclusion from thisexperiment is that the antenna orientation is an additional constraint that must beconsidered for the deployment of WUSNs, usually an aspect not very critical intraditional WSNs. This is especially true for multi-hop underground networks inconjunction with critical inter-node distances.
5.2 Effects of Burial Depth
In this section, the effects of the burial depth on the signal strength and PER areshown. As shown in Table 4, the composition of the soil does not change sig-nificantly between the topsoil and subsoil regions. Therefore, the results of thesespecific experiments, where the burial depth of the receiver is varied, are directlyrelated to the reflection effects of the ground surface. When the nodes are near thesurface (smaller burial depth), a better quality for the communication is expecteddue the positive effects of the reflected waves as explained in Sect. 4.2.1. When thenodes have higher burial depth, the high attenuation of the soil will prevent that
336 M.C. Vuran and A.R. Silva
some waves arrive at the surface and still have enough strength to be reflected andto arrive at the receiver.
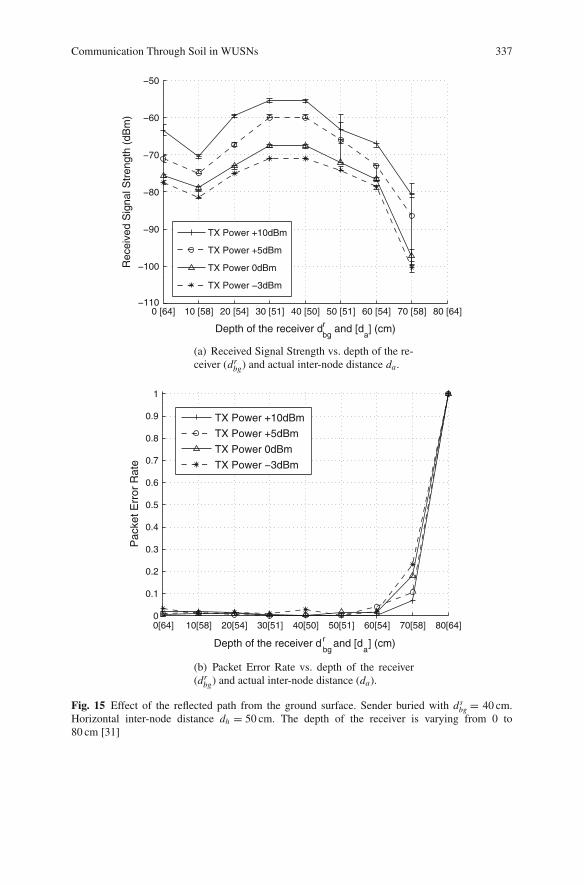
For these experiments, the horizontal inter-node distance between the senderand the receiver is fixed (dh = 50 cm), the burial depth of the sender is also fixed(ds
bg = 40 cm) and the depth of the receiver is varied from 10 to 80 cm using differ-ent transmit power levels. In Fig. 15(a) and (b), the RSS and PER values are shown,respectively, as a function of the receiver depth. The actual distance, da , betweenthe sender and the receiver is also indicated in parenthesis on the x-axis. Each linein the figures shows the results for different transmit power levels. In Fig. 15(a), thevariance of the RSS is also shown along with the average values for each point.
As shown in Fig.15(a), when we increase the actual inter-node distance, da , thesignal strength decreases as expected. The highest signal strength corresponds tothe receiver depth of 30–40 cm and the signal strength gradually decreases if thereceiver burial depth is smaller than 30 cm or higher than 40 cm. One exception tothis case is dr
bg = 0 cm, where the signal rays from above the ground impact thereceived signal strength positively and increase the RSS for each transmit powerlevel. An important observation is the significant difference of RSS values at thesame inter-node distance but at different burial depths. As commented before, it isnot expected that this difference is being caused by the soil composition, which hasonly small variations for this specific experiment site. To see how the burial depth isaffecting the RSS, consider the cases where da=58 cm: an additional attenuation of20 dB is observed for the same inter-node distance of da=58 cm, when the receiveris buried at 70 cm compared to the burial depth of 10 cm. This behavior occursmainly due to the reflection of the EM signals from the soil surface, which positivelyaffects the RSS when the nodes are buried closer to the surface. This result validatesthe two-path channel model for the wireless underground channel studied in theSect. 4.2.2.
It can be observed in Fig. 15(b), that for the receiver burial depth of 70 cm, thePER increases (0.1 < PER < 0.2) and an increase in burial depth from 70 cm to80 cm immediately causes a communication loss. It is important to observe thatthis behavior occurs for all tested transmit power levels, highlighting the fact thatthe burial depth is an important parameter in a WUSN design. This conclusion isalso in accordance with the classification proposed in the Fig. 1, where a distinc-tion between Topsoil and Subsoil WUSNs is necessary specifically considering theburial depth of the nodes. It can also be observed in Fig. 15(a) that the RSS valueshave a very small variance for all depths and transmit power levels. Hence, for agiven node deployment, the underground communication channel is very stable aslong as the composition of the soil does not change, as will be analyzed in Sect. 5.4.However, the exception for the stability of underground communication is the effectof Volumetric Water Content (VWC) which will be explained in Sect. 5.5.
Communication Through Soil in WUSNs 337
0 [64] 10 [58] 20 [54] 30 [51] 40 [50] 50 [51] 60 [54] 70 [58] 80 [64]−110
−100
−90
−80
−70
−60
−50
Depth of the receiver dbgr and [d
a] (cm)
Rec
eive
d S
igna
l Str
engt
h (d
Bm
)
TX Power +10dBm
TX Power +5dBm
TX Power 0dBm
TX Power −3dBm
(a) Received Signal Strength vs. depth of the re-ceiver (dr
bg) and actual inter-node distance da.
0[64] 10[58] 20[54] 30[51] 40[50] 50[51] 60[54] 70[58] 80[64]0
0.1
0.2
0.3
0.4
0.5
0.6
0.7
0.8
0.9
1
Depth of the receiver dbgr and [d
a] (cm)
Pac
ket E
rror
Rat
e
TX Power +10dBm
TX Power +5dBm
TX Power 0dBm
TX Power −3dBm
(b) Packet Error Rate vs. depth of the receiver(dr
bg) and actual inter-node distance (da).
Fig. 15 Effect of the reflected path from the ground surface. Sender buried with dsbg = 40 cm.
Horizontal inter-node distance dh = 50 cm. The depth of the receiver is varying from 0 to80 cm [31]
338 M.C. Vuran and A.R. Silva
5.3 Effects of Inter-Node Distance
In this section, the effects of inter-node distance on WUSN design are analyzed. Theresults of the presented field experiments show the effects of the inter-node distanceon the signal strength and PER. For our tests, the burial depth of the sender andthe receiver is fixed (ds
bg = drbg = 40 cm), and the inter-node distance is varied
from 10 to 100 cm, again using different transmit power levels. In Fig. 16, the RSSand PER values are shown, respectively, as a function of the depth of the receiverfor different transmit power levels and the variance of the RSS values are alsoshown.
As shown in Fig. 16(b), the maximum inter-node distance is found to be between80 and 90 cm for transmit powers of +5 and +10 dBm, and 50 cm for −3 and 0 dBm.For transmit powers of −3 and 0 dBm, when the inter-node distance varies from 60to 70 cm, the significant decrease of the signal strength can be observed in Fig. 16(a),which results in an abrupt PER increase as shown in Fig. 16(b). The first mainconclusion of these results is that typical WSN nodes, such as the MICA2, are notadequate for Subsoil WUSNs, at least considering the use of a low power transceiver(< +10 dBm), the typical antenna of the MICA2, and similar soil environment. InSect. 4, it has been found that a path loss of about 30 dB corresponds to an inter-nodedistance of 100 cm, which is also observed in Fig. 16(a), where an attenuation ofalmost 30 dB for an inter-node distance of 90 cm is observed with transmit powerof +10 dBm. However, more powerful transceivers can make possible the imple-mentation of Subsoil WUSNs.
The second main conclusion from the burial depth experiments is that there arevery good power management opportunities to be explored. Although more power-ful transceivers may be necessary for some WUSN solutions, specially for SubsoilWUSN applications, it does not mean that a higher transmit power level alwaysresults in better communication quality. For instance, in Fig. 16(b), in the regionwhere the signal is received with good quality (PER<10%), the communicationbehavior is very stable for all transmit power levels, including −3 dBm. Based onthese results, for a given inter-node distance, there is a minimum transmit powerfor which the underground-to-underground communication has practically the samereliability when compared to a scenario which uses a higher transmit power level.This analysis highlights the possibility of efficient power consumption schemes forWUSNs, even expecting a more demanding energy solution caused by the use ofmore powerful transceivers.
5.4 Temporal Characteristics
In this section, the temporal characteristics of the wireless underground channel areinvestigated. Accordingly, a 24-hour experiment is performed by fixing the hori-zontal inter-node distance between the sender and the receiver (dh = 50 cm), theburial depth of the sender and the receiver (ds
bg = dsbg = 40 cm), and the transmit

Communication Through Soil in WUSNs 339
10 20 30 40 50 60 70 80 90 100−110
−100
−90
−80
−70
−60
−50
Horizontal inter−node distance dh (cm)
Rec
eive
d S
igna
l Str
engt
h (d
Bm
)
TX Power +10dBm
TX Power +5dBm
TX Power 0dBm
TX Power −3dBm
(a) Received Signal Strength vs. horizontal internode distance (dh).
10 20 30 40 50 60 70 80 90 1000
0.1
0.2
0.3
0.4
0.5
0.6
0.7
0.8
0.9
1
Horizontal inter−node distance dh (cm)
Pac
ket E
rror
Rat
e
TX Power +10dBm
TX Power +5dBm
TX Power 0dBm
TX Power −3dBm
(b) Packet Error Rate vs. horizontal inter-node distance (dh).
Fig. 16 Maximum inter-node distance for underground-to-underground communication. Senderand receiver buried at depth = 40 cm (ds
bg = drbg = 40 cm). The inter-node distance dh is varying
from 10 to 100 cm [31]
power at +10 dBm. For comparison, the same experiment is repeated over-the-air,in an indoor environment with an inter-node distance of 5 m and a transmit powerof +10 dBm. In Fig. 17, the RSS and PER values are shown, respectively, as a func-tion of time. Each data point shows the average of 30 min of RSS or PER informa-tion, which corresponds to 150 packets. In Fig. 17(a), the confidence intervals ofthe RSS are also shown along with the average values for each point as well as the
340 M.C. Vuran and A.R. Silva
results of the over-the-air experiments. In Fig. 17(b), the temporal evolution of thecumulative PER is shown for underground communication.
As shown in Fig. 17(a), the maximum variation of the signal strength is only1 dB. No precipitation event was registered during the period and only a 8◦C vari-ation is observed on the temperature during the experiment [23]. Compared to theover-the-air communication, where both the average and the variance of the RSSvary significantly with time, underground wireless channel exhibits a stable char-acteristic with time. As shown in Fig.17(b), during the same period of time, PERis always smaller than 0.5% with a small variance. This result agrees with themodels for wireless underground channel proposed in Sect. 4, which also pointout the high stability of the wireless underground channel. The temporal stabilityhas important impacts in the design of routing and topology control protocols forWUSNs.
5.5 Effects of Soil Moisture
In this section, the effects of the volumetric water content (VWC) on the signalstrength and PER are discussed. Accordingly, the burial depth of the sender and thereceiver is fixed (ds
bg = drbg = 40 cm), two different inter-node distances (dh = 30
and 40 cm) are used in conjunction with two different VWC levels (dry and wet soil),and the transmit power is varied. The dry soil experiments refer to tests realized onOct 20, 2008, a sunny day, and the wet soil experiments were performed on Oct 22,2008, a rainy day, when 2.5 ins. of precipitation was recorded [23]. Based on theoven drying method [39], the different VWCs are measured to be 11% for dry soiland 18% for wet soil, which corresponds to an increase of almost 60% in VWC. InFig. 18(a) and (b), the RSS and PER values are shown, respectively, as a function ofthe transmit power level of the sender. Each line in the figures shows the results fordifferent VWC and inter-node distances.
As shown in Fig. 18(a), for high VWC, i.e., wet soil, the attenuation increasesby 12–20 dB compared to dry soil. The Fig. 18(b) also reveals that the increase ofVWC implies higher PER. As shown in Fig. 18, the negative effect of the VWC overthe quality of the communication is reduced when the transmit power is increased.This result agrees with the model for wireless underground channel in the Sect. 5.5,which showed that high levels of VWC have significant negative effects over theunderground communication. Therefore, for a scenario where the natural or artifi-cial irrigation is expected to occur, the design of WUSN protocols should carefullyconsider the variation of the VWC of the soil. For instance, the communicationprotocol may consider the volumetric water content measurements of a physicalregion to make informed routing decision or even consider to temporarily increasethe transmit power of some of the nodes in order to decrease the adverse effects ofVWC.
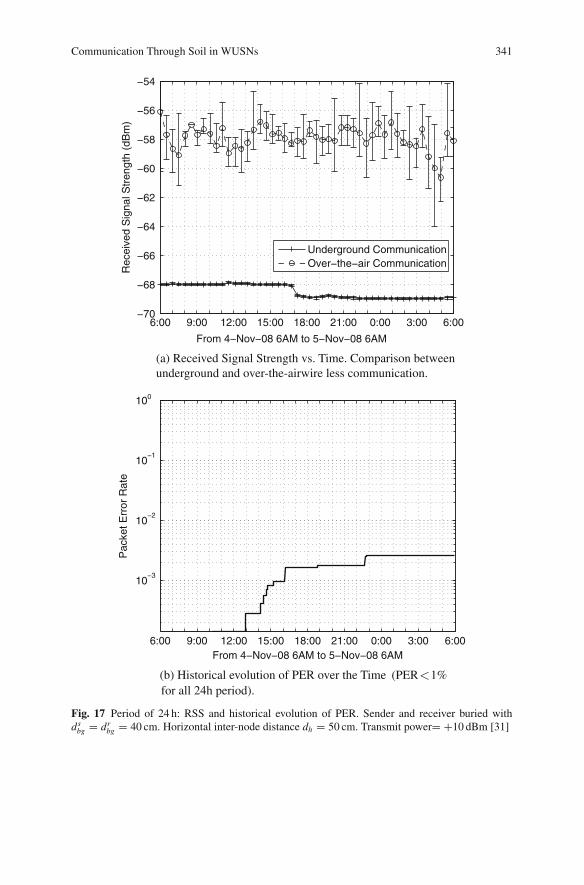
Communication Through Soil in WUSNs 341
6:00 9:00 12:00 15:00 18:00 21:00 0:00 3:00 6:00−70
−68
−66
−64
−62
−60
−58
−56
−54
Rec
eive
d S
igna
l Str
engt
h (d
Bm
)
From 4−Nov−08 6AM to 5−Nov−08 6AM
Underground CommunicationOver−the−air Communication
(a) Received Signal Strength vs. Time. Comparison betweenunderground and over-the-airwire less communication.
6:00 9:00 12:00 15:00 18:00 21:00 0:00 3:00 6:00
10−3
10−2
10−1
100
Pac
ket E
rror
Rat
e
From 4−Nov−08 6AM to 5−Nov−08 6AM
(b) Historical evolution of PER over the Time (PER 1%for all 24h period).
Fig. 17 Period of 24 h: RSS and historical evolution of PER. Sender and receiver buried withds
bg = drbg = 40 cm. Horizontal inter-node distance dh = 50 cm. Transmit power= +10 dBm [31]

342 M.C. Vuran and A.R. Silva
−3 0 5 10
−80
−75
−70
−65
−60
−55
−50
Transmit power of the sender (dBm)
Rec
eive
d S
igna
l Str
engt
h (d
Bm
)
(a) Comparison of the Received Signal Strength with dryand wet soil scenarios.
−3 0 5 100
0.01
0.02
0.03
0.04
0.05
0.06
0.07
0.08
0.09
0.1
Transmission power of the sender (dBm)
Pac
ket E
rror
Rat
e
Dry soil, dh=30cm
Dry soil, dh=40cm
Wet soil, dh=30cm
Wet soil, dh=40cm
Dry soil, dh=30cm
Dry soil, dh=40cm
Wet soil, dh=30cm
Wet soil, dh=40cm
(b) Comparison of the PER with dry and wet soil scenarios.
Fig. 18 Effect of the VWC over the wireless underground-to-underground communication. Senderand receiver buried at ds
bg = drbg = 40 cm, 2 inter-node distances: dh = 30 cm and dh = 40 cm.
Varying transmit power of the sender [31]

Communication Through Soil in WUSNs 343
6 Open Research Issues
Considering the main aspects revealed by the theoretical and experimental results,the following challenges emerge for the design of WUSNs:
6.1 Energy Efficiency
The power consumption is one of the most important factors in the design of wirelesssensor networks [3]. This is even more pronounced in WUSN because of the envi-ronmental effects. First, the higher attenuation in the underground communicationrequires higher transmit power levels to establish reasonable communication ranges.Second, changing batteries is even harder, if not impossible, in WUSN compared toits terrestrial counterpart. Consequently, energy efficient solutions are crucial for thedesign of WUSNs.
There are many possible methods to save energy in WUSN. Although the under-ground channel exhibits multi path effects with higher attenuation, it is observedthat the wireless underground channel has been found to exhibit extreme temporalstability, which is important in the design of routing and topology control protocols.However, the temporal stability of the wireless underground channel can also beexplored in terms of power saving schemes. As a result, simple modulation schemesand error control techniques may be sufficient for efficient underground communica-tion. This in turn decreases the overhead incurred by these techniques and providesa potential way for saving energy.
It is also important to consider that most underground applications requireless frequent traffic. Consequently, sleep schedules can be incorporated into thedesign of MAC schemes. Furthermore, it was shown that, for a given deploy-ment and soil composition, there is a minimum transmit power for which theunderground-to-underground communication has the same reliability compared tocases where higher transmit power levels are used. This feature is another potentialway for decreasing the power consumption of the overall WUSN solution.
Compared with typical WSNs, the composition of the specific mentioned fea-tures of WUSNs reveals the need for the development of WUSNs protocols thatexploit these features aiming reliable communication and energy efficiency.
Although the focus of this chapter is the communication of sensors buried under-ground, the use of hybrid architectures with aboveground nodes can also dramat-ically decrease the energy consumption of the overall WUSN solution. In fact,in a generic WUSN architecture, there may still be some devices, such as sinknodes, deployed above the ground. Hence, the communication between the under-ground sensors and the aboveground sinks should also be considered in the WUSNdesign.
344 M.C. Vuran and A.R. Silva
6.2 Topology Design
The results for maximum attainable communication range illustrates that under-ground environment is much more limited compared to terrestrial WSNs. In par-ticular, at the operating frequency of 300–400 MHz, the theoretical communicationrange can be extended up to 5 m. As described in Sect. 4.3, underground commu-nication is also affected by the changes according to depth. The experiment resultsvalidate the theoretical model, also showing that the burial depth is very importantfor the WUSN design due to the effects of reflected rays from the underground-airinterface at the surface. As a result, different ranges of communication distance canbe attained at different depths. This requires a topology structure that is adaptiveto the 3D effects of the channel. Optimum strategies to provide connectivity andcoverage should be developed considering these peculiarities. This provides chal-lenges in addition to the conventional deployment challenges discussed in chapter“Deployment Techniques for Sensor Networks”.
Both mentioned theoretical and experimental results related to the inter-node dis-tance suggest that multi-hop communication is essential in WUSNs. Consequently,in the design of a WUSN topology, this aspect should be emphasized. However,even with the use of multi-hop communication, the limitations of the commoditysensor nodes for WUSNs are also observed. For the specific Subsoil WSUN scenarioused in the testbed (40 cm burial depth), the inter-node distance was smaller than1 m. In terms of signal attenuation, this corresponds to roughly a 1:20 attenuationrate compared to through-the-air communication in an outdoor environment [5].Consequently, a new generation of nodes with more powerful transceivers and/ormore efficient antennas maybe required for the deployment of WUSN applications.We expect that the use of higher transmit power levels will provide higher com-munication ranges with still acceptable energy consumption, especially when theenergy-efficient features of WUSNs mentioned before are effectively exploited. Theexperimental results also highlighted that the antenna orientation of the undergroundnodes plays an important role in the connectivity of WUSNs and must be consideredin the WUSN topology design.
6.3 Operating Frequency
The channel model presented in this chapter clearly illustrates the fact that theattenuation increases with operating frequency, which motivates smaller frequencyvalues considering the high attenuation. However, this results in a tradeoff betweenthe frequency and the antenna size for the WUSN device. Our results show that300–400 MHz band is suitable for WUSNs. The simulation results show that accept-able communication ranges are possible. Moreover, there are already sensor motesworking in this band in the market; in fact, our 433 MHz MICA2 choice for theexperiments was motivated by these observations.
As explained in Sect. 4.2, the communication performance at low depth revealsthat using a fixed operating frequency may not be the best option for WUSNs.
Communication Through Soil in WUSNs 345
Cognitive radio techniques [1] can be exploited to adapt to the changing environ-mental conditions. Furthermore, our analysis reveals that the optimal frequency toreach the maximum communication range varies by depth. Consequently, cognitiveradio techniques can provide an adaptive operation for the WUSNs in this dynamicenvironment. Further experimental investigation in this area must be conducted toinvestigate the feasibility of this approach.
6.4 Cross-Layer and Environment-Aware Protocol Design
As shown in Sect. 4.3, external factors that directly influence the soil properties alsohave a great impact over the communication performance. The network topologyshould be designed to be robust to support drastic changes in the channel condi-tions. The most important soil property to be considered in a WUSN design is theVWC. Hence, the analysis of the spatio-temporal variation of the VWC in the regionwhere a WUSN application will be deployed is very important. Furthermore, soilcomposition at a particular location should be carefully investigated to tailor thetopology design according to specific characteristics of the underground channel atthat location. For instance, different node densities and inter-node distances shouldbe investigated for the WUSN deployment in a region that presents significant spa-tial soil composition heterogeneity.
Besides the effect of soil type, the seasonal changes result in variation of volu-metric water content, which significantly affects the communication performance.This specific environment parameter was also investigated through experiments.The experimental results validated the theoretical results and clearly showed thatthe adverse effects of the VWC can be decreased using higher transmit power lev-els. Therefore, in the protocol design for WUSNs, the environment dynamics needto be considered. This implies an environment-aware protocol that can adjust theoperation parameters according to its surrounding.
Finally, the feasibility of WUSNs depends on the investigation of multiple novelfactors not considered for traditional terrestrial WSNs. For instance, WUSNs mustbe robust enough to environment parameters, such as VWC and soil composition.To this end, a new generation of sensors with more powerful transceivers may benecessary. However, there are many specific positive features of the undergroundenvironment, such as the temporal stability, that can be exploited to achieve reli-able and energy-efficient communication. The use of hybrid architectures, cognitiveradios, and cross-layer protocols that dynamically change the transmit power, packetsize, and encode schema in function of the VWC are some of the options availablefor WUSN design.
Acknowledgements This work is supported by the UNL Research Council Maude HammondFling Faculty Research Fellowship. The authors would like to thank Dr. Suat Irmak for his valuablecomments throughout the development of the WUSN testbed and Emily Casper and the UNLLandscaping Services staff for their valuable helps during the experiments.
346 M.C. Vuran and A.R. Silva
References
1. I. F. Akyildiz, W. Y. Lee, M. C. Vuran, and S. Mohanty, “NeXt generation/dynamic spectrumaccess/cognitive radio wireless networks: a survey,” Computer Networks Journal (Elsevier),Vol. 50, pp. 2127–2159, September 2006.
2. I. F. Akyildiz and E. P. Stuntebeck, “Wireless underground sensor networks: research chal-lenges,” Ad Hoc Networks Journal (Elsevier), Vol. 4, pp. 669–686, July 2006.
3. I. F. Akyildiz, W. Su, Y. Sankarasubramaniam, and E. Cayirci, “Wireless sensor networks: asurvey,” Computer Networks Journal (Elsevier), Vol. 38, No. 4, pp. 393–422, March 2002.
4. I. F. Akyildiz, Z. Sun, and M. C. Vuran, “Signal propagation techniques for wireless under-ground communication networks,” Physical Communication Journal (Elsevier), Vol. 2, No. 3,pp. 167–183, September 2009.
5. C. Alippi and G. Vanini, “Wireless sensor networks and radio localization: a metrologicalanalysis of the MICA2 received signal strength indicator,” in Proceedings of IEEE Workshopon Embedded Networked Sensors, Florida, USA, November 2004.
6. J. Behari, “Microwave Dielectric Behavior of Wet Soils”, Springer, New York, 2005.7. A. Chehri, P. Fortier, and P. M. Tardif, “Application of ad-hoc sensor networks for localization
in underground mines,” in Proceedings of Wireless and Microwave Technology Conference2006 (WAMICON ’06), Florida, USA, December 2006.
8. A. Chehri, P. Fortier, and P. M. Tardif, “Security monitoring using wireless sensor networks,”Communication Networks and Services Research, 2007 – CNSR ’07, pp. 13–17, May 2007.
9. A. Chukhlantsev, “Microwave Radiometry of Vegetation Canopies”, Springer, New York,2006.
10. Crossbow Mica2 node, http://www.xbow.com.11. D. J. Daniels, “Surface-penetrating radar,” Electronics & Communication Engineering Jour-
nal, Vol. 8, No. 4, pp. 165–182, August 1996.12. N. Elkmann, et al., “Development of fully automatic inspection systems for large underground
concrete pipes partially filled with wastewater,” Robotics and Automation 2007, pp. 130–135,April 2007.
13. H. D. Foth, “Fundamentals of Soil Science,” Sixth Edition, John Wiley & Sons, New York,1978.
14. J. R. Holdem, et al., “Estimation of the number of frequencies and bandwidth for the surfacemeasurement of soil moisture as a function of depth,” IEEE Transactions on Instrumentationand Measurement, Vol. 49, No. 5, pp. 964–970, October 2000.
15. T. R. H. Holmes, “Measuring surface soil parameters using passive microwave remote sensing.The ELBARA field campaign 2003,” MSc Thesis, Vrije Universiteit Amsterdam, 71 pp., 2003.
16. G. A. Kennedy and P. J. Foster, “High resilience networks and microwave propaga-tion in underground mines,” The 9th European Conference on Wireless Technology 2006,pp. 193–196, September 2006.
17. Land and Water Development Division, FAO Organization of the United Nations, “TopsoilCharacterization for Sustainable Land Management,” in Proceedings of Rome: Food and Agri-cultural Organization, Rome, Italy, October 1998.
18. H. Li, Z. Dong, L. Wang, “Research on temporal and spatial variety of soil moistures of shift-ing sand dune and four main plant communities on Otindag sandy land,” Journal of Arid LandResources and Environment, Vol. 20, No. 3, May 2006.
19. L. Li, M. C. Vuran, and I. F. Akyildiz, “Characteristics of underground channel for wirelessunderground sensor networks,” in Proceedings Med-Hoc-Net ’07, Corfu, Greece, June 2007.
20. K. Martinez, R. Ong, and J. Hart, “Glacsweb: A sensor network for hostile environments,” inIEEE SECON ’04, pp. 81–87, 2004.
21. J. F. Mastarone and W. J. Chappell, “Urban sensor networking using thick slots in manholecovers,” in Proceedings of Antennas and Propagation Society International Symposium 2006,New Mexico, USA, July 2006.
Communication Through Soil in WUSNs 347
22. T. W. Miller, et al., “Effects of soil physical properties on GPR for landmine detection,” inFifth International Symposium on Technology and the Mine Problem, April 2002.
23. NOAA’s National Weather Service Weather Forecast Office, http://www.crh.noaa.gov/gid/?n=neb rainfall observed#archive.
24. J. Paek, K. Chintalapudi, R. Govindan, and S. Masri, “A wireless sensor network for struc-tural health monitoring: performance and experience,” in Proceedings of IEEE Workshop onEmbedded Networked Sensors (EmNetS-II), May 2005.
25. C. Park, Q. Xie, P. Chou, and M. Shinozuka, “Duranode: wireless networked sensor for struc-tural health monitoring,” in Proceedings of IEEE Sensors 2005, pp. 277–280, November 2005.
26. N. Peplinski, F. Ulaby, and M. Dobson, “Dielectric properties of soils in the 0.3–1.3-GHzrange,” IEEE Transactions on Geoscience and Remote Sensing, Vol. 33, No. 3, pp. 803–807,May 1995.
27. T. Scott, “Mica mote antenna radiation pattern analysis”, Master’s thesis – University ofVictoria, May 2004.
28. A. Sheth, et al., “Senslide: a sensor network based landslide prediction system, ” in Proceed-ings of SenSys’05, pp. 280–281, 2005.
29. G. Stuber, “Principles of Mobile Communication,” Kluwer Academic Publishers, Dordrecht,1996, 2/e 2001.
30. E. Stuntebeck, D. Pompili, and T. Melodia, “Underground wireless sensor networks usingcommodity terrestrial motes,” poster presentation at IEEE SECON 2006, September 2006.
31. A. R. Silva and M. C. Vuran, “Empirical evaluation of wireless underground-to-undergroundcommunication in wireless underground sensor networks,” in Proceedings IEEE Int. Confer-ence on Distributed Computing in Sensor Systems (DCOSS ’09), Marina Del Rey, CA, June2009.
32. Z. Sun and I. F. Akyildiz, “Channel modeling of wireless networks in tunnels,” in Proceedingsof IEEE Globecom ’08, New Orleans, USA, November 2008.
33. TinyOS web site, http://www.tinyos.net/.34. M. C. Vuran and I. F. Akyildiz, “Packet size optimization for wireless terrestrial, underwater,
and underground sensor networks,” in Proceedings of IEEE INFOCOM ’08, Phoeniz, AZ,April 2008.
35. J. Wait and J. Fuller, “On radio propagation through earth: antennas and propagation,” IEEETransactions on Antennas and Propagation, Vol. 19, No. 6, pp. 796–798, November 1971.
36. Ward Laboratories, http://wardlab.com.37. T. P. Weldon and A. Y. Rathore, “Wave propagation model and simulations for landmine detec-
tion,” Tech. Rep., University of North Carolina at Charlotte, 1999.38. G. Werner-Allen, et al., “Deploying a wireless sensor network on an active volcano,” IEEE
Internet Computing Vol. 10, No. 2, pp. 18–25, 2006.39. C. O. Willits, “Methods for determination of moisture – oven drying,” Analytical Chemistry,
Vol. 23, No. 8, pp. 1058–1062, 1951.40. N. Xu, et al., “A wireless sensor network for structural monitoring,” in Proceedings of ACM
Conference on Embedded Networked Sensor Systems, Baltimore, MD, November 2004.41. YellowJacket wireless spectrum analyzer, Berkeley Varionics Systems, Inc.,
http://www.bvsystems.com.42. K. Zhang, W. Peng, L. Wang, A. Fu, and X. Xu, “Variation of soil temperature and soil mois-
ture on black soil profile in seasonal frozen area of northeast China,” Georgraphical Research,Vol. 26, No. 2, March 2007.
Related Documents