Communication Networks and Nutrition-sensitive Extension in Rural Kenya: Essays on Centrality, Network Effects and Technology Adoption Dissertation to obtain the doctoral degree in the International Ph.D. Program for Agricultural Sciences in Goettingen (IPAG) at the Faculty of Agricultural Sciences, Georg-August-University Goettingen, Germany presented by Lisa Jäckering born in Mettingen, Germany Goettingen, March 2018

Welcome message from author
This document is posted to help you gain knowledge. Please leave a comment to let me know what you think about it! Share it to your friends and learn new things together.
Transcript

Communication Networks and Nutrition-sensitive
Extension in Rural Kenya: Essays on Centrality,
Network Effects and Technology Adoption
Dissertation
to obtain the doctoral degree
in the International Ph.D. Program for Agricultural Sciences in Goettingen (IPAG)
at the Faculty of Agricultural Sciences,
Georg-August-University Goettingen, Germany
presented by
Lisa Jäckering
born in Mettingen, Germany
Goettingen, March 2018

D7
Name of supervisor: Prof. Dr. Meike Wollni
Name of co-supervisor: Prof. Dr. Matin Qaim
Name of co-supervisor: Prof. Dr. Stephan von Cramon-Taubadel
Date of dissertation: 17.05.2018

i
Summary
Globally, 767 million people live on less than US$ 1.90 a day and two billion people are
malnourished. Especially affected by poverty and malnutrition is the rural population of Sub-
Saharan Africa (SSA), who depend on the agricultural sector for food and income. Adopting
new technologies can help farmers improve their livelihoods through an increase in income,
or an improved nutritional and health status. However, adoption rates are comparably low. As
agriculture can play a central role for food security, making agriculture more nutrition-
sensitive has become one of the hot topics in the recent development discourse. However, also
the uptake of pro-nutrition technologies – such as biofortified crops or particularly nutritious
pulses – remains below expectations.
While factors influencing the adoption of technologies are manifold (for instance, education,
risk preferences or wealth), special attention has recently been paid to the important functions
of information access and social networks. In this regards, agricultural extension systems can
set in to provide farmers with the missing information on new (pro-nutrition) technologies. A
common approach is to channel information regarding the new technologies through farmer
groups. However, so far nutrition-sensitive programs mostly focused on mothers only. There
is little evidence on how men and women embedded in groups, communicate about topics
related to agriculture and nutrition, and which persons can serve as potential target points for
nutrition-sensitive extension. Simultaneously, networks play an important role for the
diffusion of information. In particular, communication networks are potential pathways that
may induce behavioral change and may play a strong role in the setting of group-based
extension due to dynamics that trigger peer pressure or competition. However, due to lack of
detailed (panel) network data, there is little evidence on how these communication networks
are affected by the delivery of agricultural extension, and if communication networks can
contribute to finally adopt new technologies.
This dissertation addresses these research gaps by drawing conclusion based on a unique
dataset that combines a randomized controlled trial (RCT) with detailed panel data on
communication networks of farmer groups. The RCT was implemented in rural Kenya and

ii
consisted of varying combinations of group-based agricultural and nutrition training sessions.
The purpose of the extension training was the promotion of the iron-rich black common bean
variety KK15. Survey data from 48 farmer groups (824 households) was collected before
(October until December 2015) and after (October until December 2016) the intervention
(March until September 2016).
Given the background on the importance of a better understanding of communication
networks in the context of agricultural extension, this dissertation comprises two essays. The
first essay (Chapter 2) of this dissertation deals with nutrition and agricultural communication
networks of farmer groups and builds on baseline data of 48 farmer groups (815 individuals),
we collected in 2015:
In developing countries, community-based organizations (CBOs) and individuals within
CBOs are important target units for agricultural programs. However, little is known about the
flow of information within CBOs and between individuals. The objective of this study is to
investigate the structure and characteristics of communication networks for nutrition and
agriculture. First, we identify the structure of agricultural and nutrition information networks
within CBOs, as well as overlaps of the two networks. Dyadic regression techniques are then
used to explore the characteristics of persons forming links for agriculture and nutrition.
Second, key persons within CBOs that are prominent or influential for agriculture and
nutrition information networks are identified, as well as characteristics of persons that are
excluded from these networks. Analysis is conducted using descriptive and econometric
techniques such as fixed effect Poisson models. Our study finds that nutrition information is
exchanged within CBOs but to a moderate extent. Further, agricultural and nutrition
information networks overlap and often the same links are used for both topics. At the same
time, a large number of people are excluded from nutrition information networks. These
persons are more likely to be men, have smaller land sizes and are less connected to persons
outside of the group. We conclude that there is room for nutrition training to sensitize group
members and nudge communication exchange about nutrition related issues. In particular, we
recommend incentivizing communication with isolated persons. Further, our regression
results suggest targeting CBO leaders, as well as other group members that live in central

iii
locations as an entry point for training. The results can help to increase the outreach of
nutrition-sensitive programs.
The second essay (Chapter 3) investigates if interventions, such as agricultural extension,
affect agricultural communication networks and if these communication networks can act as
pathways leading to the adoption of new technologies. The analysis is based on the mentioned
RCT and therefore uses both, baseline, as well as follow-up data:
A growing body of literature focuses on the role of network effects for farmers’ adoption
decisions. However, little is known on how interventions affect networks. We analyze the
effect of group-based trainings on networks and the influence of these networks on the
adoption of technologies. Our analysis builds on a unique dataset that combines a randomized
controlled trial (RCT) with detailed panel data on communication networks. Results suggest
that, first, the intervention had a positive impact on communication among farmers (i.e. the
creation of communication links). Second, besides positive direct effects of the intervention,
we also find strong positive network effects on adoption, indicating that individual farmers
are more likely to adopt, the higher the share of adopters in their communication network.
Hence, group-based extension approaches can be efficient in diffusing new technologies, not
only because they reduce transaction costs, but also because network effects can stimulate and
drive technology adoption.

iv
Acknowledgements
First of all, I would like to express my gratitude to my supervisor Prof. Meike Wollni: Thank
you for your support, trust and guidance during the last three years! You gave me the freedom
I needed, while at the same time, making sure that I did not lose track. Our meetings were
very inspiring and encouraging and you strongly supported me in my own development as a
researcher.
Prof. Matin Qaim: Thank you for always joining my Brownbag and Doctoral seminars and for
discussing my second paper. Your feedback and thoughts were very valuable to me and
certainly shaped my work. Thank you as well for being part of my thesis committee. On the
same note, I would like to thank Prof. Stephan von Cramon-Taubadel for being my third
supervisor. Last but not least: Thank you Dr. Theda Gödecke for introducing me to the world
of networks. I was lost and skeptical in the beginning but ultimately fell in love with the
subject!
The research was financially supported by the German Federal Ministry of Food and
Agriculture (BMEL) who funded the ADDA project which is gratefully acknowledged. On
this note, thank you to all members of the ADDA Team at the University of Nairobi, at Africa
Harvest Biotech Foundation International (Kenya office), as well as at the University of
Goettingen, to the extension officers who did a great job (Bwema, Joseph, Richard and Hilda)
as well as enumerators and student assistants (Ana and Gabriel)! It was great meeting all of
you and this work wouldn’t have been possible without you. Thank you Prof. Matin Qaim, for
managing the ADDA project – your positive spirit and pragmatism was truly encouraging. A
special thanks to Theda Gödecke for putting a lot of energy into the ADDA project to make it
become a success! Also many thanks to Ilona Hoepfner for the hard work you put into the
project and for having an open ear for all sorts of issues.
To my colleagues: life in Göttingen would not be the same without you! Thanks to my two
Chair families (Chair of international food economics and rural development as well as the
Chair for environmental and resource economics), and of course to GlobalFood. What an
awesome platform for joined learning and networking! It has been a pleasure and a privilege
to be part of it.

v
In this inspiring environment, colleagues become friends: Hanna, Kathrin, Katrin, Denise,
Andrea: Our runs up to Bismarkturm energized my life here in Göttingen and filled it with
joy! Thanks for your support, jokes and love! The same holds for Eva, Dirk, Luis and Miri!
Also, special thanks to Katrin, Sahrah and Jens who supported me in the final phase of my
PhD with their comments and patience!
Andrea Fongar, a special thanks to you. I am proud that we went all the way together until we
reached the finishing line! Thank you for the countless number of wine bottles we emptied
after long days of field work. You are a great colleague and friend. Without you, these
journey(s) would have been lonely.
My friends from Lingen and surroundings (Biene, Beesten, Freren): growing up with you was
incredibly nice and I am grateful that you are still part of my life today, almost 20 years later.
Finally, thanks to my family: Papa, thanks for visiting me once a year to fix my flat. Thanks
Reinhard, for always being there for us. Last but not least: Mama, danke, mein größtes
Vorbild bist Du! Danke, für deine bedingungslose Unterstützung und dafür, dass du selbstlos
alles dafür gegeben hast, dass es mir und Malte an nichts fehlt und ich studieren konnte!

vi
Table of Content
Summary ................................................................................................................................................. i
Acknowledgements ............................................................................................................................... iv
Table of Content ................................................................................................................................... vi
List of Tables ....................................................................................................................................... viii
List of Figures ....................................................................................................................................... ix
1 General introduction ................................................................................................................... 1
1.1 Background ......................................................................................................................... 1
1.2 Problem statement ............................................................................................................... 2
1.2.1 Nutrition-sensitive agriculture and group-based extension ...................................................... 2
1.2.2 Networks and technology adoption .......................................................................................... 4
1.3 Research objectives ............................................................................................................. 5
1.3.1 Study background and data....................................................................................................... 6
1.3.2 Data .......................................................................................................................................... 6
2 Nutrition communication in agricultural information networks ............................................ 8
2.1 Introduction ......................................................................................................................... 9
2.2 Context and data ................................................................................................................ 11
2.3 Network measures and estimation strategy ....................................................................... 13
2.3.1 CBO level analysis: network structure and overlaps .............................................................. 13
2.3.2 Dyadic level analysis: link formation ..................................................................................... 14
2.3.3 Individual level analysis: characteristics of central persons and isolates ............................... 15
2.4 Results ............................................................................................................................... 17
2.4.1 Results on CBO level: Network structure and overlaps ......................................................... 17
2.4.2 Results on dyadic level: link formation .................................................................................. 22
2.4.3 Results on an individual level ................................................................................................. 24
2.5 Conclusion ......................................................................................................................... 28
2.6 Appendix A2 ..................................................................................................................... 30

vii
3 The Role of Farmer’s Communication Networks for Group-based Extension: Evidence
from a Randomized Experiment .............................................................................................. 34
3.1 Introduction ....................................................................................................................... 35
3.2 Experimental design and research setting ......................................................................... 37
3.2.1 Background on extension approaches .................................................................................... 37
3.2.2 Research area .......................................................................................................................... 37
3.2.3 Randomized experiment ......................................................................................................... 38
3.2.4 Sampling and data collection .................................................................................................. 39
3.2.5 Network data .......................................................................................................................... 39
3.2.6 Attrition .................................................................................................................................. 40
3.2.7 Balance and compliance ......................................................................................................... 41
3.3 Econometric approach ....................................................................................................... 42
3.3.1 Dyadic intent-to-treat on agricultural information networks .................................................. 42
3.3.2 Individual intent-to-treat regressions with network effects .................................................... 43
3.4 Results ............................................................................................................................... 46
3.4.1 How does group-based extension affect agricultural communication networks? ................... 46
3.4.2 Can communication networks contribute to promoting technology adoption? ...................... 50
3.5 Conclusion ......................................................................................................................... 53
3.6 Appendix A3 ..................................................................................................................... 55
4 General conclusion .................................................................................................................... 58
4.1 Limitations and room for future research .......................................................................... 59
References ............................................................................................................................................ 61
General Appendix................................................................................................................................ 68
Questionnaire 2016 (shortened version) ..................................................................................... 68

viii
List of Tables
Table 2. 1 Group related summary statistics ......................................................................................................... 18
Table 2. 2 Dyadic regression results: forming links for AGRICULTURE and NUTRITION ................................ 23
Table 2. 3 Fixed-effect Poisson regression analysis of centrality measures for AGRICULTURE and NUTRITION
................................................................................................................................................................ 25
Table 2. 4 Probit regression analysis of isolates for NUTRITION ........................................................................ 27
Table A2. 1 Summary statistics of dependent variables and covariates entering the dyadic regression ............... 30
Table A2. 2 Summary statistics of individual and household level covariates used in Poisson and Probit
regressions............................................................................................................................................... 31
Table A2. 3 Group related summary statistics including missing links ................................................................ 32
Table A2. 4 Dyadic logit regression results: forming links for AGRICULTURE and NUTRITION ..................... 32
Table A2. 5 Fixed-effect Poisson regression analysis of centrality measures for AGRICULTURE and
NUTRITION (including group-level controls) ........................................................................................ 33
Table 3. 1 Attrition per treatment arm on farmer group level ............................................................................... 40
Table 3. 2 Definition of different networks wij ..................................................................................................... 46
Table 3. 3 Descriptive statistics of dyadic dependent variables ............................................................................ 47
Table 3. 4 Effects of treatments on communication networks .............................................................................. 49
Table 3. 5 Effects of treatments on new link creation and canceling old links in communication networks ........ 49
Table 3. 6 Descriptive statistics of individual-level network effect variables ...................................................... 50
Table 3. 7 ITT, ITT with balance controls, ITT with controls and different network effects ............................... 52
Table A3.1 Additional effects of treatment 2 and treatment 3 on network changes ........................................ 55
Table A3.2 Balance check of baseline covariates on dyadic level (undirected network) ...................................... 56
Table A3.3 Balance check of baseline covariates on individual level .................................................................. 57
ix
Table A3.4 Compliance rates with training attendance ......................................................................................... 57
List of Figures
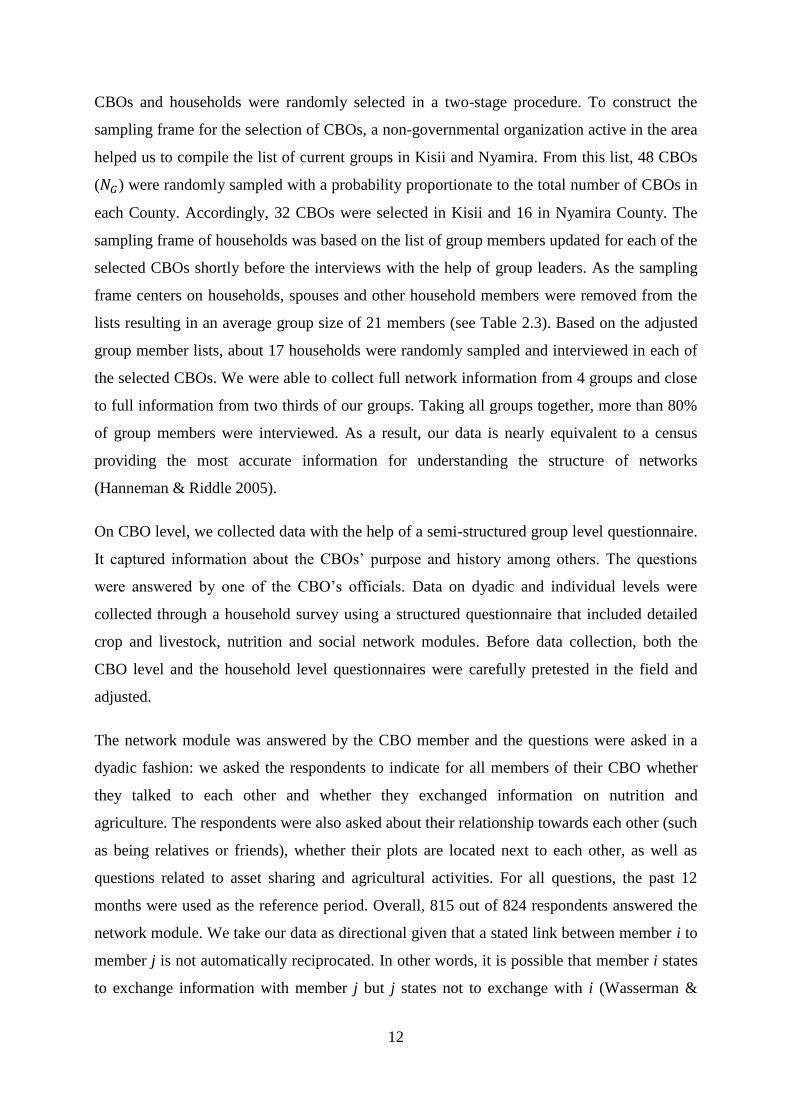
Figure 2. 1 AGRICULTURE. Color of nodes: gender (red=female, blue=male); Size of nodes: in-degrees;
Numbers indicate the CBOs’ IDs. ........................................................................................................... 20
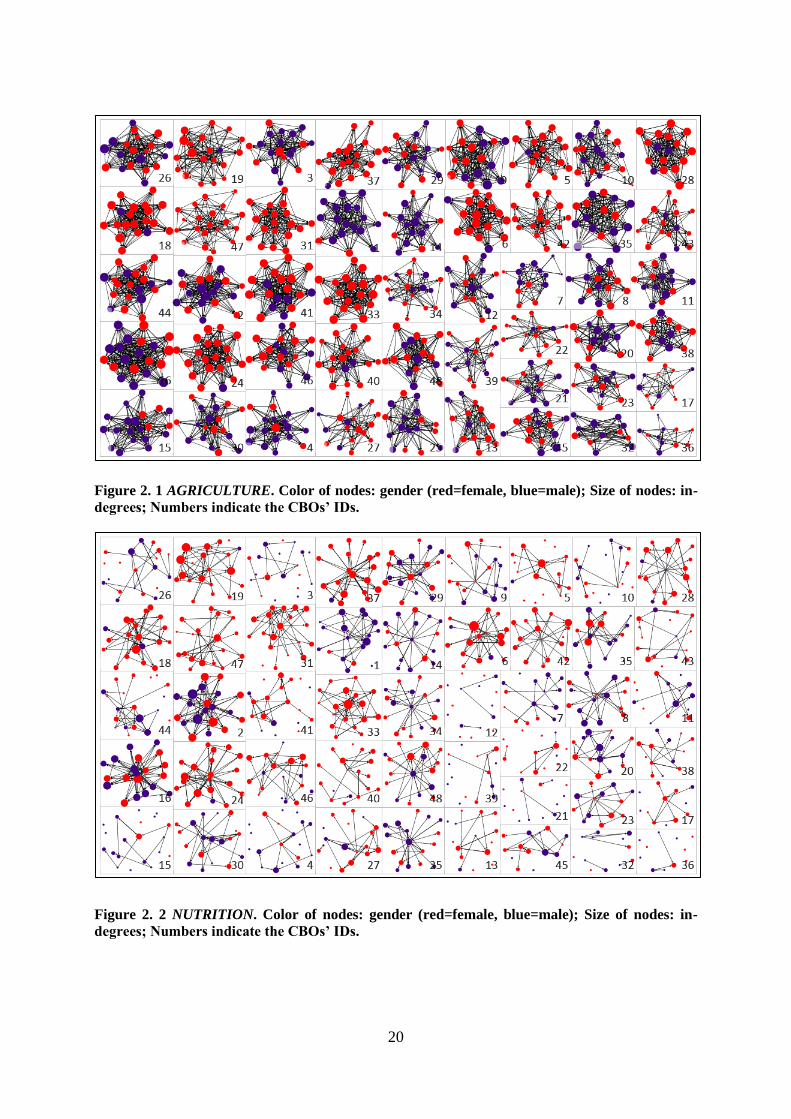
Figure 2. 2 NUTRITION. Color of nodes: gender (red=female, blue=male); Size of nodes: in-degrees; Numbers
indicate the CBOs’ IDs. .......................................................................................................................... 20
Figure 2. 3 Multiplexity of AGRICULTURE and NUTRITION ............................................................................. 21
Figure 2. 4 Distributions of out-degrees and in-degrees for AGRICULTURE and NUTRITION. ......................... 24

1
1 General introduction
1.1 Background
Worldwide, 767 million people live on less than US$ 1.90 a day and two billion people are
malnourished. Especially affected by poverty and malnutrition is the rural population of Sub-
Saharan Africa (SSA). Since important parts of the rural population work in agriculture for
both income generation and subsistence needs (FAO et al. 2017; IFPRI 2017), the agricultural
sector can be identified as key sector in order to fight both poverty and malnutrition
simultaneously.
Technology adoption – may it be the rediscovery of old, lost varieties, the adoption of new
technologies that improve yields and are resistant to pests, or have nutritional benefits – can
help farmers to improve their livelihoods through an increase in income, or an improved
nutritional and health status (Minten & Barrett 2008; Headey & Ecker 2013; Qaim 2014).
However, in general, adoption rates remain low in SSA (Evenson & Gollin 2003; Emerick et
al. 2016). Several factors determine the adoption of technologies, with information being the
ones most widely discussed (Aker 2011).
Agricultural extension systems (public or private) are institutional solutions that set in to
provide farmers with missing information on, for instance, new technologies. Therefore,
agricultural extension services play an important role in the development of the agricultural
sector in developing countries (Akroyd & Smith 2007). However, little attention has been
paid on rigorous evaluation of agricultural extension approaches regarding their effectiveness
in diffusing information and nudging the adoption of technologies (Anderson & Feder 2004;
Kondylis et al. 2017).
In addition, because agriculture is not only considered important for income generation, but
also as key for influencing the food and nutrition security of the rural population, it is
requested to investigate how the agricultural sector can become more nutrition-sensitive. This
could be achieved by, for instance, promoting pro-nutrition technologies through the
agricultural extension system (Ruel et al. 2013; Ruel et al. 2018).

2
There is an increasing body of literature that analyzes the impact of nutrition-sensitive
programs rigorously by using RCTs or quasi-experimental settings (De Brauw et al. 2015;
Olney et al. 2015; Osei et al. 2017; for an extensive overview see Ruel et al. 2018). In most of
the literature, the evaluated programs target mothers, households with children or women
groups since the objective of the programs is to improve the nutritional status of children.
Women are targeted since they are the ones responsible for food preparation and for the
nutritional status of their family, and especially children (Hoddinott & Haddad 1995; Ruel et
al. 2018). Also, women play an important role for agriculture, but extension sessions are still
predominantly attended my men (Ragasa et al. 2013). So far, little evidence exists on how
agricultural extension services – that usually targets both men and women – should be
designed to combine information on agriculture and nutrition. With regard to group-based
extension services, especially when dealing with mixed-gender groups, it is of high
importance to understand how farmers communicate about nutrition and agriculture and to
identify persons who may serve as suitable target units for nutrition-sensitive programs.
Designing agricultural extension systems in a nutrition-sensitive manner could contribute to
achieving the United Nations’ Sustainable Development Goals one (no poverty), two (zero
hunger) and three (good health and well-being).
Besides the fact that little evidence is present on which modes of extension work, also little is
known why certain modes may or may not work (Birner et al. 2009). While factors
influencing the adoption of technologies are manifold (for instance education, risk preferences
or wealth), special attention has recently been paid to the import functions of information
access and social networks (Bandiera & Rasul 2006; Conley & Udry 2010; Foster &
Rosenzweig 2010; Aker 2011). Networks are especially important in settings that lack formal
institutions where they can serve as important substitutes. However, so far networks are most
commonly measured by proxies (Breza 2016).
1.2 Problem statement
1.2.1 Nutrition-sensitive agriculture and group-based extension
Agriculture can play a central role in improving nutrition. This is why making agriculture
more nutrition-sensitive has become one of the hot topics in the recent development discourse
(Hawkes & Ruel 2008; Fan & Pandya-Lorch 2012; IFPRI 2016; Pingali & Sunder 2017). One
way of making agriculture more nutrition-sensitive, and thus combating malnutrition, is to
3
disseminate pro-nutrition technologies such as biofortified crops or particular nutritious
vegetables or pulses to farmers (De Brauw et al. 2015; Bouis and Saltzman 2017). However,
the adoption of these pro-nutrition innovations is particularly low since farmers may be
hesitant to adopt if they do not know the taste of the new variety or if the pro-nutrition
technology has no other benefits such as being high-yielding (Ogutu et al. 2018). Previous
studies have found that the adoption rate of pro-nutrition innovations is higher when farmers
have a better knowledge about the attributes of the pro-nutrition innovation (De Brauw et al.
2013; De Groote et al. 2016). A possible platform that can help to channel the required
agronomic and nutritional knowledge regarding the pro-nutrition technology to farmers might
be the existing agricultural extension service.
Delivering agricultural extension to farmers can take place in different ways (Anderson &
Feder 2007). This dissertation focuses on the group-based extension approach. Hereby the
entire farmer group receives information directly from an extension officer, in comparison
with an individual-based approach, where only individuals are trained and visited by an
extensionist, or only model or lead farmers are trained, who then in a second step are
supposed to diffuse the new information to their farmer groups. The group-based approach
offers several advantages. First, working with groups of farmers reduces transaction costs
compared to visiting a large number of dispersed individual farmers (Anderson & Feder
2004). Second, the group-based approach is considered as pro-poor since it is beneficial for
women and low-educated farmers of East Africa, both of which are especially vulnerable to
poverty (Davis et al. 2012). Third, since group-based approaches are participatory, they are
often more effective in spreading information and promoting new technologies (Fischer &
Qaim 2012). Because of this, they are widely used by development practitioners (Anderson &
Feder 2007) and play an important role in Kenya. For instance, in the early millennium years,
more than 7000 farmer groups were founded with the aim to channel agricultural extension
through them (Cuellar et al. 2006).
There is a growing body of literature that tries to understand linkages between and the
pathways through which agriculture can influence nutrition (Kabunga 2014; Malapit et al.
2015; Sibhatu et al. 2015; Carletto et al. 2015; Ruel et al. 2018), but little evidence exists on
how extension services should be designed to combine information on agriculture and
nutrition. With regard to group-based extension services, especially the identification of
persons who may serve as suitable target groups for nutrition-sensitive programs is of high

4
importance (Ruel et al. 2018). In the context of nutrition-specific interventions, mothers,
grandmothers and other accepted key persons are important target groups (Aubel 2012). In
contrast, in the setting of nutrition-sensitive extension, it is unclear which persons can be
considered as central and may serve as suitable entry points for an effective diffusion of
agricultural and nutrition information. Therefore, we collected detailed data on nutrition and
agricultural communication networks of farmer groups. These data allow conclusions to be
drawn on the structure of communication networks for agriculture and nutrition, and thus on
the characteristics of central farmers for the corresponding topics. The results can help to
develop network targeting strategies for nutrition-sensitive extension programs. This problem
statement will be addressed in the first essay, in Chapter 2 of this dissertation.
1.2.2 Networks and technology adoption
Networks play an important role for the diffusion of information and consequently for the
adoption of new technologies (Foster & Rosenzweig 1995; Conley & Udry 2001; Bandiera &
Rasul 2006; Conley & Udry 2010; Van den Broeck & Dercon 2011; Beaman et al. 2015;
Emerick et al. 2016; overview by De Janvry et al. 2017). Although the importance of social
networks for technology adoption is widely acknowledged, several studies still model farmers
as independent actors. In addition, some studies use proxies such as group membership or
geographical proximity to describe networks, which neglect actual social interactions among
farmers (Breza 2016). Recent research has collected more detailed data on social interactions,
but relied on network sampling strategies that due to missing information can only reflect
certain aspects of the network (Santos & Barrett 2010; Conley & Udry 2010; Maertens &
Barrett 2012; Murendo et al. 2017). The collection of detailed census data is rare (exceptions
Van den Broeck & Dercon 2011; Jaimovich 2015). In this dissertation, we add to the
literature by using data on actual communication networks within farmer groups as potential
pathways that may induce behavioral change, and hence the adoption of technologies. Persons
we share information with, shape our views, attitudes, and actions explicitly or implicitly.
Consequently, communication networks may play a particularly strong role for the adoption
of technologies in the setting of group-based extension due to dynamics that may trigger peer
pressure or competition (Munshi 2008; Breza 2016). Therefore, we use detailed information
on communication networks of 48 farmer groups, combined with a randomized controlled
trial (RCTs) in which the treatment groups received group-based extension that focused on a
pro-nutrition technology.

5
In addition, communication networks may easily change over time (Comola & Prina 2017).
Due to the lack of actual network data, there is consequently a lack of panel network data, too.
These data can give evidence on how interventions such as the provision of group-based
agricultural extension can contribute to an increased (or decreased) information exchange, and
hence strengthen (or weaken) the social capital of groups (Maertens & Barrett 2012). A recent
study by Arcand & Wagner (2016) for instance, suggests that the structure of CBOs become
more inclusive when development projects are channeled through them. However, the authors
focus on group membership status before and after the intervention and not on actual data on
social interactions. To the best of our knowledge, this dissertation is the first that uses panel
data on actual communication networks to establish evidence on how group-based extension
can influence these networks. To assure a proper identification of our treatment effect, we use
the above-mentioned RCT which allows us to compare communication networks of untreated
farmer groups with the networks of farmer groups that received grouped-based extension.
In summary, the second essay in Chapter 3 of this dissertation adds to the literature by
investigating if interventions, such as agricultural extension, affect agricultural
communication networks and if these communication networks can act as pathways leading to
the adoption of new technologies.
1.3 Research objectives
This dissertation contains two essays that address the mentioned research gaps by analyzing
communication networks within farmer groups from different angles. The first essay in
Chapter 2 is set in the context of nutrition-sensitive extension. We study the structure of
nutrition and agricultural communication networks within farmer groups and characterize key
persons within these networks. In the second essay in Chapter 3, we detect how agricultural
communication networks are affected by the offer of group-based agricultural extension, and
which role communication networks play for the individual adoption decision. Specifically,
we answer the following questions:
1. How does the structure of agricultural and nutrition information networks look like
within farmer groups?
2. What are the characteristics of persons forming links to exchange agricultural and
nutrition information; and do these networks overlap?
6
3. Are there certain prominent or influential key persons within farmer groups that are
important for agriculture and nutrition information networks and what are their
characteristics?
4. Are there isolated persons that are excluded from these information networks and what
are their characteristics?
5. How do interventions, such as agricultural extension, affect agricultural
communication networks?
6. How are individual adoption decisions influenced by communication and the decision
making of others in a farmer group setting?
The results can help to develop network targeting strategies for nutrition-sensitive programs
and design policies regarding group-based agricultural extension.
1.3.1 Study background and data
The study is set in Nyamira and Kisii County, in the western part of Kenya. In these densely
populated counties, more than half of the population depends on the agricultural sector. Most
commonly, farmers grow maize, beans, bananas, sugar cane, tea, and horticultural crops. The
farming system is characterized as diverse, and depends on small land sizes, with almost all of
the land being under cultivation (Mbuvi et al. 2013). Kisii and Nyamira have two cropping
seasons (March-July; September-January). Regarding the nutritional status, one-quarter of the
children are stunted in Kisii and Nyamira Counties, defined as being too short for their age.
Stunting can be an indication for malnutrition. At the same time, a third of the women of
reproductive age are overweight or obese (KNBS 2015). Against this background, the
promotion of pro-nutrition technologies – coming along with agronomic and nutrition training
– could contribute to an improvement of the farmer’s livelihood.
1.3.2 Data
The output of this dissertation is embedded in the interdisciplinary ADDA project, which
stands for “Agriculture and Dietary Diversity in Africa”. The aim of the project is the impact
evaluation of a group-based extension approach that delivered a combination of agricultural,
nutrition and marketing information to farmers. The information treatments were tailored to
the promotion of a pro-nutrition technology, the black bean variety KK15. Therefore, the

7
author and her team designed and implemented a RCT (for more information on the RCT
design see Chapter 3.2.3).
In a first stage, 48 farmers groups in Nyamira and Kisii County in Kenya were randomly
sampled from a list of existing farmer groups. In a second stage, 20 members per farmer
group were randomly chosen for interviews. Data were collected before (October until
December 2015) and after (October until December 2016) the intervention (March until
September 2016). During both data collection waves, information on a household level was
collected with help of structured questionnaires. Also group level data was elicited with help
of a group level questionnaire, answered by one of the group officials. Apart from the
collection of detailed agricultural and nutrition-related data, a special focus was put on the
collection of network data.
The network module was answered by the group member and the questions were asked in a
dyadic fashion: the respondents indicated for all member of their group whether they shared
information on nutrition and agriculture. The respondents were also asked about their
relationship towards each other (such as being relatives or friends), asset sharing, whom they
would borrow money from, whom they visit. Finally, also questions related to agricultural
activities were elicited. Overall 824 respondents were interviewed during the baseline survey
in 2015 and 746 respondents during the follow-up survey in 2016. The first essay in Chapter 2
of this dissertation builds on the baseline data collected in 2015, while the second essay in
Chapter 3 builds on the RCT and uses baseline and follow-up data.

8
2 Nutrition communication in agricultural information
networks1
Abstract. Agriculture can play a central role in improving nutrition. One way of making
agriculture more nutrition-sensitive and thus combating malnutrition is to deliver nutrition
information that particularly target farmers. In developing countries, community-based
organizations (CBOs) and individuals within CBOs are important target units for agricultural
programs. However, little is known about the flow of information within CBOs and between
individuals. The objective of this study is to investigate the structure and characteristics of
communication networks for nutrition and agriculture. First, we identify the structure of
agricultural and nutrition information networks within CBOs, as well as overlaps of the two
networks. Dyadic regression techniques are then used to explore the characteristics of persons
forming links for agriculture and nutrition. Second, key persons within CBOs that are
prominent or influential for agriculture and nutrition information networks are identified, as
well as characteristics of persons that are excluded from these networks. Analysis is
conducted using descriptive and econometric techniques such as fixed effect Poisson models.
Our study finds that nutrition information is exchanged within CBOs but to a moderate extent.
Further, agricultural and nutrition information networks overlap and often the same links are
used for both topics. At the same time, a large number of people are excluded from nutrition
information networks. These persons are more likely to be men, have smaller land sizes and
are less connected to persons outside of the group We conclude that there is room for nutrition
training to sensitize group members and nudge communication exchange about nutrition
related issues. In particular, we recommend incentivizing communication with isolated
persons. Further, our regression results suggest targeting CBO leaders, as well as other group
members that live in central locations as an entry point for training. The results can help to
increase the outreach of nutrition-sensitive programs.
Keywords: Communication networks, centrality, community-based organizations, nutrition-
sensitive agriculture, dyadic regression.
1 This chapter is co-authored by Theda Gödecke (TG) and Meike Wollni (MW). LJ, TG and MW jointly
developed the research idea. I, LJ, collected the survey data in 2015 and 2016, did the data analysis, and wrote
the essay. MW and TG commented at the various stages of the research and contributed to writing and revising
the essay.

9
2.1 Introduction
Globally, about 800 million people suffer from hunger. Most of the hungry, especially in rural
areas of developing countries, depend on agriculture for food and income (FAO 2015; IFPRI
2011). As agriculture can play a central role in improving nutrition, making agriculture more
nutrition-sensitive has become an important topic in the recent development discourse (IFPRI
2016; Fan & Pandya-Lorch 2012; Hawkes & Ruel 2008). One way of making agriculture
more nutrition-sensitive, and thus combating malnutrition, is to deliver nutrition information
that particularly target farmers. Delivering nutrition knowledge with improved targeting can
contribute to better outcomes of nutrition-sensitive programs (Ruel et al. 2013). A possible
platform to channel nutrition information might be through existing extension systems. In the
extension systems of developing countries, community-based organizations (CBOs) and
individuals within CBOs are important target units (Anderson & Feder 2007). The rationale of
targeting CBOs or key individuals within CBOs it to reduce transaction costs. It is assumed
that costs will be reduced because new information will flow among CBO members, or key
individuals will pass on the new information to other group members. Yet, relatively little is
known about the flow of information within CBOs and between CBO members.
Furthermore, little evidence exists on how agricultural extension services - that usually target
both men and women - should be designed to combine information on agriculture and
nutrition. An increasing body of literature analyzes the impact of nutrition-sensitive programs
(De Brauw et al. 2015; Olney et al. 2015; Osei et al. 2017; for an extensive overview see Ruel
et al. 2018). However, most of the evaluated programs target mothers, households with
children or women groups since the objective of the programs is to improve the nutritional
status of children. Also, women play an important role for agriculture, but extension sessions
are still predominantly attended my men (Ragasa et al. 2013). CBOs, especially when dealing
with mixed-gender groups, could be a useful platform to sensitize both, men and women, on
nutrition-related topics. Therefore, it is of high importance to understand how farmers
communicate about nutrition and agriculture.
Moreover, studies have identified the importance of key persons within networks, particularly
in the context of health and nutrition-specific interventions. In addition, individual social
networks play a major role in the adoption of new technologies (Conley & Udry 2010;
Matuschke & Qaim 2009; Maertens & Barrett 2012; Maertens 2017; Murendo et al. 2017).

10
Aubel (2012) argued that targeting and training mothers only might not be sufficient for better
child nutrition outcomes. Hence, community level communication networks and participation
of culturally accepted key persons such as grandmothers should be taken into account. A
study by Kim et al. (2015) documented that the targeting of influential individuals plus their
friends can help to increase project outreach. Similarly, Moestue et al. (2007) found that
mothers with large information networks are associated with better child nutrition. Overall,
these studies emphasize the need for further research on the targeting of influential actors
besides women for better nutrition outcomes in developing countries.
However, targeting key persons may not always be successful. Experimental evidence has
shown that efficiency in the diffusion of information is lost when farmers focus too much on a
few popular individuals (Caria & Fafchamps 2015). Therefore, they recommend incentivizing
link formation with less popular people. Similarly, Maertens (2017) found that farmers mostly
learn from a few progressive farmers who consequently have a (too) powerful role in deciding
on the overall success or failure of technologies. To be able to assess how information
diffuses, it is crucial to have data on the networks’ structure, in the best case in form of a
census of all individuals. These studies are rare even though they are especially suited to
depict the quality of networks (Smith & Christakis 2008). Instead, individual measures are
predominantly used to determine social networks in the context of agricultural technology
adoption; for example the number of contacts a farmer cites (Maertens 2017; Murendo et al.
2017; Matuschke & Qaim 2009). To the best of our knowledge, our study is the first using a
combination of directed census data and individual network measures to analyze the structure
for nutrition and agricultural communication networks and to characterize key persons within
these networks. The results could help to develop network targeting strategies for nutrition-
sensitive programs.
We contribute to the literature by addressing the following questions: first, how are
agricultural and nutrition information networks within CBOs structured and to what extent do
they overlap? Second, what are the characteristics of persons forming links to exchange
agricultural and nutrition information? Third, what are the characteristics of particularly
central persons that are important for agriculture and nutrition information networks? Forth,
what are the characteristics of isolated persons that are excluded from these networks?

11
The rest of the essay is structured as follows. Chapter 2.2 presents the study area and data
collection. In Chapter 2.3, we introduce the network measures and estimation strategies
employed on CBO, dyadic and individual levels. Chapter 2.4 presents the results, and Chapter
2.5 concludes and derives policy implications.
2.2 Context and data
The study was conducted in Kisii and Nyamira County in Kenya. These Counties are densely
populated, and more than half of the population is mainly employed in the agricultural sector.
Farmers grow maize, beans, bananas, sugar cane, tea, and horticultural crops (KNBS & SID
2013). The farming system is characterized as intensive, subsistence and almost all of the land
is under cultivation (Mbuvi et al. 2013). The majority of the population depends on the
produce from small and fragmented pieces of land. Regarding the nutritional status, people in
Kisii and Nyamira Counties are close to the national average, with one-quarter of the children
being stunted, which means that they are too short for their age. At the same time, a third of
the women of reproductive age are overweight or obese (KNBS 2015). Against this
background, agronomic and nutrition trainings could contribute to an improvement of
livelihoods, and Kisii and Nyamira can be considered suitable settings for nutrition-sensitive
interventions.
This article builds on data collected on CBO, dyadic, and individual levels in late 2015. CBOs
refer to all sorts of membership organizations at the community level, such as credit groups or
agricultural groups. CBOs can be divided into groups that have already existed for a long time
(customary) or groups that were formed due to a development intervention (World Bank &
IFPRI 2010). In the context of Kenya, the latter play an important role.2 In the early
millennium years, more than 7000 CBOs were founded in the context of the “National
Livestock and Extension Program” (NALEP), which was rolled out in Kisii County among
others. The CBOs were formed with the aim to channel extension services through them and
were seen as cost-efficient entry points (Cuellar et al. 2006). In more recent years, the
government with support of the World Bank launched the “Kenya Agricultural Productivity
Program” (KAPAP) that also builds on CBOs.
2 CBOs are also referred to as common-interest groups (CIGS) in Kenya. CIGs are “organization of some
members of the community that get together to achieve a common purpose” (Manssouri & Sparacino 2009,
p.16).
12
CBOs and households were randomly selected in a two-stage procedure. To construct the
sampling frame for the selection of CBOs, a non-governmental organization active in the area
helped us to compile the list of current groups in Kisii and Nyamira. From this list, 48 CBOs
(𝑁𝐺) were randomly sampled with a probability proportionate to the total number of CBOs in
each County. Accordingly, 32 CBOs were selected in Kisii and 16 in Nyamira County. The
sampling frame of households was based on the list of group members updated for each of the
selected CBOs shortly before the interviews with the help of group leaders. As the sampling
frame centers on households, spouses and other household members were removed from the
lists resulting in an average group size of 21 members (see Table 2.3). Based on the adjusted
group member lists, about 17 households were randomly sampled and interviewed in each of
the selected CBOs. We were able to collect full network information from 4 groups and close
to full information from two thirds of our groups. Taking all groups together, more than 80%
of group members were interviewed. As a result, our data is nearly equivalent to a census
providing the most accurate information for understanding the structure of networks
(Hanneman & Riddle 2005).
On CBO level, we collected data with the help of a semi-structured group level questionnaire.
It captured information about the CBOs’ purpose and history among others. The questions
were answered by one of the CBO’s officials. Data on dyadic and individual levels were
collected through a household survey using a structured questionnaire that included detailed
crop and livestock, nutrition and social network modules. Before data collection, both the
CBO level and the household level questionnaires were carefully pretested in the field and
adjusted.
The network module was answered by the CBO member and the questions were asked in a
dyadic fashion: we asked the respondents to indicate for all members of their CBO whether
they talked to each other and whether they exchanged information on nutrition and
agriculture. The respondents were also asked about their relationship towards each other (such
as being relatives or friends), whether their plots are located next to each other, as well as
questions related to asset sharing and agricultural activities. For all questions, the past 12
months were used as the reference period. Overall, 815 out of 824 respondents answered the
network module. We take our data as directional given that a stated link between member i to
member j is not automatically reciprocated. In other words, it is possible that member i states
to exchange information with member j but j states not to exchange with i (Wasserman &

13
Faust 1994). Directional data allows us to differentiate between prominent group members
(being named often) and influential members (persons naming many people) (Hanneman &
Riddle 2005).
Overall, our analyses are performed on three levels: first, on the group level with all 48 CBOs
(𝑁𝐺). Second, our analysis on the dyadic level will be based on 13318 dyads (𝑁𝐷). Third,
analyses will be performed on the level of the CBO member. This individual level data set
consists of 815 observations (𝑁𝐼).
2.3 Network measures and estimation strategy
2.3.1 CBO level analysis: network structure and overlaps
On group level, we analyze to what extent agricultural and nutrition information is exchanged
in CBOs. For that purpose, we explore the structure of agricultural and nutrition information
networks in terms of their densities as well as their overlaps. The concept of network density
D is associated with the speed with which information is transmitted within groups and can be
used as an indicator of the groups’ connectedness (Hanneman & Riddle 2005). Based on
Wasserman & Faust (1994) we calculated densities for directed graphs as
𝐷𝑔(𝑚)=𝐿𝑔(𝑚)
𝑛𝑖𝑔(𝑛𝑖𝑔−1), (2.1)
where i refers to the group member (nodes). All nodes i are embedded in their CBOs g, that
vary with respect to their number of members nig. Within CBOs, each node can potentially
engage in conversation with nig-1 members. A link lij is defined as a binary variable, being
one if an information exchange about a certain topic m exists. 𝐿𝑔 is the sum of actual links lij
within a CBO g. Our information networks m of interest are AGRICULTURE and
NUTRITION. CBO structure is analyzed descriptively and with the help of mapping
techniques.
This also allows us to identify isolates for AGRICULTURE and NUTRITION. Isolates are
nodes without any links, and hence these nodes are at risk that new information bypasses
them. Therefore, the identification of isolates can be important for network-based
interventions (Carrington et al. 2005). For the analysis of overlaps, we introduce the network

14
MULTIPLEX3, which is a binary variable that turns one if a link is at the same time an
agricultural and a nutrition link. To further investigate the overlap, we correlate the
underlying adjacency matrices for both networks, NUTRITION and AGRICULTURE, for each
CBO4. The adjacency matrix is a square and binary matrix. The cells record whether a link
between two actors exists (Izquierdo & Hanneman 2006). The correlation coefficient equals 1
if both networks match completely.
2.3.2 Dyadic level analysis: link formation
On dyadic level, we study the link formation of individuals within CBOs. The dyadic analysis
gives insights on the characteristics of individuals who are likely to exchange information on
NUTRITION and AGRICULTURE. In a dyadic model, the regressors need to enter the
regression in a symmetric fashion. At the same time, standard errors need to be corrected for
cross-observation correlation involving similar individuals (Fafchamps & Gubert 2007).
Accounting for these two issues, we apply the grouped dyadic regression model as proposed
by Fafchamps & Gubert (2007). The approach has more recently been applied by De Weerdt
& Fafchamps (2011), Van den Broeck & Dercon (2011), and Barr et al. (2015). The model
preserves symmetry and is specified as:
lij(m) = α1 sij + α2 (xi − xj) + α3 (xi + xj) + εijg , (2.2)
where lij is a binary variable that equals one if a link between group member i and j exists for
network m. The vector sij captures proximity variables such as both members are female,
kinship (social proximity), or members sharing the same plot borders (geographical
proximity). The α1 is a vector of parameters measuring the effects of the proximity variables
on link formation for information exchange. The vectors xi and xj refer to characteristics of i
and j, respectively, such as age, education, and land size. Parameter vector α2 measures the
effects of differences in characteristics, whereas parameter vector α3 measures the effects of
the sum of characteristics on the dependent variable. εijg is the dyadic error term. Due to the
complexity of the models, we model the binary dependent variables using linear probability
3 The overlap can also be interpreted as a measure of a link’s “multiplexity”, referring to the number of topics a
link covers. 4 This is done using the nwcommands in STATA developed by Grund (2015).

15
models (LPM)5. Summary statistics of variables used in the dyadic regression are presented in
Table A2.1 in the Appendix.
2.3.3 Individual level analysis: characteristics of central persons and
isolates
Network measures
On individual level, we are interested in characterizing central persons and potentially isolated
individuals within information networks for agriculture and nutrition. Degrees are common-
used measures of network centrality (Wasserman & Faust1994). They can be divided into
prominent (high in-degrees) and influential persons (high out-degrees) (Hanneman & Riddle
2005). Based on the data collected about the AGRICULTURE and NUTRITION networks
explained above, we construct frequencies of being named (in-degrees) or naming others (out-
degree). Following Jaimovich (2015), we define in-degrees of group member i in CBO g for
the information network m as
𝑑𝑖𝑔𝑖𝑛(m)=∑ 𝑙𝑗𝑖𝑗 (𝑚), (2.3)
as our proxy for the prominence of a person. The underlying assumption is that high in-degree
persons will be good entry points for development projects since they are the ones others
claim to communicate with most often about the topics of interest. It was recently applied by
Kim et al. (2015), who use the in-degree as a measurement of centrality in public health
interventions.
Yet, being prominent cannot be equated with frequently transmitting information to others.
Therefore, it is recommended to also study influential people, measured by their out-degree
(Hanneman & Riddle 2005). Out-degrees represent the number of persons within CBO g that
group member i indicates to exchange information with about m. Out-degrees, as a proxy for
the influence of a person, are defined as
𝑑𝑖𝑔𝑜𝑢𝑡(𝑚)=∑ 𝑙𝑖𝑗𝑗 (𝑚). (2.4)
Finally, isolates can be defined based on in-degrees, out-degrees or a combination of both.
We apply the most comprehensive definition where 𝐼𝑆𝑂𝑖𝑔(𝑚) = 1 if 𝑑𝑖𝑔𝑖𝑛(m)=0 and
5 For comparison, logit estimates are shown in Table A4 in the Appendix.

16
𝑑𝑖𝑔𝑜𝑢𝑡(m)=0, and 𝐼𝑆𝑂𝑖𝑔(𝑚) = 0 otherwise. Thus, a person is referred to as isolate, if he or she
is never named by others and at the same time claims not to share information with any group
member on topic m.
Estimation strategy
We expect that the centrality of a group member i in network m is influenced by vectors of
individual (I), household (H) and group (G) characteristics. The econometric model is
specified as
𝑑𝑖𝑔(𝑚) = 𝛽0 + 𝛽1𝐼 + 𝛽2𝐻 + 𝑣 + 𝜀, (2.5)
where 𝑑 measures the in-degree 𝑑𝑖𝑔𝑖𝑛(m) or out-degree 𝑑𝑖𝑔
𝑜𝑢𝑡(𝑚) for network m of individual i,
embedded in household h and CBO g. I is a vector of individual characteristics such as
gender, age as a proxy for experience, education, as well as holding a leadership position and
the number of external links, among others. H represents a vector of household related control
variables such as land size and economic dependency ratio. To control for unobserved
heterogeneity within CBOs, we introduce group level fixed effects v. 6
Further, clustered
standard errors are introduced to control for heteroscedasticity. The error term is represented
by 𝜀. Given that the regressands are count variables, we estimate equation (2.5) using fixed-
effects Poisson regressions (Wooldridge 2002).
Finally, we model isolation as a function of individual (I), household (H) and group (G)
related variables:
𝐼𝑆𝑂𝑖𝑔(𝑚) = 𝜕0 + 𝜕1𝐼 + 𝜕2𝐻 + 𝜕3𝐺 + 𝜇, (2.6)
where 𝐼𝑆𝑂𝑖𝑔(𝑚) = 1 𝑖𝑓 𝑑𝑖𝑔𝑖𝑛(m)=0 and 𝑑𝑖𝑔
𝑜𝑢𝑡(m)=0, and 𝐼𝑆𝑂𝑖𝑔(𝑚) = 0 otherwise, and 𝜇 is an
i.i.d. error term following a normal distribution. Given the binary nature of the dependent
variable, equation (2.6) is estimated using Probit regressions. Table A2.2 gives an overview
of the individual and household level variables included in the Poisson and Probit models.
Information on group-level variables is provided in Table 2.1.
6 ). In an alternative specification, we replace the group-level fixed effects with a vector G of CBO-level
variables in order to understand which underlying factors are captured by the fixed effects. Results are shown in
Table A2.5 in the appendix. G consists of CBO related variables such as whether the group’s main ativity is
agriculture or whether the group received external support.

17
Based on previous literature, we derive several hypotheses regarding the expected effects of
included covariates. First, persons holding leadership positions are usually well connected,
and thus are expected to have higher in-degrees and out-degrees as well as a lower probability
of being isolated with respect to a certain topic. Nonetheless, it should be kept in mind that in
cases where chairpersons are externally appointed (e.g. by donor organizations) leadership
may not necessarily represent the most central person within a network (BenYishay &
Mobarak 2013). Second, we expect differentiated gender effects depending on the information
topic. In agricultural information networks, we expect men to be more central. In the African
setting, the role of women in agriculture remains underestimated and men are still commonly
perceived as the main decision-makers (World Bank & IFPRI 2010). Also, agricultural
extension services are still predominantly attended by male household heads (e.g. Ragasa et
al. 2013). We therefore expect that men are less likely to be excluded from agricultural
information networks. In contrast, in nutrition information networks, we expect women to be
more central. In the African context, women are responsible for food preparation and for the
nutritional status of their family and in particular children. Previous research has found that
women spend on average a larger share of their expenditures on food related items (Hoddinott
& Haddad 1995), and that in particular older female family members play an important role in
influencing social norms and beliefs within the family, and thus nutrition behavior (Aubel
2012). Based on these findings, nutrition-specific programs mostly target women. We
therefore expect that women are less likely to be excluded from nutrition information
networks.
2.4 Results
2.4.1 Results on CBO level: Network structure and overlaps
On CBO level, we are interested in exploring the structure of agricultural and nutrition
information networks. Specifically, we want to explore how dense these networks are and to
what extent they overlap. Agriculture is an important function of all CBOs in our sample, and
they have received agricultural extension at some point in the past. Overall, 52% of the CBOs
in our sample indicated that agriculture is their main focus (Table 2.1). Other functions of the
selected CBOs include savings and credit activities as well as accessing funds or extension
services from the government. Almost one-third of the sampled groups (Table 2.1) were

18
initially formed for the KAPAP program that aimed at increasing agricultural productivity
through the delivery of trainings to CBOs.
The network densities presented in Table 2.1 and Figures 2.1 and 2.2 provide us with
information about the structure of networks. Densities can be interpreted as the share of links
formed of all links that could potentially be formed. The high TALK density of 90% on
average indicates that most of the interviewed group members talk to each other (Table 2.1).
This reflects the fact that our sample consists of relatively small community-based
organizations, whose members know each other and frequently interact.
Table 2. 1 Group related summary statistics
Mean s.d. Minimum Maximum
Group characteristics
External Support (1=yes) 0.47 0.50 0 1
Group’s age in years 7.07 4.6 2 23
Share of male within group 0.39 0.25 0 1
Female only (1=yes) 0.08 0.28 0 1
Female dominated (>=60%) (1=yes) 0.38 0.49 0 1
Balanced (40-59%) (1=yes) 0.33 0.05 0 1
Male dominated (>=60%) (1=yes) 0.21 0.21 0 1
Mean age of members 46.50 5.83 32.53 58.90
Mean years of education 8.69 1.34 5.25 11.44
Share of kinship relations 0.54 0.19 0.12 1
Main function agriculture (1=yes) 0.52 0.50 0 1
KAPAP group (1=yes) 0.27 0.44 0 1
Actual group size 21 3.43 15 30
Potential links (ng-1) 16.34 2.35 10 19
Network measures on CBO level TALK density: 𝐷𝑔(TALK) 0.90 0.09 0.60 0.99
Density: 𝐷𝑔(AGRICULTURE) 0.50 0.13 0.28 0.75
Density: 𝐷𝑔(NUTRITION) 0.09 0.05 0.01 0.24
Isolates: 𝐼𝑆𝑂𝑖𝑔(𝑁𝑈𝑇𝑅𝐼𝑇𝐼𝑂𝑁) 0.16 0.37 0 1
NG=48
Note: s.d.=Standard Deviation.
In line with the CBOs’ focus on agriculture, we find that agricultural information flows very
well within groups: the agricultural information network has an average density of 50%
(Table 2.1), and everyone is connected (Figure 2.1). In contrast, nutrition information
networks are sparse: average density indicates that only 9% of all potential links are formed to
exchange nutrition information (Table 2.1), and in total 16% of group members are
completely isolated from nutrition information exchange within their groups (Figure 2.2).

19
Furthermore, the analysis of overlaps between the two networks shows that the nutrition
information that is exchanged within the CBOs – even though limited in quantity – mostly
flows through agricultural links. Of all links created in the CBOs, the majority are agricultural
links (82%), 15% are multiplex links covering both agricultural and nutrition information
exchange, and only 3% are pure nutrition links (Figure 3). The underlying adjacency matrices
of AGRICULTURE and NUTRITION are positively correlated (correlation: 0.18), indicating
some overlap between the networks. Yet, the correlation coefficients are likely driven by the
fact that network densities are in general much higher for AGRICULTURE than for
NUTRITION. Overall, of the existing nutrition connections 81.5% are at the same time
agricultural links, and thus, only 18.5% of the nutrition links are exclusively NUTRITION.
Thus, our results suggest that nutrition information is mostly transmitted through existing
channels of agricultural information exchange.
20
Figure 2. 1 AGRICULTURE. Color of nodes: gender (red=female, blue=male); Size of nodes: in-
degrees; Numbers indicate the CBOs’ IDs.
Figure 2. 2 NUTRITION. Color of nodes: gender (red=female, blue=male); Size of nodes: in-
degrees; Numbers indicate the CBOs’ IDs.

21
Figure 2. 3 Multiplexity of AGRICULTURE and NUTRITION: Color of links: orange= nutrition only (233 links), turquoise = agriculture only (5624
links), dark blue = multiplex links (both nutrition and agriculture (1014 links).

22
2.4.2 Results on dyadic level: link formation
On CBO level, we observed that 50% of all potential links are formed to exchange
agricultural information and 9% to exchange nutrition information. Using dyadic regressions,
we analyze who is likely to form such links with each other (Table 2.2). First, we find that
centrality in terms of spatial and social position matters for link formation in both
communication networks: i is more likely to form a link with j, if their agricultural plots are
next to each other or if j is a leader. Other proximity variables are relevant in particular for the
exchange of nutrition information: nutrition links are more likely to be formed between kin
and group members of the same gender, and in particular between women. These results
confirm that the transfer of nutrition information between men and women cannot be taken
for granted, which is an important insight for the design of nutrition-sensitive extension
programs.
Our results further confirm that trust and social capital in general are conducive to link
formation. Group members who connect with a larger external network and who trust others
are more likely to form a link within their farmer group to exchange agricultural and nutrition
information. Moreover, nutrition links are more likely to be formed between more educated
persons. These findings may cause concern about the inclusiveness of information networks
within farmer groups, which may exclude the least connected and least educated members
from information exchange. However, our results show that differences in external links and,
in the case of nutrition, differences in education have significantly positive effects on link
formation, indicating that information does also reach group members with lower education
and less external connections.
In sum, we have seen that agricultural information flows widely and relatively unrestricted in
the studied farmer groups, even though spatial proximity and social position do play a role for
link formation. Nutrition information, which is exchanged to a much smaller extent and
mostly flows through existing agricultural information links, relies on somewhat more
exclusive channels. In particular, nutrition links are formed between kin, same gender
(especially women), and more educated persons. When relying on the existing agricultural
extension system to design nutrition-sensitive programs, these differences in network
structure and characteristics need to be taken into account.

23
Table 2. 2 Dyadic regression results: forming links for AGRICULTURE and NUTRITION
(1) (2)
AGRICULTURE NUTRITION
Proximity
Both female (1=yes) 0.0196 0.0458***
(0.0233) (0.0114)
Both male (1=yes) 0.0405* 0.0209*
(0.0212) (0.0116)
Kinship (1=yes) -0.0352 0.0188*
(0.0240) (0.0108)
j is group leader (1=yes) 0.0686*** 0.0354***
(0.0134) (0.00791)
Plots sharing same border (1=yes) 0.128*** 0.109***
(0.0225) (0.0156)
Sum of:
Land size 0.00291 0.00192
(0.00733) (0.00294)
Years of education 0.00111 0.00256**
(0.00252) (0.00125)
Years of age 0.000866 -0.000202
(0.000714) (0.000307)
Trust towards others 0.0530*** 0.0174*
(0.0167) (0.00912)
External links 0.0184*** 0.00720***
(0.00285) (0.00151)
Difference in:
Land size -0.00401 0.00305
(0.00672) (0.00287)
Years of education 0.00163 0.00257**
(0.00228) (0.00108)
Years of age 0.000834 0.000266
(0.000713) (0.000331)
Trust towards others 0.0404*** 0.0110
(0.0152) (0.00853)
External links 0.0129*** 0.00507***
(0.00262) (0.00128)
Constant 0.166* -0.0608
(0.0929) (0.0436)
lij (m)=1 6656 1247
ND 13,318 13,318
Note: Coefficients and standard errors from grouped dyadic regression (LPM); data grouped on CBO level;
standard errors (in brackets) clustered by dyads. Asterisks *, **, and *** denote significance at the 10%, 5%,
and 1% levels, respectively.

24
2.4.3 Results on an individual level
Characteristics of central persons
At the individual level we aim to identify particularly central persons that influence the
diffusion of information, and thus represent promising entry points for targeting. We therefore
analyze the characteristics of prominent persons with high in-degrees (those who are named
often), as well as the characteristics of influential persons with high out-degrees (those who
name many others). Figure 2.4 shows the distributions of in-degrees (prominence) and out-
degrees (influence) for both communication networks.
Figure 2. 4 Distributions of out-degrees and in-degrees for AGRICULTURE and NUTRITION.
Poisson regression results show that across centrality measures and in both networks, group
leadership is positively associated with being identified as a central person (Table 2.3). In the
agricultural network, older members tend to be more central in terms of both prominence and
influence, whereas members in spatially central locations tend to be more prominent, i.e.,
more often named by others. Accordingly, central persons are usually the ones in important
02
04
06
08
0F
req
ue
ncy
0 5 10 15 20Agricultural out-degree (mean = 8.17; s.d. = 6.54)
05
01
00
150
Fre
qu
en
cy
0 5 10 15 20 Agricultural in-degree (mean = 8.17; s.d. = 2.98)
01
00
200
300
400
Fre
qu
en
cy
0 5 10 15 20Nutrition out-degree (mean = 1.53; s.d. = 3.10)
01
00
200
300
Fre
qu
en
cy
0 205 10 15Nutrition in-degree (mean = 1.53; s.d. = 1.52)

25
social and spatial positions, which is in line with our earlier findings at the dyadic level.
Regarding gender, we find that men are more often named in the agricultural network,
confirming the traditional view that agriculture is a male domain. In the nutrition network, the
gender dummy has a negative sign indicating that women tend to be named more often, but it
is not statistically significant. Finally, in both networks the number of external links is
positively associated with the out-degree suggesting that the overall network size is an
important determinant of being influential within the CBO.
Table 2. 3 Fixed-effect Poisson regression analysis of centrality measures for AGRICULTURE
and NUTRITION
(1) (2) (3) (4)
𝑑𝑖𝑖𝑛(prominence) 𝑑𝑖
𝑜𝑢𝑡(influence)
AGRICULTURE NUTRITION AGRICULTURE NUTRITION
Individual level variables
Gender (1=male) 0.0636*** -0.111 0.0217 0.0809
(0.0203) (0.0751) (0.0684) (0.113)
Years of education 0.000928 0.00736 0.00776 0.0470*
(0.00261) (0.0120) (0.00821) (0.0241)
Age in years 0.00233*** 0.00216 0.00559** 0.00441
(0.000828) (0.00272) (0.00232) (0.00770)
External links named
0.00184 0.0122 0.0540*** 0.124***
(0.00287) (0.0110) (0.00999) (0.0210)
Spatial centrality proxy 0.0585*** 0.0379 -0.0352 0.284
(0.0207) (0.0591) (0.0886) (0.178)
Group leadership position
(1=yes)
0.113*** 0.273*** 0.139*** 0.370**
(0.0180) (0.0652) (0.0450) (0.146)
Household level variables
Land size (acres) 0.00597 -0.00229 -0.0122 0.0832
(0.00788) (0.0283) (0.0190) (0.0533)
Economic dependency ratio 0.00872 0.0192 0.0183 0.0542
(0.00561) (0.0219) (0.0259) (0.0482)
Small business activities
(1=yes)
0.00520 0.0342 -0.0635 0.0191
(0.0187) (0.0653) (0.0558) (0.151)
NH=815
Notes: Clustered standard errors at CBO level in parentheses. Asterisks *, **, and *** denote significance at the
10%, 5%, and 1% levels, respectively.

26
Characteristics of isolated persons (no links) for NUTRITION7
Finally, we focus on isolated persons that have no links in the nutrition network and are
therefore at risk of being excluded from the diffusion of nutrition information within the
CBO. As identified in the CBO-level analysis, these represent 16% of respondents. Results in
Table 4 show that women are significantly less likely to be isolated from the nutrition
network. Furthermore, group leaders and members with a larger external network are less
likely to be isolates. Finally, larger farmers are less likely to be excluded from nutrition
information within the CBO. Several group characteristics also contribute to explaining the
prevalence of isolated persons within the nutrition communication networks of the CBOs.
Isolates are less likely to be found in older groups (who supposedly have built stronger social
capital over time), smaller groups, and groups with a main focus on agriculture.
7 It is possible that the variables do not capture all possible group level heterogeneity. Hence omitted variables
bias may be a concern and for that reason, it is suggested interpreting the coefficients as trends.

27
Table 2. 4 Probit regression analysis of isolates for NUTRITION
𝐼𝑆𝑂𝑖𝑔(𝑁𝑈𝑇𝑅𝐼𝑇𝐼𝑂𝑁)
𝑑𝑖𝑔𝑖𝑛(m)=0 and 𝑑𝑖𝑔
𝑜𝑢𝑡(m)=0
Individual level variables
Gender (1=male) 0.214*
(0.129)
Years of education 0.0148
(0.0186)
Age in years -0.000326
(0.00496)
External links named -0.0679***
(0.0232)
Spatial centrality proxy -0.222
(0.146)
Group leadership position (1=yes) -0.346***
(0.134)
Household level variables
Land size (acres) -0.0940*
(0.0534)
Economic dependency ratio -0.0170
(0.0466)
Small business activities (1=yes) -0.0859
(0.122)
Group level variables
External support (1=yes) -0.0725
(0.120)
Group’s age in years -0.0846***
(0.0175)
Main function agriculture (1=yes) -0.653***
(0.138)
KAPAP group (1=yes) 0.0763
(0.154)
Actual group size 0.0678***
(0.0157)
Female dominated (>=60%) -0.156
(0.135)
Potential links (ng-1) -0.139***
(0.0273)
Constant 1.146**
(0.561)
NH=815
Notes: Clustered standard errors at CBO level in parentheses. Asterisks *, **, and *** denote significance at the
10%, 5%, and 1% levels, respectively.

28
2.5 Conclusion
One way of making agriculture more nutrition-sensitive and thus combating malnutrition can
be to deliver nutrition information that particularly target farmers within CBOs. However,
little is known about the flow of agricultural and nutrition information within CBOs and the
prominent and influential key persons embedded in these networks. This knowledge can
however be crucial to effectively and efficiently deliver agricultural or nutrition related
information to farmers. This study therefore contributes to fill this gap by addressing the
following questions; First, how does the structure and density of agricultural and nutrition
information networks look like within CBOs and do these networks overlap? Second, what
are the characteristics of persons forming links to exchange agricultural and nutrition
information? Third, are there certain prominent or influential key persons within CBOs who
are important for agriculture and nutrition information networks and what are their
characteristics? Forth, are there isolated persons that are excluded from these networks and
what are their characteristics?
The analyses conducted in this study have shown that nutrition information is exchanged
within CBOs, albeit to a moderate extent. Hence, we conclude that there is room for nutrition
training to sensitize group members and nudge communication exchange about nutrition
related issues. Due to a large number of isolated persons for NUTRITION, we recommend to
particularly incentivize the communication with isolates who are more likely to be male, have
smaller land sizes and are less connected to persons outside of the group. Our findings support
Caria & Fafchamps (2015) who suggest encouraging links with less popular persons to
increase the network’s efficiency. Having a deeper look at how information is transmitted, we
find that agricultural and nutrition information networks overlap and often the same links are
used for NUTRITION and AGRICULTURE. Based on these results we conclude that nutrition
information can be transmitted through existing agricultural information links, and thus,
incorporating nutrition training into more traditional agricultural trainings may indeed be a
promising approach to make agriculture more nutrition-sensitive.
However, when looking at who forms links and who is prominent, we find gender differences:
On a dyadic level, men tend to exchange more information with men for both networks, while
women tend to stick to women for NUTRITION. Hence, traditional perceptions about
responsibilities and roles for both topics are confirmed. The formation of homogeneous links

29
is a common behavior, however, not the most effective way for communication networks.
Sticking to people that are like oneself may limit ones social world and exposure to new
information (McPherson et al. 2001). Therefore, we suggest targeting both men and women
complimentarily. Men should get invitations to nutrition training and women should receive
special invitations to agricultural extension sessions. This is of special importance in times
where diabetes, hypertension and obesity as well as undernutrition are prevalent in rural
African communities, affecting both, men and women (Popkin et al. 2012).
Poisson regression results as well as dyadic regression results suggest using group leaders and
persons living in central locations as an entry point for training. This is already widely
practiced and is reasonable since it may culturally not be acceptable to bypass these informal
hierarchies. However, using group leaders as only entry points may lead to elite capture and
hence inefficiencies (World Bank & IFPRI 2010).
Further research is needed to deepen the understanding of group heterogeneity and dynamics.
In times where farmer groups are still an attractive target unit for development projects, it is
crucial to understand how they are functioning and how groups respond to interventions. Our
results so far do not show clear differences in terms of the exchange of agricultural and
nutrition information between CBOs with a main focus on agriculture compared to CBOs
with other foci. However, panel network data and a rigorous impact assessment would be
needed to be able to understand if CBOs with different characteristics respond differently to
interventions. For further investigation detailed panel network data is required. After
understanding the underlying dynamics of CBOs, interventions can contribute to increasing a
group’s social capital and ultimately help to turn it into a valuable asset itself.

30
2.6 Appendix A2
Table A2. 1 Summary statistics of dependent variables and covariates entering the dyadic
regression
Mean s.d. Minimum Maximum
Dependent Variables
lij(𝐴𝐺𝑅𝐼𝐶𝑈𝐿𝑇𝑈𝑅𝐸) 0.50 0.50 0 1
lij(𝑁𝑈𝑇𝑅𝐼𝑇𝐼𝑂𝑁) 0.09 0.29 0 1
Explanatory variables
Proximity
Both female (1=yes) 0.44 0.50 0 1
Both male (1=yes) 0.19 0.40 0 1
Kinship (1=yes) 0.35 0.48 0 1
J is group leader (1=yes) 0.28 0.45 0 1
Plots sharing same border (1=yes) 0.09 0.28 0 1
Difference in:
Land size 0.00 1.60 -9.43 9.43
Years of education 0.00 5.00 -18 18
Years of age 0.00 16.11 -57 57
Trust towards others 0.00 0.62 -1 1
External links 0.00 3.81 -10 10
Sum of:
Land size 2.80 1.78 0 15.65
Years of education 17.34 5.42 0 33
Years of age 93.10 19.32 40 154
Trust towards others 0.52 0.62 0 2
External links 8.93 3.94 0 20
ND=13318
Note: s.d.=Standard Deviation.

31
Table A2. 2 Summary statistics of individual and household level covariates used in Poisson and
Probit regressions
Description Mean s.d.
Dependent
variables
𝑑𝑖𝑖𝑛
(AGRICULTURE) Number of times the respondent has been cited
as agricultural information exchange agent
8.17 2.98
𝑑𝑖𝑜𝑢𝑡
(AGRICULTURE) Number of persons respondent has cited as
agricultural information exchange agent
8.17 6.54
𝑑𝑖𝑖𝑛
(NUTRITION) Number of times the respondent has been cited
as nutrition information exchange agent
1.53 1.51
𝑑𝑖𝑜𝑢𝑡
(NUTRITION) Number of persons respondent has cited as
nutrition information exchange agent
1.53 3.10
Explanatory variables
Individual level variables
Gender 1=male, 0=female 0.38 0.49
Education In years of completed education 8.68 3.67
Age In years 46.50 12.51
External links
named
Number of persons the respondents talks about
nutrition/agriculture outside of his CBO
4.46 2.74
Spatial centrality
proxy
=1 if respondent shares the same plot border with
at least 2 of his/her fellow CBO members,
0=otherwise
0.22 0.41
Group leadership
position
=1 if yes, 0=otherwise 0.33 0.47
Household level variables
Land size Land owned in acres 1.40 1.19
Economic
dependency ratio
Non-working household members divided by
working household members
1.73 1.23
Small business
activities
=1 if respondent is engaged in small business
activities, 0=otherwise
0.34 0.48
CBO level variables
External support =1 if CBO received external support during the
last 5years, 0=otherwise
0.47 0.50
Group’s age Number of years the CBO exists 7.07 4.6
Main function
agriculture
= 1 if yes, 0=otherwise 0.52 0.50
KAPAP group =1 if group was founded to receive KAPAP
support, 0=otherwise
0.27 0.44
Actual group size Number of CBO members 21.32 3.58
Female dominated
(>=60%) = 1 if yes, 0=otherwise 0.38 0.49
Potential links (ng-1) Number of potential links the respondent can cite
based on the number we interviewed
16.34 2.25
𝑁𝐼= 815; 𝑁𝐺= 48
Note: s.d.= Standard Deviation.

32
Table A2. 3 Group related summary statistics including missing links
Information flows
(ND=1014) NG Mean s.d. Minimum Maximum
In-degree 48 15.13 2.57 9.41 18.73
Agric. In-degree 48 7.87 2.49 2.91 14.05
Nut. In-degree 48 1.41 0.93 0.12 4.41
Table A2. 4 Dyadic logit regression results: forming links for AGRICULTURE and NUTRITION
(1) (2)
AGRICULTURE NUTRITION
Proximity
Both female (1=yes) 0.0832 0.567***
(0.0981) (0.146)
Both male (1=yes) 0.171* 0.283**
(0.0892) (0.136)
Kinship (1=yes) -0.149 0.220*
(0.102) (0.126)
J is group leader (1=yes) 0.289*** 0.412***
(0.0570) (0.0835)
Plots sharing same border (1=yes) 0.545*** 0.990***
(0.0987) (0.117)
Sum of:
Land size 0.0120 0.0230
(0.0312) (0.0359)
Years of education 0.00485 0.0337**
(0.0106) (0.0163)
Years of age 0.00368 -0.00296
(0.00302) (0.00391)
Trust towards others 0.222*** 0.200**
(0.0709) (0.0997)
External links 0.0768*** 0.0854***
(0.0125) (0.0174)
Difference in:
Land size -0.0174 0.0408
(0.0286) (0.0348)
Years of education 0.00697 0.0355**
(0.00963) (0.0144)
Years of age 0.00354 0.00294
(0.00302) (0.00418)
Trust towards others 0.169*** 0.129
(0.0643) (0.0968)
External links 0.0540*** 0.0592***
(0.0113) (0.0145)
Constant -1.406*** -4.279***
(0.397) (0.565)
lij (m)=1 6656 1247
ND 13,318 13,318
Notes: Coefficients and standard errors from grouped dyadic logit regression; data grouped on CBO level;
standard errors (in brackets) clustered by dyads. Asterisks *, **, and *** denote significance at the 10%, 5%,
and 1% levels, respectively.
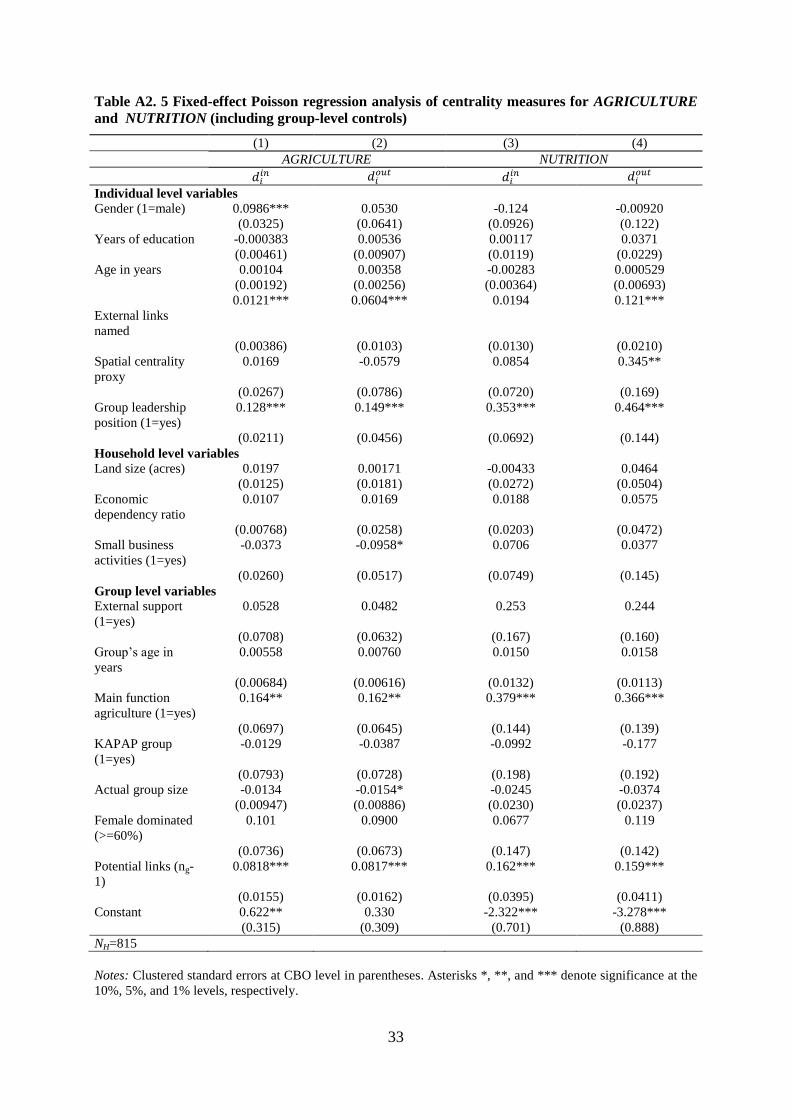
33
Table A2. 5 Fixed-effect Poisson regression analysis of centrality measures for AGRICULTURE
and NUTRITION (including group-level controls)
(1) (2) (3) (4)
AGRICULTURE NUTRITION
𝑑𝑖𝑖𝑛 𝑑𝑖
𝑜𝑢𝑡 𝑑𝑖𝑖𝑛 𝑑𝑖
𝑜𝑢𝑡
Individual level variables Gender (1=male) 0.0986*** 0.0530 -0.124 -0.00920
(0.0325) (0.0641) (0.0926) (0.122)
Years of education -0.000383 0.00536 0.00117 0.0371
(0.00461) (0.00907) (0.0119) (0.0229)
Age in years 0.00104 0.00358 -0.00283 0.000529
(0.00192) (0.00256) (0.00364) (0.00693)
External links
named
0.0121*** 0.0604*** 0.0194 0.121***
(0.00386) (0.0103) (0.0130) (0.0210)
Spatial centrality
proxy
0.0169 -0.0579 0.0854 0.345**
(0.0267) (0.0786) (0.0720) (0.169)
Group leadership
position (1=yes)
0.128*** 0.149*** 0.353*** 0.464***
(0.0211) (0.0456) (0.0692) (0.144)
Household level variables Land size (acres) 0.0197 0.00171 -0.00433 0.0464
(0.0125) (0.0181) (0.0272) (0.0504)
Economic
dependency ratio
0.0107 0.0169 0.0188 0.0575
(0.00768) (0.0258) (0.0203) (0.0472)
Small business
activities (1=yes)
-0.0373 -0.0958* 0.0706 0.0377
(0.0260) (0.0517) (0.0749) (0.145)
Group level variables External support
(1=yes)
0.0528 0.0482 0.253 0.244
(0.0708) (0.0632) (0.167) (0.160)
Group’s age in
years
0.00558 0.00760 0.0150 0.0158
(0.00684) (0.00616) (0.0132) (0.0113)
Main function
agriculture (1=yes)
0.164** 0.162** 0.379*** 0.366***
(0.0697) (0.0645) (0.144) (0.139)
KAPAP group
(1=yes)
-0.0129 -0.0387 -0.0992 -0.177
(0.0793) (0.0728) (0.198) (0.192)
Actual group size -0.0134 -0.0154* -0.0245 -0.0374
(0.00947) (0.00886) (0.0230) (0.0237)
Female dominated
(>=60%)
0.101 0.0900 0.0677 0.119
(0.0736) (0.0673) (0.147) (0.142)
Potential links (ng-
1)
0.0818*** 0.0817*** 0.162*** 0.159***
(0.0155) (0.0162) (0.0395) (0.0411)
Constant 0.622** 0.330 -2.322*** -3.278***
(0.315) (0.309) (0.701) (0.888)
NH=815
Notes: Clustered standard errors at CBO level in parentheses. Asterisks *, **, and *** denote significance at the
10%, 5%, and 1% levels, respectively.
34
3 The Role of Farmer’s Communication Networks for
Group-based Extension: Evidence from a Randomized
Experiment8
Abstract. A growing body of literature focuses on the role of network effects for farmers’
adoption decisions. However, little is known on how interventions affect networks. We
analyze the effect of group-based trainings on networks and the influence of these networks
on the adoption of technologies. Our analysis builds on a unique dataset that combines a RCT
with detailed panel data on communication networks. The RCT was implemented in rural
Kenya and consisted of varying combinations of group-based agricultural and nutrition
training sessions. The purpose of the extension training was the promotion of the iron-rich
black bean variety KK15. Survey data from 48 farmer groups (824 households) was collected
before (2015) and after (2016) the intervention. Results suggest that, first, the intervention had
a positive impact on communication among farmers (i.e. the creation of communication
links). Second, besides positive direct effects of the intervention, we also find strong positive
network effects on adoption, indicating that individual farmers are more likely to adopt, the
higher the share of adopters in their communication network. Hence, group-based extension
approaches can be efficient in diffusing new technologies, not only because they reduce
transaction costs, but also because network effects can stimulate and drive technology
adoption.
Keywords: Network effects, communication networks, RCT, group-based extension
8 This chapter is co-authored by Andrea Fongar (AF), Theda Gödecke (TG), Mercy Mbugua (MM ), Michael
Njuguna (MN), Sylvester Ogutu (SO) and Meike Wollni (MW). I (LJ) developed the research idea, collected the
survey data in 2015 and 2016, did the data analysis, and wrote the essay. AF, SO, MM provided assistance in
data collection and MN took part in the design of the RCT. MW and TG commented at the various stages of the
research and contributed to writing and revising the essay.
35
3.1 Introduction
The adoption of new technologies is key for the economic development of smallholder
farmers in Sub-Saharan Africa. Unfortunately, adoption rates remain behind expectations
(Evenson & Gollin 2003; Emerick et al. 2016). Several factors determine the adoption of
technologies, with information and social networks being the ones most widely discussed
(Aker 2011). In settings where formal institutions do not work properly, information gained
through informal networks can serve as substitute (Breza 2016). In particular in these settings,
networks play an important role for the diffusion of information and consequently for the
adoption of new technologies (Foster & Rosenzweig 1995; Bandiera & Rasul 2006; Munshi
2008; Conley & Udry 2010; Van den Broeck & Dercon 2011).
Although the importance of social networks for technology adoption is widely acknowledged,
several studies still model farmers as independent actors. Other studies use rough proxies
(such as group membership). These proxies neglect actual social interactions among famers
(Breza 2016). Recent research has collected more detailed data on social interactions, but
relied on network sampling strategies that due to missing information can only reflect certain
aspects of the network (Santos & Barrett 2010; Conley & Udry 2010; Maertens & Barrett
2012; Murendo et al. 2017). The collection of detailed census data is rare (exceptions include
Van den Broeck & Dercon 2011; Jaimovich 2015). Due to these data constraints, Maertens &
Barrett (2012) encouraged the use of detailed network data to be able to, for example,
understand how networks change over time and respond to interventions. The underlying
question is whether interventions, such as the provision of group-based agricultural extension,
can contribute to an increased (or decreased) information exchange, and hence strengthen (or
weaken) the social capital of groups. Since then, an emerging body of literature developed on
social networks and their impact on technology adoption (Emerick et al. 2016; Beaman et al.
2015; overview by De Janvry et al. 2017). However, we are not aware of any study that uses
data on actual communication networks to establish evidence on how group-based extension
can influence communication networks and how these networks then influence individual
adoption behavior. Therefore, we aim to understand how farmers that are embedded in groups
communicate and how communication networks can promote the adoption of new
technologies. We contribute to the literature by using a panel data set of detailed information
on communication networks within farmer groups, combined with a RCT. The insights
generated by our study can help to make agricultural extension more effective.

36
RCTs have become the gold standard in social science to establish causality. Yet, while RCTs
help to rule out selection bias, the pathways that finally lead to behavioral change often
remain a black box (Fafchamps 2015). In this article, we combine panel network data with a
RCT in order to shed some light on potential drivers of change. Since the persons we share
information with shape our views, attitudes and actions explicitly or implicitly (Munshi 2008;
Conley & Udry 2010; Breza 2016), communication networks can be considered potential
pathways through which behavioral change, and thus technology adoption, occurs. In the
context of group-based extension, communication networks potentially play a particularly
strong role due to dynamics that trigger peer pressure or competition. Combining the RCT
with panel network data allows us to explicitly rule out or control for network changes
induced by the intervention. In the case of communication networks this is likely to be
especially relevant as they can change easily over time, compared to less flexible networks
based e.g. on kinship or neighborhood. So far, according to Comola & Prina (2017), all
studies using detailed network data (besides their own study) are cross-sectional and thereby
assume that networks are static.
In summary, little is known if interventions, such as agricultural extension, affect agricultural
communication networks. Further, the question on how the individual adoption decision is
influenced by communication and the decision making of others in a farmer group setting
remains unanswered. Based on the presented research gaps we derive our specific research
questions: first, can group-based extension approaches help to enhance communication
networks, and second, do these networks contribute to fostering technology adoption?
The RCT was implemented in rural Kenya and consists of varying combinations of group-
based agricultural and nutrition training sessions. The purpose of the extension training was
the promotion of the iron-rich black bean variety KK15. Survey data from 48 farmer groups
(824 households) was collected before (2015) and after (2016) the intervention. Our analysis
is based on dyadic regressions and linear probability models. This essay is organized as
follows: Chapter 3.2 discusses the experimental design and research setting, Chapter 3.3
elaborates on the econometric approach, Chapter 3.4 presents the results and Chapter 3.5
concludes.

37
3.2 Experimental design and research setting
3.2.1 Background on extension approaches
Delivering agricultural extension to farmers can take place in many different ways (Anderson
& Feder 2007). The extension officers can visit individual farmers to advise them, extension
service can be provided to groups of farmers, or extension officers can train so called model
or contact farmers, who then share the new information with their peers. An increasing body
of literature has analyzed the effect of the model farmer approach, with mixed results.
Kondylis et al. (2017) for instance found that even if model farmers adopt a technology, their
adoption decision has little impact on the adoption decision of other farmers. Maertens (2017)
argues that farmers mostly learn from a few progressive farmers. Training exclusively these
progressive and powerful farmers consequently bears the risk of project failure in case they
eventually decided not to commit to the project.
The group-based extension approach is widely used by development practitioners (Anderson
& Feder 2007). Advantages are that, first, working with groups of farmers reduces transaction
costs compared to visiting a large number of dispersed individual farmers. Second, the group-
based approach is considered as pro-poor since, it is beneficial for women and low-educated
farmers in East Africa (Davis et al. 2012). Third, group-based approaches are participatory
and said to be efficient in spreading information and hence promoting new technologies
(Fischer & Qaim 2012).
3.2.2 Research area
The study is based on a randomized field experiment in which the partnering NGO, Africa
Harvest Biotech Foundation International (Africa Harvest), delivered group-based extension
training to farmers in Kisii and Nyamira County in Kenya. In these densely populated
Counties, more than half of the population depends on the agricultural sector. Most
commonly, farmers grow maize, beans, bananas, sugar cane, tea, and horticultural crops. The
farming system is characterized as diverse, and depends on small land sizes, with almost all of
the land being under cultivation (Mbuvi et al. 2013). Kisii and Nyamira have two agricultural
seasons (March-July; September-January). Regarding the nutritional status, one-quarter of the
children are stunted in Kisii and Nyamira Counties, which means being too short for their age.
At the same time, a third of the women of reproductive age are overweight or obese (KNBS

38
2015). Against this background, agronomic and nutrition training could contribute to an
improvement of the farmer’s livelihood.
3.2.3 Randomized experiment
The aim of the project was the diffusion of agronomic and nutrition knowledge, as well as the
promotion of the black bean variety KK15 which is high in iron and zinc. KK15 was bread
conventionally at the Kenyan Agriculture and Livestock Research Organization (KALRO) in
Kakamega. Besides its nutritional benefits, KK15 is high-yielding and root-rot resistant. Most
of the farmers in our sample grow beans and frequently consume them. However, black beans
are not common in our research area and the different color and unknown taste of the new
variety may hinder farmers from adopting KK15. Farmers in all groups were able to order the
black bean KK15. At any time, farmers had the option to place an order for the bean through
the group leader, who then informed the extension officers. In the treatment groups, in
addition to the trainings, the bean seeds were subsidized with 30% of the market price.
The training sessions varied in intensity and content (agronomy, nutrition, and marketing)
along three treatment arms. Farmers in the first treatment group received seven agronomic
training sessions that focused on the attributes and cultivation practices of KK15. The second
treatment group received the very same seven agronomic training sessions and additionally
three nutrition education sessions. During the nutrition education sessions, farmers were
taught on topics related to an adequate human nutrition including modules on balanced diets,
food groups and breast feeding practices among others. The overall aim of the nutrition
education sessions was to sensitize farmers on the mentioned topics, and to eventually
increase their nutritional knowledge. Treatment three received the same as treatment two
(seven agricultural training sessions, three nutrition education sessions), plus three marketing
sessions. The marketing sessions entailed a theoretical and a practical component. The
theoretical part aimed at training farmers on different marketing strategies. The practical
component linked farmers with bean traders so that they could jointly discuss the marketing
options for KK15. We followed a phase-in design, meaning that also the control group
received extension training in 2017 after the follow-up survey was completed.
The extension sessions were harmonized regarding the messages delivered and the way the
farmers were mobilized. Information on time and date of the next meetings was agreed at the
end of each session. In addition, group leaders and individual members were contacted three

39
days before the sessions took place. Besides the efforts to inform the farmers about the
extension sessions, training attendance was not incentivized and entirely voluntary.
3.2.4 Sampling and data collection
The baseline data was collected in 2015 between October and December. The sampling frame
was based on existing farmer groups is Kisii and Nyamira County. We selected 48 farmer
groups randomly, proportionate to the number of farmer groups per County (16 in Nyamira,
36 in Kisii). The lists of members were carefully checked and cleaned with help of the group
leaders before the survey, resulting in an average group size of 21 members. In a second step,
based on the adjusted group member lists, about 17 households were randomly sampled and
interviewed in each of the selected groups. During baseline, 824 group members were
interviewed. After the baseline survey, 36 farmer groups were randomly assigned to treatment
and 12 farmer groups to control. The training sessions started in February 2016 and were
completed in September 2016. The implementation was closely monitored by the researchers.
Afterwards, the follow-up survey took place between October and December 2016. During
the follow-up survey, we interviewed the same group members again. Only 78 households
could not be interviewed (e.g., respondent passed away, migrated or travelled for longer
periods). In addition, the partnering NGO collected detailed information on training
attendance as well as information on who ordered the KK15 variety. To ensure uniformity of
data collection, standardized participation lists and ordering forms were developed.
3.2.5 Network data
To collect data on social networks within the groups, we asked all randomly selected group
members about their links to all (interviewed or not) fellow group members concerning
different kind of information networks and measures of proximity (relationship, sharing the
same plot borders, sharing inputs). Since the treatment primarily dealt with the delivery of
agricultural information, we analyze, whether the training sessions affected the corresponding
network, namely the agricultural information network.
A link lij is defined as a binary variable, turning one if information about a certain topic is
exchanged. The link questions were framed as: did you share information on agriculture with
NAME? The reference period for all questions referred to the last 12 months. On average,
around 80% of group members were interviewed, which gives us close to full census data.

40
Overall, 815 respondents answered the network module during baseline. During the follow-up
visit, we were able to collect network data from 719 respondents. We take our network as
undirected, meaning we take a link as existing as soon as i or j stated to share information.
This assumption is widely applied (Comola & Prina 2017; De Weerdt & Fafchamps 2011;
Banerjee et al. 2013). Our dataset consists of 48 block-diagonal matrices since we have only
data on information flows within farmer groups, but not across them. Within farmer groups,
each respondent can engage in conversation with ng-1 members since self-links are excluded
where n is the number of members of farmer group g.
3.2.6 Attrition
Our attrition rate of 12% shown in Table 3.1 is in general low compared to other RCTs
(Ashraf et al. 2014). Normally, statistical techniques are used to control for attrition bias.
However, our research design allows us to avoid attrition in a straight-forward way. Our main
variables of interest are the communication network variables as well as the variables on
KK15 adoption. To avoid the loss of network data, we take the relationship as reciprocal: let
us assume to have information from i about j, but j is an attritor: i cites to build a
communication link with j, but we miss information on whether j also cites i. We then replace
the missing data of j with the information given by i. Hence, our undirected network dataset
consists of 815 group members and 6659 pairs of dyads per year.
Table 3. 1 Attrition per treatment arm on farmer group level
Treatment group Interviewed 2015 Interviewed 2016 Attrition Attrition %
Control 207 183 24 0.12
Treatment 608 536 72 0.12
Treatment 1 203 188 15 0.07
Treatment 2 205 170 35 0.17
Treatment 3 200 178 22 0.11
Total Sample 815 719 96 0.12
Further, we avoid attrition by replacing the missing adoption variable (self-reported data on

41
whether the farmer planted KK15) with the administrative data collected by the partnering
NGO. We thus implicitly assume that the farmers who ordered the beans have also received
and planted them9. This strategy allows our estimates to be based on 815 observations on
individual level.
3.2.7 Balance and compliance
Table A3.2 and A3.3 (Appendix A3) compare treatment and control group covariates at
baseline. Table A3.2 shows the dyadic balance table which is used for our first research
question on the impact of group-based extension on network changes, while Table A3.3
shows the balance table on individual level, which is relevant for the second research question
addressing network effects on the individual adoption decision. In general, around 60% of our
respondents are female, completed primary education (which is the equivalent to eight years
of schooling in Kenya), and farm on average a bit more than an acre of land. While all
households have received agricultural information at some point in the past, almost half of the
respondents indicated in the baseline that they had accessed nutrition information (Table
A3.3). The sample means on a dyadic level show that a little less than a third of all potential
links are close relatives (kinship) and around ten percent of all links share the same plot
border (Table A3.2). While most variables at baseline are balanced between treatment and
control group, a few statistically significant differences are found, in particular, regarding age
and education. The respondents in the treatment group are on average older and less educated
compared to respondents in the control group (Table A3.2 and A3.3). In the econometric
analysis, we take the unbalanced variables into account by including them as baseline
controls.
The overall compliance rate, including partial compliance, is 70%, indicating that 426 of the
608 interviewed group members, who were assigned to treatment, attended at least one
training session. On the average, farmers attended 38% of the training sessions offered to
them (for more details, see Table A3.4 in the Appendix A3).
9 The administrative data slightly underreports the actual adoption recorded in our survey. According to the
administrative data 116 farmers in our sample ordered KK15, compared to 146 farmers who reported in the
survey to have planted KK15. The discrepancy is due to the fact that a few farmers received seeds from fellow
group members or occasionally placed joint orders. By replacing the missing data with administrative data, we
thus potentially underestimate the true impact of the intervention.

42
3.3 Econometric approach
3.3.1 Dyadic intent-to-treat on agricultural information networks
To answer our first research question, i.e. whether group-based extension training has an
impact on agricultural communication networks, we estimate intent-to-treat (ITT) effects on
link formation in a dyadic framework.
lij(t1)= α0+ α1ITT+ εij (3.1)
where lij(t1) is a binary variable, turning one if an agricultural communication link between
individual i and j exists at time t1 (follow-up). As noted earlier, we take the network as
undirected, assuming that a link exists as long as either i or j stated so. In the intervention, we
implemented three different treatment arms that all impart agricultural training, but vary in
terms of their intensity and additional contents. Here, we only focus on the overall impact of
the group-based extension intervention on agricultural information networks, summarizing the
three arms into one treatment.10
Hence, ITT is a dummy taking the value of one, if the
respondent was assigned to any of the treatment arms, and zero, if the respondent was
assigned to the control group. Our main coefficient of interest is the ITT effect measured by
parameter α1. It tells us the effect of being assigned to the treatment group on the likelihood of
forming a communication link at follow-up. Standard errors εij are clustered at a dyadic level.
We are using grouped dyadic OLS regressions, following Fafchamps & Gubert (2007).
In a second specification, we include baseline control variables Xij for those covariates that
showed significant differences between control and treatment group at baseline (see Table
A3.2). According to Carter et al. (2013), this step can increase the accuracy of our estimates.
lij(t1)= β0+ β1ITT+ β2 Xij + εij. (3.2)
Any observed increase in communication associated with the intervention can be triggered by
two mechanisms: first, it is possible that the contents of the training stimulated sharing of
agricultural information. Second, simply the fact that group members spent more time
together during the training sessions may have induced more information exchange in general
and hence also on agricultural topics. In order to control for a potential increase in the general
10
We tested whether treatment 2 and treatment 3 had additional effects on the communication network (see
Appendix A3, Table A3.1). We did not find significant differences between the treatments, which justifies the
choice of treating the three arms as one.

43
frequency of communication, and thereby isolate the treatment effect of the agricultural
extension intervention, we also include in the above specification a binary variable that turns
one, if the frequency of general information sharing increased from baseline to follow-up11
.
In principle, observed changes in communication associated with the intervention can be
driven by two components: the creation of new links and the decision to maintain or quit old
links. To gain further insights into the underlying dynamics of network changes triggered by
the intervention, we estimate two additional model specifications exploring the effect on new
link formation (nij) and the maintenance of existing links (dij).
nij= δ0+ δ1ITT+ εij (3.3)
First, nij is a binary variable that equals one, if lij(t0) = 0 (at baseline) and lij (t1) = 1 (at follow-
up), i.e., if a link is newly created, and zero otherwise. The parameter of interest, δ1, indicates
whether new communication links are more likely to be formed in treatment groups,
compared to control groups.
dij= λ0+ λ1ITT+ εij. (3.4)
Second, dij is a binary variable that equals one, if lij(t0) = 1 and lij(t1) = 0, i.e., if an existing
link was dropped, and zero otherwise. The parameter of interest, λ1, indicates whether existing
communication links are more likely to be dropped in treatment groups, compared to control
groups. Following the same procedure as in (3.2), we also estimate equations (3.3) and (3.4)
including baseline control variables Xij.
3.3.2 Individual intent-to-treat regressions with network effects
Lastly, we want to detect how communication networks can contribute to promoting the
adoption of technologies of individuals. We hypothesize that the intervention can work
directly – farmer i is offered training, receives information regarding the KK15 bean, which
convinces i to adopt – or can be channeled through network effects. In the case of group-
based extension, fellow group members are also assigned to the treatment, potentially leading
to higher adoption rates of the KK15 bean variety within treated groups. Higher adoption
rates in farmer i’s network increase his/her exposure to KK15 and thus his/her likelihood to
11
The frequency of general information sharing was asked in the following manner: How often did you talk with
NAME between October 2015 and September 2016?
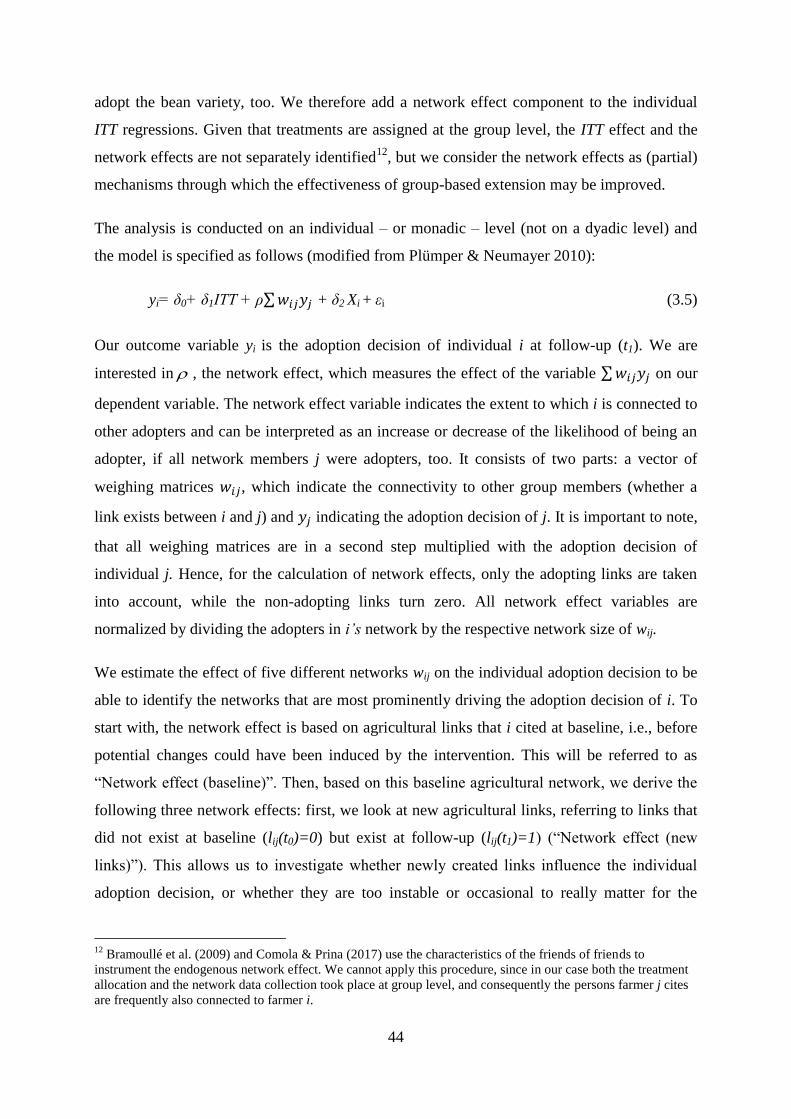
44
adopt the bean variety, too. We therefore add a network effect component to the individual
ITT regressions. Given that treatments are assigned at the group level, the ITT effect and the
network effects are not separately identified12
, but we consider the network effects as (partial)
mechanisms through which the effectiveness of group-based extension may be improved.
The analysis is conducted on an individual – or monadic – level (not on a dyadic level) and
the model is specified as follows (modified from Plümper & Neumayer 2010):
yi= δ0+ δ1ITT + ρ∑ 𝑤𝑖𝑗𝑦𝑗 + δ2 Xi + εi (3.5)
Our outcome variable yi is the adoption decision of individual i at follow-up (t1). We are
interested in , the network effect, which measures the effect of the variable ∑ 𝑤𝑖𝑗𝑦𝑗 on our
dependent variable. The network effect variable indicates the extent to which i is connected to
other adopters and can be interpreted as an increase or decrease of the likelihood of being an
adopter, if all network members j were adopters, too. It consists of two parts: a vector of
weighing matrices 𝑤𝑖𝑗, which indicate the connectivity to other group members (whether a
link exists between i and j) and 𝑦𝑗 indicating the adoption decision of j. It is important to note,
that all weighing matrices are in a second step multiplied with the adoption decision of
individual j. Hence, for the calculation of network effects, only the adopting links are taken
into account, while the non-adopting links turn zero. All network effect variables are
normalized by dividing the adopters in i’s network by the respective network size of wij.
We estimate the effect of five different networks wij on the individual adoption decision to be
able to identify the networks that are most prominently driving the adoption decision of i. To
start with, the network effect is based on agricultural links that i cited at baseline, i.e., before
potential changes could have been induced by the intervention. This will be referred to as
“Network effect (baseline)”. Then, based on this baseline agricultural network, we derive the
following three network effects: first, we look at new agricultural links, referring to links that
did not exist at baseline (lij(t0)=0) but exist at follow-up (lij(t1)=1) (“Network effect (new
links)”). This allows us to investigate whether newly created links influence the individual
adoption decision, or whether they are too instable or occasional to really matter for the
12
Bramoullé et al. (2009) and Comola & Prina (2017) use the characteristics of the friends of friends to
instrument the endogenous network effect. We cannot apply this procedure, since in our case both the treatment
allocation and the network data collection took place at group level, and consequently the persons farmer j cites
are frequently also connected to farmer i.

45
decision making process. Second, we consider the role of old, intensified agricultural links:
these links existed at baseline, still exist at follow-up, and the frequency of information
exchange increased from baseline to follow-up (“Network effect (intensified links)”). We
consider these links as strong and stable and therefore expect the intensified network effects
to be larger compared to the new network effects. Third, we define wij as the agricultural
leadership network (“Network effect (group leaders)”). This network captures farmer i’s
agricultural information links with persons in group leadership positions. We hypothesize that
leaders act as important role models in farmer groups and their behavior may, therefore, be
especially influential in the adoption decisions of fellow group members.
Lastly, we focus on a network based on geographical proximity (“Network effect
(geographical)”). In this case, a link exists, if i’s and j’s plots share the same border at t013
. As
opposed to the previous network definitions, this network is not based on communication
links reflecting the actual exchange of agricultural information. Nonetheless, geographical
proximity may facilitate observation and learning from the experience of neighboring farmers.
Such neighborhood effects are commonly seen as important drivers for the adoption of new
technologies (Conley & Udry 2010; Liverpool-Tasie & Winter-Nelson 2012; Krishnan &
Patnam 2013).
The network effect, as described above, is composed of two components: the links to other
group members and the actual adoption decision of these links. If observed network effects
are small, this could be the result of either low network activity of farmer i, or low adoption
activity within the network. To control for differences in individual network activity, we
therefore add the total size of the agricultural information network at t0 of farmer i.
Furthermore, vector Xi contains a binary variable that equals one if the farmer holds a
leadership position to control for his social role within the group, as well as baseline control
variables. Inference is a common problem when dealing with social network effects, because
the outcomes of i and j are likely to be correlated. To control for within-group correlation we
cluster the standard errors at farmer group level in specification (5), which is a common
procedure (Breza 2016). Due to the complexity of the models (1) to (5), we model the binary
13 This information was elicited with the following question: Is NAMES’s plot bordering yours?

46
dependent variables using linear probability models (LPM).14
We are aware that
simultaneously i may have an effect on j’s decision, which implies a reflection problem
(Manski 1993; Manski 1999). In our case, we do not consider the simultaneous dynamics as
problematic since we are not per se interested in who learns from whom, but rather in tracing
the overall role of group dynamics in the adoption process.
Table 3. 2 Definition of different networks wij
Networks wij Description Number of lij Mean (s. d.)
Network (baseline)
Number of agricultural links i cited at
baseline 9692 0.73
(0.45)
Network (new links)
Number of agricultural links i did not
cite at baseline, but i cited at follow-
up 1538 0.12
(0.32)
Network (intensified
links)
Number of agricultural links i cited at
baseline and follow-up, for which the
frequency of information sharing
increased 2550 0.19
(0.39)
Network (group leaders)
Number of agricultural links i cited at
baseline that are at the same time
group leaders 2861 0.21
(0.41)
Network (geographical)
Number of links i cited at baseline to
share the same plot border with 1174 0.08
(0.28)
ND Number of all potential links 13318
Note: Since the network variables are undirected, but the adoption decision of j is directed, we have a total
number of observations of 13318 (2*6659, because each link is regarded twice: from i’s and j’s perspective,
respectively).
3.4 Results
3.4.1 How does group-based extension affect agricultural communication
networks?
Table 3.3 provides summary statistics of agricultural communication networks. At baseline,
73% of all potential links were formed, with no significant difference between treatment and
control groups. In the follow-up survey, overall lower levels of network activity for
agricultural information exchange were recorded, however, significantly more links were
14
We are aware of the problem that LPM estimates can be outside the interval of [0;1]. However, the use of
LPM has the advantage of being easily interpreted and estimates are often close to the probit or logit results
(Horrace & Oaxaca 2006).

47
formed in treatment (57%) than in control groups (46%). Furthermore, in treatment groups
13% of potential links were newly formed links, compared to only 7% in control groups
(Table 3.3).
Table 3. 3 Descriptive statistics of dyadic dependent variables
(1) (2) (3) (4)
Dependent variables Total number of lij Control Treatment
Control-
Treatment
Mean (s.d.) Mean (s.d.) Mean difference
(t-value)
lij(t0) 4846 0.73 0.73 0.00805
(0.44) (0.45) (0.64)
lij(t1) 3617 0.46 0.57 0.11***
(0.50) (0.49) (-8.22)
nij 769 0.07 0.13 0.06***
(0.26) (0.34) (-6.69)
dij 1.998 0.35 0.28 -0.06***
(0.48) (0.45) (4.87)
ND 6659 1705 4954 6659
Note: Coefficients in (2) and (3) indicate a mean share of links that was created: lij refers to agricultural links at
baseline (t0) and follow-up (t1) respectively; nij refers to newly created agricultural links if lij(t0)=0 & lij(t1)=1; dij
refers to dropped agricultural links if lij(t0)=1 & lij(t1)=0. Asterisks *, **, and *** denote significance at the
10%, 5%, and 1% levels, respectively.
The dyadic regression results reveal that being assigned to the intervention (ITT) significantly
increases the likelihood of link formation. Farmers assigned to the treatment group are 11
percentage points more likely to engage in information exchange on agriculture compared to
the control group. Given the fact that on average 54 percent of possible agricultural links are
formed at follow-up (Table 3.4), 11 percentage points can be interpreted as a significant
contribution to network activities. Hence, we argue that the offer of group-based extension
had a significantly positive effect on agricultural information sharing. This result remains
robust when we control for changes in the general frequency of communication as well as for
covariates that are unbalanced between treatment and control groups at baseline.
The significantly higher network activity observed in the treatment group as compared to the
control group could be caused by two different underlying dynamics: first, the intervention
may have triggered the formation of new links; second, the intervention may have contributed
to the maintenance of existing links in the treatment group to a larger extent than in the
control group. Our results show positive ITT effects on the creation of new links and no

48
significant impact on dropping existing links (Table 3.5). This implies that the significant
increase in network activities compared to the control group mainly stems from the creation
of new links. We therefore conclude that the provision of group-based extension service
encourages agricultural information sharing not only through the existing but also importantly
through newly created links.

49
Table 3. 4 Effects of treatments on communication networks
Note: lij(t1) refers to agricultural links at follow-up. ITT refers to the intent-to-treat effect and is a dummy turning 1 if i and j are treated. Coefficients are shown with robust
standard errors corrected for dyadic correlation of errors and grouped on a farmer group level. Baseline controls include a dummy variable indicating whether a positive change in
communication frequency took place from baseline to follow-up, i and j being both male (dummy), and sums and differences of land size, age and years of education. Asterisks
*, **, and *** denote significance at the 10%, 5%, and 1% levels, respectively.
Table 3. 5 Effects of treatments on new link creation and canceling old links in communication networks
Note: nij refers to newly created agricultural links if t0=0 & t1=1; dij refers to dropped agricultural links if t0=1 & t1=0. ITT refers to the intent-to-treat effect and is a dummy
turning 1 if i and j were treated. Coefficients are shown with robust standard errors corrected for dyadic correlation of errors and grouped on a farmer group level. Baseline
controls include a dummy variable indicating whether a positive change in communication frequency took place from baseline to follow-up, i and j being both male (dummy) and
sums and differences of land size, age and years of education. Asterisks *, **, and *** denote significance at the 10%, 5%, and 1% levels, respectively.
(1) (2)
lij(t1) lij(t1)
ITT 0.114** 0.110**
(0.0464) (0.0472)
Constant 0.458*** 0.238**
(0.0409) (0.121)
Controls No Yes
Mean dependent variable 0.54 0.54
ND 6,659 6,659
(1) (2) (3) (4)
nij nij dij dij
ITT 0.0598*** 0.0597*** -0.0626 -0.0655
(0.0173) (0.0171) (0.0394) (0.0398)
Constant 0.0710*** 0.131** 0.347*** 0.409***
(0.0123) (0.0642) (0.0355) (0.0937)
Controls No Yes No Yes
Mean dependent variable 0.12 0.12 0.30 0.30
ND 6,659 6,659 6,659 6,659
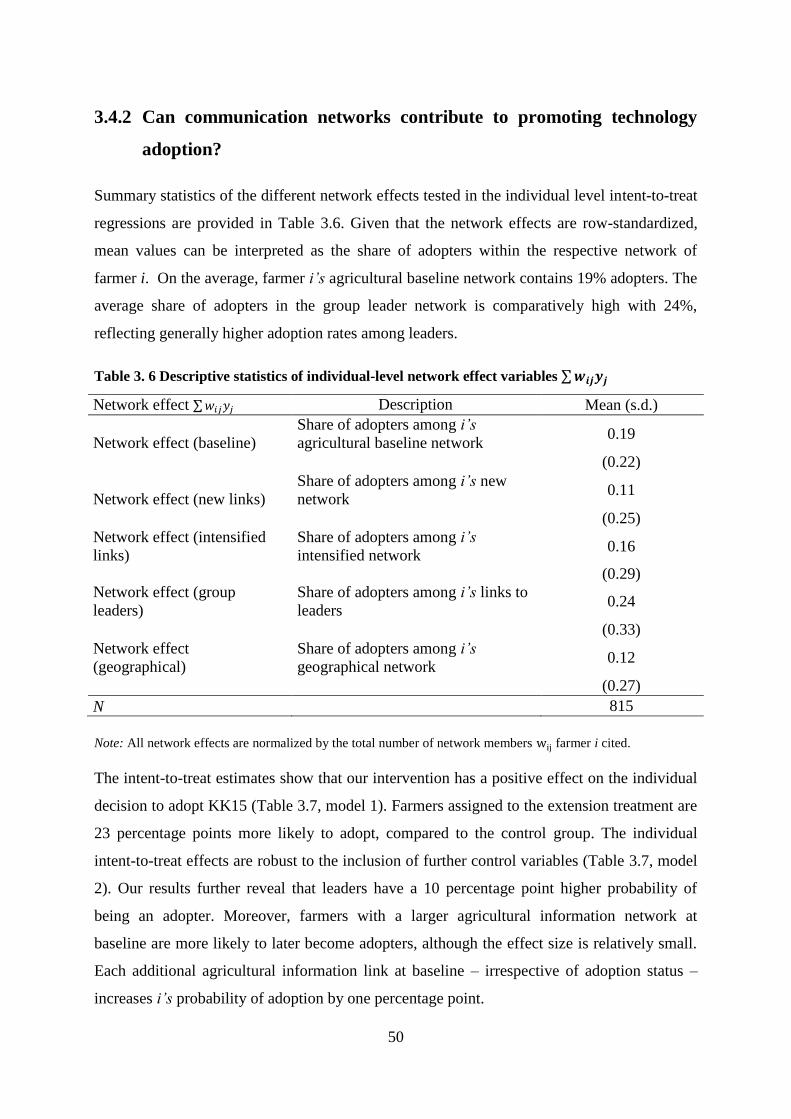
50
3.4.2 Can communication networks contribute to promoting technology
adoption?
Summary statistics of the different network effects tested in the individual level intent-to-treat
regressions are provided in Table 3.6. Given that the network effects are row-standardized,
mean values can be interpreted as the share of adopters within the respective network of
farmer i. On the average, farmer i’s agricultural baseline network contains 19% adopters. The
average share of adopters in the group leader network is comparatively high with 24%,
reflecting generally higher adoption rates among leaders.
Table 3. 6 Descriptive statistics of individual-level network effect variables ∑ 𝒘𝒊𝒋𝒚𝒋
Network effect ∑ 𝑤𝑖𝑗𝑦𝑗 Description Mean (s.d.)
Network effect (baseline)
Share of adopters among i’s
agricultural baseline network 0.19
(0.22)
Network effect (new links)
Share of adopters among i’s new
network 0.11
(0.25)
Network effect (intensified
links)
Share of adopters among i’s
intensified network 0.16
(0.29)
Network effect (group
leaders)
Share of adopters among i’s links to
leaders 0.24
(0.33)
Network effect
(geographical)
Share of adopters among i’s
geographical network 0.12
(0.27)
N 815
Note: All network effects are normalized by the total number of network members wij farmer i cited.
The intent-to-treat estimates show that our intervention has a positive effect on the individual
decision to adopt KK15 (Table 3.7, model 1). Farmers assigned to the extension treatment are
23 percentage points more likely to adopt, compared to the control group. The individual
intent-to-treat effects are robust to the inclusion of further control variables (Table 3.7, model
2). Our results further reveal that leaders have a 10 percentage point higher probability of
being an adopter. Moreover, farmers with a larger agricultural information network at
baseline are more likely to later become adopters, although the effect size is relatively small.
Each additional agricultural information link at baseline – irrespective of adoption status –
increases i’s probability of adoption by one percentage point.

51
Our results suggest that network effects in general play a crucial role for the individual
adoption decision. Furthermore, we observe heterogeneous effects depending on the chosen
network definition (models (3) – (7) in Table 3.7). The share of adopters in the agricultural
network at baseline (model 3) has a particularly large effect on the individual adoption
decision: if all agricultural network links are adopters, i’s likelihood of also being an adopter
are around 74 percentage points higher. Note that by using the baseline agricultural network,
we rule out network changes induced by the intervention. In contrast, models (4) and (5) test
the effect of newly formed agricultural links and intensified agricultural links, which have
potentially been affected by the intervention. Interestingly, the share of adopters among newly
formed links does not significantly contribute to the adoption decision of i. While the dyadic
regression results revealed that the intervention significantly increases the likelihood of new
link formation, these new links are apparently not the ones driving individual adoption
decisions. Instead, networks that are characterized by stability over time, such as the
intensified agricultural information network and the geographical network, have significant
effects on the individual adoption decision (models (5) and (7)). Lastly, the group leader
network has comparatively large effects on adoption, confirming the important role model
function of group leaders. The larger the share of adopters among the group leaders with
whom i exchanges agricultural information, the higher is the probability that i is an adopter as
well (model (6)). Group leaders may in fact also play an essential role in driving other
observed network effects. In particular, 43% of the intensified links to adopters and 37% of
the geographical links to adopters are at the same time links to group leaders, whereas none of
the newly formed links is a link to a group leader15
.
It can be seen across model specifications in Table 3.7 that once we control for network
effects, the coefficient of the direct intent-to-treat effect on the individual adoption decision
decreases. This suggests that the impact of the group-based intervention on individual
adoption decisions is to an important part channeled through communication networks and
group dynamics. Accordingly, our results confirm that fostering positive group dynamics
plays an important role for successful technology delivery and that in particular group leaders
assume critical role model functions in this process.
.
15
Overall, 43% of the agricultural network links at baseline are group leader links. Note that the network effects
are based on links that are at the same time adopters. Therefore, the high percentages of links to group leaders
are partly driven by the fact that group leaders are more likely to be adopters.

52
Table 3. 7 ITT, ITT with balance controls, ITT with controls and different network effects
(1) (2) (3) (4) (5) (6) (7)
KK15 adopter KK15 adopter KK15 adopter KK15 adopter KK15 adopter KK15 adopter KK15 adopter
ITT 0.232*** 0.226*** 0.0382** 0.203*** 0.166*** 0.0807*** 0.182***
(0.0365) (0.0365) (0.0154) (0.0375) (0.0325) (0.0237) (0.0332)
I is group leader 0.0927*** 0.0853*** 0.0975*** 0.0926*** 0.0884*** 0.102***
(0.0316) (0.0306) (0.0317) (0.0300) (0.0295) (0.0336)
Agricultural network size of i 0.0117** 0.00689** 0.0132*** 0.0102** 0.00591* 0.0103**
(0.00464) (0.00331) (0.00448) (0.00386) (0.00343) (0.00422)
Network effect (baseline) 0.717***
(0.0670)
Network effect (new links)
0.160
(0.103)
Network effect (intensified links)
0.258***
(0.0732)
Network effect (group leaders) 0.436***
(0.0603)
Network effect (geographical) 0.282***
(0.0868)
Constant 0.00483 -0.128* -0.164** -0.147** -0.150** -0.143* -0.132*
(0.00478) (0.0758) (0.0646) (0.0719) (0.0679) (0.0735) (0.0772)
Controls No Yes Yes Yes Yes Yes Yes
N 815 815 815 815 815 815 815
R-squared 0.070 0.103 0.236 0.113 0.136 0.210 0.142
Note: ITT refers to the intent-to-treat effect and is a dummy turning 1 if i and j were treated. Coefficients and robust standard errors clustered at farmer group level in parentheses
are shown. Asterisks *, **, and *** denote significance at the 10%, 5%, and 1% levels, respectively. Control variables for unbalanced baseline covariates are included (age in
years, years of education).

53
3.5 Conclusion
In this essay, we set out to analyze how group-based extension influences agricultural
information networks, and to what extent different forms of networks affect individual
decisions to adopt the black bean variety KK15. This essay is among the first using detailed
network panel data to illustrate network changes within farmer groups in response to
randomized interventions. Our results show that group-based extension significantly increased
link formation in comparison to the control group. We could also show that this increase in
network activity is predominantly driven by the creation of new information exchange links.
Furthermore, the intervention had a positive effect on the individual adoption decision, both
directly and through communication networks. Our results thus confirm the importance of
fostering positive group dynamics that are conducive to technology adoption. Testing
different forms of networks, we were able to show that in particular stable networks, such as
agricultural information links that intensified over time or links with neighboring agricultural
plots, tend to be relevant in shaping individual adoption decisions. In addition, our results
confirm the important role model function of group leaders in the technology adoption
process. By shaping network activity, group-based extension can thus be an efficient approach
for technology delivery as long as it succeeds in fostering positive group dynamics conducive
to technology adoption. In this regard, our findings suggest that it is especially critical to
reach out to group leaders and farm households in central locations as important multipliers
that influence their peers through communication networks.
Our study is based on unique panel network data combined with a RCT, which allows us to
relax the common assumption that networks are static and explicitly study the network
changes induced by the intervention. However, when analyzing the impact of the intervention
on individual adoption decisions our data does not allow separately identifying the direct ITT
effect and the network effect. Previously used instruments that can help to identify
endogenous network effects, such as the characteristics of j’s network partners (Bramoullé et
al. 2009; Comola & Prina 2017), are in our case not applicable. This is because we
implemented treatment allocation and network data collection both at the same level of farmer
groups, and therefore the persons j cites are very likely also connected to i. This problem
could be circumvented if e.g. the village instead of the farmer group is used as a reference
frame for network data collection, or if it is feasible to randomize the treatment at the
individual level. Neither of these strategies was feasible in our case. Our research focuses on

54
communication networks within farmer groups, and extending the collection of detailed
census network data to the village level would have been very time consuming and only
possible at the cost of reducing the number of clusters (farmer groups) studied. Random
assignment at the individual level is by definition precluded when studying a group-based
extension approach. One option is to add an individual randomized component, such as
sending a text message reminder to a randomly selected sub-set of farmers, but in a
community setting even small differences in how farmers are treated may lead to mistrust and
conflict and therefore not be ethically feasible. We believe that for data collection in general,
but network data, which is usually costly, in particular, researchers should carefully consider
the existing network sampling strategies and the local setting to find the most feasible,
context-specific solution allowing them to address their research questions. Based on the
insights on group-based extension generated by our study, we encourage further research
combining RCTs with panel network data to compare the role of network effects between
different extension approaches, including group-based but also e.g. model farmer approaches.
This would eventually allow deriving more general conclusions regarding the effectiveness of
different extension approaches, while taking changes in communication networks and group
dynamics explicitly into account.
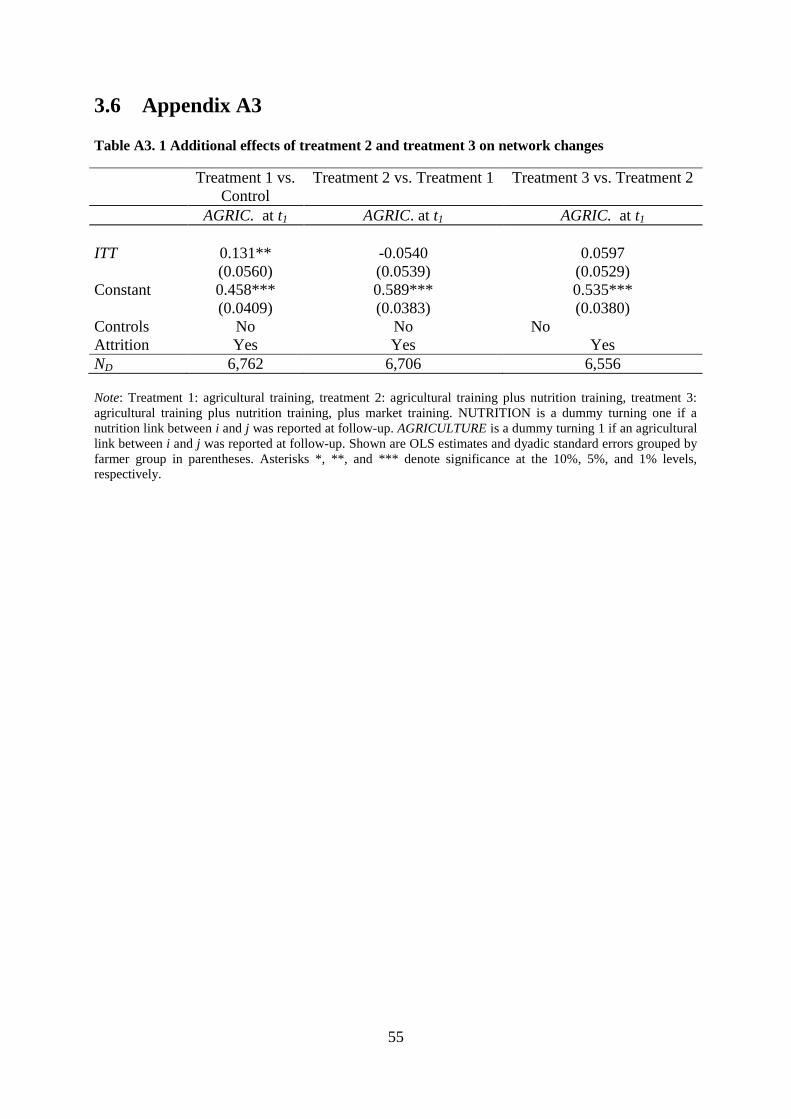
55
3.6 Appendix A3
Table A3. 1 Additional effects of treatment 2 and treatment 3 on network changes
Note: Treatment 1: agricultural training, treatment 2: agricultural training plus nutrition training, treatment 3:
agricultural training plus nutrition training, plus market training. NUTRITION is a dummy turning one if a
nutrition link between i and j was reported at follow-up. AGRICULTURE is a dummy turning 1 if an agricultural
link between i and j was reported at follow-up. Shown are OLS estimates and dyadic standard errors grouped by
farmer group in parentheses. Asterisks *, **, and *** denote significance at the 10%, 5%, and 1% levels,
respectively.
Treatment 1 vs.
Control
Treatment 2 vs. Treatment 1 Treatment 3 vs. Treatment 2
AGRIC. at t1 AGRIC. at t1 AGRIC. at t1
ITT 0.131** -0.0540 0.0597
(0.0560) (0.0539) (0.0529)
Constant 0.458*** 0.589*** 0.535***
(0.0409) (0.0383) (0.0380)
Controls No No No
Attrition Yes Yes Yes
ND 6,762 6,706 6,556
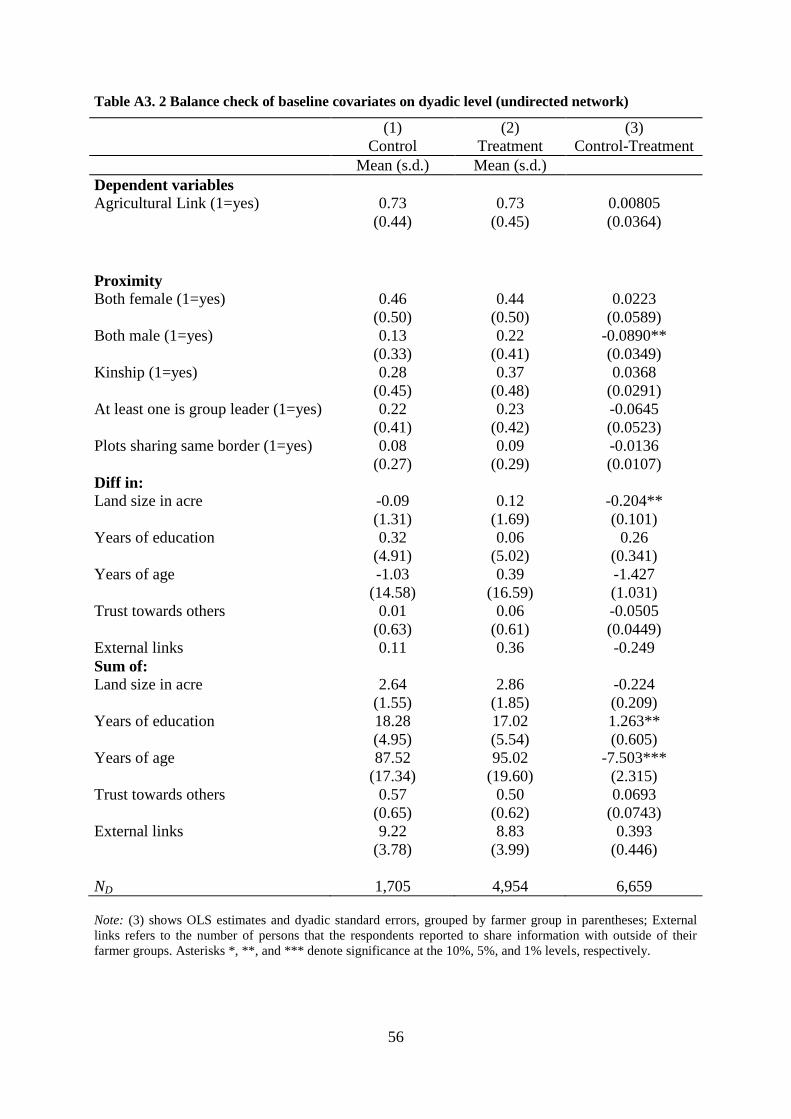
56
Table A3. 2 Balance check of baseline covariates on dyadic level (undirected network)
(1) (2) (3)
Control Treatment Control-Treatment
Mean (s.d.) Mean (s.d.)
Dependent variables
Agricultural Link (1=yes) 0.73 0.73 0.00805
(0.44) (0.45) (0.0364)
Proximity
Both female (1=yes) 0.46 0.44 0.0223
(0.50) (0.50) (0.0589)
Both male (1=yes) 0.13 0.22 -0.0890**
(0.33) (0.41) (0.0349)
Kinship (1=yes) 0.28 0.37 0.0368
(0.45) (0.48) (0.0291)
At least one is group leader (1=yes) 0.22 0.23 -0.0645
(0.41) (0.42) (0.0523)
Plots sharing same border (1=yes) 0.08 0.09 -0.0136
(0.27) (0.29) (0.0107)
Diff in:
Land size in acre -0.09 0.12 -0.204**
(1.31) (1.69) (0.101)
Years of education 0.32 0.06 0.26
(4.91) (5.02) (0.341)
Years of age -1.03 0.39 -1.427
(14.58) (16.59) (1.031)
Trust towards others 0.01 0.06 -0.0505
(0.63) (0.61) (0.0449)
External links 0.11 0.36 -0.249
Sum of:
Land size in acre 2.64 2.86 -0.224
(1.55) (1.85) (0.209)
Years of education 18.28 17.02 1.263**
(4.95) (5.54) (0.605)
Years of age 87.52 95.02 -7.503***
(17.34) (19.60) (2.315)
Trust towards others 0.57 0.50 0.0693
(0.65) (0.62) (0.0743)
External links 9.22 8.83 0.393
(3.78) (3.99) (0.446)
ND 1,705 4,954 6,659
Note: (3) shows OLS estimates and dyadic standard errors, grouped by farmer group in parentheses; External
links refers to the number of persons that the respondents reported to share information with outside of their
farmer groups. Asterisks *, **, and *** denote significance at the 10%, 5%, and 1% levels, respectively.
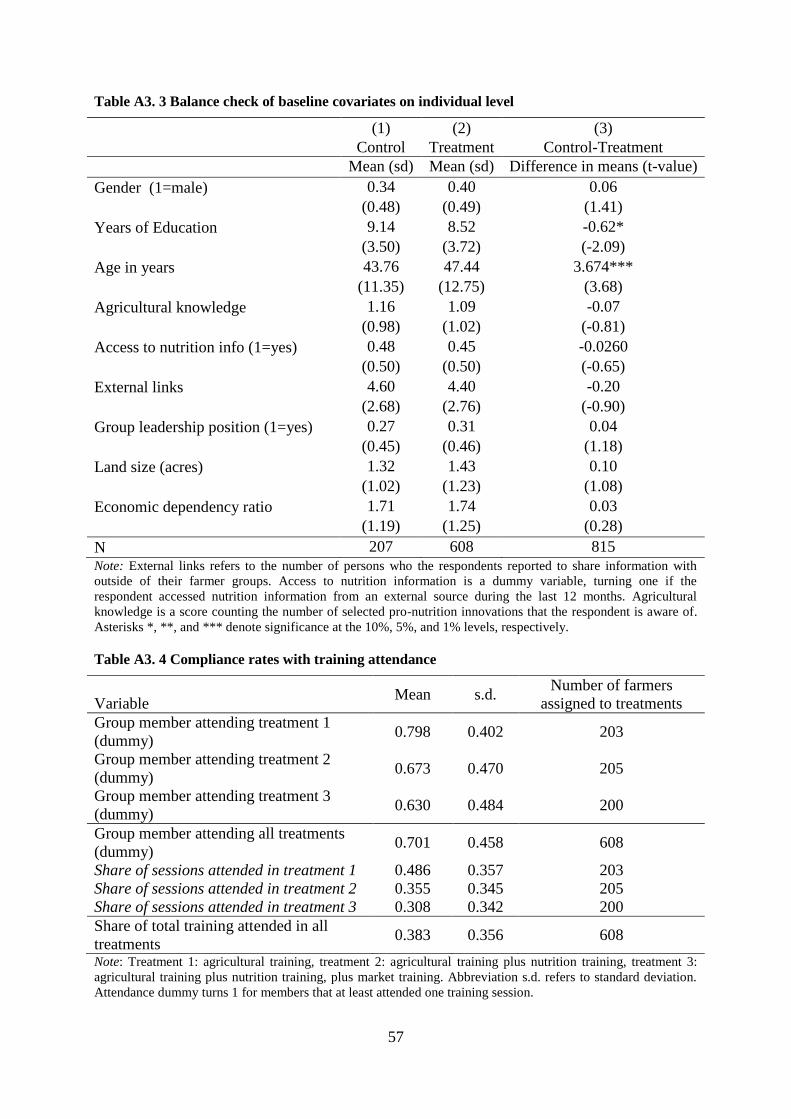
57
Table A3. 3 Balance check of baseline covariates on individual level
(1) (2) (3)
Control Treatment Control-Treatment
Mean (sd) Mean (sd) Difference in means (t-value)
Gender (1=male) 0.34 0.40 0.06
(0.48) (0.49) (1.41)
Years of Education 9.14 8.52 -0.62*
(3.50) (3.72) (-2.09)
Age in years 43.76 47.44 3.674***
(11.35) (12.75) (3.68)
Agricultural knowledge 1.16 1.09 -0.07
(0.98) (1.02) (-0.81)
Access to nutrition info (1=yes) 0.48 0.45 -0.0260
(0.50) (0.50) (-0.65)
External links 4.60 4.40 -0.20
(2.68) (2.76) (-0.90)
Group leadership position (1=yes) 0.27 0.31 0.04
(0.45) (0.46) (1.18)
Land size (acres) 1.32 1.43 0.10
(1.02) (1.23) (1.08)
Economic dependency ratio 1.71 1.74 0.03
(1.19) (1.25) (0.28)
N 207 608 815
Note: External links refers to the number of persons who the respondents reported to share information with
outside of their farmer groups. Access to nutrition information is a dummy variable, turning one if the
respondent accessed nutrition information from an external source during the last 12 months. Agricultural
knowledge is a score counting the number of selected pro-nutrition innovations that the respondent is aware of.
Asterisks *, **, and *** denote significance at the 10%, 5%, and 1% levels, respectively.
Table A3. 4 Compliance rates with training attendance
Variable Mean s.d.
Number of farmers
assigned to treatments
Group member attending treatment 1
(dummy) 0.798 0.402 203
Group member attending treatment 2
(dummy) 0.673 0.470 205
Group member attending treatment 3
(dummy) 0.630 0.484 200
Group member attending all treatments
(dummy) 0.701 0.458 608
Share of sessions attended in treatment 1 0.486 0.357 203
Share of sessions attended in treatment 2 0.355 0.345 205
Share of sessions attended in treatment 3 0.308 0.342 200
Share of total training attended in all
treatments 0.383 0.356 608
Note: Treatment 1: agricultural training, treatment 2: agricultural training plus nutrition training, treatment 3:
agricultural training plus nutrition training, plus market training. Abbreviation s.d. refers to standard deviation.
Attendance dummy turns 1 for members that at least attended one training session.

58
4 General conclusion
Technology adoption remains below expectations in SSA and a lacking access to information
is one of the most important obstacles. To facilitate the access to new information,
particularly on pro-nutrition technologies, extension services, as well as informal social
networks, can play important roles. However, little is known about the flow of agricultural
and nutrition information within farmer groups and the prominent and influential key persons
embedded in these networks. This knowledge can however be crucial to cost-effectively
deliver information regarding the attributes of pro-nutrition technologies to farmers.
Therefore, this dissertation contributes to the literature by analyzing agricultural and nutrition
linkages from a network perspective. We investigate the structure of nutrition and agricultural
communication networks within farmer groups and characterize key persons within these
networks. We also characterize persons who might be excluded from these networks. We
further detect how agricultural communication networks are affected by the offer of group-
based agricultural extension, and which role communication networks play for the individual
adoption decision. This dissertation is one of the first using detailed data on nutrition and
agricultural communication networks of farmer groups.
First of all, we find by analyzing the structure of communication networks for agriculture and
nutrition that nutrition and agricultural information are shared within farmer groups. We also
find that these agricultural and nutrition information networks overlap and often the same
links are used for sharing nutrition and agricultural information. Based on these information
synergies, we conclude that nutrition information can be transmitted through existing
agricultural information networks. We recommend that promoting pro-nutrition innovations
and nutrition information through agricultural extension may be a promising approach to
make agriculture more nutrition-sensitive. Since nutrition information are so far only shared
to a moderate extent within farmer groups and a large number of persons are excluded from
nutrition information networks, there is room for nutrition training to sensitize group members
and nudge further communication exchange about nutrition related issues.
Nudging communication may be particularly successful when working with farmer groups:
one key conclusion of my dissertation is that agricultural communication networks of farmers
can be positively influenced by group-based extension. This is relevant from a policy
perspective since we find evidence that group-based extension has the positive side-effect of

59
fostering positive group dynamics, besides being cost-effective. By fostering positive network
activity, group-based extension can thus be an efficient approach for technology deliver. In
addition, the delivery of group-based extension has a positive effect on the individual
adoption decision, both directly and through communication networks.
Last, my dissertation analyzes the characteristics of farmers that are central for the
communication about agriculture and nutrition. The results can help to develop targeting
strategies for nutrition-sensitive extension programs: we found a large number of isolated
persons – persons who do not share information on nutrition at all – and we recommend
incentivizing the communication with these isolates. Encouraging links with less popular
persons can increase the network’s efficiency (Caria & Fafchamps 2015). Regarding gender,
we have observed that men tend to share information with men and women with women.
Sticking to people that are like oneself may limit ones exposure to new information and is
hence not the most effective structure for communication networks (McPherson et al. 2001).
Therefore we suggest encouraging cross-gender information exchange during extension
sessions, if the local context allows. This is of special importance in times where diabetes,
hypertension and obesity as well as undernutrition are prevalent in rural African communities,
affecting both, men and women (Popkin et al. 2012). The essays pointed out, that group
leaders and persons that are located in geographically central locations are key for
communication networks and the adoption of technologies. I, therefore, recommend to
additionally targeting central persons. Reaching out to these important people and making
sure that they attend the extension sessions – through incentives or special invites – could
contribute to improved information diffusion, and hence, increased project outreach.
4.1 Limitations and room for future research
Our first essay characterizes important persons for nutrition and agricultural communication,
and our second essay identifies networks that foster the adoption of technologies. Both essays
point out the importance of group leaders as well as centrally located persons. However our
results remain to some extent suggestive. Future research could rigorously test whether
additionally targeting the people we considered as targeting-worthy can help to make
agricultural extension more effective. This can be done by for example designing randomized
experiments that compare group-based extension approaches with approaches that use
important persons (influencer such as leaders, or persons with farms located at central
60
locations) within groups as additional target points. Hence, there is still room for future
research on network targeting especially in the context of agricultural extension systems.
A few limitations concerning our experimental design need to be mentioned. The treatment
assignment on group level had justifiable reasons: our research interest was on the group-
based extension approach, offering only a few members training would be unethical and
dealing with groups is cheaper than dealing with many dispersed individuals. However, the
fact that only group members were interviewed does not allow separating training effects
from the network effects. Further, commonly used instruments for the endogenous network
effects such as the characteristics of j’s contacts” (Bramoullé et al. 2009; Comola & Prina
2017) are in our case not suitable since our treatment allocation and network data collection
took place on a group level. Therefore, persons farmer j cites are very likely also connected to
farmer i. It would have been ideal to have selected the respondents on a village level so that
we had network information not only from group members but also from other non-treated
villagers. This would allow the use of instruments and identification of peer effects and we
could have drawn a conclusion on spill-over effects. Even though, collecting detailed network
data on a village level may be interesting, it is very costly and was beyond the scope of this
project.
Due to the fact that the offered technology (black bean variety KK15) was not easily available
on the market, little or no adoption behavior is observed in the control group. If the control
group adopted the technology without the training, we would have had a more suitable
counterfactual for our network effects.
The project’s timeframe of three years is another drawback of our design since it is certainly
too short to measure an economic impact of the intervention. The extension treatments began
in March 2016 and the follow-up survey started in October 2016, which gave the farmers
depending on the region, one, maximum two cropping seasons to decide whether to plant the
black bean variety KK15. During the follow-up survey, the beans were not yet harvested in
some areas, which makes it difficult to measure the economic impact of our interventions.
However, even in a short-term, our intervention showed positive effects regarding technology
adoption and an increase in social capital of farmer groups.

61
References
Aker, J. C. (2011). Dial “A” for agriculture: a review of information and communication
technologies for agricultural extension in developing countries. Agricultural
Economics, 42(6), 631-647.
Akroyd, S., Smith, L. (2007). Review of public spending to agriculture. A Joint Study by
the Department for International Development and the World Bank, 5.
Anderson, J. R., & Feder, G. (2004). Agricultural extension: Good intentions and hard
realities. The World Bank Research Observer, 19(1), 41-60.
Anderson, J. R., & Feder, G. (2007). Agricultural extension. Handbook of Agricultural
Economics, 3, 2343-2378.
Arcand, J. L., & Wagner, N. (2016). Does Community-Driven Development Improve
Inclusiveness in Peasant Organizations?–Evidence from Senegal. World Development,
78, 105-124.
Ashraf, N., Field, E., & Lee, J. (2014). Household bargaining and excess fertility: an
experimental study in Zambia. The American Economic Review, 104(7), 2210-2237.
Aubel, J. (2012). The role and influence of grandmothers on child nutrition: culturally
designated advisors and caregivers. Maternal & child nutrition, 8(1), 19
Bandiera, O., & Rasul, I. (2006). Social networks and technology adoption in northern
Mozambique. The Economic Journal, 116(514), 869-902.
Banerjee, A., Chandrasekhar, A. G., Duflo, E., & Jackson, M. O. (2013). The diffusion of
microfinance. Science, 341(6144), 1236498.
Barr, A., Dekker, M., & Fafchamps, M. (2015). The formation of community-based
organizations: an analysis of a quasi-experiment in Zimbabwe. World Development,
66, 131-153.
Beaman, L., BenYishay, A., Magruder, J., & Mobarak, A. M. (2015). Can network theory-
based targeting increase technology adoption. Unpublished Manuscript.
BenYishay, A., & Mobarak, A. M. (2013). Communicating with Farmers Through Social
Networks. Yale University Economic Growth Center Discussion Paper No. 1030; Yale
Economics Department Working Paper No. 121.
Birner, R., Davis, K., Pender, J., Nkonya, E., Anandajayasekeram, P., Ekboir, J., Mbabu, A.,
Spielman, D.J., Horna, D., Benin, S. and Cohen, M. (2009). From best practice to best

62
fit: a framework for designing and analyzing pluralistic agricultural advisory services
worldwide. Journal of agricultural education and extension, 15(4), 341-355.
Bouis, H. E., & Saltzman, A. (2017). Improving nutrition through biofortification: A review
of evidence from HarvestPlus, 2003 through 2016. Global food security, 12, 49-58.
Bramoullé, Y., Djebbari, H., & Fortin, B. (2009). Identification of peer effects through social
networks. Journal of econometrics, 150(1), 41-55
Breza, E. (2016). Field experiments, social networks, and development. The Oxford
Handbook of the Economics of Networks.
Caria, A. S., & Fafchamps, M. (2015). Can Farmers Create Efficient Information Networks?
Experimental Evidence from Rural India (No. 2015-07). Centre for the Study of
African Economies, University of Oxford.
Carletto, G., Ruel, M., Winters, P., & Zezza, A. (2015). Farm-Level Pathways to Improved
Nutritional Status: Introduction to the Special Issue. Journal of Development Studies,
51(8), 945-957.
Carrington, P. J., Scott, J., & Wasserman, S. (Eds.). (2005). Models and methods in social
network analysis (Vol. 28). Cambridge university press.
Carter, M. R., Laajaj, R., & Yang, D. (2013). The impact of voucher coupons on the uptake of
fertilizer and improved seeds: evidence from a randomized trial in Mozambique.
American Journal of Agricultural Economics, 95(5), 1345-1351.
Comola, M., & Prina, S. (2017). Treatment effects accounting for network changes. Mimeo,
Case Western Reserve University.
Conley, T., & Udry, C. (2001). Social learning through networks: The adoption of new
agricultural technologies in Ghana. American Journal of Agricultural Economics,
83(3), 668-673.
Conley, T. G., & Udry, C. R. (2010). Learning about a new technology: Pineapple in Ghana.
The American Economic Review, 100(1), 35-69.
Cuellar, M., Hedlund, H., Mbai, J., & Mwangi, J. (2006). The National Agriculture and
Livestock Extension Programme (NALEP) Phase I: Impact Assessment. Sida.
Davis, K., Nkonya, E., Kato, E., Mekonnen, D. A., Odendo, M., Miiro, R., & Nkuba, J.
(2012). Impact of farmer field schools on agricultural productivity and poverty in East
Africa. World Development, 40(2), 402-413.

63
De Brauw, A., Eozenou, P., Gilligan, D., Hotz, C., Kumar, N., & Meenakshi, J. V. (2013,
August). Biofortification, crop adoption and health information: Impact pathways in
Mozambique and Uganda. In Selected paper at the Agricultural and Applied
Economics Association Meeting.
De Brauw, A., Eozenou, P., & Moursi, M. (2015). Programme participation intensity and
children’s nutritional status: evidence from a randomised control trial in Mozambique.
The Journal of Development Studies, 51(8), 996-1015.
De Groote, H., Gunaratna, N. S., Fisher, M., Kebebe, E. G., Mmbando, F., & Friesen, D.
(2016). The effectiveness of extension strategies for increasing the adoption of
biofortified crops: the case of quality protein maize in East Africa. Food Security,
8(6), 1101-1121.
De Janvry, A., Macours, K., & Sadoulet, E. (2017). Learning for Adopting: Technology
Adoption in Developing Country Agriculture.FERDI, France.
De Weerdt, J., & Fafchamps, M. (2011). Social identity and the formation of health insurance
networks. Journal of Development Studies, 47(8), 1152-1177.
Emerick, K., de Janvry, A., Sadoulet, E., & Dar, M. H. (2016). Enhancing the diffusion of
information about agricultural technology. Working Paper.
Evenson, R.E. & Gollin, D. (2003). Crop Variety Improvement and its Effect on Productivity.
Cambridge, MA: CABI.
Fafchamps, M. (2015). Causal Effects in Social Networks. Revue économique, 66(4), 657-
686.
Fafchamps, M., & Gubert, F. (2007). The formation of risk sharing networks. Journal of
Development Economics, 83(2), 326-350.
Fan, S., & Pandya-Lorch R. (2012). Reshaping agriculture for nutrition and health.
International Food Policy Research Institute.
FAO (2015). The State of Food Insecurity in the World. Rome: Food and Agriculture
Organization of the United Nations.
FAO, IFAD, UNICEF, WFP and WHO (2017).The State of Food Security and Nutrition in
the World 2017. Building resilience for peace and food security. Rome, Food and
Agriculture Organization of the United Nations.
Fischer, E., & Qaim, M. (2012). Linking smallholders to markets: determinants and impacts
of farmer collective action in Kenya. World Development, 40(6), 1255-1268.

64
Foster, A. D., & Rosenzweig, M. R. (1995). Learning by doing and learning from others:
Human capital and technical change in agriculture. Journal of Political Economy,
103(6), 1176-1209.
Foster, A. D., & Rosenzweig, M. R. (2010). Microeconomics of Technology Adoption.
Annual review of economics, 2(1), 395-424.
Grund, Thomas U. (2015) "nwcommands. Network Analysis in Stata". Retrieved from
http://nwcommands.org (accessed 25.05.2017).
Hanneman, R. A., & Riddle, M. (2005). Introduction to social network methods. Riverside,
CA: University of California, Riverside.
Hawkes, C., & Ruel, M. T. (2008). From agriculture to nutrition: Pathways, synergies and
outcomes. Agricultural and Rural Development Notes; No. 40. World Bank,
Washington, DC.
Headey, D., & Ecker, O. (2013). Rethinking the measurement of food security: from first
principles to best practice. Food security, 5(3), 327-343.
Hoddinott, J., & Haddad, L. (1995). Does female income share influence household
expenditures? Evidence from Côte d'Ivoire. Oxford Bulletin of Economics and
Statistics, 57(1), 77-96.
Horrace, W. C., & Oaxaca, R. L. (2006). Results on the bias and inconsistency of ordinary
least squares for the linear probability model. Economics Letters, 90(3), 321-327.
IFPRI (2011) Global food policy report. Washington, DC: International Food Policy Research
Institute.
IFPRI (2016) Global Nutrition Report 2016: From Promise to Impact: Ending Malnutrition
by 2030. Washington, DC: International Food Policy Research Institute.
IFPRI (2017). Global Nutrition Report. Washington, DC: International Food Policy Research
Institute.
Izquierdo, L. R., & Hanneman, R. A. (2006). Introduction to the formal analysis of social
networks using mathematica. University of California, Riverside.
Jaimovich, D. (2015). Missing links, missing markets: Evidence of the transformation process
in the economic networks of Gambian villages. World Development, 66, 645-664.
Kabunga, N. S. (2014). Improved dairy cows in Uganda: Pathways to poverty alleviation and
improved child nutrition (Vol. 1328). Washington, DC: International Food Policy
Research.

65
Kim, D. A., Hwong, A. R., Stafford, D., Hughes, D. A., O'Malley, A. J., Fowler, J. H., &
Christakis, N. A. (2015). Social network targeting to maximise population behaviour
change: a cluster randomised controlled trial. The Lancet, 386(9989), 145-153.
KNBS (2015). Kenya Demographic and Health Survey 2014. Kenya National Bureau of
Statistics (KNBS). https://dhsprogram.com/pubs/pdf/FR308/FR308.pdf (accessed
25.05.2017).
KNBS & SID (2013). Exploring Kenya’s Inequality: Pulling Apart or Pooling Together?Kisii
County. Kenya National Bureau of Statistics (KNBS) and Society for International
Development (SID).
Kondylis, F., Mueller, V., & Zhu, J. (2017). Seeing is believing? Evidence from an extension
network experiment. Journal of Development Economics, 125, 1-20.
Krishnan, P., & Patnam, M. (2013). Neighbors and extension agents in Ethiopia: Who matters
more for technology adoption?. American Journal of Agricultural Economics, 96(1),
308-327.
Maertens, A. (2017). Who cares what others think (or do)? Social learning and social
pressures in cotton farming in India. American Journal of Agricultural Economics,
aaw098.
Maertens, A., & Barrett, C. B. (2012). Measuring social networks' effects on agricultural
technology adoption. American Journal of Agricultural Economics, 95(2), 353-359.
Malapit, H. J. L., Kadiyala, S., Quisumbing, A. R., Cunningham, K., & Tyagi, P. (2015).
Women’s empowerment mitigates the negative effects of low production diversity on
maternal and child nutrition in Nepal. The journal of development studies, 51(8),
1097-1123.
Manski, C. F. (1993). Identification of endogenous social effects: The reflection problem. The
Review of Economic Studies, 60(3), 531-542.
Manski, C. F. (1999). Identification problems in the social sciences. Harvard University Press.
Manssouri, M., & Sparacino, C. (2009). Community-driven development decision tools for
rural development programmes. International Fund for Agricultural Development
(IFAD), Rome.
Matuschke, I., & Qaim, M. (2009). The impact of social networks on hybrid seed adoption in
India. Agricultural Economics, 40(5), 493-505.
Mbuvi, H. M., Kenyanya, O., & Muthengia, J. W. (2013). Determination of Potassium Levels
in Intensive Subsistence Agricultural Soils in Nyamira County, Kenya. International
Journal of Agriculture and Forestry, 3(7): 294-302.
66
McPherson, M., Smith-Lovin, L., & Cook, J. M. (2001). Birds of a feather: Homophily in
social networks. Annual review of sociology, 27(1), 415-444.
Minten, B., & Barrett, C. B. (2008). Agricultural technology, productivity, and poverty in
Madagascar. World Development, 36(5), 797-822.
Moestue, H., Huttly, S., Sarella, L., & Galab, S. (2007). ‘The bigger the better’–mothers'
social networks and child nutrition in Andhra Pradesh. Public health nutrition, 10(11),
1274-1282.
Murendo, C., Wollni, M., De Brauw, A., & Mugabi, N. (2017). Social network effects on
mobile money adoption in Uganda. The Journal of Development Studies, 1-16.
Ogutu, S.O., Fongar, A., Gödecke, T., Jäckering, L., Mwololo, H., Njuguna, M., Wollni, M.,
Qaim, M. (2018). How to Make Farming and Agricultural Extension More Nutrition-
Sensitive: Evidence from a Randomized Controlled Trial in Kenya. GlobalFood
Discussion Paper 114, University of Goettingen. http://www.uni-
goettingen.de/de/213486.html.
Olney, D. K., Pedehombga, A., Ruel, M. T., & Dillon, A. (2015). A 2-Year Integrated
Agriculture and Nutrition and Health Behavior Change Communication Program
Targeted to Women in Burkina Faso Reduces Anemia, Wasting, and Diarrhea in
Children 3–12.9 Months of Age at Baseline: A Cluster-Randomized Controlled Trial–
3. The Journal of nutrition, 145(6), 1317-1324.
Osei, A., Pandey P., Nielsen J., Pries A., Spiro D., Davis D., Quinn V., and Haselow N.
(2017). Combining home garden, poultry, and nutrition education program targeted to
families with young children improved anemia among children and anemia and
underweight among nonpregnant women in Nepal." Food and nutrition bulletin, 38(1),
49-64.
Plümper, T., & Neumayer, E. (2010). Model specification in the analysis of spatial
dependence. European Journal of Political Research, 49(3), 418-442.
Popkin, B. M., Adair, L. S., & Ng, S. W. (2012). Global nutrition transition and the pandemic
of obesity in developing countries. Nutrition reviews, 70(1), 3-21.
Ragasa, C., Berhane, G., Tadesse, F., & Taffesse, A. S. (2013). Gender differences in access
to extension services and agricultural productivity. The Journal of Agricultural
Education and Extension, 19(5), 437-468.
Ruel, M. T., Alderman, H., & Maternal and Child Nutrition Study Group. (2013). Nutrition-
sensitive interventions and programmes: how can they help to accelerate progress in
improving maternal and child nutrition? The Lancet, 382(9891), 536-551.

67
Ruel, M. T., Quisumbing, A. R., & Balagamwala, M. (2018). Nutrition-sensitive agriculture:
What have we learned so far?. Global Food Security.
Santos, P., & Barrett, C. B. (2010). Identity, interest and information search in a dynamic
rural economy. World Development, 38(12), 1788-1796.
Sibhatu, K. T., Krishna, V. V., & Qaim, M. (2015). Farm production diversity and dietary
diversity in developing countries. Proceedings of the National Academy of Sciences
(PNAS), 112, 10657-10662.
Smith, K. P., & Christakis, N. A. (2008). Social networks and health. Annu. Rev. Sociol, 34,
405-429.
Qaim, M. (2014). Evaluating nutrition and health impacts of agricultural innovations (No.
46). GlobalFood Discussion Papers.
Van den Broeck, K., & Dercon, S. (2011). Information flows and social externalities in a
Tanzanian banana growing village. The journal of development studies, 47(2), 231-
252.
Wasserman, S., & Faust, K. (1994). Social network analysis: Methods and applications (Vol.
8). Cambridge university press.
Wooldridge, J. M. (2002). Econometric Analysis of Cross Section and Panel Data. The MIT
Press 0, 5(1), 5.
World Bank and IFPRI (2010). Gender and governance in rural services: insights from India,
Ghana, and Ethiopia. Washington, DC: The World Bank and International Food
Policy Research Institute.

68
General Appendix
Questionnaire 2016 (shortened version)
Questionnaire number (adda_hhid) ____________________
HOUSEHOLD SURVEY 2016
AGRICULTURE AND DIETARY DIVERSITY IN AFRICA: AN APPLICATION OF RANDOMISED CONTROLLED TRIALS IN KISI I AND
NYAMIRA, KENYA.
Goettingen University-Germany, University of Nairobi-Kenya and Africa Harvest Biotech Foundation International (Africa Harvest) are carrying out a research on different aspects of agricultural development. We
are currently doing a survey which aims to provide more understanding about farmers’ production and marketing decisions, and nutrition and health status. Your participation in answering these questions is very
much appreciated. Your responses will be COMPLETELY CONFIDENTIAL and will only be used for research purpose. If you indicate your voluntary consent by participating in this interview, may we begin?
MODULE 0 – HOUSEHOLD ID ................................ ................................ . 3!
TARGET PERSON: GROUP MEMBER OR HOUSEHOLD HEAD ...... 4
MODULE 1: HOUSEHOLD DEMOGRAPHIC INFORMATION............. 4
MODULE 2: LAND HOLDING IN ACRES ................................ ............... 5
MODULE 3: NON-LABOUR PURCHASED INPUT USE ........................ 7
MODULE 4: CROP UTILIZATION ................................ ............................ 9
MODULE 5: LABOUR INPUTS ................................ ............................... 10!
MODULE 6: VARIETY/BREED AWARENESS AND UP-TAKE ......... 11!
MODULE 7: VARIETY/BREED ATTRIBUTES, KNOWLEDGE &
PERCEPTION ................................ ................................ ............................ 12!
MODULE 8: LIVESTOCK PRODUCTION AND MARKETING ........... 13!
MODULE 9: HOUSEHOLD ASSETS ................................ ...................... 14!
MODULE 11: OTHER SOURCES OF INCOME AND TRANSFER ...... 15!
MODULE 12: NON-FOOD EXPENDITURE ................................ ........... 16!
MODULE 13: INFORMATION ON CREDIT ACCESS .......................... 16!
MODULE 15: ACCESS TO SOCIOECONOMIC INFRASTRUCTURE 16!
MODULE 17: SHOCKS EXPERIENCENCED BY THE HOUSEHOLD 17!
TARGET PERSON: GROUP MEMBER ................................ .................. 18!
MODULE 18: SOCIAL CAPITAL ENDOWMENT ................................ . 18
MODULE 14: COMMUNITY OUTREACH METHODS ........................ 19!
MODULE 19: SOCIAL NETWORKS ................................ ....................... 22!
TARGET PERSON: PERSON RESPONSIBLE FOR FOOD PREPARATION................................ ................................ ................................ ......................... 30!
MODULE 20: HOUSEHOLD FOOD CONSUMPTION .......................... 30!
TARGET PERSON: MOTHER OR CARETAKER OF CHILD BETWEEN
THE AGE OF SIX TO 59 MONTHS ................................ .......................... 34!
MODULE 21: CHILD QUESTIONNAIRE – ONLY ONE CHILD WILL BE
CONSIDERED ................................ ................................ ........................... 34!
1.! TARGET PERSON: FIRT INDIVIUDAL ................................ ......... 37!
MODULE 22/1- FIRST INDIVIDUAL QUESTIONNAIRE (1) .............. 37
!!!! MODULE 23/1 - DECISION MAKING 41
2.! TARGET PERSON: SECOND INDIVUDAL ................................ ... 42!
MODULE 22/1- SECOND INDIVIDUAL QUESTIONNAIRE (2) ......... 42
!!!!MODULE 23/2 - DECISION MAKING 47
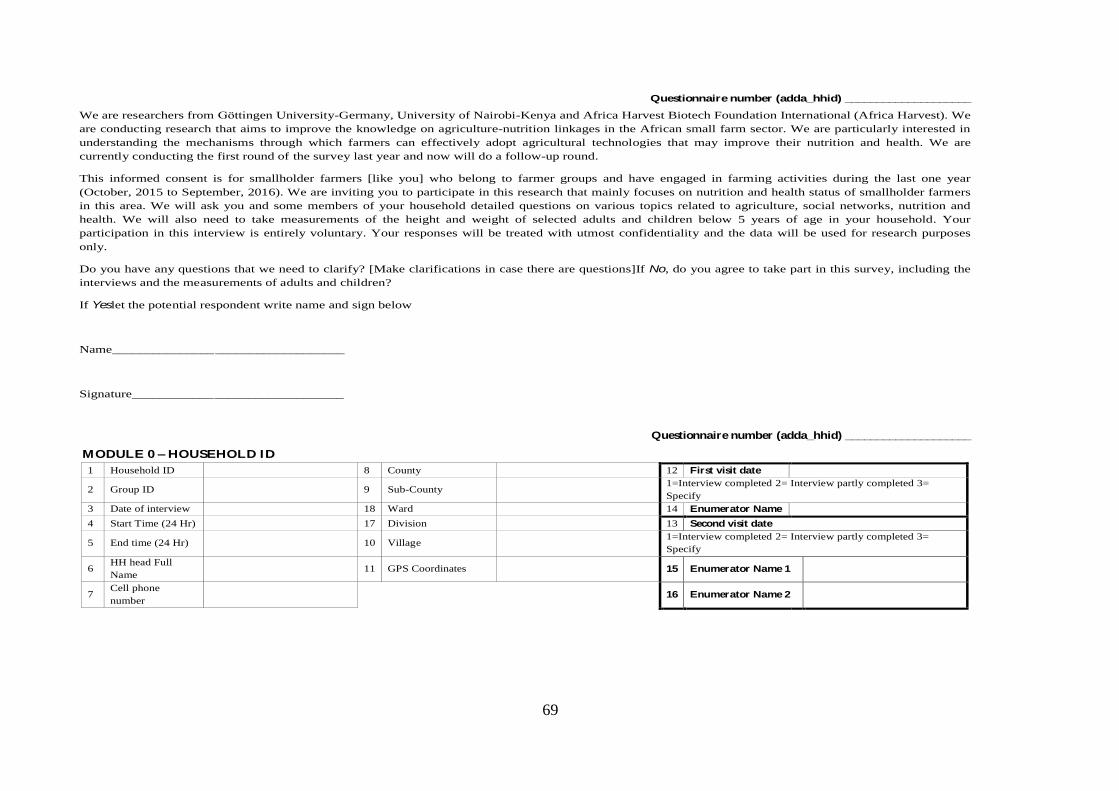
69
Questionnaire number (adda_hhid) ____________________
2
We are researchers from Göttingen University-Germany, University of Nairobi-Kenya and Africa Harvest Biotech Foundation International (Africa Harvest). We
are conducting research that aims to improve the knowledge on agriculture-nutrition linkages in the African small farm sector. We are particularly interested in
understanding the mechanisms through which farmers can effectively adopt agricultural technologies that may improve their nutrition and health. We are
currently conducting the first round of the survey last year and now will do a follow-up round.
This informed consent is for smallholder farmers [like you] who belong to farmer groups and have engaged in farming activities during the last one year
(October, 2015 to September, 2016). We are inviting you to participate in this research that mainly focuses on nutrition and health status of smallholder farmers
in this area. We will ask you and some members of your household detailed questions on various topics related to agriculture, social networks, nutrition and
health. We will also need to take measurements of the height and weight of selected adults and children below 5 years of age in your household. Your
participation in this interview is entirely voluntary. Your responses will be treated with utmost confidentiality and the data will be used for research purposes
only.
Do you have any questions that we need to clarify? [Make clarifications in case there are questions]If No, do you agree to take part in this survey, including the
interviews and the measurements of adults and children?
If Yeslet the potential respondent write name and sign below
Name__________________________________
Signature_______________________________
Questionnaire number (adda_hhid) ____________________
3
MODULE 0 – HOUSEHOLD ID
1 Household ID
8 County
12 First visit date
2 Group ID
9 Sub-County
1=Interview completed 2= Interview partly completed 3=
Specify
3 Date of interview
18 Ward 14 Enumerator Name
4 Start Time (24 Hr)
17 Division 13 Second visit date
5 End time (24 Hr)
10 Village 1=Interview completed 2= Interview partly completed 3=
Specify
6 HH head Full
Name 11 GPS Coordinates
15 Enumerator Name 1
7 Cell phone
number 16 Enumerator Name 2

70
Questionnaire number (adda_hhid) ____________________
4
TARGET PERSON: GROUP MEMBER OR HOUSEHOLD HEAD
Respondent MEMID: ________________________________________________________
MODULE 1: HOUSEHOLD DEMOGRAPHIC INFORMATION (reference period between 1st Oct 2015 and 30th Sep 2016) Household composition: Please list all household members (All those who are under the care of household head in terms of food and shelter provision, and those who normally live and eat their
meals together), starting with the household head.
1 2 3 4 5 6 7 10 11 12 13 14
MEMID
Name of the HH member
Gender M = 1 F= 0
R/ship
with HH head
(Codes A)
Age in years
Years of formal
education
(Highest level
attained)
Marital Status
(Codes
B)
# of months in the last 12
months [NAME] has been
away from home
Main
Occupation based on
time spent
(Codes D)
Household farm labour contribution
(for those above 16 years of age in the
upper category) (Codes E)
How many
hours per day are dedicated
to farm activities?
(hr)
I f you had a larger farm how many
hours per day would be
dedicated to farm
acitivities?
1
Code A Code B Code D Code E 1= Head
2=Spouse
3=Son/daughter
4=Father/mother
5=Sister/brother
6=Grandchildren
7=Grandparents
8=Step children
9=Step parents
10 = Father/mother-in-
law
11 =Sister/brother-in-
law
12 = House girl
13 =Farm labourer
16=Nephew/Niece
14 = Other relative
15= Other Unrelated
1= Married-
monogamous
2= Married polygamous
3= Single
4= Divorced/separated
5= Widow/widower
0= None
1= Farming (crop + livestock)
2= Casual labour on-other farm
3= Casual labour off-farm
4= Self-employed off-farm
5= Salaried employment (civil
servant etc)
6=Student/school
77= Other (Specify)______
1= Part time
2= Fulltime
3=Does not work on farm

71
Questionnaire number (adda_hhid) ____________________
5
MODULE 2: LAND HOLDING IN ACRES (period between 1st Oct 2015 and 30th Sep 2016)
2.1. How much land do you own in acres? ________________
2.2. How much of your total land is under homestead? _______________
2.3. Do you have a title deed for your land? ___________Yes=1 (all land), No=0 (no land), Partly=3
Land category Short rain season (Oct-Nov 2015)
Long rain season (Mar-Apr 2016)
Cultivated Fallow Cultivated Fallow
1. Own land (A)
2. Rented in (B)
3. Rented out (C)
4. Total irrigated land
2.4. What is the average cost of renting land per acre (Ksh/per year)? _________

72
Questionnaire number (adda_hhid) ____________________
6
CODES FOR MODULE 3 Codes A
1 Maize
2 Rice
3 Sorghum
4 Millet
5 Cassava
6 KK 15 Beans
7 Other Field beans
8 Bananas
9 Cabbage
10 Cowpea
11 Groundnut
12 Soybean
13 Sweet potatoes
14 Orange Fleshed Sweet
Potatoes (OFSP)
15 Black night shade
16 Sugarcane
17 Pineapple
18 Jute Mallow (Omutere)
19 Amaranthas leaves (Emboga)
20 Pumpkin leaves
21 Sukuma wiki (Kales)
22 Carrots
23 Passion Fruit
24 Irish potato
25 Bean leaves
26 Tea
27 Onion
29 Coffee
30 Napier grass
31 Avocado
32 Spider Plant
33 Vine Spinache
34 Pumpkin
35 Trees
36 Mangoes
37 Guava
38 Wheat
39 Paw Paw
40 Tomatoes
41 Loquat
42 Green grams
43 Tree Tomato
44 Strawberry
45 Spring Onion
46 Desmodium
47 Spinach
48 Arrow Roots
49 Green Peas
50 Physallis/Gooseberry
51 Corriander
52 Capsicum
53 Pepper
54 Grass
55 Butternut
56 Lemon
57 Beetroot
58 Cumcumber
59 Water melon
60 Tree Seedlings
61 Raspberry
63 Pyrethrum
64 Cowpea Leaves
77 Other__________________
78 Other__________________
79 Other___________________
Codes B 0. Local
1. Improved
2. Mixture
Codes C 1. Kilogram
2. Litre
3. 90 Kg bag (40 Gorogoro)
4. 50 Kg bag
5. 25 Kg bag
6. Gorogoro (2.25 kg)
7. Debe (18 kg/ 8 Gorogoro)
8. Wheelbarrow
9. Ox-cart
10. Bunch (bananas)
11. Piece/number
12. Not yet harvested (for perennials
only)
13. Stools
14. Glass (250 gr)
15. Suckers
16. Bucket
17. Ml
18. Spoonful
19. 5 kg bag
20. 10 kg Bag
22. Yellow paper bag
23. Grams
24. Pick up
25. Trees
26. Green paper bag
27. Lines
28. Packet (250g)
29. Crates
30. Bundle
31. Handful
32. Cuttings
33. Vines
35. Lorry
36. Seeds
37. Bushes
38. 45kg bag
39. Bottle top
40. Seedlings
41. Tonne
42. 500 Ml glass
45. Cobs
46. Poles
47. Crop failure
48. Black paper bag
77 Other (specify)________
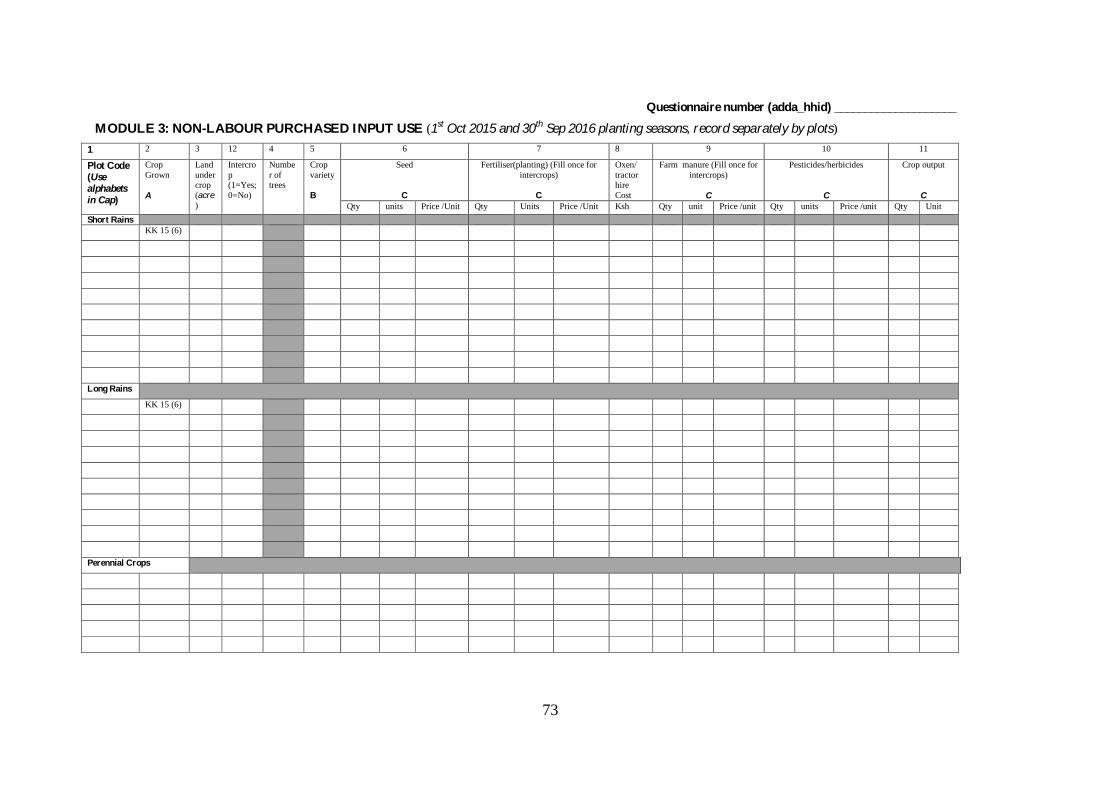
73
Questionnaire number (adda_hhid) ____________________
7
MODULE 3: NON-LABOUR PURCHASED INPUT USE (1st Oct 2015 and 30th Sep 2016 planting seasons, record separately by plots)
1 2 3 12 4 5 6 7 8 9 10 11
Plot Code (Use alphabets in Cap)
Crop
Grown
A
Land
under crop
(acre)
Intercro
p (1=Yes;
0=No)
Numbe
r of trees
Crop
variety
B
Seed
C
Fertiliser(planting) (Fill once for
intercrops)
C
Oxen/
tractor hire
Cost
Farm manure (Fill once for
intercrops)
C
Pesticides/herbicides
C
Crop output
C
Qty units Price /Unit Qty Units Price /Unit Ksh Qty unit Price /unit Qty units Price /unit Qty Unit
Short Rains
KK 15 (6)
Long Rains
KK 15 (6)
Perennial Crops

74
Questionnaire number (adda_hhid) ____________________
8
CODES FOR MODULE 4 (period between 1st Oct 2015 and 30th Sep 2016)
Codes A 1 Maize
2 Rice
3 Sorghum
4 Millet
5 Cassava
6 KK 15 Beans
7 Other Field beans
8 Bananas
9 Cabbage
10 Cowpea
11 Groundnut
12 Soybean
13 Sweet potatoes
14 Orange Fleshed Sweet
Potatoes (OFSP)
15 Black night shade
16 Sugarcane
17 Pineapple
18 Jute Mallow (Omutere)
19 Amaranthas leaves
(Emboga)
20 Pumpkin leaves
21 Sukuma wiki (Kales)
22 Carrots
23 Passion Fruit
24 Irish potato
25 Bean leaves
26 Tea
27 Onion
29 Coffee
30 Napier grass
31 Avocado
32 Spider Plant
33 Vine Spinache
34 Pumpkin
35 Trees
36 Mangoes
37 Guava
38 Wheat
39 Paw Paw
40 Tomatoes
41 Loquat
42 Green grams
43 Tree Tomato
44 Strawberry
45 Spring Onion
46 Desmodium
47 Spinach
48 Arrow Roots
49 Green Peas
50 Physallis/Gooseberry
51 Corriander
52 Capsicum
53 Pepper
54 Grass
55 Butternut
56 Lemon
57 Beetroot
58 Cumcumber
59 Water melon
60 Tree Seedlings
61 Raspberry
63 Pyrethrum
64 CowPea Leaves
77 Other__________________
78 Other__________________
79 Other___________________
Codes C 1. Kilogram
2. Litre
3. 90 Kg bag (40 Gorogoro)
4. 50 Kg bag
5. 25 Kg bag
6. Gorogoro (2.25 kg)
7. Debe (18 kg/ 8 Gorogoro)
8. Wheelbarrow
9. Ox-cart
10. Bunch (bananas)
11. Piece/number
12. Not yet harvested (for
perennials only)
13. Stools
14. Glass
15. Suckers
16. Bucket
17. Ml
18. Spoonful
19. 5 kg bag
20. 10 kg Bag
22. Yellow paper bag
23. Grams
24. Pick up
25. Trees
26. Green paper bag
27. Lines
28. Packet (250g)
29. Crates
30. Bundle
31. Handful
32. Cuttings
33. Vines
35. Lorry
36. Seeds
37. Bushes
38. 45kg bag
39. Bottle top
40. Seedlings
41. Tonne
42. 500 Ml glass
45. Cobs
46. Poles
47. Crop failure
48. Black paper bag
77 Other (specify)________
Codes D 1. Farm gate
2. Village market
3. Main market
4. Collection center
77. Other (specify)_________
Codes E 1. Own bicycle
2. Bodaboda
3. Hired truck
4. PSV
5. Donkey/oxen
6. Walking
7. Own truck
8. Taxi
77 Other (sp.)
99. NA Code F
1. Male household head
2. Female household head
3. Female spouse
4. Joint decision
5. Male spouse
77 Other (specify)___________

75
Questionnaire number (adda_hhid) ____________________
9
MODULE 4: CROP UTILIZATION (in the period between 1st Oct 2015 and 30th Sep 2016) 1 2 3 4 5 6 7 8 9 11 10 12 13 14
Crop
Code A
(Aggregated
crop)
Total Crop Output
(Enter the total crop
output from the
plots)
Consumption Saved as seed Gift, tithe,
donations, paid as
wages
Stored Quantity sold Price Point of
most
sales
D
Main
Mode of
transport
E
Travel
time to
the point
of sale
(minutes)
Who
mostly
decides
revenue
use?
F
Who
mostly
decides
technology
use e.g.
variety
F
Who mostly
decides how
much of the
total output is
consumed by
the household?
F
Qty Unit
C
Qty Unit
C
Qty Unit
C
Qty Unit
C
Qty Unit
C
Qty Unit
C
Ksh Unit
C
Short rain
KK 15 (6)
Long rain
KK 15 (6)
Perennial crop

76
Questionnaire number (adda_hhid) ____________________
10
4.1 How easily can you access the market for sale of your produce (crop and or livestock)? (Circle the applicable) 1. Very easy 2. Easy 3.Difficult 4. Very difficult
4.2 Rank three most important market access constraints, if there exists any (Prompt Codes G below) 1._________________2._________________3.________________
Codes G:1. Poor infrastructure 2. Distant markets 3. Poor market prices 4. Cheating on quality standards/weighing scales 5.Lack of contracts or reliable buyers 6.Exploitative middlemen
77. Other (specify): _________________
4.7 In the last one year did you order: 1 KK15 ____ (1.Yes; 0. No); 2. Kuroiler chicken ____ (1.Yes; 0. No);
I f the respondent is not growing KK 15 beans, skip to module 5 4.3 How easily can you market your KK15/beans? (Circle the applicable) 1. Very easy 2. Easy 3. Difficult 4. Very difficult
4.4 What is the MAIN REASON for your answer in 4.3 above (Circle the applicable) 1. Distance to market 2. Colour of beans 3. Prices 4. Yield 5. Taste 6. Pest and disease resistance 7. Cooking quality 8. Nutritional value
77. Others (specify)___________ -99 N/A
4.5 When did you first order the KK15 bean seed? Date __________________ Month______________
4.6 When did you receive KK 15 seeds for the first order? Date__________________ Month__________________
MODULE 5: LABOUR INPUTS (01.Oct 2015 to 30. Sept 2016 planting seasons, record total man hours worked by plot) 1 2 3 4 5
Plot code Plot size
in acres
Plot manager
(F=0, M=1; Joint=3)
Ploughing & harrowing Planting & thinning Applying fertiliser, Pesticide application (1st and 2nd) Weeding
(1st and 2nd ) Harvesting /Threshing/shelling/bagging
Family Hired
Short Rains
A
B
C
D
E
F
G
H
Long Rains
A
B
C
D
E
F
G
H
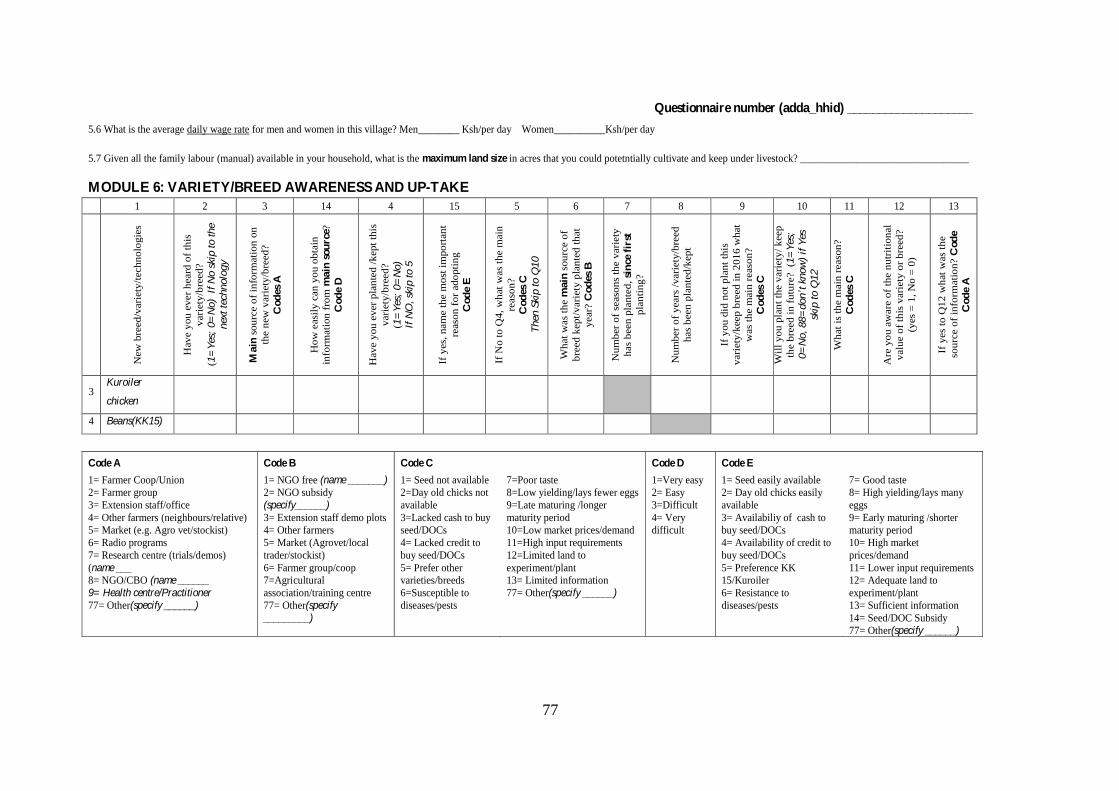
77
Questionnaire number (adda_hhid) ____________________
11
5.6 What is the average daily wage rate for men and women in this village? Men________ Ksh/per day Women__________Ksh/per day
5.7 Given all the family labour (manual) available in your household, what is the maximum land size in acres that you could potetntially cultivate and keep under livestock? _________________________________
MODULE 6: VARIETY/BREED AWARENESS AND UP-TAKE
1 2 3 14 4 15 5 6 7 8 9 10 11 12 13
New
bre
ed
/vari
ety
/techn
olo
gie
s
Hav
e y
ou e
ver
heard
of
this
vari
ety
/bre
ed
?
(1=
Yes;
0=
No)
If N
o s
kip
to the
nex
t te
chnolo
gy
Main
sou
rce o
f in
form
ati
on
on
the n
ew
vari
ety
/bre
ed
?
Cod
es
A
Ho
w e
asi
ly c
an
yo
u o
bta
in
info
rmati
on
fro
m m
ain
sou
rce?
Cod
e D
Hav
e y
ou e
ver
pla
nte
d /
kept
this
vari
ety
/bre
ed
?
(1=
Yes;
0=
No)
If N
O, sk
ip to 5
If y
es,
nam
e t
he m
ost
im
po
rtan
t
reaso
n f
or
ado
pti
ng
Cod
e E
If N
o t
o Q
4, w
hat
was
the m
ain
reaso
n?
Cod
es
C
Then S
kip
to Q
10
Wh
at
was
the m
ain
sou
rce o
f
bre
ed
kept/
vari
ety
pla
nte
d t
hat
year?
Codes
B
Num
ber
of
seaso
ns
the v
ari
ety
has
been p
lante
d, si
nce f
irst
pla
nti
ng
?
Nu
mb
er
of
years
/v
ari
ety
/bre
ed
has
been
pla
nte
d/k
ep
t
If y
ou
did
not
pla
nt
this
vari
ety
/keep b
reed
in
201
6 w
hat
was
the m
ain
reaso
n?
Cod
es
C
Wil
l yo
u p
lan
t th
e v
ari
ety
/ k
eep
the b
reed
in
fu
ture
?
(1=
Yes;
0=
No, 88=
don’t
know
) if Y
es
skip
to Q
12
W
hat
is t
he m
ain
reaso
n?
Cod
es
C
Are
yo
u a
ware
of
the n
utr
itio
nal
valu
e o
f th
is v
ari
ety
or
bre
ed
?
(yes
= 1
, N
o =
0)
If y
es
to Q
12 w
hat
was
the
sou
rce o
f in
form
ati
on
? C
od
e
Cod
e A
3 Kuroiler
chicken
4 Beans(KK15)
Code A Code B Code C Code D Code E
1= Farmer Coop/Union
2= Farmer group
3= Extension staff/office
4= Other farmers (neighbours/relative)
5= Market (e.g. Agro vet/stockist)
6= Radio programs
7= Research centre (trials/demos)
(name ___
8= NGO/CBO (name ______ 9= Health centre/Practitioner 77= Other(specify ______)
1= NGO free (name _______) 2= NGO subsidy
(specify______) 3= Extension staff demo plots
4= Other farmers
5= Market (Agrovet/local
trader/stockist)
6= Farmer group/coop
7=Agricultural
association/training centre
77= Other(specify _________)
1= Seed not available
2=Day old chicks not
available
3=Lacked cash to buy
seed/DOCs
4= Lacked credit to
buy seed/DOCs
5= Prefer other
varieties/breeds
6=Susceptible to
diseases/pests
7=Poor taste
8=Low yielding/lays fewer eggs
9=Late maturing /longer
maturity period
10=Low market prices/demand
11=High input requirements
12=Limited land to
experiment/plant
13= Limited information
77= Other(specify ______)
1=Very easy
2= Easy
3=Difficult
4= Very
difficult
1= Seed easily available
2= Day old chicks easily
available
3= Availabiliy of cash to
buy seed/DOCs
4= Availability of credit to
buy seed/DOCs
5= Preference KK
15/Kuroiler
6= Resistance to
diseases/pests
7= Good taste
8= High yielding/lays many
eggs
9= Early maturing /shorter
maturity period
10= High market
prices/demand
11= Lower input requirements
12= Adequate land to
experiment/plant
13= Sufficient information
14= Seed/DOC Subsidy
77= Other(specify ______)

78
Questionnaire number (adda_hhid) ____________________
12
MODULE 7: VARIETY/BREED ATTRIBUTES, KNOWLEDGE & PERCEPTION Instructions: Only ask the following questions to farmers who have ever heard or grown or kept the new technologies (listed below).
If Yes, ask for his/her perception of the performance of the technology (ies) against the listed attributes compared to his/her preferred local variety /breed. Please mark the respondent’s response with a tick in the appropriate cells below. If No, skip to the next module.
1 2 3
Kuroiler chicken Beans (KK15)
Do you know the attributes of the following
technologies? Yes=1 No=0
_________ If No Skip to the next technology, IF Yes ask for the attributes
_________ If No Skip to the next technology, IF Yes ask for the attributes
Technology attributes Better Worse No difference Don’ t know Better Worse No difference Don’ t know
1 Early maturity
2 Yield
3 Pest and disease resistance
4 Marketability (demand)
5 Cost of planting materials
6 Market price received
7 Cost of day old chicks
8 Taste
9 Lays more eggs
7.8 How easily can you market your Kuroiler chicken? (Circle the applicable) 1. Very easy 2. Easy 3.Difficult 4. Very difficult 88. DNK
7.9 How easily can you market your Kuroiler eggs? (Circle the applicable) 1. Very easy 2. Easy 3.Difficult 4. Very difficult 88. DNK
7.10 What is the MAIN REASON for your answer in 7.8 above (Circle the applicable) 1.Early maturity 2.Pest and disease resistance 3.Maketability 4.Market price received 5. Cost of day old chicks 6. Taste 7. Lay more eggs 77.Others (specify) -99 N/A
7.11 What is the MAIN REASON for your answer in 7.9 above (Circle the applicable) 1. Taste 2 Price 3. Size 4. Colour of the yolk -99 N/A
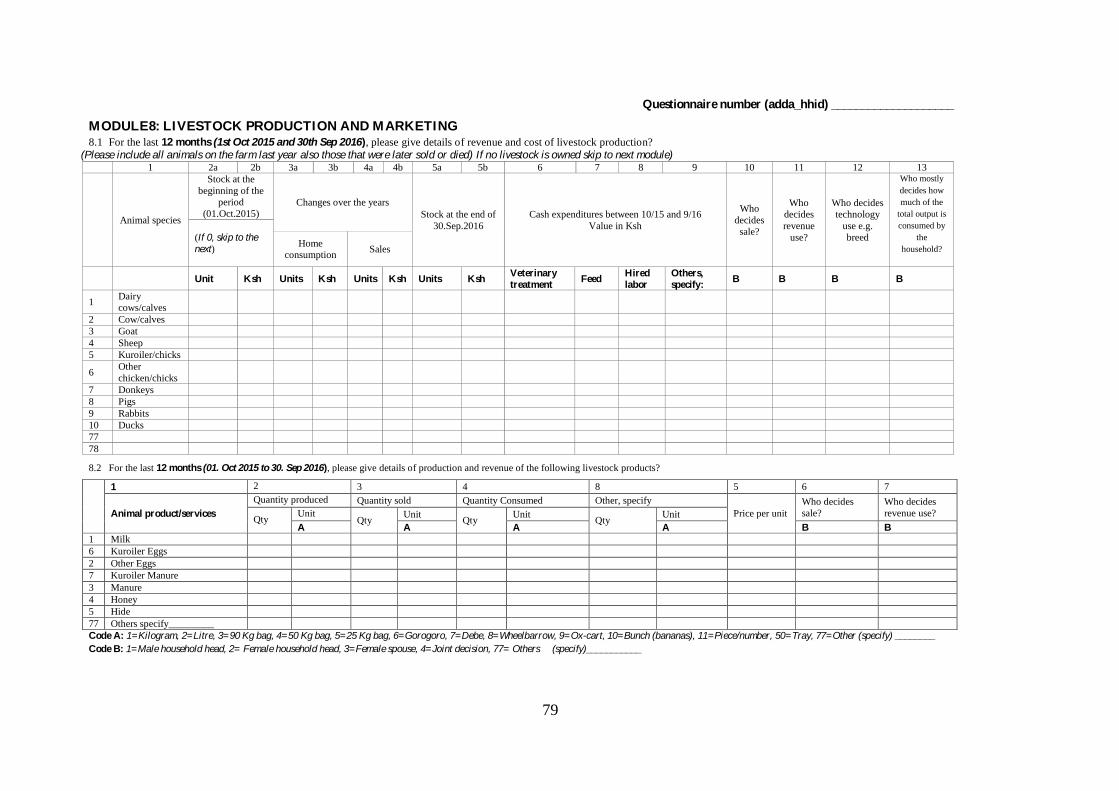
79
Questionnaire number (adda_hhid) ____________________
13
MODULE8: LIVESTOCK PRODUCTION AND MARKETING 8.1 For the last 12 months (1st Oct 2015 and 30th Sep 2016), please give details of revenue and cost of livestock production?
(Please include all animals on the farm last year also those that were later sold or died) If no livestock is owned skip to next module) 1 2a 2b 3a 3b 4a 4b 5a 5b 6 7 8 9 10 11 12 13
Animal species
Stock at the
beginning of the
period
(01.Oct.2015) Changes over the years
Stock at the end of
30.Sep.2016
Cash expenditures between 10/15 and 9/16
Value in Ksh
Who
decides
sale?
Who
decides
revenue
use?
Who decides
technology
use e.g.
breed
Who mostly
decides how
much of the
total output is
consumed by
the
household?
(If 0, skip to the next)
Home
consumption Sales
Unit Ksh Units Ksh Units Ksh Units Ksh Veterinary treatment
Feed Hired labor
Others, specify:
B B B B
1 Dairy
cows/calves
2 Cow/calves
3 Goat
4 Sheep
5 Kuroiler/chicks
6 Other
chicken/chicks
7 Donkeys
8 Pigs
9 Rabbits
10 Ducks
77
78
8.2 For the last 12 months (01. Oct 2015 to 30. Sep 2016), please give details of production and revenue of the following livestock products?
Code A: 1=Kilogram, 2=Litre, 3=90 Kg bag, 4=50 Kg bag, 5=25 Kg bag, 6=Gorogoro, 7=Debe, 8=Wheelbarrow, 9=Ox-cart, 10=Bunch (bananas), 11=Piece/number, 50=Tray, 77=Other (specify) ________
Code B: 1=Male household head, 2= Female household head, 3=Female spouse, 4=Joint decision, 77= Others (specify)___________
1 2 3 4 8 5 6 7
Animal product/services
Quantity produced Quantity sold Quantity Consumed Other, specify
Price per unit
Who decides
sale?
Who decides
revenue use? Qty
Unit Qty
Unit Qty
Unit Qty
Unit
A A A A B B 1 Milk
6 Kuroiler Eggs
2 Other Eggs
7 Kuroiler Manure
3 Manure
4 Honey
5 Hide
77 Others specify_________

80
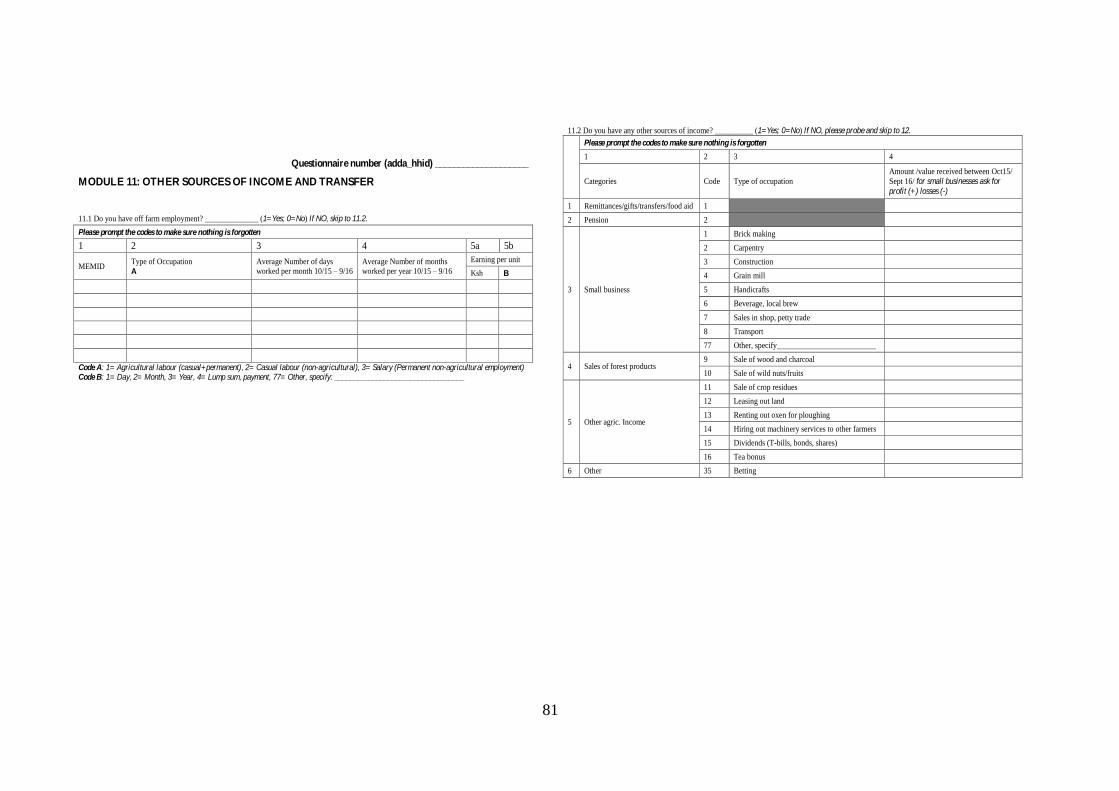
81
Questionnaire number (adda_hhid) ____________________
15
MODULE 11: OTHER SOURCES OF INCOME AND TRANSFER
11.1 Do you have off farm employment? ______________ (1=Yes; 0=No) If NO, skip to 11.2.
Please prompt the codes to make sure nothing is forgotten
1 2 3 4 5a 5b
MEMID Type of Occupation
A
Average Number of days
worked per month 10/15 – 9/16
Average Number of months
worked per year 10/15 – 9/16
Earning per unit
Ksh B
Code A: 1= Agricultural labour (casual+permanent), 2= Casual labour (non-agricultural), 3= Salary (Permanent non-agricultural employment) Code B: 1= Day, 2= Month, 3= Year, 4= Lump sum, payment, 77= Other, specify: __________________________________
11.2 Do you have any other sources of income? __________ (1=Yes; 0=No) If NO, please probe and skip to 12.
Please prompt the codes to make sure nothing is forgotten
1 2 3 4
Categories Code Type of occupation
Amount /value received between Oct15/
Sept 16/ for small businesses ask for profit (+) losses (-)
1 Remittances/gifts/transfers/food aid 1
2 Pension 2
3 Small business
1 Brick making
2 Carpentry
3 Construction
4 Grain mill
5 Handicrafts
6 Beverage, local brew
7 Sales in shop, petty trade
8 Transport
77 Other, specify__________________________
4 Sales of forest products 9 Sale of wood and charcoal
10 Sale of wild nuts/fruits
5 Other agric. Income
11 Sale of crop residues
12 Leasing out land
13 Renting out oxen for ploughing
14 Hiring out machinery services to other farmers
15 Dividends (T-bills, bonds, shares)
16 Tea bonus
6 Other 35 Betting

82
Questionnaire number (adda_hhid) ____________________
16
MODULE 12: NON-FOOD EXPENDITURE
Consider the last year (Oct 15 - Sept 16) generally how much has your HH spent
on the items listed in a typical year (see specification indicated for each item)?
1 2
Read out: Please exclude Business
Expenditures How much did your household spend on
[ITEM/SERVICE] during the last year
(Oct. 15 – Sept 16)? Enter 88, if respondent does not know.
Value in Khs
Non
-food
1 Rent (housing)
2 Personal care supplies
3 Clothes, shoes and bags, accessories
4 Detergent/washing powder
5 Electricity
6 Other non-food
Tra
nsp
ort
ati
on
+
com
mu
nic
ati
on 7
Fuel, maintenance, insurance, and tax
for motorbike/car
8 Public transport
9 Airtime (incl. MPESA)
10 Other transportation, communication
11
12
Ed
uca
tion
13 School fees, books, Student’s
dress/uniform, Tuition and rental fee
14 Other cost of schooling
15
16
Hea
lth
17 Medicine, doctor fees
18 Other health cost
19
20
Soci
al
21 Celebration and funeral cost
22 Recreation and entertainment
23 Contributions (eg. Church, groups)
24 Tobacco (incl. snuff and miraa)
25 Insurance (eg. Car, life, health)
26 Remittances transferred to other HH
27 Other social cost
28
29
MODULE 13: INFORMATION ON CREDIT ACCESS
13.1 Could you obtain credit if you needed it for the purpose of operational
agricultural expenses (e.g. buying fertilizer paying for labour etc.)?
____________________1=Yes, 0=No
13.2 During the last 12 months (Oct15 to Sep16), have you or any other
household member received any credit to buy inputs, or received inputs on
credit?_________________1=Yes, 0=No
13.3 If yes to 13.2, how much did you receive in Ksh? (___________________)
(Include the value of inputs if inputs are provided on credit)
13.4 How much went into purchasing inputs? (_______________)
(Include the value of inputs if inputs are provided on credit)
MODULE 15: ACCESS TO SOCIOECONOMIC INFRASTRUCTURE 1 2 3
Social facilities Distance to the nearest (km)
Most frequently used means of transportation to the facility (Use codes A below)
1. Murram road
2. Tarmac road
3. Village market
4. Main Agricultural input
market
5. Main agricultural product
market
6. Health centre
7. Agric. Extension agent
Code A: Means of transport Codes 1= Bicycle; 2= Motorbike; 3= Car; 4= Walk;
77= Others, (specify) ________

83
Questionnaire number (adda_hhid) ____________________
18
TARGET PERSON: GROUP MEMBER
Respondent MEMID: __________________________
MODULE 18: SOCIAL CAPITAL ENDOWMENT 18.1 List all the groups you belong to (Start with the sampled group)
1 2 3 4 8 9 10 11
Group Name Group
Type
Please name
the most
important
group
function
Year
joined
Participation
in meetings in
the reference
period (Oct
15/Sep16)
Your
own role
in the
group
Did the group receive
any agricultural
training during the
reference period
(Oct15/Sept16)
Yes= 1; N0= 0
Who
offered the
training?
AH= 1;
Other= 0,
AH+other=
2, DNK= 88
A B D E
In case sampled group was not named in table above, answer 18.9, 18.10 and 18.11, otherwise skip to 18.2.
18.9 Are you still a member of the sampled group (NAME)? ________________ (Yes= 1; No= 0)
18.10 If no: Please shortly explain why you left the group: _______________________________________________________________
18.11 In case, you received agricultural training from Africa Harvest in the sampled group: Who mostly informed you about the single training
session (time and place)? _____________________________________ (1= Group leader, 2= Other members, 3= Extension officer, 4= He was
not informed, 77= Other, specify: _______________, -99= N/A)
18.2. Do you personally exchange information with the local authorities/gov’t agencies? ______ (1= Yes; 0= No)
18.6 Do you hold any of the other following positions: ________________________________________________ (Multiple answers possible)
(0=No, 1= Village chief, 2= Village elder, 3= Nyumbakumi, 4= Religious leader, 77= Other_______________)
18.7 Are you a close relative to one of the mentioned positions (1=Yes; 0=No) ___________
18.8 If yes: Name position and relative: a. Position: _________ (Code 18.6) Relative _______ F
b. Position: _________ (Code 18.6) Relative _______ F
Codes A 1. Farmer cooperative
2. Farmers group
3. Women`s association
4. Youth association
5. Faith-based association/group
6. Funeral association/insurance
group
7. Savings and credit group
8. Community based organization
9. Water users association
10. Informal labour sharing group
11. Widow/ widower
12. Family group
77. Other (______)
Codes B 1. Produce marketing
2. Input access or
marketing
3. Seed production
4. Farmer research
5. Savings and credit
6. Welfare/funeral activities
7. Tree planting/Nursery
8. Soil & Water
conservation
9. Faith-based organization
10. Input credit
77. Other (______)
Codes D 1. Always
2. Sometimes
3. Rarely
4. Never
Codes E 1. Official
2. Ex-official
3. Ordinary
member
Code F
1. Parent
2. Spouse
3. Child
4. Brother/sister
5. Grandparent
6. Grandchild
7. Nephew/Nice
8. Uncle/Aunt
9. Cousin
10. Mother/father in low
11. Brother/Sister-in law
12. Other relative
13. Neighbour
14. Friend
15. Fellow villager
16. Attend same church/mosque
17. Business colleague
77. Other, specify _________

84
Questionnaire number (adda_hhid) ____________________
22
MODULE 19: SOCIAL NETWORKS
Code A 1 Parent 11 Brother/Sister-in
law
2 Spouse 12 Other relative
3 Child 13 Neighbour
4 Brother/sister 14 Friend
5 Grandparent 15 Fellow villager
6 Grandchild 16 Attend same
church/mosque
7 Nephew/Nice 17 Business
colleague
8 Uncle/Aunt 77 Other, specify___
9 Cousin
10
Mother/father in low
Questionnaire number (adda_hhid) ____________________
23
19.1. General information about each group member
1 2 3 4 5 6 7 8 9 32
MEM ID Name of the group
member
Do you know
NAME?
(1=Yes; 0=No), (-99=N/A)
Please
specify
your
relations
hip to
NAME
A
Is
NAME’
s plot
borderin
g yours?
(1=Yes; 0=No)
Do you
know
the kind
of crops
NAME
grows?
(1=Yes; 0=No)
Do you
know
the kind
of
livestoc
k
NAME
keeps?
(1=Yes; 0=No)
Did you lend or borrow any
of the following production
means from NAME
between Oct15 and Sept16?
0=no
1=lend
2=borrow
3=lend &borrow
Do you
exchange
/ share
food
items?
(1=Yes; 0=No)
Seeds
Agric.
Produce
1
2
3
4
5
6
7
8
9
10
11
12
13
14
15
16
17
18
19
20
21
22
23
24
25
26
27
28
29
30
31
32
33
34
35
36
37
38
39
40
Questionnaire number (adda_hhid) ____________________
23
19.1. General information about each group member
1 2 3 4 5 6 7 8 9 32
MEM ID Name of the group
member
Do you know
NAME?
(1=Yes;
0=No), (-
99=N/A)
Please
specify
your
relations
hip to
NAME
A
Is
NAME’
s plot
borderin
g yours?
(1=Yes
; 0=No)
Do you
know
the kind
of crops
NAME
grows?
(1=Yes;
0=No)
Do you
know
the kind
of
livestoc
k
NAME
keeps?
(1=Yes
; 0=No)
Did you lend or borrow any
of the following production
means from NAME
between Oct15 and Sept16?
0=no
1=lend
2=borrow
3=lend &borrow
Do you
exchange/
share food
items?
(1=Yes;
0=No)
Seeds
Agric.
Produce
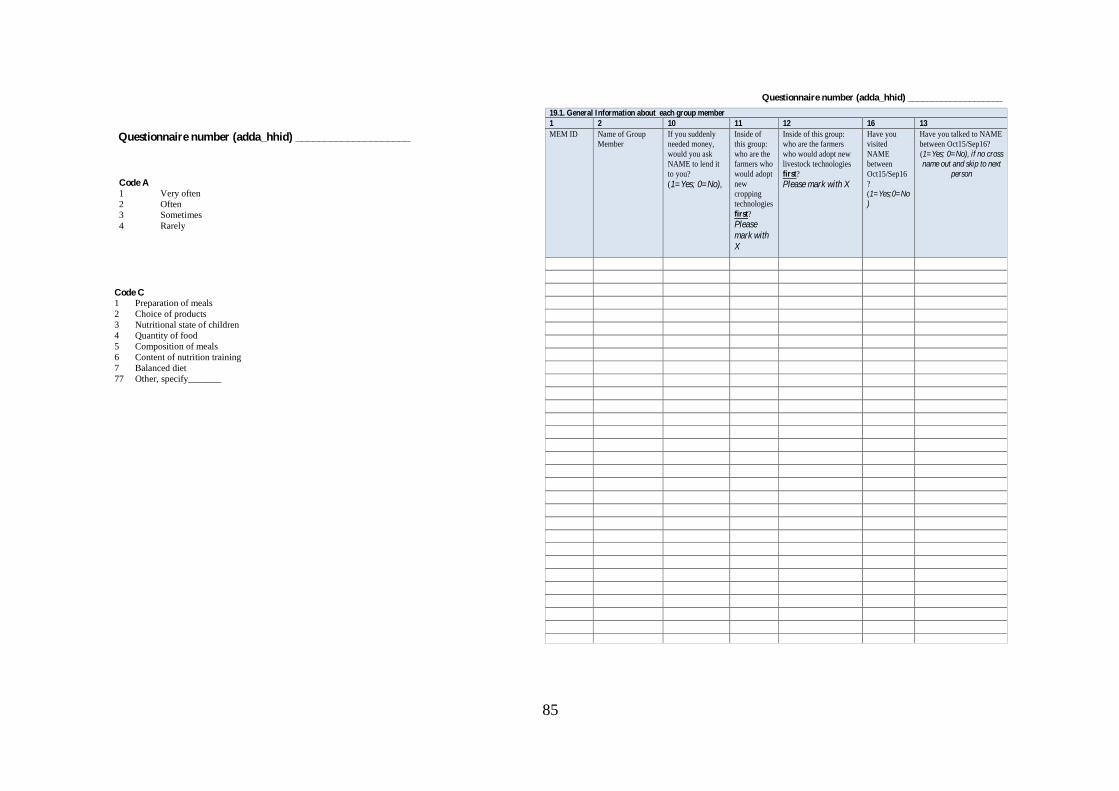
85
Questionnaire number (adda_hhid) ____________________
26
Code C 1 Preparation of meals
2 Choice of products
3 Nutritional state of children
4 Quantity of food
5 Composition of meals
6 Content of nutrition training
7 Balanced diet
77 Other, specify_______
Code A 1 Very often
2 Often
3 Sometimes
4 Rarely
Questionnaire number (adda_hhid) ____________________
23
19.1. General information about each group member
1 2 3 4 5 6 7 8 9 32
MEM ID Name of the group
member
Do you know
NAME?
(1=Yes; 0=No), (-99=N/A)
Please
specify
your
relations
hip to
NAME
A
Is
NAME’
s plot
borderin
g yours?
(1=Yes; 0=No)
Do you
know
the kind
of crops
NAME
grows?
(1=Yes; 0=No)
Do you
know
the kind
of
livestoc
k
NAME
keeps?
(1=Yes; 0=No)
Did you lend or borrow any
of the following production
means from NAME
between Oct15 and Sept16?
0=no
1=lend
2=borrow
3=lend &borrow
Do you
exchange
/ share
food
items?
(1=Yes; 0=No)
Seeds
Agric.
Produce
1
2
3
4
5
6
7
8
9
10
11
12
13
14
15
16
17
18
19
20
21
22
23
24
25
26
27
28
29
30
31
32
33
34
35
36
37
38
39
40
Questionnaire number (adda_hhid) ____________________
25
19.1. General Information about each group member
1 2 10 11 12 16 13
MEM ID Name of Group
Member
If you suddenly
needed money,
would you ask
NAME to lend it
to you? (1=Yes; 0=No),
Inside of
this group:
who are the
farmers who
would adopt
new
cropping
technologies
first?
Please mark with
X
Inside of this group:
who are the farmers
who would adopt new
livestock technologies
first?
Please mark with X
Have you
visited
NAME
between
Oct15/Sep16
?
(1=Yes;0=No)
Have you talked to NAME
between Oct15/Sep16?
(1=Yes; 0=No), if no cross name out and skip to next
person

86
Questionnaire number (adda_hhid) ____________________
27
!
19.1. Specific interaction within the farmer group (remind respondent of nutrition definition)
1 2 14 17 18 19 23 24
ME
M
ID
Name of the Group
Member
How often
did you talk
with NAME
between
Oct15/Sep1
6?
A
Did you share
information on
nutrition with
NAME?
(1=Yes;0=No) If no skip to 19
Name the
specific
nutrition
topic you
mostly
talked about
with
NAME
C
Did you share
information on
agriculture with
NAME
between
Oct15/Sept16?
(1=Yes; 0=No),
if no, skip to next person
Did you
share
information
on Kuroiler
chicken
with
NAME?
(1=Yes; 0=No)
Did you share
information on
beans (KK 15)
with NAME?
(1=Yes; 0=No)
Questionnaire number (adda_hhid) ____________________
28
PLEASE USE THE 8 DIGIT MEMID (SEE GROUPLIST)
25. Who do you think is the most informed person among the group members concerning nutrition information?
_____________________ MEMID
26. Who do you think is the most informed person among the group members concerning agricultural information?
_____________________ MEMID
27. Why did you decide to become a group member? Give reason ___________________________________________
28. Were you asked by another member to join the group ________ (Yes=1, No=0)
29. If yes: By whom? _________ ? MEMID
30. Have you introduced new people to this group? _____ (Yes=1, No=0)
31. If yes: Whom? MEMID__________ MEMID__________ MEMID__________
33. Please consider a situation where an organization offers agricultural training to your group.
However, the agricultural extension officers will only train 3 persons of your group. These persons are supposed
to forward the information to the group.
Who do you think are the 3 most suitable persons of your group for this purpose?
MEMID__________ MEMID__________ MEMID__________
34. Do you like this approach or would you prefer that all group members should be able to participate in the training?
1=only 3 persons, 2= all group members
35. Now imageine the same situation, but the organization offers nutrition training to your group.
However, the NGO will only train 3 persons of your group,
Who do you think are the 3 most suitable persons of your group for this purpose?
MEMID__________ MEMID__________ MEMID__________
36. Do you like this approach or would you prefer that all group members should be able to participate in the training?
___ 1=only 3 persons, 2= all group member
Questionnaire number (adda_hhid) ____________________
23
19.1. General information about each group member
1 2 3 4 5 6 7 8 9 32
MEM ID Name of the group
member
Do you know
NAME?
(1=Yes; 0=No), (-99=N/A)
Please
specify
your
relations
hip to
NAME
A
Is
NAME’
s plot
borderin
g yours?
(1=Yes; 0=No)
Do you
know
the kind
of crops
NAME
grows?
(1=Yes; 0=No)
Do you
know
the kind
of
livestoc
k
NAME
keeps?
(1=Yes; 0=No)
Did you lend or borrow any
of the following production
means from NAME
between Oct15 and Sept16?
0=no
1=lend
2=borrow
3=lend &borrow
Do you
exchange
/ share
food
items?
(1=Yes; 0=No)
Seeds
Agric.
Produce
1
2
3
4
5
6
7
8
9
10
11
12
13
14
15
16
17
18
19
20
21
22
23
24
25
26
27
28
29
30
31
32
33
34
35
36
37
38
39
40

87
Questionnaire number (adda_hhid) ____________________
29
19.2. SPECIFIC INTERACTIONS OUTSIDE THIS COMMON INTEREST GROUP
19.2.1 Please name the persons outside of your common interest group you most frequently exchanged information about nutrition between Oct15/Sept16. Please name a
maximum of 5 persons: OUT ID 1 OUT ID 2 OUT ID 3 OUT ID 4 OUT ID 5 _________________
19.2.2 Please name the persons outside of your common interest group you most frequently exchanged information about agriculture between Oct15/Sept16. Please name a
maximum of 5 persons: OUT ID 6 OUT ID 7 OUT ID 8 OUT ID 9 OUT ID 10 _
12. Who do you think is the most informed person among the ones named concerning nutrition information? OUT ID
13. Who do you think is the most informed person among the ones named concerning agriculture information? OUT ID
ID Section
1 2 3 4 6 9 10 12 11
OUT ID Name NAME’s
gender
Male=1, female=0
Please specify
your
relationship to
NAME
A
How often
did you talk
with NAME
between
Oct15/Sep16?
B
Did you lend or borrow any of the following
production means from NAME between
Oct15 and Sept16?
0=no
1=lend
2=borrow
3=lend &borrow
Do you exchange/
share food items?
(1=Yes; 0=No)
If you suddenly needed
money, would you ask
NAME to lend it to you? (1=Yes; 0=No)
Seeds Agric. Produce
40
40
40
40
40
40
40
40
40
40
Code A Code B 1 Parent 6 Grandchild 11 Brother/Sister-in law 16 Attend same church/mosque 1 Very often
2 Spouse 7 Nephew/Nice 12 Other relative 17 Business colleague 2 Often
3 Child 8 Uncle/Aunt 13 Neighbour 77 Other, specify___ 3 Sometimes
4 Brother/sister 9 Cousin 14 Friend 4 Rarely
5 Grandparent 10 Mother/father in low 15 Fellow villager
Related Documents