Communicable Diseases Intelligence Volume 34 Number 3 Quarterly report September 2010 Annual reports 157 Australia’s notifiable disease status, 2008: Annual report of the National Notifiable Diseases Surveillance System NNDSS Annual Report Writing Group 225 Arboviral diseases and malaria in Australia, 2008–09: Annual report of the National Arbovirus and Malaria Advisory Committee Gerard J Fitzsimmons, Phil Wright, Cheryl A Johansen, Peter I Whelan and the National Arbovirus and Malaria Advisory Committee 241 Immunisation coverage annual report, 2008 Brynley P Hull, Deepika Mahajan, Aditi Dey, Rob I Menzies, Peter B McIntyre 259 Annual report: surveillance of adverse events following immunisation in Australia, 2009 Deepika Mahajan, Ilnaz Roomiani, Michael S Gold, Glenda L Lawrence, Peter B McIntyre, Rob I Menzies 277 Annual report of the Australian National Poliovirus Reference Laboratory, 2009 Jason A Roberts, Linda Hobday, Sophie Polychronopoulos, Aishah Ibrahim, Bruce R Thorley 285 Australian Paediatric Surveillance Unit annual report, 2008 and 2009 Yvonne Zurynski, Elizabeth Davey, Elizabeth J Elliott 291 Annual report of the Australian Meningococcal Surveillance Programme, 2009 The Australian Meningococcal Surveillance Programme Peer-reviewed articles 303 Antiviral distribution data – a potential syndromic surveillance system to assist pandemic health service operational planning Andrew SC Way, David N Durrheim, Tony Merritt, Hassan Vally 310 Evaluating the utility of Emergency Department syndromic surveillance for a regional public health service Kirsty G Hope, Tony D Merritt, David N Durrheim, Peter D Massey, Julie K Kohlhagen, Kerry W Todd, Catherine A D’Este 319 A new national chlamydia sentinel surveillance system in Australia: Evaluation of the first stage of implementation Rebecca J Guy, Fabian Kong, Jane Goller, Neil Franklin, Isabel Bergeri, Wayne Dimech, Nicole Reilly, Elizabeth Sullivan, James Ward, John M Kaldor, Margaret Hellard, Basil Donovan, on behalf of the ACCESS collaboration 329 An outbreak of gastroenteritis due to Salmonella Typhimurium phage type 170 associated with consumption of a dessert containing raw egg Anna Reynolds, Cameron RM Moffatt, Amalie Dyda, Rebecca L Hundy, Andrew L Kaye, Radomir Krsteski, Simon Rockliff, Riemke Kampen, Paul M Kelly, Eddie D O’Brien 334 Potential exposure to Australian bat lyssavirus in South East Queensland: what has changed in 12 years? Megan K Young, Bradley J McCall Short reports 339 Zoonotic tuberculosis: on the decline Paul R Ingram, Peter Bremner, Tim J Inglis, Ronan J Murray, Debbie V Cousins 342 Penicillin-resistant Neisseria meningitidis bacteraemia, Kimberley region, March 2010 Shivanti D Abeysuriya, David J Speers, Jackie Gardiner, Ronan J Murray Quarterly reports 345 OzFoodNet quarterly report, 1 April to 30 June 2010 The OzFoodNet Working Group 355 Communicable diseases surveillance 355 Tables 365 Additional reports

Welcome message from author
This document is posted to help you gain knowledge. Please leave a comment to let me know what you think about it! Share it to your friends and learn new things together.
Transcript
Communicable Diseases Intelligence
Volume 34 Number 3 Quarterly report September 2010
Annual reports
157 Australia’s notifiable disease status, 2008: Annual report of the National Notifiable Diseases Surveillance SystemNNDSS Annual Report Wri t ing Group
225 Arboviral diseases and malaria in Australia, 2008–09: Annual report of the National Arbovirus and Malaria Advisory CommitteeGerard J Fitzsimmons, Phil Wright, Cheryl A Johansen, Peter I Whelan and the National Arbovirus and Malaria Advisory Committee
241 Immunisation coverage annual report, 2008Brynley P Hul l , Deepika Mahajan, Adi t i Dey, Rob I Menzies, Peter B McIntyre
259 Annual report: surveillance of adverse events following immunisation in Australia, 2009Deepika Mahajan, I lnaz Roomiani, Michael S Gold, Glenda L Lawrence, Peter B McIntyre, Rob I Menzies
277 Annual report of the Australian National Poliovirus Reference Laboratory, 2009Jason A Roberts, L inda Hobday, Sophie Polychronopoulos, Aishah Ibrahim, Bruce R Thorley
285 Australian Paediatric Surveillance Unit annual report, 2008 and 2009Yvonne Zurynski , E l i zabeth Davey, E l i zabeth J E l l io t t
291 Annual report of the Australian Meningococcal Surveillance Programme, 2009The Aust ra l ian Meningococcal Survei l lance Programme
Peer-reviewed articles
303 Antiviral distribution data – a potential syndromic surveillance system to assist pandemic health service operational planningAndrew SC Way, David N Durrheim, Tony Merr i t t , Hassan Val ly
310 Evaluating the utility of Emergency Department syndromic surveillance for a regional public health serviceKirs ty G Hope, Tony D Merr i t t , David N Durrheim, Peter D Massey, Jul ie K Kohlhagen, Kerry W Todd, Cather ine A D’Este
319 A new national chlamydia sentinel surveillance system in Australia: Evaluation of the first stage of implementationRebecca J Guy, Fabian Kong, Jane Gol ler, Nei l Frankl in, I sabel Berger i , Wayne Dimech, Nicole Rei l l y, E l i zabeth Sul l ivan, James Ward, John M Kaldor, Margaret Hel lard, Bas i l Donovan, on behal f of the ACCESS col laborat ion
329 An outbreak of gastroenteritis due to Salmonella Typhimurium phage type 170 associated with consumption of a dessert containing raw eggAnna Reynolds, Cameron RM Moffat t , Amal ie Dyda, Rebecca L Hundy, Andrew L Kaye, Radomir Krs tesk i , S imon Rockl i f f, R iemke Kampen, Paul M Kel ly, Eddie D O’Br ien
334 Potential exposure to Australian bat lyssavirus in South East Queensland: what has changed in 12 years?Megan K Young, Bradley J McCal l
Short reports
339 Zoonotic tuberculosis: on the declinePaul R Ingram, Peter Bremner, Tim J Ingl is , Ronan J Murray, Debbie V Cousins
342 Penicillin-resistant Neisseria meningitidis bacteraemia, Kimberley region, March 2010Shivant i D Abeysur iya, David J Speers, Jackie Gardiner, Ronan J Murray
Quarterly reports
345 OzFoodNet quarterly report, 1 April to 30 June 2010The OzFoodNet Working Group
355 Communicable diseases surveillance355 Tables365 Addi t ional repor ts
© Commonwealth of Australia 2010
ISSN 0725-3141ISSN 1445-4866 Online
This work is copyright. Apart from any use as permitted under the Copyright Act 1968, no part may be reproduced by any process without prior written permission from the Commonwealth. Requests and inquiries concerning reproduction and rights should be addressed to the Commonwealth Copyright Administration, Attorney General’s Department, Robert Garran Offi ces, National Circuit, Barton ACT 2600 or posted at http://www.ag.gov.au/cca
Communicable Diseases Intelligence aims to diseminate information on the epidemiology and control of communicable diseases in Australia. Communicable Diseases Intelligence invites contributions dealing with any aspect of communicable disease epidemiology, surveillance or prevention and control in Australia. Submissions can be in the form of original articles, short reports, surveillance summaries, reviews or correspondence. Instructions for authors can be found in Commun Dis Intell 2010;34(1):86–88.
Communicable Diseases Intelligence contributes to the work of the Communicable Diseases Network Australia (http://www.health.gov.au/cdna)
EditorIan McKay
Editorial and Production StaffAlison Milton, Mark Power, Colette O’Neill
Editorial Advisory BoardJeremy McAnulty (Chair), Scott Cameron, John Kaldor, Peter McIntyre, Paul Van Buynder, Charles Watson
Websitehttp://www.health.gov.au/cdi
Subscriptions and contactsCommunicable Diseases Intelligence is produced every quarter by:Surveillance BranchOffi ce of Health ProtectionAustralian Government Department of Health and AgeingGPO Box 9848, (MDP 6)CANBERRA ACT 2601;Telephone: +61 2 6289 2717Facsimile: +61 2 6289 2600Email: [email protected]
This journal is indexed by Index Medicus, Medline and the Australasian Medical Index
DisclaimerOpinions expressed in Communicable Diseases Intelligence are those of the authors and not necessarily those of the Australian Government Department of Health and Ageing or the Communicable Diseases Network Australia. Data may be subject to revision.
Printed by Union Offset, Canberra
CDI Vol 34 No 3 2010 157
National Notifiable Diseases Surveillance System, 2008 Annual reports
Annual reports AUSTRALIA’S NOTIFIABLE DISEASE STATUS, 2008: ANNUAL REPORT OF THE NATIONAL NOTIFIABLE DISEASES SURVEILLANCE SYSTEM
NNDSS Annual Report Writing Group
Abstract
In 2008, 65 communicable diseases and conditions were nationally notifiable in Australia. States and territories reported a total of 160,508 notifications of communicable diseases to the National Notifi-able Diseases Surveillance System, an increase of 9% on the number of notifications in 2007. In 2008, the most frequently notified diseases were sexually transmissible infections (69,459 notifications, 43% of total notifications), vaccine preventable diseases (34,225 notifications, 21% of total notifications) and gastrointestinal diseases (27,308 notifications, 17% of total notifications). There were 18,207 noti-fications of bloodborne diseases; 8,876 notifica-tions of vectorborne diseases; 1,796 notifications of other bacterial infections; 633 notifications of zoonoses and 4 notifications of quarantinable diseases. Commun Dis Intell 2010;34(3):157–225.
Keywords: Australia, communicable diseases, epidemiology, surveillance
Introduction
Australia’s notifi able diseases status, 2008, is an annual surveillance report of nationally notifi able communicable diseases. Communicable disease surveillance in Australia operates at the national, state and territory, and local levels. Primary responsibility for public health action lies with the state and territory health departments. Th e purpose of communicable disease surveillance at a national level is to:
• identify national trends and compare the rates of specifi c diseases across Australia with national averages;
• guide policy development and resource alloca-tion at a national level;
• monitor the need for and impact of national disease control programs;
• identify national or multi-jurisdictional out-breaks and coordinate a national response;
• describe the epidemiology of rare diseases in Australia;
• meet international reporting requirements, such as providing disease statistics to the World Health Organization (WHO); and
• support quarantine activities, which are the responsibility of the national government.
Methods
Australia is a federation of 6 states (New South Wales, Queensland, South Australia, Tasmania, Victoria and Western Australia) and 2 territories (the Australian Capital Territory and the North-ern Territory).
State and territory health departments collect notifi cations of communicable diseases under their public health legislation. In September 2007, the National Health Security Act 2007 1 received royal assent. Th is Act provides a legislative basis for and authorises the exchange of health infor-mation, including personal information, between jurisdictions and the Commonwealth. Th e Act provides for the establishment of the National Notifi able Diseases List, 2 which specifi es the diseases for which personal information can be shared. Th e National Health Security Agreement 2008 3 establishes operational arrangements to formalise and enhance existing surveillance and reporting systems, an important objective of the Agreement.
Under the Agreement, in 2008 states and territo-ries forwarded de-identifi ed data on the nationally agreed set of 65 communicable diseases to the Department of Health and Aging for the purposes of national communicable disease surveillance, although not all 65 diseases were notifi able in each jurisdiction. States and territories provided data
National Notifi able Diseases Surveillance System, 2008
158 CDI Vol 34 No 3 2010
Annual reports National Notifiable Diseases Surveillance System, 2008
to the National Notifi able Diseases Surveillance System (NNDSS) electronically, daily or several times a week. Th e system was complemented by other surveillance systems, which provided infor-mation on various diseases, including four that are not reported to NNDSS, namely human immu-nodefi ciency virus (HIV), acquired immune defi -ciency (AIDS) and the classical and variant forms of Creutzfeldt-Jakob disease (CJD).
In 2008, the NNDSS core dataset included the following 5 mandatory data fi elds: unique record reference number; notifying state or territory; disease code; confi rmation status and the date when the public health unit was notifi ed (noti-fi cation receive date). In addition, the following core but non-mandatory data fi elds were supplied where possible: date of birth; age at onset; sex; indigenous status; postcode of residence; disease onset date; date when the medical practitioner signed the notifi cation form (notifi cation date), death status, date of specimen collection and out-break reference number (to identify cases linked to an outbreak). Where relevant, information on the species, serogroups/subtypes and phage types of organisms isolated, and on the vaccination status of the case were collected and reported to NNDSS. Data quality was monitored by the Offi ce of Health Protection and the National Surveillance Committee (NSC) and there was a continual process of improving the national consistency of communicable disease surveillance through the daily, fortnightly and quarterly review of these data.
While not included in the core national dataset, enhanced surveillance information for some dis-eases (invasive pneumococcal disease, hepatitis C, tuberculosis and some sexually transmissible infections) were reported from states and territo-ries to NNDSS but not included in this report. Additional information concerning mortality and specifi c health risk factors for some diseases were obtained from states and territories and included in this annual report.
Newly diagnosed HIV infection and AIDS were notifi able conditions in each state or territory health jurisdiction in 2008 and these data were for-warded directly to the National HIV Registry and National AIDS Registry at the National Centre in HIV Epidemiology and Clinical Research (NCHECR). Further information can be found in NCHECR’s annual surveillance report. 4
Surveillance of the classical and variant forms of CJD in Australia has been conducted through the Australian National Creutzfeldt-Jakob Disease Registry (ANCJDR) since its establishment in October 2003. CJD is a nationally notifi able
disease and by June 2006, CJD was notifi able in all states and territories. Further surveillance information on CJD can be found in surveillance reports from the ANCJDR. 5
Information from communicable disease surveil-lance is communicated through several avenues. Th e most up-to-date information on topics of interest is provided at fortnightly teleconferences of the Com-municable Diseases Network Australia (CDNA) and a summary of these reports is available online from http://www.health.gov.au/cdnareport 6 Th e Communicable Diseases Intelligence (CDI) quarterly journal publishes surveillance data and reports of research studies on the epidemiology and control of various communicable diseases.
Notifi cation rates for each notifi able disease were calculated using the estimated 2008 mid-year resi-dent population supplied by the Australian Bureau of Statistics 7 (ABS) (Appendix 1 and Appendix 2). Where diseases were not notifi able in a state or ter-ritory, national rates were adjusted by excluding the population of that jurisdiction from the denomi-nator. For some diseases, age adjusted rates were calculated using either the direct method of stand-ardisation for gastrointestinal diseases, or indirect method for sexually transmissible infections, with 2006 census data as the standard population.
Th e 4 maps produced for this report (chlamydia, infl uenza, pertussis, Q fever) were created with ArcGIS mapping software (ESRI, Redlands, CA) and based on the NNDSS notifi cations’ residen-tial postcode recorded in the NNDSS.
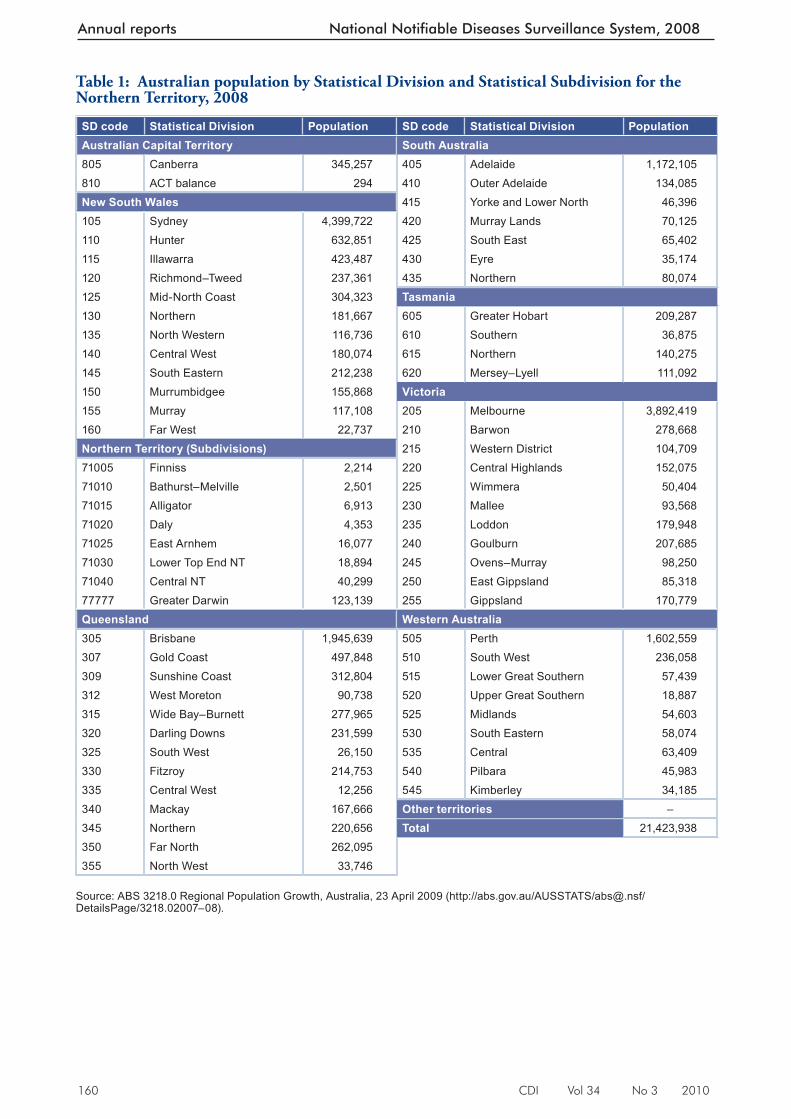
With one exception, maps were based on Statisti-cal Divisions (SDs), as defi ned by the Australian Standard Geographical Classifi cation (AGSC) (Map 1, Table 1), for all states and territories. Th e Northern Territory was represented by Statistical Subdivisions (SSD) and in the case of Greater Darwin, by the combination of the Tiwi Islands, Darwin, Palmerston and Litchfi eld SSD. Th is combination helped preserve confi dentiality while improving legibility at the scale the maps to be printed. Th e geocode 77777 for Greater Darwin is only nominal.
Notifi cations were summed by the postcode weighting calculated by the Australian Bureau of Statistics Postcode Concordance. 8 Th ese ABS concordance data were used to proportionally allocate notifi cations into SDs/SSDs according to the percentage of the population of the postcode living in the region. Th e total notifi cations per region are displayed in the relevant area.
Disease rates were calculated per 100,000 popula-tion for the relevant areas using ABS population
CDI Vol 34 No 3 2010 159
National Notifiable Diseases Surveillance System, 2008 Annual reports
data. 7 Rates were mapped for diff erent SDs and ordered into 5 groups using the Jenks Natural Breaks method (http://resources.arcgis.com/content/kbase?fa=articleShow&d=26442) whereby the largest breaks between natural clusters of ordered data were identifi ed and used as class boundaries. A class ‘0’ was added to account for areas with no notifi cations, resulting in a total of 6 rate classes per map. Note that the classifi cation is data dependent and changes from map to map.
N otes on interpretation
Th e present report is based on 2008 ‘fi nalised’ data from each state or territory agreed upon in September 2009 and represents a snapshot of the year after duplicate records and incorrect or incomplete data were removed. Th erefore, totals in this report may vary slightly from the totals reported in CDI quarterly publications.
Analyses in this report were based on the date of disease diagnosis in an attempt to estimate disease activity within the reporting period. Th e date of diagnosis is the onset date or where the date of onset was not known, the earliest of the specimen collection date, the notifi cation date, or the notifi -cation receive date. As considerable time may have elapsed between the onset and diagnosis dates for hepatitis B (unspecifi ed), hepatitis C (unspeci-fi ed) and tuberculosis, the earliest specimen date, health professional notifi cation date or public health unit notifi cation receive date was used for these conditions.
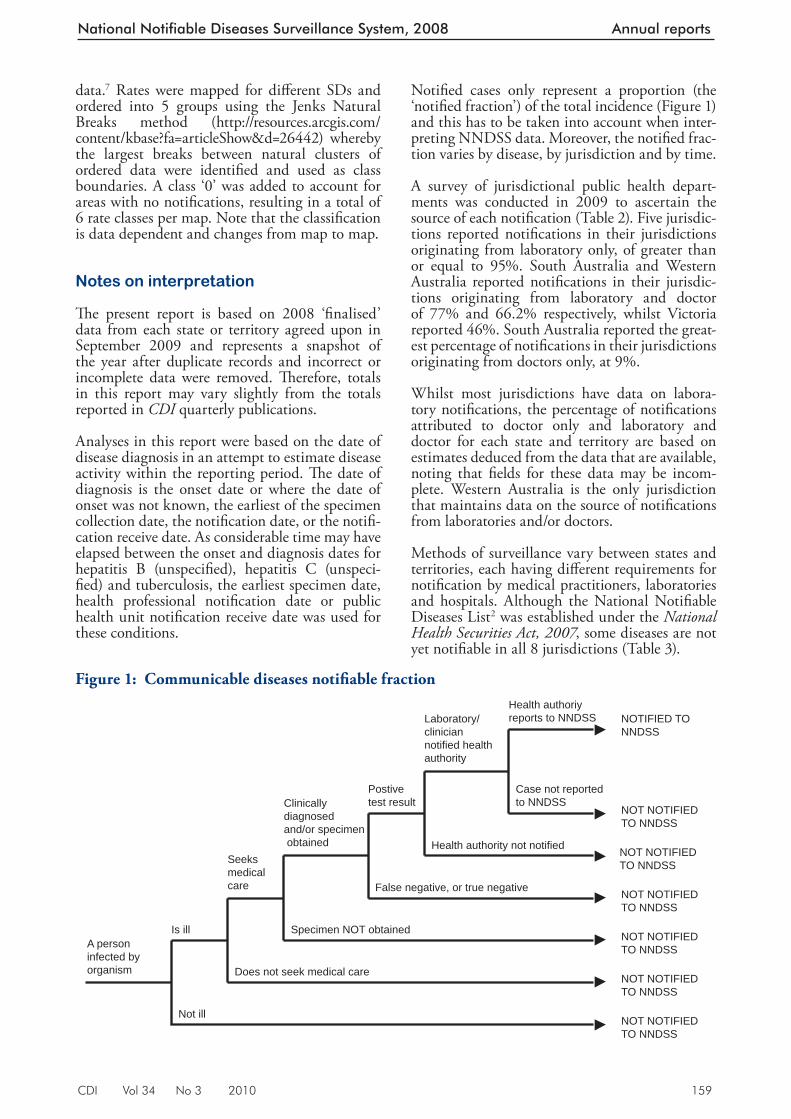
Notifi ed cases only represent a proportion (the ‘notifi ed fraction’) of the total incidence (Figure 1) and this has to be taken into account when inter-preting NNDSS data. Moreover, the notifi ed frac-tion varies by disease, by jurisdiction and by time.
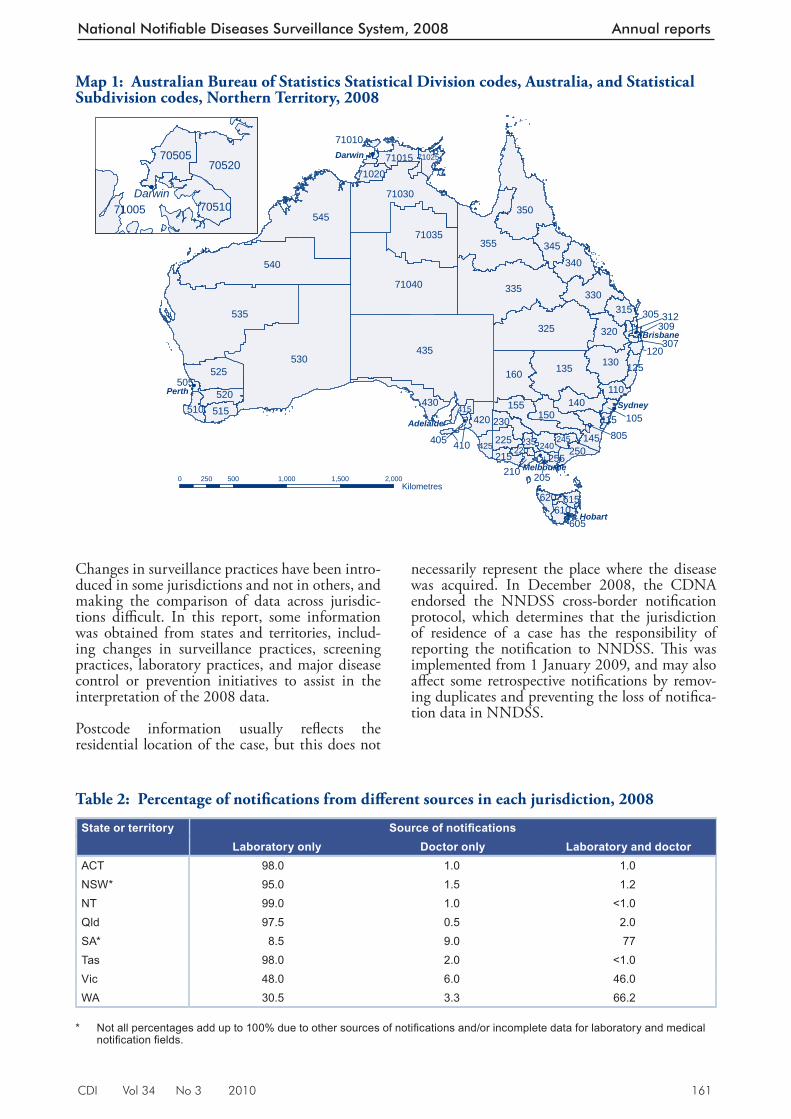
A survey of jurisdictional public health depart-ments was conducted in 2009 to ascertain the source of each notifi cation (Table 2). Five jurisdic-tions reported notifi cations in their jurisdictions originating from laboratory only, of greater than or equal to 95%. South Australia and Western Australia reported notifi cations in their jurisdic-tions originating from laboratory and doctor of 77% and 66.2% respectively, whilst Victoria reported 46%. South Australia reported the great-est percentage of notifi cations in their jurisdictions originating from doctors only, at 9%.
W hilst most jurisdictions have data on labora-tory notifi cations, the percentage of notifi cations attributed to doctor only and laboratory and doctor for each state and territory are based on estimates deduced from the data that are available, noting that fi elds for these data may be incom-plete. Western Australia is the only jurisdiction that maintains data on the source of notifi cations from laboratories and/or doctors.
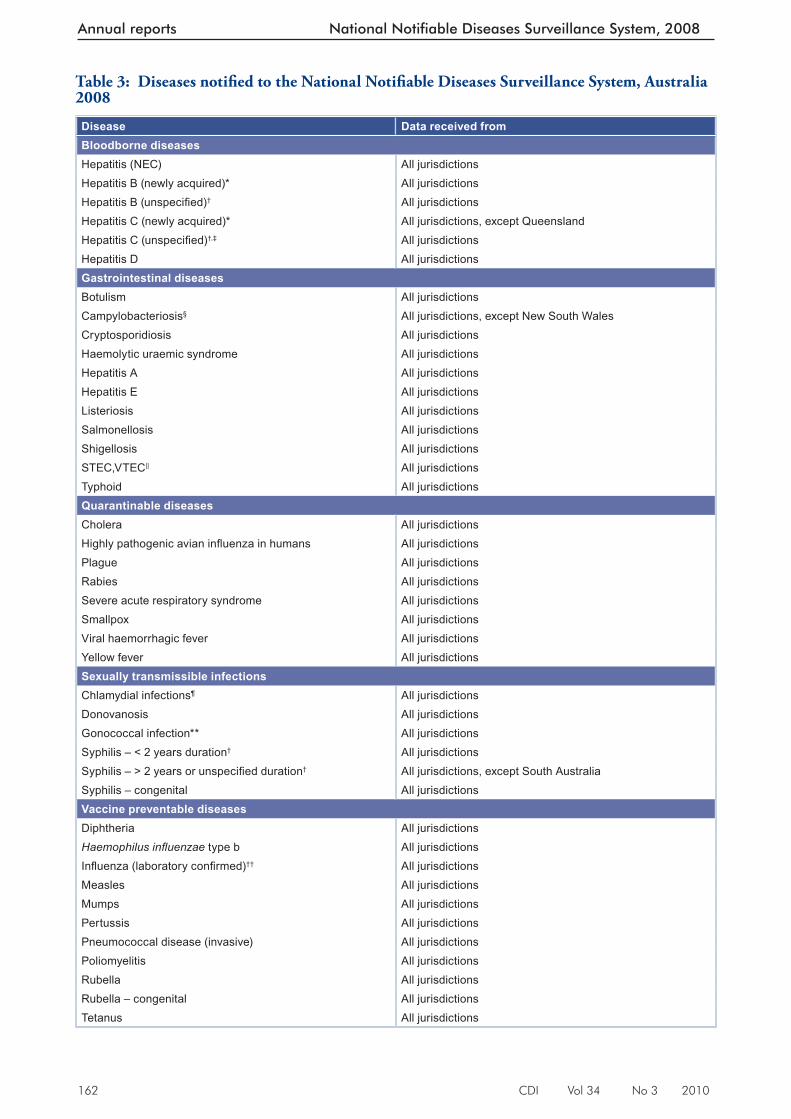
Methods of surveillance vary between states and territories, each having diff erent requirements for notifi cation by medical practitioners, laboratories and hospitals. Although the National Notifi able Diseases List 2 was established under the National Health Securities Act, 2007 , some diseases are not yet notifi able in all 8 jurisdictions (Table 3).
F igure 1: Communicable diseases notifi able fraction
A personinfected byorganism
Is ill
Seeks medicalcare
Clinically diagnosed and/or specimen obtained
Postivetest result
Laboratory/cliniciannotified healthauthority
Health authoriyreports to NNDSS
Not ill
Does not seek medical care
Specimen NOT obtained
False negative, or true negative
Health authority not notified
Case not reportedto NNDSS
NOTIFIED TONNDSS
NOT NOTIFIEDTO NNDSS
NOT NOTIFIEDTO NNDSS
NOT NOTIFIEDTO NNDSS
NOT NOTIFIEDTO NNDSS
NOT NOTIFIEDTO NNDSS
NOT NOTIFIEDTO NNDSS
160 CDI Vol 34 No 3 2010
Annual reports National Notifiable Diseases Surveillance System, 2008
Table 1: Australian population by Statistical Division and Statistical Subdivision for the Northern Territory, 2008
SD code Statis tical Division Population SD code Statistical Division PopulationAust ralian Capital Territory South Australia805 Canberra 345,257 405 Adelaide 1,172,105810 ACT balance 294 410 Outer Adelaide 134,085New South Wales 415 Yorke and Lower North 46,396105 Sydney 4,399,722 420 Murray Lands 70,125110 Hunter 632,851 425 South East 65,402115 Illawarra 423,487 430 Eyre 35,174120 Richmond–Tweed 237,361 435 Northern 80,074125 Mid-North Coast 304,323 Tasmania130 Northern 181,667 605 Greater Hobart 209,287135 North Western 116,736 610 Southern 36,875140 Central West 180,074 615 Northern 140,275145 South Eastern 212,238 620 Mersey–Lyell 111,092150 Murrumbidgee 155,868 Victoria155 Murray 117,108 205 Melbourne 3,892,419160 Far West 22,737 210 Barwon 278,668Northern Territory (Subdivisions) 215 Western District 104,70971005 Finniss 2,214 220 Central Highlands 152,07571010 Bathurst–Melville 2,501 225 Wimmera 50,40471015 Alligator 6,913 230 Mallee 93,56871020 Daly 4,353 235 Loddon 179,94871025 East Arnhem 16,077 240 Goulburn 207,68571030 Lower Top End NT 18,894 245 Ovens–Murray 98,25071040 Central NT 40,299 250 East Gippsland 85,31877777 Greater Darwin 123,139 255 Gippsland 170,779Queensland Western Australia305 Brisbane 1,945,639 505 Perth 1,602,559307 Gold Coast 497,848 510 South West 236,058309 Sunshine Coast 312,804 515 Lower Great Southern 57,439312 West Moreton 90,738 520 Upper Great Southern 18,887315 Wide Bay–Burnett 277,965 525 Midlands 54,603320 Darling Downs 231,599 530 South Eastern 58,074325 South West 26,150 535 Central 63,409330 Fitzroy 214,753 540 Pilbara 45,983335 Central West 12,256 545 Kimberley 34,185340 Mackay 167,666 Other territories –345 Northern 220,656 Total 21,423,938350 Far North 262,095355 North West 33,746
Source: ABS 3218.0 Regional Population Growth, Australia, 23 April 2009 (http://abs.gov.au/AUSSTATS/[email protected]/DetailsPage/3218.02007–08).
CDI Vol 34 No 3 2010 161
National Notifiable Diseases Surveillance System, 2008 Annual reports
Changes in surveillance practices have been intro-duced in some jurisdictions and not in others, and making the comparison of data across jurisdic-tions diffi cult. In this report, some information was obtained from states and territories, includ-ing changes in surveillance practices, screening practices, laboratory practices, and major disease control or prevention initiatives to assist in the interpretation of the 2008 data.
Postcode information usually refl ects the residential location of the case, but this does not
necessarily represent the place where the disease was acquired. In December 2008, the CDNA endorsed the NNDSS cross-border notifi cation protocol, which determines that the jurisdiction of residence of a case has the responsibility of reporting the notifi cation to NNDSS. Th is was implemented from 1 January 2009, and may also aff ect some retrospective notifi cations by remov-ing duplicates and preventing the loss of notifi ca-tion data in NNDSS.
Map 1: Australian Bureau of Statistics Statistical Division codes, Australia, and Statistical Subdivision codes, Northern Territory, 2008
!
Darwin
!
!
!
!
!
!
!
435530
535
540
545
335
325
71040
355
350
135
71030
71035
160525
330
130
155
340
320
430
345
150140
145
420
520
315
230515
225
71015
250
110
510
240
610
215425
71020
615
245
125
620
415
71025
235220
105
255
312
120
210
115
205
410
505
71005
71010
309
605
70520
307
805405
305
70505
70510
Darwin
Perth
Adelaide
Melbourne
Hobart
Brisbane
Sydney
0 500 1,000 1,500 2,000250Kilometres
Table 2: Percentage of notifi cations from diff erent sources in each jurisdiction, 2008
State or territory Source of notifi cationsLaboratory only Doctor only Laboratory and doctor
ACT 98.0 1.0 1.0NSW* 95.0 1.5 1.2NT 99.0 1.0 <1.0Qld 97.5 0.5 2.0SA* 8.5 9.0 77Tas 98.0 2.0 <1.0Vic 48.0 6.0 46.0WA 30.5 3.3 66.2
* Not all percentages add up to 100% due to other sources of notifi cations and/or incomplete data for laboratory and medical
notifi cation fi elds.
162 CDI Vol 34 No 3 2010
Annual reports National Notifiable Diseases Surveillance System, 2008
Table 3 : Diseases notifi ed to the National Notifi able Diseases Surveillance System, Australia 2008
Disease Data received fromBloodborne diseasesHepatitis (NEC) All jurisdictionsHepatitis B (newly acquired)* All jurisdictionsHepatitis B (unspecifi ed)† All jurisdictionsHepatitis C (newly acquired)* All jurisdictions, except QueenslandHepatitis C (unspecifi ed)†,‡ All jurisdictionsHepatitis D All jurisdictionsGastrointestinal diseasesBotulism All jurisdictionsCampylobacteriosis§ All jurisdictions, except New South WalesCryptosporidiosis All jurisdictionsHaemolytic uraemic syndrome All jurisdictionsHepatitis A All jurisdictionsHepatitis E All jurisdictionsListeriosis All jurisdictionsSalmonellosis All jurisdictionsShigellosis All jurisdictionsSTEC,VTEC|| All jurisdictionsTyphoid All jurisdictionsQuarantinable diseasesCholera All jurisdictionsHighly pathogenic avian infl uenza in humans All jurisdictionsPlague All jurisdictionsRabies All jurisdictionsSevere acute respiratory syndrome All jurisdictionsSmallpox All jurisdictionsViral haemorrhagic fever All jurisdictionsYellow fever All jurisdictionsSexually transmissible infectionsChlamydial infections¶ All jurisdictions Donovanosis All jurisdictionsGonococcal infection** All jurisdictionsSyphilis – < 2 years duration† All jurisdictionsSyphilis – > 2 years or unspecifi ed duration† All jurisdictions, except South AustraliaSyphilis – congenital All jurisdictionsVaccine preventable diseasesDiphtheria All jurisdictionsHaemophilus infl uenzae type b All jurisdictionsInfl uenza (laboratory confi rmed)†† All jurisdictionsMeasles All jurisdictionsMumps All jurisdictionsPertussis All jurisdictionsPneumococcal disease (invasive) All jurisdictionsPoliomyelitis All jurisdictionsRubella All jurisdictionsRubella – congenital All jurisdictionsTetanus All jurisdictions
CDI Vol 34 No 3 2010 163
National Notifiable Diseases Surveillance System, 2008 Annual reports
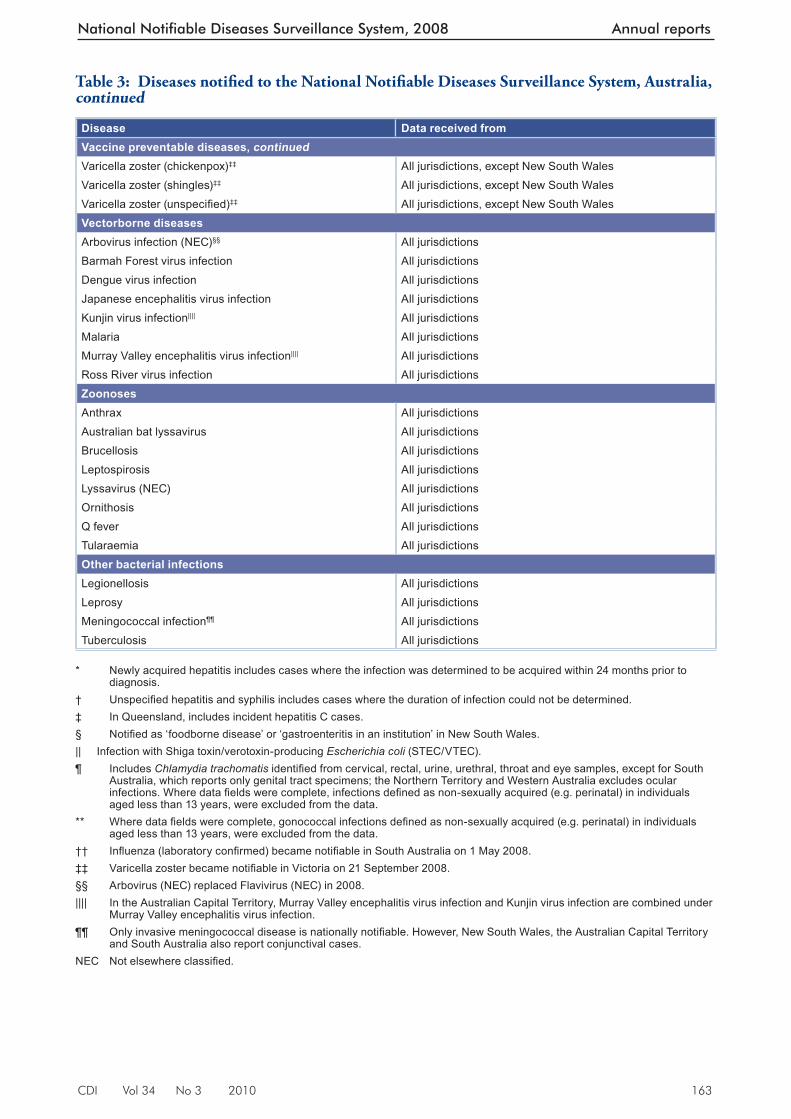
Disease Data received fromVaccine preventable diseases, continuedVaricella zoster (chickenpox)‡‡ All jurisdictions, except New South WalesVaricella zoster (shingles)‡‡ All jurisdictions, except New South WalesVaricella zoster (unspecifi ed)‡‡ All jurisdictions, except New South WalesVectorborne diseasesArbovirus infection (NEC)§§ All jurisdictionsBarmah Forest virus infection All jurisdictionsDengue virus infection All jurisdictionsJapanese encephalitis virus infection All jurisdictionsKunjin virus infection|||| All jurisdictionsMalaria All jurisdictionsMurray Valley encephalitis virus infection|||| All jurisdictionsRoss River virus infection All jurisdictionsZoonosesAnthrax All jurisdictionsAustralian bat lyssavirus All jurisdictionsBrucellosis All jurisdictionsLeptospirosis All jurisdictionsLyssavirus (NEC) All jurisdictionsOrnithosis All jurisdictionsQ fever All jurisdictionsTularaemia All jurisdictionsOther bacterial infectionsLegionellosis All jurisdictionsLeprosy All jurisdictionsMeningococcal infection¶¶ All jurisdictionsTuberculosis All jurisdictions
* Newly acquired hepatitis includes cases where the infection was determined to be acquired within 24 months prior to
diagnosis. † Unspecifi ed hepatitis and syphilis includes cases where the duration of infection could not be determined. ‡ In Queensland, includes incident hepatitis C cases. § Notifi ed as ‘foodborne disease’ or ‘gastroenteritis in an institution’ in New South Wales. || Infection with Shiga toxin/verotoxin-producing Escherichia coli (STEC/VTEC). ¶ Includes Chlamydia trachomatis identifi ed from cervical, rectal, urine, urethral, throat and eye samples, except for South
Australia, which reports only genital tract specimens; the Northern Territory and Western Australia excludes ocular infections. Where data fi elds were complete, infections defi ned as non-sexually acquired (e.g. perinatal) in individuals aged less than 13 years, were excluded from the data.
** Where data fi elds were complete, gonococcal infections defi ned as non-sexually acquired (e.g. perinatal) in individuals aged less than 13 years, were excluded from the data.
†† Infl uenza (laboratory confi rmed) became notifi able in South Australia on 1 May 2008. ‡‡ Varicella zoster became notifi able in Victoria on 21 September 2008. §§ Arbovirus (NEC) replaced Flavivirus (NEC) in 2008. |||| In the Australian Capital Territory, Murray Valley encephalitis virus infection and Kunjin virus infection are combined under
Murray Valley encephalitis virus infection. ¶¶ Only invasive meningococcal disease is nationally notifi able. However, New South Wales, the Australian Capital Territory
and South Australia also report conjunctival cases. NEC Not elsewhere classifi ed.
Table 3 : Diseases notifi ed to the National Notifi able Diseases Surveillance System, Australia, continued
164 CDI Vol 34 No 3 2010
Annual reports National Notifiable Diseases Surveillance System, 2008
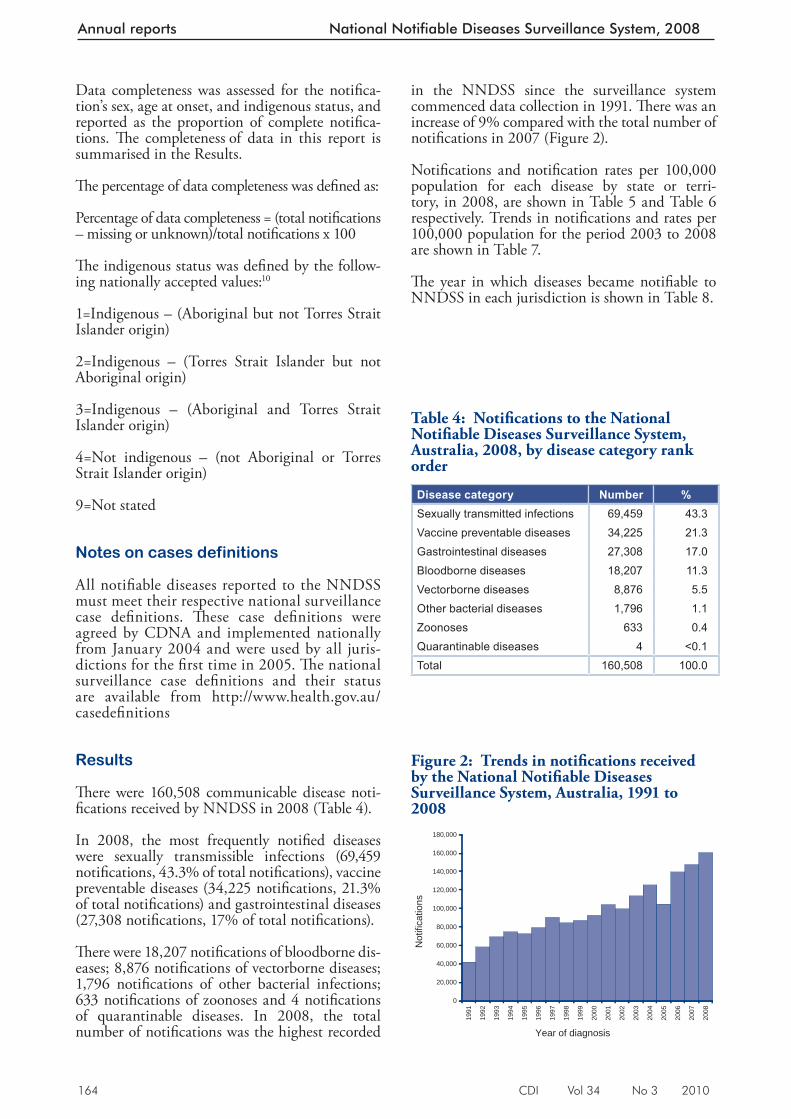
in the NNDSS since the surveillance system commenced data collection in 1991. Th ere was an increase of 9% compared with the total number of notifi cations in 2007 (Figure 2).
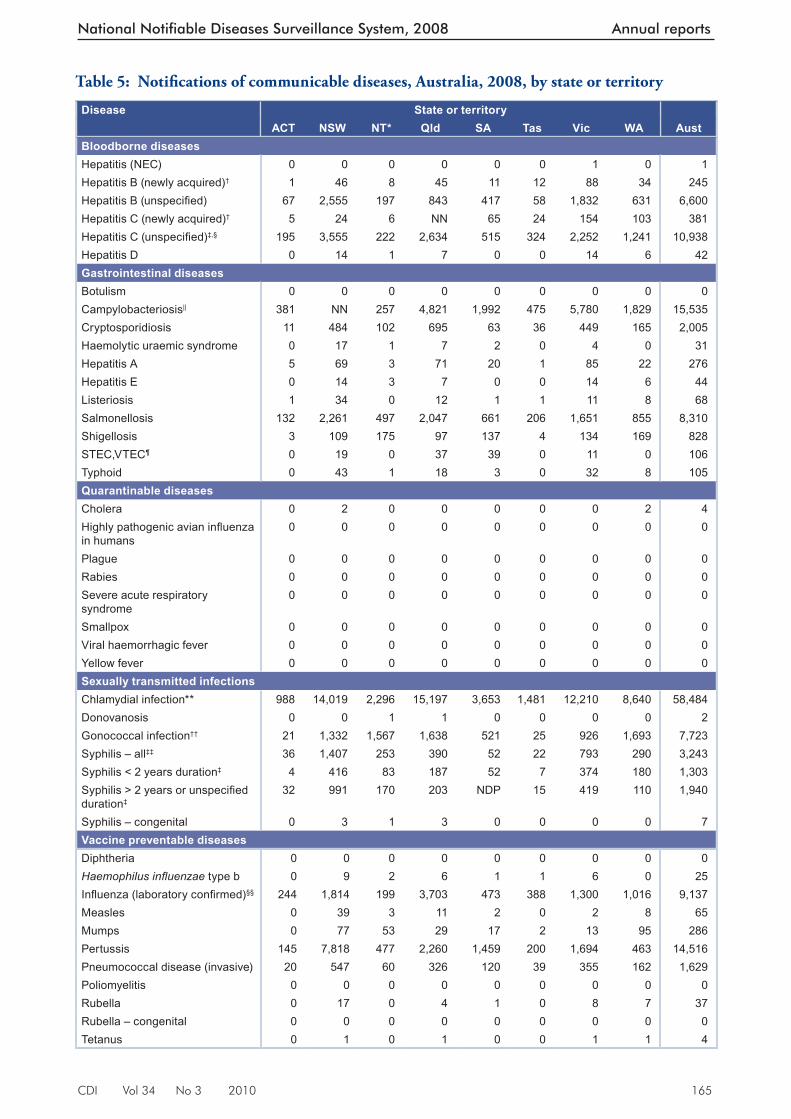
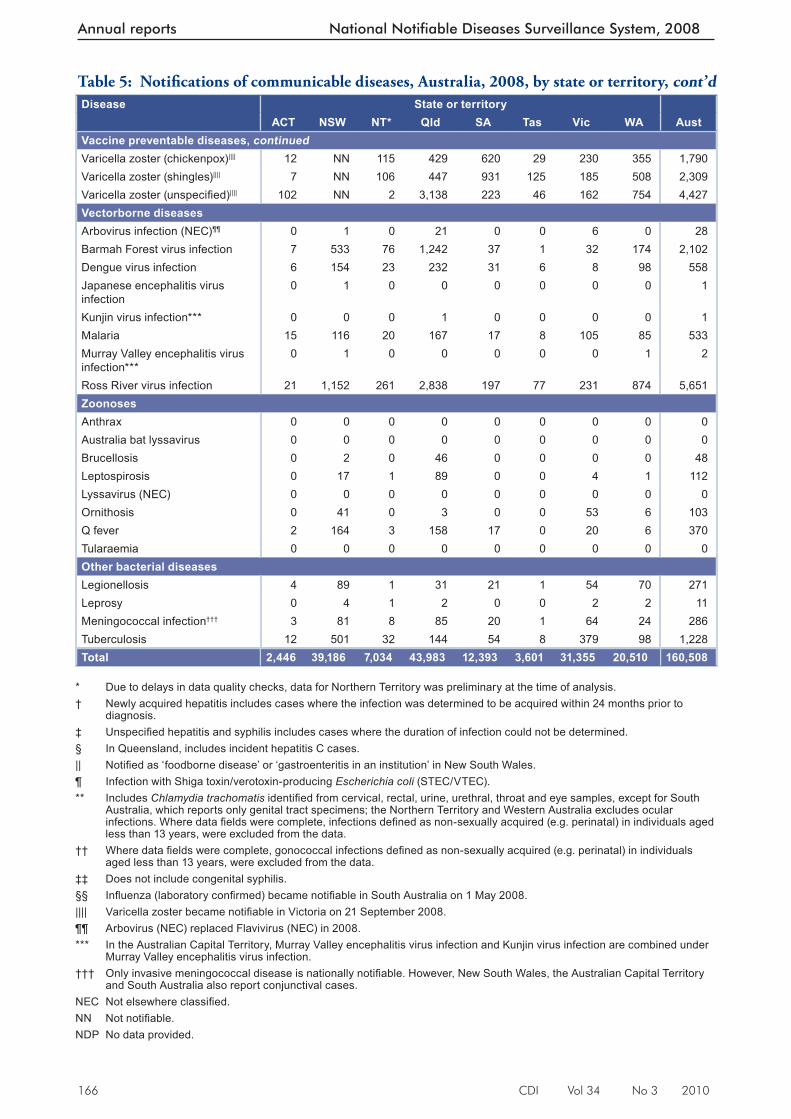
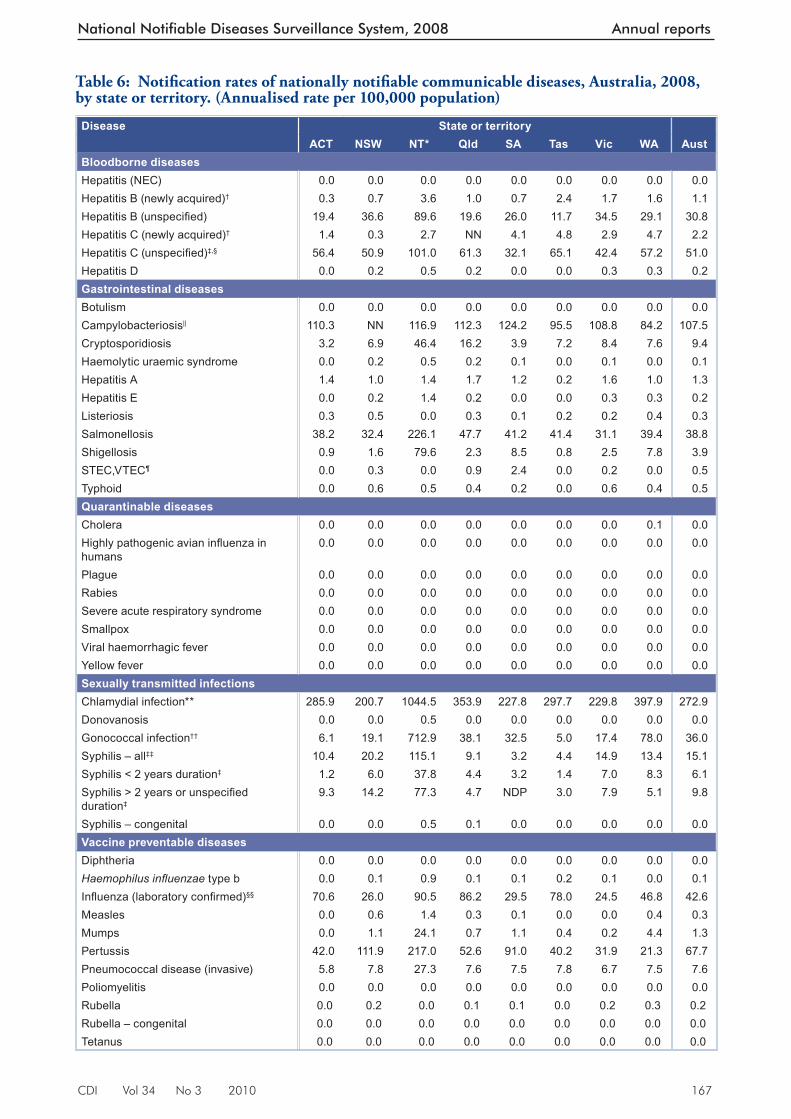
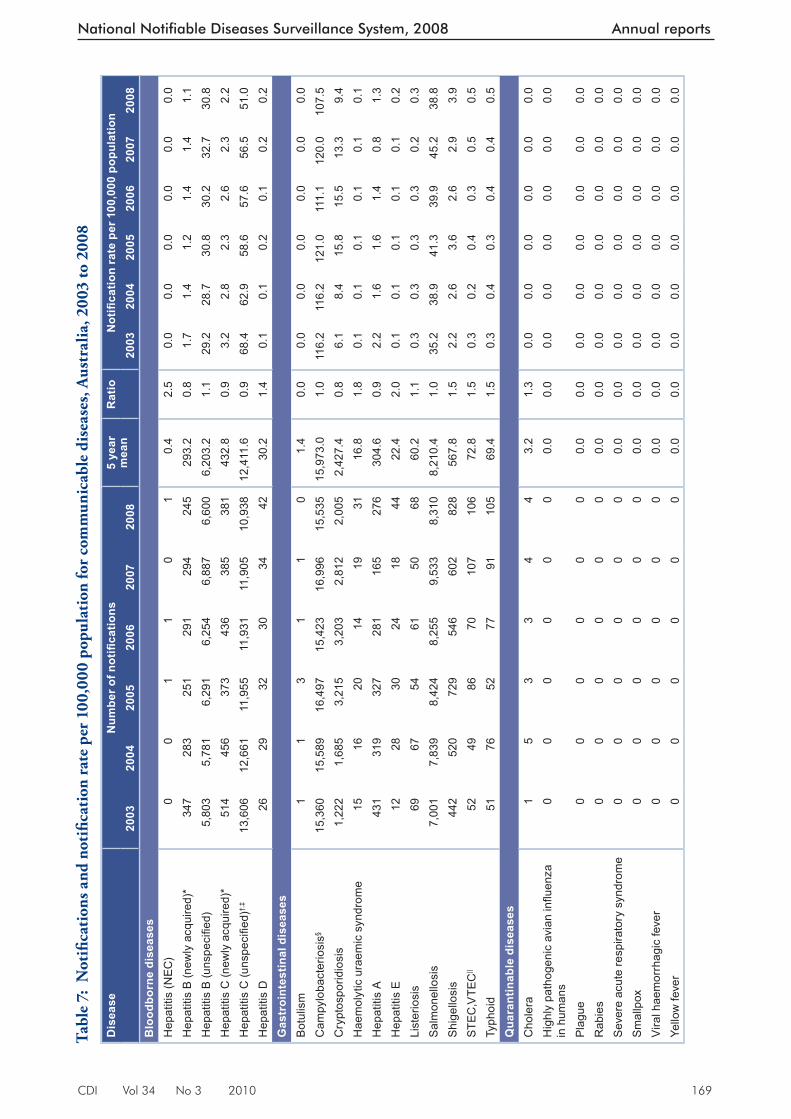
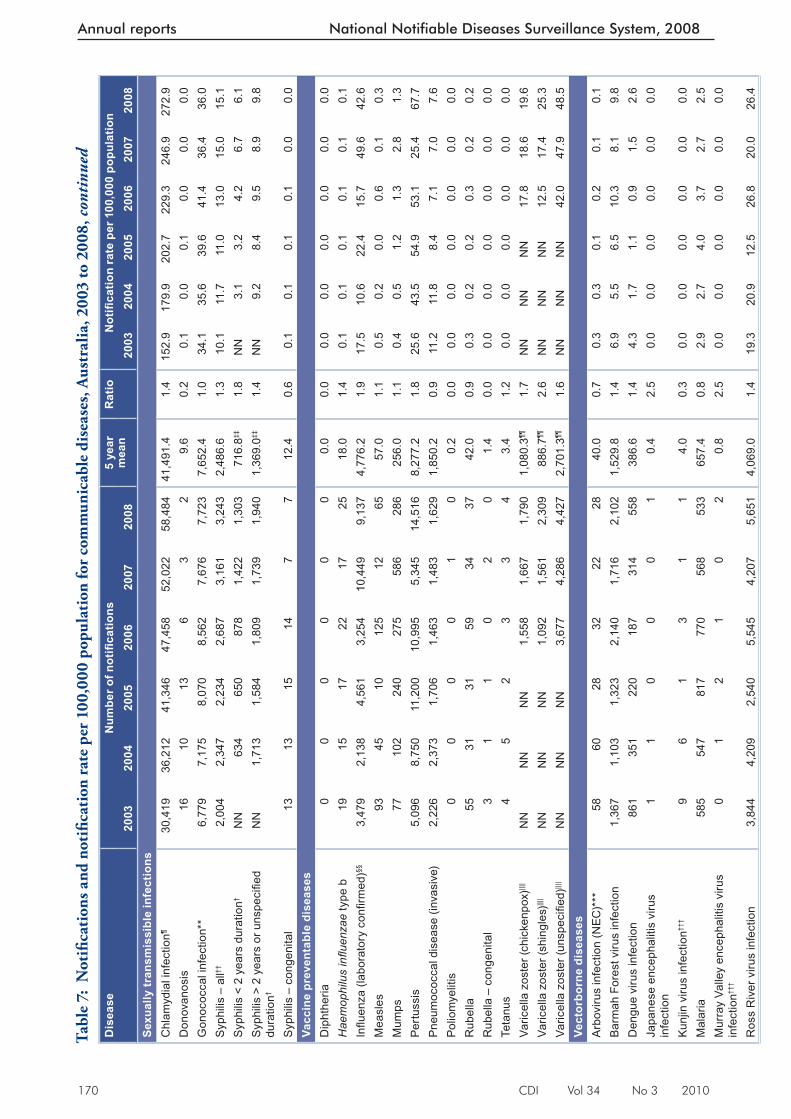
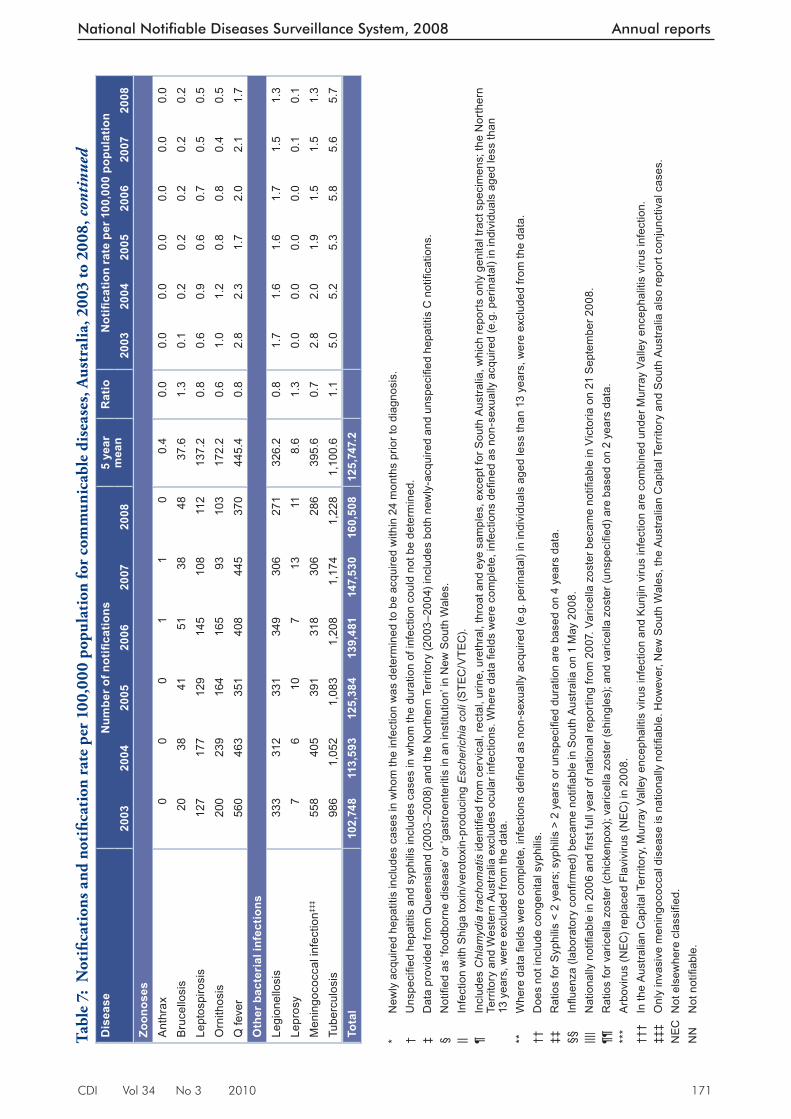
Notifi cations and notifi cation rates per 100,000 population for each disease by state or terri-tory, in 2008, are shown in Table 5 and Table 6 respectively. Trends in notifi cations and rates per 100,000 population for the period 2003 to 2008 are shown in Table 7.
Th e year in which diseases became notifi able to NNDSS in each jurisdiction is shown in Table 8.
Data completeness was assessed for the notifi ca-tion’s sex, age at onset, and indigenous status, and reported as the proportion of complete notifi ca-tions. Th e completeness of data in this report is summarised in the Results.
Th e percentage of data completeness was defi ned as:
Percentage of data completeness = (total notifi cations – missing or unknown)/total notifi cations x 100
Th e indigenous status was defi ned by the follow-ing nationally accepted values: 10
1=Indigenous – (Aboriginal but not Torres Strait Islander origin)
2=Indigenous – (Torres Strait Islander but not Aboriginal origin)
3=Indigenous – (Aboriginal and Torres Strait Islander origin)
4=Not indigenous – (not Aboriginal or Torres Strait Islander origin)
9=Not stated
Notes on cases definitions
All notifi able diseases reported to the NNDSS must meet their respective national surveillance case defi nitions. Th ese case defi nitions were agreed by CDNA and implemented nationally from January 2004 and were used by all juris-dictions for the fi rst time in 2005. Th e national surveillance case defi nitions and their status are available from http://www.health.gov.au/casedefi nitions
Results
Th ere were 160,508 communicable disease noti-fi cations received by NNDSS in 2008 (Table 4).
In 2008, the most frequently notifi ed diseases were sexually transmissible infections (69,459 notifi cations, 43.3% of total notifi cations), vaccine preventable diseases (34,225 notifi cations, 21.3% of total notifi cations) and gastrointestinal diseases (27,308 notifi cations, 17% of total notifi cations).
Th ere were 18,207 notifi cations of bloodborne dis-eases; 8,876 notifi cations of vectorborne diseases; 1,796 notifi cations of other bacterial infections; 633 notifi cations of zoonoses and 4 notifi cations of quarantinable diseases. In 2008, the total number of notifi cations was the highest recorded
Figure 2: Trends in notifi cations received by the National Notifi able Diseases Surveillance System, Australia, 1991 to 2008
0
20,000
40,000
60,000
80,000
100,000
120,000
140,000
160,000
180,000
1991
1992
1993
1994
1995
1996
1997
1998
1999
2000
2001
2002
2003
2004
2005
2006
2007
2008
Year of diagnosis
Not
ifica
tions
Table 4: Not ifi cations to the National Notifi able Diseases Surveillance System, Australia, 2008, by disease category rank order
Disease category Number %Sexually transmitted infections 69,459 43.3Vaccine preventable diseases 34,225 21.3Gastrointestinal diseases 27,308 17.0Bloodborne diseases 18,207 11.3Vectorborne diseases 8,876 5.5Other bacterial diseases 1,796 1.1Zoonoses 633 0.4Quarantinable diseases 4 <0.1Total 160,508 100.0
CDI Vol 34 No 3 2010 165
National Notifiable Diseases Surveillance System, 2008 Annual reports
Table 5: Notifi cations of communicable diseases, Australia, 2008, by state or territory
Disease State or territoryACT NSW NT* Qld SA Tas Vic WA Aust
Bloodborne diseasesHepatitis (NEC) 0 0 0 0 0 0 1 0 1Hepatitis B (newly acquired)† 1 46 8 45 11 12 88 34 245Hepatitis B (unspecifi ed) 67 2,555 197 843 417 58 1,832 631 6,600Hepatitis C (newly acquired)† 5 24 6 NN 65 24 154 103 381Hepatitis C (unspecifi ed)‡,§ 195 3,555 222 2,634 515 324 2,252 1,241 10,938Hepatitis D 0 14 1 7 0 0 14 6 42Gastrointestinal diseasesBotulism 0 0 0 0 0 0 0 0 0Campylobacteriosis|| 381 NN 257 4,821 1,992 475 5,780 1,829 15,535Cryptosporidiosis 11 484 102 695 63 36 449 165 2,005Haemolytic uraemic syndrome 0 17 1 7 2 0 4 0 31Hepatitis A 5 69 3 71 20 1 85 22 276Hepatitis E 0 14 3 7 0 0 14 6 44Listeriosis 1 34 0 12 1 1 11 8 68Salmonellosis 132 2,261 497 2,047 661 206 1,651 855 8,310Shigellosis 3 109 175 97 137 4 134 169 828STEC,VTEC¶ 0 19 0 37 39 0 11 0 106Typhoid 0 43 1 18 3 0 32 8 105Quarantinable diseasesCholera 0 2 0 0 0 0 0 2 4Highly pathogenic avian infl uenza in humans
0 0 0 0 0 0 0 0 0
Plague 0 0 0 0 0 0 0 0 0Rabies 0 0 0 0 0 0 0 0 0Severe acute respiratory syndrome
0 0 0 0 0 0 0 0 0
Smallpox 0 0 0 0 0 0 0 0 0Viral haemorrhagic fever 0 0 0 0 0 0 0 0 0Yellow fever 0 0 0 0 0 0 0 0 0Sexually transmitted infectionsChlamydial infection** 988 14,019 2,296 15,197 3,653 1,481 12,210 8,640 58,484Donovanosis 0 0 1 1 0 0 0 0 2Gonococcal infection†† 21 1,332 1,567 1,638 521 25 926 1,693 7,723Syphilis – all‡‡ 36 1,407 253 390 52 22 793 290 3,243Syphilis < 2 years duration‡ 4 416 83 187 52 7 374 180 1,303Syphilis > 2 years or unspecifi ed duration‡
32 991 170 203 NDP 15 419 110 1,940
Syphilis – congenital 0 3 1 3 0 0 0 0 7Vaccine preventable diseasesDiphtheria 0 0 0 0 0 0 0 0 0Haemophilus infl uenzae type b 0 9 2 6 1 1 6 0 25Infl uenza (laboratory confi rmed)§§ 244 1,814 199 3,703 473 388 1,300 1,016 9,137Measles 0 39 3 11 2 0 2 8 65Mumps 0 77 53 29 17 2 13 95 286Pertussis 145 7,818 477 2,260 1,459 200 1,694 463 14,516Pneumococcal disease (invasive) 20 547 60 326 120 39 355 162 1,629Poliomyelitis 0 0 0 0 0 0 0 0 0Rubella 0 17 0 4 1 0 8 7 37Rubella – congenital 0 0 0 0 0 0 0 0 0Tetanus 0 1 0 1 0 0 1 1 4
166 CDI Vol 34 No 3 2010
Annual reports National Notifiable Diseases Surveillance System, 2008
Disease State or territoryACT NSW NT* Qld SA Tas Vic WA Aust
Vaccine preventable diseases, continuedVaricella zoster (chickenpox)|||| 12 NN 115 429 620 29 230 355 1,790Varicella zoster (shingles)|||| 7 NN 106 447 931 125 185 508 2,309Varicella zoster (unspecifi ed)|||| 102 NN 2 3,138 223 46 162 754 4,427Vectorborne diseasesArbovirus infection (NEC)¶¶ 0 1 0 21 0 0 6 0 28Barmah Forest virus infection 7 533 76 1,242 37 1 32 174 2,102Dengue virus infection 6 154 23 232 31 6 8 98 558Japanese encephalitis virus infection
0 1 0 0 0 0 0 0 1
Kunjin virus infection*** 0 0 0 1 0 0 0 0 1Malaria 15 116 20 167 17 8 105 85 533Murray Valley encephalitis virus infection***
0 1 0 0 0 0 0 1 2
Ross River virus infection 21 1,152 261 2,838 197 77 231 874 5,651ZoonosesAnthrax 0 0 0 0 0 0 0 0 0Australia bat lyssavirus 0 0 0 0 0 0 0 0 0Brucellosis 0 2 0 46 0 0 0 0 48Leptospirosis 0 17 1 89 0 0 4 1 112Lyssavirus (NEC) 0 0 0 0 0 0 0 0 0Ornithosis 0 41 0 3 0 0 53 6 103Q fever 2 164 3 158 17 0 20 6 370Tularaemia 0 0 0 0 0 0 0 0 0Other bacterial diseasesLegionellosis 4 89 1 31 21 1 54 70 271Leprosy 0 4 1 2 0 0 2 2 11Meningococcal infection††† 3 81 8 85 20 1 64 24 286Tuberculosis 12 501 32 144 54 8 379 98 1,228Total 2,446 39,186 7,034 43,983 12,393 3,601 31,355 20,510 160,508
* Due to delays in data quality checks, data for Northern Territory was preliminary at the time of analysis.† Newly acquired hepatitis includes cases where the infection was determined to be acquired within 24 months prior to
diagnosis.‡ Unspecifi ed hepatitis and syphilis includes cases where the duration of infection could not be determined.§ In Queensland, includes incident hepatitis C cases.|| Notifi ed as ‘foodborne disease’ or ‘gastroenteritis in an institution’ in New South Wales.¶ Infection with Shiga toxin/verotoxin-producing Escherichia coli (STEC/VTEC).** Includes Chlamydia trachomatis identifi ed from cervical, rectal, urine, urethral, throat and eye samples, except for South
Australia, which reports only genital tract specimens; the Northern Territory and Western Australia excludes ocular infections. Where data fi elds were complete, infections defi ned as non-sexually acquired (e.g. perinatal) in individuals aged less than 13 years, were excluded from the data.
†† Where data fi elds were complete, gonococcal infections defi ned as non-sexually acquired (e.g. perinatal) in individuals aged less than 13 years, were excluded from the data.
‡‡ Does not include congenital syphilis.§§ Infl uenza (laboratory confi rmed) became notifi able in South Australia on 1 May 2008.|||| Varicella zoster became notifi able in Victoria on 21 September 2008.¶¶ Arbovirus (NEC) replaced Flavivirus (NEC) in 2008. *** In the Australian Capital Territory, Murray Valley encephalitis virus infection and Kunjin virus infection are combined under
Murray Valley encephalitis virus infection.††† Only invasive meningococcal disease is nationally notifi able. However, New South Wales, the Australian Capital Territory
and South Australia also report conjunctival cases.NEC Not elsewhere classifi ed.NN Not notifi able.NDP No data provided.
Table 5: Notifi cations of communicable diseases, Australia, 2008, by state or territory, cont’d
CDI Vol 34 No 3 2010 167
National Notifiable Diseases Surveillance System, 2008 Annual reports
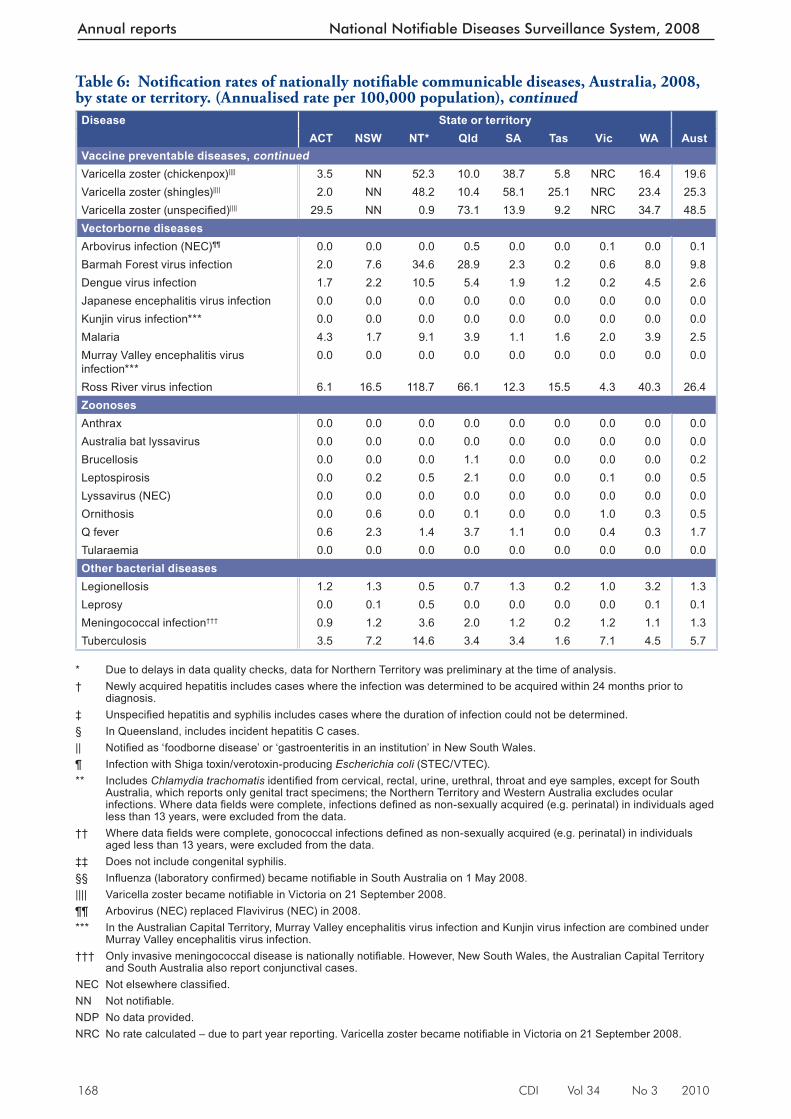
Table 6: Notifi cat ion rates of nationally notifi able communicable diseases, Australia, 2008, by state or territory. (Annualised rate per 100,000 population)
Disease State or territoryACT NSW NT* Qld SA Tas Vic WA Aust
Bloodborne diseasesHepatitis (NEC) 0.0 0.0 0.0 0.0 0.0 0.0 0.0 0.0 0.0Hepatitis B (newly acquired)† 0.3 0.7 3.6 1.0 0.7 2.4 1.7 1.6 1.1Hepatitis B (unspecifi ed) 19.4 36.6 89.6 19.6 26.0 11.7 34.5 29.1 30.8Hepatitis C (newly acquired)† 1.4 0.3 2.7 NN 4.1 4.8 2.9 4.7 2.2Hepatitis C (unspecifi ed)‡,§ 56.4 50.9 101.0 61.3 32.1 65.1 42.4 57.2 51.0Hepatitis D 0.0 0.2 0.5 0.2 0.0 0.0 0.3 0.3 0.2Gastrointestinal diseasesBotulism 0.0 0.0 0.0 0.0 0.0 0.0 0.0 0.0 0.0Campylobacteriosis|| 110.3 NN 116.9 112.3 124.2 95.5 108.8 84.2 107.5Cryptosporidiosis 3.2 6.9 46.4 16.2 3.9 7.2 8.4 7.6 9.4Haemolytic uraemic syndrome 0.0 0.2 0.5 0.2 0.1 0.0 0.1 0.0 0.1Hepatitis A 1.4 1.0 1.4 1.7 1.2 0.2 1.6 1.0 1.3Hepatitis E 0.0 0.2 1.4 0.2 0.0 0.0 0.3 0.3 0.2Listeriosis 0.3 0.5 0.0 0.3 0.1 0.2 0.2 0.4 0.3Salmonellosis 38.2 32.4 226.1 47.7 41.2 41.4 31.1 39.4 38.8Shigellosis 0.9 1.6 79.6 2.3 8.5 0.8 2.5 7.8 3.9STEC,VTEC¶ 0.0 0.3 0.0 0.9 2.4 0.0 0.2 0.0 0.5Typhoid 0.0 0.6 0.5 0.4 0.2 0.0 0.6 0.4 0.5Quarantinable diseasesCholera 0.0 0.0 0.0 0.0 0.0 0.0 0.0 0.1 0.0Highly pathogenic avian infl uenza in humans
0.0 0.0 0.0 0.0 0.0 0.0 0.0 0.0 0.0
Plague 0.0 0.0 0.0 0.0 0.0 0.0 0.0 0.0 0.0Rabies 0.0 0.0 0.0 0.0 0.0 0.0 0.0 0.0 0.0Severe acute respiratory syndrome 0.0 0.0 0.0 0.0 0.0 0.0 0.0 0.0 0.0Smallpox 0.0 0.0 0.0 0.0 0.0 0.0 0.0 0.0 0.0Viral haemorrhagic fever 0.0 0.0 0.0 0.0 0.0 0.0 0.0 0.0 0.0Yellow fever 0.0 0.0 0.0 0.0 0.0 0.0 0.0 0.0 0.0Sexually transmitted infectionsChlamydial infection** 285.9 200.7 1044.5 353.9 227.8 297.7 229.8 397.9 272.9Donovanosis 0.0 0.0 0.5 0.0 0.0 0.0 0.0 0.0 0.0Gonococcal infection†† 6.1 19.1 712.9 38.1 32.5 5.0 17.4 78.0 36.0Syphilis – all‡‡ 10.4 20.2 115.1 9.1 3.2 4.4 14.9 13.4 15.1Syphilis < 2 years duration‡ 1.2 6.0 37.8 4.4 3.2 1.4 7.0 8.3 6.1Syphilis > 2 years or unspecifi ed duration‡
9.3 14.2 77.3 4.7 NDP 3.0 7.9 5.1 9.8
Syphilis – congenital 0.0 0.0 0.5 0.1 0.0 0.0 0.0 0.0 0.0Vaccine preventable diseasesDiphtheria 0.0 0.0 0.0 0.0 0.0 0.0 0.0 0.0 0.0Haemophilus infl uenzae type b 0.0 0.1 0.9 0.1 0.1 0.2 0.1 0.0 0.1Infl uenza (laboratory confi rmed)§§ 70.6 26.0 90.5 86.2 29.5 78.0 24.5 46.8 42.6Measles 0.0 0.6 1.4 0.3 0.1 0.0 0.0 0.4 0.3Mumps 0.0 1.1 24.1 0.7 1.1 0.4 0.2 4.4 1.3Pertussis 42.0 111.9 217.0 52.6 91.0 40.2 31.9 21.3 67.7Pneumococcal disease (invasive) 5.8 7.8 27.3 7.6 7.5 7.8 6.7 7.5 7.6Poliomyelitis 0.0 0.0 0.0 0.0 0.0 0.0 0.0 0.0 0.0Rubella 0.0 0.2 0.0 0.1 0.1 0.0 0.2 0.3 0.2Rubella – congenital 0.0 0.0 0.0 0.0 0.0 0.0 0.0 0.0 0.0Tetanus 0.0 0.0 0.0 0.0 0.0 0.0 0.0 0.0 0.0
168 CDI Vol 34 No 3 2010
Annual reports National Notifiable Diseases Surveillance System, 2008
Disease State or territoryACT NSW NT* Qld SA Tas Vic WA Aust
Vaccine preventable diseases, continuedVaricella zoster (chickenpox)|||| 3.5 NN 52.3 10.0 38.7 5.8 NRC 16.4 19.6Varicella zoster (shingles)|||| 2.0 NN 48.2 10.4 58.1 25.1 NRC 23.4 25.3Varicella zoster (unspecifi ed)|||| 29.5 NN 0.9 73.1 13.9 9.2 NRC 34.7 48.5Vectorborne diseasesArbovirus infection (NEC)¶¶ 0.0 0.0 0.0 0.5 0.0 0.0 0.1 0.0 0.1Barmah Forest virus infection 2.0 7.6 34.6 28.9 2.3 0.2 0.6 8.0 9.8Dengue virus infection 1.7 2.2 10.5 5.4 1.9 1.2 0.2 4.5 2.6Japanese encephalitis virus infection 0.0 0.0 0.0 0.0 0.0 0.0 0.0 0.0 0.0Kunjin virus infection*** 0.0 0.0 0.0 0.0 0.0 0.0 0.0 0.0 0.0Malaria 4.3 1.7 9.1 3.9 1.1 1.6 2.0 3.9 2.5Murray Valley encephalitis virus infection***
0.0 0.0 0.0 0.0 0.0 0.0 0.0 0.0 0.0
Ross River virus infection 6.1 16.5 118.7 66.1 12.3 15.5 4.3 40.3 26.4ZoonosesAnthrax 0.0 0.0 0.0 0.0 0.0 0.0 0.0 0.0 0.0Australia bat lyssavirus 0.0 0.0 0.0 0.0 0.0 0.0 0.0 0.0 0.0Brucellosis 0.0 0.0 0.0 1.1 0.0 0.0 0.0 0.0 0.2Leptospirosis 0.0 0.2 0.5 2.1 0.0 0.0 0.1 0.0 0.5Lyssavirus (NEC) 0.0 0.0 0.0 0.0 0.0 0.0 0.0 0.0 0.0Ornithosis 0.0 0.6 0.0 0.1 0.0 0.0 1.0 0.3 0.5Q fever 0.6 2.3 1.4 3.7 1.1 0.0 0.4 0.3 1.7Tularaemia 0.0 0.0 0.0 0.0 0.0 0.0 0.0 0.0 0.0Other bacterial diseasesLegionellosis 1.2 1.3 0.5 0.7 1.3 0.2 1.0 3.2 1.3Leprosy 0.0 0.1 0.5 0.0 0.0 0.0 0.0 0.1 0.1Meningococcal infection††† 0.9 1.2 3.6 2.0 1.2 0.2 1.2 1.1 1.3Tuberculosis 3.5 7.2 14.6 3.4 3.4 1.6 7.1 4.5 5.7
* Due to del ays in data quality checks, data for Northern Territory was preliminary at the time of analysis.† Newly acquired hepatitis includes cases where the infection was determined to be acquired within 24 months prior to
diagnosis.‡ Unspecifi ed hepatitis and syphilis includes cases where the duration of infection could not be determined.§ In Queensland, includes incident hepatitis C cases.|| Notifi ed as ‘foodborne disease’ or ‘gastroenteritis in an institution’ in New South Wales.¶ Infection with Shiga toxin/verotoxin-producing Escherichia coli (STEC/VTEC).** Includes Chlamydia trachomatis identifi ed from cervical, rectal, urine, urethral, throat and eye samples, except for South
Australia, which reports only genital tract specimens; the Northern Territory and Western Australia excludes ocular infections. Where data fi elds were complete, infections defi ned as non-sexually acquired (e.g. perinatal) in individuals aged less than 13 years, were excluded from the data.
†† W here data fi elds were complete, gonococcal infections defi ned as non-sexually acquired (e.g. perinatal) in individuals aged less than 13 years, were excluded from the data.
‡‡ Does not include congenital syphilis.§§ Infl uenza (laboratory confi rmed) became notifi able in South Australia on 1 May 2008.|||| Varicella zoster became notifi able in Victoria on 21 September 2008.¶¶ Arbovirus (NEC) replaced Flavivirus (NEC) in 2008. *** In the Australian Capital Territory, Murray Valley encephalitis virus infection and Kunjin virus infection are combined under
Murray Valley encephalitis virus infection.††† Only invasive meningococcal disease is nationally notifi able. However, New South Wales, the Australian Capital Territory
and South Australia also report conjunctival cases.NEC Not elsewhere classifi ed.NN Not notifi able.NDP No data provided.NRC No rate calculated – due to part year reporting. Varicella zoster became notifi able in Victoria on 21 September 2008.
Table 6: Notifi cat ion rates of nationally notifi able communicable diseases, Australia, 2008, by state or territory. (Annualised rate per 100,000 population), continued
CDI Vol 34 No 3 2010 169
National Notifiable Diseases Surveillance System, 2008 Annual reports
Tab l
e 7:
Not
ifi ca
tion
s and
not
ifi ca
tion
rat
e pe
r 10
0,00
0 po
pula
tion
for
com
mun
icab
le d
isea
ses,
Aus
tral
ia, 2
003
to 2
008
Dis
ease
Num
ber o
f not
ifi ca
tions
5 ye
ar
mea
nR
atio
Not
ifi ca
tion
rate
per
100
,000
pop
ulat
ion
2003
2004
2005
2006
2007
2008
2003
2004
2005
2006
2007
2008
Blo
odbo
rne
dise
ases
Hep
atiti
s (N
EC)
0 0
11
0 1
0.4
2.5
0.0
0.0
0.0
0.0
0.0
0.0
Hep
atiti
s B
(new
ly a
cqui
red)
*34
728
325
129
129
424
529
3.2
0.8
1.7
1.4
1.2
1.4
1.4
1.1
Hep
atiti
s B
(uns
pecifi e
d)5,
803
5,78
16,
291
6,25
46,
887
6,60
06,
203.
21.
129
.228
.730
.830
.232
.730
.8H
epat
itis
C (n
ewly
acq
uire
d)*
514
456
373
436
385
381
432.
80.
93.
22.
82.
32.
62.
32.
2H
epat
itis
C (u
nspe
cifi e
d)†,
‡13
,606
12,6
6111
,955
11,9
3111
,905
10,9
3812
,411
.60.
968
.462
.958
.657
.656
.551
.0H
epat
itis
D26
2932
3034
4230
.21.
40.
10.
10.
20.
10.
20.
2G
astr
oint
estin
al d
isea
ses
Bot
ulis
m1
13
11
0 1.
40.
00.
00.
00.
00.
00.
00.
0C
ampy
loba
cter
iosi
s§15
,360
15,5
8916
,497
15,4
2316
,996
15,5
3515
,973
.01.
011
6.2
116.
212
1.0
111.
112
0.0
107.
5C
rypt
ospo
ridio
sis
1,22
21,
685
3,21
53,
203
2,81
22,
005
2,42
7.4
0.8
6.1
8.4
15.8
15.5
13.3
9.4
Hae
mol
ytic
ura
emic
syn
drom
e15
1620
1419
3116
.81.
80.
10.
10.
10.
10.
10.
1H
epat
itis
A43
131
932
728
116
527
630
4.6
0.9
2.2
1.6
1.6
1.4
0.8
1.3
Hep
atiti
s E
1228
3024
1844
22.4
2.0
0.1
0.1
0.1
0.1
0.1
0.2
List
erio
sis
6967
5461
5068
60.2
1.1
0.3
0.3
0.3
0.3
0.2
0.3
Sal
mon
ello
sis
7,00
17,
839
8,42
48,
255
9,53
38,
310
8,21
0.4
1.0
35.2
38.9
41.3
39.9
45.2
38.8
Shi
gello
sis
442
520
729
546
602
828
567.
81.
52.
22.
63.
62.
62.
93.
9S
TEC
,VTE
C||
5249
8670
107
106
72.8
1.5
0.3
0.2
0.4
0.3
0.5
0.5
Typh
oid
5176
5277
9110
569
.41.
50.
30.
40.
30.
40.
40.
5Q
uara
ntin
able
dis
ease
sC
hole
ra1
53
34
43.
21.
30.
00.
00.
00.
00.
00.
0H
ighl
y pa
thog
enic
avi
an infl u
enza
in
hum
ans
00
00
00
0.0
0.0
0.0
0.0
0.0
0.0
0.0
0.0
Pla
gue
00
00
00
0.0
0.0
0.0
0.0
0.0
0.0
0.0
0.0
Rab
ies
00
00
00
0.0
0.0
0.0
0.0
0.0
0.0
0.0
0.0
Sev
ere
acut
e re
spira
tory
syn
drom
e0
00
00
00.
00.
00.
00.
00.
00.
00.
00.
0S
mal
lpox
00
00
00
0.0
0.0
0.0
0.0
0.0
0.0
0.0
0.0
Vira
l hae
mor
rhag
ic fe
ver
00
00
00
0.0
0.0
0.0
0.0
0.0
0.0
0.0
0.0
Yello
w fe
ver
00
00
00
0.0
0.0
0.0
0.0
0.0
0.0
0.0
0.0
170 CDI Vol 34 No 3 2010
Annual reports National Notifiable Diseases Surveillance System, 2008
Dis
ease
Num
ber o
f not
ifi ca
tions
5 ye
ar
mea
nR
atio
Not
ifi ca
tion
rate
per
100
,000
pop
ulat
ion
2003
2004
2005
2006
2007
2008
2003
2004
2005
2006
2007
2008
Sexu
ally
tran
smis
sibl
e in
fect
ions
Chl
amyd
ial i
nfec
tion¶
30,4
1936
,212
41,3
4647
,458
52,0
2258
,484
41,4
91.4
1.4
152.
917
9.9
202.
722
9.3
246.
927
2.9
Don
ovan
osis
1610
136
32
9.6
0.2
0.1
0.0
0.1
0.0
0.0
0.0
Gon
ococ
cal i
nfec
tion*
*6,
779
7,17
58,
070
8,56
27,
676
7,72
37,
652.
41.
034
.135
.639
.641
.436
.436
.0S
yphi
lis –
all††
2,00
42,
347
2,23
42,
687
3,16
13,
243
2,48
6.6
1.3
10.1
11.7
11.0
13.0
15.0
15.1
Syp
hilis
< 2
yea
rs d
urat
ion†
NN
634
650
878
1,42
21,
303
716.
8‡‡1.
8N
N3.
13.
24.
26.
76.
1S
yphi
lis >
2 y
ears
or u
nspe
cifi e
d du
ratio
n†N
N1,
713
1,58
41,
809
1,73
91,
940
1,36
9.0‡‡
1.4
NN
9.2
8.4
9.5
8.9
9.8
Syp
hilis
– c
onge
nita
l13
1315
147
712
.40.
60.
10.
10.
10.
10.
00.
0Va
ccin
e pr
even
tabl
e di
seas
esD
ipht
heria
00
00
00
0.0
0.0
0.0
0.0
0.0
0.0
0.0
0.0
Hae
mop
hilu
s infl u
enza
e ty
pe b
1915
1722
1725
18.0
1.4
0.1
0.1
0.1
0.1
0.1
0.1
Infl u
enza
(lab
orat
ory
confi
rmed
)§§3,
479
2,13
84,
561
3,25
410
,449
9,13
74,
776.
21.
917
.510
.622
.415
.749
.642
.6M
easl
es93
4510
125
1265
57.0
1.1
0.5
0.2
0.0
0.6
0.1
0.3
Mum
ps77
102
240
275
586
286
256.
01.
10.
40.
51.
21.
32.
81.
3Pe
rtuss
is5,
096
8,75
011
,200
10,9
955,
345
14,5
168,
277.
21.
825
.643
.554
.953
.125
.467
.7P
neum
ococ
cal d
isea
se (i
nvas
ive)
2,22
62,
373
1,70
61,
463
1,48
31,
629
1,85
0.2
0.9
11.2
11.8
8.4
7.1
7.0
7.6
Pol
iom
yelit
is0
00
01
00.
20.
00.
00.
00.
00.
00.
00.
0R
ubel
la55
3131
5934
3742
.00.
90.
30.
20.
20.
30.
20.
2R
ubel
la –
con
geni
tal
31
10
20
1.4
0.0
0.0
0.0
0.0
0.0
0.0
0.0
Teta
nus
45
23
34
3.4
1.2
0.0
0.0
0.0
0.0
0.0
0.0
Varic
ella
zos
ter (
chic
kenp
ox)|||
|N
NN
NN
N1,
558
1,66
71,
790
1,08
0.3¶¶
1.7
NN
NN
NN
17.8
18.6
19.6
Varic
ella
zos
ter (
shin
gles
)||||
NN
NN
NN
1,09
21,
561
2,30
988
6.7¶¶
2.6
NN
NN
NN
12.5
17.4
25.3
Varic
ella
zos
ter (
unsp
ecifi
ed)|||
|N
NN
NN
N3,
677
4,28
64,
427
2,70
1.3¶¶
1.6
NN
NN
NN
42.0
47.9
48.5
Vect
orbo
rne
dise
ases
Arb
oviru
s in
fect
ion
(NEC
)***
5860
2832
2228
40.0
0.7
0.3
0.3
0.1
0.2
0.1
0.1
Bar
mah
For
est v
irus
infe
ctio
n1,
367
1,10
31,
323
2,14
01,
716
2,10
21,
529.
81.
46.
95.
56.
510
.38.
19.
8D
engu
e vi
rus
infe
ctio
n86
135
122
018
731
455
838
6.6
1.4
4.3
1.7
1.1
0.9
1.5
2.6
Japa
nese
enc
epha
litis
viru
s in
fect
ion
11
0 0
0 1
0.4
2.5
0.0
0.0
0.0
0.0
0.0
0.0
Kunj
in v
irus
infe
ctio
n†††
96
13
11
4.0
0.3
0.0
0.0
0.0
0.0
0.0
0.0
Mal
aria
585
547
817
770
568
533
657.
40.
82.
92.
74.
03.
72.
72.
5M
urra
y Va
lley
ence
phal
itis
viru
s in
fect
ion††
†0
12
10
20.
82.
50.
00.
00.
00.
00.
00.
0
Ros
s R
iver
viru
s in
fect
ion
3,84
44,
209
2,54
05,
545
4,20
75,
651
4,06
9.0
1.4
19.3
20.9
12.5
26.8
20.0
26.4
Tab l
e 7:
Not
ifi ca
tion
s and
not
ifi ca
tion
rat
e pe
r 10
0,00
0 po
pula
tion
for
com
mun
icab
le d
isea
ses,
Aus
tral
ia, 2
003
to 2
008,
con
tinu
ed
CDI Vol 34 No 3 2010 171
National Notifiable Diseases Surveillance System, 2008 Annual reports
Dis
ease
Num
ber o
f not
ifi ca
tions
5 ye
ar
mea
nR
atio
Not
ifi ca
tion
rate
per
100
,000
pop
ulat
ion
2003
2004
2005
2006
2007
2008
2003
2004
2005
2006
2007
2008
Zoon
oses
Ant
hrax
00
01
10
0.4
0.0
0.0
0.0
0.0
0.0
0.0
0.0
Bru
cello
sis
2038
4151
3848
37.6
1.3
0.1
0.2
0.2
0.2
0.2
0.2
Lept
ospi
rosi
s12
717
712
914
510
811
213
7.2
0.8
0.6
0.9
0.6
0.7
0.5
0.5
Orn
ithos
is20
023
916
416
593
103
172.
20.
61.
01.
20.
80.
80.
40.
5Q
feve
r56
046
335
140
844
537
044
5.4
0.8
2.8
2.3
1.7
2.0
2.1
1.7
Oth
er b
acte
rial
infe
ctio
nsLe
gion
ello
sis
333
312
331
349
306
271
326.
20.
81.
71.
61.
61.
71.
51.
3Le
pros
y7
610
713
118.
61.
30.
00.
00.
00.
00.
10.
1M
enin
goco
ccal
infe
ctio
n‡‡‡
558
405
391
318
306
286
395.
60.
72.
82.
01.
91.
51.
51.
3Tu
berc
ulos
is98
61,
052
1,08
31,
208
1,17
41,
228
1,10
0.6
1.1
5.0
5.2
5.3
5.8
5.6
5.7
Tota
l10
2,74
811
3,59
312
5,38
413
9,48
114
7,53
016
0,50
812
5,74
7.2
*
New
ly a
cqui
red
hepa
titis
incl
udes
cas
es in
who
m th
e in
fect
ion
was
det
erm
ined
to b
e ac
quire
d w
ithin
24
mon
ths
prio
r to
diag
nosi
s. †
Uns
pecifi e
d he
patit
is a
nd s
yphi
lis in
clud
es c
ases
in w
hom
the
dura
tion
of in
fect
ion
coul
d no
t be
dete
rmin
ed.
‡ D
ata
prov
ided
from
Que
ensl
and
(200
3–20
08) a
nd th
e N
orth
ern
Terr
itory
(200
3–20
04) i
nclu
des
both
new
ly-a
cqui
red
and
unsp
ecifi
ed h
epat
itis
C n
otifi
catio
ns.
§ N
otifi
ed a
s ‘fo
odbo
rne
dise
ase’
or ‘
gast
roen
terit
is in
an
inst
itutio
n’ in
New
Sou
th W
ales
. ||
Infe
ctio
n w
ith S
higa
toxi
n/ve
roto
xin-
prod
ucin
g E
sche
richi
a co
li (S
TEC
/VTE
C).
¶ In
clud
es C
hlam
ydia
trac
hom
atis
iden
tifi e
d fro
m c
ervi
cal,
rect
al, u
rine,
ure
thra
l, th
roat
and
eye
sam
ples
, exc
ept f
or S
outh
Aus
tralia
, whi
ch re
port
s on
ly g
enita
l tra
ct s
peci
men
s; th
e N
orth
ern
Terr
itory
and
Wes
tern
Aus
tralia
exc
lude
s oc
ular
infe
ctio
ns. W
here
dat
a fi e
lds
wer
e co
mpl
ete,
infe
ctio
ns d
efi n
ed a
s no
n-se
xual
ly a
cqui
red
(e.g
. per
inat
al) i
n in
divi
dual
s ag
ed le
ss th
an
13 y
ears
, wer
e ex
clud
ed fr
om th
e da
ta.
**
Whe
re d
ata fi e
lds
wer
e co
mpl
ete,
infe
ctio
ns d
efi n
ed a
s no
n-se
xual
ly a
cqui
red
(e.g
. per
inat
al) i
n in
divi
dual
s ag
ed le
ss th
an 1
3 ye
ars,
wer
e ex
clud
ed fr
om th
e da
ta.
††
Doe
s no
t inc
lude
con
geni
tal s
yphi
lis.
‡‡
Rat
ios
for S
yphi
lis <
2 y
ears
; syp
hilis
> 2
yea
rs o
r uns
pecifi e
d du
ratio
n ar
e ba
sed
on 4
yea
rs d
ata.
§§
Infl u
enza
(lab
orat
ory
confi
rmed
) bec
ame
notifi
abl
e in
Sou
th A
ustra
lia o
n 1
May
200
8. |||
| N
atio
nally
not
ifi ab
le in
200
6 an
d fi r
st fu
ll ye
ar o
f nat
iona
l rep
ortin
g fro
m 2
007.
Var
icel
la z
oste
r bec
ame
notifi
abl
e in
Vic
toria
on
21 S
epte
mbe
r 200
8. ¶¶
R
atio
s fo
r var
icel
la z
oste
r (ch
icke
npox
); va
ricel
la z
oste
r (sh
ingl
es);
and
varic
ella
zos
ter (
unsp
ecifi
ed) a
re b
ased
on
2 ye
ars
data
. **
* A
rbov
irus
(NEC
) rep
lace
d Fl
aviv
irus
(NEC
) in
2008
. ††
† In
the
Aus
tralia
n C
apita
l Ter
ritor
y, M
urra
y Va
lley
ence
phal
itis
viru
s in
fect
ion
and
Kun
jin v
irus
infe
ctio
n ar
e co
mbi
ned
unde
r Mur
ray
Valle
y en
ceph
aliti
s vi
rus
infe
ctio
n. ‡‡
‡ O
nly
inva
sive
men
ingo
cocc
al d
isea
se is
nat
iona
lly n
otifi
able
. How
ever
, New
Sou
th W
ales
, the
Aus
tralia
n C
apita
l Ter
ritor
y an
d S
outh
Aus
tralia
als
o re
port
conj
unct
ival
cas
es.
NEC
Not
els
ewhe
re c
lass
ifi ed
. N
N
Not
not
ifi ab
le.
Tab l
e 7:
Not
ifi ca
tion
s and
not
ifi ca
tion
rat
e pe
r 10
0,00
0 po
pula
tion
for
com
mun
icab
le d
isea
ses,
Aus
tral
ia, 2
003
to 2
008,
con
tinu
ed
172 CDI Vol 34 No 3 2010
Annual reports National Notifiable Diseases Surveillance System, 2008
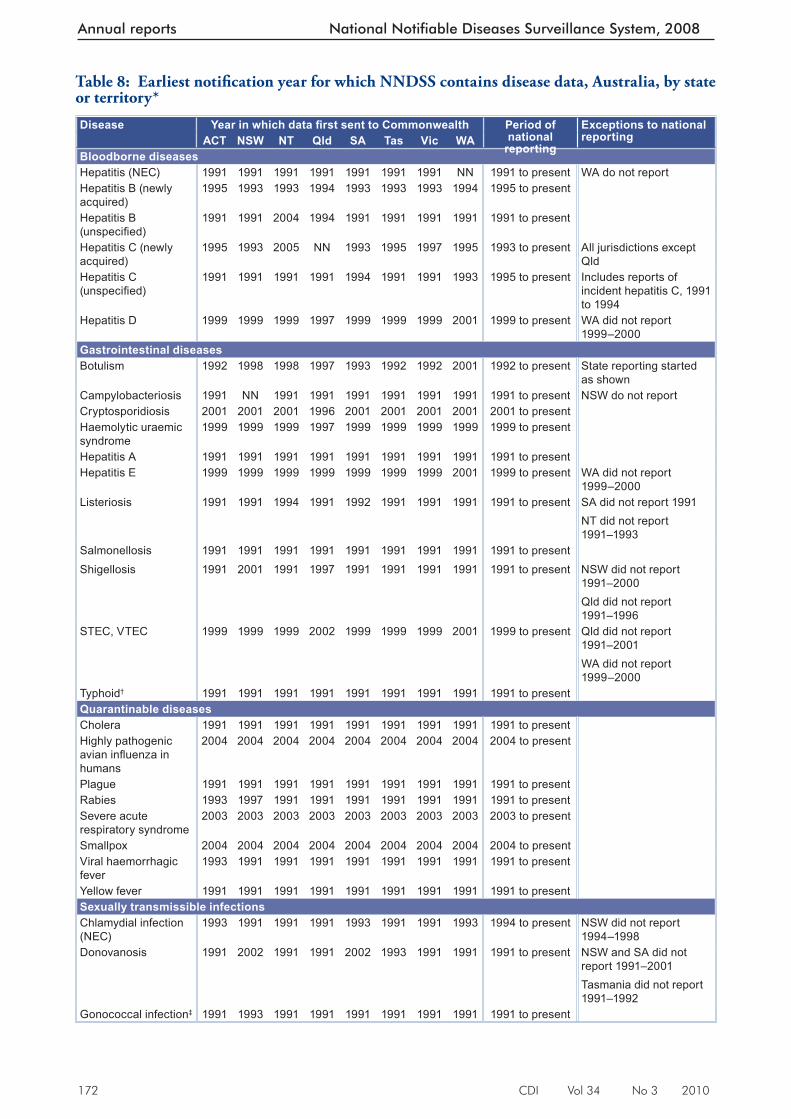
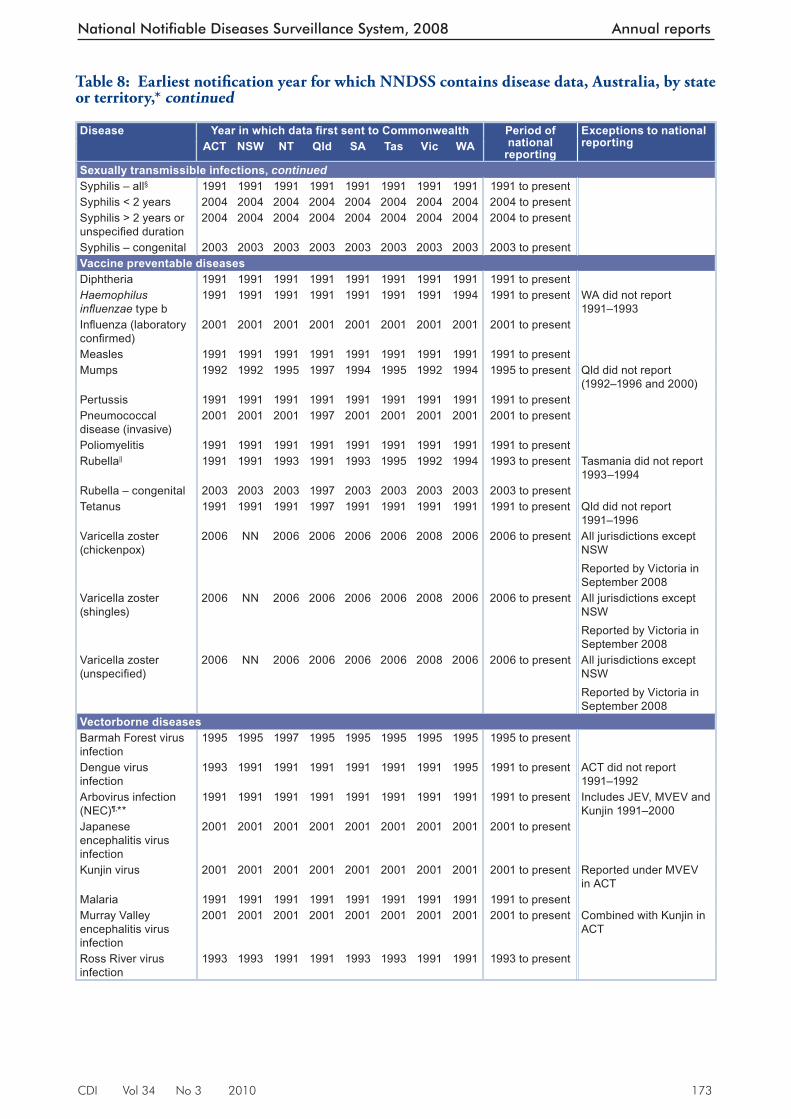
Table 8: Earliest notifi cation year for which NNDSS contains disease data, Australia, by state or territory*
Disease Year in which data fi rst sent to Commonwealth Period of national
reporting
Exceptions to national reportingACT NSW NT Qld SA Tas Vic WA
Bloodborne diseasesHepatitis (NEC) 1991 1991 1991 1991 1991 1991 1991 NN 1991 to present WA do not reportHepatitis B (newly acquired)
1995 1993 1993 1994 1993 1993 1993 1994 1995 to present
Hepatitis B (unspecifi ed)
1991 1991 2004 1994 1991 1991 1991 1991 1991 to present
Hepatitis C (newly acquired)
1995 1993 2005 NN 1993 1995 1997 1995 1993 to present All jurisdictions except Qld
Hepatitis C (unspecifi ed)
1991 1991 1991 1991 1994 1991 1991 1993 1995 to present Includes reports of incident hepatitis C, 1991 to 1994
Hepatitis D 1999 1999 1999 1997 1999 1999 1999 2001 1999 to present WA did not report 1999–2000
Gastrointestinal diseasesBotulism 1992 1998 1998 1997 1993 1992 1992 2001 1992 to present State reporting started
as shownCampylobacteriosis 1991 NN 1991 1991 1991 1991 1991 1991 1991 to present NSW do not reportCryptosporidiosis 2001 2001 2001 1996 2001 2001 2001 2001 2001 to present Haemolytic uraemic syndrome
1999 1999 1999 1997 1999 1999 1999 1999 1999 to present
Hepatitis A 1991 1991 1991 1991 1991 1991 1991 1991 1991 to present Hepatitis E 1999 1999 1999 1999 1999 1999 1999 2001 1999 to present WA did not report
1999–2000Listeriosis 1991 1991 1994 1991 1992 1991 1991 1991 1991 to present SA did not report 1991
NT did not report 1991–1993
Salmonellosis 1991 1991 1991 1991 1991 1991 1991 1991 1991 to present Shigellosis 1991 2001 1991 1997 1991 1991 1991 1991 1991 to present NSW did not report
1991–2000Qld did not report 1991–1996
STEC, VTEC 1999 1999 1999 2002 1999 1999 1999 2001 1999 to present Qld did not report 1991–2001WA did not report 1999–2000
Typhoid† 1991 1991 1991 1991 1991 1991 1991 1991 1991 to present Quarantinable diseasesCholera 1991 1991 1991 1991 1991 1991 1991 1991 1991 to present Highly pathogenic avian infl uenza in humans
2004 2004 2004 2004 2004 2004 2004 2004 2004 to present
Plague 1991 1991 1991 1991 1991 1991 1991 1991 1991 to present Rabies 1993 1997 1991 1991 1991 1991 1991 1991 1991 to present Severe acute respiratory syndrome
2003 2003 2003 2003 2003 2003 2003 2003 2003 to present
Smallpox 2004 2004 2004 2004 2004 2004 2004 2004 2004 to present Viral haemorrhagic fever
1993 1991 1991 1991 1991 1991 1991 1991 1991 to present
Yellow fever 1991 1991 1991 1991 1991 1991 1991 1991 1991 to present Sexually transmissible infectionsChlamydial infection (NEC)
1993 1991 1991 1991 1993 1991 1991 1993 1994 to present NSW did not report 1994–1998
Donovanosis 1991 2002 1991 1991 2002 1993 1991 1991 1991 to present NSW and SA did not report 1991–2001Tasmania did not report 1991–1992
Gonococcal infection‡ 1991 1993 1991 1991 1991 1991 1991 1991 1991 to present
CDI Vol 34 No 3 2010 173
National Notifiable Diseases Surveillance System, 2008 Annual reports
Disease Year in which data fi rst sent to Commonwealth Period of national
reporting
Exceptions to national reportingACT NSW NT Qld SA Tas Vic WA
Sexually transmissible infections, continuedSyphilis – all§ 1991 1991 1991 1991 1991 1991 1991 1991 1991 to present Syphilis < 2 years 2004 2004 2004 2004 2004 2004 2004 2004 2004 to present Syphilis > 2 years or unspecifi ed duration
2004 2004 2004 2004 2004 2004 2004 2004 2004 to present
Syphilis – congenital 2003 2003 2003 2003 2003 2003 2003 2003 2003 to present Vaccine preventable diseasesDiphtheria 1991 1991 1991 1991 1991 1991 1991 1991 1991 to present Haemophilus infl uenzae type b
1991 1991 1991 1991 1991 1991 1991 1994 1991 to present WA did not report 1991–1993
Infl uenza (laboratory confi rmed)
2001 2001 2001 2001 2001 2001 2001 2001 2001 to present
Measles 1991 1991 1991 1991 1991 1991 1991 1991 1991 to present Mumps 1992 1992 1995 1997 1994 1995 1992 1994 1995 to present Qld did not report
(1992–1996 and 2000)Pertussis 1991 1991 1991 1991 1991 1991 1991 1991 1991 to present Pneumococcal disease (invasive)
2001 2001 2001 1997 2001 2001 2001 2001 2001 to present
Poliomyelitis 1991 1991 1991 1991 1991 1991 1991 1991 1991 to present Rubella|| 1991 1991 1993 1991 1993 1995 1992 1994 1993 to present Tasmania did not report
1993–1994Rubella – congenital 2003 2003 2003 1997 2003 2003 2003 2003 2003 to present Tetanus 1991 1991 1991 1997 1991 1991 1991 1991 1991 to present Qld did not report
1991–1996Varicella zoster (chickenpox)
2006 NN 2006 2006 2006 2006 2008 2006 2006 to present All jurisdictions except NSWReported by Victoria in September 2008
Varicella zoster (shingles)
2006 NN 2006 2006 2006 2006 2008 2006 2006 to present All jurisdictions except NSWReported by Victoria in September 2008
Varicella zoster (unspecifi ed)
2006 NN 2006 2006 2006 2006 2008 2006 2006 to present All jurisdictions except NSWReported by Victoria in September 2008
Vectorborne diseasesBarmah Forest virus infection
1995 1995 1997 1995 1995 1995 1995 1995 1995 to present
Dengue virus infection
1993 1991 1991 1991 1991 1991 1991 1995 1991 to present ACT did not report 1991–1992
Arbovirus infection (NEC)¶,**
1991 1991 1991 1991 1991 1991 1991 1991 1991 to present Includes JEV, MVEV and Kunjin 1991–2000
Japanese encephalitis virus infection
2001 2001 2001 2001 2001 2001 2001 2001 2001 to present
Kunjin virus 2001 2001 2001 2001 2001 2001 2001 2001 2001 to present Reported under MVEV in ACT
Malaria 1991 1991 1991 1991 1991 1991 1991 1991 1991 to present Murray Valley encephalitis virus infection
2001 2001 2001 2001 2001 2001 2001 2001 2001 to present Combined with Kunjin in ACT
Ross River virus infection
1993 1993 1991 1991 1993 1993 1991 1991 1993 to present
Table 8: Earliest notifi cation year for which NNDSS contains disease data, Australia, by state or territory,* continued
174 CDI Vol 34 No 3 2010
Annual reports National Notifiable Diseases Surveillance System, 2008
Disease Year in which data fi rst sent to Commonwealth Period of national
reporting
Exceptions to national reportingACT NSW NT Qld SA Tas Vic WA
ZoonosesAnthrax 2001 2001 2001 1991 2002 2001 2001 2001 2001 to present Australian bat lyssavirus
2001 2001 2001 1998 2001 2001 2001 2001 2001 to present
Brucellosis 1991 1991 1991 1991 1991 1991 1991 1991 1991 to present Leptospirosis 1991 1991 1991 1991 1991 1991 1991 1991 1991 to present Lyssavirus (NEC) 2001 2001 2001 1998 2001 2001 2001 2001 2001 to present Ornithosis 1991 2001 1991 1992 1991 1991 1991 1991 1991 to present NSW did not report
1991–2000Qld did not report 1997–2001
Q fever 1991 1991 1991 1991 1991 1991 1991 1991 1991 to present Tularaemia 2004 2004 2004 2004 2004 2004 2004 2004 2004 to present Other bacterial infectionsLegionellosis 1991 1991 1991 1991 1991 1991 1991 1991 1991 to present Leprosy 1991 1991 1991 1991 1991 1991 1991 1991 1991 to present Meningococcal infection
1991 1991 1991 1991 1991 1991 1991 1991 1991 to present
Tuberculosis 1991 1991 1991 1991 1991 1991 1991 1991 1991 to present * Data from the National Notifi able Diseases Surveillance System annual reports from 1991. First full year of reporting to the
Department of health and Ageing is shown. Some diseases may have been notifi able to state or territory health departments before the dates shown here.
† Includes paratyphoid in New South Wales, Queensland and Victoria. ‡ Includes neonatal ophthalmia in the Northern Territory, Queensland, South Australia, and Victoria. § Includes syphilis – congenital from 1991 to 2002. || Includes rubella – congenital from 1991 to 2002. ¶ Before 1997, includes Ross River virus infection, dengue virus infection and Barmah Forest virus infection. ** Flavivirus (NEC) replaced arbovirus (NEC) 1 January 2004. Arbovirus (NEC) replaced Flavivirus (NEC) in 2008. NN Not Notifi able
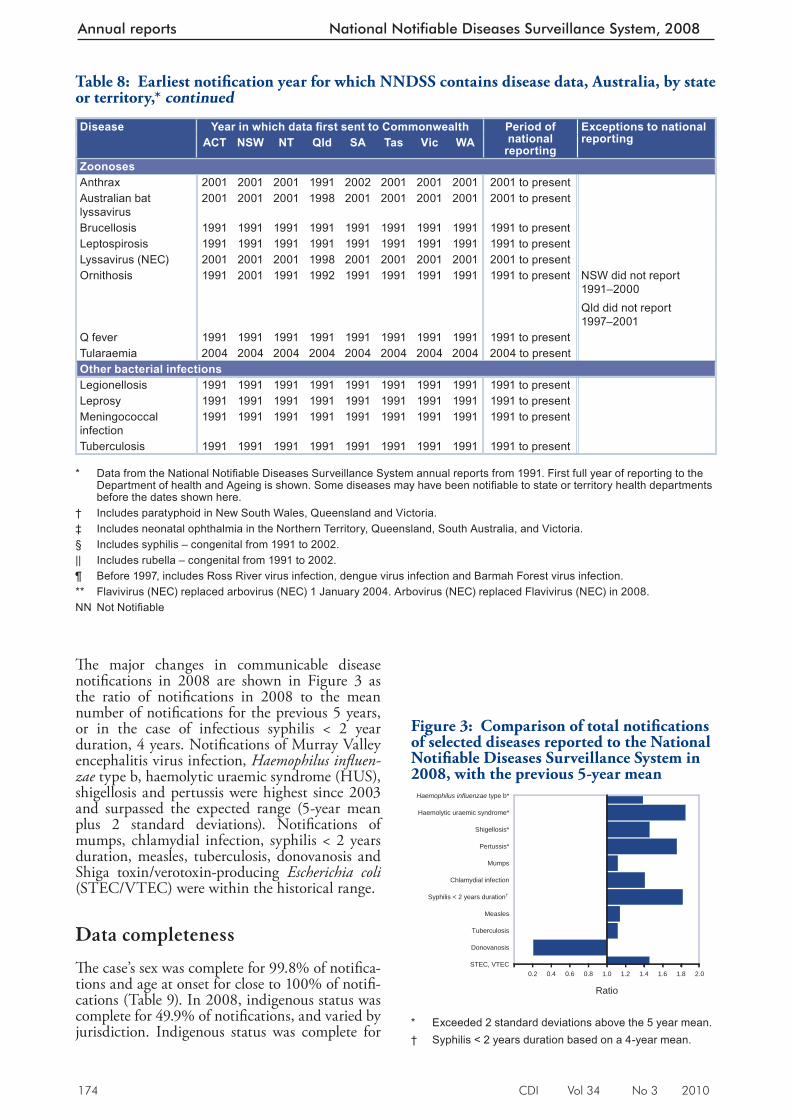
Figure 3: Comparison of total notifi cations of selected diseases reported to the National Notifi able Diseases Surveillance System in 2008, with the previous 5-year mean
0.2 0.4 0.6 0.8 1.0 1.2 1.4 1.6 1.8 2.0
STEC, VTEC
Donovanosis
Tuberculosis
Measles
Syphilis < 2 years duration†
Chlamydial infection
Mumps
Pertussis*
Shigellosis*
Haemolytic uraemic syndrome*
Haemophilus influenzae type b*
Ratio * Exceeded 2 standard deviations above the 5 year mean. † Syphilis < 2 years duration based on a 4-year mean.
Table 8: Earliest notifi cation year for which NNDSS contains disease data, Australia, by state or territory,* continued
Th e major changes in commu nicable disease notifi cations in 2008 are shown in Figure 3 as the ratio of notifi cations in 2008 to the mean number of notifi cations for the previous 5 years, or in the case of infectious syphilis < 2 year duration, 4 years. Notifi cations of Murray Valley encephalitis virus infection, Haemophilus infl uen-zae type b, haemolytic uraemic syndrome (HUS), shigellosis and pertussis were highest since 2003 and surpassed the expected range (5-year mean plus 2 standard deviations). Notifi cations of mumps, chlamydial infection, syphilis < 2 years duration, measles, tuberculosis, donovanosis and Shiga toxin/verotoxin-producing Escherichia coli (STEC/VTEC) were within the historical range.
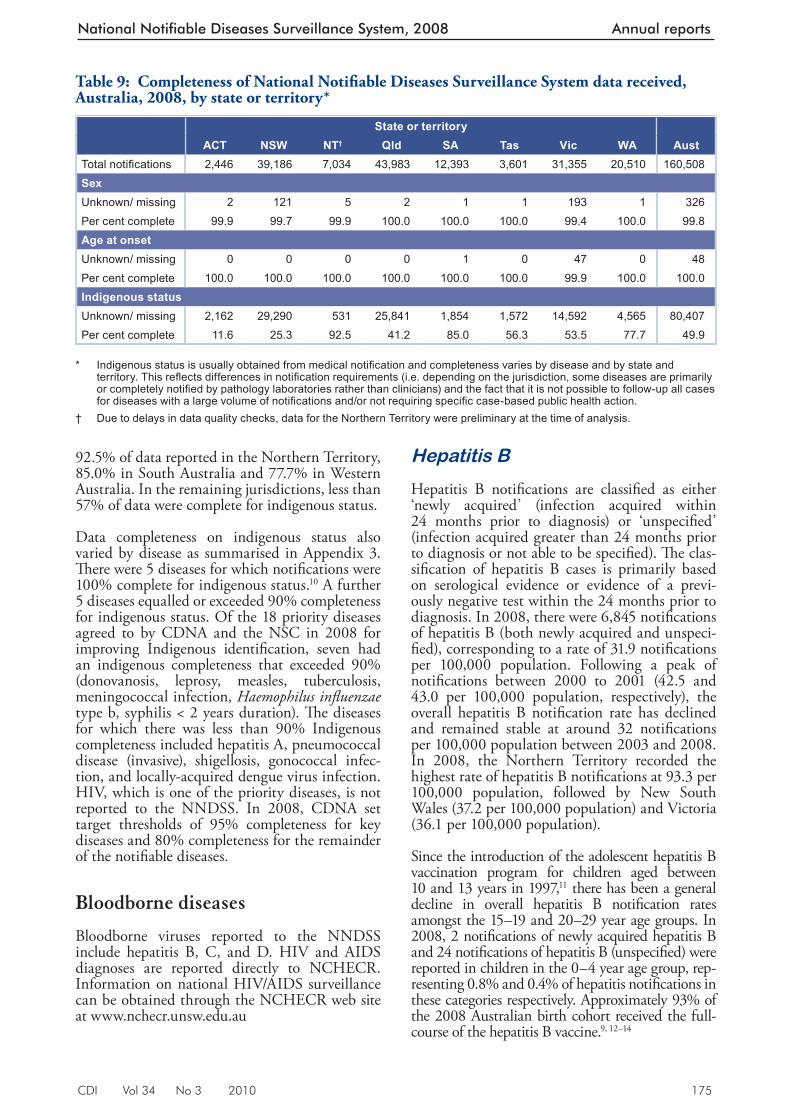
Data completeness
Th e case’s sex was complete for 99.8% of notifi ca-tions and age at onset for close to 100% of notifi -cations (Table 9). In 2008, indigenous status was complete for 49.9% of notifi cations, and varied by jurisdiction. Indigenous status was complete for
CDI Vol 34 No 3 2010 175
National Notifiable Diseases Surveillance System, 2008 Annual reports
92.5% of data reported in the Northern Territory, 85.0% in South Australia and 77.7% in Western Australia. In the remaining jurisdictions, less than 57% of data were complete for indigenous status.
Data completeness on indigenous status also varied by disease as summarised in Appendix 3. Th ere were 5 diseases for which notifi cations were 100% complete for indigenous status. 10 A further 5 diseases equalled or exceeded 90% completeness for indigenous status. Of the 18 priority diseases agreed to by CDNA and the NSC in 2008 for improving Indigenous identifi cation, seven had an indigenous completeness that exceeded 90% (donovanosis, leprosy, measles, tuberculosis, meningococcal infection, Haemophilus infl uenzae type b, syphilis < 2 years duration). Th e diseases for which there was less than 90% Indigenous completeness included hepatitis A, pneumococcal disease (invasive), shigellosis, gonococcal infec-tion, and locally-acquired dengue virus infection. HIV, which is one of the priority diseases, is not reported to the NNDSS. In 2008, CDNA set target thresholds of 95% completeness for key diseases and 80% completeness for the remainder of the notifi able diseases.
Bloodborne diseases
Bloodborne viruses reported to the NNDSS include hepatitis B, C, and D. HIV and AIDS diagnoses are reported directly to NCHECR. Information on national HIV/AIDS surveillance can be obtained through the NCHECR web site at www.nchecr.unsw.edu.au
Hepatitis B
Hepatitis B notifi cations are classifi ed as either ‘newly acquired’ (infection acquired within 24 months prior to diagnosis) or ‘unspecifi ed’ (infection acquired greater than 24 months prior to diagnosis or not able to be specifi ed). Th e clas-sifi cation of hepatitis B cases is primarily based on serological evidence or evidence of a previ-ously negative test within the 24 months prior to diagnosis. In 2008, there were 6,845 notifi cations of hepatitis B (both newly acquired and unspeci-fi ed), corresponding to a rate of 31.9 notifi cations per 100,000 population. Following a peak of notifi cations between 2000 to 2001 (42.5 and 43.0 per 100,000 population, respectively), the overall hepatitis B notifi cation rate has declined and remained stable at around 32 notifi cations per 100,000 population between 2003 and 2008. In 2008, the Northern Territory recorded the highest rate of hepatitis B notifi cations at 93.3 per 100,000 population, followed by New South Wales (37.2 per 100,000 population) and Victoria (36.1 per 100,000 population).
Since the introduction of the adolescent hepatitis B vaccination program for children aged between 10 and 13 years in 1997, 11 there has been a general decline in overall hepatitis B notifi cation rates amongst the 15–19 and 20–29 year age groups. In 2008, 2 notifi cations of newly acquired hepatitis B and 24 notifi cations of hepatitis B (unspecifi ed) were reported in children in the 0–4 year age group, rep-resenting 0.8% and 0.4% of hepatitis notifi cations in these categories respectively. Approximately 93% of the 2008 Australian birth cohort received the full-course of the hepatitis B vaccine. 9, 12–14
Table 9: Completeness of National Notifi able Diseases Surveillance System data received, Australia, 2008, by state or territory*
State or territory ACT NSW NT† Qld SA Tas Vic WA Aust
Total notifi cations 2,446 39,186 7,034 43,983 12,393 3,601 31,355 20,510 160,508SexUnknown/ missing 2 121 5 2 1 1 193 1 326Per cent complete 99.9 99.7 99.9 100.0 100.0 100.0 99.4 100.0 99.8Age at onsetUnknown/ missing 0 0 0 0 1 0 47 0 48Per cent complete 100.0 100.0 100.0 100.0 100.0 100.0 99.9 100.0 100.0Indigenous statusUnknown/ missing 2,162 29,290 531 25,841 1,854 1,572 14,592 4,565 80,407Per cent complete 11.6 25.3 92.5 41.2 85.0 56.3 53.5 77.7 49.9
* Indigenous status is usually obtained from medical notifi cation and completeness varies by disease and by state and
territory. This refl ects differences in notifi cation requirements (i.e. depending on the jurisdiction, some diseases are primarily or completely notifi ed by pathology laboratories rather than clinicians) and the fact that it is not possible to follow-up all cases for diseases with a large volume of notifi cations and/or not requiring specifi c case-based public health action.
† Due to delays in data quality checks, data for the Northern Territory were preliminary at the time of analysis.
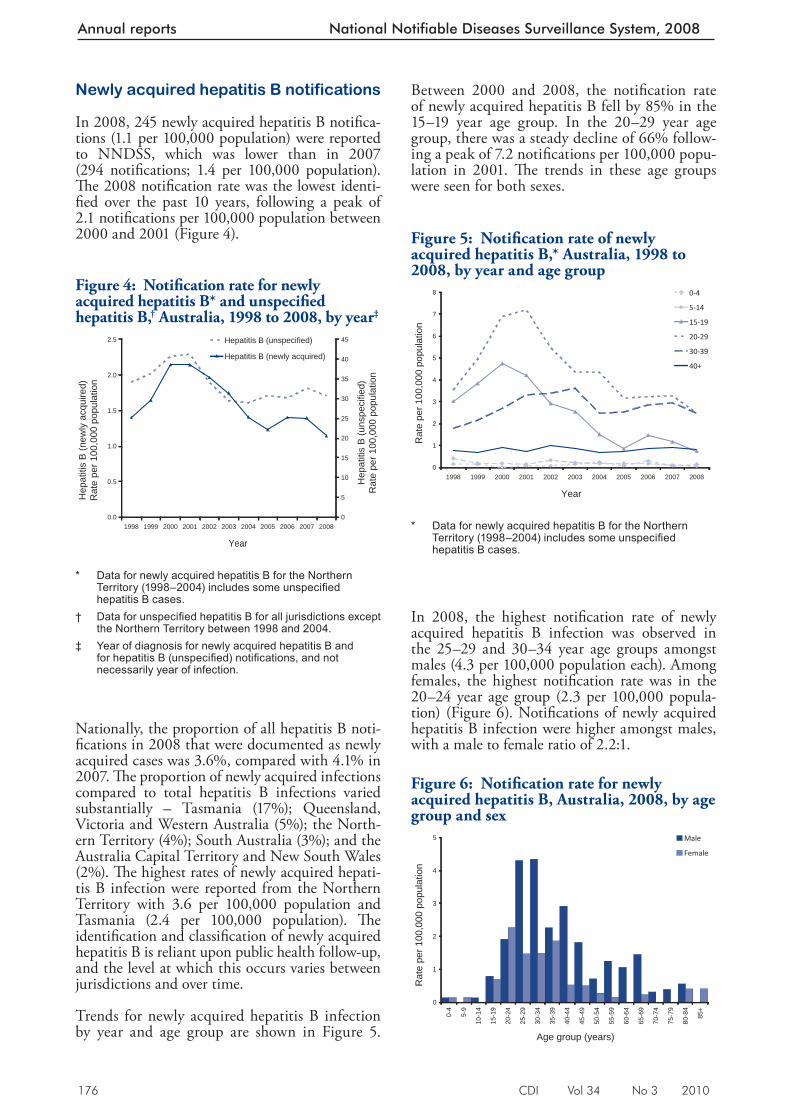
176 CDI Vol 34 No 3 2010
Annual reports National Notifiable Diseases Surveillance System, 2008
Newly acquired hepatitis B notifications
In 2008, 245 newly acquired hepatitis B notifi ca-tions (1.1 per 100,000 population) were reported to NNDSS, which was lower than in 2007 (294 notifi cations; 1.4 per 100,000 population). Th e 2008 notifi cation rate was the lowest identi-fi ed over the past 10 years, following a peak of 2.1 notifi cations per 100,000 population between 2000 and 2001 (Figure 4).
Nationally, the proportion of all hepatitis B noti-fi cations in 2008 that were documented as newly acquired cases was 3.6%, compared with 4.1% in 2007. Th e proportion of newly acquired infections compared to total hepatitis B infections varied substantially – Tasmania (17%); Queensland, Victoria and Western Australia (5%); the North-ern Territory (4%); South Australia (3%); and the Australia Capital Territory and New South Wales (2%). Th e highest rates of newly acquired hepati-tis B infection were reported from the Northern Territory with 3.6 per 100,000 population and Tasmania (2.4 per 100,000 population). Th e identifi cation and classifi cation of newly acquired hepatitis B is reliant upon public health follow-up, and the level at which this occurs varies between jurisdictions and over time.
Trends for newly acquired hepatitis B infection by year and age group are shown in Figure 5.
Between 2000 and 2008, the notifi cation rate of newly acquired hepatitis B fell by 85% in the 15–19 year age group. In the 20–29 year age group, there was a steady decline of 66% follow-ing a peak of 7.2 notifi cations per 100,000 popu-lation in 2001. Th e trends in these age groups were seen for both sexes.
In 2008, the highest notifi cation rate of newly acquired hepatitis B infection was observed in the 25–29 and 30–34 year age groups amongst males (4.3 per 100,000 population each). Among females, the highest notifi cation rate was in the 20–24 year age group (2.3 per 100,000 popula-tion) (Figure 6). Notifi cations of newly acquired hepatitis B infection were higher amongst males, with a male to female ratio of 2.2:1.
Figure 4: Notifi cation rate for newly acquired hepatitis B* and unspecifi ed hepatitis B, † Australia, 1998 to 2008, by year ‡
0.0
0.5
1.0
1.5
2.0
2.5
1998 1999 2000 2001 2002 2003 2004 2005 2006 2007 2008
Year
Hep
atiti
s B
(new
ly a
cqui
red)
Rat
e pe
r 100
,000
pop
ulat
ion
0
5
10
15
20
25
30
35
40
45
Hep
atiti
s B
(uns
peci
fied)
Rat
e pe
r 100
,000
pop
ulat
ion
Hepatitis B (unspecified)
Hepatitis B (newly acquired)
* Data for newly acquired hepatitis B for the Northern
Territory (1998–2004) includes some unspecifi ed hepatitis B cases.
† Data for unspecifi ed hepatitis B for all jurisdictions except the Northern Territory between 1998 and 2004.
‡ Year of diagnosis for newly acquired hepatitis B and for hepatitis B (unspecifi ed) notifi cations, and not necessarily year of infection.
Figure 5: Notifi cation rate of newly acquired hepatitis B,* Australia, 1998 to 2008, by year and age group
0
1
2
3
4
5
6
7
8
1998 1999 2000 2001 2002 2003 2004 2005 2006 2007 2008
Year
Rat
e pe
r 100
,000
pop
ulat
ion
0-4
5-14
15-19
20-29
30-39
40+
* Data for newly acquired hepatitis B for the Northern
Territory (1998–2004) includes some unspecifi ed hepatitis B cases.
Figure 6: Notifi cation rate for newly acquired hepatitis B, Australia, 2008, by age group and sex
0
1
2
3
4
5
0-4
5-9
10-1
4
15-1
9
20-2
4
25-2
9
30-3
4
35-3
9
40-4
4
45-4
9
50-5
4
55-5
9
60-6
4
65-6
9
70-7
4
75-7
9
80-8
4
85+
Age group (years)
Rat
e pe
r 100
,000
pop
ulat
ion
Male
Female
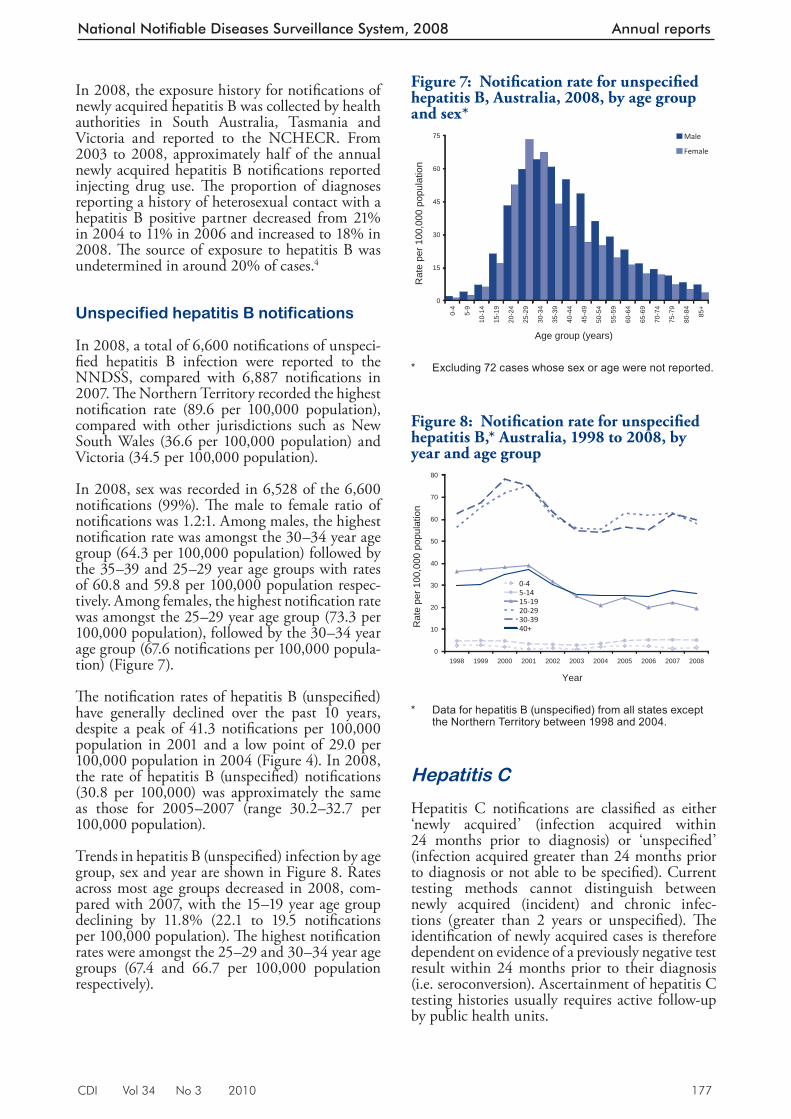
CDI Vol 34 No 3 2010 177
National Notifiable Diseases Surveillance System, 2008 Annual reports
In 2008, the exposure history for notifi cations of newly acquired hepatitis B was collected by health authorities in South Australia, Tasmania and Victoria and reported to the NCHECR. From 2003 to 2008, approximately half of the annual newly acquired hepatitis B notifi cations reported injecting drug use. Th e proportion of diagnoses reporting a history of heterosexual contact with a hepatitis B positive partner decreased from 21% in 2004 to 11% in 2006 and increased to 18% in 2008. Th e source of exposure to hepatitis B was undetermined in around 20% of cases. 4
Unspecified hepatitis B notifications
In 2008, a total of 6,600 notifi cations of unspeci-fi ed hepatitis B infection were reported to the NNDSS, compared with 6,887 notifi cations in 2007. Th e Northern Territory recorded the highest notifi cation rate (89.6 per 100,000 population), compared with other jurisdictions such as New South Wales (36.6 per 100,000 population) and Victoria (34.5 per 100,000 population).
In 2008, sex was recorded in 6,528 of the 6,600 notifi cations (99%). Th e male to female ratio of notifi cations was 1.2:1. Among males, the highest notifi cation rate was amongst the 30–34 year age group (64.3 per 100,000 population) followed by the 35–39 and 25–29 year age groups with rates of 60.8 and 59.8 per 100,000 population respec-tively. Among females, the highest notifi cation rate was amongst the 25–29 year age group (73.3 per 100,000 population), followed by the 30–34 year age group (67.6 notifi cations per 100,000 popula-tion) (Figure 7).
Th e notifi cation rates of hepatitis B (unspecifi ed) have generally declined over the past 10 years, despite a peak of 41.3 notifi cations per 100,000 population in 2001 and a low point of 29.0 per 100,000 population in 2004 (Figure 4). In 2008, the rate of hepatitis B (unspecifi ed) notifi cations (30.8 per 100,000) was approximately the same as those for 2005–2007 (range 30.2–32.7 per 100,000 population).
Trends in hepatitis B (unspecifi ed) infection by age group, sex and year are shown in Figure 8. Rates across most age groups decreased in 2008, com-pared with 2007, with the 15–19 year age group declining by 11.8% (22.1 to 19.5 notifi cations per 100,000 population). Th e highest notifi cation rates were amongst the 25–29 and 30–34 year age groups (67.4 and 66.7 per 100,000 population respectively).
Hepatitis C
Hepatitis C notifi cations are classifi ed as either ‘newly acquired’ (infection acquired within 24 months prior to diagnosis) or ‘unspecifi ed’ (infection acquired greater than 24 months prior to diagnosis or not able to be specifi ed). Current testing methods cannot distinguish between newly acquired (incident) and chronic infec-tions (greater than 2 years or unspecifi ed). Th e identifi cation of newly acquired cases is therefore dependent on evidence of a previously negative test result within 24 months prior to their diagnosis (i.e. seroconversion). Ascertainment of hepatitis C testing histories usually requires active follow-up by public health units.
Figure 7: Notifi cation rate for unspecifi ed hepatitis B, Australia, 2008, by age group and sex*
0
15
30
45
60
75
0-4
5-9
10-1
4
15-1
9
20-2
4
25-2
9
30-3
4
35-3
9
40-4
4
45-4
9
50-5
4
55-5
9
60-6
4
65-6
9
70-7
4
75-7
9
80-8
4
85+
Age group (years)
Rat
e pe
r 100
,000
pop
ulat
ion
Male
Female
* Excluding 72 cases whose sex or age were not reported.
Figure 8: Notifi cation rate for unspecifi ed hepatitis B,* Australia, 1998 to 2008, by year and age group
0
10
20
30
40
50
60
70
80
1998 1999 2000 2001 2002 2003 2004 2005 2006 2007 2008
Year
Rat
e pe
r 100
,000
pop
ulat
ion
0-45-1415-1920-2930-3940+
* Data for hepatitis B (unspecifi ed) from all states except
the Northern Territory between 1998 and 2004.
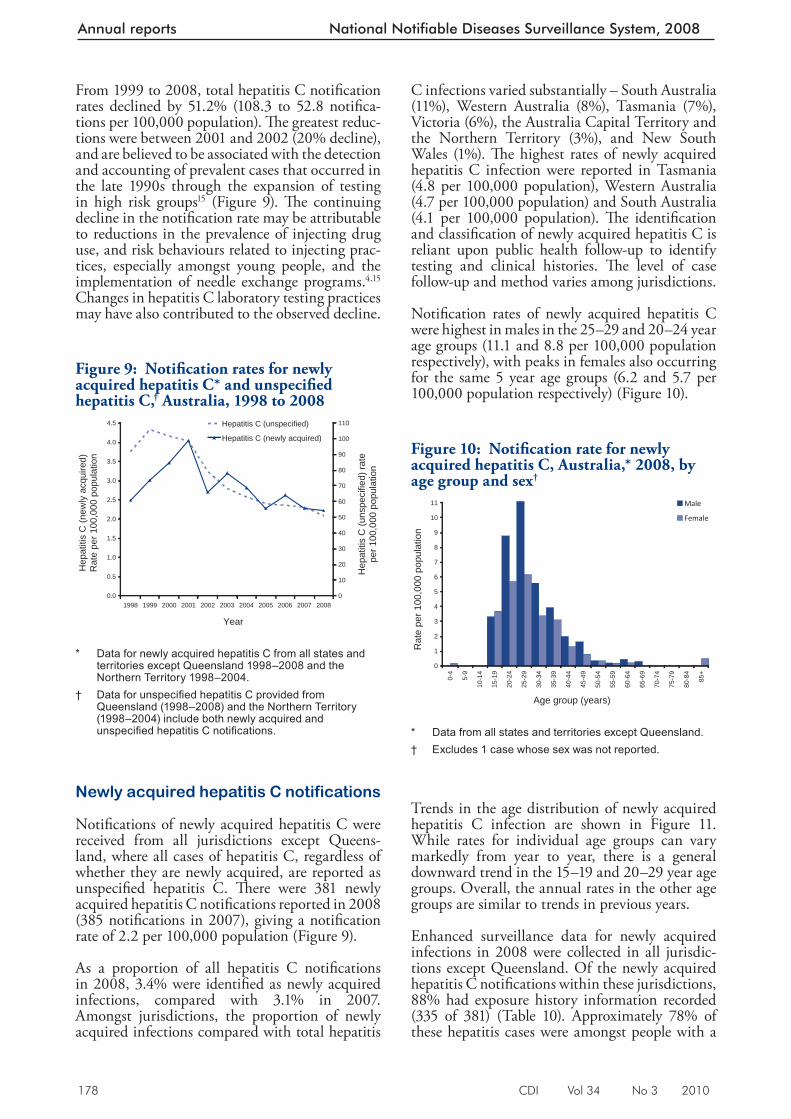
178 CDI Vol 34 No 3 2010
Annual reports National Notifiable Diseases Surveillance System, 2008
From 1999 to 2008, total hepatitis C notifi cation rates declined by 51.2% (108.3 to 52.8 notifi ca-tions per 100,000 population). Th e greatest reduc-tions were between 2001 and 2002 (20% decline), and are believed to be associated with the detection and accounting of prevalent cases that occurred in the late 1990s through the expansion of testing in high risk groups 15 (Figure 9). Th e continuing decline in the notifi cation rate may be attributable to reductions in the prevalence of injecting drug use, and risk behaviours related to injecting prac-tices, especially amongst young people, and the implementation of needle exchange programs. 4,15 Changes in hepatitis C laboratory testing practices may have also contributed to the observed decline.
Newly acquired hepatitis C notifications
Notifi cations of newly acquired hepatitis C were received from all jurisdictions except Queens-land, where all cases of hepatitis C, regardless of whether they are newly acquired, are reported as unspecifi ed hepatitis C. Th ere were 381 newly acquired hepatitis C notifi cations reported in 2008 (385 notifi cations in 2007), giving a notifi cation rate of 2.2 per 100,000 population (Figure 9).
As a proportion of all hepatitis C notifi cations in 2008, 3.4% were identifi ed as newly acquired infections, compared with 3.1% in 2007. Amongst jurisdictions, the proportion of newly acquired infections compared with total hepatitis
C infections varied substantially – South Australia (11%), Western Australia (8%), Tasmania (7%), Victoria (6%), the Australia Capital Territory and the Northern Territory (3%), and New South Wales (1%). Th e highest rates of newly acquired hepatitis C infection were reported in Tasmania (4.8 per 100,000 population), Western Australia (4.7 per 100,000 population) and South Australia (4.1 per 100,000 population). Th e identifi cation and classifi cation of newly acquired hepatitis C is reliant upon public health follow-up to identify testing and clinical histories. Th e level of case follow-up and method varies among jurisdictions.
Notifi cation rates of newly acquired hepatitis C were highest in males in the 25–29 and 20–24 year age groups (11.1 and 8.8 per 100,000 population respectively), with peaks in females also occurring for the same 5 year age groups (6.2 and 5.7 per 100,000 population respectively) (Figure 10).
Trends in the age distribution of newly acquired hepatitis C infection are shown in Figure 11. While rates for individual age groups can vary markedly from year to year, there is a general downward trend in the 15–19 and 20–29 year age groups. Overall, the annual rates in the other age groups are similar to trends in previous years.
Enhanced surveillance data for newly acquired infections in 2008 were collected in all jurisdic-tions except Queensland. Of the newly acquired hepatitis C notifi cations within these jurisdictions, 88% had exposure history information recorded (335 of 381) (Table 10). Approximately 78% of these hepatitis cases were amongst people with a
Figure 9: Notifi cation rates for newly acquired hepatitis C* and unspecifi ed hepatitis C, † Australia, 1998 to 2008
0.0
0.5
1.0
1.5
2.0
2.5
3.0
3.5
4.0
4.5
1998 1999 2000 2001 2002 2003 2004 2005 2006 2007 2008
Year
Hep
atiti
s C
(new
ly a
cqui
red)
Rat
e pe
r 100
,000
pop
ulat
ion
0
10
20
30
40
50
60
70
80
90
100
110
Hep
atiti
s C
(uns
peci
fied)
rate
pe
r 100
,000
pop
ulat
ion
Hepatitis C (unspecified)
Hepatitis C (newly acquired)
* Data for newly acquired hepatitis C from all states and
territories except Queensland 1998–2008 and the Northern Territory 1998–2004.
† Data for unspecifi ed hepatitis C provided from Queensland (1998–2008) and the Northern Territory (1998–2004) include both newly acquired and unspecifi ed hepatitis C notifi cations.
Figure 10: Notifi cation rate for newly acquired hepatitis C, Australia,* 2008, by age group and sex†
0
1
2
3
4
5
6
7
8
9
10
11
0-4
5-9
10-1
4
15-1
9
20-2
4
25-2
9
30-3
4
35-3
9
40-4
4
45-4
9
50-5
4
55-5
9
60-6
4
65-6
9
70-7
4
75-7
9
80-8
4
85+
Age group (years)
Rat
e pe
r 100
,000
pop
ulat
ion
Male
Female
* Data from all states and territories except Queensland. † Excludes 1 case whose sex was not reported.
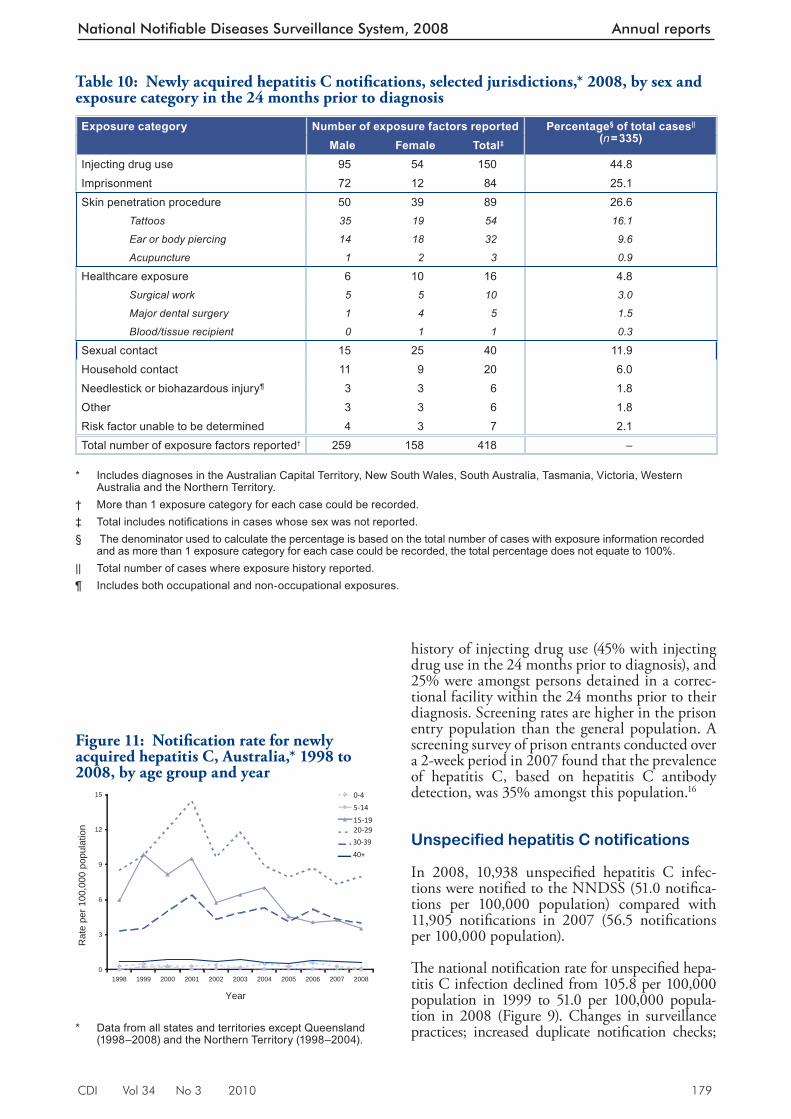
CDI Vol 34 No 3 2010 179
National Notifiable Diseases Surveillance System, 2008 Annual reports
history of injecting drug use (45% with injecting drug use in the 24 months prior to diagnosis), and 25% were amongst persons detained in a correc-tional facility within the 24 months prior to their diagnosis. Screening rates are higher in the prison entry population than the general population. A screening survey of prison entrants conducted over a 2-week period in 2007 found that the prevalence of hepatitis C, based on hepatitis C antibody detection, was 35% amongst this population. 16
Unspecified hepatitis C notifications
In 2008, 10,938 unspecifi ed hepatitis C infec-tions were notifi ed to the NNDSS (51.0 notifi ca-tions per 100,000 population) compared with 11,905 notifi cations in 2007 (56.5 notifi cations per 100,000 population).
Th e national notifi cation rate for unspecifi ed hepa-titis C infection declined from 105.8 per 100,000 population in 1999 to 51.0 per 100,000 popula-tion in 2008 (Figure 9). Changes in surveillance practices; increased duplicate notifi cation checks;
Figure 11: Notifi cation rate for newly acquired hepatitis C, Australia,* 1998 to 2008, by age group and year
0
3
6
9
12
15
1998 1999 2000 2001 2002 2003 2004 2005 2006 2007 2008
Year
Rat
e pe
r 100
,000
pop
ulat
ion
0-4
5-14
15-1920-29
30-39
40+
* Data from all states and territories except Queensland
(1998–2008) and the Northern Territory (1998–2004).
Table 10: Newly acquire d hepatitis C notifi cations, selected jurisdictions,* 2008, by sex and exposure category in the 24 months prior to diagnosis
Exposure category Number of exposure factors reported Percentage§ of total cases|| (n = 335)Male Female Total‡
Injecting drug use 95 54 150 44.8Imprisonment 72 12 84 25.1Skin penetration procedure 50 39 89 26.6 Tattoos 35 19 54 16.1
Ear or body piercing 14 18 32 9.6
Acupuncture 1 2 3 0.9
Healthcare exposure 6 10 16 4.8 Surgical work 5 5 10 3.0
Major dental surgery 1 4 5 1.5
Blood/tissue recipient 0 1 1 0.3
Sexual contact 15 25 40 11.9Household contact 11 9 20 6.0Needlestick or biohazardous injury¶ 3 3 6 1.8Other 3 3 6 1.8Risk factor unable to be determined 4 3 7 2.1Total number of exposure factors reported† 259 158 418 –
* Includes diagnoses in the Australian Capital Territory, New South Wales, South Australia, Tasmania, Victoria, Western
Australia and the Northern Territory. † More than 1 exposure category for each case could be recorded. ‡ Total includes notifi cations in cases whose sex was not reported. § The denominator used to calculate the percentage is based on the total number of cases with exposure information recorded
and as more than 1 exposure category for each case could be recorded, the total percentage does not equate to 100%. || Total number of cases where exposure history reported. ¶ Includes both occupational and non-occupational exposures.
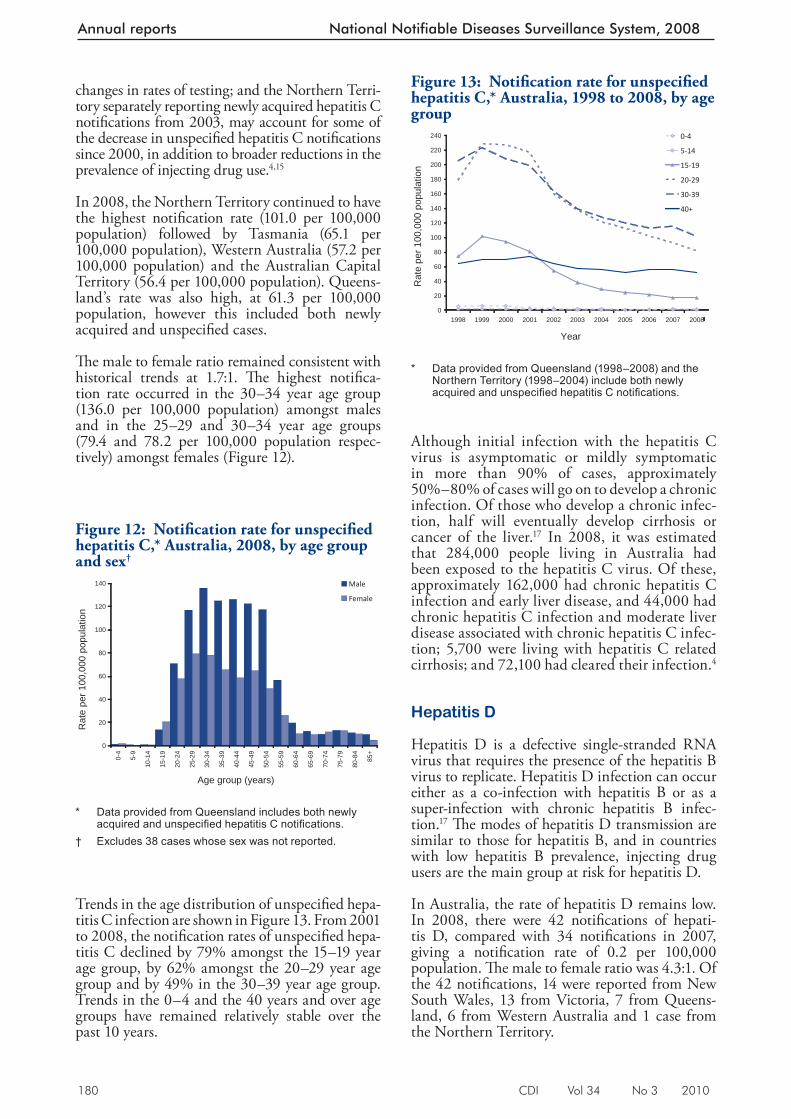
180 CDI Vol 34 No 3 2010
Annual reports National Notifiable Diseases Surveillance System, 2008
Although initial infection with the hepatitis C virus is asymptomatic or mildly symptomatic in more than 90% of cases, approximately 50%–80% of cases will go on to develop a chronic infection. Of those who develop a chronic infec-tion, half will eventually develop cirrhosis or cancer of the liver. 17 In 2008, it was estimated that 284,000 people living in Australia had been exposed to the hepatitis C virus. Of these, approximately 162,000 had chronic hepatitis C infection and early liver disease, and 44,000 had chronic hepatitis C infection and moderate liver disease associated with chronic hepatitis C infec-tion; 5,700 were living with hepatitis C related cirrhosis; and 72,100 had cleared their infection. 4
Hepatitis D
Hepatitis D is a defective single-stranded RNA virus that requires the presence of the hepatitis B virus to replicate. Hepatitis D infection can occur either as a co-infection with hepatitis B or as a super-infection with chronic hepatitis B infec-tion. 17 Th e modes of hepatitis D transmission are similar to those for hepatitis B, and in countries with low hepatitis B prevalence, injecting drug users are the main group at risk for hepatitis D.
In Australia, the rate of hepatitis D remains low. In 2008, there were 42 notifi cations of hepati-tis D, compared with 34 notifi cations in 2007, giving a notifi cation rate of 0.2 per 100,000 population. Th e male to female ratio was 4.3:1. Of the 42 notifi cations, 14 were reported from New South Wales, 13 from Victoria, 7 from Queens-land, 6 from Western Australia and 1 case from the Northern Territory.
Figure 13: Notifi cation rate for unspecifi ed hepatitis C,* Australia, 1998 to 2008, by age group
0
20
40
60
80
100
120
140
160
180
200
220
240
1998 1999 2000 2001 2002 2003 2004 2005 2006 2007 2008
Year
Rat
e pe
r 100
,000
pop
ulat
ion
0-4
5-14
15-19
20-29
30-39
40+
* Data provided from Queensland (1998–2008) and the
Northern Territory (1998–2004) include both newly acquired and unspecifi ed hepatitis C notifi cations.
changes in rates of testing; and the Northern Terri-tory separately reporting newly acquired hepatitis C notifi cations from 2003, may account for some of the decrease in unspecifi ed hepatitis C notifi cations since 2000, in addition to broader reductions in the prevalence of injecting drug use. 4,15
In 2008, the Northern Territory continued to have the highest notifi cation rate (101.0 per 100,000 population) followed by Tasmania (65.1 per 100,000 population), Western Australia (57.2 per 100,000 population) and the Australian Capital Territory (56.4 per 100,000 population). Queens-land’s rate was also high, at 61.3 per 100,000 population, however this included both newly acquired and unspecifi ed cases.
Th e male to female ratio remained consistent with historical trends at 1.7:1. Th e highest notifi ca-tion rate occurred in the 30–34 year age group (136.0 per 100,000 population) amongst males and in the 25–29 and 30–34 year age groups (79.4 and 78.2 per 100,000 population respec-tively) amongst females (Figure 12).
Trends in the age distribution of unspecifi ed hepa-titis C infection are shown in Figure 13. From 2001 to 2008, the notifi cation rates of unspecifi ed hepa-titis C declined by 79% amongst the 15–19 year age group, by 62% amongst the 20–29 year age group and by 49% in the 30–39 year age group. Trends in the 0–4 and the 40 years and over age groups have remained relatively stable over the past 10 years.
Figure 12: Notifi cation rate for unspecifi e d hepatitis C,* Australia, 2008, by age group and sex†
0
20
40
60
80
100
120
140
0-4
5-9
10-1
4
15-1
9
20-2
4
25-2
9
30-3
4
35-3
9
40-4
4
45-4
9
50-5
4
55-5
9
60-6
4
65-6
9
70-7
4
75-7
9
80-8
4
85+
Age group (years)
Rat
e pe
r 100
,000
pop
ulat
ion
Male
Female
* Data provided from Queensland includes both newly
acquired and unspecifi ed hepatitis C notifi cations. † Excludes 38 cases whose sex was not reported.
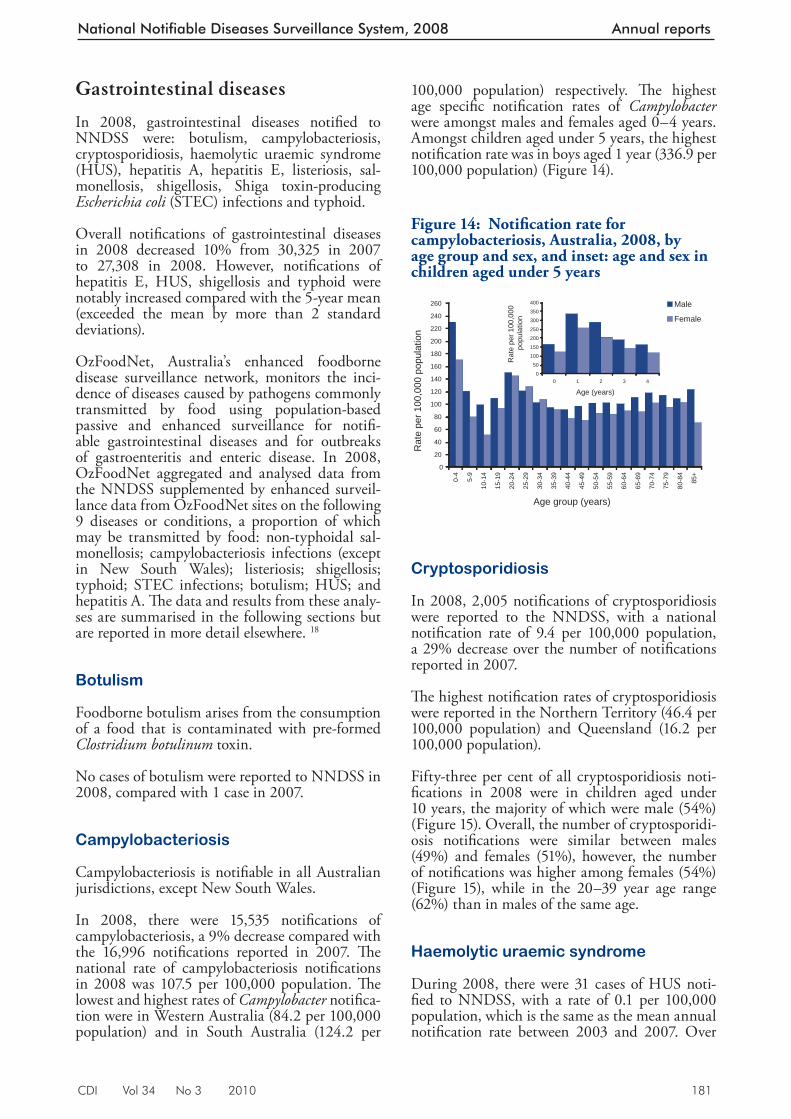
CDI Vol 34 No 3 2010 181
National Notifiable Diseases Surveillance System, 2008 Annual reports
Gastrointestinal diseases
In 2008, gastrointestinal diseases notifi ed to NNDSS were: botulism, campylobacteriosis, cryptosporidiosis, haemolytic uraemic syndrome (HUS), hepatitis A, hepatitis E, listeriosis, sal-monellosis, shigellosis, Shiga toxin-producing Escherichia coli (STEC) infections and typhoid.
Overall notifi cations of gastrointestinal diseases in 2008 decreased 10% from 30,325 in 2007 to 27,308 in 2008. However, notifi cations of hepatitis E, HUS, shigellosis and typhoid were notably increased compared with the 5-year mean (exceeded the mean by more than 2 standard deviations).
OzFoodNet, Australia’s enhanced foodborne disease surveillance network, monitors the inci-dence of diseases caused by pathogens commonly transmitted by food using population-based passive and enhanced surveillance for notifi -able gastrointestinal diseases and for outbreaks of gastroenteritis and enteric disease. In 2008, OzFoodNet aggregated and analysed data from the NNDSS supplemented by enhanced surveil-lance data from OzFoodNet sites on the following 9 diseases or conditions, a proportion of which may be transmitted by food: non-typhoidal sal-monellosis; campylobacteriosis infections (except in New South Wales); listeriosis; shigellosis; typhoid; STEC infections; botulism; HUS; and hepatitis A. Th e data and results from these analy-ses are summarised in the following sections but are reported in more detail elsewhere. 18
Botulism
Foodborne botulism arises from the consumption of a food that is contaminated with pre-formed Clostridium botulinum toxin.
No cases of botulism were reported to NNDSS in 2008, compared with 1 case in 2007.
Campylobacteriosis
Campylobacteriosis is notifi able in all Australian jurisdictions, except New South Wales.
In 2008, there were 15,535 notifi cations of campylobacteriosis, a 9% decrease compared with the 16,996 notifi cations reported in 2007. Th e national rate of campylobacteriosis notifi cations in 2008 was 107.5 per 100,000 population. Th e lowest and highest rates of Campylobacter notifi ca-tion were in Western Australia (84.2 per 100,000 population) and in South Australia (124.2 per
100,000 population) respectively. Th e highest age specifi c notifi cation rates of Campylobacter were amongst males and females aged 0–4 years. Amongst children aged under 5 years, the highest notifi cation rate was in boys aged 1 year (336.9 per 100,000 population) (Figure 14).
Cryptosporidiosis
In 2008, 2,005 notifi cations of cryptosporidiosis were reported to the NNDSS, with a national notifi cation rate of 9.4 per 100,000 population, a 29% decrease over the number of notifi cations reported in 2007.
Th e highest notifi cation rates of cryptosporidiosis were reported in the Northern Territory (46.4 per 100,000 population) and Queensland (16.2 per 100,000 population).
Fifty-three per cent of all cryptosporidiosis noti-fi cations in 2008 were in children aged under 10 years, the majority of which were male (54%) (Figure 15). Overall, the number of cryptosporidi-osis notifi cations were similar between males (49%) and females (51%), however, the number of notifi cations was higher among females (54%) (Figure 15), while in the 20–39 year age range (62%) than in males of the same age.
Haemolytic uraemic syndrome
During 2008, there were 31 cases of HUS noti-fi ed to NNDSS, with a rate of 0.1 per 100,000 population, which is the same as the mean annual notifi cation rate between 2003 and 2007. Over
Figure 14: Notifi cation rate for campylobact eriosis, Australia, 2008, by age group and sex, and inset: age and sex in children aged under 5 years
0
20
40
60
80
100
120
140
160
180
200
220
240
260
0-4
5-9
10-1
4
15-1
9
20-2
4
25-2
9
30-3
4
35-3
9
40-4
4
45-4
9
50-5
4
55-5
9
60-6
4
65-6
9
70-7
4
75-7
9
80-8
4
85+
Age group (years)
Rat
e pe
r 100
,000
pop
ulat
ion
Male
Female
0
50
100
150
200
250
300
350
400
0 1 2 3 4
Age (years)
Rat
e pe
r 100
,000
po
pula
tion
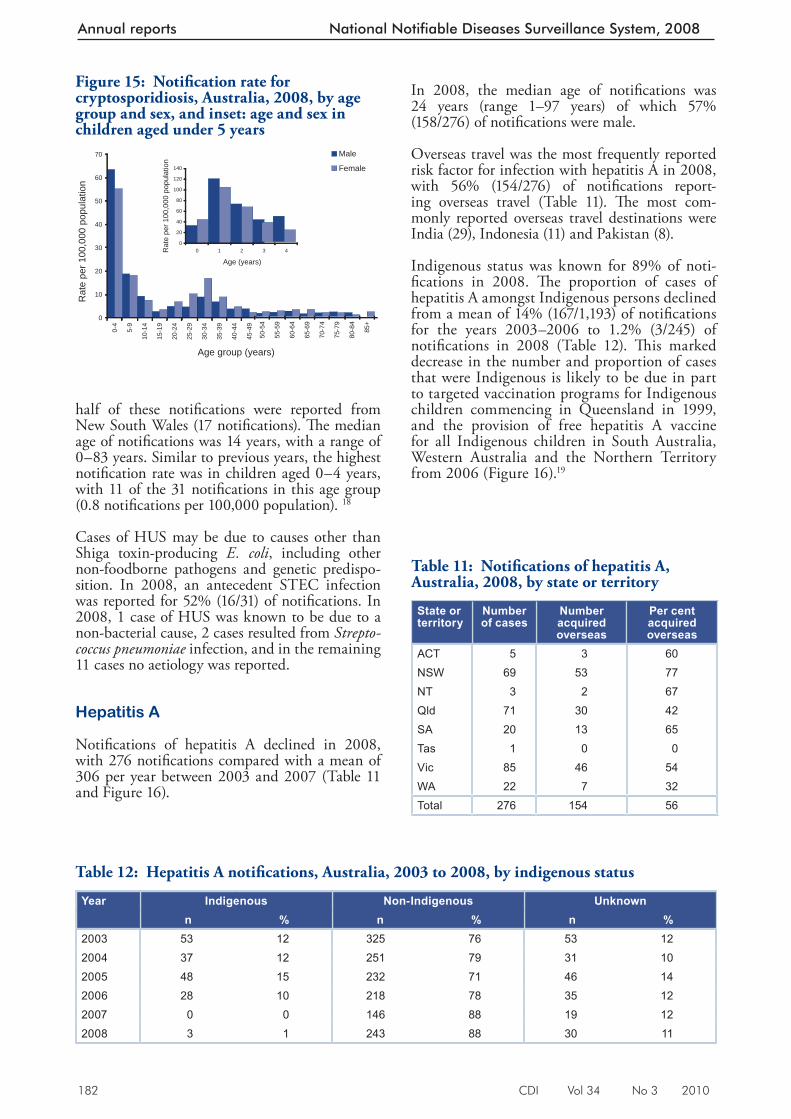
182 CDI Vol 34 No 3 2010
Annual reports National Notifiable Diseases Surveillance System, 2008
half of these notifi cations were reported from New South Wales (17 notifi cations). Th e median age of notifi cations was 14 years, with a range of 0–83 years. Similar to previous years, the highest notifi cation rate was in children aged 0–4 years, with 11 of the 31 notifi cations in this age group (0.8 notifi cations per 100,000 population). 18
Cases of HUS may be due to causes other than Shiga toxin-producing E. coli , including other non-foodborne pathogens and genetic predispo-sition. In 2008, an antecedent STEC infection was reported for 52% (16/31) of notifi cations. In 2008, 1 case of HUS was known to be due to a non-bacterial cause, 2 cases resulted from Strepto-coccus pneumoniae infection, and in the remaining 11 cases no aetiology was reported.
Hepatitis A
Notifi cations of hepatitis A declined in 2008, with 276 notifi cations compared with a mean of 306 per year between 2003 and 2007 (Table 11 and Figure 16).
In 2008, the median age of notifi cations was 24 years (range 1–97 years) of which 57% (158/276) of notifi cations were male.
Overseas travel was the most frequently reported risk factor for infection with hepatitis A in 2008, with 56% (154/276) of notifi cations report-ing overseas travel (Table 11). Th e most com-monly reported overseas travel destinations were India (29), Indonesia (11) and Pakistan (8).
Indigenous status was known for 89% of noti-fi cations in 2008. Th e proportion of cases of hepatitis A amongst Indigenous persons declined from a mean of 14% (167/1,193) of notifi cations for the years 2003–2006 to 1.2% (3/245) of notifi cations in 2008 (Table 12). Th is marked decrease in the number and proportion of cases that were Indigenous is likely to be due in part to targeted vaccination programs for Indigenous children commencing in Queensland in 1999, and the provision of free hepatitis A vaccine for all Indigenous children in South Australia, Western Australia and the Northern Territory from 2006 (Figure 16). 19
Figure 15: Notifi cation rate for cryptospori diosis, Australia, 2008, by age group and sex, and inset: age and sex in children aged under 5 years
0
10
20
30
40
50
60
70
0-4
5-9
10-1
4
15-1
9
20-2
4
25-2
9
30-3
4
35-3
9
40-4
4
45-4
9
50-5
4
55-5
9
60-6
4
65-6
9
70-7
4
75-7
9
80-8
4
85+
Age group (years)
Rat
e pe
r 100
,000
pop
ulat
ion
Male
Female
0
20
40
60
80
100
120
140
0 1 2 3 4
Age (years)
Rat
e pe
r 100
,000
pop
ulat
ion
Table 11: Notifi cations of hepatitis A, Aust ralia, 2008, by state or territory
State or territory
Number of cases
Number acquired overseas
Per cent acquired overseas
ACT 5 3 60NSW 69 53 77NT 3 2 67Qld 71 30 42SA 20 13 65Tas 1 0 0Vic 85 46 54WA 22 7 32Total 276 154 56
Table 12: Hepatitis A notifi cations, Australia, 2003 to 2008, by indigenous status
Year Indigenous Non-Indigenous Unknownn % n % n %
2003 53 12 325 76 53 122004 37 12 251 79 31 102005 48 15 232 71 46 142006 28 10 218 78 35 122007 0 0 146 88 19 122008 3 1 243 88 30 11
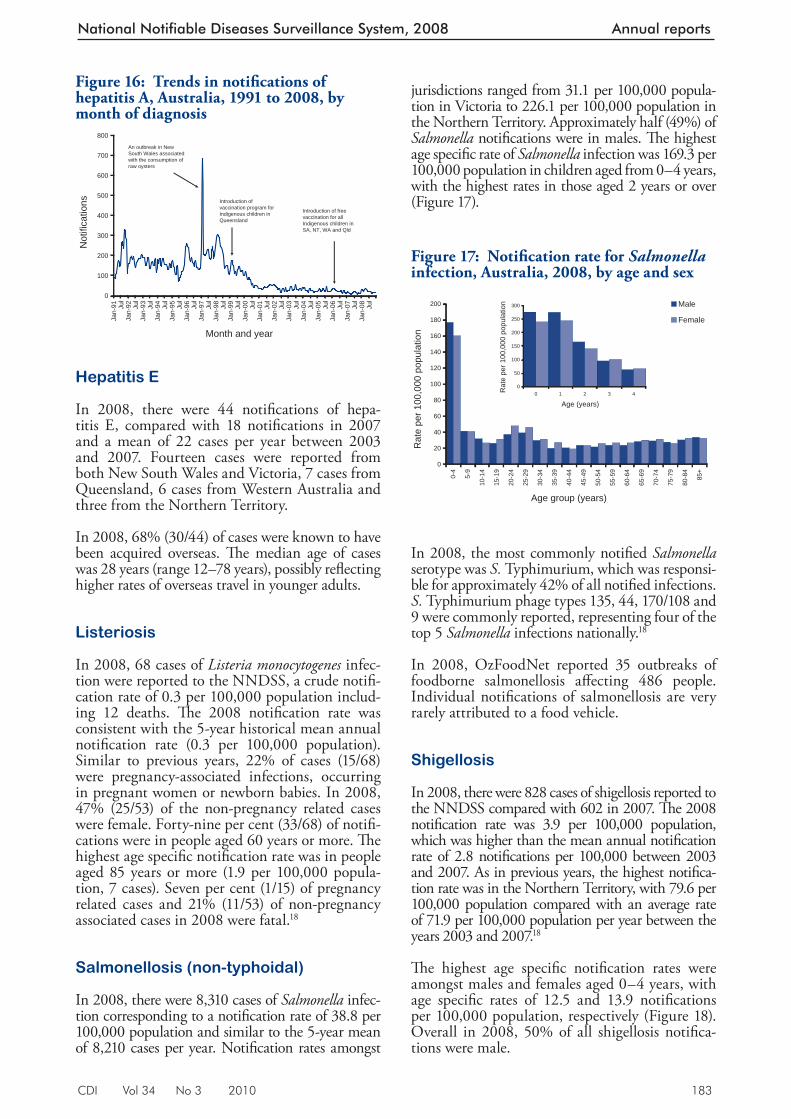
CDI Vol 34 No 3 2010 183
National Notifiable Diseases Surveillance System, 2008 Annual reports
Hepatitis E
In 2008, there were 44 notifi cations of hepa-titis E, compared with 18 notifi cations in 2007 and a mean of 22 cases per year between 2003 and 2007. Fourteen cases were reported from both New South Wales and Victoria, 7 cases from Queensland, 6 cases from Western Australia and three from the Northern Territory.
In 2008, 68% (30/44) of cases were known to have been acquired overseas. Th e median age of cases was 28 years (range 12–78 years), possibly refl ecting higher rates of overseas travel in younger adults.
Listeriosis
In 2008, 68 cases of Listeria monocytogenes infec-tion were reported to the NNDSS, a crude notifi -cation rate of 0.3 per 100,000 population includ-ing 12 deaths. Th e 2008 notifi cation rate was consistent with the 5-year historical mean annual notifi cation rate (0.3 per 100,000 population). Similar to previous years, 22% of cases (15/68) were pregnancy-associated infections, occurring in pregnant women or newborn babies. In 2008, 47% (25/53) of the non-pregnancy related cases were female. Forty-nine per cent (33/68) of notifi -cations were in people aged 60 years or more. Th e highest age specifi c notifi cation rate was in people aged 85 years or more (1.9 per 100,000 popula-tion, 7 cases). Seven per cent (1/15) of pregnancy related cases and 21% (11/53) of non-pregnancy associated cases in 2008 were fatal. 18
Salmonellosis (non-typhoidal)
In 2008, there were 8,310 cases of Salmonella infec-tion corresponding to a no tifi cation rate of 38.8 per 100,000 population and similar to the 5-year mean of 8,210 cases per year. Notifi cation rates amongst
Figure 16: Trends in notifi cations of hepatitis A, Au stralia, 1991 to 2008, by month of diagnosis
0
100
200
300
400
500
600
700
800
Jan-
91 Jul
Jan-
92 Jul
Jan-
93 Jul
Jan-
94 Jul
Jan-
95 Jul
Jan-
96 Jul
Jan-
97 Jul
Jan-
98 Jul
Jan-
99 Jul
Jan-
00 Jul
Jan-
01 Jul
Jan-
02 Jul
Jan-
03 Jul
Jan-
04 Jul
Jan-
05 Jul
Jan-
06 Jul
Jan-
07 Jul
Jan-
08 Jul
Month and year
Not
ifica
tions
An outbreak in New South Wales associated with the consumption of raw oysters
Introduction of free vaccination for all Indigenous children in SA, NT, WA and Qld
Introduction of vaccination program for Indigenous children in Queensland
jurisdictions ranged from 31.1 per 100,000 popula-tion in Victoria to 226.1 per 100,000 population in the Northern Territory. Approximately half (49%) of Salmonella notifi cations were in males. Th e highest age specifi c rate of Salmonella infection was 169.3 per 100,000 population in children aged from 0–4 years, with the highest rates in those aged 2 years or over (Figure 17).
In 2008, the most commonly notifi ed Salmonella serotype was S. Typhimurium, which was responsi-ble for approximately 42% of all notifi ed infections. S. Typhimurium phage types 135, 44, 170/108 and 9 were commonly reported, representing four of the top 5 Salmonella infections nationally. 18
In 2008, OzFoodNet reported 35 outbreaks of foodborne salmonellosis aff ecting 486 people. Individual notifi cations of salmonellosis are very rarely attributed to a food vehicle.
Shigellosis
In 2008, there were 828 cases of shigellosis reported to the NNDSS compared with 602 in 2007. Th e 2008 notifi cation rate was 3.9 per 100,000 population, which was higher than the mean annual notifi cation rate of 2.8 notifi cations per 100,000 between 2003 and 2007. As in previous years, the highest notifi ca-tion rate was in the Northern Territory, with 79.6 per 100,000 population compared with an average rate of 71.9 per 100,000 population per year between the years 2003 and 2007. 18
Th e highest age specifi c notifi cation rates were amongst males and females aged 0–4 years, with age specifi c rates of 12.5 and 13.9 notifi cations per 100,000 population, respectively (Figure 18). Overall in 2008, 50% of all shigellosis notifi ca-tions were male.
Figure 17: Notifi cation rate for Salmonella infection, Aust ralia, 2008, by age and sex
0
20
40
60
80
100
120
140
160
180
200
0-4
5-9
10-1
4
15-1
9
20-2
4
25-2
9
30-3
4
35-3
9
40-4
4
45-4
9
50-5
4
55-5
9
60-6
4
65-6
9
70-7
4
75-7
9
80-8
4
85+
Age group (years)
Rat
e pe
r 100
,000
pop
ulat
ion
Male
Female
0
50
100
150
200
250
300
0 1 2 3 4
Age (years)
Rat
e pe
r 100
,000
pop
ulat
ion
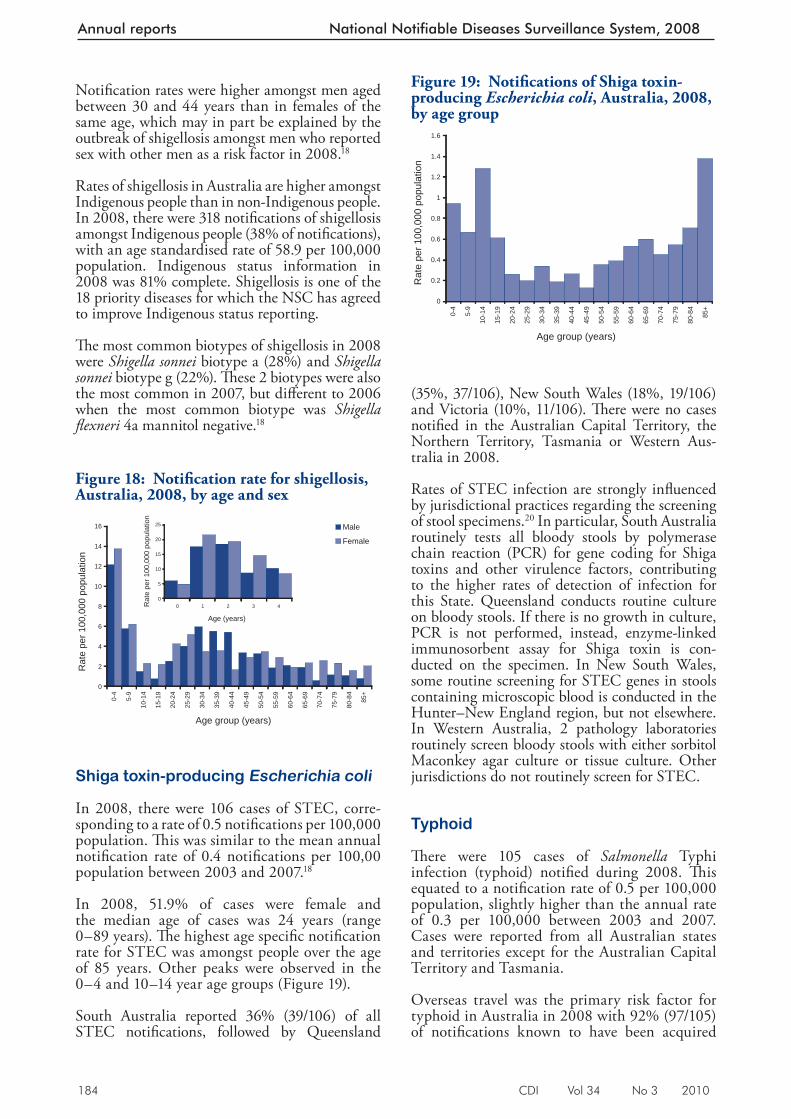
184 CDI Vol 34 No 3 2010
Annual reports National Notifiable Diseases Surveillance System, 2008
Notifi cation rates were higher amongst men aged between 30 and 44 years than in females of the same age, which may in part be explained by the outbreak of shigellosis amongst men who reported sex with other men as a risk factor in 2008. 18
Rates of shigellosis in Australia are higher amongst Indigenous people than in non-Indigenous people. In 2008, there were 318 notifi cations of shigellosis amongst Indigenous people (38% of notifi cations), with an age standardised rate of 58.9 per 100,000 population. Indigenous status information in 2008 was 81% complete. Shigellosis is one of the 18 priority diseases for which the NSC has agreed to improve Indigenous status reporting.
Th e most common biotypes of shigellosis in 2008 were Shigella sonnei biotype a (28%) and Shigella sonnei biotype g (22%). Th ese 2 biotypes were also the most common in 2007, but diff erent to 2006 when the most common biotype was Shigella fl exneri 4a mannitol negative. 18
Shiga toxin-producing Escherichia coli
In 2008, there were 106 cases of STEC, corre-sponding to a rate of 0.5 notifi cations per 100,000 population. Th is was similar to the mean annual notifi cation rate of 0.4 notifi cations per 100,00 population between 2003 and 2007. 18
In 2008, 51.9% of cases were female and the median age of cases was 24 years (range 0–89 years). Th e highest age specifi c notifi cation rate for STEC was amongst people over the age of 85 years. Other peaks were observed in the 0–4 and 10–14 year age groups (Figure 19).
South Australia reported 36% (39/106) of all STEC notifi cations, followed by Queensland
(35%, 37/106), New South Wales (18%, 19/106) and Victoria (10%, 11/106). Th ere were no cases notifi ed in the Australian Capital Territory, the Northern Territory, Tasmania or Western Aus-tralia in 2008.
Rates of STEC infection are strongly infl uenced by jurisdictional practices regarding the screening of stool specimens. 20 In particular, South Australia routinely tests all bloody stools by polymerase chain reaction (PCR) for gene coding for Shiga toxins and other virulence factors, contributing to the higher rates of detection of infection for this State. Queensland conducts routine culture on bloody stools. If there is no growth in culture, PCR is not performed, instead, enzyme-linked immunosorbent assay for Shiga toxin is con-ducted on the specimen. In New South Wales, some routine screening for STEC genes in stools containing microscopic blood is conducted in the Hunter–New England region, but not elsewhere. In Western Australia, 2 pathology laboratories routinely screen bloody stools with either sorbitol Maconkey agar culture or tissue culture. Other jurisdictions do not routinely screen for STEC.
Typhoid
Th ere were 105 cases of Salmonella Typhi infection (typhoid) notifi ed during 2008. Th is equated to a notifi cation rate of 0.5 per 100,000 population, slightly higher than the annual rate of 0.3 per 100,000 between 2003 and 2007. Cases were reported from all Australian states and territories except for the Australian Capital Territory and Tasmania.
Overseas travel was the primary risk factor for typhoid in Australia in 2008 with 92% (97/105) of notifi cations known to have been acquired
Figure 18: Notifi cation rate for shigellosis, Australia, 20 08, by age and sex
0
2
4
6
8
10
12
14
16
0-4
5-9
10-1
4
15-1
9
20-2
4
25-2
9
30-3
4
35-3
9
40-4
4
45-4
9
50-5
4
55-5
9
60-6
4
65-6
9
70-7
4
75-7
9
80-8
4
85+
Age group (years)
Rat
e pe
r 100
,000
pop
ulat
ion
Male
Female
0
5
10
15
20
25
0 1 2 3 4
Age (years)
Rat
e pe
r 100
,000
pop
ulat
ion
Figure 19: Notifi cations of Shiga toxin-producing Escherich ia coli, Australia, 2008, by age group
0
0.2
0.4
0.6
0.8
1
1.2
1.4
1.6
0-4
5-9
10-1
4
15-1
9
20-2
4
25-2
9
30-3
4
35-3
9
40-4
4
45-4
9
50-5
4
55-5
9
60-6
4
65-6
9
70-7
4
75-7
9
80-8
4
85+
Age group (years)
Rat
e pe
r 100
,000
pop
ulat
ion
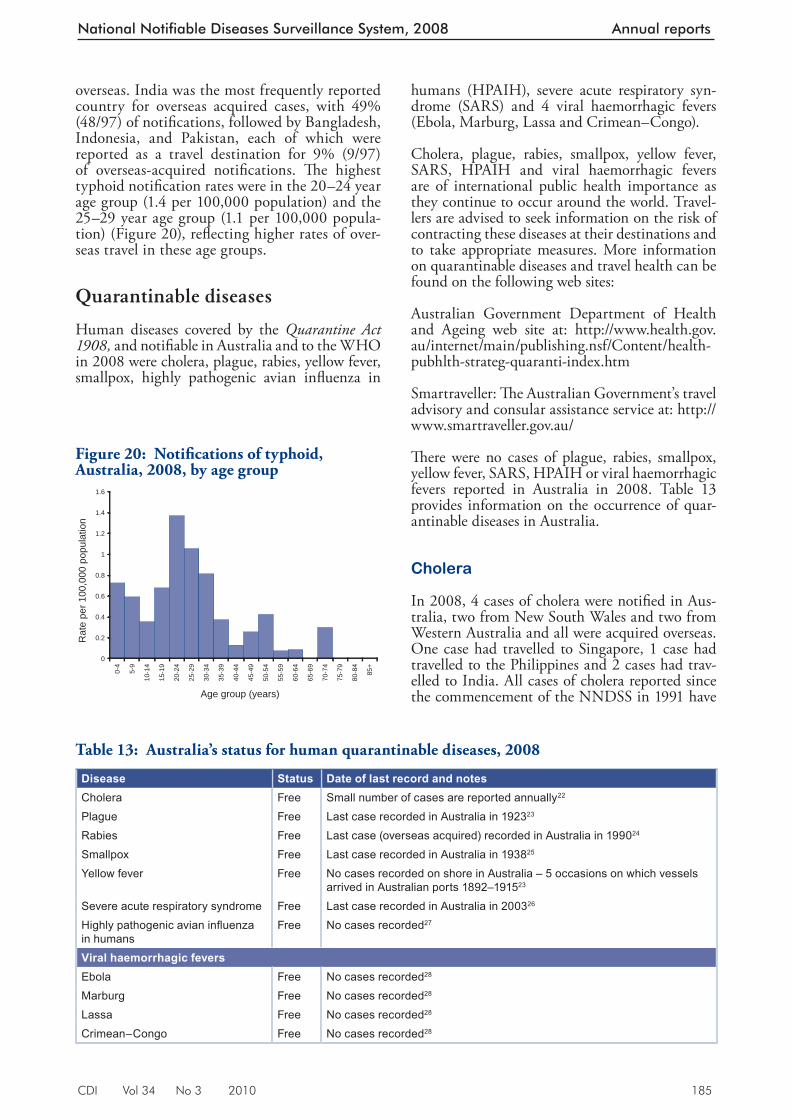
CDI Vol 34 No 3 2010 185
National Notifiable Diseases Surveillance System, 2008 Annual reports
overseas. India was the most frequently reported country for overseas acquired cases, with 49% (48/97) of notifi cations, followed by Bangladesh, Indonesia, and Pakistan, each of which were reported as a travel destination for 9% (9/97) of overseas-acquired notifi cations. Th e highest typhoid notifi cation rates were in the 20–24 year age group (1.4 per 100,000 population) and the 25–29 year age group (1.1 per 100,000 popula-tion) (Figure 20), refl ecting higher rates of over-seas travel in these age groups.
Quarantinable diseases
Human diseases covered by the Quarantine Act 1908, and notifi able in Australia and to the WHO in 2008 were cholera, plague, rabies, yellow fever, smallpox, highly pathogenic avian infl uenza in
humans (HPAIH), severe acute respiratory syn-drome (SARS) and 4 viral haemorrhagic fevers (Ebola, Marburg, Lassa and Crimean–Congo).
Cholera, plague, rabies, smallpox, yellow fever, SARS, HPAIH and viral haemorrhagic fevers are of international public health importance as they continue to occur around the world. Travel-lers are advised to seek information on the risk of contracting these diseases at their destinations and to take appropriate measures. More information on quarantinable diseases and travel health can be found on the following web sites:
Australian Government Department of Health and Ageing web site at: http://www.health.gov.au/internet/main/publishing.nsf/Content/health-pubhlth-strateg-quaranti-index.htm
Smartraveller: Th e Australian Government’s travel advisory and consular assistance service at: http://www.smartraveller.gov.au/
Th ere were no cases of plague, rabies, smallpox, yellow fever, SARS, HPAIH or viral haemorrhagic fevers reported in Australia in 2008. Table 13 provides information on the occurrence of quar-antinable diseases in Australia.
Cholera
In 2008, 4 cases of cholera were notifi ed in Aus-tralia, two from New South Wales and two from Western Australia and all were acquired overseas. One case had travelled to Singapore, 1 case had travelled to the Philippines and 2 cases had trav-elled to India. All cases of cholera reported since the commencement of the NNDSS in 1991 have
Figure 20: Notifi cations of typhoid, Australia, 2008, by ag e group
0
0.2
0.4
0.6
0.8
1
1.2
1.4
1.6
0-4
5-9
10-1
4
15-1
9
20-2
4
25-2
9
30-3
4
35-3
9
40-4
4
45-4
9
50-5
4
55-5
9
60-6
4
65-6
9
70-7
4
75-7
9
80-8
4
85+
Age group (years)
Rat
e pe
r 100
,000
pop
ulat
ion
Table 13: Australia’s status for human quarantinable diseases, 2008
Disease Status Date of last record and notesCholera Free Small number of cases are reported annually22
Plague Free Last case recorded in Australia in 192323
Rabies Free Last case (overseas acquired) recorded in Australia in 199024
Smallpox Free Last case recorded in Australia in 193825
Yellow fever Free No cases recorded on shore in Australia – 5 occasions on which vessels arrived in Australian ports 1892–191523
Severe acute respiratory syndrome Free Last case recorded in Australia in 200326
Highly pathogenic avian infl uenza in humans
Free No cases recorded27
Viral haemorrhagic feversEbola Free No cases recorded28
Marburg Free No cases recorded28
Lassa Free No cases recorded28
Crimean–Congo Free No cases recorded28
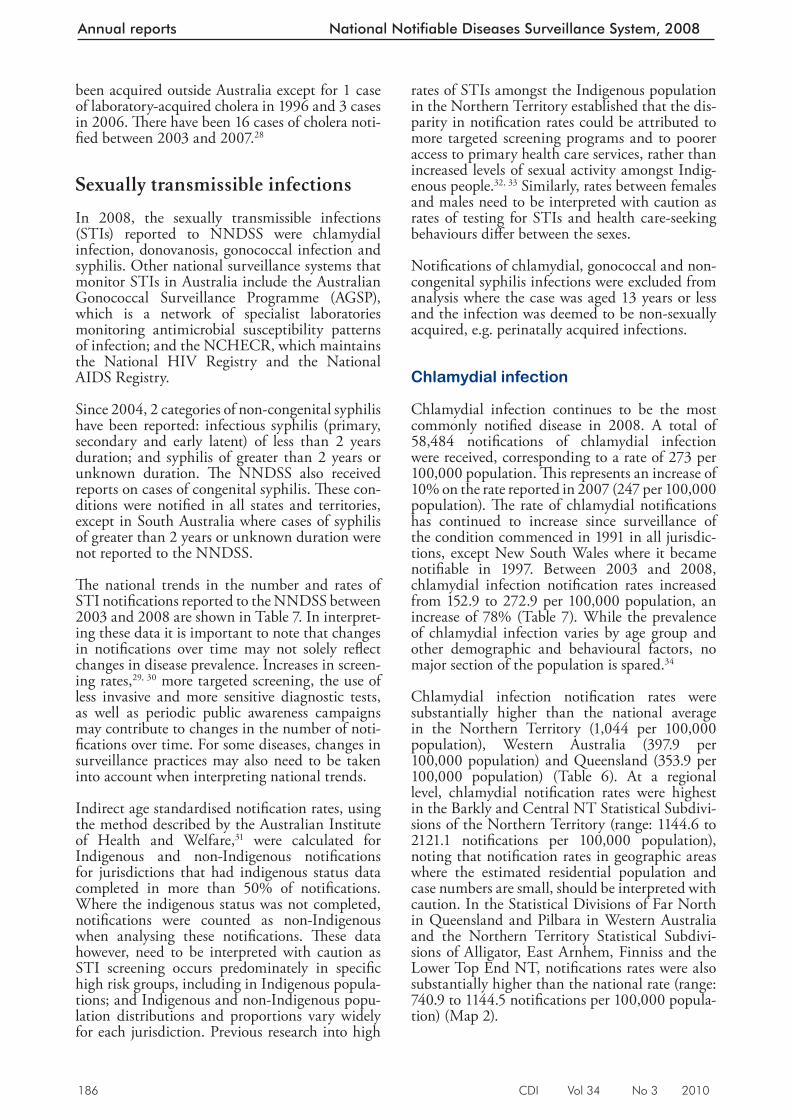
186 CDI Vol 34 No 3 2010
Annual reports National Notifiable Diseases Surveillance System, 2008
been acquired outside Australia except for 1 case of laboratory-acquired cholera in 1996 and 3 cases in 2006. Th ere have been 16 cases of cholera noti-fi ed between 2003 and 2007. 28
Sexually transmissible infections
In 2008, the sexually transmissible infections (STIs) reported to NNDSS were chlamydial infection, donovanosis, gonococcal infection and syphilis. Other national surveillance systems that monitor STIs in Australia include the Australian Gonococcal Surveillance Programme (AGSP), which is a network of specialist laboratories monitoring antimicrobial susceptibility patterns of infection; and the NCHECR, which maintains the National HIV Registry and the National AIDS Registry.
Since 2004, 2 categories of non-congenital syphilis have been reported: infectious syphilis (primary, secondary and early latent) of less than 2 years duration; and syphilis of greater than 2 years or unknown duration. Th e NNDSS also received reports on cases of congenital syphilis. Th ese con-ditions were notifi ed in all states and territories, except in South Australia where cases of syphilis of greater than 2 years or unknown duration were not reported to the NNDSS.
Th e national trends in the number and rates of STI notifi cations reported to the NNDSS between 2003 and 2008 are shown in Table 7. In interpret-ing these data it is important to note that changes in notifi cations over time may not solely refl ect changes in disease prevalence. Increases in screen-ing rates, 29, 30 more targeted screening, the use of less invasive and more sensitive diagnostic tests, as well as periodic public awareness campaigns may contribute to changes in the number of noti-fi cations over time. For some diseases, changes in surveillance practices may also need to be taken into account when interpreting national trends.
Indirect age standardised notifi cation rates, using the method described by the Australian Institute of Health and Welfare, 31 were calculated for Indigenous and non-Indigenous notifi cations for jurisdictions that had indigenous status data completed in more than 50% of notifi cations. Where the indigenous status was not completed, notifi cations were counted as non-Indigenous when analysing these notifi cations. Th ese data however, need to be interpreted with caution as STI screening occurs predominately in specifi c high risk groups, including in Indigenous popula-tions; and Indigenous and non-Indigenous popu-lation distributions and proportions vary widely for each jurisdiction. Previous research into high
rates of STIs amongst the Indigenous population in the Northern Territory established that the dis-parity in notifi cation rates could be attributed to more targeted screening programs and to poorer access to primary health care services, rather than increased levels of sexual activity amongst Indig-enous people. 32, 33 Similarly, rates between females and males need to be interpreted with caution as rates of testing for STIs and health care-seeking behaviours diff er between the sexes.
Notifi cations of chlamydial, gonococcal and non-congenital syphilis infections were excluded from analysis where the case was aged 13 years or less and the infection was deemed to be non-sexually acquired, e.g. perinatally acquired infections.
Chlamydial infection
Chlamydial infection continues to be the most commonly notifi ed disease in 2008. A total of 58,484 notifi cations of chlamydial infection were received, corresponding to a rate of 273 per 100,000 population. Th is represents an increase of 10% on the rate reported in 2007 (247 per 100,000 population). Th e rate of chlamydial notifi cations has continued to increase since surveillance of the condition commenced in 1991 in all jurisdic-tions, except New South Wales where it became notifi able in 1997. Between 2003 and 2008, chlamydial infection notifi cation rates increased from 152.9 to 272.9 per 100,000 population, an increase of 78% (Table 7). While the prevalence of chlamydial infection varies by age group and other demographic and behavioural factors, no major section of the population is spared. 34
Chlamydial infection notifi cation rates were substantially higher than the national average in the Northern Territory (1,044 per 100,000 population), Western Australia (397.9 per 100,000 population) and Queensland (353.9 per 100,000 population) (Table 6). At a regional level, chlamydial notifi cation rates were highest in the Barkly and Central NT Statistical Subdivi-sions of the Northern Territory (range: 1144.6 to 2121.1 notifi cations per 100,000 population), noting that notifi cation rates in geographic areas where the estimated residential population and case numbers are small, should be interpreted with caution. In the Statistical Divisions of Far North in Queensland and Pilbara in Western Australia and the Northern Territory Statistical Subdivi-sions of Alligator, East Arnhem, Finniss and the Lower Top End NT, notifi cations rates were also substantially higher than the national rate (range: 740.9 to 1144.5 notifi cations per 100,000 popula-tion) (Map 2).
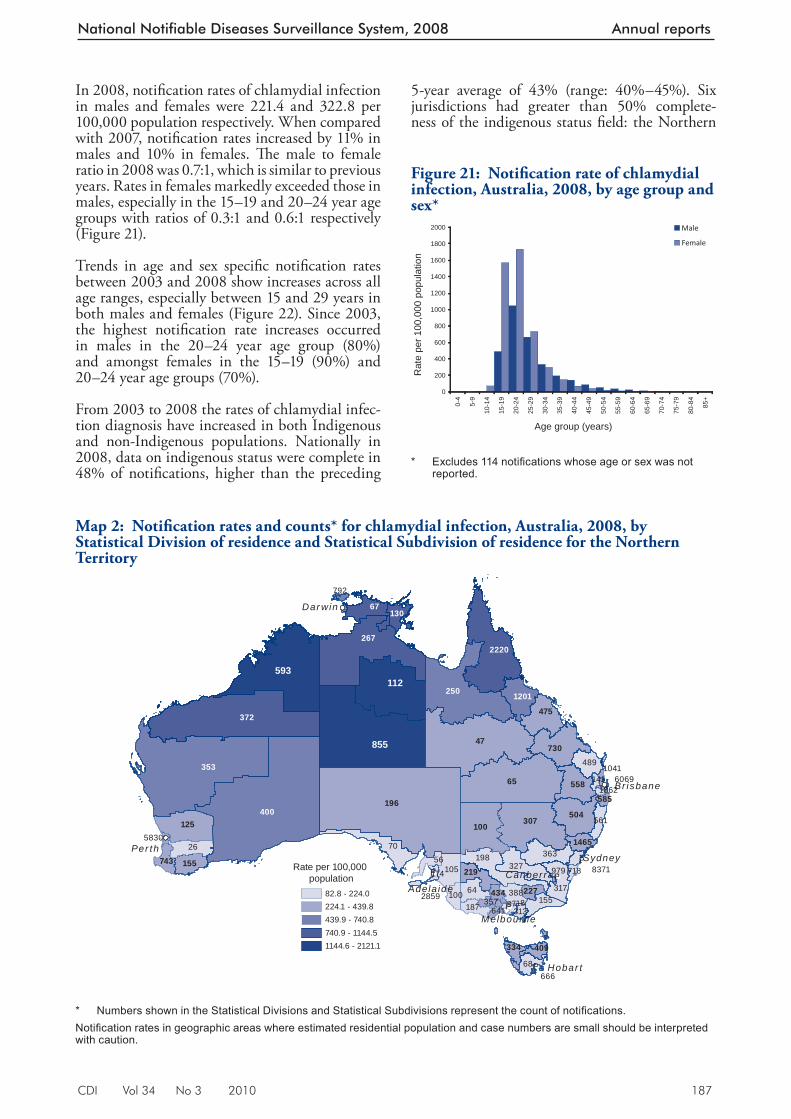
CDI Vol 34 No 3 2010 187
National Notifiable Diseases Surveillance System, 2008 Annual reports
In 2008, notifi cation rates of chlamydial infection in males and females were 221.4 and 322.8 per 100,000 population respectively. When compared with 2007, notifi cation rates increased by 11% in males and 10% in females. Th e male to female ratio in 2008 was 0.7:1, which is similar to previous years. Rates in females markedly exceeded those in males, especially in the 15–19 and 20–24 year age groups with ratios of 0.3:1 and 0.6:1 respectively (Figure 21).
Trends in age and sex specifi c notifi cation rates between 2003 and 2008 show increases across all age ranges, especially between 15 and 29 years in both males and females (Figure 22). Since 2003, the highest notifi cation rate increases occurred in males in the 20–24 year age group (80%) and amongst females in the 15–19 (90%) and 20–24 year age groups (70%).
From 2003 to 2008 the rates of chlamydial infec-tion diagnosis have increased in both Indigenous and non-Indigenous populations. Nationally in 2008, data on indigenous status were complete in 48% of notifi cations, higher than the preceding
5-year average of 43% (range: 40%–45%). Six jurisdictions had greater than 50% complete-ness of the indigenous status fi eld: the Northern
Map 2: Notifi cation rates and counts* for chlamydial infection, Australia , 2008, by Statistical Division of residence and Statistical Subdivision of residence for the Northern Territory
!P
!P
!
!P
!
!P
!
!P
70198
26
327363
31764
105
489
68
155
56
388
187100
561
313
141
8371718174
196
47
65
307100125
730
504
475
558
219155743
334
1465
409
227434357
585
6418718
1
5830
60691041
666
2859
1862
979
400
353
250 1201
792
2672220
67130
593112
Rate per 100,000 population
82.8 - 224.0224.1 - 439.8439.9 - 740.8740.9 - 1144.51144.6 - 2121.1
855
Br isbane
Sydney
Canber ra
Melbourne
Hobar t
Per th
Dar win
Adela ide
372
* Numbers shown in the Statistical Divisions and Statistical Subdivisions represent the count of notifi cations. Notifi cation rates in geographic areas where estimated residential population and case numbers are small should be interpreted with caution.
Figure 21: Notifi cation rate of chlamydial infection, Australia, 2008, by age group and sex*
0
200
400
600
800
1000
1200
1400
1600
1800
2000
0-4
5-9
10-1
4
15-1
9
20-2
4
25-2
9
30-3
4
35-3
9
40-4
4
45-4
9
50-5
4
55-5
9
60-6
4
65-6
9
70-7
4
75-7
9
80-8
4
85+
Age group (years)R
ate
per 1
00,0
00 p
opul
atio
n
Male
Female
* Excludes 114 notifi cations whose age or sex was not
reported.
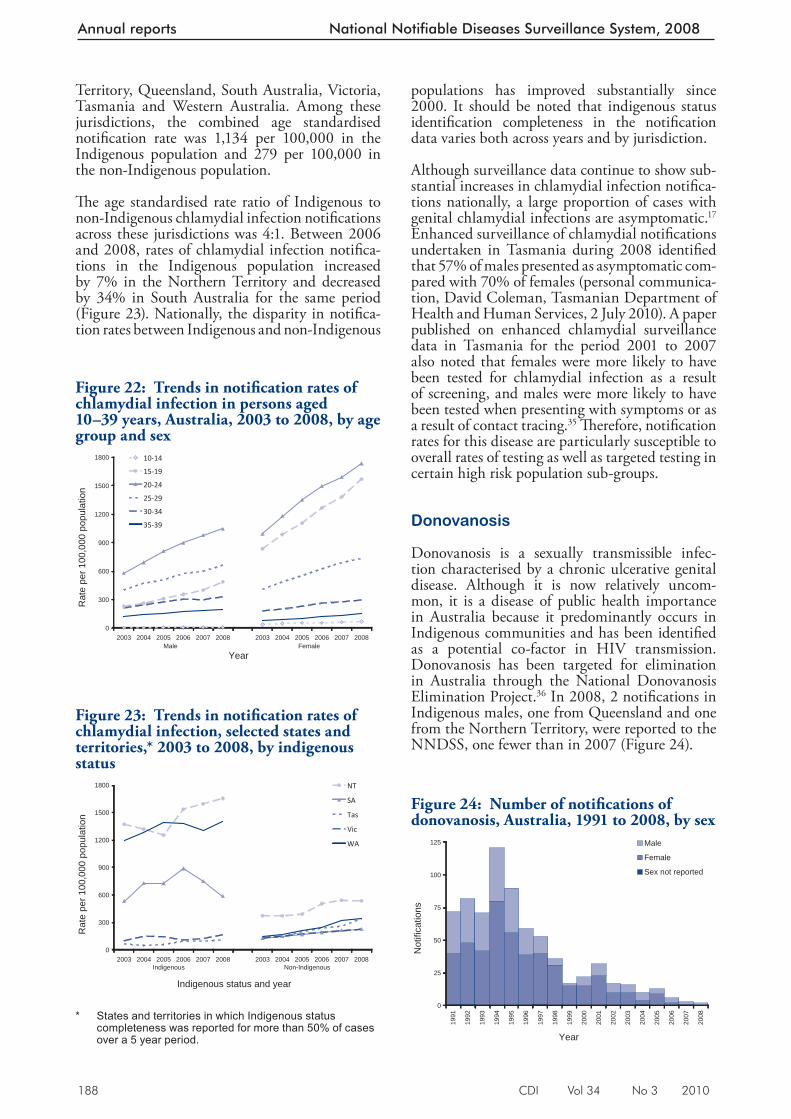
188 CDI Vol 34 No 3 2010
Annual reports National Notifiable Diseases Surveillance System, 2008
Territory, Queensland, South Australia, Victoria, Tasmania and Western Australia. Among these jurisdictions, the combined age standardised notifi cation rate was 1,134 per 100,000 in the Indigenous population and 279 per 100,000 in the non-Indigenous population.
Th e age standardised rate ratio of Indigenous to non-Indigenous chlamydial infection notifi cations across these jurisdictions was 4:1. Between 2006 and 2008, rates of chlamydial infection notifi ca-tions in the Indigenous population increased by 7% in the Northern Territory and decreased by 34% in South Australia for the same period (Figure 23). Nationally, the disparity in notifi ca-tion rates between Indigenous and non-Indigenous
populations has improved substantially since 2000. It should be noted that indigenous status identifi cation completeness in the notifi cation data varies both across years and by jurisdiction.
Although surveillance data continue to show sub-stantial increases in chlamydial infection notifi ca-tions nationally, a large proportion of cases with genital chlamydial infections are asymptomatic. 17 Enhanced surveillance of chlamydial notifi cations undertaken in Tasmania during 2008 identifi ed that 57% of males presented as asymptomatic com-pared with 70% of females (personal communica-tion, David Coleman, Tasmanian Department of Health and Human Services, 2 July 2010). A paper published on enhanced chlamydial surveillance data in Tasmania for the period 2001 to 2007 also noted that females were more likely to have been tested for chlamydial infection as a result of screening, and males were more likely to have been tested when presenting with symptoms or as a result of contact tracing. 35 Th erefore, notifi cation rates for this disease are particularly susceptible to overall rates of testing as well as targeted testing in certain high risk population sub-groups.
Donovanosis
Donovanosis is a sexually transmissible infec-tion characterised by a chronic ulcerative genital disease. Although it is now relatively uncom-mon, it is a disease of public health importance in Australia because it predominantly occurs in Indigenous communities and has been identifi ed as a potential co-factor in HIV transmission. Donovanosis has been targeted for elimination in Australia through the National Donovanosis Elimination Project. 36 In 2008, 2 notifi cations in Indigenous males, one from Queensland and one from the Northern Territory, were reported to the NNDSS, one fewer than in 2007 (Figure 24).
Figure 23: Trends in notifi cation rates of chlamydial infection, selected states and territories,* 2003 to 2008, by indigenous status
0
300
600
900
1200
1500
1800
2003Indigenous
2004 2005 2006 2007 2008 2003Non-Indigenous
2004 2005 2006 2007 2008
Indigenous status and year
Rat
e pe
r 100
,000
pop
ulat
ion
NT
SA
Tas
Vic
WA
* States and territories in which Indigenous status
completeness was reported for more than 50% of cases over a 5 year period.
Figure 24: Number of notifi cations of donovanosis, Australia, 1991 to 200 8, by sex
0
25
50
75
100
125
1991
1992
1993
1994
1995
1996
1997
1998
1999
2000
2001
2002
2003
2004
2005
2006
2007
2008
Year
Not
ifica
tions
Male
Female
Sex not reported
Figure 22: Trends in notifi cation rates of chlamydial infection in person s aged 10–39 years, Australia, 2003 to 2008, by age group and sex
0
300
600
900
1200
1500
1800
2003Male
2004 2005 2006 2007 2008 2003Female
2004 2005 2006 2007 2008
Year
Rat
e pe
r 100
,000
pop
ulat
ion
10-14
15-19
20-24
25-29
30-34
35-39
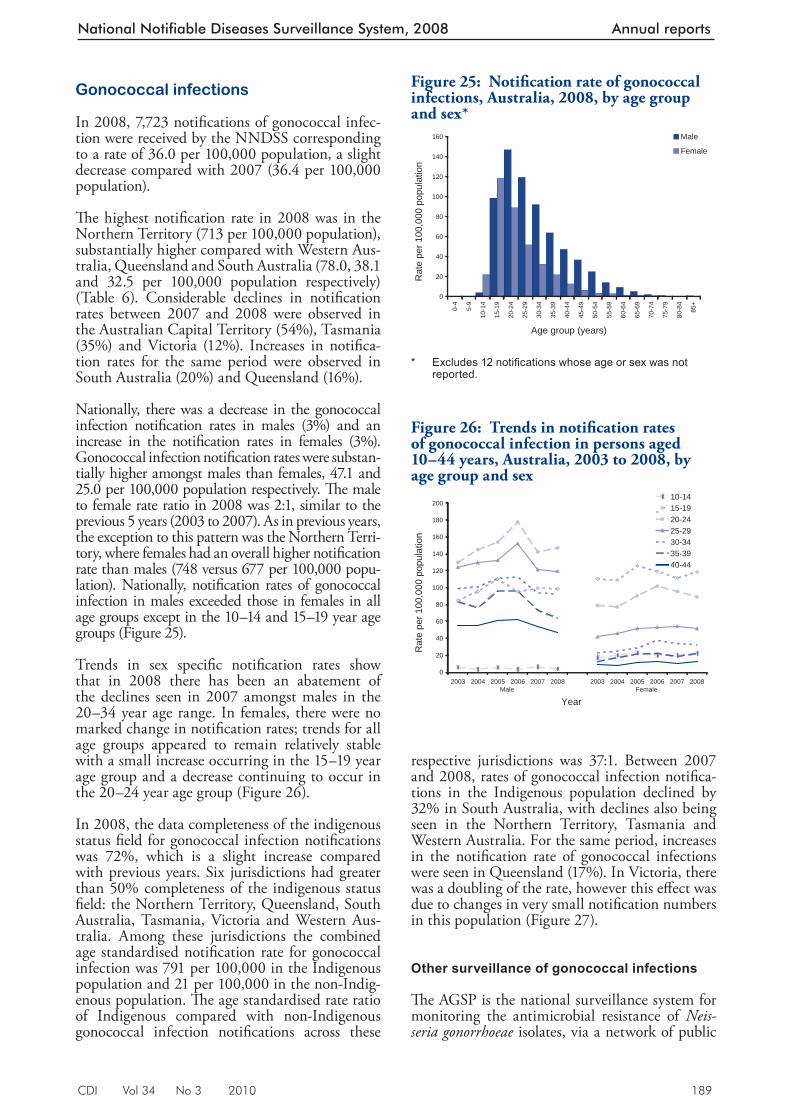
CDI Vol 34 No 3 2010 189
National Notifiable Diseases Surveillance System, 2008 Annual reports
Gonococcal infections
In 2008, 7,723 notifi cations of gonococcal infec-tion were received by the NNDSS corresponding to a rate of 36.0 per 100,000 population, a slight decrease compared with 2007 (36.4 per 100,000 population).
Th e highest notifi cation rate in 2008 was in the Northern Territory (713 per 100,000 population), substantially higher compared with Western Aus-tralia, Queensland and South Australia (78.0, 38.1 and 32.5 per 100,000 population respectively) (Table 6). Considerable declines in notifi cation rates between 2007 and 2008 were observed in the Australian Capital Territory (54%), Tasmania (35%) and Victoria (12%). Increases in notifi ca-tion rates for the same period were observed in South Australia (20%) and Queensland (16%).
Nationally, there was a decrease in the gonococcal infection notifi cation rates in males (3%) and an increase in the notifi cation rates in females (3%). Gonococcal infection notifi cation rates were substan-tially higher amongst males than females, 47.1 and 25.0 per 100,000 population respectively. Th e male to female rate ratio in 2008 was 2:1, similar to the previous 5 years (2003 to 2007). As in previous years, the exception to this pattern was the Northern Terri-tory, where females had an overall higher notifi cation rate than males (748 versus 677 per 100,000 popu-lation). Nationally, notifi cation rates of gonococcal infection in males exceeded those in females in all age groups except in the 10–14 and 15–19 year age groups (Figure 25).
Trends in sex specifi c notifi cation rates show that in 2008 there has been an abatement of the declines seen in 2007 amongst males in the 20–34 year age range. In females, there were no marked change in notifi cation rates; trends for all age groups appeared to remain relatively stable with a small increase occurring in the 15–19 year age group and a decrease continuing to occur in the 20–24 year age group (Figure 26).
In 2008, the data completeness of the indigenous status fi eld for gonococcal infection notifi cations was 72%, which is a slight increase compared with previous years. Six jurisdictions had greater than 50% completeness of the indigenous status fi eld: the Northern Territory, Queensland, South Australia, Tasmania, Victoria and Western Aus-tralia. Among these jurisdictions the combined age standardised notifi cation rate for gonococcal infection was 791 per 100,000 in the Indigenous population and 21 per 100,000 in the non-Indig-enous population. Th e age standardised rate ratio of Indigenous compared with non-Indigenous gonococcal infection notifi cations across these
respective jurisdictions was 37:1. Between 2007 and 2008, rates of gonococcal infection notifi ca-tions in the Indigenous population declined by 32% in South Australia, with declines also being seen in the Northern Territory, Tasmania and Western Australia. For the same period, increases in the notifi cation rate of gonococcal infections were seen in Queensland (17%). In Victoria, there was a doubling of the rate, however this eff ect was due to changes in very small notifi cation numbers in this population (Figure 27).
Other surveillance of gonococcal infections
Th e AGSP is the national surveillance system for monitoring the antimicrobial resistance of Neis-seria gonorrhoeae isolates, via a network of public
Figure 25: Notifi cation rate of gonococcal infections, Australia, 2008, b y age group and sex*
0
20
40
60
80
100
120
140
160
0-4
5-9
10-1
4
15-1
9
20-2
4
25-2
9
30-3
4
35-3
9
40-4
4
45-4
9
50-5
4
55-5
9
60-6
4
65-6
9
70-7
4
75-7
9
80-8
4
85+
Age group (years)
Rat
e pe
r 100
,000
pop
ulat
ion
Male
Female
* Excludes 12 notifi cations whose age or sex was not
reported.
Figure 26: Trends in notifi cation rates of gonococcal infection in person s aged 10–44 years, Australia, 2003 to 2008, by age group and sex
0
20
40
60
80
100
120
140
160
180
200
2003Male
2004 2005 2006 2007 2008 2003Female
2004 2005 2006 2007 2008
Year
Rat
e pe
r 100
,000
pop
ulat
ion
10-1415-1920-2425-2930-3435-3940-44
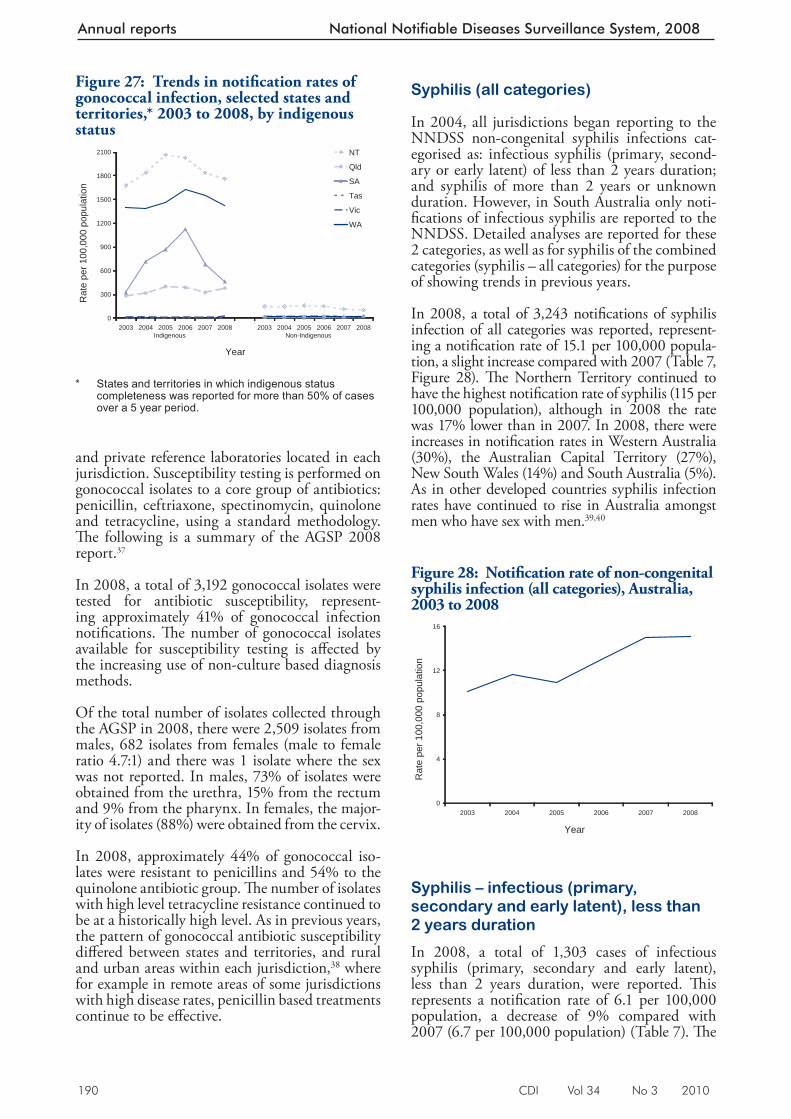
190 CDI Vol 34 No 3 2010
Annual reports National Notifiable Diseases Surveillance System, 2008
and private reference laboratories located in each jurisdiction. Susceptibility testing is performed on gonococcal isolates to a core group of antibiotics: penicillin, ceftriaxone, spectinomycin, quinolone and tetracycline, using a standard methodology. Th e following is a summary of the AGSP 2008 report. 37
In 2008, a total of 3,192 gonococcal isolates were tested for antibiotic susceptibility, represent-ing approximately 41% of gonococcal infection notifi cations. Th e number of gonococcal isolates available for susceptibility testing is aff ected by the increasing use of non-culture based diagnosis methods.
Of the total number of isolates collected through the AGSP in 2008, there were 2,509 isolates from males, 682 isolates from females (male to female ratio 4.7:1) and there was 1 isolate where the sex was not reported. In males, 73% of isolates were obtained from the urethra, 15% from the rectum and 9% from the pharynx. In females, the major-ity of isolates (88%) were obtained from the cervix.
In 2008, approximately 44% of gonococcal iso-lates were resistant to penicillins and 54% to the quinolone antibiotic group. Th e number of isolates with high level tetracycline resistance continued to be at a historically high level. As in previous years, the pattern of gonococcal antibiotic susceptibility diff ered between states and territories, and rural and urban areas within each jurisdiction, 38 where for example in remote areas of some jurisdictions with high disease rates, penicillin based treatments continue to be eff ective.
Syphilis (all categories)
In 2004, all jurisdictions began reporting to the NNDSS non-congenital syphilis infections cat-egorised as: infectious syphilis (primary, second-ary or early latent) of less than 2 years duration; and syphilis of more than 2 years or unknown duration. However, in South Australia only noti-fi cations of infectious syphilis are reported to the NNDSS. Detailed analyses are reported for these 2 categories, as well as for syphilis of the combined categories (syphilis – all categories) for the purpose of showing trends in previous years.
In 2008, a total of 3,243 notifi cations of syphilis infection of all categories was reported, represent-ing a notifi cation rate of 15.1 per 100,000 popula-tion, a slight increase compared with 2007 (Table 7, Figure 28). Th e Northern Territory continued to have the highest notifi cation rate of syphilis (115 per 100,000 population), although in 2008 the rate was 17% lower than in 2007. In 2008, there were increases in notifi cation rates in Western Australia (30%), the Australian Capital Territory (27%), New South Wales (14%) and South Australia (5%). As in other developed countries syphilis infection rates have continued to rise in Australia amongst men who have sex with men. 39,40
Syphilis – infectious (primary, secondary and early latent), less than 2 years duration
In 2008, a total of 1,303 cases of infectious syphilis (primary, secondary and early latent), less than 2 years duration, were reported. Th is represents a notifi cation rate of 6.1 per 100,000 population, a decrease of 9% compared with 2007 (6.7 per 100,000 population) (Table 7). Th e
Figure 27: Trends in notifi cation rates of gonococcal infection, selected states and territories,* 2003 to 2008, by indigenous status
0
300
600
900
1200
1500
1800
2100
2003Indigenous
2004 2005 2006 2007 2008 2003Non-Indigenous
2004 2005 2006 2007 2008
Year
Rat
e pe
r 100
,000
pop
ulat
ion
NT
Qld
SA
Tas
Vic
WA
* States and territories in which indigenous status
completeness was reported for more than 50% of cases over a 5 year period.
Figure 28: Notifi cation rate of non-congenital syphilis infection (all ca tegories), Australia, 2003 to 2008
0
4
8
12
16
2003 2004 2005 2006 2007 2008
Year
Rat
e pe
r 100
,000
pop
ulat
ion
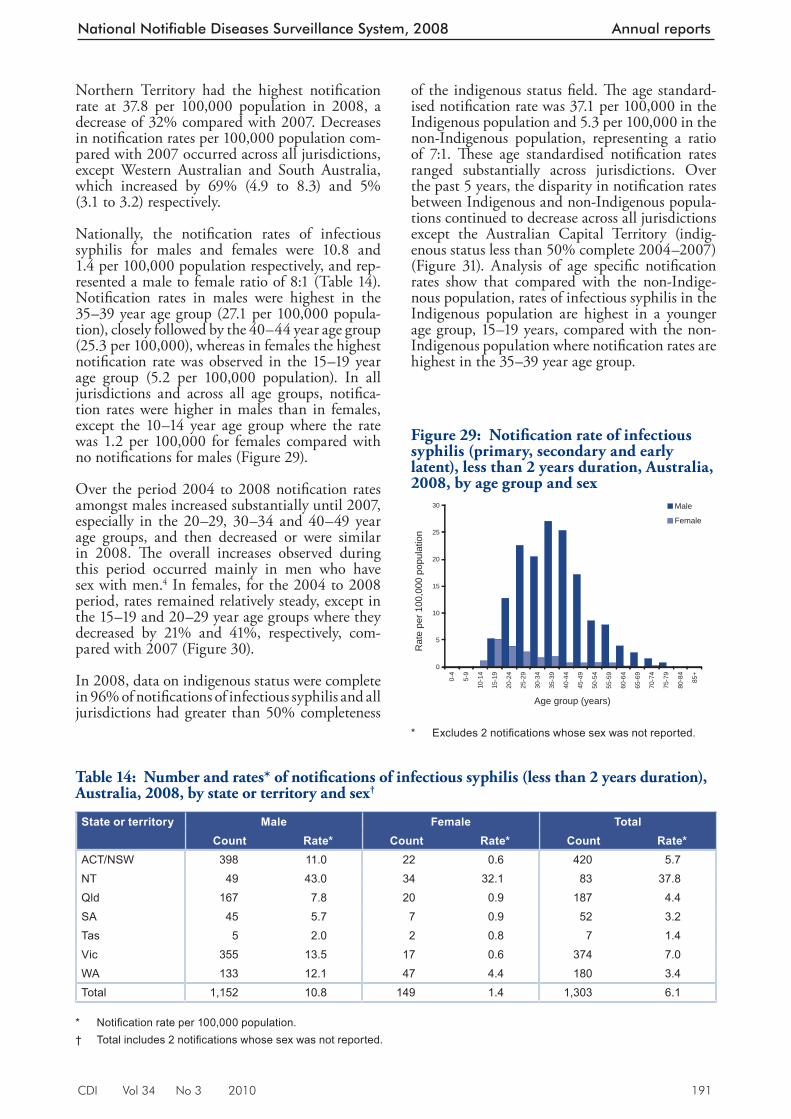
CDI Vol 34 No 3 2010 191
National Notifiable Diseases Surveillance System, 2008 Annual reports
Northern Territory had the highest notifi cation rate at 37.8 per 100,000 population in 2008, a decrease of 32% compared with 2007. Decreases in notifi cation rates per 100,000 population com-pared with 2007 occurred across all jurisdictions, except Western Australian and South Australia, which increased by 69% (4.9 to 8.3) and 5% (3.1 to 3.2) respectively.
Nationally, the notifi cation rates of infectious syphilis for males and females were 10.8 and 1.4 per 100,000 population respectively, and rep-resented a male to female ratio of 8:1 (Table 14). Notifi cation rates in males were highest in the 35–39 year age group (27.1 per 100,000 popula-tion), closely followed by the 40–44 year age group (25.3 per 100,000), whereas in females the highest notifi cation rate was observed in the 15–19 year age group (5.2 per 100,000 population). In all jurisdictions and across all age groups, notifi ca-tion rates were higher in males than in females, except the 10–14 year age group where the rate was 1.2 per 100,000 for females compared with no notifi cations for males (Figure 29).
Over the period 2004 to 2008 notifi cation rates amongst males increased substantially until 2007, especially in the 20–29, 30–34 and 40–49 year age groups, and then decreased or were similar in 2008. Th e overall increases observed during this period occurred mainly in men who have sex with men. 4 In females, for the 2004 to 2008 period, rates remained relatively steady, except in the 15–19 and 20–29 year age groups where they decreased by 21% and 41%, respectively, com-pared with 2007 (Figure 30).
In 2008, data on indigenous status were complete in 96% of notifi cations of infectious syphilis and all jurisdictions had greater than 50% completeness
of the indigenous status fi eld. Th e age standard-ised notifi cation rate was 37.1 per 100,000 in the Indigenous population and 5.3 per 100,000 in the non-Indigenous population, representing a ratio of 7:1. Th ese age standardised notifi cation rates ranged substantially across jurisdictions. Over the past 5 years, the disparity in notifi cation rates between Indigenous and non-Indigenous popula-tions continued to decrease across all jurisdictions except the Australian Capital Territory (indig-enous status less than 50% complete 2004–2007) (Figure 31). Analysis of age specifi c notifi cation rates show that compared with the non-Indige-nous population, rates of infectious syphilis in the Indigenous population are highest in a younger age group, 15–19 years, compared with the non-Indigenous population where notifi cation rates are highest in the 35–39 year age group.
Table 14: Number and rates* of notifi cations of infectious syphilis (less than 2 years duration), Australia, 2008, by state or territory a nd sex †
State or territory Male Female TotalCount Rate* Count Rate* Count Rate*
ACT/NSW 398 11.0 22 0.6 420 5.7NT 49 43.0 34 32.1 83 37.8Qld 167 7.8 20 0.9 187 4.4SA 45 5.7 7 0.9 52 3.2Tas 5 2.0 2 0.8 7 1.4Vic 355 13.5 17 0.6 374 7.0WA 133 12.1 47 4.4 180 3.4Total 1,152 10.8 149 1.4 1,303 6.1
* Notifi cation rate per 100,000 population. † Total includes 2 notifi cations whose sex was not reported.
Figure 29: Notifi cation rate of infectious syphilis (primary, secondary and early latent ), less than 2 years duration, Australia, 2008, by age group and sex
0
5
10
15
20
25
30
0-4
5-9
10-1
4
15-1
9
20-2
4
25-2
9
30-3
4
35-3
9
40-4
4
45-4
9
50-5
4
55-5
9
60-6
4
65-6
9
70-7
4
75-7
9
80-8
4
85+
Age group (years)
Rat
e pe
r 100
,000
pop
ulat
ion
Male
Female
* Excludes 2 notifi cations whose sex was not reported.
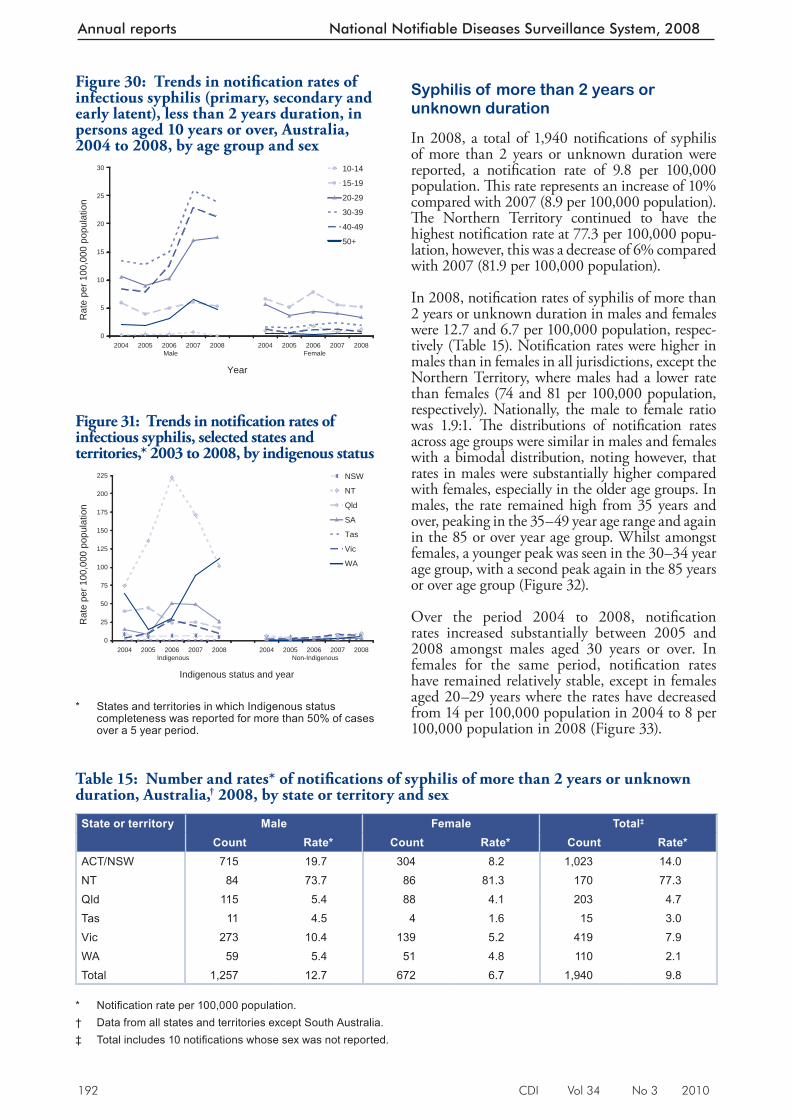
192 CDI Vol 34 No 3 2010
Annual reports National Notifiable Diseases Surveillance System, 2008
Syphilis of more than 2 years or unknown duration
In 2008, a total of 1,940 notifi cations of syphilis of more than 2 years or unknown duration were reported, a notifi cation rate of 9.8 per 100,000 population. Th is rate represents an increase of 10% compared with 2007 (8.9 per 100,000 population). Th e Northern Territory continued to have the highest notifi cation rate at 77.3 per 100,000 popu-lation, however, this was a decrease of 6% compared with 2007 (81.9 per 100,000 population).
In 2008, notifi cation rates of syphilis of more than 2 years or unknown duration in males and females were 12.7 and 6.7 per 100,000 population, respec-tively (Table 15). Notifi cation rates were higher in males than in females in all jurisdictions, except the Northern Territory, where males had a lower rate than females (74 and 81 per 100,000 population, respectively). Nationally, the male to female ratio was 1.9:1. Th e distributions of notifi cation rates across age groups were similar in males and females with a bimodal distribution, noting however, that rates in males were substantially higher compared with females, especially in the older age groups. In males, the rate remained high from 35 years and over, peaking in the 35–49 year age range and again in the 85 or over year age group. Whilst amongst females, a younger peak was seen in the 30–34 year age group, with a second peak again in the 85 years or over age group (Figure 32).
Over the period 2004 to 2008, notifi cation rates increased substantially between 2005 and 2008 amongst males aged 30 years or over. In females for the same period, notifi cation rates have remained relatively stable, except in females aged 20–29 years where the rates have decreased from 14 per 100,000 population in 2004 to 8 per 100,000 population in 2008 (Figure 33).
Figure 31: Trends in notifi cation rates of infectious syphilis, selected states and terr itories,* 2003 to 2008, by indigenous status
0
25
50
75
100
125
150
175
200
225
2004Indigenous
2005 2006 2007 2008 2004Non-Indigenous
2005 2006 2007 2008
Indigenous status and year
Rat
e pe
r 100
,000
pop
ulat
ion
NSW
NT
Qld
SA
Tas
Vic
WA
* States and territories in which Indigenous status
completeness was reported for more than 50% of cases over a 5 year period.
Table 15: Number and rates* of notifi cations of syphilis of more than 2 years or unknow n duration, Australia, † 2008, by state or territory and sex
State or territory Male Female Total‡
Count Rate* Count Rate* Count Rate*ACT/NSW 715 19.7 304 8.2 1,023 14.0NT 84 73.7 86 81.3 170 77.3Qld 115 5.4 88 4.1 203 4.7Tas 11 4.5 4 1.6 15 3.0Vic 273 10.4 139 5.2 419 7.9WA 59 5.4 51 4.8 110 2.1Total 1,257 12.7 672 6.7 1,940 9.8
* Notifi cation rate per 100,000 population. † Data from all states and territories except South Australia. ‡ Total includes 10 notifi cations whose sex was not reported.
Figure 30: Trends in notifi cation rates of infectious syphilis (primary, secondary and e arly latent), less than 2 years duration, in persons aged 10 years or over, Australia, 2004 to 2008, by age group and sex
0
5
10
15
20
25
30
2004Male
2005 2006 2007 2008 2004Female
2005 2006 2007 2008
Year
Rat
e pe
r 100
,000
pop
ulat
ion
10-14
15-19
20-29
30-39
40-49
50+
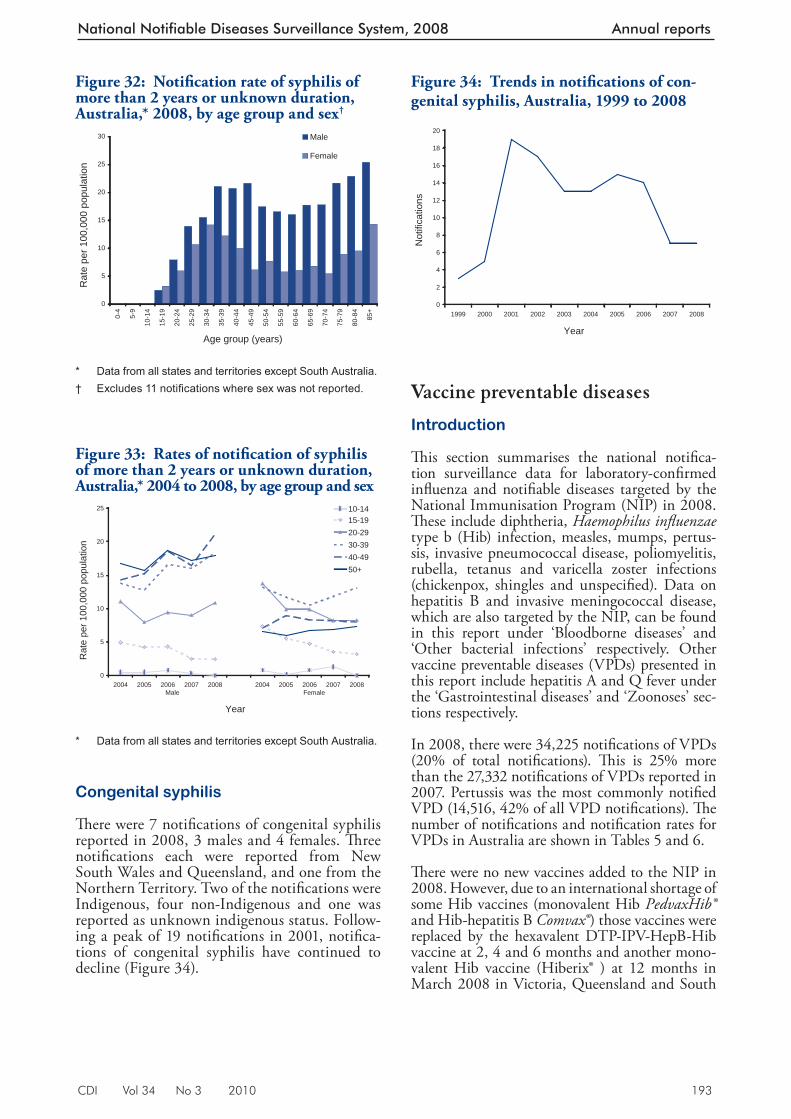
CDI Vol 34 No 3 2010 193
National Notifiable Diseases Surveillance System, 2008 Annual reports
Vaccine prev entable diseases
Introduction
Th is section summarises the national notifi ca-tion surveillance data for laboratory-confi rmed infl uenza and notifi able diseases targeted by the National Immunisation Program (NIP) in 2008. Th ese include diphtheria, Haemophilus infl uenzae type b (Hib) infection, measles, mumps, pertus-sis, invasive pneumococcal disease, poliomyelitis, rubella, tetanus and varicella zoster infections (chickenpox, shingles and unspecifi ed). Data on hepatitis B and invasive meningococcal disease, which are also targeted by the NIP, can be found in this report under ‘Bloodborne diseases’ and ‘Other bacterial infections’ respectively. Other vaccine preventable diseases (VPDs) presented in this report include hepatitis A and Q fever under the ‘Gastrointestinal diseases’ and ‘Zoonoses’ sec-tions respectively.
In 2008, there were 34,225 notifi cations of VPDs (20% of total notifi cations). Th is is 25% more than the 27,332 notifi cations of VPDs reported in 2007. Pertussis was the most commonly notifi ed VPD (14,516, 42% of all VPD notifi cations). Th e number of notifi cations and notifi cation rates for VPDs in Australia are shown in Tables 5 and 6.
Th ere were no new vaccines added to the NIP in 2008. However, due to an international shortage of some Hib vaccines (monovalent Hib PedvaxHib® and Hib-hepatitis B Comvax® ) those vaccines were replaced by the hexavalent DTP-IPV-HepB-Hib vaccine at 2, 4 and 6 months and another mono-valent Hib vaccine (Hiberix® ) at 12 months in March 2008 in Victoria, Queensland and South
Congenital syphilis
Th ere were 7 notifi cations of congenital syphilis reported in 2008, 3 males and 4 females. Th ree notifi cations each were reported from New South Wales and Queensland, and one from the Northern Territory. Two of the notifi cations were Indigenous, four non-Indigenous and one was reported as unknown indigenous status. Follow-ing a peak of 19 notifi cations in 2001, notifi ca-tions of congenital syphilis have continued to decline (Figure 34).
Figure 32: Notifi cation rate of syphilis of more than 2 years or unknown duration, Australia,* 2008, by age group and sex†
0
5
10
15
20
25
30
0-4
5-9
10-1
4
15-1
9
20-2
4
25-2
9
30-3
4
35-3
9
40-4
4
45-4
9
50-5
4
55-5
9
60-6
4
65-6
9
70-7
4
75-7
9
80-8
4
85+
Age group (years)
Rat
e pe
r 100
,000
pop
ulat
ion
Male
Female
* Data from all states and territories except South Australia. † Excludes 11 notifi cations where sex was not reported.
Figure 33: Rates of notifi cation of syphilis of more than 2 years or unknown duration, Austral ia,* 2004 to 2008, by age group and sex
0
5
10
15
20
25
2004Male
2005 2006 2007 2008 2004Female
2005 2006 2007 2008
Year
Rat
e pe
r 100
,000
pop
ulat
ion
10-1415-1920-2930-3940-4950+
* Data from all states and territories except South Australia.
Figure 34: Trends in notifi cations of con-genital syphilis, Australia, 1999 to 2008
0
2
4
6
8
10
12
14
16
18
20
1999 2000 2001 2002 2003 2004 2005 2006 2007 2008
Year
Not
ifica
tions
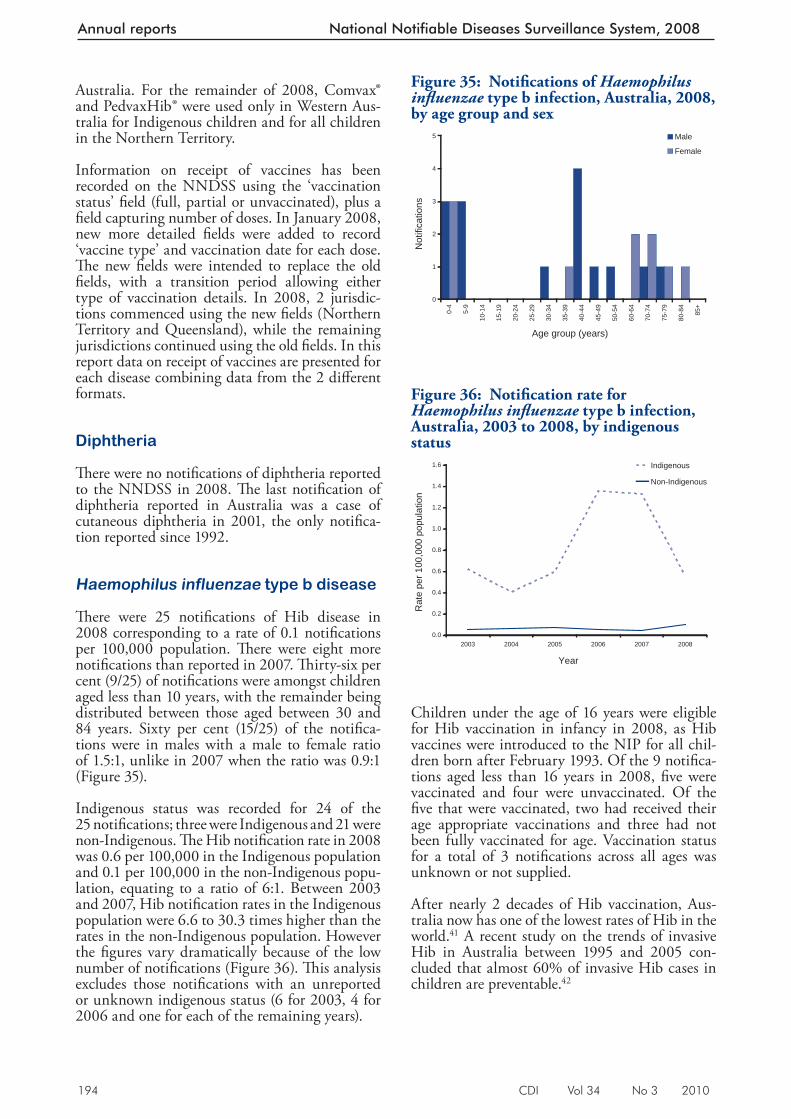
194 CDI Vol 34 No 3 2010
Annual reports National Notifiable Diseases Surveillance System, 2008
Australia. For the remainder of 2008, Comvax® and PedvaxHib® were used only in Western Aus-tralia for Indigenous children and for all children in the Northern Territory.
Information on receipt of vaccines has been recorded on the NNDSS using the ‘vaccination status’ fi eld (full, partial or unvaccinated), plus a fi eld capturing number of doses. In January 2008, new more detailed fi elds were added to record ‘vaccine type’ and vaccination date for each dose. Th e new fi elds were intended to replace the old fi elds, with a transition period allowing either type of vaccination details. In 2008, 2 jurisdic-tions commenced using the new fi elds (Northern Territory and Queensland), while the remaining jurisdictions continued using the old fi elds. In this report data on receipt of vaccines are presented for each disease combining data from the 2 diff erent formats.
Diphtheria
Th ere were no notifi cations of diphtheria reported to the NNDSS in 2008. Th e last notifi cation of diphtheria reported in Australia was a case of cutaneous diphtheria in 2001, the only notifi ca-tion reported since 1992.
Haemophilus influenzae type b disease
Th ere were 25 notifi cations of Hib disease in 2008 corresponding to a rate of 0.1 notifi cations per 100,000 population. Th ere were eight more notifi cations than reported in 2007. Th irty-six per cent (9/25) of notifi cations were amongst children aged less than 10 years, with the remainder being distributed between those aged between 30 and 84 years. Sixty per cent (15/25) of the notifi ca-tions were in males with a male to female ratio of 1.5:1, unlike in 2007 when the ratio was 0.9:1 (Figure 35).
Indigenous status was recorded for 24 of the 25 notifi cations; three were Indigenous and 21 were non-Indigenous. Th e Hib notifi cation rate in 2008 was 0.6 per 100,000 in the Indigenous population and 0.1 per 100,000 in the non-Indigenous popu-lation, equating to a ratio of 6:1. Between 2003 and 2007, Hib notifi cation rates in the Indigenous population were 6.6 to 30.3 times higher than the rates in the non-Indigenous population. However the fi gures vary dramatically because of the low number of notifi cations (Figure 36). Th is analysis excludes those notifi cations with an unreported or unknown indigenous status (6 for 2003, 4 for 2006 and one for each of the remaining years).
Children under the age of 16 years were eligible for Hib vaccination in infancy in 2008, as Hib vaccines were introduced to the NIP for all chil-dren born after February 1993. Of the 9 notifi ca-tions aged less than 16 years in 2008, fi ve were vaccinated and four were unvaccinated. Of the fi ve that were vaccinated, two had received their age appropriate vaccinations and three had not been fully vaccinated for age. Vaccination status for a total of 3 notifi cations across all ages was unknown or not supplied.
After nearly 2 decades of Hib vaccination, Aus-tralia now has one of the lowest rates of Hib in the world. 41 A recent study on the trends of invasive Hib in Australia between 1995 and 2005 con-cluded that almost 60% of invasive Hib cases in children are preventable. 42
Figure 35: Notifi cations of Haemophilus infl uenzae type b infection, Australia, 2008, by age group and sex
0
1
2
3
4
5
0-4
5-9
10-1
4
15-1
9
20-2
4
25-2
9
30-3
4
35-3
9
40-4
4
45-4
9
50-5
4
60-6
4
70-7
4
75-7
9
80-8
4
85+
Age group (years)
Not
ifica
tions
Male
Female
Figure 36: Notifi cation rate for Haemophilus infl uenzae type b infection, Australia, 2003 to 2008, by indigenous status
0.0
0.2
0.4
0.6
0.8
1.0
1.2
1.4
1.6
2003 2004 2005 2006 2007 2008
Year
Rat
e pe
r 100
,000
pop
ulat
ion
Indigenous
Non-Indigenous
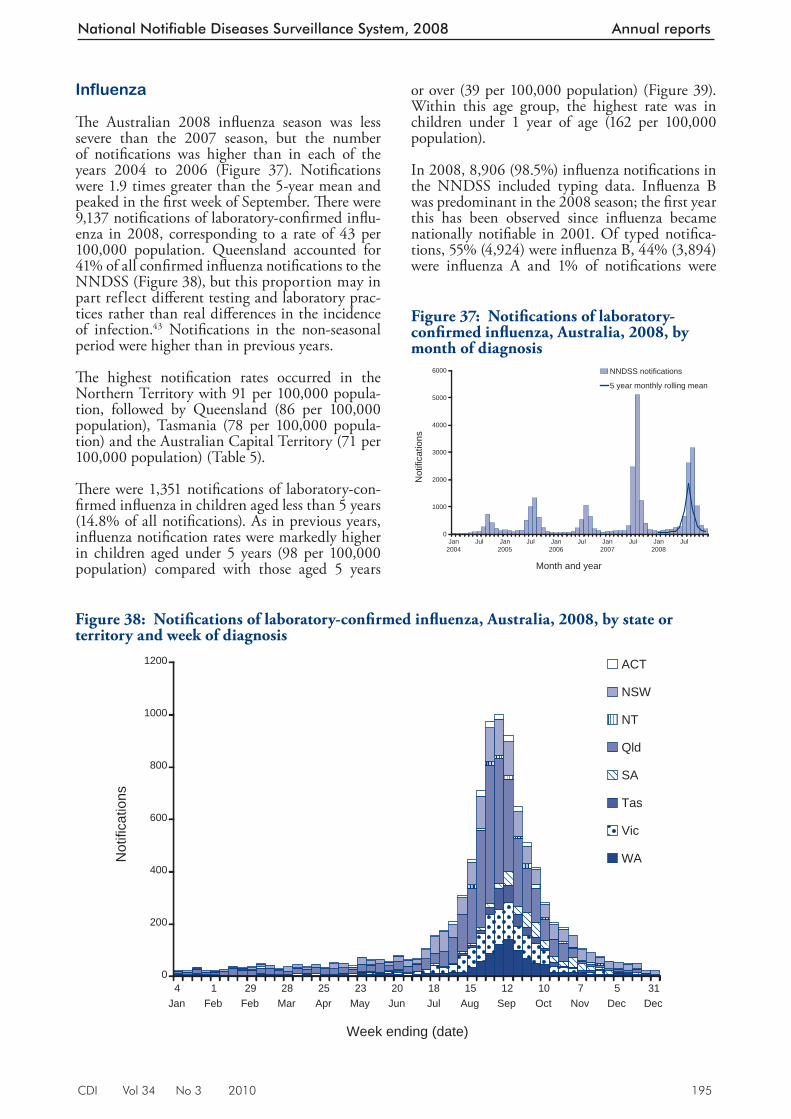
CDI Vol 34 No 3 2010 195
National Notifiable Diseases Surveillance System, 2008 Annual reports
Influenza
Th e Australian 2008 infl uenza season was less severe than the 2007 season, but the number of notifi cations was higher than in each of the years 2004 to 2006 (Figure 37). Notifi cations were 1.9 times greater than the 5-year mean and peaked in the fi rst week of September. Th ere were 9,137 notifi cations of laboratory-confi rmed infl u-enza in 2008, corresponding to a rate of 43 per 100,000 population. Queensland accounted for 41% of all confi rmed infl uenza notifi cations to the NNDSS (Figure 38), but this proportion may in part ref lect diff erent testing and laboratory prac-tices rather than real diff erences in the incidence of infection. 43 Notifi cations in the non-seasonal period were higher than in previous years.
Th e highest notifi cation rates occurred in the Northern Territory with 91 per 100,000 popula-tion, followed by Queensland (86 per 100,000 population), Tasmania (78 per 100,000 popula-tion) and the Australian Capital Territory (71 per 100,000 population) (Table 5).
Th ere were 1,351 notifi cations of laboratory-con-fi rmed infl uenza in children aged less than 5 years (14.8% of all notifi cations). As in previous years, infl uenza notifi cation rates were markedly higher in children aged under 5 years (98 per 100,000 population) compared with those aged 5 years
or over (39 per 100,000 population) (Figure 39). Within this age group, the highest rate was in children under 1 year of age (162 per 100,000 population).
In 2008, 8,906 (98.5%) infl uenza notifi cations in the NNDSS included typing data. Infl uenza B was predominant in the 2008 season; the fi rst year this has been observed since infl uenza became nationally notifi able in 2001. Of typed notifi ca-tions, 55% (4,924) were infl uenza B, 44% (3,894) were infl uenza A and 1% of notifi cations were
Figure 37: Notifi cations of laboratory-confi rmed infl uenza, Australia, 2008, by month of diagnosis
0
1000
2000
3000
4000
5000
6000
Jan2004
Jul Jan2005
Jul Jan2006
Jul Jan2007
Jul Jan2008
Jul
Month and year
Not
ifica
tions
NNDSS notifications
5 year monthly rolling mean
Figure 38: Notifi cations of laboratory-confi rmed infl uenza, Australia, 2008, by state or territory and week of diagnosis
0
200
400
600
800
1000
1200
4Jan
1Feb
29Feb
28Mar
25Apr
23May
20Jun
18Jul
15Aug
12Sep
10Oct
7Nov
5Dec
31Dec
Week ending (date)
Not
ifica
tions
ACT
NSW
NT
Qld
SA
Tas
Vic
WA
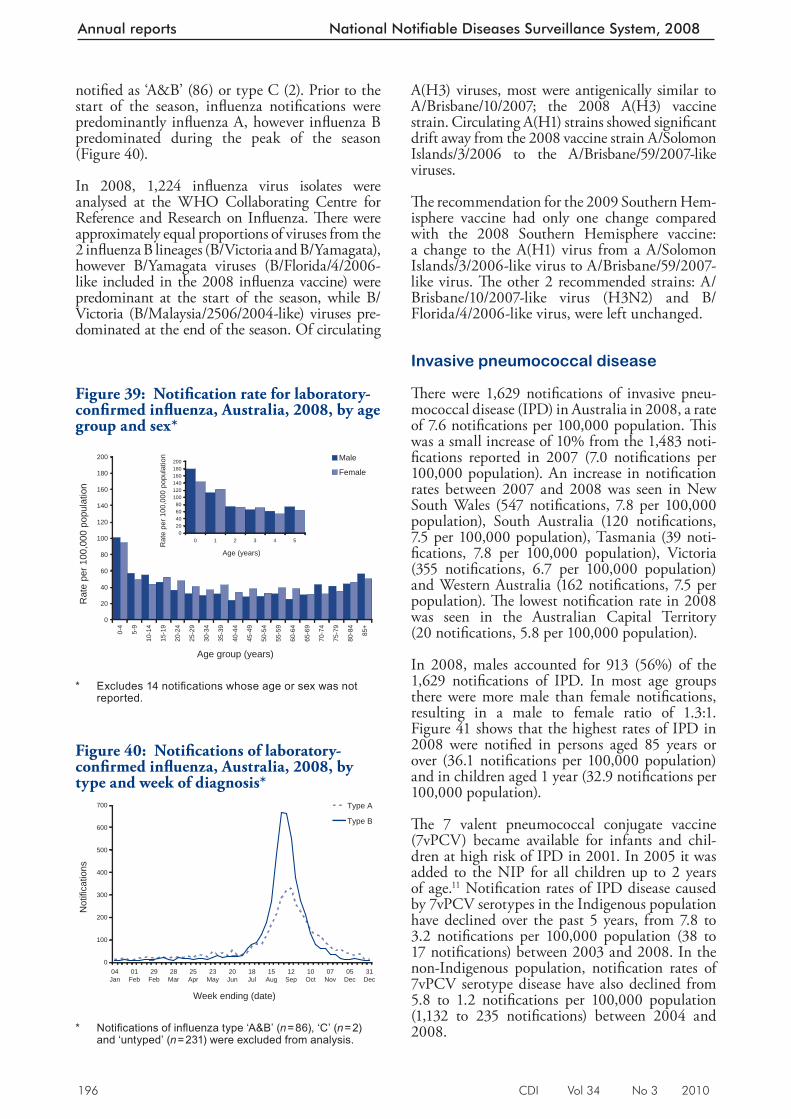
196 CDI Vol 34 No 3 2010
Annual reports National Notifiable Diseases Surveillance System, 2008
notifi ed as ‘A&B’ (86) or type C (2). Prior to the start of the season, infl uenza notifi cations were predominantly infl uenza A, however infl uenza B predominated during the peak of the season (Figure 40).
In 2008, 1,224 infl uenza virus isolates were analysed at the WHO Collaborating Centre for Reference and Research on Infl uenza. Th ere were approximately equal proportions of viruses from the 2 infl uenza B lineages (B/Victoria and B/Yamagata), however B/Yamagata viruses (B/Florida/4/2006-like included in the 2008 infl uenza vaccine) were predominant at the start of the season, while B/Victoria (B/Malaysia/2506/2004-like) viruses pre-dominated at the end of the season. Of circulating
A(H3) viruses, most were antigenically similar to A/Brisbane/10/2007; the 2008 A(H3) vaccine strain. Circulating A(H1) strains showed signifi cant drift away from the 2008 vaccine strain A/Solomon Islands/3/2006 to the A/Brisbane/59/2007-like viruses.
Th e recommendation for the 2009 Southern Hem-isphere vaccine had only one change compared with the 2008 Southern Hemisphere vaccine: a change to the A(H1) virus from a A/Solomon Islands/3/2006-like virus to A/Brisbane/59/2007-like virus. Th e other 2 recommended strains: A/Brisbane/10/2007-like virus (H3N2) and B/Florida/4/2006-like virus, were left unchanged.
Invasive pneumococcal disease
Th ere were 1,629 notifi cations of invasive pneu-mococcal disease (IPD) in Australia in 2008, a rate of 7.6 notifi cations per 100,000 population. Th is was a small increase of 10% from the 1,483 noti-fi cations reported in 2007 (7.0 notifi cations per 100,000 population). An increase in notifi cation rates between 2007 and 2008 was seen in New South Wales (547 notifi cations, 7.8 per 100,000 population), South Australia (120 notifi cations, 7.5 per 100,000 population), Tasmania (39 noti-fi cations, 7.8 per 100,000 population), Victoria (355 notifi cations, 6.7 per 100,000 population) and Western Australia (162 notifi cations, 7.5 per population). Th e lowest notifi cation rate in 2008 was seen in the Australian Capital Territory (20 notifi cations, 5.8 per 100,000 population).
In 2008, males accounted for 913 (56%) of the 1,629 notifi cations of IPD. In most age groups there were more male than female notifi cations, resulting in a male to female ratio of 1.3:1. Figure 41 shows that the highest rates of IPD in 2008 were notifi ed in persons aged 85 years or over (36.1 notifi cations per 100,000 population) and in children aged 1 year (32.9 notifi cations per 100,000 population).
Th e 7 valent pneumococcal conjugate vaccine (7vPCV) became available for infants and chil-dren at high risk of IPD in 2001. In 2005 it was added to the NIP for all children up to 2 years of age. 11 Notifi cation rates of IPD disease caused by 7vPCV serotypes in the Indigenous population have declined over the past 5 years, from 7.8 to 3.2 notifi cations per 100,000 population (38 to 17 notifi cations) between 2003 and 2008. In the non-Indigenous population, notifi cation rates of 7vPCV serotype disease have also declined from 5.8 to 1.2 notifi cations per 100,000 population (1,132 to 235 notifi cations) between 2004 and 2008.
Figure 39: Notifi ca tion rate for laboratory-confi rmed infl uenza, Australia, 2008, by age group and sex*
0
20
40
60
80
100
120
140
160
180
200
0-4
5-9
10-1
4
15-1
9
20-2
4
25-2
9
30-3
4
35-3
9
40-4
4
45-4
9
50-5
4
55-5
9
60-6
4
65-6
9
70-7
4
75-7
9
80-8
4
85+
Age group (years)
Rat
e pe
r 100
,000
pop
ulat
ion
Male
Female
020406080
100120140160180200
0 1 2 3 4 5
Age (years)
Rat
e pe
r 100
,000
pop
ulat
ion
* Excludes 14 notifi cations whose age or sex was not
reported.
Figure 40: Notifi cations of laboratory-confi rmed infl uenza, Australia, 2008, by type and week of di agnosis*
0
100
200
300
400
500
600
700
04Jan
01Feb
29Feb
28Mar
25Apr
23May
20Jun
18Jul
15Aug
12Sep
10Oct
07Nov
05Dec
31Dec
Week ending (date)
Not
ifica
tions
Type A
Type B
* Notifi cations of infl uenza type ‘A&B’ ( n = 86), ‘C’ ( n = 2)
and ‘untyped’ ( n = 231) were excluded from analysis.
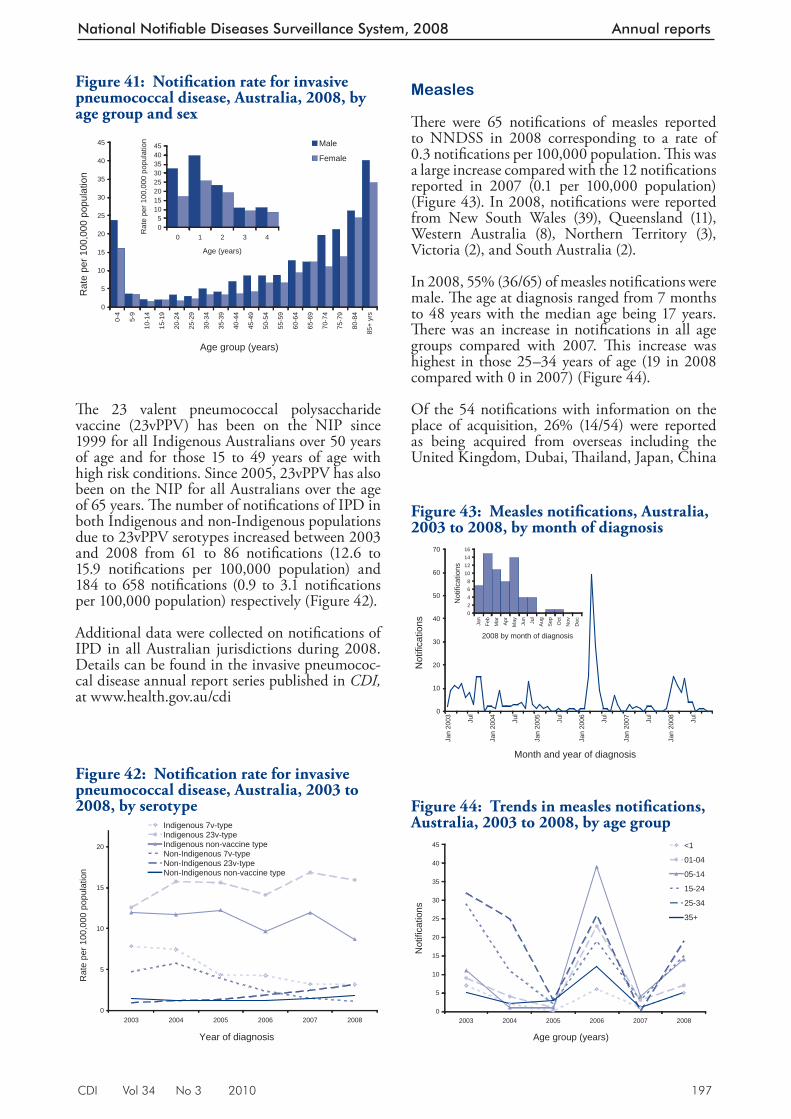
CDI Vol 34 No 3 2010 197
National Notifiable Diseases Surveillance System, 2008 Annual reports
Th e 23 valent pneumococcal polysaccharide vaccine (23vPPV) has been on the NIP since 1999 for all Indigenous Australians over 50 years of age and for those 15 to 49 years of age with high risk conditions. Since 2005, 23vPPV has also been on the NIP for all Australians over the age of 65 years. Th e number of notifi cations of IPD in both Indigenous and non-Indigenous populations due to 23vPPV serotypes increased between 2003 and 2008 from 61 to 86 notifi cations (12.6 to 15.9 notifi cations per 100,000 population) and 184 to 658 notifi cations (0.9 to 3.1 notifi cations per 100,000 population) respectively (Figure 42).
Additional data were collected on notifi cations of IPD in all Australian jurisdictions during 2008. Details can be found in the invasive pneumococ-cal disease annual report series published in CDI, at www.health.gov.au/cdi
Measles
Th ere were 65 notifi cations of measles reported to NNDSS in 2008 corresponding to a rate of 0.3 notifi cations per 100,000 population. Th is was a large increase compared with the 12 notifi cations reported in 2007 (0.1 per 100,000 population) (Figure 43). In 2008, notifi cations were reported from New South Wales (39), Queensland (11), Western Australia (8), Northern Territory (3), Victoria (2), and South Australia (2).
In 2008, 55% (36/65) of measles notifi cations were male. Th e age at diagnosis ranged from 7 months to 48 years with the median age being 17 years. Th ere was an increase in notifi cations in all age groups compared with 2007. Th is increase was highest in those 25–34 years of age (19 in 2008 compared with 0 in 2007) (Figure 44).
Of the 54 notifi cat ions with information on the place of acquisition, 26% (14/54) were reported as being acquired from overseas including the United Kingdom, Dubai, Th ailand, Japan, China
Figure 41: Notifi cation rate for invasive pneumococcal disease, Australia, 2008, by age group and s ex
0
5
10
15
20
25
30
35
40
45
0-4
5-9
10-1
4
15-1
9
20-2
4
25-2
9
30-3
4
35-3
9
40-4
4
45-4
9
50-5
4
55-5
9
60-6
4
65-6
9
70-7
4
75-7
9
80-8
4
85+
yrs
Age group (years)
Rat
e pe
r 100
,000
pop
ulat
ion
Male
Female
05
1015202530354045
0 1 2 3 4
Age (years)
Rat
e pe
r 100
,000
pop
ulat
ion
Figure 42: Notifi cation rate for invasive pneumococcal disease, Australia, 2003 to 2008, by serotyp e
0
5
10
15
20
2003 2004 2005 2006 2007 2008
Year of diagnosis
Rat
e pe
r 100
,000
pop
ulat
ion
Indigenous 7v-typeIndigenous 23v-typeIndigenous non-vaccine typeNon-Indigenous 7v-typeNon-Indigenous 23v-typeNon-Indigenous non-vaccine type
Figure 43: Measles notifi cations, Australia, 2003 to 2008, by month of diagnosis
0
10
20
30
40
50
60
70
Jan
2003 Ju
l
Jan
2004 Ju
l
Jan
2005 Ju
l
Jan
2006 Ju
l
Jan
2007 Ju
l
Jan
2008 Ju
l
Month and year of diagnosis
Not
ifica
tions
02468
10121416
Jan
Feb
Mar
Apr
May Jun
Jul
Aug
Sep Oct
Nov
Dec
2008 by month of diagnosis
Not
ifica
tions
Figure 44: Trends in measles notifi cations, Australia, 2003 to 2008, by age group
0
5
10
15
20
25
30
35
40
45
2003 2004 2005 2006 2007 2008
Age group (years)
Not
ifica
tions
<1
01-04
05-14
15-24
25-34
35+
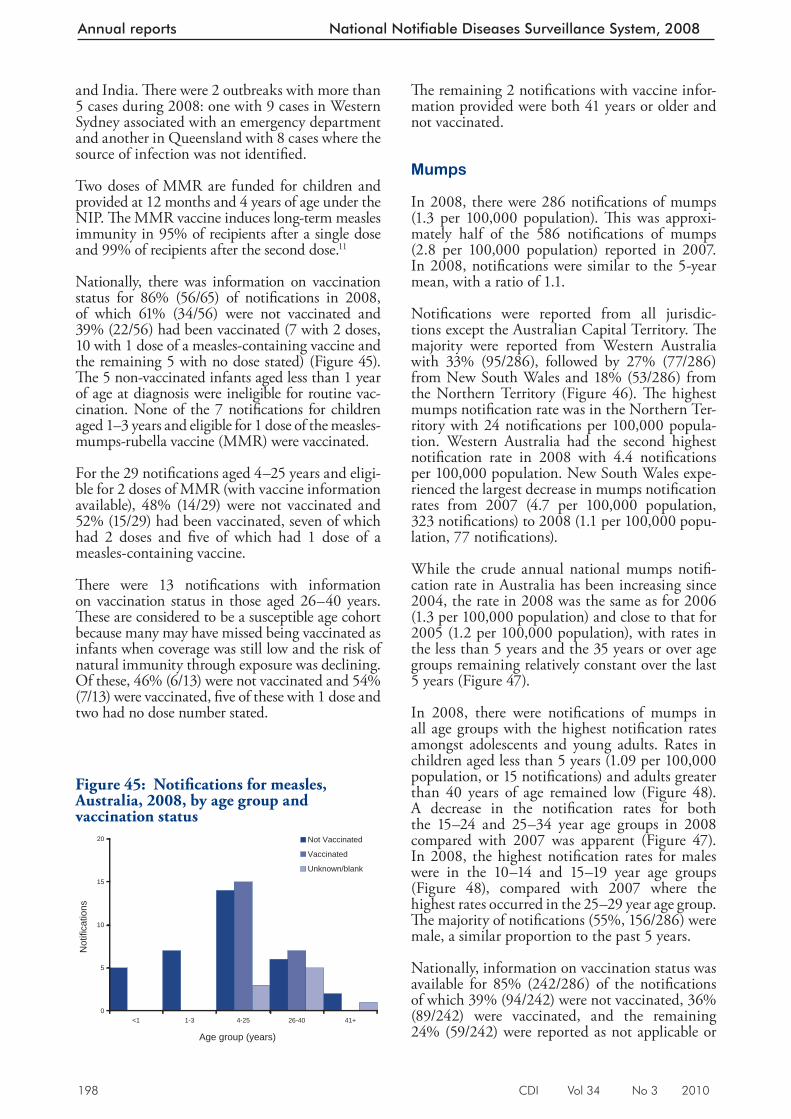
198 CDI Vol 34 No 3 2010
Annual reports National Notifiable Diseases Surveillance System, 2008
and India. Th ere were 2 outbreaks with more than 5 cases during 2008: one with 9 cases in Western Sydney associated with an emergency department and another in Queensland with 8 cases where the source of infection was not identifi ed.
Two doses of MMR are funded for children and provided at 12 months and 4 years of age under the NIP. Th e MMR vaccine induces long-term measles immunity in 95% of recipients after a single dose and 99% of recipients after the second dose. 11
Nationally, there was information on vaccination status for 86% (56/65) of notifi cations in 2008, of which 61% (34/56) were not vaccinated and 39% (22/56) had been vaccinated (7 with 2 doses, 10 with 1 dose of a measles-containing vaccine and the remaining 5 with no dose stated) (Figure 45). Th e 5 non-vaccinated infants aged less than 1 year of age at diagnosis were ineligible for routine vac-cination. None of the 7 notifi cations for children aged 1–3 years and eligible for 1 dose of the measles-mumps-rubella vaccine (MMR) were vaccinated.
For the 29 notifi cations aged 4–25 years and eligi-ble for 2 doses of MMR (with vaccine information available), 48% (14/29) were not vaccinated and 52% (15/29) had been vaccinated, seven of which had 2 doses and fi ve of which had 1 dose of a measles-containing vaccine.
Th ere were 13 notifi cations with information on vaccination status in those aged 26–40 years. Th ese are considered to be a susceptible age cohort because many may have missed being vaccinated as infants when coverage was still low and the risk of natural immunity through exposure was declining. Of these, 46% (6/13) were not vaccinated and 54% (7/13) were vaccinated, fi ve of these with 1 dose and two had no dose number stated.
Th e remaining 2 notifi cations with vaccine infor-mation provided were both 41 years or older and not vaccinated.
Mumps
In 2 008, there were 286 notifi cations of mumps (1.3 per 100,000 population). Th is was approxi-mately half of the 586 notifi cations of mumps (2.8 per 100,000 population) reported in 2007. In 2008, notifi cations were similar to the 5-year mean, with a ratio of 1.1.
Notifi cations were reported from all jurisdic-tions except the Australian Capital Territory. Th e majority were reported from Western Australia with 33% (95/286), followed by 27% (77/286) from New South Wales and 18% (53/286) from the Northern Territory (Figure 46). Th e highest mumps notifi cation rate was in the Northern Ter-ritory with 24 notifi cations per 100,000 popula-tion. Western Australia had the second highest notifi cation rate in 2008 with 4.4 notifi cations per 100,000 population. New South Wales expe-rienced the largest decrease in mumps notifi cation rates from 2007 (4.7 per 100,000 population, 323 notifi cations) to 2008 (1.1 per 100,000 popu-lation, 77 notifi cations).
While the crude annual national mumps notifi -cation rate in Australia has been increasing since 2004, the rate in 2008 was the same as for 2006 (1.3 per 100,000 population) and close to that for 2005 (1.2 per 100,000 population), with rates in the less than 5 years and the 35 years or over age groups remaining relatively constant over the last 5 years (Figure 47).
In 2008, the re were notifi cations of mumps in all age groups with the highest notifi cation rates amongst adolescents and young adults. Rates in children aged less than 5 years (1.09 per 100,000 population, or 15 notifi cations) and adults greater than 40 years of age remained low (Figure 48). A decrease in the notifi cation rates for both the 15–24 and 25–34 year age groups in 2008 compared with 2007 was apparent (Figure 47). In 2008, the highest notifi cation rates for males were in the 10–14 and 15–19 year age groups (Figure 48), compared with 2007 where the highest rates occurred in the 25–29 year age group. Th e majority of notifi cations (55%, 156/286) were male, a similar proportion to the past 5 years.
Nationally, information on vacc ination status was available for 85% (242/286) of the notifi cations of which 39% (94/242) were not vaccinated, 36% (89/242) were vaccinated, and the remaining 24% (59/242) were reported as not applicable or
Figure 45: Notifi cations for measles, Australia, 2008, by age group and vaccination status
0
5
10
15
20
<1 1-3 4-25 26-40 41+
Age group (years)
Not
ifica
tions
Not Vaccinated
Vaccinated
Unknown/blank
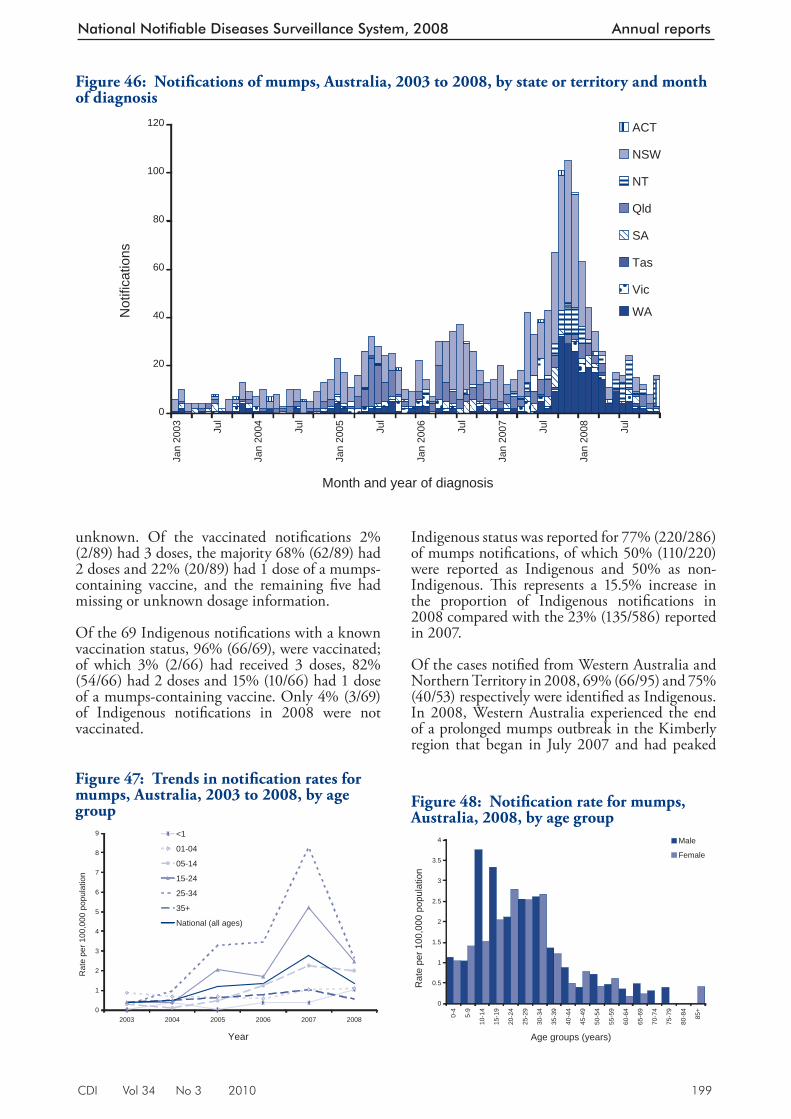
CDI Vol 34 No 3 2010 199
National Notifiable Diseases Surveillance System, 2008 Annual reports
unknown. Of the vaccinated notifi cations 2% (2/89) had 3 doses, the majority 68% (62/89) had 2 doses and 22% (20/89) had 1 dose of a mumps-containing vaccine, and the remaining fi ve had missing or unknown dosage information.
Of the 69 Indigenous notifi cations with a known vaccination status, 96% (66/69), were vaccinated; of which 3% (2/66) had received 3 doses, 82% (54/66) had 2 doses and 15% (10/66) had 1 dose of a mumps-containing vaccine. Only 4% (3/69) of Indigenous notifi cations in 2008 were not vaccinated.
Indigenous status was reported for 77% (220/286) of mumps notifi cations, of which 50% (110/220) were reported as Indigenous and 50% as non-Indigenous. Th is represents a 15.5% increase in the proportion of Indigenous notifi cations in 2008 compared with the 23% (135/586) reported in 2007.
Of the cases notifi ed from Western Australia and Northern Territory in 2008, 69% (66/95) and 75% (40/53) respectively were identifi ed as Indigenous. In 2008, Western Australia experienced the end of a prolonged mumps outbreak in the Kimberly region that began in July 2007 and had peaked
Figure 46: Notifi cations of mumps, Australia, 2003 to 2008, by state or territory and month of diag nosis
0
20
40
60
80
100
120
Jan
2003 Ju
l
Jan
2004 Ju
l
Jan
2005 Ju
l
Jan
2006 Ju
l
Jan
2007 Ju
l
Jan
2008 Ju
l
Month and year of diagnosis
Not
ifica
tions
ACT
NSW
NT
Qld
SA
Tas
Vic
WA
Figure 47: Trends in notifi cation rates for mumps, Australia, 2003 to 2008, by age group
0
1
2
3
4
5
6
7
8
9
2003 2004 2005 2006 2007 2008
Year
Rat
e pe
r 100
,000
pop
ulat
ion
<1
01-04
05-14
15-24
25-34
35+
National (all ages)
Figure 48: Notifi cation rate for mumps, Australia, 2008, by age group
0
0.5
1
1.5
2
2.5
3
3.5
4
0-4
5-9
10-1
4
15-1
9
20-2
4
25-2
9
30-3
4
35-3
9
40-4
4
45-4
9
50-5
4
55-5
9
60-6
4
65-6
9
70-7
4
75-7
9
80-8
4
85+
Age groups (years)
Rat
e pe
r 100
,000
pop
ulat
ion
Male
Female
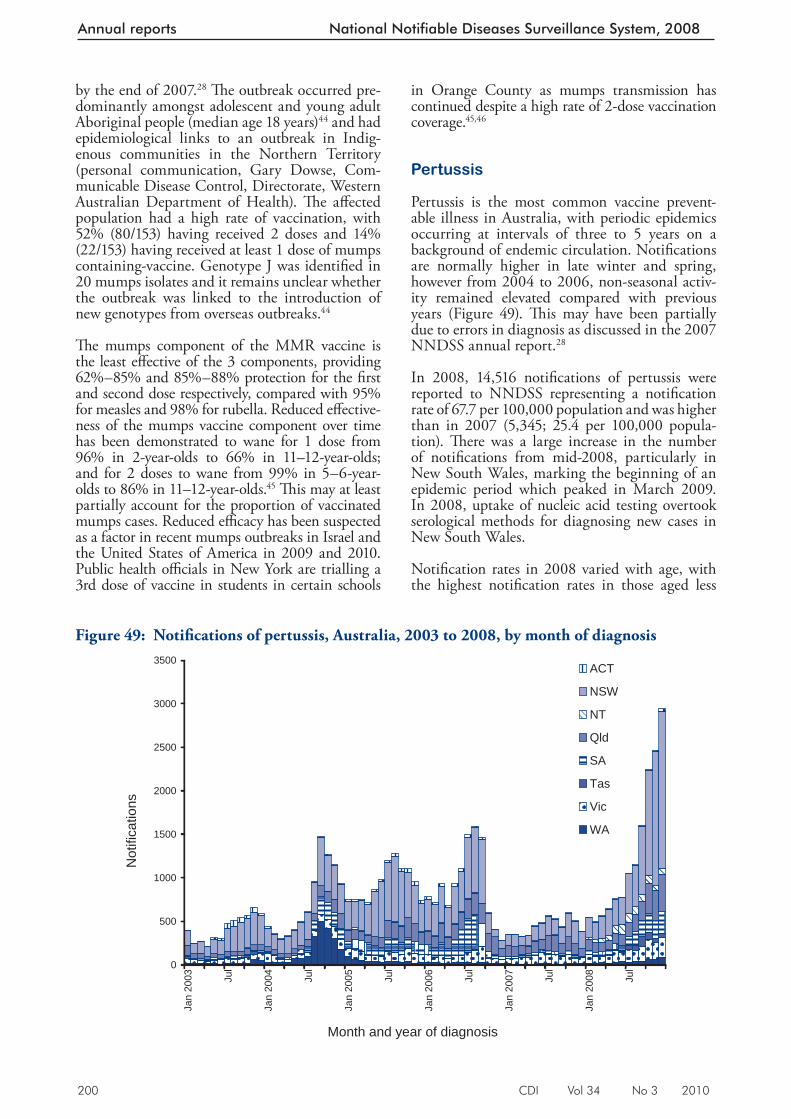
200 CDI Vol 34 No 3 2010
Annual reports National Notifiable Diseases Surveillance System, 2008
in Orange County as mumps transmission has continued despite a high rate of 2-dose vaccination coverage. 45,46
Pertussis
Pertussis is the most common vaccine prevent-able illness in Australia, with periodic epidemics occurring at intervals of three to 5 years on a background of endemic circulation. Notifi cations are normally higher in late winter and spring, however from 2004 to 2006, non-seasonal activ-ity remained elevated compared with previous years (Figure 49). Th is may have been partially due to errors in diagnosis as discussed in the 2007 NNDSS annual report. 28
In 2008, 14,516 notifi cations of pertussis were rep orted to NNDSS representing a notifi cation rate of 67.7 per 100,000 population and was higher than in 2007 (5,345; 25.4 per 100,000 popula-tion). Th ere was a large increase in the number of notifi cations from mid-2008, particularly in New South Wales, marking the beginning of an epidemic period which peaked in March 2009. In 2008, uptake of nucleic acid testing overtook serological methods for diagnosing new cases in New South Wales.
Notifi cation rates in 2008 varied with age, with the highest notifi cation rates in those aged less
by the end of 2007. 28 Th e outbreak occurred pre-dominantly amongst adolescent and young adult Aboriginal people (median age 18 years) 44 and had epidemiological links to an outbreak in Indig-enous communities in the Northern Territory (personal communication, Gary Dowse, Com-municable Disease Control, Directorate, Western Australian Department of Health). Th e aff ected population had a high rate of vaccination, with 52% (80/153) having received 2 doses and 14% (22/153) having received at least 1 dose of mumps containing-vaccine. Genotype J was identifi ed in 20 mumps isolates and it remains unclear whether the outbreak was linked to the introduction of new genotypes from overseas outbreaks. 44
Th e mumps component of the MMR vaccine is the least eff ective of the 3 components, providing 62%–85% and 85%–88% protection for the fi rst and second dose respectively, compared with 95% for measles and 98% for rubella. Reduced eff ective-ness of the mumps vaccine component over time has been demonstrated to wane for 1 dose from 96% in 2-year-olds to 66% in 11–12-year-olds; and for 2 doses to wane from 99% in 5–6-year-olds to 86% in 11–12-year-olds. 45 Th is may at least partially account for the proportion of vaccinated mumps cases. Reduced effi cacy has been suspected as a factor in recent mumps outbreaks in Israel and the United States of America in 2009 and 2010. Public health offi cials in New York are trialling a 3rd dose of vaccine in students in certain schools
Figure 49: Notifi cations of pertussis, Australia, 2003 to 2008, by month of diagnosis
0
500
1000
1500
2000
2500
3000
3500
Jan
2003 Ju
l
Jan
2004 Ju
l
Jan
2005 Ju
l
Jan
2006 Ju
l
Jan
2007 Ju
l
Jan
2008 Ju
l
Month and year of diagnosis
Not
ifica
tions
ACT
NSW
NT
Qld
SA
Tas
Vic
WA
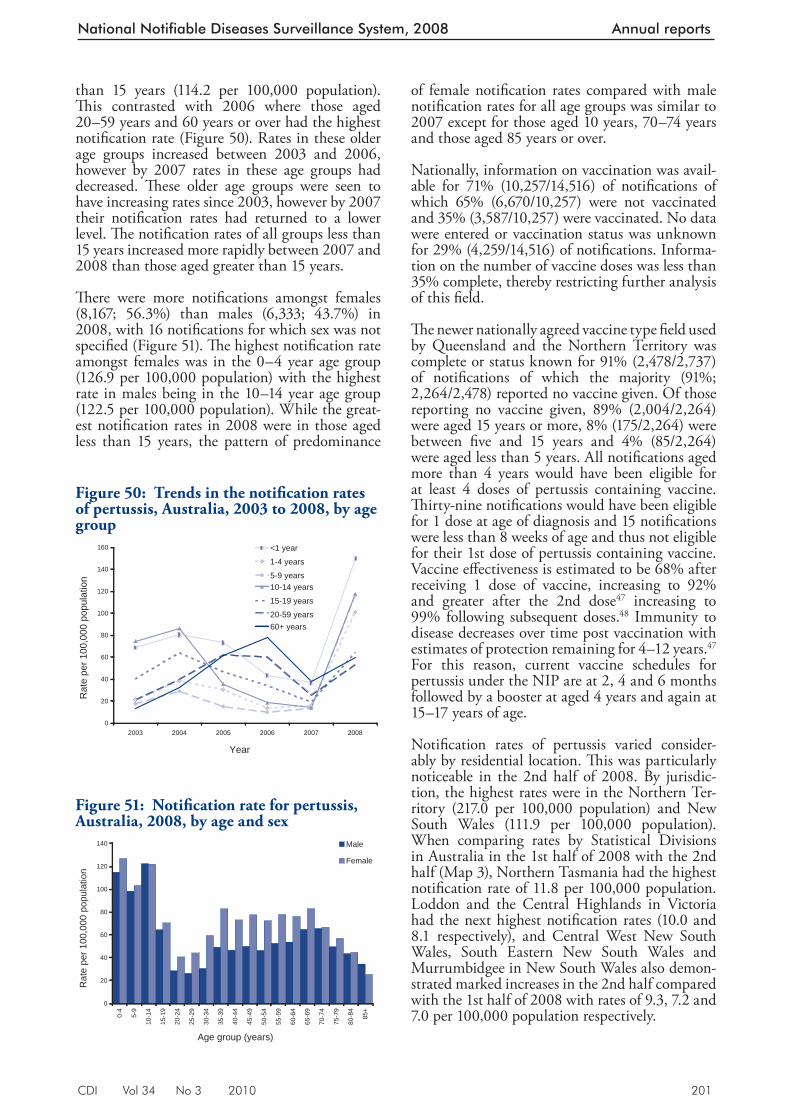
CDI Vol 34 No 3 2010 201
National Notifiable Diseases Surveillance System, 2008 Annual reports
than 15 years (114.2 per 100,000 population). Th is contrasted with 2006 where those aged 20–59 years and 60 years or over had the highest notifi cation rate (Figure 50). Rates in these older age groups increased between 2003 and 2006, however by 2007 rates in these age groups had decreased. Th ese older age groups were seen to have increasing rates since 2003, however by 2007 their notifi cation rates had returned to a lower level. Th e notifi cation rates of all groups less than 15 years increased more rapidly between 2007 and 2008 than those aged greater than 15 years.
Th ere were more notifi cations amongst fem ales (8,167; 56.3%) than males (6,333; 43.7%) in 2008, with 16 notifi cations for which sex was not specifi ed (Figure 51). Th e highest notifi cation rate amongst females was in the 0–4 year age group (126.9 per 100,000 population) with the highest rate in males being in the 10–14 year age group (122.5 per 100,000 population). While the great-est notifi cation rates in 2008 were in those aged less than 15 years, the pattern of predominance
of female notifi cation rates compared with male notifi cation rates for all age groups was similar to 2007 except for those aged 10 years, 70–74 years and those aged 85 years or over.
Nationally, information on vaccination was avail-able for 71% (10,257/14,516) of notifi cations of which 65% (6,670/10,257) were not vaccinated and 35% (3,587/10,257) were vaccinated. No data were entered or vaccination status was unknown for 29% (4,259/14,516) of notifi cations. Informa-tion on the number of vaccine doses was less than 35% complete, thereby restricting further analysis of this fi eld.
Th e newer nationally agreed vaccine type fi eld used by Queensland and the Northern Territory was complete or status known for 91% (2,478/2,737) of notifi cations of which the majority (91%; 2,264/2,478) reported no vaccine given. Of those reporting no vaccine given, 89% (2,004/2,264) were aged 15 years or more, 8% (175/2,264) were between fi ve and 15 years and 4% (85/2,264) were aged less than 5 years. All notifi cations aged more than 4 years would have been eligible for at least 4 doses of pertussis containing vaccine. Th irty-nine notifi cations would have been eligible for 1 dose at age of diagnosis and 15 notifi cations were less than 8 weeks of age and thus not eligible for their 1st dose of pertussis containing vaccine. Vaccine eff ectiveness is estimated to be 68% after receiving 1 dose of vaccine, increasing to 92% and greater after the 2nd dose 47 increasing to 99% following subsequent doses. 48 Immunity to disease decreases over time post vaccination with estimates of protection remaining for 4–12 years. 47 For this reason, current vaccine schedules for pertussis under the NIP are at 2, 4 and 6 months followed by a booster at aged 4 years and again at 15–17 years of age.
Notifi cation rates of pertussis varied consider-ably by residential location. Th is was particularly noticeable in the 2nd half of 2008. By jurisdic-tion, the highest rates were in the Northern Ter-ritory (217.0 per 100,000 population) and New South Wales (111.9 per 100,000 population). When comparing rates by Statistical Divisions in Australia in the 1st half of 2008 with the 2nd half (Map 3), Northern Tasmania had the highest notifi cation rate of 11.8 per 100,000 population. Loddon and the Central Highlands in Victoria had the next highest notifi cation rates (10.0 and 8.1 respectively), and Central West New South Wales, South Eastern New South Wales and Murrumbidgee in New South Wales also demon-strated marked increases in the 2nd half compared with the 1st half of 2008 with rates of 9.3, 7.2 and 7.0 per 100,000 population respectively.
Figure 51: Notifi cation rate for pertussis, Australia, 2008, by age and sex
0
20
40
60
80
100
120
140
0-4
5-9
10-1
4
15-1
9
20-2
4
25-2
9
30-3
4
35-3
9
40-4
4
45-4
9
50-5
4
55-5
9
60-6
4
65-6
9
70-7
4
75-7
9
80-8
4
85+
Age group (years)
Rat
e pe
r 100
,000
pop
ulat
ion
Male
Female
Figure 50: Trends in the notifi cation rates of pertussis, Australia, 2003 to 2008, by age group
0
20
40
60
80
100
120
140
160
2003 2004 2005 2006 2007 2008
Year
Rat
e pe
r 100
,000
pop
ulat
ion
<1 year
1-4 years
5-9 years10-14 years
15-19 years
20-59 years60+ years
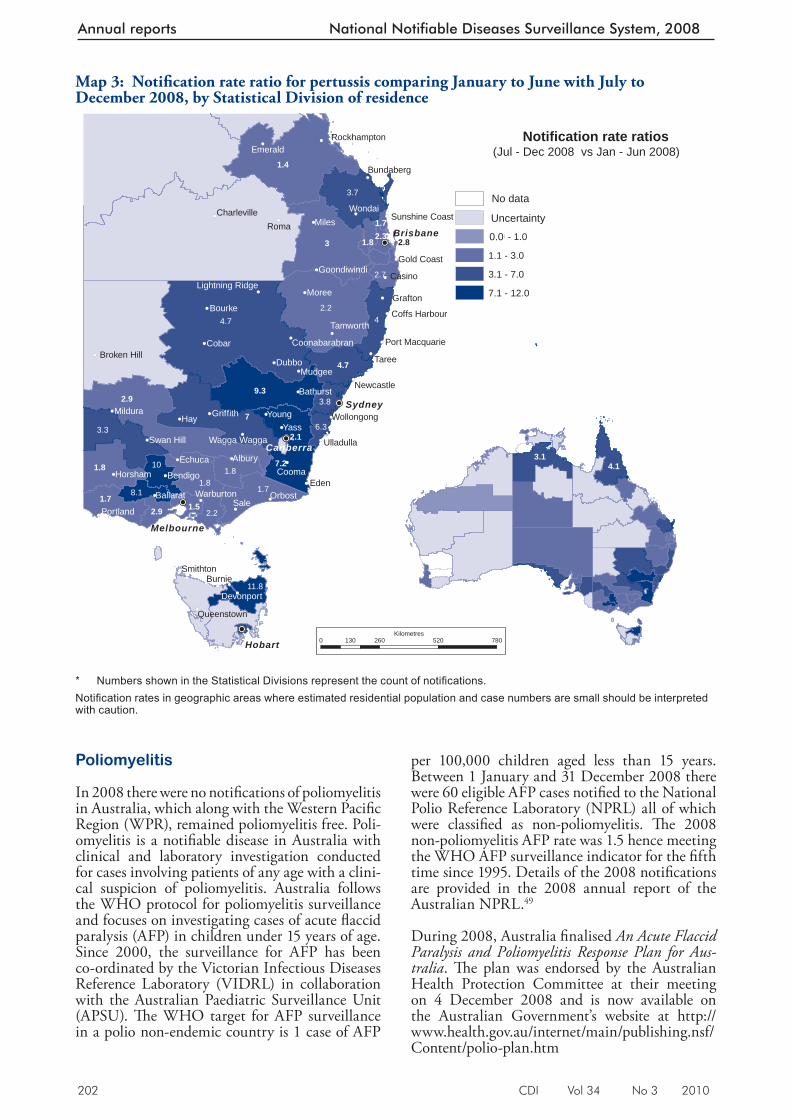
202 CDI Vol 34 No 3 2010
Annual reports National Notifiable Diseases Surveillance System, 2008
P oliomyelitis
In 2008 there were no notifi cations of poliomyelitis in Australia, which along with the Western Pacifi c Region (WPR), remained poliomyelitis free. Poli-omyelitis is a notifi able disease in Australia with clinical and laboratory investigation conducted for cases involving patients of any age with a clini-cal suspicion of poliomyelitis. Australia follows the WHO protocol for poliomyelitis surveillance and focuses on investigating cases of acute fl accid paralysis (AFP) in children under 15 years of age. Since 2000, the surveillance for AFP has been co-ordinated by the Victorian Infectious Diseases Reference Laboratory (VIDRL) in collaboration with the Australian Paediatric Surveillance Unit (APSU). Th e WHO target for AFP surveillance in a polio non-endemic country is 1 case of AFP
per 100,000 children aged less than 15 years. Between 1 January and 31 December 2008 there were 60 eligible AFP cases notifi ed to the National Polio Reference Laboratory (NPRL) all of which were classifi ed as non-poliomyelitis. Th e 2008 non-poliomyelitis AFP rate was 1.5 hence meeting the WHO AFP surveillance indicator for the fi fth time since 1995. Details of the 2008 notifi cations are provided in the 2008 annual report of the Australian NPRL. 49
During 2008, Australia fi nalised An Acute Flaccid Paralysis and Poliomyelitis Response Plan for Aus-tralia . Th e plan was endorsed by the Australian Health Protection Committee at their meeting on 4 December 2008 and is now available on the Australian Government’s website at http://www.health.gov.au/internet/main/publishing.nsf/Content/polio-plan.htm
Map 3: Notifi cation rate ratio for pertussis comparing January to June with July to December 2008, by Statistical Division of residence
!(
!(
!(
!(
!(
!(
!(
!(
!(
!(
!(
!(
!(
!(
!(
!(
!(
!(
!(
!(
!(
!(
!(
!(
!(
!(
!(
!(
!(
!(
!(
!(
!(
!(
!(
!(
!(!(
!(
!(
!(
!(
!( !(
!(
!(
!(
!(
!(
!(
!(
!(
!(
!P
!P
!P
!P
!P
Hay
Sale
Roma
Eden
Yass
Miles
Cobar
Taree
Moree
Cooma
Dubbo
Young
Burnie
AlburyEchuca
Orbost
Wondai
Bourke
Casino
Mudgee
BendigoHorsham
Mildura
Emerald
Grafton
Smithton
Portland
Ballarat
Griffith
Tamworth
Bathurst
Devonport
Bundaberg
Swan Hill
Warburton
Newcastle
Ulladulla
Gold Coast
Queenstown
Wollongong
Cunnamulla
Goondiwindi
Rockhampton
Charleville
Broken Hill
Wagga Wagga
Coffs Harbour
Coonabarabran
Sunshine Coast
Port Macquarie
Lightning Ridge
4.7
3
7
2.2
2.9
1.4
9.3
4
7.2
3.7
3.3
1.8
1.7
10
8.1
3.8
2.7
1.5
11.8
6.3
2.32.8
2.1
4.13.1
No data
Sydney
Canberra
Melbourne
Hobart
Brisbane
(Jul - Dec 2008 vs Jan - Jun 2008)
1.81.8
1.72.9 2.2
1.8
1.7
4.7
0 260 520 780130Kilometres
Notification rate ratios
-1.0
-0.9 - 1.0
1.1 - 3.0
3.1 - 7.0
7.1 - 12.0
Uncertainty
"0.0
* Numbers shown in the Statistical Divisions represent the count of notifi cations. Notifi cation rates in geographic areas where estimated residential population and case numbers are small should be interpreted with caution.
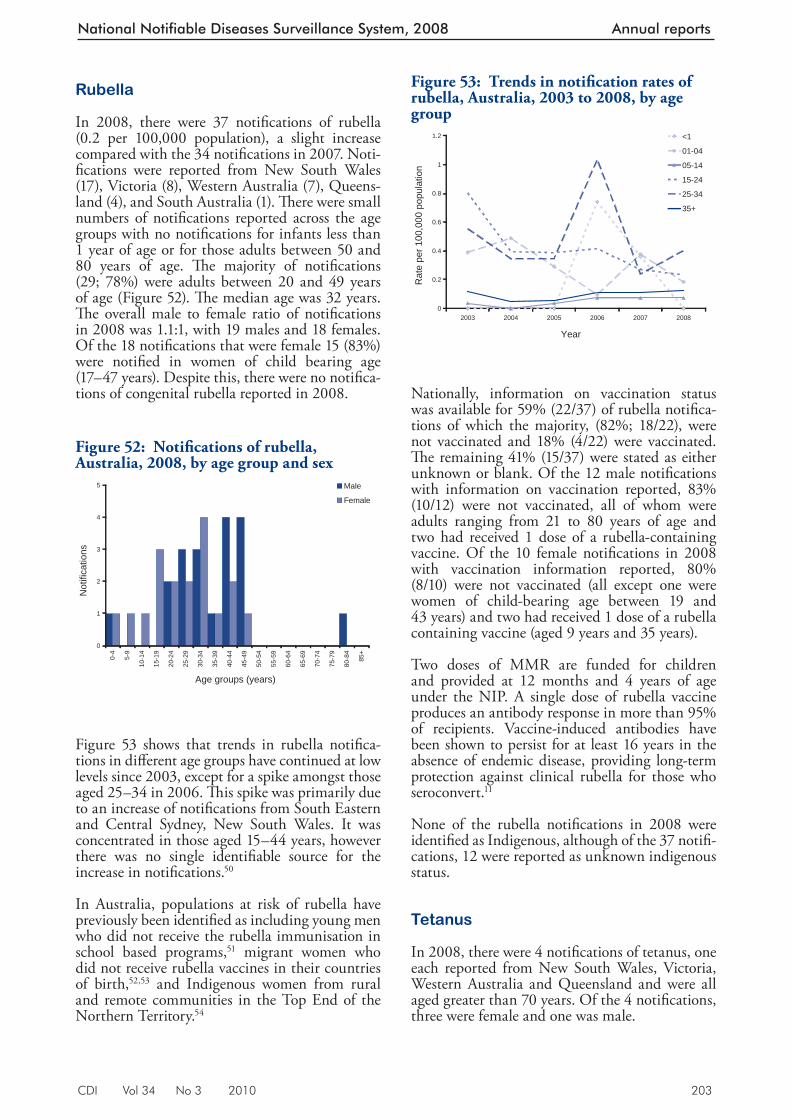
CDI Vol 34 No 3 2010 203
National Notifiable Diseases Surveillance System, 2008 Annual reports
Rubella
In 2008, there were 37 notifi cations of rubella (0.2 per 100,000 population), a slight increase compared with the 34 notifi cations in 2007. Noti-fi cations were reported from New South Wales (17), Victoria (8), Western Australia (7), Queens-land (4), and South Australia (1). Th ere were small numbers of notifi cations reported across the age groups with no notifi cations for infants less than 1 year of age or for those adults between 50 and 80 years of age. Th e majority of notifi cations (29; 78%) were adults between 20 and 49 years of age (Figure 52). Th e median age was 32 years. Th e overall male to female ratio of notifi cations in 2008 was 1.1:1, with 19 males and 18 females. Of the 18 notifi cations that were female 15 (83%) were notifi ed in women of child bearing age (17–47 years). Despite this, there were no notifi ca-tions of congenital rubella reported in 2008.
Figure 53 shows that trends in rubella notifi ca-tions in diff er ent age groups have continued at low levels since 2003, except for a spike a mongst those aged 25–34 in 2006. Th is spike was primarily due to an increase of notifi cations from South Eastern and Central Sydney, New South Wales. It was concentrated in those aged 15–44 years, however there was no single identifi able source for the increase in notifi cations. 50
In Australia, populations at risk of rubella have previously been identifi ed as including young men who did not receive the rubella immunisation in school based programs, 51 migrant women who did not receive rubella vaccines in their countries of birth, 52,53 and Indigenous women from rural and remote communities in the Top End of the Northern Territory. 54
Nationally, information on vaccination status was available for 59% (22/37) of rubella notifi ca-tions of which the majority, (82%; 18/22), were not vaccinated and 18% (4/22) were vaccinated. Th e remaining 41% (15/37) were stated as either unknown or blank. Of the 12 male notifi cations with information on vaccination reported, 83% (10/12) were not vaccinated, all of whom were adults ranging from 21 to 80 years of age and two had received 1 dose of a rubella-containing vaccine. Of the 10 female notifi cations in 2008 with vaccination information reported, 80% (8/10) were not vaccinated (all except one were women of child-bearing age between 19 and 43 years) and two had received 1 dose of a rubella containing vaccine (aged 9 years and 35 years).
Two doses of MMR are funded for children and provided at 12 months and 4 years of age under the NIP. A single dose of rubella vaccine produces an antibody response in more than 95% of recipients. Vaccine-induced antibodies have been shown to persist for at least 16 years in the absence of endemic disease, providing long-term protection against clinical rubella for those who seroconvert. 11
None of the rubella notifi cations in 2008 were identifi ed as Indigenous, although of the 37 notifi -cations, 12 were reported as unknown indigenous status.
Tetanus
In 2008, there were 4 notifi cations of tetanus, one each reported from New South Wales, Victoria, Western Australia and Queensland and were all aged greater than 70 years. Of the 4 notifi cations, three were female and one was male.
Figure 52: Notifi cations of rubella, Australia, 2008, by age group and sex
0
1
2
3
4
5
0-4
5-9
10-1
4
15-1
9
20-2
4
25-2
9
30-3
4
35-3
9
40-4
4
45-4
9
50-5
4
55-5
9
60-6
4
65-6
9
70-7
4
75-7
9
80-8
4
85+
Age groups (years)
Not
ifica
tions
Male
Female
Figure 53: Trends in notifi cation rates of rubella, Australia, 2003 to 2008, by age group
0
0.2
0.4
0.6
0.8
1
1.2
2003 2004 2005 2006 2007 2008
Year
Rat
e pe
r 100
,000
pop
ulat
ion
<1
01-04
05-14
15-24
25-34
35+
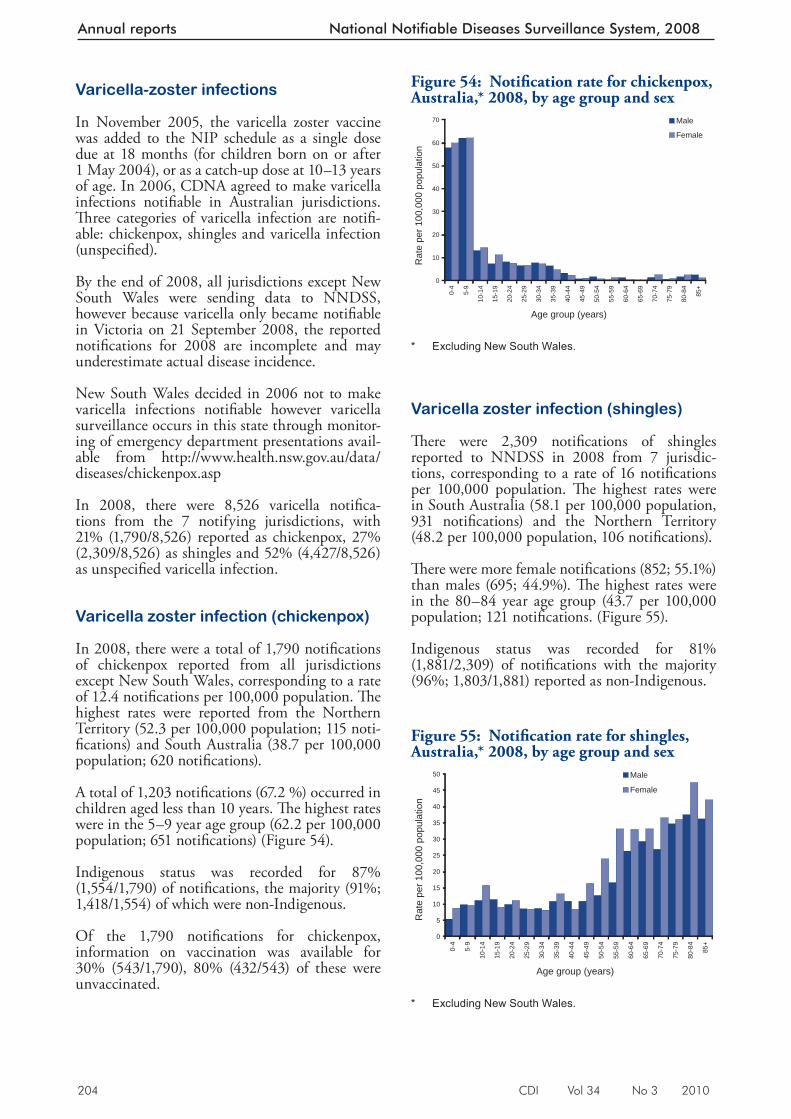
204 CDI Vol 34 No 3 2010
Annual reports National Notifiable Diseases Surveillance System, 2008
Varicella-zoster infections
In November 2005, the varicella zoster vaccine was added to the NIP schedule as a single dose due at 18 months (for children born on or after 1 May 2004), or as a catch-up dose at 10–13 years of age. In 2006, CDNA agreed to make varicella infections notifi able in Australian jurisdictions. Th ree categories of varicella infection are notifi -able: chickenpox, shingles and varicella infection (unspecifi ed).
By the end of 2008, all jurisdictions except New South Wales were sending data to NNDSS, however because varicella only became notifi able in Victoria on 21 September 2008, the reported notifi cations for 2008 are incomplete and may underestimate actual disease incidence.
New South Wales decided in 2006 not to make varicella infections notifi able however varicella surveillance occurs in this state through monitor-ing of emergency department presentations avail-able from http://www.health.nsw.gov.au/data/diseases/chickenpox.asp
In 2008, there were 8,526 varicella notifi ca-tions from the 7 notifying jurisdictions, with 21% (1,790/8,526) reported as chickenpox, 27% (2,309/8,526) as shingles and 52% (4,427/8,526) as unspecifi ed varicella infection.
Varicella zoster infection (chickenpox)
In 2008, there were a total of 1,790 notifi cations of chickenpox reported from all jurisdictions except New South Wales, corresponding to a rate of 12.4 notifi cations per 100,000 population. Th e highest rates were reported from the Northern Territory (52.3 per 100,000 population; 115 noti-fi cations) and South Australia (38.7 per 100,000 population; 620 notifi cations).
A total of 1,203 notifi cations (67.2 %) occurred in children aged less than 10 years. Th e highest rates were in the 5–9 year age group (62.2 per 100,000 population; 651 notifi cations) (Figure 54).
Indigenous status was re corded for 87% (1,554/1,790) of notifi cations, the majority (91%; 1,418/1,554) of which were non-Indigenous.
Of the 1,790 notifi cations for chickenpox, information on vaccination was available for 30% (543/1,790), 80% (432/543) of these were unvaccinated.
Varicella zoster infection (shingles)
Th ere were 2,309 notifi cations of shingles reported to NNDSS in 2008 from 7 jurisdic-tions, corresponding to a rate of 16 notifi cations per 100,000 population. Th e highest rates were in South Australia (58.1 per 100,000 population, 931 notifi cations) and the Northern Territory (48.2 per 100,000 population, 106 notifi cations).
Th ere were more female notifi cations (852; 55.1%) than males (695; 44.9%). Th e highest rates were in the 80–84 year age group (43.7 per 100,000 population; 121 notifi cations. (Figure 55).
Indigenous status was reco rded for 81% (1,881/2,309) of notifi cations with the majority (96%; 1,803/1,881) reported as non-Indigenous.
Figure 54: Notifi cation rate for chickenpox, Australia,* 2008, by age group and sex
0
10
20
30
40
50
60
70
0-4
5-9
10-1
4
15-1
9
20-2
4
25-2
9
30-3
4
35-3
9
40-4
4
45-4
9
50-5
4
55-5
9
60-6
4
65-6
9
70-7
4
75-7
9
80-8
4
85+
Age group (years)
Rat
e pe
r 100
,000
pop
ulat
ion
Male
Female
* Excluding New South Wales.
Figure 55: Notifi cation rate for shingles, Australia,* 2008, by age group and sex
0
5
10
15
20
25
30
35
40
45
50
0-4
5-9
10-1
4
15-1
9
20-2
4
25-2
9
30-3
4
35-3
9
40-4
4
45-4
9
50-5
4
55-5
9
60-6
4
65-6
9
70-7
4
75-7
9
80-8
4
85+
Age group (years)
Rat
e pe
r 100
,000
pop
ulat
ion
Male
Female
* Excluding New South Wales.
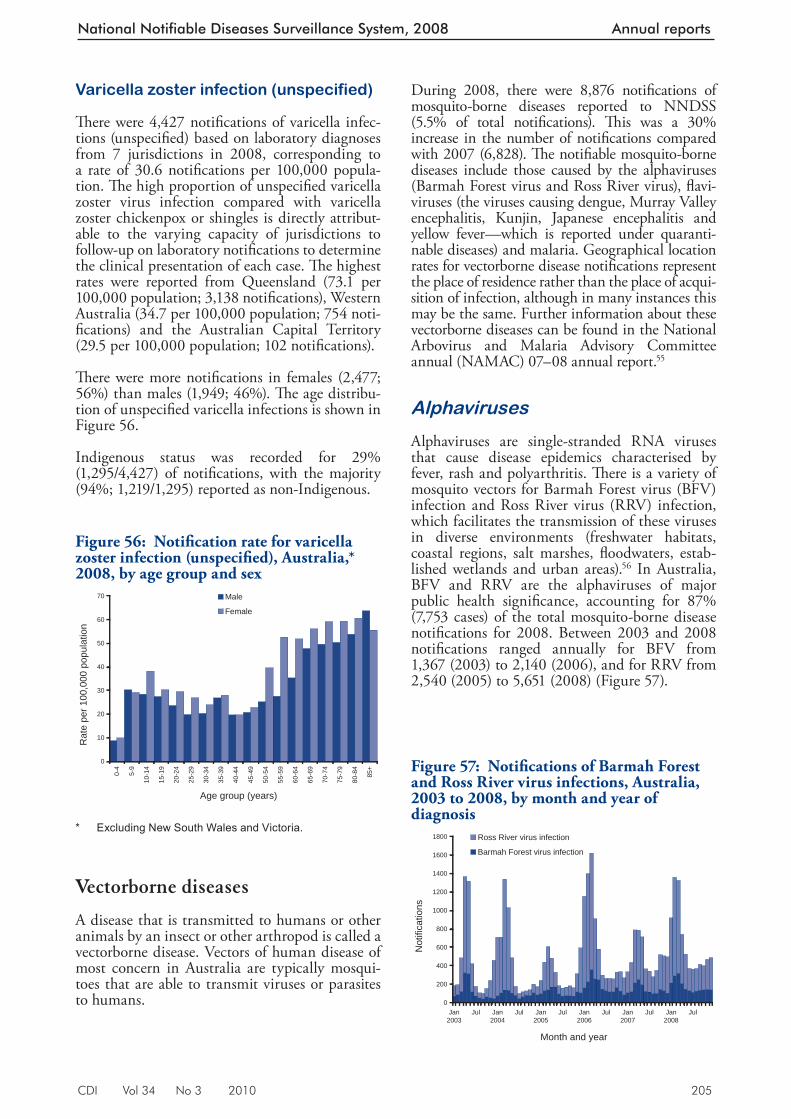
CDI Vol 34 No 3 2010 205
National Notifiable Diseases Surveillance System, 2008 Annual reports
Varicella zoster infection (unspecified)
Th ere were 4,427 notifi cations of varicella infec-tions (unspecifi ed) based on laboratory diagnoses from 7 jurisdictions in 2008, corresponding to a rate of 30.6 notifi cations per 100,000 popula-tion. Th e high proportion of unspecifi ed varicella zoster virus infection compared with varicella zoster chickenpox or shingles is directly attribut-able to the varying capacity of jurisdictions to follow-up on laboratory notifi cations to determine the clinical presentation of each case. Th e highest rates were reported from Queensland (73.1 per 100,000 population; 3,138 notifi cations), Western Australia (34.7 per 100,000 population; 754 noti-fi cations) and the Australian Capital Territory (29.5 per 100,000 population; 102 notifi cations).
Th ere were more notifi cations in females (2,477; 56%) than males (1,949; 46%). Th e age distribu-tion of unspecifi ed varicella infections is shown in Figure 56.
Indigenous status was recorded for 29% (1,295/4,427) of notifi cations, with the majority (94%; 1,219/1,295) reported as non-Indigenous.
Vectorborne diseases
A disease that is transmitted to humans or other animals by an insect or other arthropod is called a vectorborne disease. Vectors of human disease of most concern in Australia are typically mosqui-toes that are able to transmit viruses or parasites to humans.
During 2008, there were 8,876 notifi cations of mosquito-borne diseases reported to NNDSS (5.5% of total notifi cations). Th is was a 30% increase in the number of notifi cations compared with 2007 (6,828). Th e notifi able mosquito-borne diseases include those caused by the alphaviruses (Barmah Forest virus and Ross River virus), fl avi-viruses (the viruses causing dengue, Murray Valley encephalitis, Kunjin, Japanese encephalitis and yellow fever—which is reported under quaranti-nable diseases) and malaria. Geographical location rates for vectorborne disease notifi cations represent the place of residence rather than the place of acqui-sition of infection, although in many instances this may be the same. Further information about these vectorborne diseases can be found in the National Arbovirus and Malaria Advisory Committee annual (NAMAC) 07–08 annual report. 55
Alphaviruses
Alphaviruses are single-stranded RNA viruses that cause disease epidemics characterised by fever, rash and polyarthritis. Th ere is a variety of mosquito vectors for Barmah Forest virus (BFV) infection and Ross River virus (RRV) infection, which facilitates the transmission of these viruses in diverse environments (freshwater habitats, coastal regions, salt marshes, fl oodwaters, estab-lished wetlands and urban areas). 56 In Australia, BFV and RRV are the alphaviruses of major public health signifi cance, accounting for 87% (7,753 cases) of the total mosquito-borne disease notifi cations for 2008. Between 2003 and 2008 notifi cations ranged annually for BFV from 1,367 (2003) to 2,140 (2006), and for RRV from 2,540 (2005) to 5,651 (2008) (Figure 57).
F igure 56: Notifi cation rate for varicella zoster infection (unspecifi ed), Australia,* 2008, by age group and sex
0
10
20
30
40
50
60
70
0-4
5-9
10-1
4
15-1
9
20-2
4
25-2
9
30-3
4
35-3
9
40-4
4
45-4
9
50-5
4
55-5
9
60-6
4
65-6
9
70-7
4
75-7
9
80-8
4
85+
Age group (years)
Rat
e pe
r 100
,000
pop
ulat
ion
Male
Female
* Excluding New South Wales and Victoria.
Figure 57: Notifi cations of Barmah Forest and Ross River virus infections, Australia, 2003 to 2008, by month and year of diagnosis
0
200
400
600
800
1000
1200
1400
1600
1800
Jan2003
Jul Jan2004
Jul Jan2005
Jul Jan2006
Jul Jan2007
Jul Jan2008
Jul
Month and year
Not
ifica
tions
Ross River virus infection
Barmah Forest virus infection
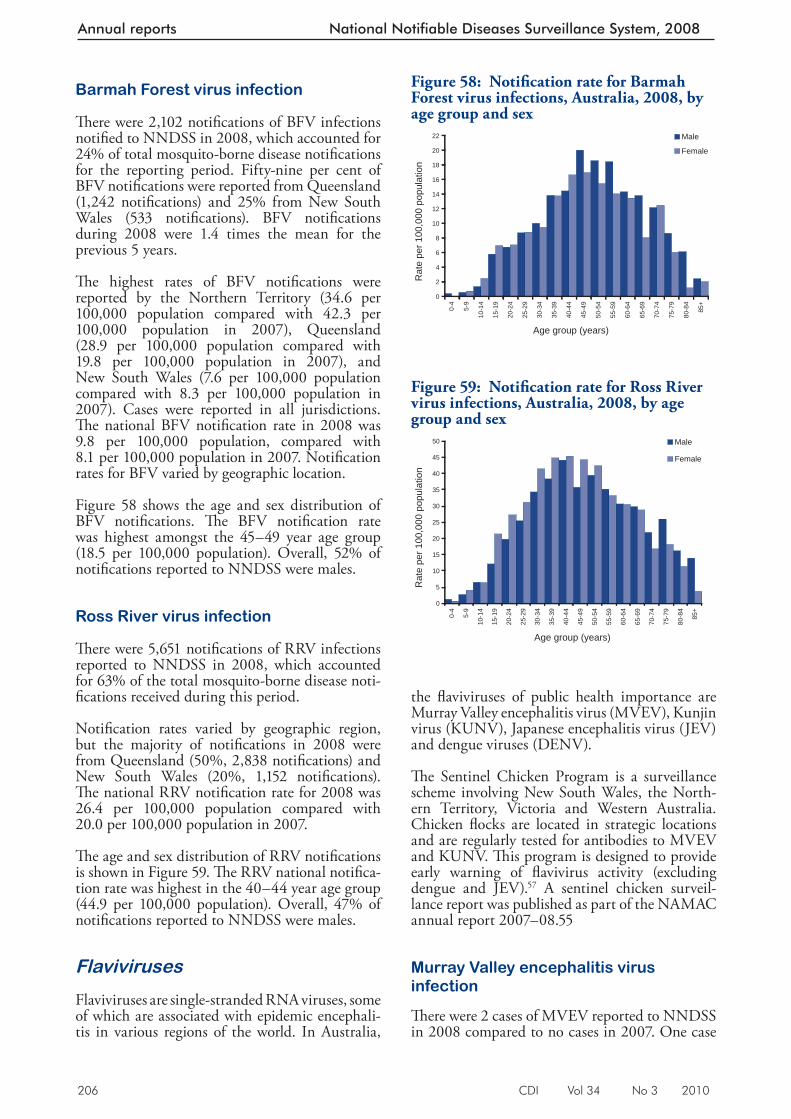
206 CDI Vol 34 No 3 2010
Annual reports National Notifiable Diseases Surveillance System, 2008
Barmah Forest virus infection
Th ere were 2,102 notifi cations of BFV infections notifi ed to NNDSS in 2008, which accounted for 24% of total mosquito-borne disease notifi cations for the reporting period. Fifty-nine per cent of BFV notifi cations were reported from Queensland (1,242 notifi cations) and 25% from New South Wales (533 notifi cations). BFV notifi cations during 2008 were 1.4 times the mean for the previous 5 years.
Th e highest rates of BFV notifi cations were reported by the Northern Territory (34.6 per 100,000 population compared with 42.3 per 100,000 population in 2007), Queensland (28.9 per 100,000 population compared with 19.8 per 100,000 population in 2007), and New South Wales (7.6 per 100,000 population compared with 8.3 per 100,000 population in 2007). Cases were reported in all jurisdictions. Th e national BFV notifi cation rate in 2008 was 9.8 per 100,000 population, compared with 8.1 per 100,000 population in 2007. Notifi cation rates for BFV varied by geographic location.
Figure 58 shows the age and sex distribution of BFV notifi cations. Th e BFV notifi cation rate was highest amongst the 45–49 year age group (18.5 per 100,000 population). Overall, 52% of notifi cations reported to NNDSS were males.
Ross River virus infection
Th ere w ere 5,651 notifi cations of RRV infections reported to NNDSS in 2008, which accounted for 63% of the total mosquito-borne disease noti-fi cations received during this period.
Notifi cation rates varied by geographic region, but the majority of notifi cations in 2008 were from Queensland (50%, 2,838 notifi cations) and New South Wales (20%, 1,152 notifi cations). Th e national RRV notifi cation rate for 2008 was 26.4 per 100,000 population compared with 20.0 per 100,000 population in 2007.
Th e age and sex distribution of RRV notifi cations is shown in Figure 59. Th e RRV national notifi ca-tion rate was highest in the 40–44 year age group (44.9 per 100,000 population). Overall, 47% of no tifi cations reported to NNDSS were males.
Flaviviruses
Flaviviruses are single- stranded RNA viruses, some of which are associated with epidemic encephali-tis in various regions of the world. In Australia,
the fl aviviruses of public health importance are Murray Valley encephalitis virus (MVEV), Kunjin virus (KUNV), Japanese encephalitis virus (JEV) and dengue viruses (DENV).
Th e Sentinel Chicken Program is a surveillance scheme involving New South Wales, the North-ern Territory, Victoria and Western Australia. Chicken fl ocks are located in strategic locations and are regularly tested for antibodies to MVEV and KUNV. Th is program is designed to provide early warning of fl avivirus activity (excluding dengue and JEV). 57 A sentinel chicken surveil-lance report was published as part of the NAMAC annual report 2007–08.55
Murray Valley encephalitis virus infection
Th ere were 2 cases of MVEV reported to NNDSS in 2008 compared to no cases in 2007. One case
Figure 58: Notifi cation rate for Barmah Forest virus infections, Australia, 2008, by age group and sex
0
2
4
6
8
10
12
14
16
18
20
22
0-4
5-9
10-1
4
15-1
9
20-2
4
25-2
9
30-3
4
35-3
9
40-4
4
45-4
9
50-5
4
55-5
9
60-6
4
65-6
9
70-7
4
75-7
9
80-8
4
85+
Age group (years)
Rat
e pe
r 100
,000
pop
ulat
ion
Male
Female
Figure 59: Notifi cation rate for Ross River virus infections, Australia, 2008, by age group and sex
0
5
10
15
20
25
30
35
40
45
500-
4
5-9
10-1
4
15-1
9
20-2
4
25-2
9
30-3
4
35-3
9
40-4
4
45-4
9
50-5
4
55-5
9
60-6
4
65-6
9
70-7
4
75-7
9
80-8
4
85+
Age group (years)
Rat
e pe
r 100
,000
pop
ulat
ion
Male
Female
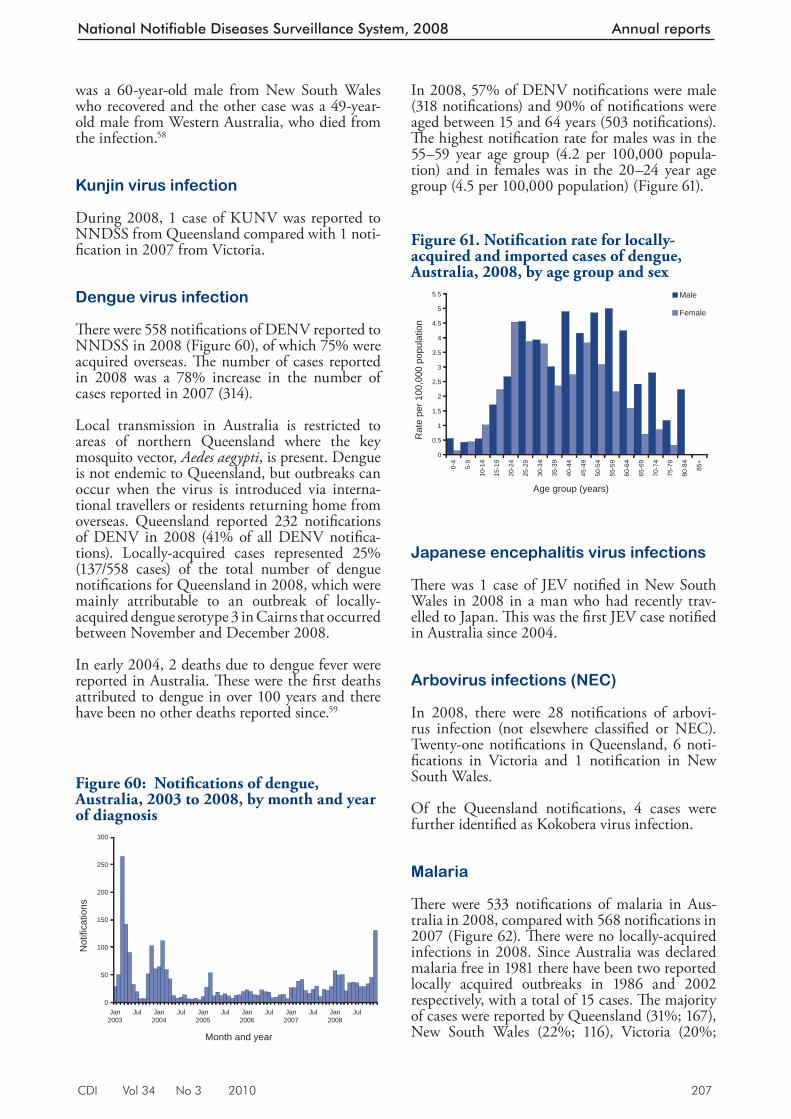
CDI Vol 34 No 3 2010 207
National Notifiable Diseases Surveillance System, 2008 Annual reports
In 2008, 57% of DENV notifi cations were male (318 notifi cations) and 90% of notifi cations were aged between 15 and 64 years (503 notifi cations). Th e highest notifi cation rate for males was in the 55–59 year age group (4.2 per 100,000 popula-tion) and in females was in the 20–24 year age group (4.5 per 100,000 popula tion) (Figure 61).
Japanese encephalitis virus infections
Th ere was 1 ca se of JEV notifi ed in New South Wales in 2008 in a man who had recently trav-elled to Japan. Th is was the fi rst JEV case notifi ed in Australia since 2004.
Arbovirus infections (NEC)
In 2008, there were 28 notifi cations of arbovi-rus infection (not elsewhere classifi ed or NEC). Twenty-one notifi cations in Queensland, 6 noti-fi cations in Victoria and 1 notifi cation in New South Wales.
Of the Queensland notifi cations, 4 cases were further identifi ed as Kokobera virus infection.
Malaria
Th ere were 533 notifi cations of malaria in Aus-tralia in 2008, compared with 568 notifi cations in 2007 (Figure 62). Th ere were no locally-acquired infections in 2008. Since Australia was declared malaria free in 1981 there have been two reported locally acquired outbreaks in 1986 and 2002 respectively, with a total of 15 cases. Th e majority of cases were reported by Queensland (31%; 167), New South Wales (22%; 116), Victoria (20%;
was a 60-year-old male from New South Wales who recovered and the other case was a 49-year-old male from Western Australia, who died from the infection. 58
Kunjin virus infection
During 2008, 1 case of KUNV was reported to NNDSS from Queensland compared with 1 noti-fi cation in 2007 from Victoria.
Dengue virus infection
Th ere were 558 notifi cations of DENV reported to NNDSS in 2008 (Figure 60), of which 75% were acquired overseas. Th e number of cases reported in 2008 was a 78% increase in the number of cases reported in 2007 (314).
Local trans mission in Australia is restricted to areas of northern Queensland where the key mosquito vector, Aedes aegypti , is present. Dengue is not endemic to Queensland , but outbreaks can occur when the virus is introduced via interna-tional travellers or residents returning home from overseas. Queensland reported 232 notifi cations of DENV in 2008 (41% of all DENV notifi ca-tions). Locally-acquired cases represented 25% (137/558 cases) of the total number of dengue notifi cations for Queensland in 2008, which were mainly attributable to an outbreak of locally-acquired dengue serotype 3 in Cairns that occurred between November and December 2008.
In early 2004, 2 deaths due to dengue fever were reported in Australia. Th ese were the fi rst deaths attributed to dengue in over 100 years and there have been no other deaths reported since. 59
Figure 60: Notifi cations of dengue, Australia, 2003 to 2008, by month and year of diagnosis
0
50
100
150
200
250
300
Jan2003
Jul Jan2004
Jul Jan2005
Jul Jan2006
Jul Jan2007
Jul Jan2008
Jul
Month and year
Not
ifica
tions
Figure 61. Notifi cation rate for locally-acquired and imported cases of dengue, Australia, 2008, by age group and sex
0
0.5
1
1.5
2
2.5
3
3.5
4
4.5
5
5.5
0-4
5-9
10-1
4
15-1
9
20-2
4
25-2
9
30-3
4
35-3
9
40-4
4
45-4
9
50-5
4
55-5
9
60-6
4
65-6
9
70-7
4
75-7
9
80-8
4
85+
Age group (years)
Rat
e pe
r 100
,000
pop
ulat
ion
Male
Female
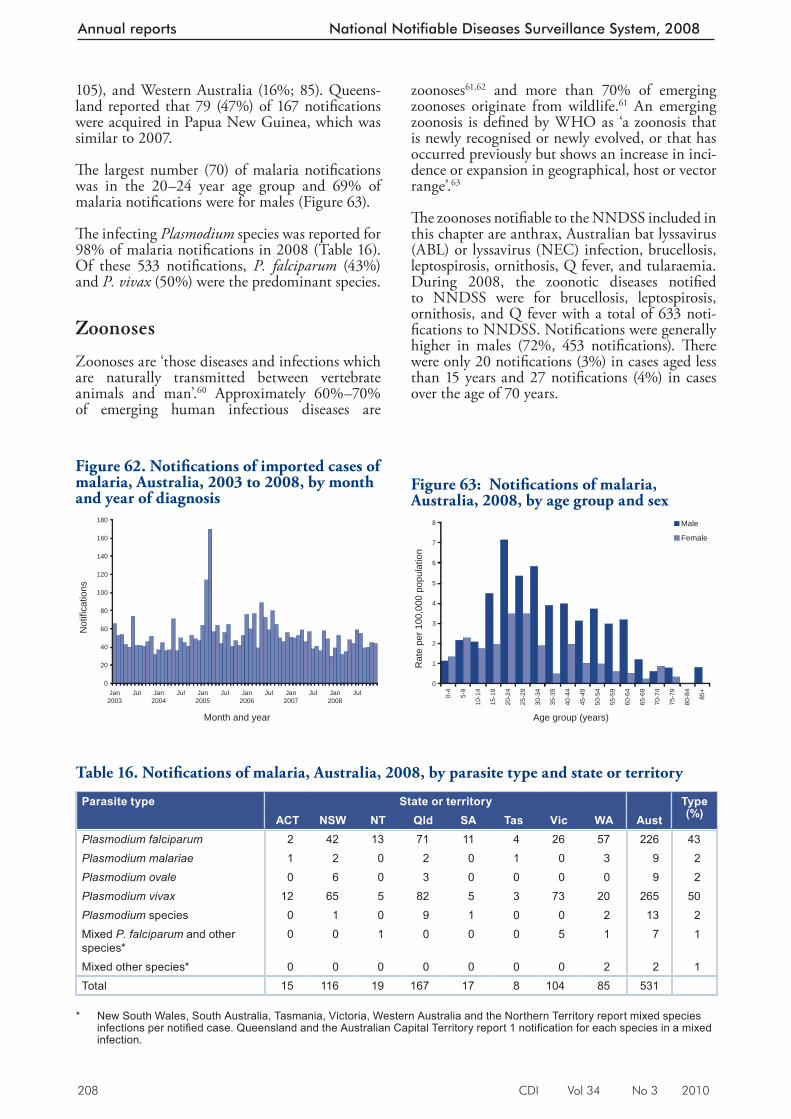
208 CDI Vol 34 No 3 2010
Annual reports National Notifiable Diseases Surveillance System, 2008
105), and Western Australia (16%; 85). Queens-land reported that 79 (47%) of 167 notifi cations were acquired in Papua New Guinea, which was similar to 2007.
Th e largest number (70) of malaria notifi cations was in the 20–24 year age group and 69% of malaria notifi cations were for males (Figure 63).
Th e infecting Plasmodium species was reported for 98% of malaria notifi cations in 2008 (Table 1 6). Of these 533 notifi cations, P. falciparum (43%) and P. vivax (50%) were the predominant species.
Zoonoses
Zoonoses are ‘those diseases and infections which are naturally transmitted between vertebrate animals and man’. 60 Approximately 60%–70% of emerging human infectious diseases are
zoonoses 61,62 and more than 70% of emerging zoonoses originate from wildlife. 61 An emerging zoonosis is defi ned by WHO as ‘a zoonosis that is newly recognised or newly evolved, or that has occurred previously but shows an increase in inci-dence or expansion in geographical, host or vector range’. 63
Th e zoonoses notifi able to the NNDSS included in this chapter are anthrax, Australian bat lyssavirus (ABL) or lyssavirus (NEC) infection, brucellosis, leptospirosis, ornithosis, Q fever, and tularaemia. During 2008, the zoonotic diseases notifi ed to NNDSS were for brucellosis, leptospirosis, ornithosis, and Q fever with a total of 633 noti-fi cations to NNDSS. Notifi cations were generally higher in males (72%, 453 notifi cations). Th ere were only 20 notifi cations (3%) in cases aged less than 15 years and 27 notifi cations (4%) in cases over the age of 70 years.
Figure 62. Notifi cations of imported cases of malaria, Australia, 2003 to 2008, by month and year of diagnosis
0
20
40
60
80
100
120
140
160
180
Jan2003
Jul Jan2004
Jul Jan2005
Jul Jan2006
Jul Jan2007
Jul Jan2008
Jul
Month and year
Not
ifica
tions
Figure 63: Notifi cations of malaria, Australia, 2008, by age group and sex
0
1
2
3
4
5
6
7
8
0-4
5-9
10-1
4
15-1
9
20-2
4
25-2
9
30-3
4
35-3
9
40-4
4
45-4
9
50-5
4
55-5
9
60-6
4
65-6
9
70-7
4
75-7
9
80-8
4
85+
Age group (years)
Rat
e pe
r 100
,000
pop
ulat
ion
Male
Female
Table 16. Notifi cations of malaria, Australia, 2008, by parasite type and state or territory
Parasite type State or territory Type (%)ACT NSW NT Qld SA Tas Vic WA Aust
Plasmodium falciparum 2 42 13 71 11 4 26 57 226 43Plasmodium malariae 1 2 0 2 0 1 0 3 9 2Plasmodium ovale 0 6 0 3 0 0 0 0 9 2Plasmodium vivax 12 65 5 82 5 3 73 20 265 50Plasmodium species 0 1 0 9 1 0 0 2 13 2Mixed P. falciparum and other species*
0 0 1 0 0 0 5 1 7 1
Mixed other species* 0 0 0 0 0 0 0 2 2 1Total 15 116 19 167 17 8 104 85 531
* New South Wales, South Australia, Tasmania, Victoria, Western Australia and the Northern Territory report mixed species
infections per notifi ed case. Queensland and the Australian Capital Territory report 1 notifi cation for each species in a mixed infection.
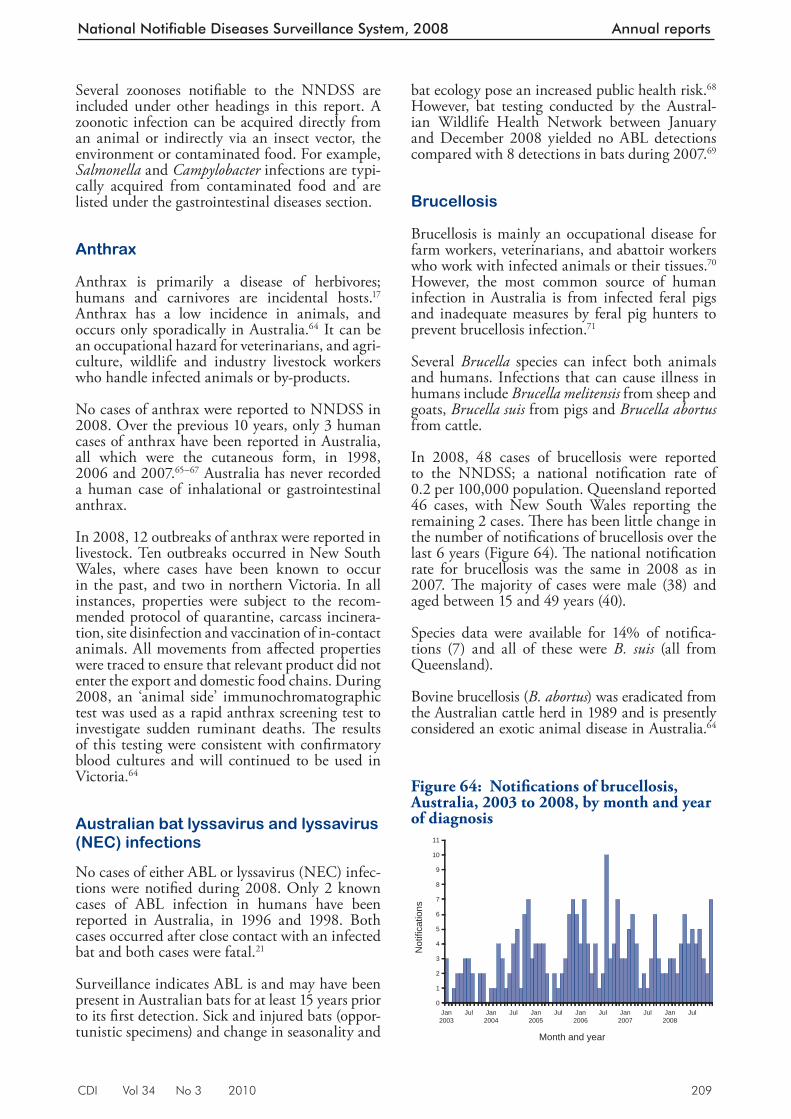
CDI Vol 34 No 3 2010 209
National Notifiable Diseases Surveillance System, 2008 Annual reports
bat ecology pose an increased public health risk. 68 However, bat testing conducted by the Austral-ian Wildlife Health Network between January and December 2008 yielded no ABL detections compared with 8 detections in bats during 2007. 69
Brucellosis
Brucellosis is mainly an occupational disease for farm workers, veterinarians, and abattoir workers who work with infected animals or their tissues. 70 However, the most common source of human infection in Australia is from infected feral pigs and inadequate measures by feral pig hunters to prevent brucellosis infection. 71
Several Brucella species can infect both animals and humans. Infections that can cause illness in humans include Brucella melitensis from sheep and goats, Brucella suis from pigs and Brucella abortus from cattle.
In 2008, 48 cases of brucellosis were reported to the NNDSS; a national notifi cation rate of 0.2 per 100,000 population. Queensland reported 46 cases, with New South Wales reporting the remaining 2 cases. Th ere has been little change in the number of notifi cations of brucellosis over the last 6 years (Figure 64). Th e national notifi cation rate for brucellosis was the same in 2008 as in 2007. Th e majority of cases were male (38) and aged between 15 and 49 years (40).
Species data were available for 14% of notifi ca-tions (7) and all of these were B. su is (all from Queensland).
Bovine brucellosis ( B. abortus ) was eradicated from the Australian cattle herd in 1989 and is presently considered an exotic animal disease in Australia. 64
Several zoonoses notifi able to the NNDSS are included under other headings in this report. A zoonotic infection can be acquired directly from an animal or indirectly via an insect vector, the environment or contaminated food. For example, Salmonella and Campylobacter infections are typi-cally acquired from contaminated food and are listed under the gastrointestinal diseases section.
Anthrax
Anthrax is primarily a disease of herbivores; humans and carnivores are incidental hosts. 17 Anthrax has a low incidence in animals, and occurs only sporadically in Australia. 64 It can be an occupational hazard for veterinarians, and agri-culture, wildlife and industry livestock workers who handle infected animals or by-products.
No cases of anthrax were reported to NNDSS in 2008. Over the previous 10 years, only 3 human cases of anthrax have been reported in Australia, all which were the cutaneous form, in 1998, 2006 and 2007. 65–67 Australia has never recorded a human case of inhalational or gastrointestinal anthrax.
In 2008, 12 outbreaks of anthrax were reported in livestock. Ten outbreaks occurred in New South Wales, where cases have been known to occur in the past, and two in northern Victoria. In all instances, properties were subject to the recom-mended protocol of quarantine, carcass incinera-tion, site disinfection and vaccination of in-contact animals. All movements from aff ected properties were traced to ensure that relevant product did not enter the export and domestic food chains. During 2008, an ‘animal side’ immunochromatographic test was used as a rapid anthrax screening test to investigate sudden ruminant deaths. Th e results of this testing were consistent with confi rmatory blood cultures and will continued to be used in Victoria. 64
Australian bat lyssavirus and lyssavirus (NEC) infections
No cases of either ABL or lyssavirus (NEC) infec-tions were notifi ed during 2008. Only 2 known cases of ABL infection in humans have been reported in Australia, in 1996 and 1998. Both cases occurred after close contact with an infected bat and both cases were fatal. 21
Surveillance indicates ABL is and may have been present in Australian bats for at least 15 years prior to its fi rst detection. Sick and injured bats (oppor-tunistic specimens) and change in seasonality and
Figure 64: Notifi cations of brucellosis, Australia, 2003 to 2008, by month and year of diagnosis
0
1
2
3
4
5
6
7
8
9
10
11
Jan2003
Jul Jan2004
Jul Jan2005
Jul Jan2006
Jul Jan2007
Jul Jan2008
Jul
Month and year
Not
ifica
tions
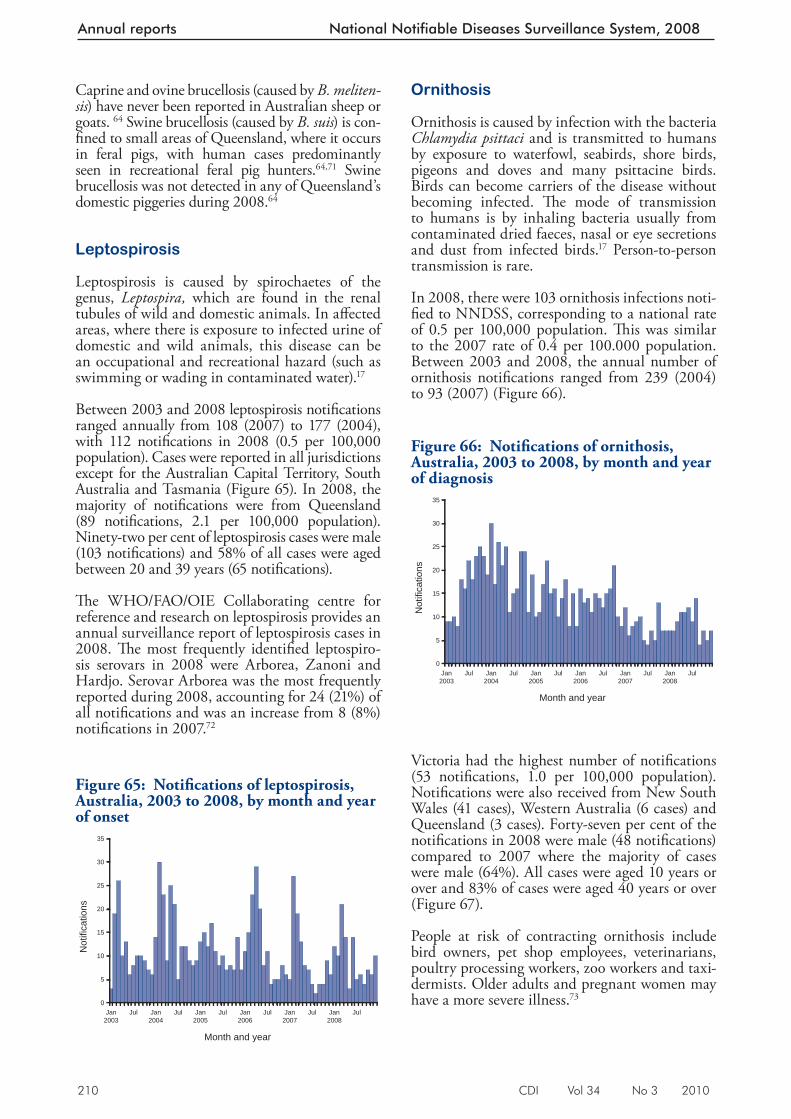
210 CDI Vol 34 No 3 2010
Annual reports National Notifiable Diseases Surveillance System, 2008
Caprine and ovine brucellosis (caused by B. meliten-sis ) have never been reported in Australian sheep or goats. 64 Swine brucellosis (caused by B. suis ) is con-fi ned to small areas of Queensland, where it occurs in feral pigs, with human cases predominantly seen in recreational feral pig hunters. 64,71 Swine brucellosis was not detected in any of Queensland’s domestic piggeries during 2008. 64
Leptospirosis
Leptospirosis is caused by spirochaetes of the genus, Leptospira, which are found in the renal tubules of wild and domestic animals. In aff ected areas, where there is exposure to infected urine of domestic and wild animals, this disease can be an occupational and recreational hazard (such as swimming or wading in contaminated water). 17
Between 2003 and 2008 leptospirosis notifi cations ranged annually from 108 (2007) to 177 (2004), with 112 notifi cations in 2008 (0.5 per 100,000 population). Cases were reported in all jurisdictions except for the Australian Capital Territory, South Australia and Tasmania (Figure 65). In 2008, the majority of notifi cations were from Queensland (89 notifi cations, 2.1 per 100,000 population). Ninety-two per cent of leptospirosis cases were male (103 notifi cations) and 58% of all cases were aged between 20 and 39 years (65 notifi cations).
Th e WHO/FAO/OIE Collaborating centre for reference and research on leptospirosis provides an annual surveillance report of leptospirosis cases in 2008. Th e most frequently identifi ed leptospiro-sis serovars in 2008 were Arborea, Zanoni and Hardjo. Serovar Arborea was the most frequently reported during 2008, accounting for 24 (21%) of all notifi cations and was an increase from 8 (8%) notifi cations in 2007. 72
Ornithosis
Ornithosis is caused by infection with the bacteria Chlamydia psittaci and is transmitted to humans by exposure to waterfowl, seabirds, shore birds, pigeons and doves and many psittacine birds. Birds can become carriers of the disease without becoming infected. Th e mode of transmission to humans is by inhaling bacteria usually from contaminated dried faeces, nasal or eye secretions and dust from infected birds. 17 Person-to-person transmission is rare.
In 2008, there were 103 ornithosis infections noti-fi ed to NNDSS, corresponding to a national rate of 0.5 per 100,000 population. Th is was similar to the 2007 rate of 0.4 per 100.000 population. Between 2003 and 2008, the annual number of ornithosis notifi cations ranged from 239 (2004) to 93 (2007) (Figure 66).
Victoria had the highest number of notifi cations (53 notifi cations, 1.0 per 100,000 p opulation). Notifi cations were also received from New South Wales (41 cases), Western Australia (6 cases) and Queensland (3 cases). Forty-seven per cent of the notifi cations in 2008 were male (48 notifi cations) compared to 2007 where the majority of cases were male (64%). All cases were aged 10 years or over and 83% of cases were aged 40 years or over (Figure 67).
People at risk of contracting ornithosis include bird owners, pet shop employees, veterinarians, poultry processing workers, zoo workers and taxi-dermists. Older adults and pregnant women may have a more severe illness. 73
Figure 65: Notifi cations of leptospirosis, Australia, 2003 to 2008, by month and year of onset
0
5
10
15
20
25
30
35
Jan2003
Jul Jan2004
Jul Jan2005
Jul Jan2006
Jul Jan2007
Jul Jan2008
Jul
Month and year
Not
ifica
tions
Figure 66: Notifi cations of ornithosis, Australia, 2003 to 2008, by month and year of diagnosis
0
5
10
15
20
25
30
35
Jan2003
Jul Jan2004
Jul Jan2005
Jul Jan2006
Jul Jan2007
Jul Jan2008
Jul
Month and year
Not
ifica
tions
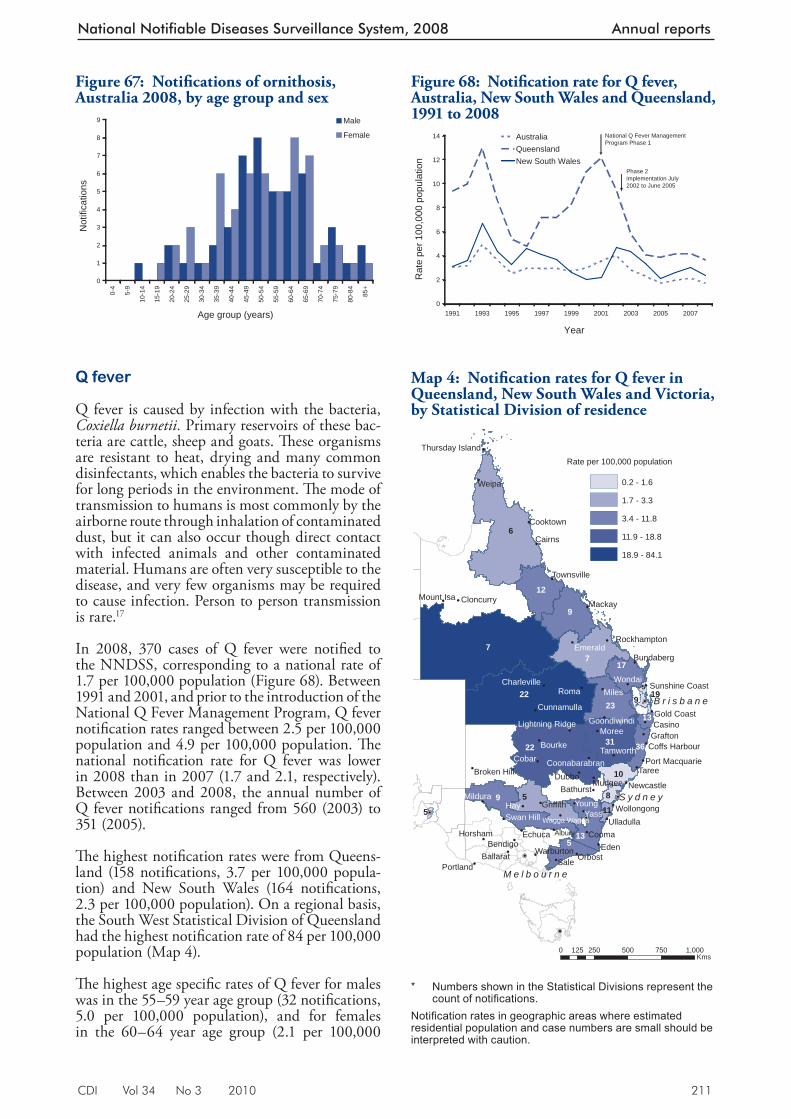
CDI Vol 34 No 3 2010 211
National Notifiable Diseases Surveillance System, 2008 Annual reports
Q fever
Q fever is caused by infection with the bacteria, Coxiella burnetii. Primary reservoirs of these bac-teria are cattle, sheep and goats. Th ese organisms are resistant to heat, drying and many common disinfectants, which enables the bacteria to survive for long periods in the environment. Th e mode of transmission to humans is most commonly by the airborne route through inhalation of contaminated dust, but it can also occur though direct contact with infected animals and other contaminated material. Humans are often very susceptible to the disease, and very few organisms may be required to cause infection. Person to person transmission is rare. 17
In 2008, 370 cases of Q fever were notifi ed to the NNDSS, corresponding to a national rate of 1.7 per 100,000 population (Figure 68). Between 1991 and 2001, and prior to the introduction of the National Q Fever Management Program, Q fever notifi cation rates ranged between 2.5 per 100,000 population and 4.9 per 100,000 population. Th e national notifi cation rate for Q fever was lower in 2008 than in 2007 (1.7 and 2.1, respectively). Between 2003 and 2008, the annual number of Q fever notifi cations ranged from 560 (2003) to 351 (2005).
Th e highest notifi cation rates were from Queens-land (158 notifi cations, 3.7 per 100 ,000 popula-tion) and New South Wales (164 notifi cations, 2.3 per 100,000 population). On a regional basis, the South West Statistical Division of Queensland had the highest notifi cation rate of 84 per 100,000 population (Map 4).
Th e highest age specifi c rates of Q fever for males was in th e 55–59 year age group (32 notifi cations, 5.0 per 100,000 population), and for females in the 60–64 year age group (2.1 per 100,000
Figure 67: Notifi cations of ornithosis, Australia 2008, by age group and sex
0
1
2
3
4
5
6
7
8
90-
4
5-9
10-1
4
15-1
9
20-2
4
25-2
9
30-3
4
35-3
9
40-4
4
45-4
9
50-5
4
55-5
9
60-6
4
65-6
9
70-7
4
75-7
9
80-8
4
85+
Age group (years)
Not
ifica
tions
Male
Female
Map 4: Notifi cation rates for Q fever in Queensland, New South Wales and Victoria, by Statistical Division of residence
!
!
!
!
!
!
!
!
!
!
!!
!
!
!
!
!
!
!!
!
!
!
!
!
!
!
!
!
!
!
!
!
!
!
!
!
!
!!
!
!
!
!
! !
!
!
!
!
!
!
!
!
!
!P
!P
!P
!P
!P
!P
Hay
Sale
Roma
Eden
Yass
Weipa
Miles
CobarTaree
Moree
Cooma
Dubbo
Young
Cairns
Mackay
AlburyEchuca
Orbost
Wondai
Bourke
Casino
Mudgee
BendigoHorsham
Mildura
Emerald
Grafton
Cooktown
PortlandBallarat
Griffith
Tamworth
Bathurst
Bundaberg
Swan Hill
Warburton
Mount Isa Cloncurry
Newcastle
Ulladulla
Gold Coast
Townsville
Wollongong
CunnamullaGoondiwindi
Rockhampton
Charleville
Broken Hill
Wagga Wagga
Coffs Harbour
Coonabarabran
Sunshine Coast
Port Macquarie
Thursday Island
Lightning Ridge
10
19
5
6
7
511
9
23
12
513
17
22 31 36
7
Rate per 100,000 population
0.2 - 1.6
1.7 - 3.3
3.4 - 11.8
11.9 - 18.8
18.9 - 84.1
22
8
9
13
9
5
M e l b o u r n e
S y d n e y
B r i s b a n e
0 250 500 750 1,000125Kms
* Numbers shown in the Statistical Divisions represent the
count of notifi cations. Notifi cation rates in geographic areas where estimated residential population and case numbers are small should be interpreted with caution.
Figure 68: Notifi cation rate for Q fever, Australia, New South Wales and Queensland, 1991 to 2008
0
2
4
6
8
10
12
14
1991 1993 1995 1997 1999 2001 2003 2005 2007
Year
Rat
e pe
r 100
,000
pop
ulat
ion
Australia QueenslandNew South Wales
National Q Fever Management Program Phase 1
Phase 2 implementation July 2002 to June 2005
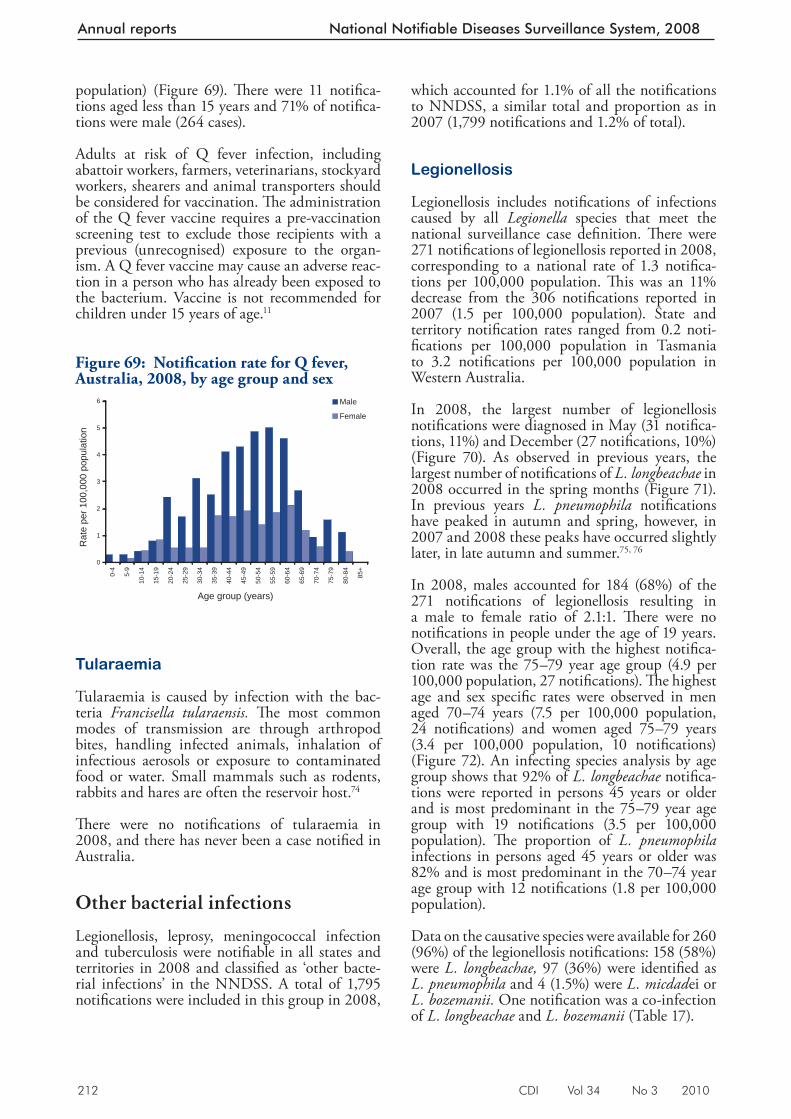
212 CDI Vol 34 No 3 2010
Annual reports National Notifiable Diseases Surveillance System, 2008
population) (Figure 69). Th ere were 11 notifi ca-tion s aged less than 15 years and 71% of notifi ca-tions were male (264 cases).
Adults at risk of Q fever infection, including abattoir workers, farmers, veterinarians, stockyard workers, shearers and animal transporters should be considered for vaccination. Th e administration of the Q fever vaccine requires a pre-vaccination screening test to exclude those recipients with a previous (unrecognised) exposure to the organ-ism. A Q fever vaccine may cause an adverse reac-tion in a person who has already been exposed to the bacterium. Vaccine is not recommended for children under 15 years of age. 11
Tularaemia
Tularaemia is caused by infection with the bac-teria Francisella tularaensis. Th e most comm on modes of transmission are through arthropod bites, handling infected animals, inhalation of infectious aerosols or exposure to contaminated food or water. Small mammals such as rodents, rabbits and hares are often the reservoir host. 74
Th ere were no notifi cations of tularaemia in 2008, and there has never been a case notifi ed in Australia.
Other bacterial infections
Legionellosis, leprosy, meningococcal infection and tuberculosis were notifi able in all states and territories in 2008 and classifi ed as ‘other bacte-rial infections’ in the NNDSS. A total of 1,795 notifi cations were included in this group in 2008,
which accounted for 1.1% of all the notifi cations to NNDSS, a similar total and proportion as in 2007 (1,799 notifi cations and 1.2% of total).
Legionellosis
Legionellosis includes notifi cations of infections caused by all Legionella species that meet the national surveillance case defi nition. Th ere were 271 notifi cations of legionellosis reported in 2008, corresponding to a national rate of 1.3 notifi ca-tions per 100,000 population. Th is was an 11% decrease from the 306 notifi cations reported in 2007 (1.5 per 100,000 population). State and territory notifi cation rates ranged from 0.2 noti-fi cations per 100,000 population in Tasmania to 3.2 notifi cations per 100,000 population in Western Australia.
In 2008, the largest number of legionellosis notifi cations were diagnosed in May (31 notifi ca-tions, 11%) and December (27 notifi cations, 10%) (Figure 70). As observed in previous years, the largest number of notifi cations of L. longbeachae in 2008 occurred in the spring months (Figure 71). In previous years L. pneumophila notifi cations have peaked in autumn and spring, however, in 2007 and 2008 these peaks have occurred slightly later, in late autumn and summer. 75, 76
In 2008, males accounted for 184 (68%) of the 271 notifi cations of legionellosi s resulting in a male to female ratio of 2.1:1. Th ere were no notifi cations in people under the age of 19 years. Overall, the age group with the highest notifi ca-tion rate was the 75–79 year age group (4.9 per 100,000 population, 27 notifi cations). Th e highest age and sex specifi c rates were observed in men aged 70–74 years (7.5 per 100,000 population, 24 notifi cations) and women aged 75–79 years (3.4 per 100,000 population, 10 notifi cations) (Figure 72). An infecting species analysis by age group shows that 92% of L. longbeachae notifi ca-tions were reported in persons 45 years or older and is most predominant in the 75–79 year age group with 19 notifi cations (3.5 per 100,000 population). Th e proportion of L. pneumophila infections in persons aged 45 years or older was 82% and is most predominant in the 70–74 year age group with 12 notifi cations (1.8 per 100,000 population).
Data on the causative species were available for 260 (96%) of the legionellosis notifi cations: 158 (58%) were L. longbeachae, 97 (36%) were identifi ed as L. pneumophila and 4 (1.5%) were L. micdad ei or L. bozemanii. One notifi cation was a co-infection of L. longbeachae and L. bozemanii (Table 17).
Figure 69: Notifi cation rate for Q fever, Australia, 2008, by age group and sex
0
1
2
3
4
5
6
0-4
5-9
10-1
4
15-1
9
20-2
4
25-2
9
30-3
4
35-3
9
40-4
4
45-4
9
50-5
4
55-5
9
60-6
4
65-6
9
70-7
4
75-7
9
80-8
4
85+
Age group (years)
Rat
e pe
r 100
,000
pop
ulat
ion
Male
Female
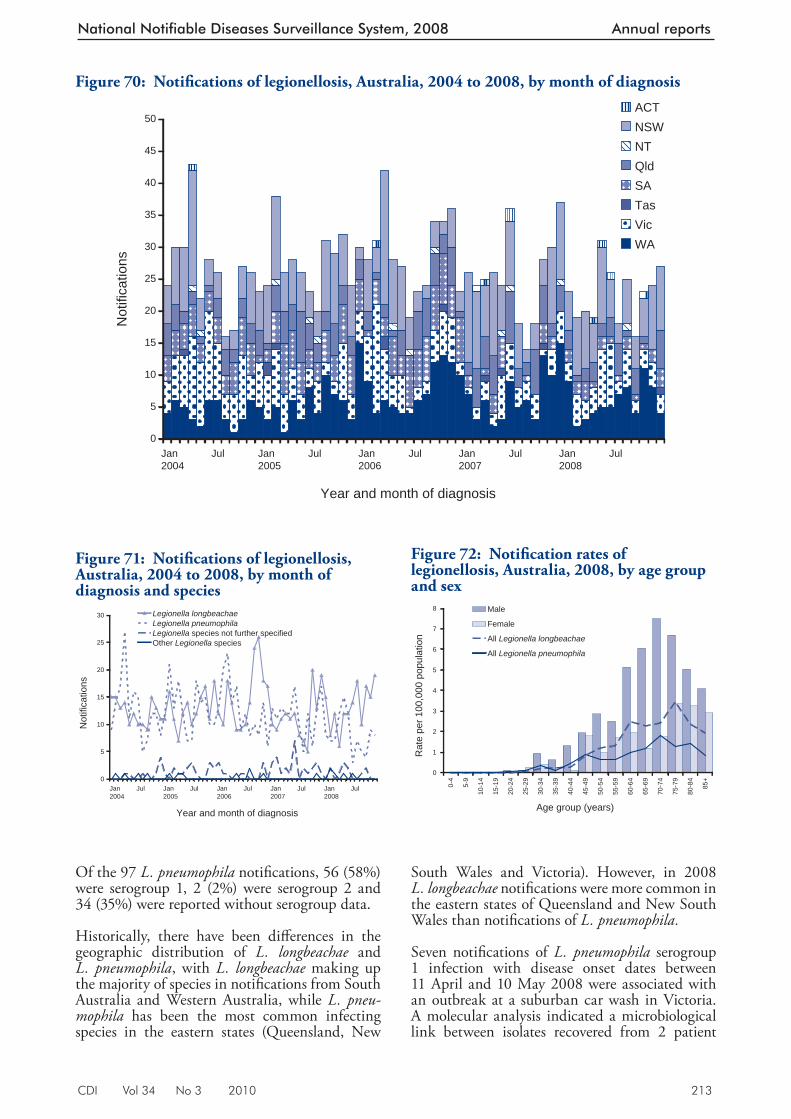
CDI Vol 34 No 3 2010 213
National Notifiable Diseases Surveillance System, 2008 Annual reports
Of the 97 L. pneumophila notifi cations, 56 (58%) were serogroup 1, 2 (2%) were serogroup 2 and 34 (35%) were reported without serogroup data.
Historically, there have been diff erences in the geographic distribution of L. longbeachae and L. pneumophila , with L. longbeachae making up the majority of species in notifi cations from South Australia and Western Australia, while L. pneu-mophila has been the most common infecting species in the eastern states (Queensland, New
South Wales and Victoria). However, in 2008 L. longbeachae notifi cations were more common in the eastern states of Queensland and New South Wales than notifi cations of L. pneumophila.
Seven notifi cations of L. pneumophila serogroup 1 infection with disease onset dates between 11 April and 10 May 2008 were associated with an outbreak at a suburban car wash in Victoria. A molecular analysis indicated a microbiological link between isolates recovered from 2 patient
Figure 70: Notifi cations of legionellosis, Australia, 2004 to 2008, by month of diagnosis
0
5
10
15
20
25
30
35
40
45
50
Jan2004
Jul Jan2005
Jul Jan2006
Jul Jan2007
Jul Jan2008
Jul
Year and month of diagnosis
Not
ifica
tions
ACTNSWNTQldSATasVicWA
Figure 71: Notifi cations of legionellosis, Australia, 2004 to 2008, by month of diagnosis and species
0
5
10
15
20
25
30
Jan 2004
Jul Jan 2005
Jul Jan2006
Jul Jan2007
Jul Jan2008
Jul
Year and month of diagnosis
Not
ifica
tions
Legionella longbeachaeLegionella pneumophilaLegionella species not further specifiedOther Legionella species
Figure 72: Notifi cation rates of legionellosis, Australia, 2008, by age group and sex
0
1
2
3
4
5
6
7
8
0-4
5-9
10-1
4
15-1
9
20-2
4
25-2
9
30-3
4
35-3
9
40-4
4
45-4
9
50-5
4
55-5
9
60-6
4
65-6
9
70-7
4
75-7
9
80-8
4
85+
Age group (years)
Rat
e pe
r 100
,000
pop
ulat
ion
Male
Female
All Legionella longbeachae
All Legionella pneumophila
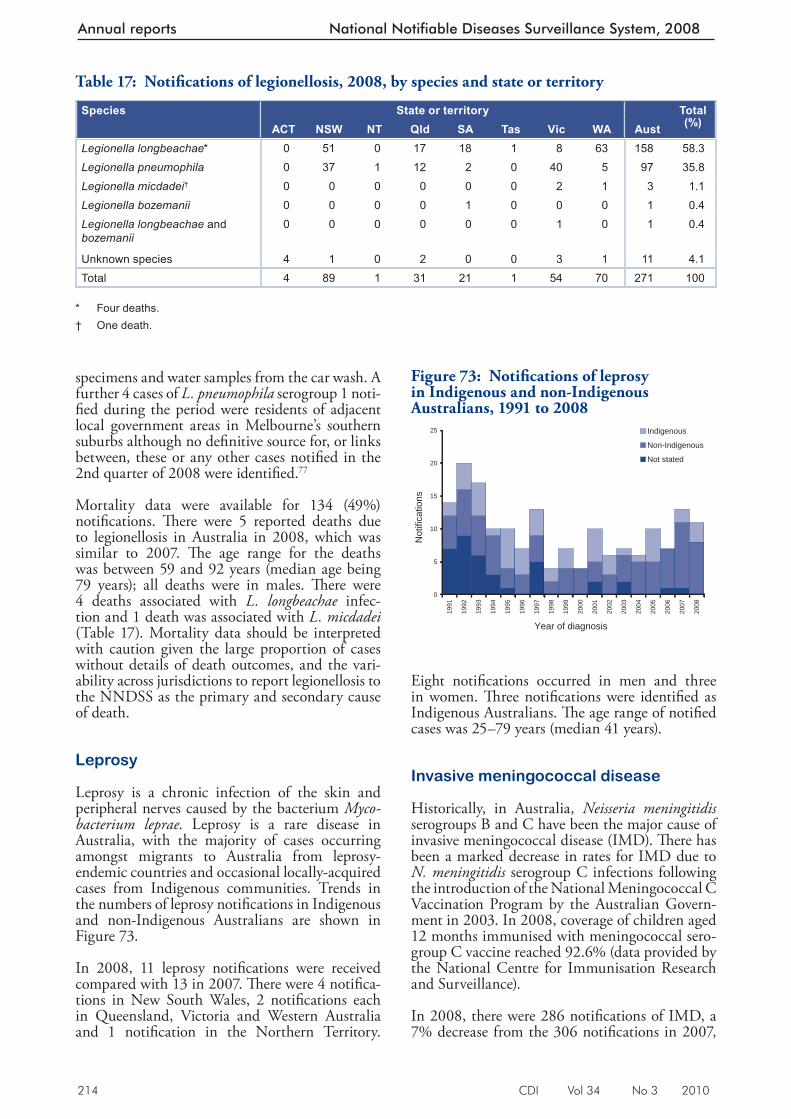
214 CDI Vol 34 No 3 2010
Annual reports National Notifiable Diseases Surveillance System, 2008
specimens and water samples from the car wash. A further 4 cases of L. pneumophila serogroup 1 noti-fi ed during the period were residents of adjacent local government areas in Melbourne’s southern suburbs although no defi nitive source for, or links between, these or any other cases notifi ed in the 2nd quarter of 2008 were identifi ed. 77
Mortality data were available for 134 (49%) notifi cations. Th ere were 5 reported deaths due to legionellosis in Australia in 2008, which was similar to 2007. Th e age range for the deaths was between 59 and 92 years (median age being 79 years); all deaths were in males. Th ere were 4 deaths associated with L. longbeachae infec-tion and 1 death was associated with L. micdadei (Table 17). Mortality data should be interpreted with caution given the large proportion of cases without details of death outcomes, and the vari-ability across jurisdictions to report legionellosis to the NNDSS as the primary and secondary cause of death.
Leprosy
Leprosy is a chronic infection of the skin and peripheral nerves caused by the bacterium Myco-bacterium leprae . Leprosy is a rare disease in Australia, with the majority of cases occurring amongst migrants to Australia from leprosy-endemic countries and occasional locally-acquired cases from Indigenous communities. Trends in the numbers of leprosy notifi cations in Indigenous and non-Indigenous Australians are shown in Figure 73.
In 2008, 11 leprosy notifi cations were received compared with 13 in 2007. Th ere were 4 notifi ca-tions in Ne w South Wales, 2 notifi cations each in Queensland, Victoria and Western Australia and 1 notifi cation in the Northern Territory.
Eight notifi cations occurred in men and three in women. Th ree notifi cations were identifi ed as Indigenous Australians. Th e age range of notifi ed cases was 25–79 years (median 41 years).
Invasive meningococcal disease
Historically, in Australia, Neisseria meningitidis serogroups B and C have been the major cause of invasive meningococcal disease (IMD). Th ere has been a marked decrease in rates for IMD due to N. meningitidis serogroup C infections following the introduction of the National Meningococcal C Vaccination Program by the Australian Govern-ment in 2003. In 2008, coverage of children aged 12 months immunised with meningococcal sero-group C vaccine reached 92.6% (data provided by the National Centre for Immunisation Research and Surveillance).
In 2008, there were 286 notifi cations of IMD, a 7% decrease from the 306 notifi cations in 2007,
Table 17: Notifi cations of legionellosis, 2008, by species and state or territory
Species State or territory Total(%)ACT NSW NT Qld SA Tas Vic WA Aust
Legionella longbeachae* 0 51 0 17 18 1 8 63 158 58.3Legionella pneumophila 0 37 1 12 2 0 40 5 97 35.8Legionella micdadei† 0 0 0 0 0 0 2 1 3 1.1Legionella bozemanii 0 0 0 0 1 0 0 0 1 0.4Legionella longbeachae and bozemanii
0 0 0 0 0 0 1 0 1 0.4
Unknown species 4 1 0 2 0 0 3 1 11 4.1Total 4 89 1 31 21 1 54 70 271 100
* Four deaths. † One death.
Figure 73: Notifi cations of leprosy in Indigenous and non-Indigenous Australians, 1991 to 2008
0
5
10
15
20
25
1991
1992
1993
1994
1995
1996
1997
1998
1999
2000
2001
2002
2003
2004
2005
2006
2007
2008
Year of diagnosis
Not
ifica
tions
Indigenous
Non-Indigenous
Not stated
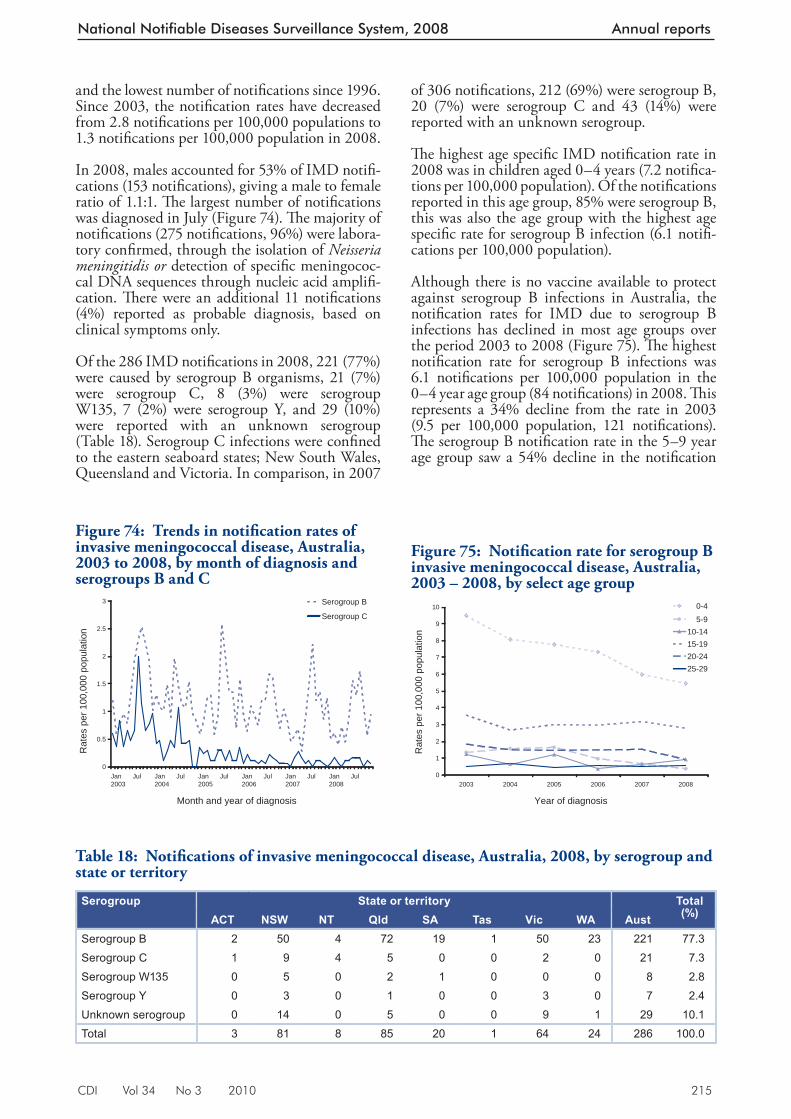
CDI Vol 34 No 3 2010 215
National Notifiable Diseases Surveillance System, 2008 Annual reports
of 306 notifi cations, 212 (69%) were serogroup B, 20 (7%) were serogroup C and 43 (14%) were reported with an unknown serogroup.
Th e highest age specifi c IMD notifi cation rate in 2008 was in children aged 0–4 years (7.2 notifi ca-tions per 100,000 population). Of the notifi cations reported in this age group, 85% were serogroup B, this was also the age group with the highest age specifi c rate for serogroup B infection (6.1 notifi -cations per 100,000 population).
Although there is no vaccine available to protect against serogroup B infections in Australia, the notifi cation rates for IMD due to serogroup B infections has declined in most age groups over the period 2003 to 2008 (Figure 75). Th e highest notifi cation rate for serogroup B infections was 6.1 notifi cations per 100,000 population in the 0–4 year age group (84 notifi cations) in 2008. Th is represents a 34% decline from the rate in 2003 (9.5 per 100,000 population, 121 notifi cations). Th e serogroup B notifi cation rate in the 5–9 year age group saw a 54% decline in the notifi cation
and the lowest number of notifi cations since 1996. Since 2003, the notifi cation rates have decreased from 2.8 notifi cations per 100,000 populations to 1.3 notifi cations per 100,000 population in 2008.
In 2008, males accounted for 53% of IMD notifi -cations (153 notifi cations), giving a male to female ratio of 1.1:1. Th e largest number of notifi cations was diagnosed in July (Figure 74). Th e majority of notifi cations (275 notifi cations, 96%) were labora-tory confi rmed, through the isolation of Neisseria meningitidis or detection of specifi c meningococ-cal DNA sequences through nucleic acid amplifi -cation. Th ere were an additional 11 notifi cations (4%) reported as probable diagnosis, based on clinical symptoms only.
Of the 286 IMD notifi cations in 2008, 221 (77%) were cau sed by serogroup B organisms, 21 (7%) were serogroup C, 8 (3%) were serogroup W135, 7 (2%) were serogroup Y, and 29 (10%) were reported with an unknown serogroup (Table 18). Serogroup C infections were confi ned to the eastern seaboard states; New South Wales, Queensland and Victoria. In comparison, in 2007
Figure 74: Trends in notifi cation rates of invasive meningococcal disease, Australia, 2003 to 2008, by month of diagnosis and serogroups B and C
0
0.5
1
1.5
2
2.5
3
Jan2003
Jul Jan2004
Jul Jan2005
Jul Jan2006
Jul Jan2007
Jul Jan2008
Jul
Month and year of diagnosis
Rat
es p
er 1
00,0
00 p
opul
atio
n
Serogroup B
Serogroup C
Table 18: Notifi cations of invasive meningococcal disease, Australia, 2008, by serogroup and state or territory
Serogroup State or territory Total(%)ACT NSW NT Qld SA Tas Vic WA Aust
Serogroup B 2 50 4 72 19 1 50 23 221 77.3Serogroup C 1 9 4 5 0 0 2 0 21 7.3Serogroup W135 0 5 0 2 1 0 0 0 8 2.8Serogroup Y 0 3 0 1 0 0 3 0 7 2.4Unknown serogroup 0 14 0 5 0 0 9 1 29 10.1Total 3 81 8 85 20 1 64 24 286 100.0
Figure 75: Notifi cation rate for serogroup B invasive meningococcal disease, Australia, 2003 – 2008, by select age group
0
1
2
3
4
5
6
7
8
9
10
2003 2004 2005 2006 2007 2008
Year of diagnosis
Rat
es p
er 1
00,0
00 p
opul
atio
n
0-4
5-910-1415-1920-2425-29
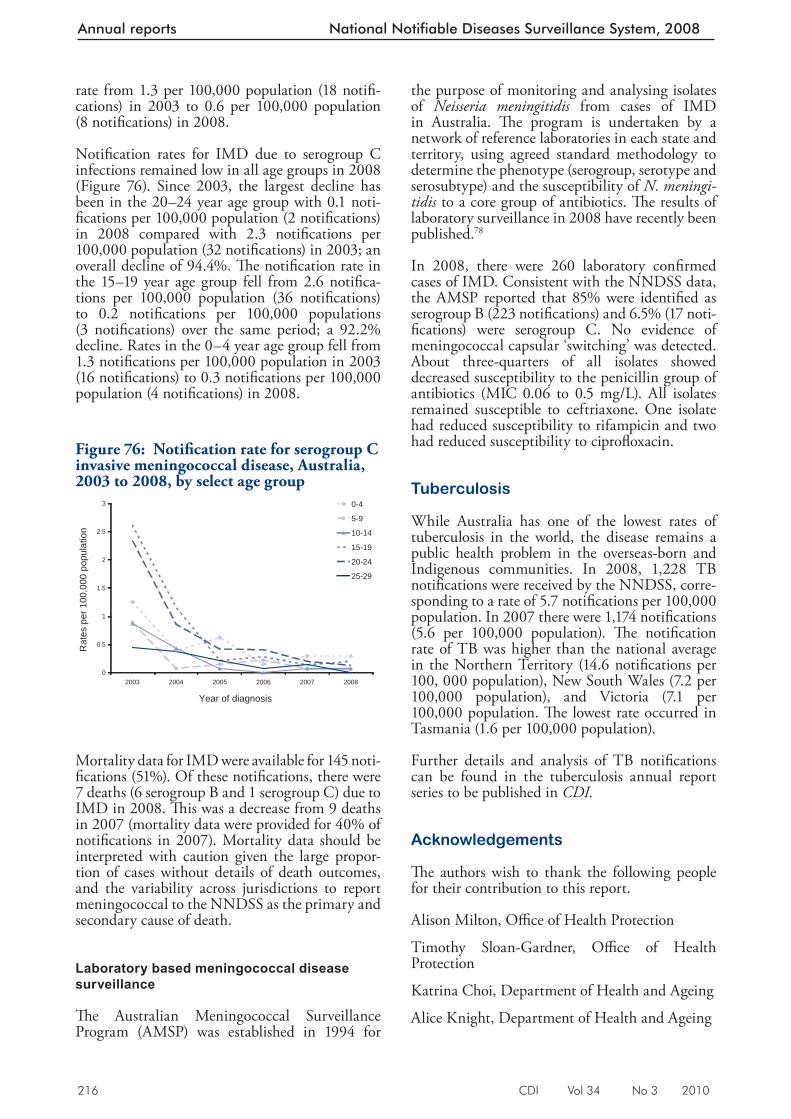
216 CDI Vol 34 No 3 2010
Annual reports National Notifiable Diseases Surveillance System, 2008
rate from 1.3 per 100,000 population (18 notifi -cations) in 2003 to 0.6 per 100,000 population (8 notifi cations) in 2008.
Notifi cation rates for IMD due to serogroup C infections remained low in all age group s in 2008 (Figure 76). Since 2003, the largest decline has been in the 20–24 year age group with 0.1 noti-fi cations per 100,000 population (2 notifi cations) in 2008 compared with 2.3 notifi cations per 100,000 population (32 notifi cations) in 2003; an overall decline of 94.4%. Th e notifi cation rate in the 15–19 year age group fell from 2.6 notifi ca-tions per 100,000 population (36 notifi cations) to 0.2 notifi cations per 100,000 populations (3 notifi cations) over the same period; a 92.2% decline. Rates in the 0–4 year age group fell from 1.3 notifi cations per 100,000 population in 2003 (16 notifi cations) to 0.3 notifi cations per 100,000 population (4 notifi cations) in 2008.
Mortality data for IMD were available for 145 noti-fi cations (51%). Of these notifi cat ions, there were 7 deaths (6 serogroup B and 1 serogroup C) due to IMD in 2008. Th is was a decrease from 9 deaths in 2007 (mortality data were provided for 40% of notifi cations in 2007). Mortality data should be interpreted with caution given the large propor-tion of cases without details of death outcomes, and the variability across jurisdictions to report meningococcal to the NNDSS as the primary and secondary cause of death.
Laboratory based meningococcal disease surveillance
Th e Australian Meningococcal Surveillance Program (AMSP) was established in 1994 for
the purpose of monitoring and analysing isolates of Neisseria meningitidis from cases of IMD in Australia. Th e program is undertaken by a network of reference laboratories in each state and territory, using agreed standard methodology to determine the phenotype (serogroup, serotype and serosubtype) and the susceptibility of N. meningi-tidis to a core group of antibiotics. Th e results of laboratory surveillance in 2008 have recently been published. 78
In 2008, there were 260 laboratory confi rmed cases of IMD. Consistent with the NNDSS data, the AMSP reported that 85% were identifi ed as serogroup B (223 notifi cations) and 6.5% (17 noti-fi cations) were serogroup C. No evidence of meningococcal capsular ‘switching’ was detected. About three-quarters of all isolates showed decreased susceptibility to the penicillin group of antibiotics (MIC 0.06 to 0.5 mg/L). All isolates remained susceptible to ceftriaxone. One isolate had reduced susceptibility to rifampicin and two had reduced susceptibility to ciprofl oxacin.
Tuberculosis
While Australia has one of the lowest rates of tuberculosis in the world, the disease remains a public health problem in the overseas-born and Indigenous communities. In 2008, 1,228 TB notifi cations were received by the NNDSS, corre-sponding to a rate of 5.7 notifi cations per 100,000 population. In 2007 there were 1,174 notifi cations (5.6 per 100,000 population). Th e notifi cation rate of TB was higher than the national average in the Northern Territory (14.6 notifi cations per 100, 000 population), New South Wales (7.2 per 100,000 population), and Victoria (7.1 per 100,000 population. Th e lowest rate occurred in Tasmania (1.6 per 100,000 population).
Further details and analysis of TB notifi cations can be found in the tuberculosis annual report series to be published in CDI.
Acknowledgements
Th e authors wish to thank the following people for their contribution to this report.
Alison Milton, Offi ce of Health Protection
Timothy Sloan-Gardner, Offi ce of Health Protection
Katrina Choi, Department of Health and Ageing
Alice Knight, Department of Health and Ageing
Figure 76: Notifi cation rate for serogroup C invasive meningococcal disease, Australia, 2003 to 2008, by select age group
0
0.5
1
1.5
2
2.5
3
2003 2004 2005 2006 2007 2008
Year of diagnosis
Rat
es p
er 1
00,0
00 p
opul
atio
n
0-4
5-9
10-14
15-19
20-24
25-29
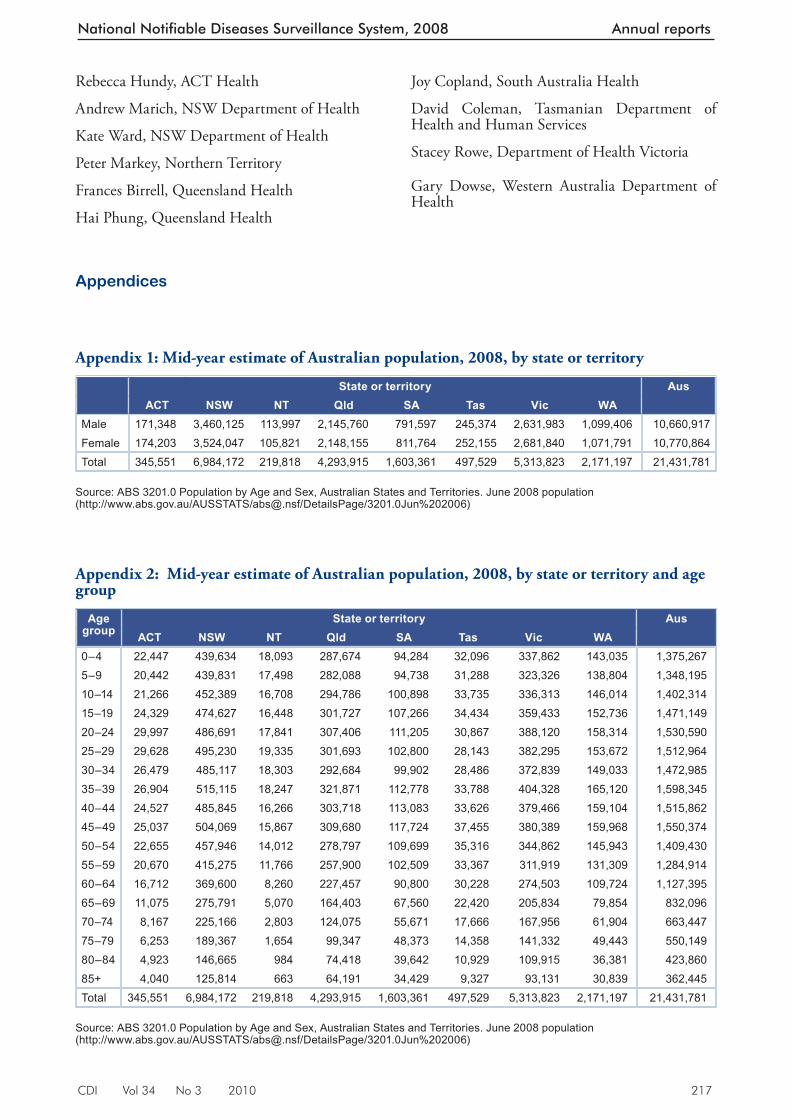
CDI Vol 34 No 3 2010 217
National Notifiable Diseases Surveillance System, 2008 Annual reports
Rebecca Hundy, ACT Health
Andrew Marich, NSW Department of Health
Kate Ward, NSW Department of Health
Peter Markey, Northern Territory
Frances Birrell, Queensland Health
Hai Phung, Queensland Health
Joy Copland, South Australia Health
David Coleman, Tasmanian Department of Health and Human Services
Stacey Rowe, Department of Health Victoria
Gary Dowse, Western Australia Department of Health
Appendix 1: Mid-year estimate of Australian population, 2008, by state or territory
State or territory AusACT NSW NT Qld SA Tas Vic WA
Male 171,348 3,460,125 113,997 2,145,760 791,597 245,374 2,631,983 1,099,406 10,660,917Female 174,203 3,524,047 105,821 2,148,155 811,764 252,155 2,681,840 1,071,791 10,770,864Total 345,551 6,984,172 219,818 4,293,915 1,603,361 497,529 5,313,823 2,171,197 21,431,781
Source: ABS 3201.0 Population by Age and Sex, Australian States and Territories. June 2008 population (http://www.abs.gov.au/AUSSTATS/[email protected]/DetailsPage/3201.0Jun%202006)
Appendices
Appendix 2: Mid-year estimate of Australian population, 2008, by state or territory and age group
Age group
State or territory AusACT NSW NT Qld SA Tas Vic WA
0–4 22,447 439,634 18,093 287,674 94,284 32,096 337,862 143,035 1,375,2675–9 20,442 439,831 17,498 282,088 94,738 31,288 323,326 138,804 1,348,19510–14 21,266 452,389 16,708 294,786 100,898 33,735 336,313 146,014 1,402,31415–19 24,329 474,627 16,448 301,727 107,266 34,434 359,433 152,736 1,471,14920–24 29,997 486,691 17,841 307,406 111,205 30,867 388,120 158,314 1,530,59025–29 29,628 495,230 19,335 301,693 102,800 28,143 382,295 153,672 1,512,96430–34 26,479 485,117 18,303 292,684 99,902 28,486 372,839 149,033 1,472,98535–39 26,904 515,115 18,247 321,871 112,778 33,788 404,328 165,120 1,598,34540–44 24,527 485,845 16,266 303,718 113,083 33,626 379,466 159,104 1,515,86245–49 25,037 504,069 15,867 309,680 117,724 37,455 380,389 159,968 1,550,37450–54 22,655 457,946 14,012 278,797 109,699 35,316 344,862 145,943 1,409,43055–59 20,670 415,275 11,766 257,900 102,509 33,367 311,919 131,309 1,284,91460–64 16,712 369,600 8,260 227,457 90,800 30,228 274,503 109,724 1,127,39565–69 11,075 275,791 5,070 164,403 67,560 22,420 205,834 79,854 832,09670–74 8,167 225,166 2,803 124,075 55,671 17,666 167,956 61,904 663,44775–79 6,253 189,367 1,654 99,347 48,373 14,358 141,332 49,443 550,14980–84 4,923 146,665 984 74,418 39,642 10,929 109,915 36,381 423,86085+ 4,040 125,814 663 64,191 34,429 9,327 93,131 30,839 362,445Total 345,551 6,984,172 219,818 4,293,915 1,603,361 497,529 5,313,823 2,171,197 21,431,781
Source: ABS 3201.0 Population by Age and Sex, Australian States and Territories. June 2008 population (http://www.abs.gov.au/AUSSTATS/[email protected]/DetailsPage/3201.0Jun%202006)
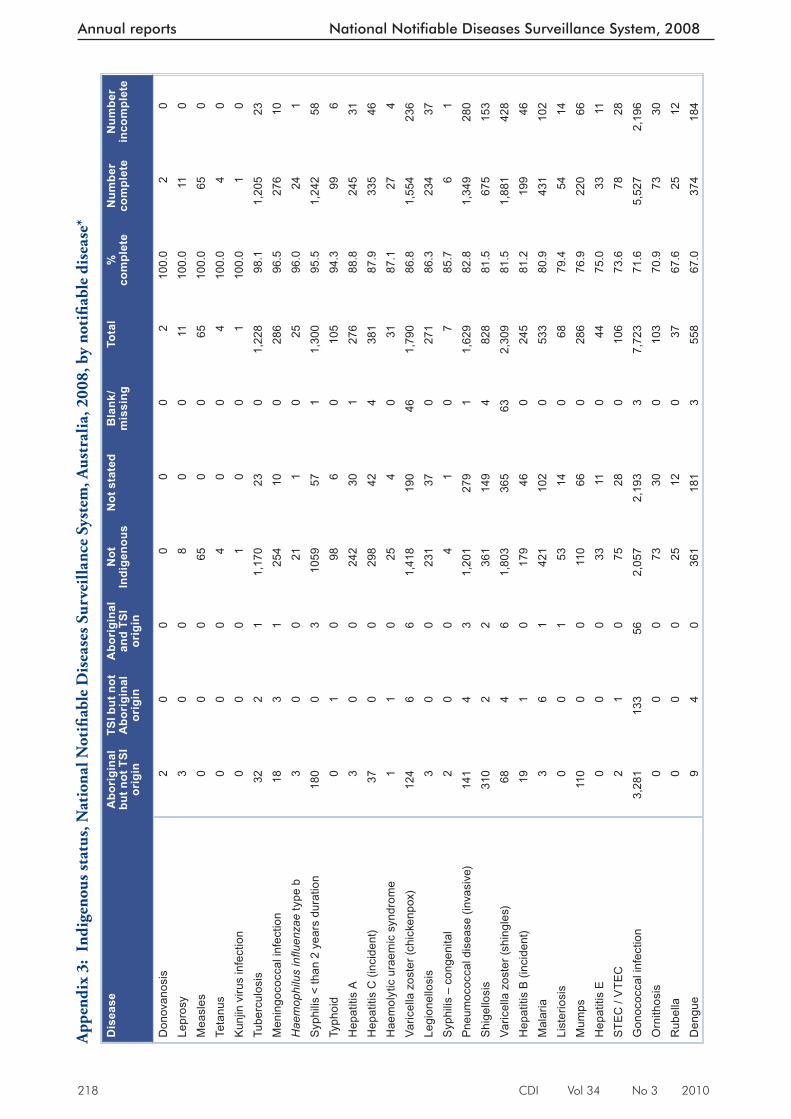
218 CDI Vol 34 No 3 2010
Annual reports National Notifiable Diseases Surveillance System, 2008
App
endi
x 3:
Ind
igen
ous s
tatu
s, N
atio
nal N
otifi
able
Dis
ease
s Sur
veill
ance
Sys
tem
, Aus
tral
ia, 2
008,
by
noti
fi abl
e di
seas
e*
Dis
ease
Abo
rigi
nal
but n
ot T
SI
orig
in
TSI b
ut n
ot
Abo
rigi
nal
orig
in
Abo
rigi
nal
and
TSI
orig
in
Not
In
dige
nous
Not
sta
ted
Bla
nk/
mis
sing
Tota
l%
co
mpl
ete
Num
ber
com
plet
eN
umbe
r in
com
plet
e
Don
ovan
osis
20
00
00
210
0.0
20
Lepr
osy
30
08
00
1110
0.0
110
Mea
sles
00
065
00
6510
0.0
650
Teta
nus
00
04
00
410
0.0
40
Kun
jin v
irus
infe
ctio
n0
00
10
01
100.
01
0Tu
berc
ulos
is32
21
1,17
023
01,
228
98.1
1,20
523
Men
ingo
cocc
al in
fect
ion
183
125
410
028
696
.527
610
Hae
mop
hilu
s infl u
enza
e ty
pe b
30
021
10
2596
.024
1S
yphi
lis <
than
2 y
ears
dur
atio
n18
00
310
5957
11,
300
95.5
1,24
258
Typh
oid
01
098
60
105
94.3
996
Hep
atiti
s A
30
024
230
127
688
.824
531
Hep
atiti
s C
(inc
iden
t)37
00
298
424
381
87.9
335
46H
aem
olyt
ic u
raem
ic s
yndr
ome
11
025
40
3187
.127
4Va
ricel
la z
oste
r (ch
icke
npox
)12
46
61,
418
190
461,
790
86.8
1,55
423
6Le
gion
ello
sis
30
023
137
027
186
.323
437
Syp
hilis
– c
onge
nita
l2
00
41
07
85.7
61
Pne
umoc
occa
l dis
ease
(inv
asiv
e)14
14
31,
201
279
11,
629
82.8
1,34
928
0S
hige
llosi
s31
02
236
114
94
828
81.5
675
153
Varic
ella
zos
ter (
shin
gles
)68
46
1,80
336
563
2,30
981
.51,
881
428
Hep
atiti
s B
(inc
iden
t)19
10
179
460
245
81.2
199
46M
alar
ia3
61
421
102
053
380
.943
110
2Li
ster
iosi
s0
01
5314
068
79.4
5414
Mum
ps11
00
011
066
028
676
.922
066
Hep
atiti
s E
00
033
110
4475
.033
11S
TEC
/ V
TEC
21
075
280
106
73.6
7828
Gon
ococ
cal i
nfec
tion
3,28
113
356
2,05
72,
193
37,
723
71.6
5,52
72,
196
Orn
ithos
is0
00
7330
010
370
.973
30R
ubel
la0
00
2512
037
67.6
2512
Den
gue
94
036
118
13
558
67.0
374
184
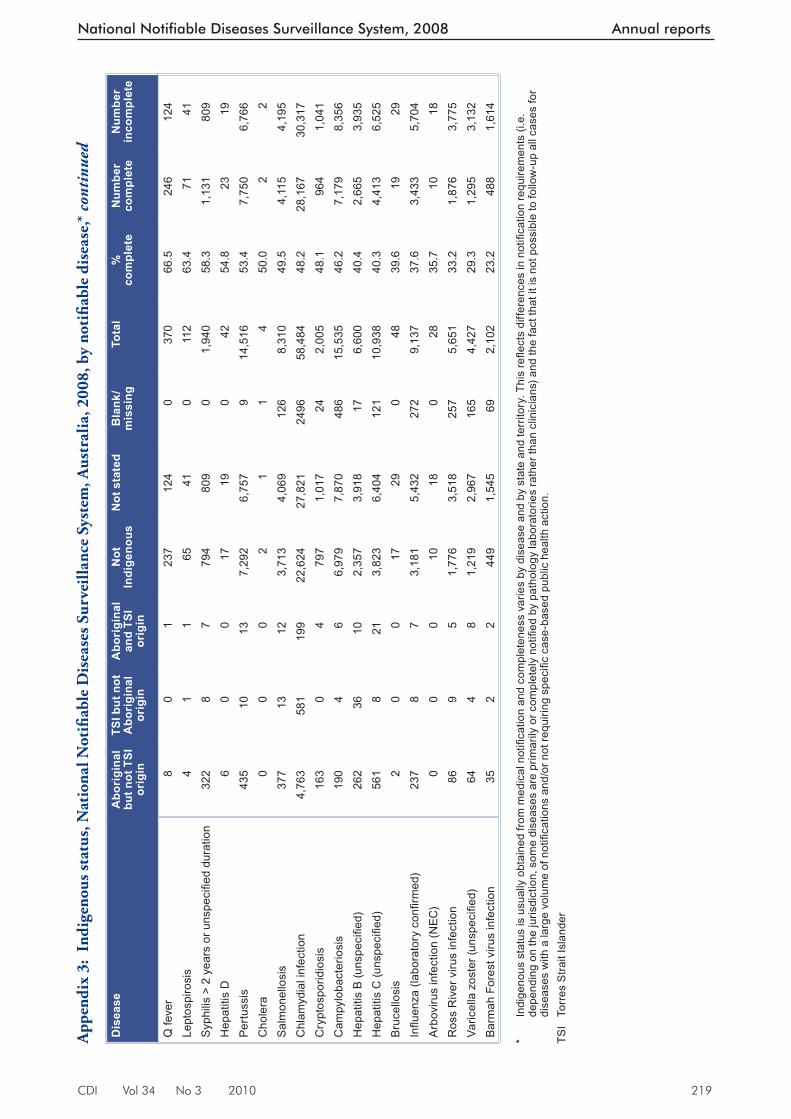
CDI Vol 34 No 3 2010 219
National Notifiable Diseases Surveillance System, 2008 Annual reports
Dis
ease
Abo
rigi
nal
but n
ot T
SI
orig
in
TSI b
ut n
ot
Abo
rigi
nal
orig
in
Abo
rigi
nal
and
TSI
orig
in
Not
In
dige
nous
Not
sta
ted
Bla
nk/
mis
sing
Tota
l%
co
mpl
ete
Num
ber
com
plet
eN
umbe
r in
com
plet
e
Q fe
ver
80
123
712
40
370
66.5
246
124
Lept
ospi
rosi
s4
11
6541
011
263
.471
41S
yphi
lis >
2 y
ears
or u
nspe
cifi e
d du
ratio
n32
28
779
480
90
1,94
058
.31,
131
809
Hep
atiti
s D
60
017
190
4254
.823
19Pe
rtuss
is43
510
137,
292
6,75
79
14,5
1653
.47,
750
6,76
6C
hole
ra0
00
21
14
50.0
22
Sal
mon
ello
sis
377
1312
3,71
34,
069
126
8,31
049
.54,
115
4,19
5C
hlam
ydia
l inf
ectio
n4,
763
581
199
22,6
2427
,821
2496
58,4
8448
.228
,167
30,3
17C
rypt
ospo
ridio
sis
163
04
797
1,01
724
2,00
548
.196
41,
041
Cam
pylo
bact
erio
sis
190
46
6,97
97,
870
486
15,5
3546
.27,
179
8,35
6H
epat
itis
B (u
nspe
cifi e
d)26
236
102,
357
3,91
817
6,60
040
.42,
665
3,93
5H
epat
itis
C (u
nspe
cifi e
d)56
18
213,
823
6,40
412
110
,938
40.3
4,41
36,
525
Bru
cello
sis
20
017
290
4839
.619
29Infl u
enza
(lab
orat
ory
confi
rmed
)23
78
73,
181
5,43
227
29,
137
37.6
3,43
35,
704
Arb
oviru
s in
fect
ion
(NEC
)0
00
1018
028
35.7
1018
Ros
s R
iver
viru
s in
fect
ion
869
51,
776
3,51
825
75,
651
33.2
1,87
63,
775
Varic
ella
zos
ter (
unsp
ecifi
ed)
644
81,
219
2,96
716
54,
427
29.3
1,29
53,
132
Bar
mah
For
est v
irus
infe
ctio
n35
22
449
1,54
569
2,10
223
.248
81,
614
* In
dige
nous
sta
tus
is u
sual
ly o
btai
ned
from
med
ical
not
ifi ca
tion
and
com
plet
enes
s va
ries
by d
isea
se a
nd b
y st
ate
and
terr
itory
. Thi
s refl e
cts
diffe
renc
es in
not
ifi ca
tion
requ
irem
ents
(i.e
. de
pend
ing
on th
e ju
risdi
ctio
n, s
ome
dise
ases
are
prim
arily
or c
ompl
etel
y no
tifi e
d by
pat
holo
gy la
bora
torie
s ra
ther
than
clin
icia
ns) a
nd th
e fa
ct th
at it
is n
ot p
ossi
ble
to fo
llow
-up
all c
ases
for
dise
ases
with
a la
rge
volu
me
of n
otifi
catio
ns a
nd/o
r not
requ
iring
spe
cifi c
cas
e-ba
sed
publ
ic h
ealth
act
ion.
TSI
Torr
es S
trait
Isla
nder
App
endi
x 3:
Ind
igen
ous s
tatu
s, N
atio
nal N
otifi
able
Dis
ease
s Sur
veill
ance
Sys
tem
, Aus
tral
ia, 2
008,
by
noti
fi abl
e di
seas
e,*
cont
inue
d
220 CDI Vol 34 No 3 2010
Annual reports National Notifiable Diseases Surveillance System, 2008
Abbreviations
7vPCV 7 valent pneumococcal conjugate vaccine 23vPPV 23 valent pneumococcal polysaccharide vaccine ABL Australian bat lyssavirus ABS Australian Bureau of Statistics AFP acute fl accid paralysis AGSP Australian Gonococcal Surveillance Programme AIDS acquired immunodefi ciency syndrome AMSP Australian Meningococcal Surveillance Programme ANCJDR Australian National Creutzfeldt-Jakob Disease Registry BFV Barmah Forest virus CDI Communicable Diseases Intelligence CDNA Communicable Diseases Network Australia CJD Creutzfeldt-Jakob disease DENV dengue virus Hib Haemophilus infl uenzae type b HIV human immunodefi ciency virus HPAIH highly pathogenic avian infl uenza in humans HUS haemolytic uraemic syndrome IMD invasive meningococcal disease IPD invasive pneumococcal disease JEV Japanese encephalitis virus KUNV Kunjin virus MMR measles-mumps-rubella MVEV Murray Valley encephalitis virus NAMAC National Arbovirus and Malaria Advisory Committee NCHECR National Centre in HIV Epidemiology and Clinical Research NEC not elsewhere classifi ed NIP National Immunisation Program NN not notifi able NNDSS National Notifi able Diseases System NPRL National Polio Reference Laboratory NSC National Surveillance Committee PCR polymerase chain reaction RRV Ross River virus SARS severe acute respiratory syndrome SD Statistical Division SSD Statistical Subdivision STEC Shiga toxin-producing Escherichia coli STI(s) sexually transmissible infections(s) TB tuberculosis VPD(s) vaccine preventable disease(s) VTEC verotoxigenic Escherichia coli WHO World Health Organization WPR Western Pacifi c Region WPV wild-type polio virus
CDI Vol 34 No 3 2010 221
National Notifiable Diseases Surveillance System, 2008 Annual reports
Author details
Coordinating author: Leah Newman Data management and mapping: Stefan Stirzaker, Dougald Knuckey Bloodborne diseases: Kate Robinson Gastrointestinal diseases: Jennie Hood, Katrina Knope Quarantinable diseases: Gerard Fitzsimmons, Katrina Knope, Jennie Hood Sexually transmissible infections: Kate Robinson Vaccine preventable diseases: Susan Barker, Nicolee Martin, Samantha Siripol, Indra Gajanayake, Marlena Kaczmarek, Ian Barr, Aurysia Hii, Ruth Foxwell, Rhonda Owen, Conan Liu Vectorborne diseases: Jennie Hood, Phil Wright, Gerard Fitzsimmons Zoonoses: Jennie Hood, Gerard Fitzsimmons, Lance Sanders Other bacterial infections: Christina Barry, Susan Barker, Jolene Ormond, Conan Liu
With contributions from:
National organisations
Communicable Diseases Network Australia and subcommittees Australian Childhood Immunisation Register Australian Gonococcal Surveillance Programme Australian Meningococcal Surveillance Programme Australian Sentinel Practice Research Network Australian Quarantine Inspection Service National Centre in HIV Epidemiology and Clinical Research National Centre for Immunisation Research and Surveillance of Vaccine Preventable Diseases National Enteric Pathogens Surveillance Scheme OzFoodNet Working Group World Health Organization Collaborating Centre for Reference and Research on Influenza
State and territory health departments
Communicable Diseases Control, ACT Health, Australian Capital Territory Communicable Diseases Surveillance and Control Unit, NSW Department of Health, New South Wales Centre for Disease Control, Northern Territory Department of Health and Community Services, Northern Territory Communicable Diseases Branch, Queensland Health, Queensland Communicable Disease Control, South Australian Department of Health, South Australia Communicable Diseases Prevention Unit, Department of Health and Human Services, Tasmania Communicable Diseases Section, Department of Human Services, Victoria Communicable Diseases Control Directorate, Department of Health, Western Australia
Corresponding author: Ms Leah Newman, Systems and Coordination Section, Office of Health Protection, Australian Government Department of Health and Ageing, GPO Box 4898, MDP 14, CANBERRA, ACT 2601. Telephone: +61 2 6289 2761. Facsimile: +61 2 6289 2600. Email: [email protected]
References
1. National Health Security Act, No 174. 2007. Available from: ht tp://www.comlaw.gov.au/ComLaw/Legislation/Act1.nsf/0/A005BA0145A00248CA25736A00126AA5?OpenDocument Accessed November 2009.
2. National Notifiable Diseases List. 2008. Available from: ht tp://www.comlaw.gov.au/ComLaw/legislation/LegislativeInstrument1.nsf/0/7162D634C6DD1BAACA25740B0079D6B8?OpenDocument Accessed November 2009.
3. National Health Security Agreement. 2008. Available from: http://www.health.gov.au/internet/main/publishing.nsf/Content/ohp-nhs-agreement.htm Accessed November 2009.
4. National Centre in HIV Epidemiology and Clinical Research. HIV/AIDS, Viral Hepatitis and Sexually Transmissible Infections in Australia Annual Surveillance Report, 2009: National Centre in HIV Epidemiology and Clinical Research, The University of New South Wales, Sydney; 2009.
5. Klug GM, Boyd A, Lewis V, McGlade AR, Roberts H, Douglass SL, et al. Surveillance of Creutzfeldt-Jakob Disease in Australia: 2008. Commun Dis Intel l 2008;32(2):232–236.
6. Communicable Diseases Network Australia. National Notifiable Diseases Surveillance System. Available from: www.health.gov.au/nndssdata
7. Australian Bureau of Statistics. Population by age and sex, Australian States and Territories, Estimated Resident Population By Single Year of Age, Australia. Canberra: Australian Bureau of Statistics; 2008. Catalogue no: 3201.0.
8. Australian Bureau of Statis tics. Australian Standard Geographical Classification (ASGC) Concordance, June 2008 Canberra: Australian Bureau of Statistics.
9. Medicare Australia. Australian Childhood Immunisation Register – Quarterly Coverage Repor t 30 June 2009. Canberra: Medicare Australia; 2009.
10. Australian Institute of Health and Welfare. National Health Data Dictionary 13.3; 2008.
222 CDI Vol 34 No 3 2010
Annual reports National Notifiable Diseases Surveillance System, 2008
11. National Health and Medical Research Council. The Australian Immunisation Handbook 9th edn. Canberra, Australia: Australian Government Department of Health and Ageing; 2008.
12. Medicare Australia. Australian Childhood Immunisation Register – Quarterly Coverage Report 30 September 2009. Canberra: Medicare Australia; 2009.
13. Medicare Australia. Australian Childhood Immunisation Register – Quarterly Coverage Repor t 31 December 2009. In. Canberra: Medicare Australia; 2009.
14. Medicare Australia. Australian Childhood Immunisation Register – Quarterly Coverage Report 31 March 2010. Canberra: Medicare Australia; 2010.
15. Razali K, Thein HH, Bell J, Cooper-Stanbury M, Dolan K, Dore G, et al. Modelling the hepatitis C virus epidemic in Australia. Drug and Alcohol Dependence 2007;91(2–3):228–235.
16. Butler T, Papanastasiou C. National Prison Entrants’ Bloodborne Virus and Risk Behaviour Survey Report 2004 and 2007; 2008.
17. Heymann DL. Control of Communicable Diseases Manual . 19 edn. Washington: American Public Health Association, USA; 2008.
18. OzFoodNet Working Group. Monitoring the incidence and causes of diseases potentially transmitted by food in Australia: Annual report of the OzFoodNet Network, 2008. Commun Dis Intell 2009;33(4):389–413.
19. Hanna JH, SL. Humpreys, JL. Impact of hepatitis A vaccination on Indigenous children on notifications of hepatitis A in north Queensland. Med J Aust 2004;181(9):482–485.
20. Combs B, Raupach J, Kirk M. Surveillance of Shiga toxigenic Escherichia coli in Australia. Commun Dis Intell 2005;29(4):366–369.
21. Begg K, Roche P, Owen R, Liu C, Kaczmarek M, Hii A, et al. Australia’s notifiable diseases status, 2006: Annual report of the National Notifiable Diseases Surveillance System. Commun Dis Intell 2008;32(2):139–207.
22. Cumpston JHL. Health and disease in Australia. Canberra: Australian Government Publishing Service; 1989.
23. Grat tan-Smith PJ, O’Regan WJ, Ell is PS, O’Flaherty SJ, McIntyre PB, Barnes CJ. Rabies. A second Australian case with a long incubation period. Med J Aust 1992;156(9):651–654.
24. Wor ld Health Organizat ion. The Global Eradication of Smallpox: Final Report of the Global Commission for the Certification of Smallpox Eradications, Geneva, December 1979. Geneva: World Health Organization; 1980.
25. Miller M, Roche P, Yohannes K, Spencer J, Bartlett M, Brotherton J, et al. Australia’s notifiable diseases status, 2003: Annual repor t of the National Notifiable Diseases Surveillance System . Commun Dis Intell 2005;29(1):1–61.
26. World Health Organization. Cumulative number of confirmed human cases of avian influenza A/(H5N1) reported to the World Health Organization. Geneva: World Health Organization; 2009. Accessed on 9 February 2009. Available from: http://www.who.int/csr/disease/avian_influenza/country/cases_table_2009_02_05/en/index.html
27. Australian Government Department of Health and Ageing. Factsheets: Viral haemorrhagic fever. 2009. Accessed on 9 February 2009. Available from: http://www.health.gov.au/internet/main/publishing.nsf/Content/health-pubhlth-strateg-communic-factsheets-vhf.htm
28. NNDSS Annual Report Writing Group. Australia’s notifiable disease status, 2007: Annual report of the National Notifiable Diseases Surveillance System. Commun Dis Intell 2009;33(2):89–154.
29. Chen MY, Fairley CK, Donovan B. Nowhere near the point of diminishing returns: correlations between chlamydia testing and notification rates in New South Wales. Aust N Z J Public Health 2005;29(3):249–253.
30. Hocking J, Fairley C, Counahan M, Crofts N. The pattern of notification and testing for genital Chlamydia trachomatis infection in Victoria, 1998–2000: an ecological analysis. Aust N Z J Public Health 2003;27(4):405–408.
31. Australian Institute of Health and Welfare. Age-standardised rate – Identifying and definitional attributes. 2005. Accessed on 17 March 2010. Available from: http://meteor.aihw.gov.au/content/index.phtml/itemId/327276
32. Bowden F, Fairly C. Endemic STDs in Northern Territory: estimations of effective rates of partner change. In: Northern Territory RACP meeting; November 1996: Unpublished; 1996.
CDI Vol 34 No 3 2010 223
National Notifiable Diseases Surveillance System, 2008 Annual reports
33. Queensland Health. Queensland HIV, Hepatitis C and Sexually Transmissible Infections Strategy: 2005–2011: Queensland Health; 2005.
34. Chen M, Donovan B. Genital Chlamydia trachomatis infection in Australia: epidemiology and clinical implications. Sex Health 2004;1(4):189–196.
35. Stephens N, O’Sullivan M, Coleman D, Shaw K. Chlamydia trachomatis in Tasmania 2001–2007: rising notification trends. Aust N Z J Public Health 2010;34(2):120–125.
36. Bowden FJ. Donovanosis in Australia: going, going. Sex Transm Infect 2005;81(5):365–366.
37. Australian Gonococcal Surveillance Programme. Annual report of the Australian Gonococcal Surveillance Programme, 2008. Commun Dis Intell 2009;33(3):268–274.
38. Tapsall JW, Limnios EA, Murphy D. Analysis of trends in antimicrobial resistance in Neisseria gonorrhoeae isolated in Australia, 1997–2006. J Antimicrob Chemother 2008;61(1):150–155.
39. Jin F, Prestage GP, Zablotska I, Rawstorne P, Kippax SC, Donovan B, et al. High rates of sexually transmitted infections in HIV positive homosexual men: data from two community based cohorts. Sex Transm Infect 2007;83(5):397–399.
40. Fairley CK, Hocking JS, Medland N. Syphilis: back on the rise, but not unstoppable. Med J Aust 2005;183(4):172–173.
41. Brotherton J, Wang H, Schaffer A, Quinn H, Menzies R, Hull B, et al. Vaccine preventable diseases and vaccination coverage in Australia, 2003 to 2005. Commun Dis Intell 2007;31 (Suppl):S1–S152.
42. Wang H, Deeks S, Glasswell A, McIntyre P. Trends in invasive Haemophilus influenzae type B disease in Australia, 1995–2005. Commun Dis Intell 2008;32(3):316–325.
43. Lambert SB, Faux CE, Grant KA, Williams SH, Bletchly C, Catton MG, et al. Influenza surveillance in Australia: we need to do more than count. Med J Aust 2010;193(1):43–45.
44. Bangor-Jones RD DG, Giele CM, van Buynder PG, Hodge MM, Whitty MM. A prolonged mumps outbreak among highly vaccinated Aboriginal people in the Kimberley region of Western Australia. Med J Aust 2009;191(7):4.
45. Stein-Zamir C, Shoob H, Abramson N, Tallen-Gozani E, Sokolov I, Zentner G. Mumps outbreak in Jerusalem affecting mainly male adolescents. Euro Surveill 2009;14(50).
46. High P, Handschur E, Eze O, Montana B, Rober tson C, Tan C, et al. Update: mumps outbreak – New York and New Jersey, June 2009 – January 2010. MMWR Morb Mortal Wkly Rep 2010;59(5):4.
47. Wendelboe AM, van Rie A, Salmaso S, Englund JA. Duration of immunity against per tussis after natural infection or vaccination. Pediatr Infect Dis J 2005;24(5 Suppl):S58–S61.
48. Juretzko P, von Kries R, Hermann M, Wirsing von Konig CH, Weil J, Giani G. Effectiveness of acellular pertussis vaccine assessed by hospital-based active surveillance in Germany. Clin Infect Dis 2002;35:162–167.
49. Roberts J, Grant K, Ibrahim A, Thorley B. Annual repor t of the Australian National Poliovirus Reference Laborator y. Commun Dis Intell 2007;32(3):308–315.
50. Department of Health and Ageing. Communicable diseases surveillance – Highlights for 4th quarter, 2006. Commun Dis Intell 2007;31(1):135–138.
51. Kelly H, Worth L, Karapanagiotidis T, Riddell M. Interruption of rubella virus transmission in Australia may require vaccination of adult males: evidence from a Victorian sero-survey. Commun Dis Intell 2004;28(1):69–73.
52. Francis BH, Thomas AK, McCarty CA. The impact of rubella immunisation on the serological status of women of child-bearing age: a retrospective longitudinal study in Melbourne, Australia. Am J Public Health 2003;93(8):1274–1276.
53. Santhanandan D, Gupta L, Liu BH, Rutherford A, Lane J. Factors associated with low immunity to rubella infection on antenatal screening. Aust N Z J Obstet Gynaecol 2005;45(5):435–438.
54. Hunt JM, Lumley J. Top end rural and remote Indigenous women: an Australian population group vulnerable to rubella. Commun Dis Intell 2004;28(4):499–503.
55. Fitzsimmons G, Wright P, Johansen C, Whelan P. National Arbovirus and Malar ia Advisor y Committee annual report. Commun Dis Intell 2009; 33(2):155–170.
224 CDI Vol 34 No 3 2010
Annual reports National Notifiable Diseases Surveillance System, 2008
56. Russell RC, Dwyer DE. Arboviruses associated with human disease in Australia. Microbes Infect 2000;2(14):1693–1704.
57. Broom AK, Azuolas J, Hueston L, Mackenzie JS, Melville L, Smith DW, et al. Australian encephalitis: Sentinel Chicken Surveillance Programme. Commun Dis Intell 2001;25(3):157–160.
58. Western Australia Department of Health. Media release. Upgraded warning on mosquito-borne disease in the Kimberly and Pilbara. 29 April 2008.
59. McBride WJH. Deaths associated with dengue haemorrhagic fever: the first in Australia in over a century. Med J Aust 2005;183(1):35–37.
60. World Health Organization. Zoonoses. Technical report series no. 169. Geneva: World Health Organization; 1959.
61. Jones KE, Patel NG, Levy MA. Global trends in emerging infec t ious diseases. Nature 2008(451):990–994.
62. Woolhouse MEJ, Gowtage-Sequeria S. Host range and emerging and reemerging pathogens. Emerg Infec Dis 2005;11(12):1842–1847.
63. World Health Organization. Report of the WHO/FAO/OIE joint consultation on emerging zoonotic diseases. Geneva: World Health Organization; 2004.
64. Animal Health Australia. Animal Health in Australia 2008. Canberra; 2009.
65. McCall B, Looke D, Crome M, Nimmo G, O’Kane G, Harper J, et al. Sporadic human anthrax in urban Brisbane. Commun Dis Intell 1998;22(9):189–190.
66. Ko lbe A , Yuen M, Doy le B. A case o f human cu taneous anthrax . Med J Aus t 2006;185(5):281–282.
67. Fielding J. Zoonoses: Anthrax. Victorian Infectious Diseases Bulletin 2007;10(2):47.
68. Field H. The ecology of Hendra virus and Australian bat lyssavirus. 2004. Accessed on 1 August 2009. Available from: http://espace.library.uq.edu.au/eserv.php?pid=UQ:13859&dsID=field_thesis_05.pdf
69. Australian Bat Lyssavirus Focus Group. Australian Bat Lyssavirus Report, December 2008: Australian Wildlife Health Network; 2008.
70. Hellard ME, Sinclair MI, Harris AH, Kirk M, Fairley CK. Cost of community gastroenteritis. J Gastroenterol Hepatol 2003;18:322–328.
71. Queensland Health:, Sweeny AL, Beard FH. Queensland Health Notifiable Diseases Report 2002–2006. Brisbane: Communicable Diseases Branch, Brisbane: Queensland Health.; 2009
72. Queensland Health Forensic and Scientific Services. National leptospirosis surveillance report number 17, January – December 2008. Accessed on 12 February 2009. Available from: http://www.health.qld.gov.au/qhcss/documents/lepto/08_annual.pdf
73. Victorian Depar tment of Human Services. Blue Book. Revised Edition 2005. Accessed on 15 August 2009. Available from: http://www.health.vic.gov.au/ideas/bluebook
74. Whipp MJ, Davis JM, Lum GD, de Boer J, Zhou Y, Bearden SW, et al. Characterization of a novicida – like Francisella tularensis isolated in Australia. J Med Microbiol 2003;52:839–842.
75. Li J, O’Brien ED, Guest C. A review of national legionellosis surveillance in Australia, 1991 to 2000. Commun Dis Intell 2002;26:462–470.
76. O’Connor BA, Carman J, Eckert K, Tucker G, Givney R, Cameron S. Does potting mix make you sick? Results from a Legionella longbeachae case control study in South Australia. Epidemiol Infect 2007;135:34–39.
77. Stylianopoulos, Easton T, Veitch M. Reports of bloodstream infections and meningitis to the Victorian Hospital Pathogen Surveillance Scheme, January–June 2008. Victorian Infectious Diseases Bulletin 2008;11(23).
78. Aus t ra l ian Meningococcal Sur ve i l lance Programme. Annual report of the Australian Meningococcal Surveillance Programme, 2008. Commun Dis Intell 2009;33(3):259–267.
CDI Vol 34 No 3 2010 225
National Arbovirus and Malaria Advisory Committee, 2008–09 Annual reports
ARBOVIRAL DISEASES AND MALARIA IN AUSTRALIA, 2008–09: ANNUAL REPORT OF THE NATIONAL ARBOVIRUS AND MALARIA ADVISORY COMMITTEE
Gerard J Fitzsimmons, Phil Wright, Cheryl A Johansen, Peter I Whelan and the National Arbovirus and Malaria Advisory Committee
Introduction
Th is report describes the surveillance of mosquito-borne diseases of public health importance in Australia from 1 July 2008 to 30 June 2009. It includes those diseases caused by the alphaviruses (Barmah Forest, chikungunya and Ross River), fl aviviruses (dengue, Murray Valley encephalitis, Kunjin, Japanese encephalitis and yellow fever) and malaria.
Th e Australian Government Department of Health and Ageing established the National Arbovirus Advisory Committee (NAAC) in 2001 as a tech-nical advisory group. In March 2003, the NAAC became the National Arbovirus and Malaria Advisory Committee (NAMAC) when malaria was included in its terms of reference. NAMAC monitors arbovirus and malaria surveillance, strategic arbovirus and malaria disease manage-ment, and vector control, and has a key role in making recommendations on the management of mosquito-borne diseases. NAMAC provides expert technical advice on arboviruses and malaria to the Australian Health Protection Committee through the Communicable Diseases Network Australia. It also assists in the detection, management and control of actual or potential outbreaks of arboviral and malarial disease. Members of the Committee have expertise in disease surveillance, virology, vector surveillance, vector control and quarantine, and represent agencies with a substantial interest in this area.
Methods
Human cases of arbovirus infection and malaria are monitored using the National Notifi able Diseases Surveillance System (NNDSS). All Aus-tralian states and territories require doctors and/or pathology laboratories to notify cases of infec-tious diseases that are important to public health including several arboviruses and malaria. Th e National Health Security Act 2007 provides the legislative basis for communicable disease notifi -cations in Australia and authorises the exchange
Abstract
The National Notifiable Diseases Surveillance System received 8,677 notifications of diseases transmitted by mosquitoes in Australia from 1 July 2008 to 30 June 2009. The alphaviruses, Barmah Forest and Ross River, accounted for 6,574 (78%) of these notifications during 2008–09. There were 1,009 notifications of dengue virus infection locally-acquired in North Queensland and 484 notified cases resulted from overseas travel. Notification rates of dengue virus infection for 2008–09, regardless of where infection was acquired, exceeded the five-year mean rate and may be attributed to increased disease activity in the Asia–Pacific region. North Queensland was the site of several outbreaks of locally-acquired dengue virus infection involving all 4 serotypes. These dengue outbreaks affected several locations with over 1,000 notifications. Detection of flavivirus seroconversions in sentinel chicken flocks across Australia provides an early warning of increased levels of Murray Valley encephalitis virus and Kunjin virus activity. Increased levels of flavivirus activity were detected in western and northern Australia, which prompted public health action. This action preceded 4 notifications of Murray Valley encephalitis infections, 2 (fatal) cases acquired in the Northern Territory and two in Western Australia. There were no notifications of locally-acquired malaria in Australia and 567 notifications of overseas-acquired malaria during 2008–09. This annual report presents information of diseases transmitted by mosquitoes in Australia and notified to the National Notifiable Diseases Surveillance System. Commun Dis Intell 2010;34(3):225–240.
Keywords: arbovirus; Barmah Forest virus, chikungunya, dengue, disease surveillance; epidemiology, flavivirus, Japanese encephalitis, Kunjin, malaria, mosquito-borne disease, mosquitoes, Murray Valley encephalitis virus, Ross River virus, yellow fever
National Arbovirus and Malaria Advisory Committee, 2008–09
226 CDI Vol 34 No 3 2010
Annual reports National Arbovirus and Malaria Advisory Committee, 2008–09
of health information between jurisdictions and the Commonwealth. Th e Act provides for the establishment of the National Notifi able Diseases List, which specifi es the diseases about which personal information can be provided. State and territory health departments transfer these noti-fi cations regularly to the NNDSS, as described in the National Health Security Agreement 2008. Th e primary responsibility for public health action resulting from a notifi cation resides with state and territory health departments. Th is report presents data extracted from NNDSS during February 2010 and analysed by date of diagnosis. Th is is a derived fi eld and represents the earliest of the reported fi elds of notifi cation date and notifi ca-tion received date. Th e dataset represents a ‘snap shot’, and numbers in this report may vary slightly from those reported from other NNDSS sources. Detailed notes on the interpretation of NNDSS are available in the 2008 NNDSS annual report. 1 Case defi nitions for the diseases included in this report are available from: http://www.health.gov.au/casedefi nitions Th e report includes informa-tion on the following pathogens transmitted by mosquitoes:
• alphaviruses (Barmah Forest, Ross River, and chikungunya);
• fl aviviruses (dengue, Japanese encephalitis, Kunjin, Murray Valley encephalitis, yellow fever and arbovirus not elsewhere classifi ed); and
• malaria.
To compare notifi cations in 2008–09 to histori-cal totals, crude numbers and rates of notifi cation were compared either with the mean of the previ-ous 5 years or with data from the previous year. Th e Australian Bureau of Statistics estimated resident populations for Australia and each state or territory at June 2008, was used to calculate rates of notifi cation.
Additional information was available from a survey conducted with state and territory public health surveillance managers. Th e survey sought to confi rm cases reported to NNDSS and determine the place of acquisition for locally-acquired cases of dengue virus infections. States and territories may conduct follow-up of arbovirus and malaria cases to determine the likely place of acquisition of infection. To date, the Northern Territory, Queensland, Victoria, and Tasmania are able to transfer place of acquisition details to NNDSS.
Overseas and locally-acquired dengue notifi ca-tions from the Cairns and Townsville areas were mapped, based on the residential postcode of
each case, to illustrate the spatial distribution of reported cases during the 2008–09 season. Each dot on the map is randomly assigned to an urban area within the postcode boundary (Map 1).
Results
During the 2008–09 season, there were 8,677 notifi cations of diseases transmitted by mosquitoes. Th is represented a 27% increase from the mean of 6,848 notifi cations for the previous 5 years and can be largely attributed to increased numbers of dengue notifi cations from the outbreak in Queensland. A summary of the number and rates of these mosquito-borne diseases is shown in Table 1. Th ere were no reported cases of yellow fever during 2008–09.
Alphavirus
Th e main alphaviruses occurring in Australia, Ross River virus (RRV) and Barmah Forest virus (BFV), can cause illnesses characterised by fever, rash and polyarthritis. Th ese viruses are transmit-ted by numerous species of mosquitoes that breed in diverse environments (freshwater habitats, coastal regions, salt marshes, fl oodwaters, estab-lished wetlands and urban areas). 2 No specifi c treatment or vaccine is available for these diseases. During 2008–09, there were 6,574 notifi cations of alphaviruses (BFV and RRV) of which RRV infections accounted for 74% (4,858).
Barmah Forest virus infections
Th ere were 1,716 notifi cations of BFV infections during 2008–09, representing a rate of eight per 100,000 population. Th is was a 4% increase over the mean of the previous 5 years (Table 1). Queensland reported the largest number of notifi cations of BFV (940) while the highest rate was reported in the Northern Territory (56 per 100,000 population).
Th e highest age specifi c rate for males of 16 per 100,000 population was reported in the 50–54 year age group and for females 14 per 100,000 population in the 45–49 year age group. Approximately half of all notifi cations were male (53%). Cases were reported in all jurisdictions.
As in previous years, there was a marked seasonal trend with the highest number of notifi cations being diagnosed in the months of January (162) and February (214). Th e number of BFV notifi ca-tions per month did not exceed the 5-year rolling mean during the 2008–09 season.
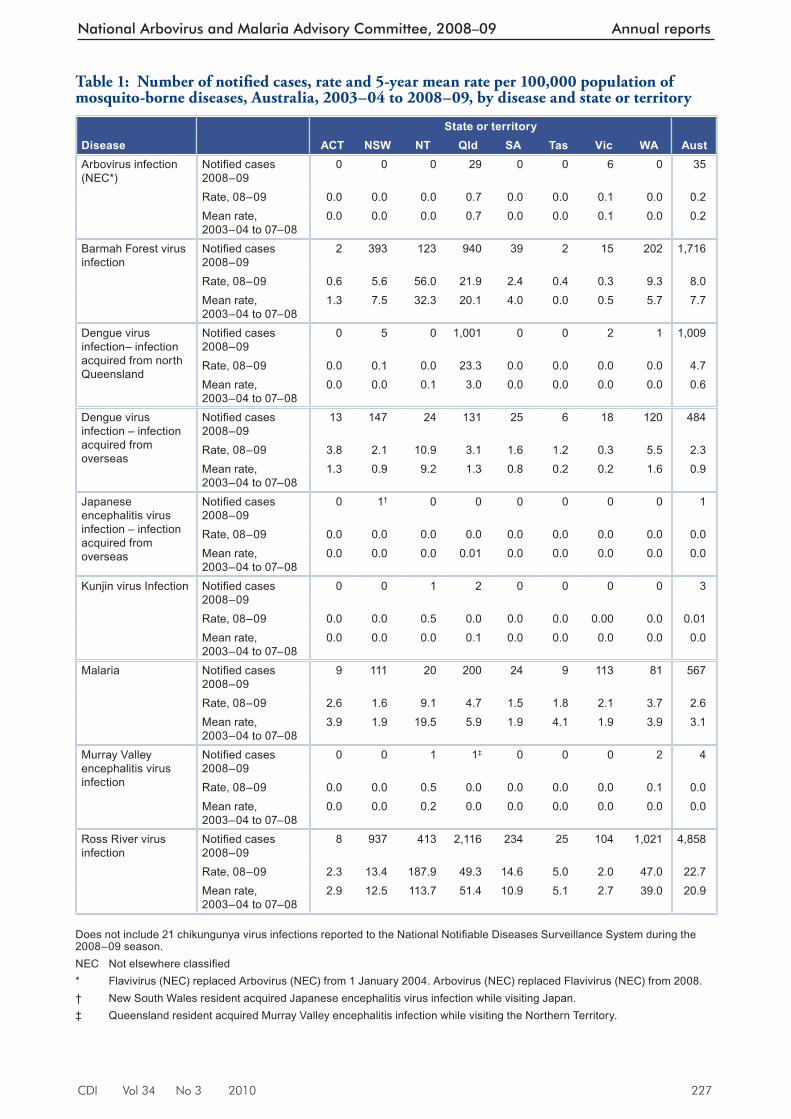
CDI Vol 34 No 3 2010 227
National Arbovirus and Malaria Advisory Committee, 2008–09 Annual reports
Table 1: Number of notifi ed cases, rate and 5-year mean rate per 100,000 population of mosquito-borne diseases, Australia, 2003–04 to 2008–09, by disease and state or territory
State or territoryDisease ACT NSW NT Qld SA Tas Vic WA AustArbovirus infection (NEC*)
Notifi ed cases 2008–09
0 0 0 29 0 0 6 0 35
Rate, 08–09 0.0 0.0 0.0 0.7 0.0 0.0 0.1 0.0 0.2Mean rate, 2003–04 to 07–08
0.0 0.0 0.0 0.7 0.0 0.0 0.1 0.0 0.2
Barmah Forest virus infection
Notifi ed cases 2008–09
2 393 123 940 39 2 15 202 1,716
Rate, 08–09 0.6 5.6 56.0 21.9 2.4 0.4 0.3 9.3 8.0Mean rate, 2003–04 to 07–08
1.3 7.5 32.3 20.1 4.0 0.0 0.5 5.7 7.7
Dengue virus infection– infection acquired from north Queensland
Notifi ed cases 2008–09
0 5 0 1,001 0 0 2 1 1,009
Rate, 08–09 0.0 0.1 0.0 23.3 0.0 0.0 0.0 0.0 4.7Mean rate, 2003–04 to 07–08
0.0 0.0 0.1 3.0 0.0 0.0 0.0 0.0 0.6
Dengue virus infection – infection acquired from overseas
Notifi ed cases 2008–09
13 147 24 131 25 6 18 120 484
Rate, 08–09 3.8 2.1 10.9 3.1 1.6 1.2 0.3 5.5 2.3Mean rate, 2003–04 to 07–08
1.3 0.9 9.2 1.3 0.8 0.2 0.2 1.6 0.9
Japanese encephalitis virus infection – infection acquired from overseas
Notifi ed cases 2008–09
0 1† 0 0 0 0 0 0 1
Rate, 08–09 0.0 0.0 0.0 0.0 0.0 0.0 0.0 0.0 0.0Mean rate, 2003–04 to 07–08
0.0 0.0 0.0 0.01 0.0 0.0 0.0 0.0 0.0
Kunjin virus Infection Notifi ed cases 2008–09
0 0 1 2 0 0 0 0 3
Rate, 08–09 0.0 0.0 0.5 0.0 0.0 0.0 0.00 0.0 0.01Mean rate, 2003–04 to 07–08
0.0 0.0 0.0 0.1 0.0 0.0 0.0 0.0 0.0
Malaria Notifi ed cases 2008–09
9 111 20 200 24 9 113 81 567
Rate, 08–09 2.6 1.6 9.1 4.7 1.5 1.8 2.1 3.7 2.6Mean rate, 2003–04 to 07–08
3.9 1.9 19.5 5.9 1.9 4.1 1.9 3.9 3.1
Murray Valley encephalitis virus infection
Notifi ed cases 2008–09
0 0 1 1‡ 0 0 0 2 4
Rate, 08–09 0.0 0.0 0.5 0.0 0.0 0.0 0.0 0.1 0.0Mean rate, 2003–04 to 07–08
0.0 0.0 0.2 0.0 0.0 0.0 0.0 0.0 0.0
Ross River virus infection
Notifi ed cases 2008–09
8 937 413 2,116 234 25 104 1,021 4,858
Rate, 08–09 2.3 13.4 187.9 49.3 14.6 5.0 2.0 47.0 22.7Mean rate, 2003–04 to 07–08
2.9 12.5 113.7 51.4 10.9 5.1 2.7 39.0 20.9
Does not include 21 chikungunya virus infections reported to the National Notifi able Diseases Surveillance System during the 2008–09 season. NEC Not elsewhere classifi ed * Flavivirus (NEC) replaced Arbovirus (NEC) from 1 January 2004. Arbovirus (NEC) replaced Flavivirus (NEC) from 2008. † New South Wales resident acquired Japanese encephalitis virus infection while visiting Japan. ‡ Queensland resident acquired Murray Valley encephalitis infection while visiting the Northern Territory.
228 CDI Vol 34 No 3 2010
Annual reports National Arbovirus and Malaria Advisory Committee, 2008–09
Authorities are considering the possibility of the fi rst evidence of local transmission of BFV in Tasmania based on the travel histories of 2 cases reported during early 2009. All previous notifi ed cases of BFV in Tasmania have reported a travel history to other parts of Australia aff ected by BFV. Th ese cases justify the provision of advice to general practitioners in Tasmania to assist with the diagnosis of future cases. Further investigation will also be undertaken in an attempt to isolate the virus from known vector mosquito species and local wildlife in Tasmania (personal communica-tion: Department of Health and Human Services, Tasmania).
Ross River virus infections
Th ere were 4,858 notifi cations of RRV infection during 2008–09 representing a rate of 23 per 100,000 population (Table 1). Th is was a 9% increase over the mean of the previous fi ve years. Queensland reported the largest number of noti-fi cations of RRV (2,116) while the highest rate was reported in the Northern Territory (188 per 100,000 population).
Th e highest age specifi c rate for males of 33 per 100,000 population was reported in the 45–64 year age groups and for females 40 per 100,000 population in the 40–45 year age group. Nearly half of all notifi cations were male (48%).
As in previous years, there was a marked seasonal trend with the highest number of notifi cations being diagnosed in March (680) and April (597). Th e number of notifi cations per month was either similar or less than the 5-year rolling mean during the 2008–09 season.
Both Western Australia and the Northern Terri-tory reported a large increase in RRV notifi cations when compared with the mean of the previous 5-year period. In 2008–09, the number of notifi -cations reported was the largest for a season since NNDSS began in 1991. Th is increase was prob-ably due to variations in the amount and timing of rainfall in the various regions compared with previous years, but was possibly complicated to some extent by movement of people between the regions, and diff erences in pathology test requests or methods. 3
Chikungunya virus infection
Chi kungunya virus (CHIKV) is a member of the Alphavirus genus in the family Togaviridae and is closely related to RRV and BFV. Illness is charac-terised by an abrupt onset of fever, rash and severe joint pain. Th e acute disease lasts one to 10 days, but convalescence may include prolonged joint
swelling and pain lasting months. It has clinical similarities to dengue, including occasional cases with haemorrhagic manifestations. 4 CHIKV is of concern given that humans are amplifi cation hosts rather than incidental hosts, and other vertebrates are not required for high levels of transmission to occur. In Australia, the known competent mos-quito vectors for CHIKV include Aedes aegypti , which occurs in northern Queensland and Aedes albopictus (Asian Tiger mosquito), which is found on the Cocos, Christmas and the Torres Strait islands. 5 Other Australian mosquitoes have been shown to be competent laboratory vectors of CHIKV and in particular Aedes spp., which have been implicated previously as endemic RRV and BFV vectors. 6
CHIKV infection is a notifi able disease in all jurisdictions other than the Australian Capital Territory. Th ere were 21 notifi cations of overseas-acquired CHIKV infection reported to NNDSS during 2008–09 compared with 3 cases notifi ed during 2007–08. Ten of the cases were reported to have acquired their infection during travel to Malaysia.
Flaviviruses
Th is section provides information on several fl aviviruses notifi ed to NNDSS including dengue virus, Murray Valley encephalitis virus (MVEV) infection, Kunjin virus (KUNV) infection and Japanese encephalitis virus (JEV) infection. Other fl aviviruses may be notifi ed under the Arbovirus (NEC) category. Dengue is characterised by fl u like symptoms (fever, headache, muscle or joint pain) and has 4 distinct serotypes. MVEV, KUNV and JEV can, in a small percentage of cases, result in illness involving the central nervous system including encephalitis of variable severity. Ae. aegypti is the major vector of dengue in Australia and Culex annulirostris is the major vector of MVEV, JEV and KUNV. No specifi c treatment is available for these diseases and care is largely supportive. A vaccine is not available for dengue, MVEV or KUNV infection but a vaccination to prevent JEV infection is available. 7 Dengue is the most commonly notifi ed fl avivirus infection in Australia and accounted for 99% (1,493) of the 1,501 fl avivirus notifi cations reported during 2008–09 (Table 1). Th e remaining fl avivirus notifi cations included 4 notifi cations of MVEV infection, 3 notifi cations of KUNV infection and a single notifi cation of overseas-acquired JEV infection.
Dengue virus infection
Th e re were 1,493 notifi cations of dengue infec-tion notifi ed during the season of 2008–09. Of
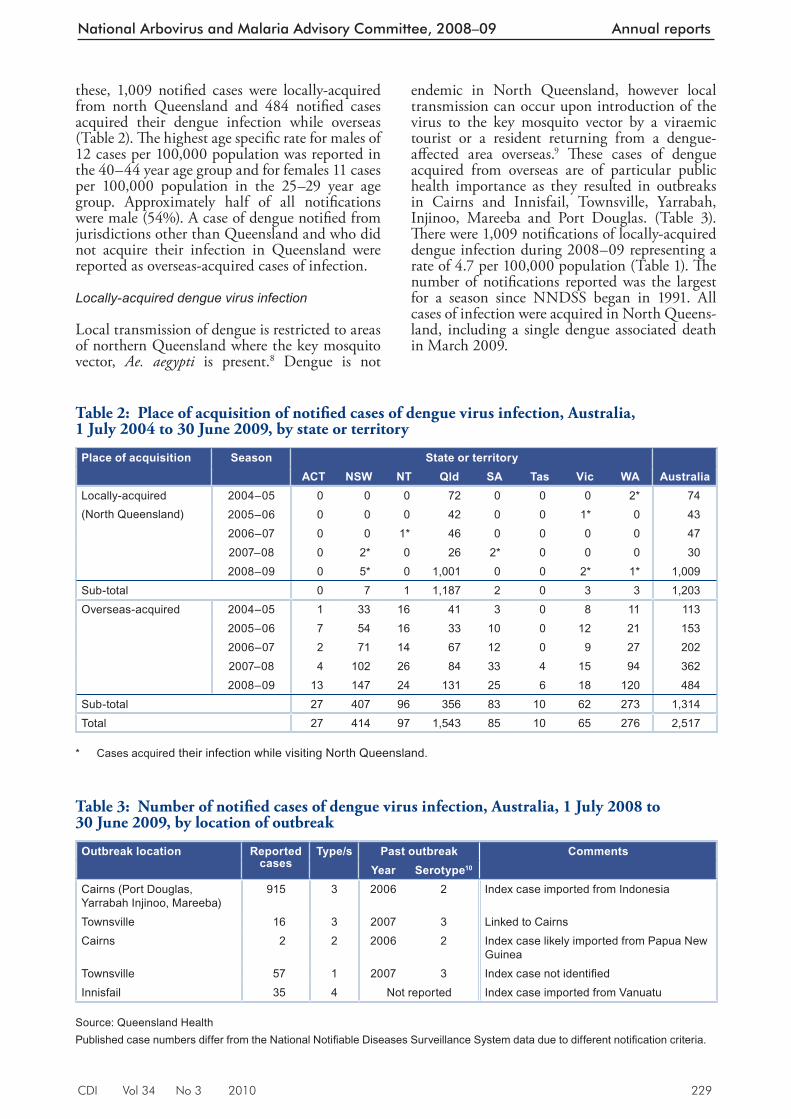
CDI Vol 34 No 3 2010 229
National Arbovirus and Malaria Advisory Committee, 2008–09 Annual reports
these, 1,009 notifi ed cases were locally-acquired from north Queensland and 484 notifi ed cases acquired their dengue infection while overseas (Table 2). Th e highest age specifi c rate for males of 12 cases per 100,000 population was reported in the 40–44 year age group and for females 11 cases per 100,000 population in the 25–29 year age group. Approximately half of all notifi cations were male (54%). A case of dengue notifi ed from jurisdictions other than Queensland and who did not acquire their infection in Queensland were reported as overseas-acquired cases of infection.
Locally-acquired dengue virus infection
Local transmission of dengue is restricted to areas of northern Queensland where the key mosquito vector, Ae. aegypti is present. 8 Dengue is not
endemic in North Queensland, however local transmission can occur upon introduction of the virus to the key mosquito vector by a viraemic tourist or a resident returning from a dengue-aff ected area overseas. 9 Th ese cases of dengue acquired from overseas are of particular public health importance as they resulted in outbreaks in Cairns and Innisfail, Townsville, Yarrabah, Injinoo, Mareeba and Port Douglas. (Table 3). Th ere were 1,009 notifi cations of locally-acquired dengue infection during 2008–09 representing a rate of 4.7 per 100,000 population (Table 1). Th e number of notifi cations reported was the largest for a season since NNDSS began in 1991. All cases of infection were acquired in North Queens-land, including a single dengue associated death in March 2009.
Tab le 2: Place of acquisition of notifi ed cases of dengue virus infection, Australia, 1 July 2004 to 30 June 2009, by state or territory
Place of acquisition Season State or territory ACT NSW NT Qld SA Tas Vic WA Australia
Locally-acquired(North Queensland)
2004–05 0 0 0 72 0 0 0 2* 742005–06 0 0 0 42 0 0 1* 0 432006–07 0 0 1* 46 0 0 0 0 472007–08 0 2* 0 26 2* 0 0 0 302008–09 0 5* 0 1,001 0 0 2* 1* 1,009
Sub-total 0 7 1 1,187 2 0 3 3 1,203Overseas-acquired 2004–05 1 33 16 41 3 0 8 11 113
2005–06 7 54 16 33 10 0 12 21 1532006–07 2 71 14 67 12 0 9 27 2022007–08 4 102 26 84 33 4 15 94 3622008–09 13 147 24 131 25 6 18 120 484
Sub-total 27 407 96 356 83 10 62 273 1,314Total 27 414 97 1,543 85 10 65 276 2,517
* Cases acquired their infection while visiting North Queensland.
Table 3: Number of notifi ed cases of dengue virus infection, Australia, 1 July 2008 to 30 June 2009, by location of outbreak
Outbreak location Reported cases
Type/s Past outbreak CommentsYear Serotype10
Cairns (Port Douglas, Yarrabah Injinoo, Mareeba)
915 3 2006 2 Index case imported from Indonesia
Townsville 16 3 2007 3 Linked to CairnsCairns 2 2 2006 2 Index case likely imported from Papua New
GuineaTownsville 57 1 2007 3 Index case not identifi edInnisfail 35 4 Not reported Index case imported from Vanuatu
Source: Queensland Health Published case numbers differ from the National Notifi able Diseases Surveillance System data due to different notifi cation criteria.
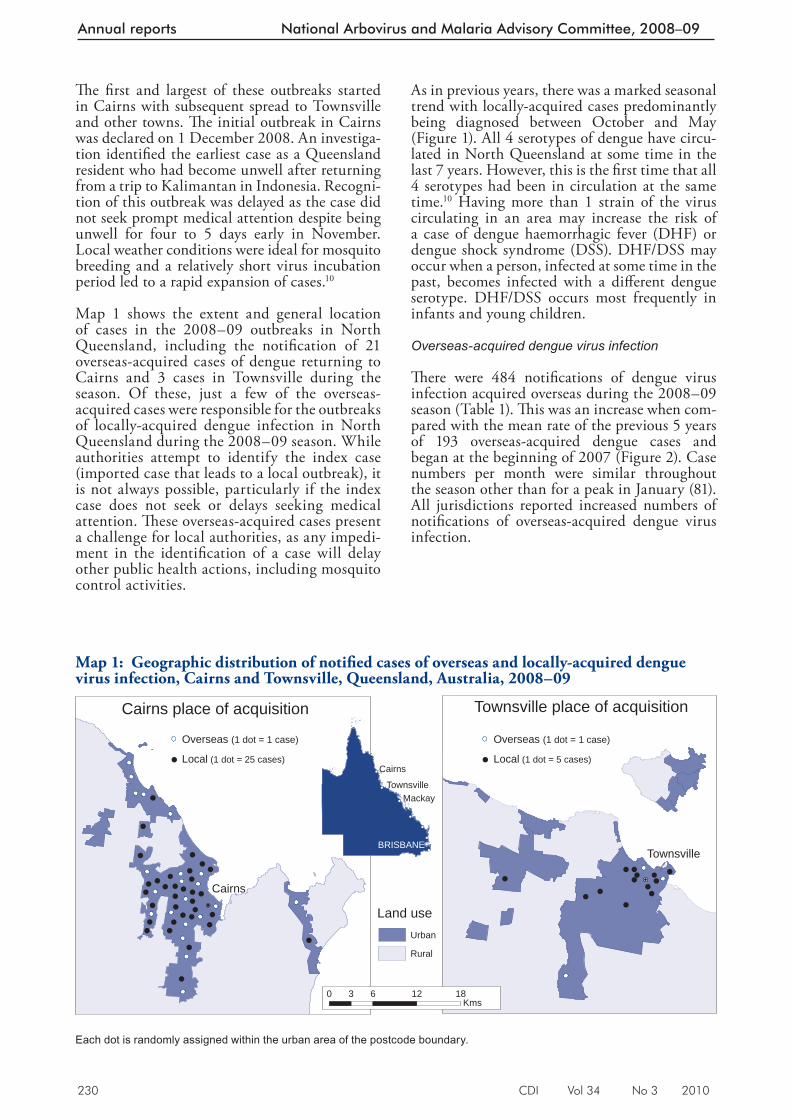
230 CDI Vol 34 No 3 2010
Annual reports National Arbovirus and Malaria Advisory Committee, 2008–09
Th e fi rst and largest of these outbreaks started in Cairns with subsequent spread to Townsville and other towns. Th e initial outbreak in Cairns was declared on 1 December 2008. An investiga-tion identifi ed the earliest case as a Queensland resident who had become unwell after returning from a trip to Kalimantan in Indonesia. Recogni-tion of this outbreak was delayed as the case did not seek prompt medical attention despite being unwell for four to 5 days early in November. Local weather conditions were ideal for mosquito breeding and a relatively short virus incubation period led to a rapid expansion of cases. 10
Map 1 shows the extent and general location of cases in the 2008–09 outbreaks in North Queensland, including the notifi cation of 21 overseas-acquired cases of dengue returning to Cairns and 3 cases in Townsville during the season. Of these, just a few of the overseas-acquired cases were responsible for the outbreaks of locally-acquired dengue infection in North Queensland during the 2008–09 season. While authorities attempt to identify the index case (imported case that leads to a local outbreak), it is not always possible, particularly if the index case does not seek or delays seeking medical attention. Th ese overseas-acquired cases present a challenge for local authorities, as any impedi-ment in the identifi cation of a case will delay other public health actions, including mosquito control activities.
As in previous years, there was a marked seasonal trend with locally-acquired cases predominantly being diagnosed between October and May (Figure 1). All 4 serotypes of dengue have circu-lated in North Queensland at some time in the last 7 years. However, this is the fi rst time that all 4 serotypes had been in circulation at the same time. 10 Having more than 1 strain of the virus circulating in an area may increase the risk of a case of dengue haemorrhagic fever (DHF) or dengue shock syndrome (DSS). DHF/DSS may occur when a person, infected at some time in the past, becomes infected with a diff erent dengue serotype. DHF/DSS occurs most frequently in infants and young children.
Overseas- acquired dengue virus infection
Th ere were 484 notifi cations of dengue virus infection acquired overseas during the 2008–09 season (Table 1). Th is was an increase when com-pared with the mean rate of the previous 5 years of 193 overseas-acquired dengue cases and began at the beginning of 2007 (Figure 2). Case numbers per month were similar throughout the season other than for a peak in January (81). All jurisdictions reported increased numbers of notifi cations of overseas-acquired dengue virus infection.
Map 1: Geographic distribution of notifi ed cases of overseas and locally-acquired dengue virus infection, Cairns and Townsville, Queensland, Australia, 2008–09
Cairns
Townsville place of acquisitionCairns place of acquisition
BRISBANE
Cairns
MackayTownsville
Townsville
Local (1 dot = 25 cases)
Overseas (1 dot = 1 case)
Local (1 dot = 5 cases)
Overseas (1 dot = 1 case)
Urban
Rural
Land use
60 12 183Kms
Each dot is randomly assigned within the urban area of the postcode boundary.
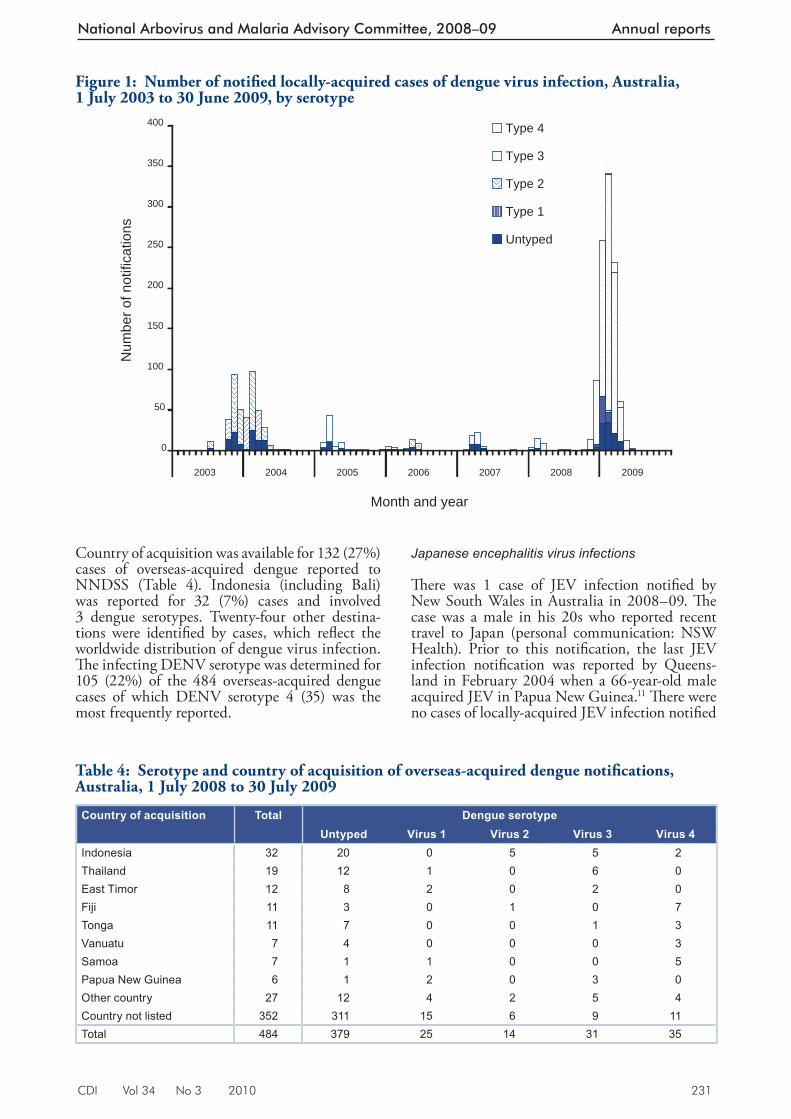
CDI Vol 34 No 3 2010 231
National Arbovirus and Malaria Advisory Committee, 2008–09 Annual reports
Country of acquisition was available for 132 (27%) cases of overseas-acquired den gue reported to NNDSS (Table 4). Indonesia (including Bali) was reported for 32 (7%) cases and involved 3 dengue serotypes. Twenty-four other destina-tions were identifi ed by cases, which refl ect the worldwide distribution of dengue virus infection. Th e infecting DENV serotype was determined for 105 (22%) of the 484 overseas-acquired dengue cases of which DENV serotype 4 (35) was the most frequently reported.
Japanese encephalitis virus infections
Th ere was 1 case of JEV infection notifi ed by New South Wales in Australia in 2008–09. Th e case was a male in his 20s who reported recent travel to Japan (personal communication: NSW Health). Prior to this notifi cation, the last JEV infection notifi cation was reported by Queens-land in February 2004 when a 66-year-old male acquired JEV in Papua New Guinea. 11 Th ere were no cases of locally-acquired JEV infection notifi ed
Figure 1: Number of notifi ed locally-acquired cases of dengue virus infection, Australia, 1 July 2003 to 30 June 2009, by serotype
0
50
100
150
200
250
300
350
400
2003 2004 2005 2006 2007 2008 2009
Month and year
Num
ber o
f not
ifica
tions
Type 4
Type 3
Type 2
Type 1
Untyped
Table 4: Serotype and country of acquisition of overseas-acquired dengue notifi cations, Australia, 1 July 2008 to 30 July 2009
Country of acquisition Total Dengue serotypeUntyped Virus 1 Virus 2 Virus 3 Virus 4
Indonesia 32 20 0 5 5 2Thailand 19 12 1 0 6 0East Timor 12 8 2 0 2 0Fiji 11 3 0 1 0 7Tonga 11 7 0 0 1 3Vanuatu 7 4 0 0 0 3Samoa 7 1 1 0 0 5Papua New Guinea 6 1 2 0 3 0Other country 27 12 4 2 5 4Country not listed 352 311 15 6 9 11Total 484 379 25 14 31 35
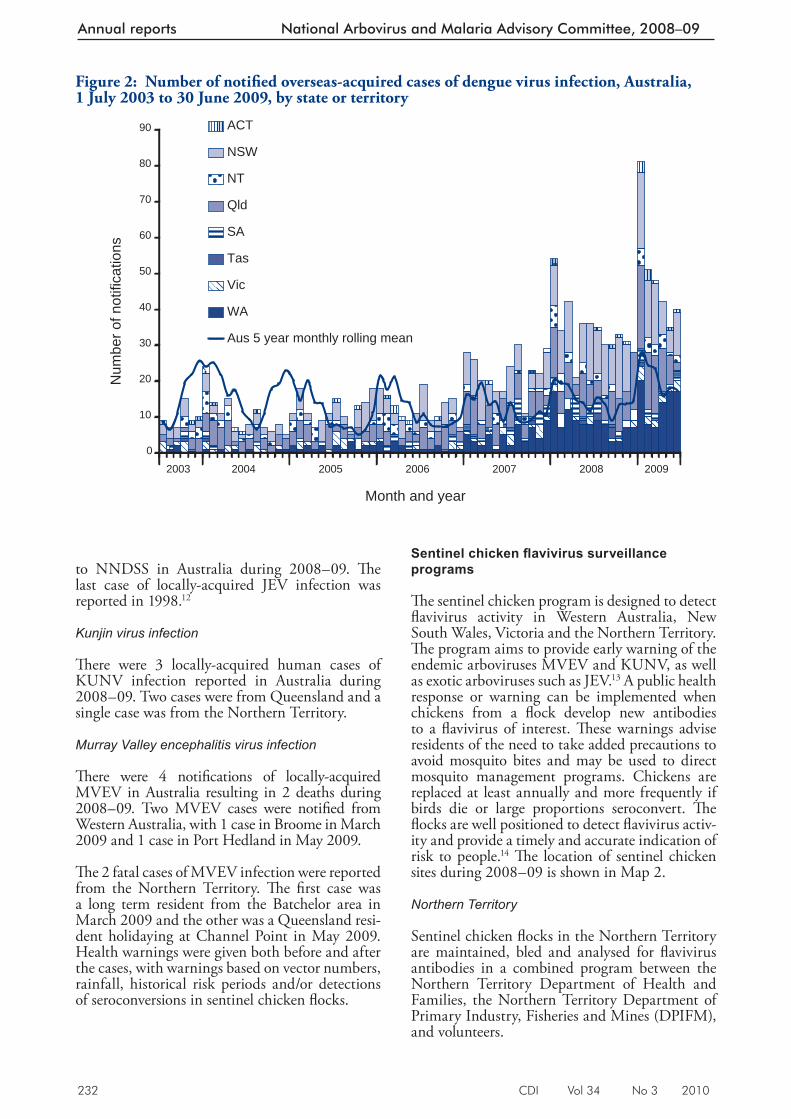
232 CDI Vol 34 No 3 2010
Annual reports National Arbovirus and Malaria Advisory Committee, 2008–09
to NNDSS in Australia during 2008–09. Th e last case of locally-acquired JEV infection was reported in 1998. 12
Kunjin virus infection
Th ere were 3 locally-acquired human cases of KUNV infection reported in Australia during 2008–09. Two cases were from Queensland and a single case was from the Northern Territory.
Murray Valley encephalitis virus infection
Th ere were 4 notifi cations of locally-acquired MVEV in Australia resulting in 2 deaths during 2008–09. Two MVEV cases were notifi ed from Western Australia, with 1 case in Broome in March 2009 and 1 case in Port Hedland in May 2009.
Th e 2 fatal cases of MVEV infection were reported from the Northern Territory. Th e fi rst case was a long term resident from the Batchelor area in March 2009 and the other was a Queensland resi-dent holidaying at Channel Point in May 2009. Health warnings were given both before and after the cases, with warnings based on vector numbers, rainfall, historical risk periods and/or detections of seroconversions in sentinel chicken fl ocks.
Sentinel chicken fl avivirus surveillance programs
Th e sentinel chicken program is designed to detect fl avivirus activity in Western Australia, New South Wales, Victoria and the Northern Territory. Th e program aims to provide early warning of the endemic arboviruses MVEV and KUNV, as well as exotic arboviruses such as JEV. 13 A public health response or warning can be implemented when chickens from a fl ock develop new antibodies to a fl avivirus of interest. Th ese warnings advise residents of the need to take added precautions to avoid mosquito bites and may be used to direct mosquito management programs. Chickens are replaced at least annually and more frequently if birds die or large proportions seroconvert. Th e fl ocks are well positioned to detect fl avivirus activ-ity and provide a timely and accurate indication of risk to people. 14 Th e location of sentinel chicken sites during 2008–09 is shown in Map 2.
Northern Territory
Sentinel chicken fl ocks in the Northern Territory are maintained, bled and analysed for fl avivirus antibodies in a combined program between the Northern Territory Department of Health and Families, the Northern Territory Department of Primary Industry, Fisheries and Mines (DPIFM), and volunteers.
Figure 2: Number of notifi ed overseas-acquired cases of dengue virus infection, Australia, 1 July 2003 to 30 June 2009, by state or territory
0
10
20
30
40
50
60
70
80
90
2004 2005 2006 2007 2008 2009
Month and year
Num
ber o
f not
ifica
tions
ACT
NSW
NT
Qld
SA
Tas
Vic
WA
Aus 5 year monthly rolling mean
2003
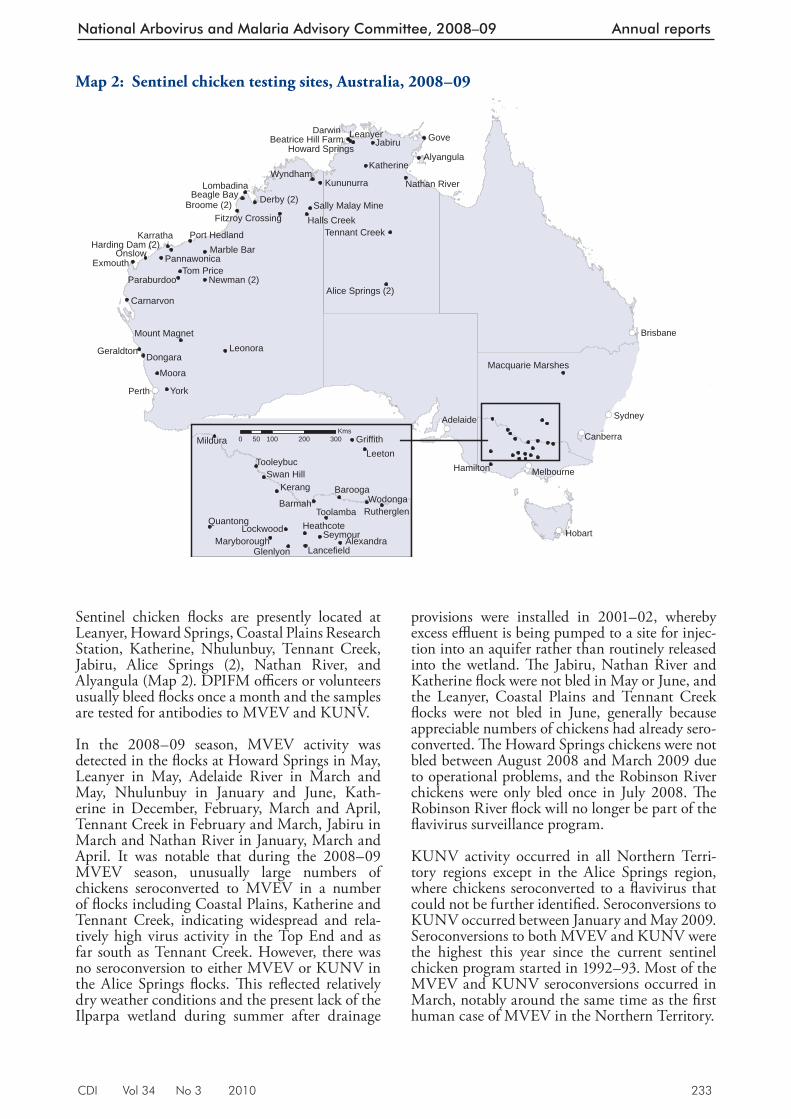
CDI Vol 34 No 3 2010 233
National Arbovirus and Malaria Advisory Committee, 2008–09 Annual reports
Map 2: Sentinel chicken testing sites, Australia, 2008–09
!(
!(
!(
!(
!(
!(
!(
!(
York
Gove
Moora
Onslow
Jabiru
Wyndham
Leonora
Exmouth
Dongara
Leanyer
Karratha
Hamilton
Tom Price
Lombadina Kununurra
Geraldton
Derby (2)
Carnarvon
KatherineAlyangula
Paraburdoo Newman (2)
Marble Bar
Broome (2)Beagle Bay
Halls CreekPort Hedland
Mount Magnet
Nathan River
Tennant Creek
Howard Springs
Sally Malay Mine
Alice Springs (2)
Macquarie Marshes
PannawonicaHarding Dam (2)
Fitzroy Crossing
Beatrice Hill Farm
Brisbane
Sydney
Canberra
Melbourne
Adelaide
Perth
Darwin
Hobart
Kerang
Barmah
Leeton
Wodonga
Seymour
Mildura
Barooga
ToolambaQuantong
Lockwood
Glenlyon
Griffith
Swan Hill
Heathcote
Alexandra
Tooleybuc
Rutherglen
LancefieldMaryborough
0 100 200 30050Kms
Sentinel chicken fl ocks are presently located at Leanyer, Howard Springs, Coastal Plains Research Station, Katherine, Nhulunbuy, Tennant Creek, Jabiru, Alice Springs (2), Nathan River, and Alyangula (Map 2). DPIFM offi cers or volunteers usually bleed fl ocks once a month and the samples are tested for antibodies to MVEV and KUNV.
In the 2008–09 season, MVEV activity was detected in the fl ocks at Howard Springs in May, Leanyer in May, Adelaide River in March and May, Nhulunbuy in January and June, Kath-erine in December, February, March and April, Tennant Creek in February and March, Jabiru in March and Nathan River in January, March and April. It was notable that during the 2008–09 MVEV season, unusually large numbers of chickens seroconverted to MVEV in a number of fl ocks including Coastal Plains, Katherine and Tennant Creek, indicating widespread and rela-tively high virus activity in the Top End and as far south as Tennant Creek. However, there was no seroconversion to either MVEV or KUNV in the Alice Springs fl ocks. Th is refl ected relatively dry weather conditions and the present lack of the Ilparpa wetland during summer after drainage
provisions were installed in 2001–02, whereby excess effl uent is being pumped to a site for injec-tion into an aquifer rather than routinely released into the wetland. Th e Jabiru, Nathan River and Katherine fl ock were not bled in May or June, and the Leanyer, Coastal Plains and Tennant Creek fl ocks were not bled in June, generally because appreciable numbers of chickens had already sero-converted. Th e Howard Springs chickens were not bled between August 2008 and March 2009 due to operational problems, and the Robinson River chickens were only bled once in July 2008. Th e Robinson River fl ock will no longer be part of the fl avivirus surveillance program.
KUNV activity occurred in all Northern Terri-tory regions except in the Alice Springs region, where chickens seroconverted to a fl avivirus that could not be further identifi ed. Seroconversions to KUNV occurred between January and May 2009. Seroconversions to both MVEV and KUNV were the highest this year since the current sentinel chicken program started in 1992–93. Most of the MVEV and KUNV seroconversions occurred in March, notably around the same time as the fi rst human case of MVEV in the Northern Territory.
234 CDI Vol 34 No 3 2010
Annual reports National Arbovirus and Malaria Advisory Committee, 2008–09
Northern Territory sentinel chicken surveillance indicated that during the 2008–09 season, MVEV was wide-spread in the Northern Territory as far south as Tennant Creek, with large numbers of chickens seroconverting to MVEV, and all fl ocks except Alyangula and the Alice Springs fl ocks showing seroconversions. Th e absence of MVEV seroconversions around Alyangula over the last 3 years indicate that the Alyangula locality is not conducive to MVEV transmission, probably as a result of relatively low numbers of the principle vector and the lack of a nearby wetland and associ-ated birds. Th ere have been no seroconversions to MVEV in the Alice Springs fl ocks since 2001–02, when the Ilparpa swamp was drained. Health warnings were issued throughout the main MVEV risk period between January and June 2009.
Western Australia
Th e Arbovirus Surveillance and Research Laboratory (ASRL) at Th e University of Western Australia, on behalf of the Western Australian Department of Health, undertakes the fl avivirus sentinel chicken program in Western Australia. Many state and local government authorities and community volunteers also take part in the program. Th irty sentinel chicken fl ocks (of up to 12 chickens) are located at major towns and communities in the Kimberley, Pilbara, Gascoyne, Goldfi elds, Midwest and Central Coastal regions of Western Australia (Map 2). Blood samples are collected from the chickens by environmental health offi cers or trained volunteers at fortnightly intervals during the peak MVEV risk season (December to June). At other times of the year, monthly blood samples are collected, unless prolonged fl avivirus activity warrants continued fortnightly sampling. Samples are transported to the ASRL where they are tested for antibodies to fl aviviruses using an epitope blocking ELISA. 15
Th e passage of Tropical Cyclone Billy in the north-ern Kimberley region in December caused heavy rain and fl ooding. Above average rainfall was recorded across most of the Kimberley, Pilbara, Interior and southern Goldfi elds. Successive tropical cyclones and low pressure systems caused further rainfall and fl ooding in northern Western Australia in January, February and March. Th e west Pilbara was particularly aff ected in February, and the eastern Pilbara received heavy rainfall in March. Conditions were generally dry in northern Western Australia between April and June 2009.
A total of 4,067 serum samples from the 30 sentinel chicken fl ocks were tested for antibodies to fl aviviruses during 2008–09. 16 Seroconversions were detected in 247 (6.1%) of the samples. Two MVEV seroconversions detected at Onslow
in the Pilbara region in July and August 2008 were associated with activity extending from the 2007–08 wet season. Th e fi rst activity associated with the 2008–09 wet season occurred in February 2009, when MVEV was detected at Kununurra in the north-east Kimberley region, Halls Creek and Sally Malay mine in the south-east Kimberley region, Fitzroy Crossing in the West Kimberley region, and a couple of weeks later at Harding Dam in the Pilbara region. KUNV activity was also detected in February, when 2 seroconversions to KUNV were detected at Marble Bar, in the Pilbara region. Widespread MVEV activity continued, and was ultimately detected at all locations where sentinel chickens were in place in the Kimberley, Pilbara and Gascoyne regions. Th e level of MVEV activity was very high in 2008–09, with 108 MVEV seroconversions in the Kimberley, 99 in the Pilbara and four in the Gascoyne region. Overall, the level of MVEV activity was substantially higher than the previous season, and was almost as high as 2000, when there was widespread activity of MVEV and 11 clinical cases, including 9 cases of encephalitis. 17 Despite the high level of MVEV activity, no seroconversions to MVEV were detected south of the Gascoyne region. In contrast, the level of activity of KUNV was relatively low, and activity of KUNV was not detected south of Newman. A small proportion of unidentifi ed fl avivirus infections were detected at several locations in the Kimberley and Pilbara regions, possibly due to activity of other fl aviviruses that have previously been isolated from mosquitoes collected in northern Western Australia.
New South Wales
Th e NSW Arbovirus Surveillance and Mosquito Monitoring program at the Institute of Clinical Pathology and Medical Research undertakes the New South Wales sentinel chicken program. Th e 2008–09 season began on 2 October 2008 and ended on 12 April 2009. A total of 1,509 samples were received from 6 sentinel chicken fl ocks in New South Wales over a 7-month period in 2008–09. Th e sentinel chicken fl ocks were located at Bourke, Deniliquin, Griffi th, Leeton, Macquarie Marshes and Menindee (Map 2). Th ere were no seroconversions to MVEV or KUNV. 18 A description of the bleeding method of the chickens and the testing regime is outlined in the 2003–2004 New South Wales Arbovirus Surveillance Program annual report. 19
Victoria
Th e Victorian Department of Primary Industry on behalf of the Victorian Department of Health undertakes the Victorian sentinel chicken program.
CDI Vol 34 No 3 2010 235
National Arbovirus and Malaria Advisory Committee, 2008–09 Annual reports
Th e program received 6,160 samples from the 10 sentinel chicken fl ocks in Victoria during the season (Map 2). Th ere were no seroconversions to MVEV or KUNV. Detection of MVEV activity in Victoria during March and April 2008 prompted the addi-tion of 9 sites to test weekly from 1 January 2009 to 30 March 2009 (total tests 1,620). Th ese sites were across an east/west direction and further south than the established 10 sites in the Murray Valley region. Similarly, no seroconversions were detected (personal communication: Victorian Government Department of Health).
Malaria
Malaria is a serious acute febrile illness that is nor-mally transmitted from person to person through the bite of an infected mosquito. It is caused by a protozoan parasite called Plasmodium that includes 4 species – vivax , falciparum , malariae and ovale. 20 A 5th species, Plasmodium knowlesi has been recently identifi ed as a cause of human malaria occurring predominantly throughout South East Asia. Infec-tion with this primate malaria has the potential of being fatal if treatment is not given early in the course of an infection. 21
Th ere were 567 notifi cations of overseas-acquired malaria during the season 2008–09, representing a rate of 2.6 per 100,000 population (Table 1). Th is was a decrease when compared with the mean rate of the previous 5 years of 3.1 per 100,000 popu-lation. Th ere were no reports of locally-acquired malaria. Th e last outbreak of locally-acquired malaria occurred in North Queensland during 2002. 22 Notifi cation rates ranged from 1.5 per 100,000 population in South Australia to 9.1 per 100,000 population in the Northern Territory. All jurisdictions reported a decrease in notifi cations when compared with the previous 5 years, other than in Victoria (1.9 to 2.1 per 100,000 popula-tion). Seventy-one per cent of notifi cations were
male, which was consistent with the past 5 years. Th e highest age specifi c rate for males of 8.2 per 100,000 and 4.1 per 100,000 population for females was reported in the 20–24 year age group. No deaths from malaria were reported during the 2008–09 season.
Th e infecting Plasmodium species was reported for 96% of malaria notifi cations during 2008–09 (Table 5). Of these 567 notifi cations, P. falciparum and P. vivax were the predominant species. Th ere were no cases of P. knowlesi notifi ed to NNDSS during 2008–09.
Th e country of acquisition of infection was avail-able for 227 (40%) cases of malaria reported to NNDSS (Table 6). Papua New Guinea was reported as the country of acquisition by 113 (20%) cases and included both P. falciparum and P. vivax species. Twenty-four other destina-tions were identifi ed by cases. Th ey included India (34), Indonesia (9) and Mozambique (7).
Arbovirus infection (N EC)
Th e category Arbovirus infection (NEC) includes notifi cations of vectorborne infections not else-where classifi ed. Th ere were 35 notifi cations in this category during 2008–09, which was similar when compared with the previous 5 years. Queensland (29) and Victoria (6) accounted for all notifi ed cases. Single notifi cations were identi-fi ed as Kokobera and Stratford virus infection.
Other surveillance and research activities
National Arbovirus Monitoring Program
Th e National Arbovirus Monitoring Program (NAMP) monitors the distribution of economically important arboviruses of livestock and their vectors
Table 5: Oversea s-acquired malaria cases, Australia 1 July 2008 to 30 June 2009, by species and state or territory
Plasmodium species State or territory Type (%)ACT NSW NT Qld SA Tas Vic WA Aust
Plasmodium falciparum 2 41 10 80 11 6 32 49 231 41
Plasmodium vivax 6 63 8 94 11 2 73 21 278 49Other Plasmodium species 1 7 1 6 0 1 2 4 22 4Mixed Plasmodium species 0 0 1 0 2 0 5 5 13 2Plasmodium species 0 0 0 20 0 0 1 2 23 4Total 9 111 20 200 24 9 113 81 567
New South Wales, Victoria, South Australia, Western Australia, Tasmania and the Northern Territory report mixed species infections per notifi ed case. Queensland and the Australian Capital Territory report 1 notifi cation for each species in a mixed infection.
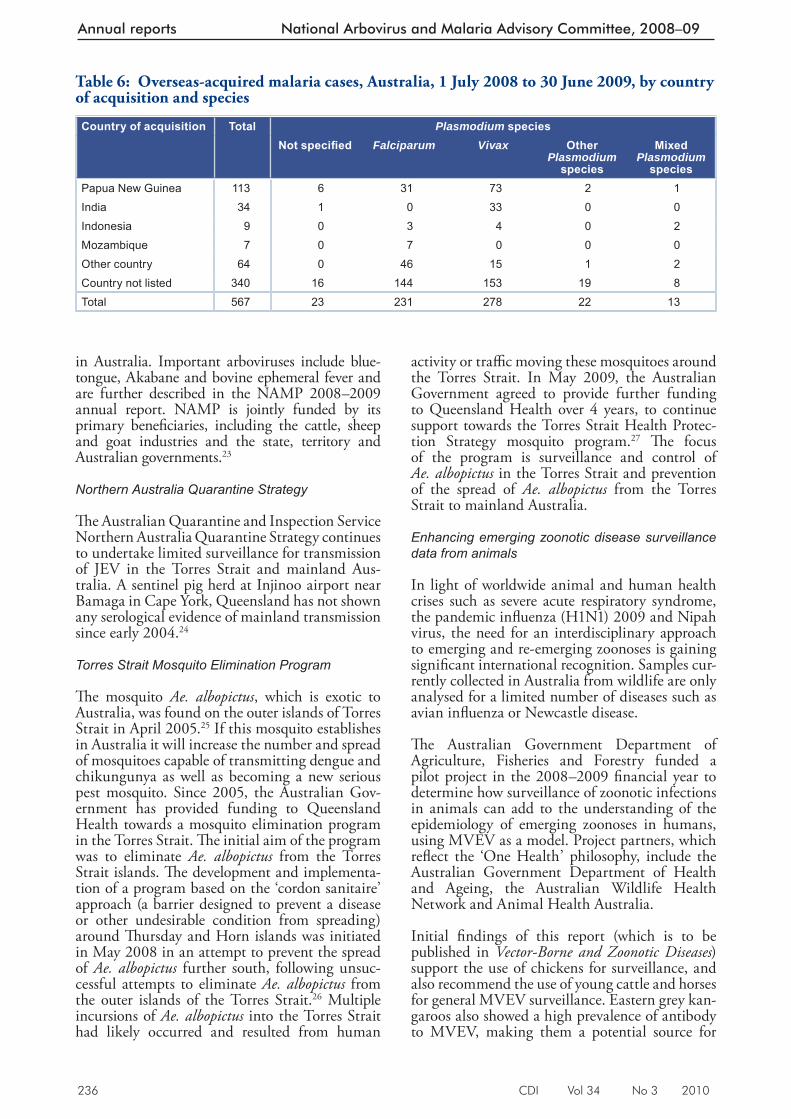
236 CDI Vol 34 No 3 2010
Annual reports National Arbovirus and Malaria Advisory Committee, 2008–09
in Australia. Important arboviruses include blue-tongue, Akabane and bovine ephemeral fever and are further described in the NAMP 2008–2009 annual report. NAMP is jointly funded by its primary benefi ciaries, including the cattle, sheep and goat industries and the state, territory and Australian governments. 23
Northern Australia Quarantine Strategy
Th e Australian Quarantine and Inspection Service Northern Australia Quarantine Strategy continues to undertake limited surveillance for transmission of JEV in the Torres Strait and mainland Aus-tralia. A sentinel pig herd at Injinoo airport near Bamaga in Cape York, Queensland has not shown any serological evidence of mainland transmission since early 2004. 24
Torres Strait Mosquito Elimination Program
Th e mosquito Ae. albopictus , which is exotic to Australia, was found on the outer islands of Torres Strait in April 2005. 25 If this mosquito establishes in Australia it will increase the number and spread of mosquitoes capable of transmitting dengue and chikungunya as well as becoming a new serious pest mosquito. Since 2005, the Australian Gov-ernment has provided funding to Queensland Health towards a mosquito elimination program in the Torres Strait. Th e initial aim of the program was to eliminate Ae. albopictus from the Torres Strait islands. Th e development and implementa-tion of a program based on the ‘cordon sanitaire’ approach (a barrier designed to prevent a disease or other undesirable condition from spreading) around Th ursday and Horn islands was initiated in May 2008 in an attempt to prevent the spread of Ae. albopictus further south, following unsuc-cessful attempts to eliminate Ae. albopictus from the outer islands of the Torres Strait. 26 Multiple incursions of Ae. albopictus into the Torres Strait had likely occurred and resulted from human
activity or traffi c moving these mosquitoes around the Torres Strait. In May 2009, the Australian Government agreed to provide further funding to Queensland Health over 4 years, to continue support towards the Torres Strait Health Protec-tion Strategy mosquito program. 27 Th e focus of the program is surveillance and control of Ae. albopictus in the Torres Strait and prevention of the spread of Ae. albopictus from the Torres Strait to mainland Australia.
Enhancing emerging zoonotic disease surveillance data from animals
In light of worldwide animal and human health crises such as severe acute respiratory syndrome, the pandemic infl uenza (H1N1) 2009 and Nipah virus, the need for an interdisciplinary approach to emerging and re-emerging zoonoses is gaining signifi cant international recognition. Samples cur-rently collected in Australia from wildlife are only analysed for a limited number of diseases such as avian infl uenza or Newcastle disease.
Th e Australian Government Department of Agriculture, Fisheries and Forestry funded a pilot project in the 2008–2009 fi nancial year to determine how surveillance of zoonotic infections in animals can add to the understanding of the epidemiology of emerging zoonoses in humans, using MVEV as a model. Project partners, which refl ect the ‘One Health’ philosophy, include the Australian Government Department of Health and Ageing, the Australian Wildlife Health Network and Animal Health Australia.
Initial fi ndings of this report (which is to be published in Vector-Borne and Zoonotic Diseases ) support the use of chickens for surveillance, and also recommend the use of young cattle and horses for general MVEV surveillance. Eastern grey kan-garoos also showed a high prevalence of antibody to MVEV, making them a potential source for
Table 6: Overseas-ac quired malaria cases, Australia, 1 July 2008 to 30 June 2009, by country of acquisition and species
Country of acquisition Total Plasmodium speciesNot specifi ed Falciparum Vivax Other
Plasmodium species
Mixed Plasmodium
speciesPapua New Guinea 113 6 31 73 2 1India 34 1 0 33 0 0Indonesia 9 0 3 4 0 2Mozambique 7 0 7 0 0 0Other country 64 0 46 15 1 2Country not listed 340 16 144 153 19 8Total 567 23 231 278 22 13
CDI Vol 34 No 3 2010 237
National Arbovirus and Malaria Advisory Committee, 2008–09 Annual reports
monitoring outbreaks and retrospectively deter-mining the extent of an outbreak (personal com-munication: Australian Government Department of Agriculture, Fisheries and Forestry).
Discussion
Th is report summarises the surveillance of nation-ally notifi able mosquito-borne disease in Australia for 1 July 2008 to 30 June 2009. Of particular concern were the outbreaks of locally-acquired dengue infection in North Queensland and the occurrence of fatal human cases of MVEV infec-tion in the Northern Territory.
Australia experienced several outbreaks of locally-acquired dengue virus infections involving all 4 serotypes in Queensland from 1 July 2008 to 30 June 2009. It is important to rapidly diagnose the disease in returning residents and tourists to prevent local spread in North Queensland. Queensland health authorities are experienced in responding to outbreaks of the disease and imple-mented the Dengue Fever Management Plan. A major focus of the response was raising public awareness of the need to take responsibility for reducing mosquito breeding opportunities around homes, and for those people living in areas where dengue fever was known to occur to seek medical advice if feeling unwell. Control measures also included spraying known mosquito breeding sites with insecticide. People were encouraged to avoid dengue infection by taking measures to prevent mosquito bites. Th is included using insect repel-lent, wearing long sleeve clothing and reducing mosquito breeding sites by ensuring that pools and other receptacles of water are not available in and around the home.
Outbreaks of dengue in North Queensland are not unprecedented; in 2003–04 there were over 800 cases of locally-acquired dengue reported in Queensland and in 1998 nearly 500 cases of dengue serotype 2 were recorded. 10 By comparison, the 2008–09 outbreaks of all 4 serotypes aff ected several locations with over 1,000 dengue cases in a short period and represented the largest reported annual number of cases in recent times. 10,28 Much of the increase in overseas-acquired dengue virus infections over the past few years can be attributed to an increase in disease activity in the Asia–Pacifi c region. Th e World Health Organization has warned of a spreading threat of dengue outbreaks in the Asia–Pacifi c region. Th is threat has been recognised in the publication of a regional strategic plan. 29
Authorities are concerned that the more severe forms of the disease, DHF/DSS may eventu-ate as outbreaks of multiple serotypes of dengue
continue to occur in North Queensland. DHF/DSS may occur when a person, infected at some time in the past, becomes infected with a dif-ferent dengue serotype. As a result, NAMAC is considering the feasibility of the eradication of the Ae. aegypti mosquito from North Queensland.
Th e main way of preventing and controlling the further spread of dengue fever is to control the vector Ae. aegypti through environmental man-agement (e.g. eliminating larval habitats) and/or insecticide application. Mosquito control strate-gies will continue to evolve but must now take account of the recent drought conditions that has led to water storage vessels increasingly being used across Australia. If vessels such as water tanks are not mosquito ‘proof ’ then there is the potential for increased mosquito breeding and mosquito-borne diseases such as dengue. 30 Water tanks in Australia built to Australian standards and maintained to that standard will not allow mosquito breed-ing because of the mosquito proofi ng at access points. However, poorly maintained water tanks may quickly become a suitable site for mosquito breeding.
Malaria and dengue, although almost completely preventable, remain a signifi cant risk to travellers overseas despite warnings and other travel advice. Travellers continue to acquire malaria and dengue infections. Th e main way to minimise the risk of infection is to avoid being bitten by mosquitoes through the application of personal prevention measures. Travellers are encouraged to consider the information available on the Smartraveller travel health web site and to seek a doctor’s advice prior to travel.
MVEV activity in the sentinel chicken fl ocks in northern Western Australia and the Northern Territory both led to public health actions in the form of media releases to warn the public of potential infection and other prevention strate-gies. Th ese warnings started prior to the human cases of MVEV infection during the season and demonstrate that sentinel chicken surveillance provided public health authorities forewarning of virus activity.
Th e limitations of surveillance data used in this report are referred to in detailed notes on the interpretation of NNDSS, which are available in the 2008 NNDSS annual report. 1 A specifi c limitation of the data used in this report relates to the virological testing, which is required to distinguish alphavirus disease from other causes of arthritis. Th e alphavirus infections notifi ed to NNDSS each season are based on laboratory defi nitive evidence only and assumes a clinically compatible arthritic infection. A case can still be
238 CDI Vol 34 No 3 2010
Annual reports National Arbovirus and Malaria Advisory Committee, 2008–09
notifi ed when clinical illness may not be consist-ent with the diagnosis of alphavirus infection. Furthermore, false positive reactions are an issue in the serological diagnosis of some arboviral infections and cross-reacting IgM can occur, particularly with fl avivirus infections. Following some infections, particularly alphaviruses and fl aviviruses, IgM antibodies can persist for long periods and should be interpreted as presump-tive evidence of recent infection. 31 Th e Case Defi nitions Working Group of the Communi-cable Diseases Network Australia is reviewing this issue. Human surveillance for alphavirus infection enables local authorities to implement public health action and manage local disease outbreaks, but does not necessarily provide a reli-able indication of the true incidence of a disease.
Another limitation on the fi ndings of this report relates to place or country of acquisition of infec-tion. Th is information is currently not available for all notifi cations due to system limitations. Th e Northern Territory, Queensland, Victoria, and Tasmania are the jurisdictions able to provide place of acquisition details to NNDSS.
Surveillance and reporting systems for arbovirus disease and malaria encompassing humans and animals provides information to assist in the detection, management and control of real or potential outbreaks in Australia. Th e surveillance of these diseases contributes to the preparation for and prevention of outbreaks, implementation of response measures to control outbreaks, and enables NAMAC to provide advice on the strate-gic approaches for the management of arbovirus disease and malaria.
Acknowledgements
Th e National Arbovirus and Malaria Advisory Committee members are (in alphabetical order): Bart Currie, Peter Dagg, Peter Daniels, Jenny Firman, Gerard Fitzsimmons, Rogan Lee, Mike Lindsay, John Mackenzie, Rodney Moran, Scott Ritchie, Richard Russell, Christine Selvey, David Smith, Peter Whelan, Craig Williams. Jennifer Wall and Phil Wright (Secretariat).
We would also like to thank:
Alison Milton, Dougald Knuckey, Jennie Hood of the Offi ce of Health Protection, Australian Government Department of Health and Ageing
State and territory public health communicable disease surveillance managers
Sentinel reports were provided by:
Cheryl Johansen and technical staff of the Arbo-virus Surveillance and Research Laboratory and the Mosquito-Borne Disease Control Branch, Western Australian Department of Health
Th e New South Wales Arbovirus Surveillance and Mosquito Monitoring Program, Institute of Clini-cal Pathology and Medical Research, University of Sydney and Westmead Hospital
Peter Whelan of the Northern Territory Depart-ment of Health and Families, and Lorna Melville, Northern Territory Department of Primary Industry, Fisheries and Mines
Author details
Gerard J Fitzsimmons 1
Phil Wright 1
Cheryl A Johansen 2
Peter I Whelan 3
1. Zoonoses, Foodborne and Emerging Infectious Diseases, Office of Health Protection, Australian Government Department of Health and Ageing, CANBERRA, Australian Capital Territory
2. Arbovirus Surveillance and Research Laboratory, Discipline of Microbiology and Immunology, The University of Western Australia, Western Australia
3. Medical Entomology, Communicable Disease Control, Department of Health and Families, Northern Territory
Corresponding author: Mr Gerard Fitzsimmons, Zoonoses, Foodborne and Emerging Infectious Diseases, Office of Health Protection, Australian Government Department of Health and Ageing, GPO Box 9848, MDP 14, CANBERRA, ACT 2601. Telephone: +61 2 6289 2748. Facsimile: +61 2 6289 2500. Email: [email protected]
References
1. NNDSS Writing Group. Australia’s notifiable disease status, 2008: annual report of the National Notifiable Diseases Surveillance System. Commun Dis Intell 2010;34(3):157–224.
2. Russell RC, Dwyer DE. Arboviruses associated with human disease in Australia. Microbes Infect 2000;2(14):1693–1704.
3. Medical Entomology, Centre for Disease Control, Department of Health and Families, Northern Territory. Medical Entomology Annual Report 2008/09. Darwin: Department of Health and Families, Northern Territory; 2009.
CDI Vol 34 No 3 2010 239
National Arbovirus and Malaria Advisory Committee, 2008–09 Annual reports
4. Parida MM, Santhosh SR, Dash PK, Lakshmana Rao PV. Rapid and real-time assays for detection and quantification of chikungunya virus. Future Virol 2008;3(2):179–192.
5. Harrington S, Lindsay MD, Douglas A. Christmas Island and Cocos (Keeling) Islands, Indian Ocean: Mosquito fauna and mosquito-borne disease risk assessment and management recommendations. FINAL REPORT of investigations under taken in 2007–08: Public Health Division, Western Australian Department of Health; 2009.
6. van den Hurk AF, Hall-Mendelin S, Pyke AT, Smith GA, Mackenzie JS. Vector competence of Australian mosquitoes for chikungunya virus. Vector Borne Zoonotic Dis 2010;10(5):489–495.
7. National Health and Medical Research Council. The Australian Immunisation Handbook 9th edn. Canberra, Australia: Australian Government Department of Health and Ageing; 2008.
8. Hanna JN, Ritchie SA, Richards AR, Humphreys JL, Montgomery BL, Ehlers GJ, et al. Dengue in north Queensland, 2005–2008. Commun Dis Intell 2009;33(2):198–203.
9. Queensland Health. Dengue fever management plan for North Queensland 2005–2010. Cairns, Queensland: Tropical Public Health Unit Network, Queensland Health; 2005.
10. Hanna JN, Ritchie SA. Outbreaks of dengue in north Queensland, 1990–2008. Commun Dis Intell 2009;33(1):32–33.
11. Hanson JP, Taylor CT, Richards AR, Smith IL, Boutlis CS. Japanese encephalitis acquired near Port Moresby: implications for residents and travellers to Papua New Guinea. Med J Aust 2004;181(5):282–283.
12. Hanna JN, Ritchie SA, Phillips DA, Lee JM, Hills SL, van den Hurk AF, et al. Japanese encephalitis in north Queensland, Australia, 1998. Med J Aust 1999;170(11):533–536.
13. Broom AK, Azuolas J, Hueston L, Mackenzie JS, Melville L, Smith DW, et al. Australian encephalitis: Sentinel Chicken Surveillance Programme. Commun Dis Intell 2001;25(3):157–160.
14. Broom AK. Sentinel Chicken Surveillance Program in Australia, July 2002 to June 2003. Commun Dis Intell 2003;27(3):367–369.
15. Hall RA, Broom AK, Harnett AC, Howard MJ, Mackenzie JS. Immunodominant epitopes on the NS1 protein of MVE and KUN viruses serve as targets for a blocking ELISA to detect virus-specific antibodies in sentinel animal serum. J Virol Methods 1995;51:201–210.
16. Johansen C, Avery V, Cashen C, Power C, McFall S, Masters M, et al. The University of Western Australia Arbovirus Surveillance and Research Laboratory Annual Report: 2008–2009. Discipline of Microbiology and Immunology, The University of Western Australia; 2009.
17. Cordova SP, Smith DW, Broom AK, Lindsay MD, Dowse GK, Beers MY. Murray Valley encephalitis in Western Australia in 2000, with evidence of southerly spread. Commun Dis Intell 2000;24(12):368–372.
18. Dogget t S, Clancy J, Haniotis J, Webb C, Russell RC, Hueston L, et al. The New South Wales Arbovirus Surveillance and Mosquito Monitoring Program 2008–2009 Annual Report. Medical Entomology Department, Institute of Clinical Pathology and Medical Research, University of Sydney and Westmead Hospital; 2009.
19. Doggett S, Clancy J, Haniotis J, Russell R, Hueston L, Marchetti M, et al. The New South Wales Arbovirus Surveillance and Mosquito Monitoring Program 2003–2004 Annual Report. Medical Entomology Department, Institute of Clinical Pathology and Medical Research, University of Sydney and Westmead Hospital; 2004.
20. Heymann D, ed. Control of Communicable Diseases Manual . 18th edn. Washington: American Public Health Association; 2004.
21. Cox-Singh J, Davis TM, Lee KS, Shamsul SS, Matusop A, Ratnam S, et al. Plasmodium knowlesi malaria in humans is widely distributed and potentially life threatening. Clin Infect Dis 2008;46(2):165–171.
22. Hanna JN, Ritchie SA, Eisen DP, Cooper RD, Brookes DL, Montgomery BL. An outbreak o f P l a s m o d i u m v i v a x m a l a r i a i n Fa r Nor t h Queens land, 2002. Med J Aus t 2004;180(1):24–28.
23. Animal Health Australia. National Arbovirus Monitoring Program Annual Report 2008–2009. Canberra: Animal Health Australia; 2010.
24. Animal Health Australia. Animal Health in Australia 2008. Canberra, Animal Health Australia; 2009.
240 CDI Vol 34 No 3 2010
Annual reports National Arbovirus and Malaria Advisory Committee, 2008–09
25. Ritchie SA, Moore P, Carruthers M, Williams C, Montgomery B, Foley P, et al. Discovery of a widespread infestation of Aedes albopictus in the Torres Strait, Australia. J Amer Mosquito Control Assoc 2006;22(3):358–365.
26. Queensland Health. Aedes albopictus elimination program in the Torres Strait: Repor t for the period 1 July 2007–30 June 2008. Queensland, Australia: Queensland Health; 2009.
27. Australian Government Department of Health and Ageing. Portfolio budget statements 2009–10: Budget related paper No. 1.10; 2009.
28. Hanna JN, Ritchie SA, Hills SL, Pyke AT, Montgomery BL, Richards AR, et al. Dengue in north Queensland, 2002. Commun Dis Intell 2003;27(3):384–389.
29. Regional Office for South-East Asia and the Western Pacific World Health Organization. The Dengue Strategic Plan for the Asia Pacific Region, 2008–2015. Geneva: World Health Organization; 2008.
30. Beebe NW, Cooper RD, Mottram P, Sweeney AW. Aus tralia’s dengue r isk dr iven by human adaptation to climate change. PLoS Negl Trop Dis 2009;3(5):e429.
31. Public Health Laboratory Network. Alphavirus and flavivirus laboratory case definitions. 2001. Accessed on 11 June 2009. Available from: http://www.health.gov.au/internet/main/publishing.nsf/Content/cda-phlncd-flavivirus.htm
CDI Vol 34 No 3 2010 241
Immunisation coverage, 2008 Annual reports
IMMUNISATION COVERAGE ANNUAL REPORT, 2008 Brynley P Hull, Deepika Mahajan, Aditi Dey, Rob I Menzies, Peter B McIntyre
Abstract
This, the 2nd annual immunisation coverage report, documents trends during 2008 for a range of standard measures derived from Australian Childhood Immunisation Register data, including overall coverage at standard age milestones and for individual vaccines included on the National Immunisation Program (NIP). Coverage by indig-enous status and mapping by smaller geographic areas as well as trends in timeliness are also sum-marised according to standard templates. With respect to overall coverage, Immunise Australia Program targets have been reached for children at 12 and 24 months of age but not for children at 5 years of age. Coverage at 24 months of age exceeds that at 12 months of age, but as receipt of varicella vaccine at 18 months is excluded from calculations of ‘fully immunised’ this probably represents delayed immunisation, with some con-tribution from immunisation incentives. Similarly, the decrease in coverage estimates for immunisa-tions due at 4 years of age from March 2008, is primarily due to changing the assessment age from 6 years to 5 years of age from December 2007. A number of individual vaccines on the NIP are not currently assessed for ‘fully immunised’ status or for eligibility for incentive payments. These include pneumococcal conjugate and meningococcal C conjugate vaccines for which coverage is com-parable to vaccines which are assessed for ‘fully immunised’ status, and rotavirus and varicella vaccines for which coverage is lower. Coverage is also suboptimal for vaccines recommended for Indigenous children only (i.e. hepatitis A and pneu-mococcal polysaccharide vaccine) as previously reported for other vaccines for both children and adults. Delayed receipt of vaccines is an important issue for vaccines recommended for Indigenous children and has not improved among non-Indig-enous children despite improvements in coverage at the 24-month milestone. Although Indigenous children in Australia have coverage levels that are similar to non-Indigenous children at 24 months of age, the disparity in delayed vaccination between Indigenous and non-Indigenous children, which is up to 18% for the 3rd dose of DTP, remains a chal-lenge. Commun Dis Intell 2010;34(3):241–258.
Keywords: immunisation coverage, immunisation delay, small area coverage reporting
Introduction
Th is is the 2nd annual Australian Childhood Immunisation Register (ACIR) coverage report. Th is series of annual reports was established to consolidate the various forms of regular cover-age reports and ad-hoc publications produced by the National Centre for Immunisation Research and Surveillance using ACIR data, highlighting important trends and signifi cant issues over the preceding 12 months. 1–13 It follows the format of the 1st report, providing a detailed summary for 2008 that includes vaccination coverage at standard milestone ages, coverage for vaccines not included in standard coverage assessments, timeliness of vaccination, coverage for Indigenous children, and data for small geographic areas on vaccination coverage and prevalence of conscien-tious objectors. Readers are referred to the 1st report for a more detailed explanation of the background to this series of annual reports and the range of analyses presented. 14
Th is report uses the long-standing international practice of reporting coverage at key milestone ages, to measure coverage against national targets and to track trends over time. Th e fi rst 2 milestones are unchanged since the previous report (12 months for vaccines due at 6 months and 24 months for vaccines due at 12 months). However, from the beginning of 2008, assess-ment of the oldest milestone (for vaccines due at 4 years) was changed from 6 years to 5 years. 15 N o new vaccines were introduced to the National Immunisation Program (NIP) during 2008, however, this report does include the 1st full year of coverage data for rotavirus vaccine, which was introduced in 2007.
Incentives for vaccination and reporting to the Australian Childhood Immunisation Register
Th ere were important recent changes to the payment of incentives to providers and carers, which had potential impacts on reported cover-age. Th e Australian Government, through the Department of Health and Ageing, advises the ACIR on whether calculation of coverage of the new vaccines/antigens should be included in the completed schedule assessment for eligibility for payments to parents or immunisation providers. In 2008, the ACIR made information payments (up
Immunisation coverage, 2008
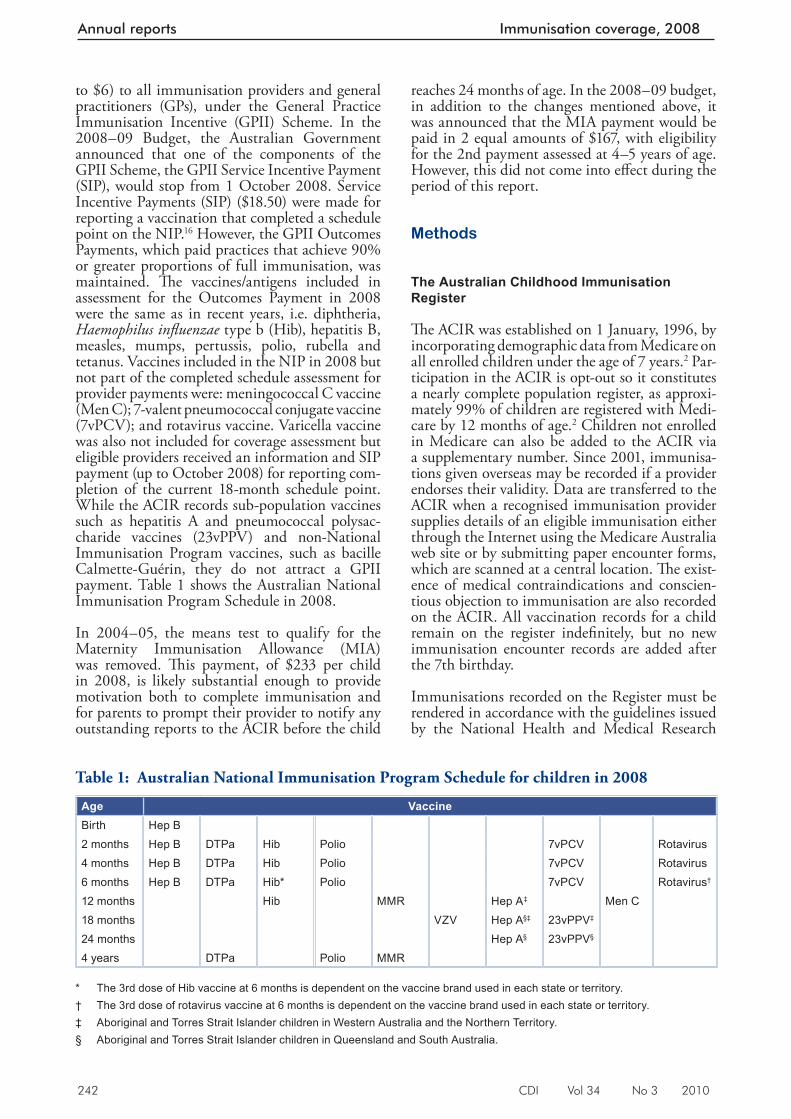
242 CDI Vol 34 No 3 2010
Annual reports Immunisation coverage, 2008
to $6) to all immunisation providers and general practitioners (GPs), under the General Practice Immunisation Incentive (GPII) Scheme. In the 2008–09 Budget, the Australian Government announced that one of the components of the GPII Scheme, the GPII Service Incentive Payment (SIP), would stop from 1 October 2008. Service Incentive Payments (SIP) ($18.50) were made for reporting a vaccination that completed a schedule point on the NIP. 16 However, the GPII Outcomes Payments, which paid practices that achieve 90% or greater proportions of full immunisation, was maintained. Th e vaccines/antigens included in assessment for the Outcomes Payment in 2008 were the same as in recent years, i.e. diphtheria, Haemophilus infl uenzae type b (Hib), hepatitis B, measles, mumps, pertussis, polio, rubella and tetanus. Vaccines included in the NIP in 2008 but not part of the completed schedule assessment for provider payments were: meningococcal C vaccine (Men C); 7-valent pneumococcal conjugate vaccine (7vPCV); and rotavirus vaccine. Varicella vaccine was also not included for coverage assessment but eligible providers received an information and SIP payment (up to October 2008) for reporting com-pletion of the current 18-month schedule point. While the ACIR records sub-population vaccines such as hepatitis A and pneumococcal polysac-charide vaccines (23vPPV) and non-National Immunisation Program vaccines, such as bacille Calmette-Guérin, they do not attract a GPII payment. Table 1 shows the Australian National Immunisation Program Schedule in 2008.
In 2004–05, the means test to qualify for the Maternity Immunisation Allowance (MIA) was removed. Th is payment, of $233 per child in 2008, is likely substantial enough to provide motivation both to complete immunisation and for parents to prompt their provider to notify any outstanding reports to the ACIR before the child
reaches 24 months of age. In the 2008–09 budget, in addition to the changes mentioned above, it was announced that the MIA payment would be paid in 2 equal amounts of $167, with eligibility for the 2nd payment assessed at 4–5 years of age. However, this did not come into eff ect during the period of this report.
Methods
The Australian Childhood Immunisation Register
Th e ACIR was established on 1 January, 1996, by incorporating demographic data from Medicare on all enrolled children under the age of 7 years. 2 Par-ticipation in the ACIR is opt-out so it constitutes a nearly complete population register, as approxi-mately 99% of children are registered with Medi-care by 12 months of age. 2 Children not enrolled in Medicare can also be added to the ACIR via a supplementary number. Since 2001, immunisa-tions given overseas may be recorded if a provider endorses their validity. Data are transferred to the ACIR when a recognised immunisation provider supplies details of an eligible immunisation either through the Internet using the Medicare Australia web site or by submitting paper encounter forms, which are scanned at a central location. Th e exist-ence of medical contraindications and conscien-tious objection to immunisation are also recorded on the ACIR. All vaccination records for a child remain on the register indefi nitely, but no new immunisation encounter records are added after the 7th birthday.
Immunisations recorded on the Register must be rendered in accordance with the guidelines issued by the National Health and Medical Research
Table 1: Australian National Immunisation Program Schedule for children in 2008
Age VaccineBirth Hep B2 months Hep B DTPa Hib Polio 7vPCV Rotavirus4 months Hep B DTPa Hib Polio 7vPCV Rotavirus6 months Hep B DTPa Hib* Polio 7vPCV Rotavirus†
12 months Hib MMR Hep A‡ Men C18 months VZV Hep A§‡ 23vPPV‡
24 months Hep A§ 23vPPV§
4 years DTPa Polio MMR * The 3rd dose of Hib vaccine at 6 months is dependent on the vaccine brand used in each state or territory. † The 3rd dose of rotavirus vaccine at 6 months is dependent on the vaccine brand used in each state or territory. ‡ Aboriginal and Torres Strait Islander children in Western Australia and the Northern Territory. § Aboriginal and Torres Strait Islander children in Queensland and South Australia.
CDI Vol 34 No 3 2010 243
Immunisation coverage, 2008 Annual reports
Council as stated in Th e Australian Immunisation Handbook . 17 Notifi cations falling outside these guidelines or duplicate notifi cations prompt an enquiry with the provider, and if their validity cannot be established they are rejected.
Measuring immunisation coverage using the Australian Childhood Immunisation Register
Th e cohort method has been used for calculating coverage at the population level (national and state or territory) 18 since the ACIR’s inception. Cohort immunisation status is assessed at 12 months of age (for vaccines due at 6 months), 24 months of age (for vaccines due at 12 months), and 5 years of age (for vaccines due at 4 years). A minimum 3-month lag period is allowed for late notifi ca-tion of immunisations to the Register, but only immunisations given on or before a child’s 1st, 2nd or 5th respective birthdays are considered. 18 If a child’s records indicate receipt of the last dose of a vaccine that requires more than 1 dose to complete the series, it is assumed that earlier vaccinations in the sequence have been given. Th is assumption has been shown to be valid. 4,5
Th ree-month birth cohorts are used for time trend analyses, and 12-month cohorts used for other analyses in this report. Th ese cohorts are children born between 1 January and 31 December 2007 for the 12-month milestone age; children born between 1 January and 31 December 2006 for the 24-month milestone age; and children born between 1 January and 31 December 2003 for the 5-year (60-month) milestone age.
Th e proportion of children designated as ‘fully immunised’ is calculated using the number of Medicare-registered children completely immunised with the vaccines of interest by the designated age as the numerator, and the total number of Medicare-registered children in the age cohort as the denominator. ‘Fully immu-nised’ at 12 months of age is defi ned as a child having a record on the ACIR of a 3rd dose of a diph theria (D), tetanus (T) and pertussis-con-taining (P) vaccine; a 3rd dose of polio vaccine; 2 or 3 doses of PRP-OMP containing Hib vaccine or 3 doses of any other Hib vaccine; and 2 or 3 doses of Comvax hepatitis B vaccine or 3 doses of any other hepatitis B vaccines. ‘Fully immunised’ at 24 months of age is defi ned as a child having a record on the ACIR of a 3rd dose of a DTP-containing vaccine; a 3rd dose of polio vaccine; 3 or 4 doses of PRP-OMP containing Hib vaccine or 4 doses of any other Hib vaccine; 3 or 4 doses of Comvax hepati-tis B vaccine or 4 doses of any other hepatitis B vaccines; and the 1st dose of a measles, mumps
and rubella-containing (MMR) vaccine. ‘Fully immunised’ at 5 years of age is defi ned as a child having a record on the ACIR of a 4th or 5th dose of a DTP-containing vaccine; a 4th dose of polio vaccine; and a 2nd dose of an MMR-containing vaccine.
Immunisation coverage estimates were also cal-culated for individual NIP vaccines, including the 6 NIP vaccines not routinely reported in Communicable Diseases Intelligence (CDI). Th ey were: a 3rd dose of 7vPCV and 2nd or 3rd dose of rotavirus vaccine by 12 months of age; the 1st dose of varicella vaccine and the 1st dose of meningococcal C vaccine by 24 months of age; a 2nd dose of hepatitis A vaccine in Indigenous children by 30 months of age; and the 1st dose of 23-valent pneumococcal polysaccharide vaccine in Indigenous children by 36 months of age.
Timeliness
Age-appropriate immunisation was defi ned as receipt of a scheduled vaccine dose within 30 days of the recommended age. For example, a child who received the 1 st dose of DTP (due at 60 days of age) when he or she was more than 90 days of age, was classifi ed as not age-appropriately immunised (i.e. late for the dose). For descriptive purposes, we categorised the outcome measure for each dose as either vaccines received ’too early’ (greater than 30 days prior to when it was due), vaccine received ‘acceptably early’ (within 30 days prior to when it was due), ‘no delay’ (age-appropriately immunised), ‘delay of between 1 to 6 months’, ‘delay greater than 6 months’, or vaccine dose ‘not recorded’. However, we have only reported on the 2 ‘delay’ categories within this report. All children included in the analysis were at least 36 months of age when the data were extracted and, therefore, old enough to potentially experience delays in immunisation greater than 6 months for immunisation due by 24 months of age or earlier. Th e interval between doses was not evaluated. Timeliness of diff erent vaccines and doses was also compared by plotting the cumulative percentage receiving each vaccine dose by age, with the proportion ever immunised set as 100%.
Remoteness status
Th e area of residence of children was defi ned as accessible or remote using the Accessibility/Remoteness Index of Australia (ARIA), which was developed by the Department of Health and Aged Care, and proposed as the national standard measure of remoteness for inclusion in the Austral-ian Bureau of Statistics (ABS) 2001 census. 19 We defi ne the 2 ARIA categories with most restricted
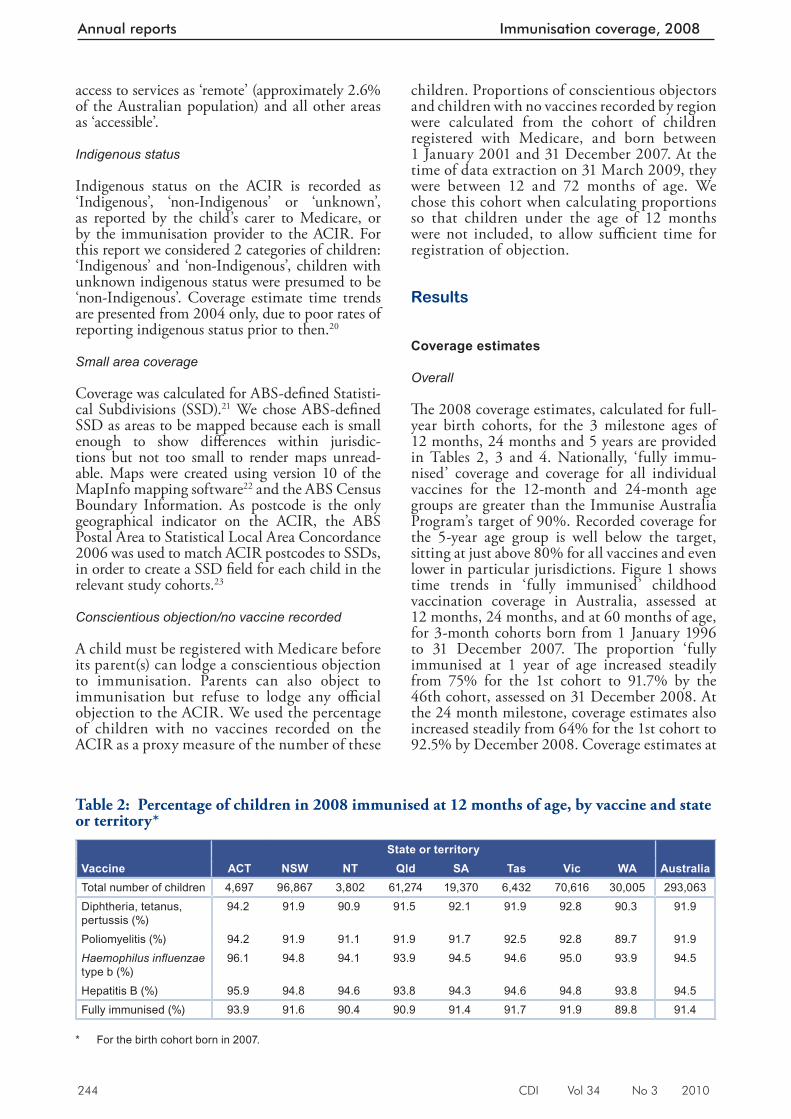
244 CDI Vol 34 No 3 2010
Annual reports Immunisation coverage, 2008
access to services as ‘remote’ (approximately 2.6% of the Australian population) and all other areas as ‘accessible’.
Indigenous status
Indigenous status on the ACIR is recorded as ‘Indigenous’, ‘non-Indigenous’ or ‘unknown’, as reported by the child’s carer to Medicare, or by the immunisation provider to the ACIR. For this report we considered 2 categories of children: ‘Indigenous’ and ‘non-Indigenous’, children with unknown indigenous status were presumed to be ‘non-Indigenous’. Coverage estimate time trends are presented from 2004 only, due to poor rates of reporting indigenous status prior to then. 20
Small area coverage
Coverage was calculated for ABS-defi ned Statisti-cal Subdivisions (SSD). 21 We chose ABS-defi ned SSD as areas to be mapped because each is small enough to show diff erences within jurisdic-tions but not too small to render maps unread-able. Maps were created using version 10 of the MapInfo mapping software 22 and the ABS Census Boundary Information. As postcode is the only geographical indicator on the ACIR, the ABS Postal Area to Statistical Local Area Concordance 2006 was used to match ACIR postcodes to SSDs, in order to create a SSD fi eld for each child in the relevant study cohorts. 23
Conscientious objection/no vaccine recorded
A child must be registered with Medicare before its parent(s) can lodge a conscientious objection to immunisation. Parents can also object to immunisation but refuse to lodge any offi cial objection to the ACIR. We used the percentage of children with no vaccines recorded on the ACIR as a proxy measure of the number of these
children. Proportions of conscientious objectors and children with no vaccines recorded by region were calculated from the cohort of children registered with Medicare, and born between 1 January 2001 and 31 December 2007. At the time of data extraction on 31 March 2009, they were between 12 and 72 months of age. We chose this cohort when calculating proportions so that children under the age of 12 months were not included, to allow suffi cient time for registration of objection.
Results
Coverage estimates
Overall
Th e 2008 coverage estimates, calculated for full-year birth cohorts, for the 3 milestone ages of 12 months, 24 months and 5 years are provided in Tables 2, 3 and 4. Nationally, ‘fully immu-nised’ coverage and coverage for all individual vaccines for the 12-month and 24-month age groups are greater than the Immunise Australia Program’s target of 90%. Recorded coverage for the 5-year age group is well below the target, sitting at just above 80% for all vaccines and even lower in particular jurisdictions. Figure 1 shows time trends in ‘fully immunised’ childhood vaccination coverage in Australia, assessed at 12 months, 24 months, and at 60 months of age, for 3-month cohorts born from 1 January 1996 to 31 December 2007. Th e proportion ‘fully immunised at 1 year of age increased steadily from 75% for the 1st cohort to 91.7% by the 46th cohort, assessed on 31 December 2008. At the 24 month milestone, coverage estimates also increased steadily from 64% for the 1st cohort to 92.5% by December 2008. Coverage estimates at
Table 2: Percentage of children in 2008 immunised at 12 months of age, by vaccine and state or territory*
State or territoryVaccine ACT NSW NT Qld SA Tas Vic WA AustraliaTotal number of children 4,697 96,867 3,802 61,274 19,370 6,432 70,616 30,005 293,063Diphtheria, tetanus, pertussis (%)
94.2 91.9 90.9 91.5 92.1 91.9 92.8 90.3 91.9
Poliomyelitis (%) 94.2 91.9 91.1 91.9 91.7 92.5 92.8 89.7 91.9Haemophilus infl uenzae type b (%)
96.1 94.8 94.1 93.9 94.5 94.6 95.0 93.9 94.5
Hepatitis B (%) 95.9 94.8 94.6 93.8 94.3 94.6 94.8 93.8 94.5Fully immunised (%) 93.9 91.6 90.4 90.9 91.4 91.7 91.9 89.8 91.4
* For the birth cohort born in 2007.
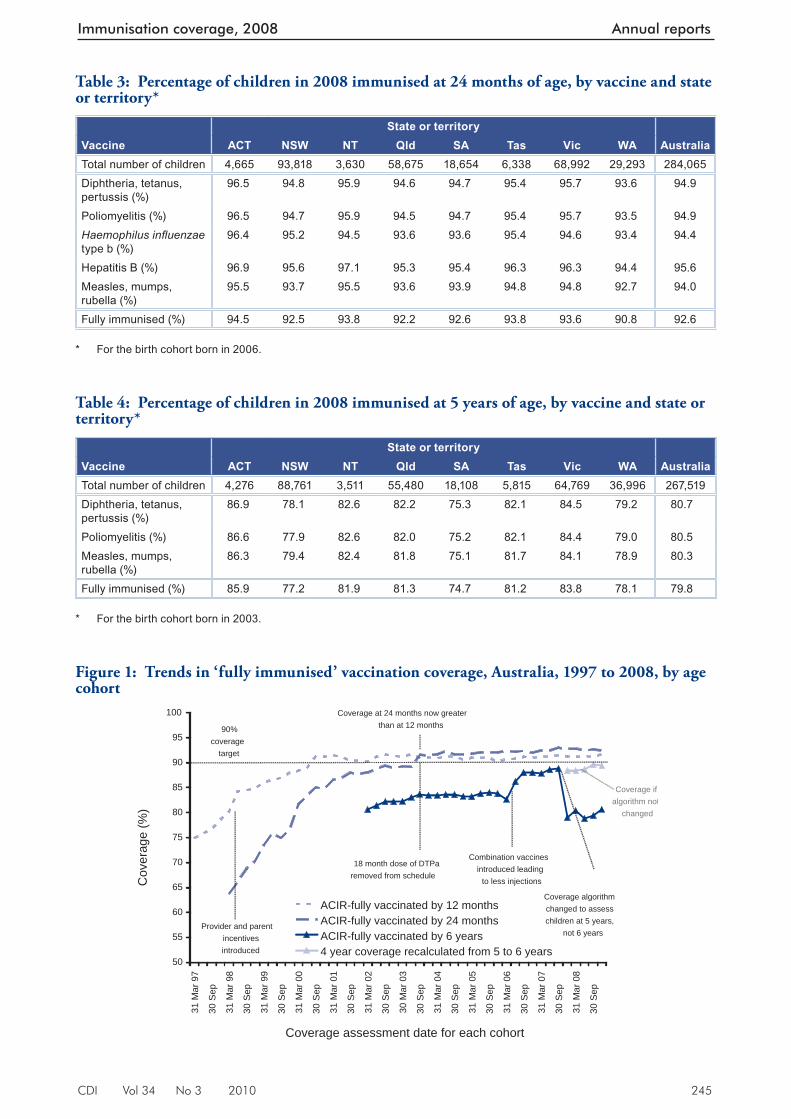
CDI Vol 34 No 3 2010 245
Immunisation coverage, 2008 Annual reports
Table 3: Percentage of children in 2008 immunised at 24 months of age, by vaccine and state or territory*
State or territory Vaccine ACT NSW NT Qld SA Tas Vic WA AustraliaTotal number of children 4,665 93,818 3,630 58,675 18,654 6,338 68,992 29,293 284,065Diphtheria, tetanus, pertussis (%)
96.5 94.8 95.9 94.6 94.7 95.4 95.7 93.6 94.9
Poliomyelitis (%) 96.5 94.7 95.9 94.5 94.7 95.4 95.7 93.5 94.9Haemophilus infl uenzae type b (%)
96.4 95.2 94.5 93.6 93.6 95.4 94.6 93.4 94.4
Hepatitis B (%) 96.9 95.6 97.1 95.3 95.4 96.3 96.3 94.4 95.6Measles, mumps, rubella (%)
95.5 93.7 95.5 93.6 93.9 94.8 94.8 92.7 94.0
Fully immunised (%) 94.5 92.5 93.8 92.2 92.6 93.8 93.6 90.8 92.6 * For the birth cohort born in 2006.
Table 4: Percentage of children in 2008 immunised at 5 years of age, by vaccine and state or territory *
State or territory Vaccine ACT NSW NT Qld SA Tas Vic WA AustraliaTotal number of children 4,276 88,761 3,511 55,480 18,108 5,815 64,769 36,996 267,519Diphtheria, tetanus, pertussis (%)
86.9 78.1 82.6 82.2 75.3 82.1 84.5 79.2 80.7
Poliomyelitis (%) 86.6 77.9 82.6 82.0 75.2 82.1 84.4 79.0 80.5Measles, mumps, rubella (%)
86.3 79.4 82.4 81.8 75.1 81.7 84.1 78.9 80.3
Fully immunised (%) 85.9 77.2 81.9 81.3 74.7 81.2 83.8 78.1 79.8 * For the birth cohort born in 2003.
Figure 1: Trends in ‘fully immunised’ vaccination coverage, Australia, 1997 to 2008, by age cohort
50
55
60
65
70
75
80
85
90
95
100
31 M
ar 9
7
30 S
ep
31 M
ar 9
8
30 S
ep
31 M
ar 9
9
30 S
ep
31 M
ar 0
0
30 S
ep
31 M
ar 0
1
30 S
ep
31 M
ar 0
2
30 S
ep
30 M
ar 0
3
30 S
ep
31 M
ar 0
4
30 S
ep
31 M
ar 0
5
30 S
ep
31 M
ar 0
6
30 S
ep
31 M
ar 0
7
30 S
ep
31 M
ar 0
8
30 S
ep
Coverage assessment date for each cohort
Cov
erag
e (%
)
ACIR-fully vaccinated by 12 monthsACIR-fully vaccinated by 24 monthsACIR-fully vaccinated by 6 years4 year coverage recalculated from 5 to 6 years
90%coverage
target
Provider and parentincentives introduced
18 month dose of DTParemoved from schedule
Coverage at 24 months now greater than at 12 months
Combination vaccinesintroduced leading to less injections
Coverage algorithm changed to assess children at 5 years,
not 6 years
Coverage if algorithm not
changed
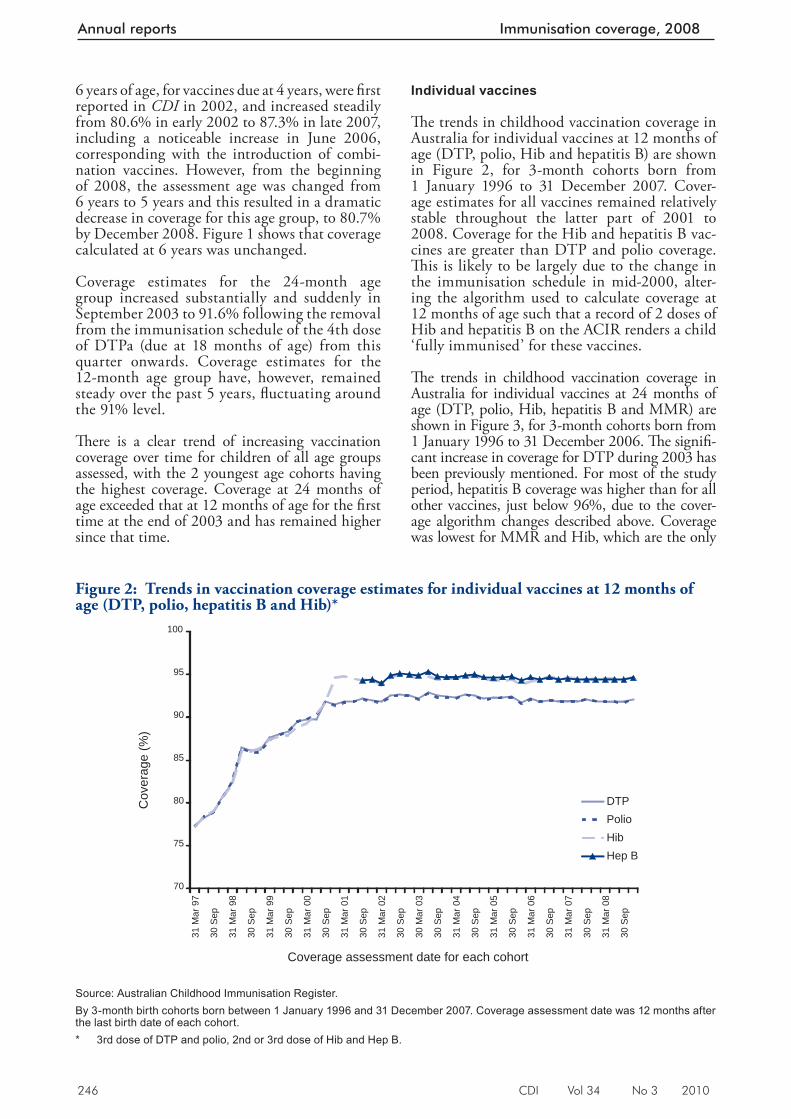
246 CDI Vol 34 No 3 2010
Annual reports Immunisation coverage, 2008
Figure 2: Trends in vaccination coverage estimates for individual vaccines at 12 months of age (DTP, polio, hepatitis B and Hib)*
70
75
80
85
90
95
100
31 M
ar 9
7
30 S
ep
31 M
ar 9
8
30 S
ep
31 M
ar 9
9
30 S
ep
31 M
ar 0
0
30 S
ep
31 M
ar 0
1
30 S
ep
31 M
ar 0
2
30 S
ep
30 M
ar 0
3
30 S
ep
31 M
ar 0
4
30 S
ep
31 M
ar 0
5
30 S
ep
31 M
ar 0
6
30 S
ep
31 M
ar 0
7
30 S
ep
31 M
ar 0
8
30 S
ep
Coverage assessment date for each cohort
Cov
erag
e (%
)
DTPPolioHibHep B
Source: Australian Childhood Immunisation Register. By 3-month birth cohorts born between 1 January 1996 and 31 December 2007. Coverage assessment date was 12 months after the last birth date of each cohort. * 3rd dose of DTP and polio, 2nd or 3rd dose of Hib and Hep B.
Individual vaccines
Th e trends in childhood vaccination coverage in Australia for individual vaccines at 12 months of age (DTP, polio, Hib and hepatitis B) are shown in Figure 2, for 3-month cohorts born from 1 January 1996 to 31 December 2007. Cover-age estimates for all vaccines remained relatively stable throughout the latter part of 2001 to 2008. Coverage for the Hib and hepatitis B vac-cines are greater than DTP and polio coverage. Th is is likely to be largely due to the change in the immunisation schedule in mid-2000, alter-ing the algorithm used to calculate coverage at 12 months of age such that a record of 2 doses of Hib and hepatitis B on the ACIR renders a child ‘fully immunised’ for these vaccines.
Th e trends in childhood vaccination coverage in Australia for individual vaccines at 24 months of age (DTP, polio, Hib, hepatitis B and MMR) are shown in Figure 3, for 3-month cohorts born from 1 January 1996 to 31 December 2006. Th e signifi -cant increase in coverage for DTP during 2003 has been previously mentioned. For most of the study period, hepatitis B coverage was higher than for all other vaccines, just below 96%, due to the cover-age algorithm changes described above. Coverage was lowest for MMR and Hib, which are the only
6 years of age, for vaccines due at 4 years, were fi rst reported in CDI in 2002, and increased steadily from 80.6% in early 2002 to 87.3% in late 2007, including a noticeable increase in June 2006, corresponding with the introduction of combi-nation vaccines. However, from the beginning of 2008, the assessment age was changed from 6 years to 5 years and this resulted in a dramatic decrease in coverage for this age group, to 80.7% by December 2008. Figure 1 shows that coverage calculated at 6 years was unchanged.
Coverage estimates for the 24-month age group increased substantially and suddenly in September 2003 to 91.6% following the removal from the immunisation schedule of the 4th dose of DTPa (due at 18 months of age) from this quarter onwards. Coverage estimates for the 12-month age group have, however, remained steady over the past 5 years, fl uctuating around the 91% level.
Th ere is a clear trend of increasing vaccination coverage over time for children of all age groups assessed, with the 2 youngest age cohorts having the highest coverage. Coverage at 24 months of age exceeded that at 12 months of age for the fi rst time at the end of 2003 and has remained higher since that time.
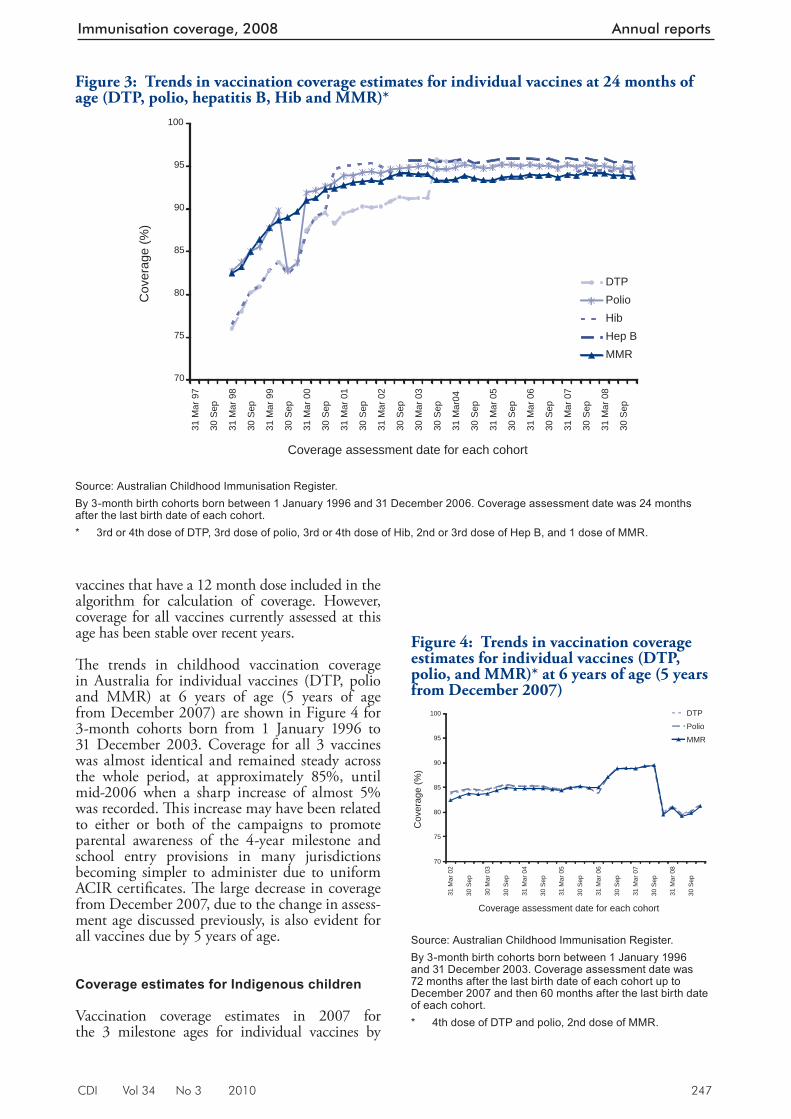
CDI Vol 34 No 3 2010 247
Immunisation coverage, 2008 Annual reports
Figure 3: Trends in vaccination coverage estimates for individual vaccines at 24 months of age (DTP, polio, hepatitis B, Hib and MMR)*
70
75
80
85
90
95
100
31 M
ar 9
7
30 S
ep
31 M
ar 9
8
30 S
ep
31 M
ar 9
9
30 S
ep
31 M
ar 0
0
30 S
ep
31 M
ar 0
1
30 S
ep
31 M
ar 0
2
30 S
ep
30 M
ar 0
3
30 S
ep
31 M
ar04
30 S
ep
31 M
ar 0
5
30 S
ep
31 M
ar 0
6
30 S
ep
31 M
ar 0
7
30 S
ep
31 M
ar 0
8
30 S
ep
Coverage assessment date for each cohort
Cov
erag
e (%
)
DTPPolioHibHep BMMR
Source: Australian Childhood Immunisation Register. By 3-month birth cohorts born between 1 January 1996 and 31 December 2006. Coverage assessment date was 24 months after the last birth date of each cohort. * 3rd or 4th dose of DTP, 3rd dose of polio, 3rd or 4th dose of Hib, 2nd or 3rd dose of Hep B, and 1 dose of MMR.
Figure 4: Trends in vaccination coverage estimates for individual vaccines (DTP, polio, and MMR)* at 6 years of age (5 years from December 2007)
70
75
80
85
90
95
100
31 M
ar 0
2
30 S
ep
30 M
ar 0
3
30 S
ep
31 M
ar 0
4
30 S
ep
31 M
ar 0
5
30 S
ep
31 M
ar 0
6
30 S
ep
31 M
ar 0
7
30 S
ep
31 M
ar 0
8
30 S
ep
Coverage assessment date for each cohort
Cov
erag
e (%
)
DTP
Polio
MMR
Source: Australian Childhood Immunisation Register. By 3-month birth cohorts born between 1 January 1996 and 31 December 2003. Coverage assessment date was 72 months after the last birth date of each cohort up to December 2007 and then 60 months after the last birth date of each cohort. * 4th dose of DTP and polio, 2nd dose of MMR.
vaccines that have a 12 month dose included in the algorithm for calculation of coverage. However, coverage for all vaccines currently assessed at this age has been stable over recent years.
Th e trends in childhood vaccination coverage in Australia for individual vaccines (DTP, polio and MMR) at 6 years of age (5 years of age from December 2007) are shown in Figure 4 for 3-month cohorts born from 1 January 1996 to 31 December 2003. Coverage for all 3 vaccines was almost identical and remained steady across the whole period, at approximately 85%, until mid-2006 when a sharp increase of almost 5% was recorded. Th is increase may have been related to either or both of the campaigns to promote parental awareness of the 4-year milestone and school entry provisions in many jurisdictions becoming simpler to administer due to uniform ACIR certifi cates. Th e large decrease in coverage from December 2007, due to the change in assess-ment age discussed previously, is also evident for all vaccines due by 5 years of age.
Coverage estimates for Indigenous children
Vaccination coverage estimates in 2007 for the 3 milestone ages for individual vaccines by
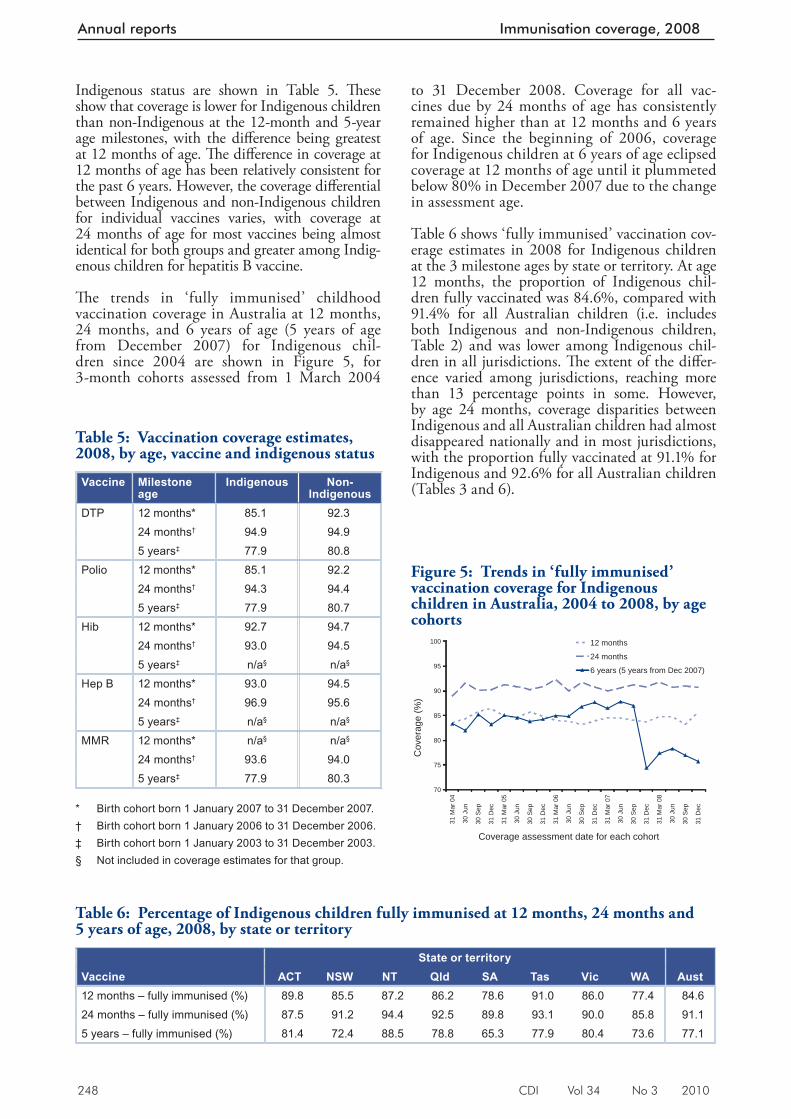
248 CDI Vol 34 No 3 2010
Annual reports Immunisation coverage, 2008
to 31 December 2008. Coverage for all vac-cines due by 24 months of age has consistently remained higher than at 12 months and 6 years of age. Since the beginning of 2006, coverage for Indigenous children at 6 years of age eclipsed coverage at 12 months of age until it plummeted below 80% in December 2007 due to the change in assessment age.
Table 6 shows ‘fully immunised’ vaccination cov-erage estimates in 2008 for Indigenous children at the 3 milestone ages by state or territory. At age 12 months, the proportion of Indigenous chil-dren fully vaccinated was 84.6%, compared with 91.4% for all Australian children (i.e. includes both Indigenous and non-Indigenous children, Table 2) and was lower among Indigenous chil-dren in all jurisdictions. Th e extent of the diff er-ence varied among jurisdictions, reaching more than 13 percentage points in some. However, by age 24 months, coverage disparities between Indigenous and all Australian children had almost disappeared nationally and in most jurisdictions, with the proportion fully vaccinated at 91.1% for Indigenous and 92.6% for all Australian children (Tables 3 and 6).
Indigenous status are shown in Table 5. Th ese show that coverage is lower for Indigenous children than non-Indigenous at the 12-month and 5-year age milestones, with the diff erence being greatest at 12 months of age. Th e diff erence in coverage at 12 months of age has been relatively consistent for the past 6 years. However, the coverage diff erential between Indigenous and non-Indigenous children for individual vaccines varies, with coverage at 24 months of age for most vaccines being almost identical for both groups and greater among Indig-enous children for hepatitis B vaccine.
Th e trends in ‘fully immunised’ childhood vaccin ation coverage in Australia at 12 months, 24 months, and 6 years of age (5 years of age from December 2007) for Indigenous chil-dren since 2004 are shown in Figure 5, for 3-month cohorts assessed from 1 March 2004
Table 6: Percentage of Indigenous children fully immunised at 12 months, 24 months and 5 years of age, 2008, by state or territory
State or territory Vaccine ACT NSW NT Qld SA Tas Vic WA Aust12 months – fully immunised (%) 89.8 85.5 87.2 86.2 78.6 91.0 86.0 77.4 84.624 months – fully immunised (%) 87.5 91.2 94.4 92.5 89.8 93.1 90.0 85.8 91.15 years – fully immunised (%) 81.4 72.4 88.5 78.8 65.3 77.9 80.4 73.6 77.1
Table 5: Vaccination coverage estimates, 2008, by age, vaccine and indigenous status
Vaccine Milestone age
Indigenous Non-Indigenous
DTP 12 months* 85.1 92.324 months† 94.9 94.95 years‡ 77.9 80.8
Polio 12 months* 85.1 92.224 months† 94.3 94.45 years‡ 77.9 80.7
Hib 12 months* 92.7 94.724 months† 93.0 94.55 years‡ n/a§ n/a§
Hep B 12 months* 93.0 94.524 months† 96.9 95.65 years‡ n/a§ n/a§
MMR 12 months* n/a§ n/a§
24 months† 93.6 94.05 years‡ 77.9 80.3
* Birth cohort born 1 January 2007 to 31 December 2007. † Birth cohort born 1 January 2006 to 31 December 2006. ‡ Birth cohort born 1 January 2003 to 31 December 2003. § Not included in coverage estimates for that group.
Figure 5: Trends in ‘fully immunised’ vaccination coverage for Indigenous children in Australia, 2004 to 2008, by age cohorts
70
75
80
85
90
95
100
31 M
ar 0
4
30 J
un
30 S
ep
31 D
ec
31 M
ar 0
5
30 J
un
30 S
ep
31 D
ec
31 M
ar 0
6
30 J
un
30 S
ep
31 D
ec
31 M
ar 0
7
30 J
un
30 S
ep
31 D
ec
31 M
ar 0
8
30 J
un
30 S
ep
31 D
ec
Coverage assessment date for each cohort
Cov
erag
e (%
)
12 months
24 months
6 years (5 years from Dec 2007)
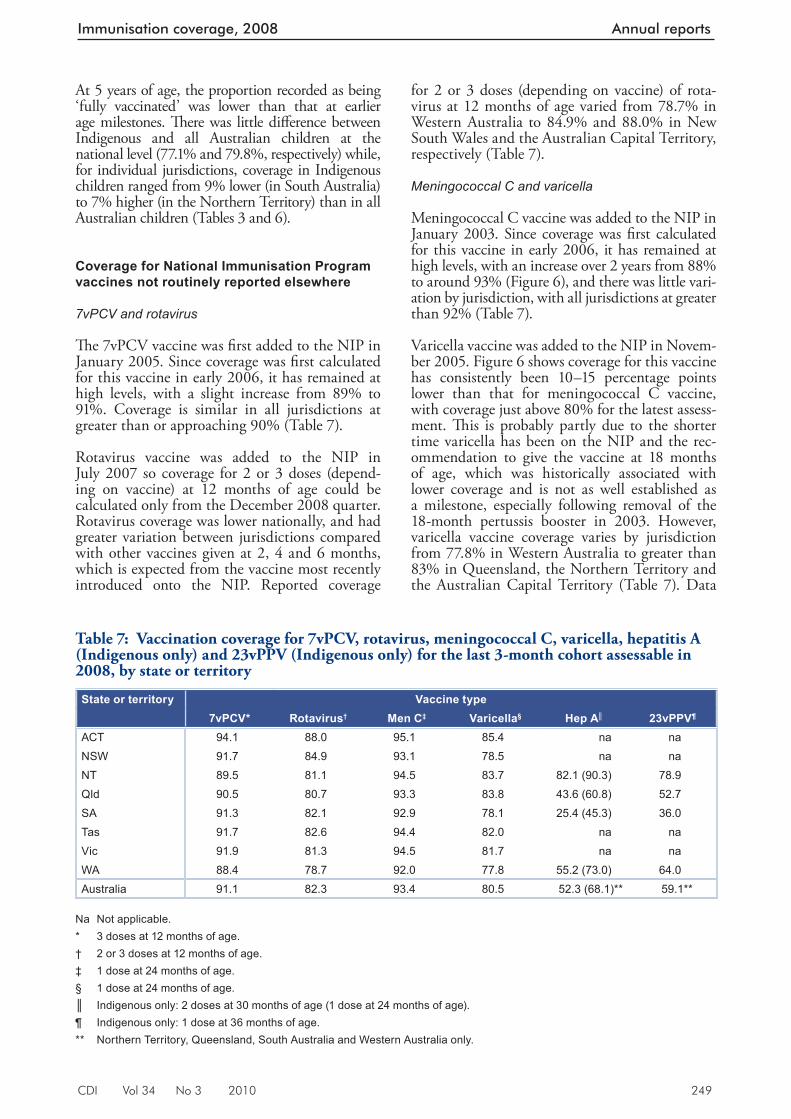
CDI Vol 34 No 3 2010 249
Immunisation coverage, 2008 Annual reports
At 5 years of age, the proportion recorded as being ‘fully vaccinated’ was lower than that at earlier age milestones. Th ere was little diff erence between Indigenous and all Australian children at the national level (77.1% and 79.8%, respectively) while, for individual jurisdictions, coverage in Indigenous children ranged from 9% lower (in South Australia) to 7% higher (in the Northern Territory) than in all Australian children (Tables 3 and 6).
Coverage for National Immunisation Program vaccines not routinely reported elsewhere
7vPCV and rotavirus
Th e 7vPCV vaccine was fi rst added to the NIP in January 2005. Since coverage was fi rst calculated for this vaccine in early 2006, it has remained at high levels, with a slight increase from 89% to 91%. Coverage is similar in all jurisdictions at greater than or approaching 90% (Table 7).
Rotavirus vaccine was added to the NIP in July 2007 so coverage for 2 or 3 doses (depend-ing on vaccine) at 12 months of age could be calculated only from the December 2008 quarter. Rotavirus coverage was lower nationally, and had greater variation between jurisdictions compared with other vaccines given at 2, 4 and 6 months, which is expected from the vaccine most recently introduced onto the NIP. Reported coverage
for 2 or 3 doses (depending on vaccine) of rota-virus at 12 months of age varied from 78.7% in Western Australia to 84.9% and 88.0% in New South Wales and the Australian Capital Territory, respectively (Table 7).
Meningococcal C and varicella
Meningococcal C vaccine was added to the NIP in January 2003. Since coverage was fi rst calculated for this vaccine in early 2006, it has remained at high levels, with an increase over 2 years from 88% to around 93% (Figure 6), and there was little vari-ation by jurisdiction, with all jurisdictions at greater than 92% (Table 7).
Varicella vaccine was added to the NIP in Novem-ber 2005. Figure 6 shows coverage for this vaccine has consistently been 10–15 percentage points lower than that for meningococcal C vaccine, with coverage just above 80% for the latest assess-ment. Th is is probably partly due to the shorter time varicella has been on the NIP and the rec-ommendation to give the vaccine at 18 months of age, which was historically associated with lower coverage and is not as well established as a milestone, especially following removal of the 18-month pertussis booster in 2003. However, varicella vaccine coverage varies by jurisdiction from 77.8% in Western Australia to greater than 83% in Queensland, the Northern Territory and the Australian Capital Territory (Table 7). Data
Table 7: Vaccination coverage for 7vPCV, rotavirus, meningococcal C, varicella, hepatitis A (Indigenous only) and 23vPPV (Indigenous only) for the last 3-month cohort assessable in 2008, by state or territory
State or territory Vaccine type7vPCV* Rotavirus† Men C‡ Varicella§ Hep A║ 23vPPV¶
ACT 94.1 88.0 95.1 85.4 na naNSW 91.7 84.9 93.1 78.5 na naNT 89.5 81.1 94.5 83.7 82.1 (90.3) 78.9Qld 90.5 80.7 93.3 83.8 43.6 (60.8) 52.7SA 91.3 82.1 92.9 78.1 25.4 (45.3) 36.0Tas 91.7 82.6 94.4 82.0 na naVic 91.9 81.3 94.5 81.7 na naWA 88.4 78.7 92.0 77.8 55.2 (73.0) 64.0Australia 91.1 82.3 93.4 80.5 52.3 (68.1)** 59.1**
Na Not applicable. * 3 doses at 12 months of age. † 2 or 3 doses at 12 months of age. ‡ 1 dose at 24 months of age. § 1 dose at 24 months of age. ║ Indigenous only: 2 doses at 30 months of age (1 dose at 24 months of age). ¶ Indigenous only: 1 dose at 36 months of age. ** Northern Territory, Queensland, South Australia and Western Australia only.
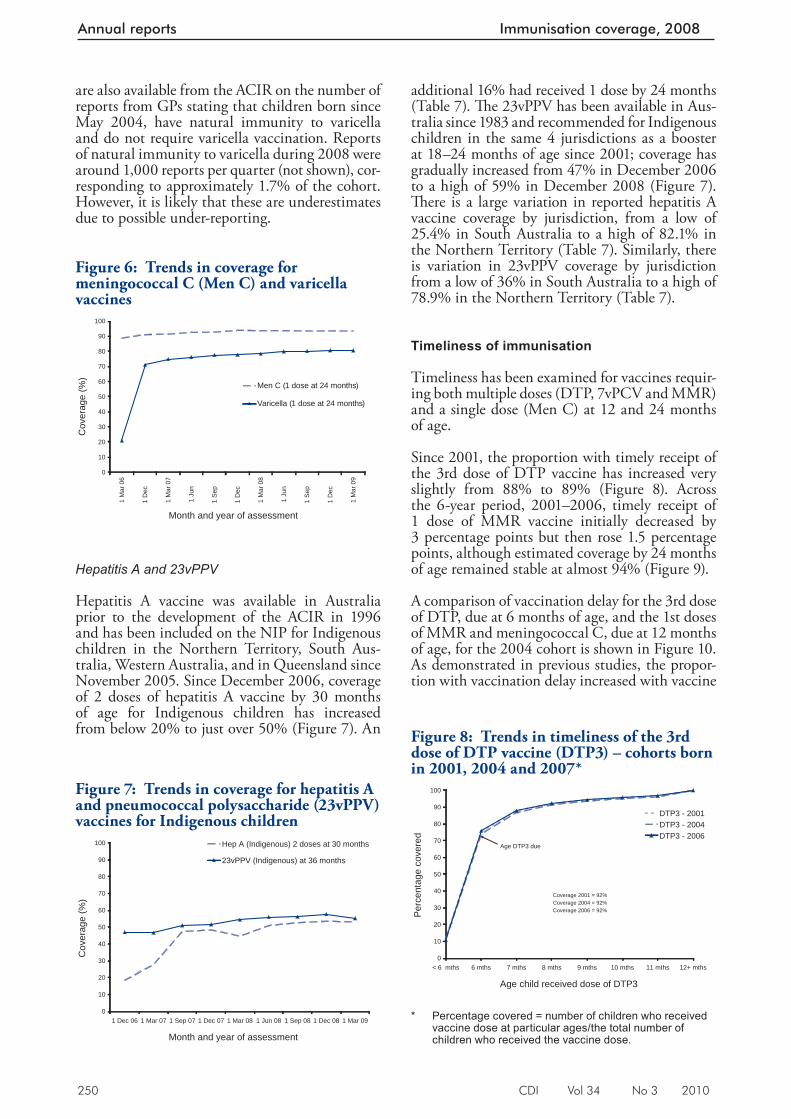
250 CDI Vol 34 No 3 2010
Annual reports Immunisation coverage, 2008
are also available from the ACIR on the number of reports from GPs stating that children born since May 2004, have natural immunity to varicella and do not require varicella vaccination. Reports of natural immunity to varicella during 2008 were around 1,000 reports per quarter (not shown), cor-responding to approximately 1.7% of the cohort. However, it is likely that these are underestimates due to possible under-reporting.
Hepatitis A and 23vPPV
Hepatitis A vaccine was available in Australia prior to the development of the ACIR in 1996 and has been included on the NIP for Indigenous children in the Northern Territory, South Aus-tralia, Western Australia, and in Queensland since November 2005. Since December 2006, coverage of 2 doses of hepatitis A vaccine by 30 months of age for Indigenous children has increased from below 20% to just over 50% (Figure 7). An
additional 16% had received 1 dose by 24 months (Table 7). Th e 23vPPV has been available in Aus-tralia since 1983 and recommended for Indigenous children in the same 4 jurisdictions as a booster at 18–24 months of age since 2001; coverage has gradually increased from 47% in December 2006 to a high of 59% in December 2008 (Figure 7). Th ere is a large variation in reported hepatitis A vaccine coverage by jurisdiction, from a low of 25.4% in South Australia to a high of 82.1% in the Northern Territory (Table 7). Similarly, there is variation in 23vPPV coverage by jurisdiction from a low of 36% in South Australia to a high of 78.9% in the Northern Territory (Table 7).
Timeliness of immunisation
Timeliness has been examined for vaccines requir-ing both multiple doses (DTP, 7vPCV and MMR) and a single dose (Men C) at 12 and 24 months of age.
Since 2001, the proportion with timely receipt of the 3rd dose of DTP vaccine has increased very slightly from 88% to 89% (Figure 8). Across the 6-year period, 2001–2006, timely receipt of 1 dose of MMR vaccine initially decreased by 3 percentage points but then rose 1.5 percentage points, although estimated coverage by 24 months of age remained stable at almost 94% (Figure 9).
A comparison of vaccination delay for the 3rd dose of DTP, due at 6 months of age, and the 1st doses of MMR and meningococcal C, due at 12 months of age, for the 2004 cohort is shown in Figure 10. As demonstrated in previous studies, the propor-tion with vaccination delay increased with vaccine
Figure 7: Trends in coverage for hepatitis A and pneumococcal polysaccharide (23vPPV) vaccines for Indigenous children
0
10
20
30
40
50
60
70
80
90
100
1 Dec 06 1 Mar 07 1 Sep 07 1 Dec 07 1 Mar 08 1 Jun 08 1 Sep 08 1 Dec 08 1 Mar 09
Month and year of assessment
Cov
erag
e (%
)
Hep A (Indigenous) 2 doses at 30 months
23vPPV (Indigenous) at 36 months
Figure 8: Trends in timeliness of the 3rd dose of DTP vaccine (DTP3) – cohorts born in 2001, 2004 and 2007*
0
10
20
30
40
50
60
70
80
90
100
< 6 mths 6 mths 7 mths 8 mths 9 mths 10 mths 11 mths 12+ mths
Age child received dose of DTP3
Per
cent
age
cove
red
DTP3 - 2001DTP3 - 2004DTP3 - 2006
Age DTP3 due
Coverage 2001 = 92% Coverage 2004 = 92%Coverage 2006 = 92%
* Percentage covered = number of children who received
vaccine dose at particular ages/the total number of children who received the vaccine dose.
Figure 6: Trends in coverage for meningococcal C (Men C) and varicella vaccines
0
10
20
30
40
50
60
70
80
90
100
1 M
ar 0
6
1 D
ec
1 M
ar 0
7
1 Ju
n
1 Se
p
1 D
ec
1 M
ar 0
8
1 Ju
n
1 Se
p
1 D
ec
1 M
ar 0
9
Month and year of assessment
Cov
erag
e (%
)
Men C (1 dose at 24 months)
Varicella (1 dose at 24 months)
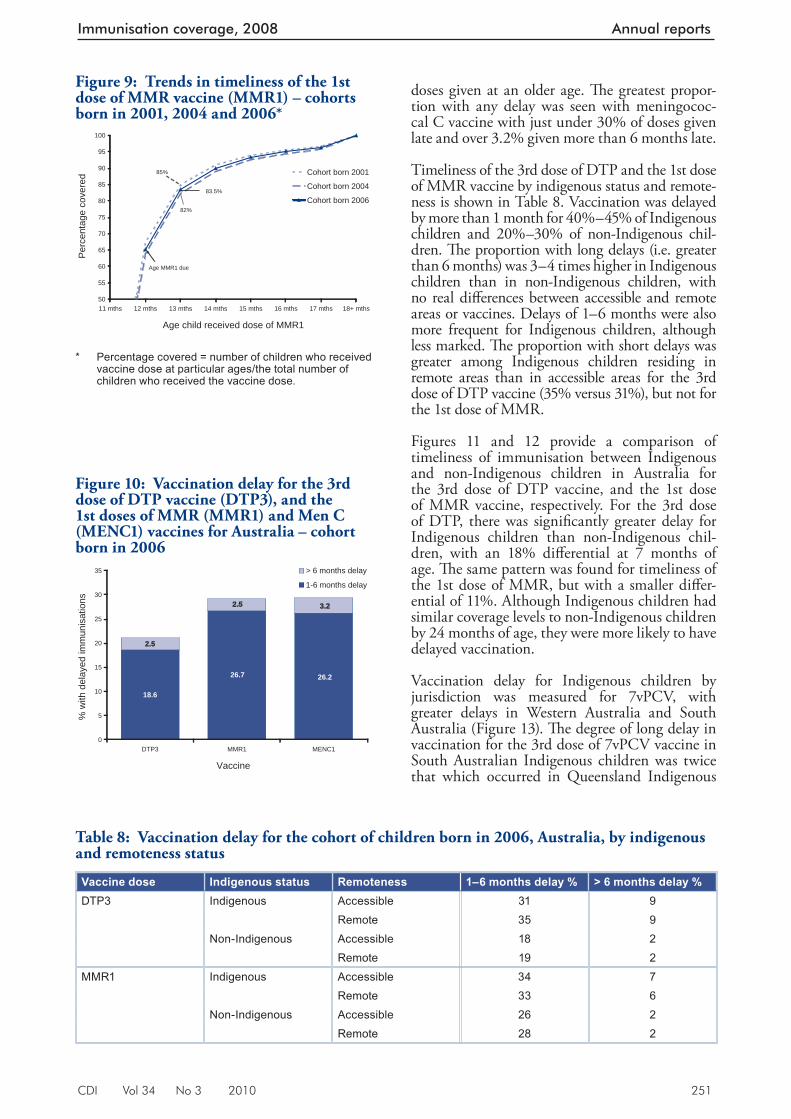
CDI Vol 34 No 3 2010 251
Immunisation coverage, 2008 Annual reports
doses given at an older age. Th e greatest propor-tion with any delay was seen with meningococ-cal C vaccine with just under 30% of doses given late and over 3.2% given more than 6 months late.
Timeliness of the 3rd dose of DTP and the 1st dose of MMR vaccine by indigenous status and remote-ness is shown in Table 8. Vaccination was delayed by more than 1 month for 40%–45% of Indigenous children and 20%–30% of non-Indigenous chil-dren. Th e proportion with long delays (i.e. greater than 6 months) was 3–4 times higher in Indigenous children than in non-Indigenous children, with no real diff erences between accessible and remote areas or vaccines. Delays of 1–6 months were also more frequent for Indigenous children, although less marked. Th e proportion with short delays was greater among Indigenous children residing in remote areas than in accessible areas for the 3rd dose of DTP vaccine (35% versus 31%), but not for the 1st dose of MMR.
Figures 11 and 12 provide a comparison of timeliness of immunisation between Indigenous and non-Indigenous children in Australia for the 3rd dose of DTP vaccine, and the 1st dose of MMR vaccine, respectively. For the 3rd dose of DTP, there was signifi cantly greater delay for Indigenous children than non-Indigenous chil-dren, with an 18% diff erential at 7 months of age. Th e same pattern was found for timeliness of the 1st dose of MMR, but with a smaller diff er-ential of 11%. Although Indigenous children had similar coverage levels to non-Indigenous children by 24 months of age, they were more likely to have delayed vaccination.
Vaccination delay for Indigenous children by jurisdiction was measured for 7vPCV, with greater delays in Western Australia and South Australia (Figure 13). Th e degree of long delay in vaccination for the 3rd dose of 7vPCV vaccine in South Australian Indigenous children was twice that which occurred in Queensland Indigenous
Figure 9: Trends in timeliness of the 1st dose of MMR vaccine (MMR1) – cohorts born in 2001, 2004 and 2006*
50
55
60
65
70
75
80
85
90
95
100
11 mths 12 mths 13 mths 14 mths 15 mths 16 mths 17 mths 18+ mths
Age child received dose of MMR1
Per
cent
age
cove
red Cohort born 2001
Cohort born 2004
Cohort born 2006
Age MMR1 due
82%
85%
83.5%
* Percentag e covered = number of children who received
vaccine dose at particular ages/the total number of children who received the vaccine dose.
Figure 10: Vaccination delay for the 3rd dose of DTP vaccine (DTP3), and the 1st doses of MMR (MMR1) and Men C (MENC1) vaccines for Australia – cohort born in 2006
18.6
26.7 26.2
2.5
2.5 3.2
0
5
10
15
20
25
30
35
DTP3 MMR1 MENC1
Vaccine
% w
ith d
elay
ed im
mun
isat
ions
> 6 months delay
1-6 months delay
Table 8: Vaccination delay for the cohort of children born in 2006, Australia, by indigenous and remoteness status
Vaccine dose Indigenous status Remoteness 1–6 months delay % > 6 months delay %DTP3 Indigenous Accessible 31 9
Remote 35 9Non-Indigenous Accessible 18 2
Remote 19 2MMR1 Indigenous Accessible 34 7
Remote 33 6Non-Indigenous Accessible 26 2
Remote 28 2
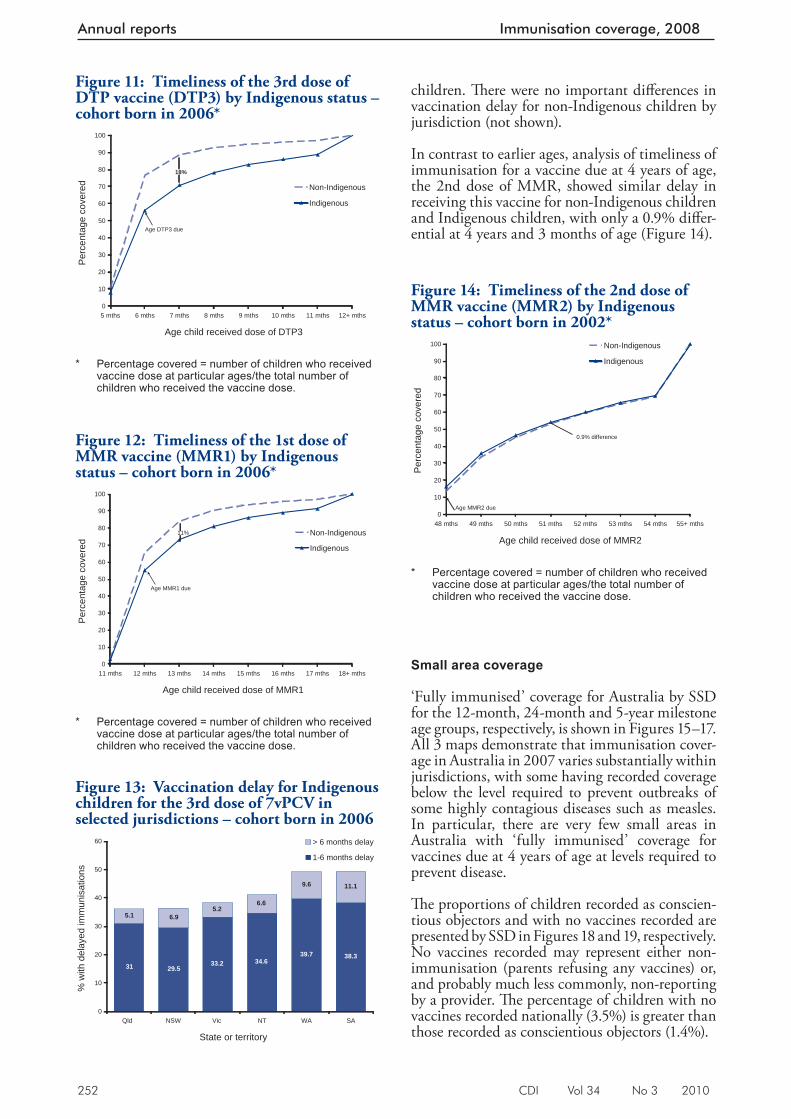
252 CDI Vol 34 No 3 2010
Annual reports Immunisation coverage, 2008
children. Th ere were no important diff erences in vaccination delay for non-Indigenous children by jurisdiction (not shown).
In contrast to earlier ages, analysis of timeliness of immunisation for a vaccine due at 4 years of age, the 2nd dose of MMR, showed similar delay in receiving this vaccine for non-Indigenous children and Indigenous children, with only a 0.9% diff er-ential at 4 years and 3 months of age (Figure 14).
Small area coverage
‘Fully immunised’ coverage for Australia by SSD for the 12-month, 24-month and 5-year milestone age groups, respectively, is shown in Figures 15–17. All 3 maps demonstrate that immunisation cover-age in Australia in 2007 varies substantially within jurisdictions, with some having recorded coverage below the level required to prevent outbreaks of some highly contagious diseases such as measles. In particular, there are very few small areas in Australia with ‘fully immunised’ coverage for vaccines due at 4 years of age at levels required to prevent disease.
Th e proportions of children recorded as conscien-tious objectors and with no vaccines recorded are presented by SSD in Figures 18 and 19, respectively. No vaccines recorded may represent either non-immunisation (parents refusing any vaccines) or, and probably much less commonly, non-reporting by a provider. Th e percentage of children with no vaccines recorded nationally (3.5%) is greater than those recorded as conscientious objectors (1.4%).
Figure 14: Timeliness of the 2nd dose of MMR vaccine (MMR2) by Indigenous status – cohort born in 2002*
0
10
20
30
40
50
60
70
80
90
100
48 mths 49 mths 50 mths 51 mths 52 mths 53 mths 54 mths 55+ mths
Age child received dose of MMR2
Per
cent
age
cove
red
Non-Indigenous
Indigenous
0.9% difference
Age MMR2 due
* Percentage covered = number of children who received
vaccine dose at particular ages/the total number of children who received the vaccine dose.
Figure 13: Vaccination delay for Indigenous children for the 3rd dose of 7vPCV in selected jurisdictions – cohort born in 2006
31 29.533.2 34.6
39.7 38.3
5.1 6.95.2
6.6
9.6 11.1
0
10
20
30
40
50
60
Qld NSW Vic NT WA SA
State or territory
% w
ith d
elay
ed im
mun
isat
ions
> 6 months delay
1-6 months delay
Figure 12: Timeliness of the 1st dose of MMR vaccine (MMR1) by Indigenous status – cohort born in 2006*
0
10
20
30
40
50
60
70
80
90
100
11 mths 12 mths 13 mths 14 mths 15 mths 16 mths 17 mths 18+ mths
Age child received dose of MMR1
Per
cent
age
cove
red
Non-Indigenous
Indigenous
11%
Age MMR1 due
* Percentage covered = number of children who received
vaccine dose at particular ages/the total number of children who received the vaccine dose.
Figure 11: Timeliness of the 3rd dose of DTP vaccine (DTP3) by Indigenous status – cohort born in 2006*
0
10
20
30
40
50
60
70
80
90
100
5 mths 6 mths 7 mths 8 mths 9 mths 10 mths 11 mths 12+ mths
Age child received dose of DTP3
Per
cent
age
cove
red Non-Indigenous
Indigenous
18%
Age DTP3 due
* Percentage covered = number of children who received
vaccine dose at particular ages/the total number of children who received the vaccine dose.
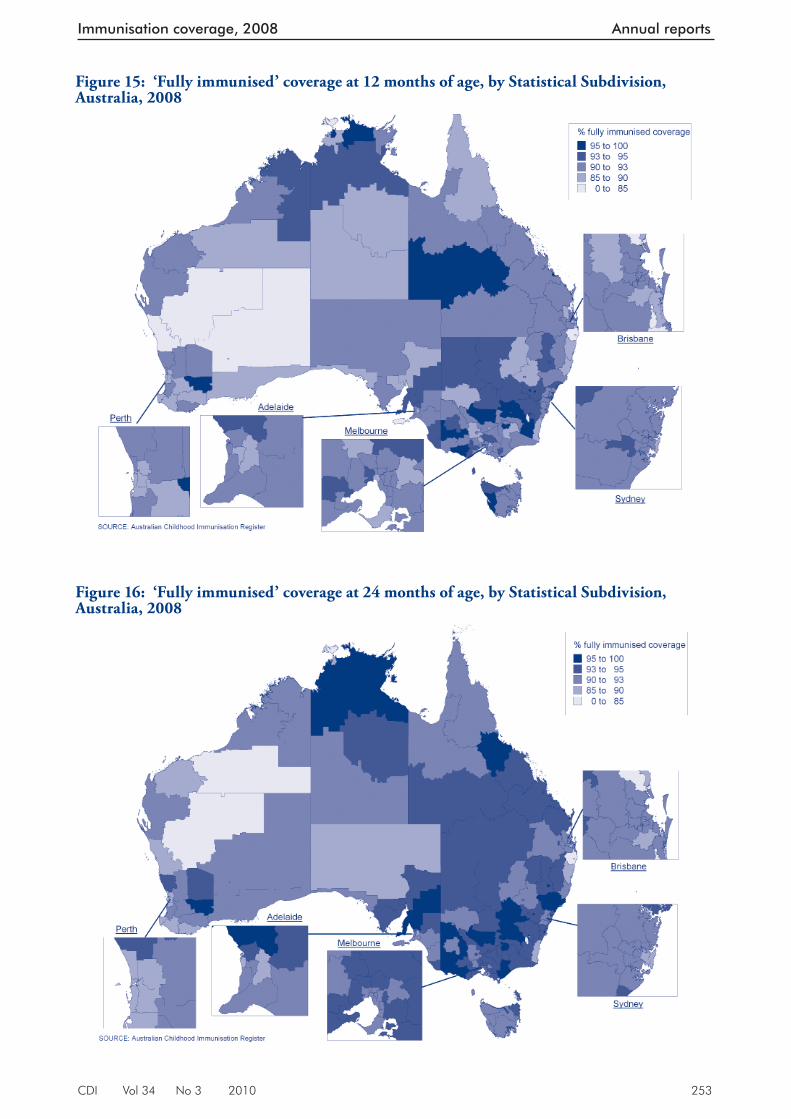
CDI Vol 34 No 3 2010 253
Immunisation coverage, 2008 Annual reports
Figure 15: ‘Fully immunised’ coverage at 12 months of age, by Statistical Subdivision, Australia, 2008
Figure 16: ‘Fully immunised’ coverage at 24 months of age, by Statistical Subdivision, Australia, 2008
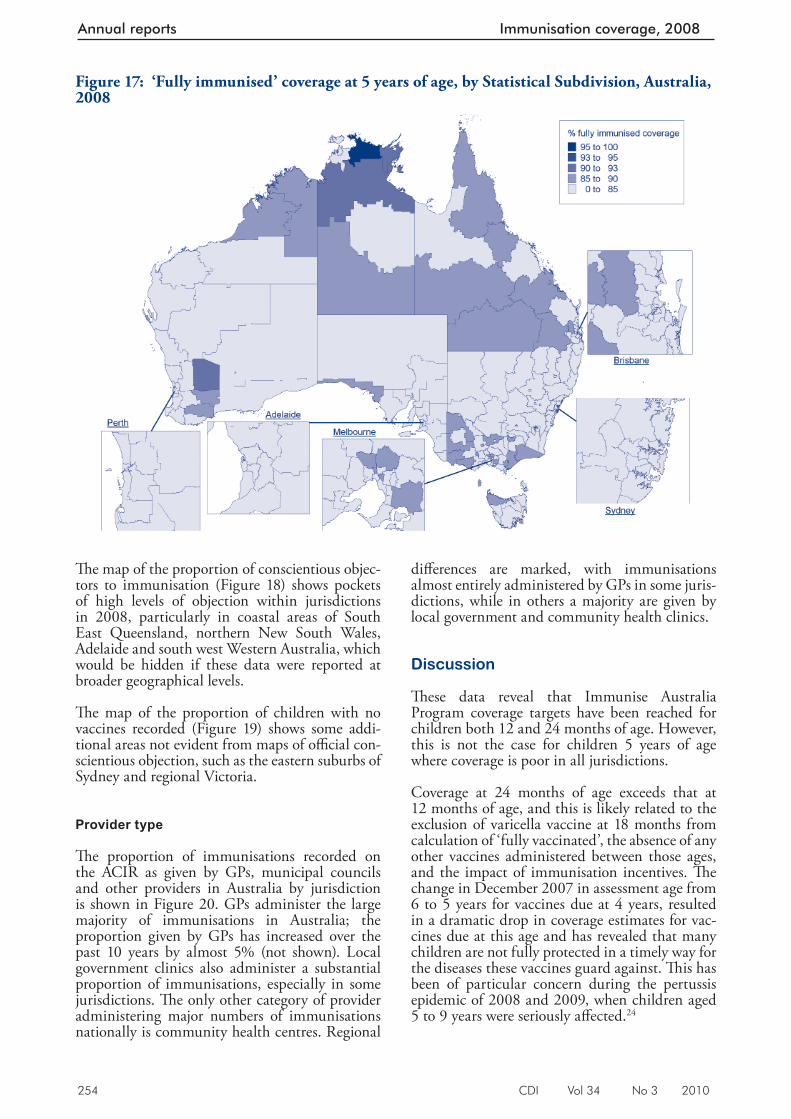
254 CDI Vol 34 No 3 2010
Annual reports Immunisation coverage, 2008
Th e map of the proportion of conscientious objec-tors to immunisation (Figure 18) shows pockets of high levels of objection within jurisdictions in 2008, particularly in coastal areas of South East Queensland, northern New South Wales, Adelaide and south west Western Australia, which would be hidden if these data were reported at broader geographical levels.
Th e map of the proportion of children with no vaccines recorded (Figure 19) shows some addi-tional areas not evident from maps of offi cial con-scientious objection, such as the eastern suburbs of Sydney and regional Victoria.
Provider type
Th e proportion of immunisations recorded on the ACIR as given by GPs, municipal councils and other providers in Australia by jurisdiction is shown in Figure 20. GPs administer the large majority of immunisations in Australia; the proportion given by GPs has increased over the past 10 years by almost 5% (not shown). Local government clinics also administer a substantial proportion of immunisations, especially in some jurisdictions. Th e only other category of provider administering major numbers of immunisations nationally is community health centres. Regional
diff erences are marked, with immunisations almost entirely administered by GPs in some juris-dictions, while in others a majority are given by local government and community health clinics.
Discussion
Th ese data reveal that Immunise Australia Program coverage targets have been reached for children both 12 and 24 months of age. However, this is not the case for children 5 years of age where coverage is poor in all jurisdictions.
Coverage at 24 months of age exceeds that at 12 months of age, and this is likely related to the exclusion of varicella vaccine at 18 months from calculation of ‘fully vaccinated’, the absence of any other vaccines administered between those ages, and the impact of immunisation incentives. Th e change in December 2007 in assessment age from 6 to 5 years for vaccines due at 4 years, resulted in a dramatic drop in coverage estimates for vac-cines due at this age and has revealed that many children are not fully protected in a timely way for the diseases these vaccines guard against. Th is has been of particular concern during the pertussis epidemic of 2008 and 2009, when children aged 5 to 9 years were seriously aff ected. 24
Figure 17: ‘Fully immunised’ coverage at 5 years of age, by Statistical Subdivision, Australia, 2008
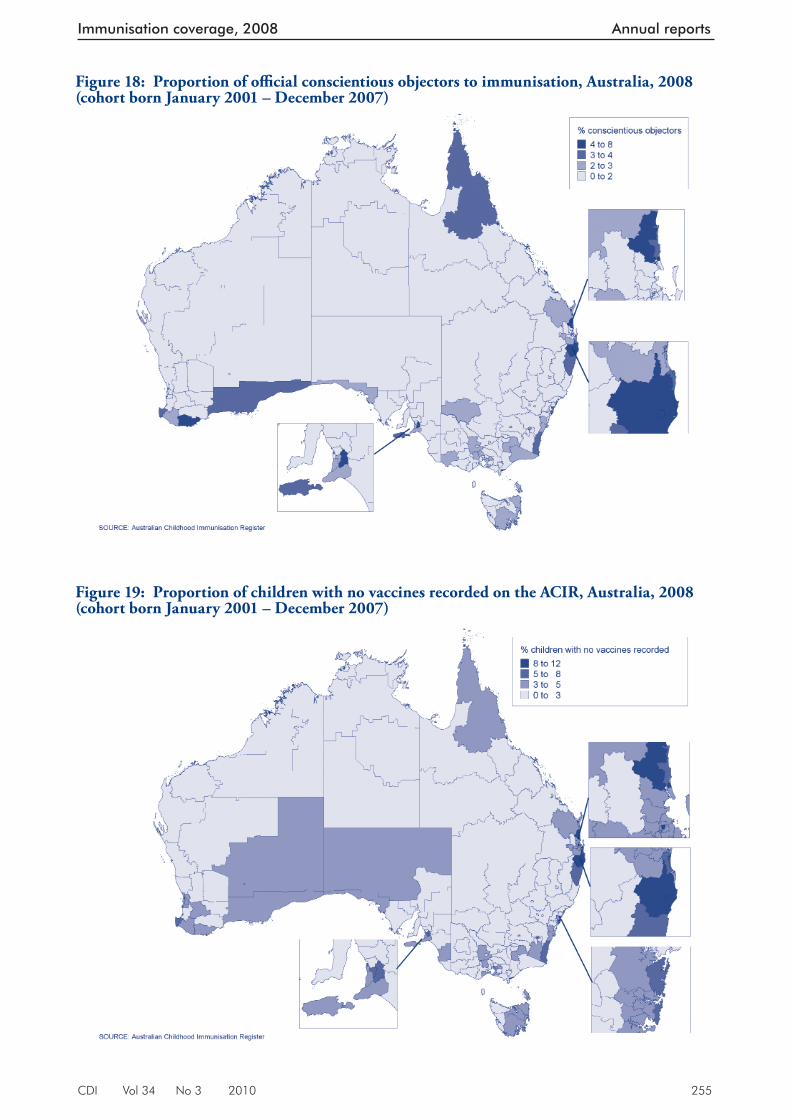
CDI Vol 34 No 3 2010 255
Immunisation coverage, 2008 Annual reports
Figure 18: Proportion of offi cial conscientious objectors to immunisation, Australia, 2008 (cohort born January 2001 – December 2007)
Figure 19: Proportion of children with no vaccines recorded on the ACIR, Australia, 2008 (cohort born January 2001 – December 2007)
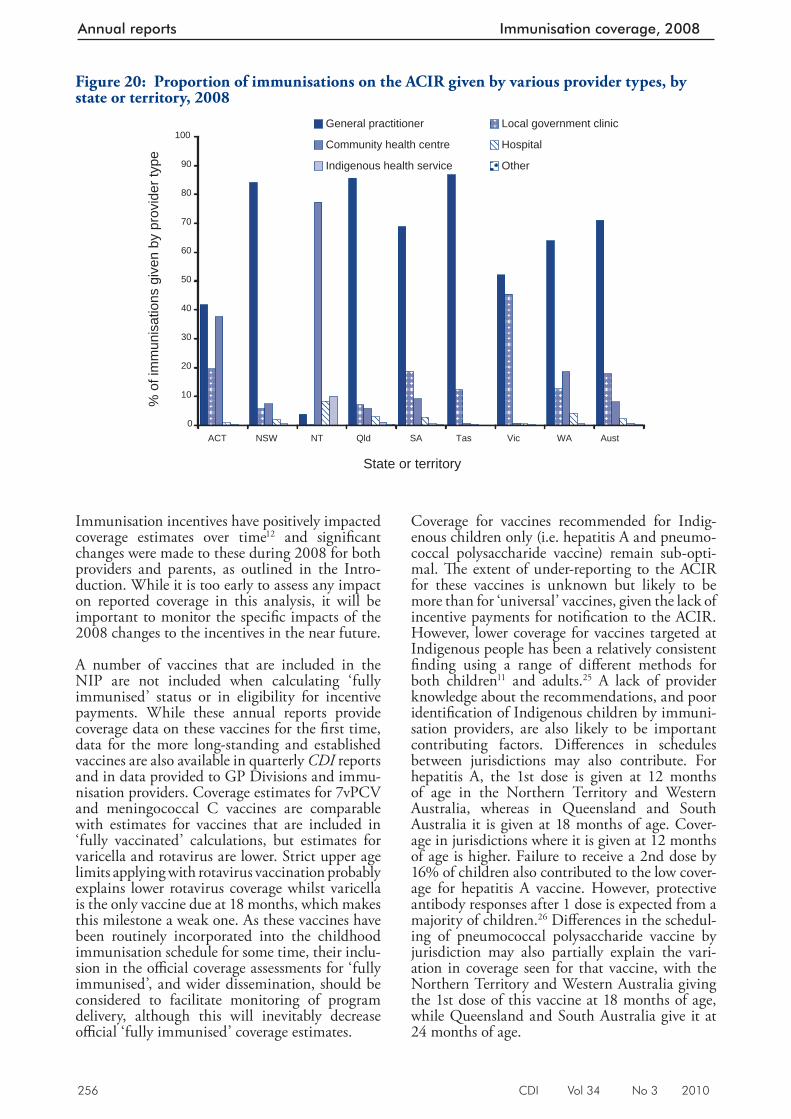
256 CDI Vol 34 No 3 2010
Annual reports Immunisation coverage, 2008
Immunisation incentives have positively impacted coverage estimates over time 12 and signifi cant changes were made to these during 2008 for both providers and parents, as outlined in the Intro-duction. While it is too early to assess any impact on reported coverage in this analysis, it will be important to monitor the specifi c impacts of the 2008 changes to the incentives in the near future.
A number of vaccines that are included in the NIP are not included when calculating ‘fully immunised’ status or in eligibility for incentive payments. While these annual reports provide coverage data on these vaccines for the fi rst time, data for the more long-standing and established vaccines are also available in quarterly CDI reports and in data provided to GP Divisions and immu-nisation providers. Coverage estimates for 7vPCV and meningococcal C vaccines are comparable with estimates for vaccines that are included in ‘fully vaccinated’ calculations, but estimates for varicella and rotavirus are lower. Strict upper age limits applying with rotavirus vaccination probably explains lower rotavirus coverage whilst varicella is the only vaccine due at 18 months, which makes this milestone a weak one. As these vaccines have been routinely incorporated into the childhood immunisation schedule for some time, their inclu-sion in the offi cial coverage assessments for ‘fully immunised’, and wider dissemination, should be considered to facilitate monitoring of program delivery, although this will inevitably decrease offi cial ‘fully immunised’ coverage estimates.
Coverage for vaccines recommended for Indig-enous children only (i.e. hepatitis A and pneumo-coccal polysaccharide vaccine) remain sub-opti-mal. Th e extent of under-reporting to the ACIR for these vaccines is unknown but likely to be more than for ‘universal’ vaccines, given the lack of incentive payments for notifi cation to the ACIR. However, lower coverage for vaccines targeted at Indigenous people has been a relatively consistent fi nding using a range of diff erent methods for both children 11 and adults. 25 A lack of provider knowledge about the recommendations, and poor identifi cation of Indigenous children by immuni-sation providers, are also likely to be important contributing factors. Diff erences in schedules between jurisdictions may also contribute. For hepatitis A, the 1st dose is given at 12 months of age in the Northern Territory and Western Australia, whereas in Queensland and South Australia it is given at 18 months of age. Cover-age in jurisdictions where it is given at 12 months of age is higher. Failure to receive a 2nd dose by 16% of children also contributed to the low cover-age for hepatitis A vaccine. However, protective antibody responses after 1 dose is expected from a majority of children. 26 Diff erences in the schedul-ing of pneumococcal polysaccharide vaccine by jurisdiction may also partially explain the vari-ation in coverage seen for that vaccine, with the Northern Territory and Western Australia giving the 1st dose of this vaccine at 18 months of age, while Queensland and South Australia give it at 24 months of age.
Figure 20: Proportion of immunisations on the ACIR given by various provider types, by state or territory, 2008
0
10
20
30
40
50
60
70
80
90
100
ACT NSW NT Qld SA Tas Vic WA Aust
State or territory
% o
f im
mun
isat
ions
giv
en b
y pr
ovid
er ty
pe
General practitioner Local government clinic
Community health centre Hospital
Indigenous health service Other
CDI Vol 34 No 3 2010 257
Immunisation coverage, 2008 Annual reports
Although coverage data reveal that most children eventually complete the scheduled vaccination series by the 24-month milestone, many still do not do so in a timely manner. While there have been signifi cant improvements in coverage in Australia over the past 4–5 years, vaccination delay as measured in this report has improved only marginally. Th is is a concern, especially for diseases where multiple vaccine doses are required for protection and the disease risk among young infants is signifi cant (e.g. pertussis). Immunisation at the earliest appropriate age should be a public health goal for countries such as Australia where high levels of vaccine coverage at milestone ages have been achieved.
In comparison with other countries, reported coverage at 12 months of age is higher in many other countries. 27 However, with more than 3% of children not vaccinated due to ideological reasons, the greater than 91% of Australian infants fully immunised at 12 months of age is above the national target and would be diffi cult to improve upon. Rather, the ACIR has shown the rapid uptake of new vaccines and consistently high cov-erage for all vaccines, unlike some other developed countries. 28,29 Th e reporting of national small area coverage data has not been noted elsewhere and vaccination timeliness has been reported elsewhere but not routinely. 7
In conclusion, data provided by the ACIR in this report refl ect the successful delivery of the NIP in Australia, while identifying some areas for improvement. Coverage for varicella and rotavirus vaccines are below that for other vaccines, coverage is low in some small geographic areas, timeliness of vaccination could be improved, particularly for Indigenous infants, and coverage for vaccines recommended only for Indigenous infants is lower than for other vaccines. Th e ACIR continues to be a very useful tool for administering the NIP and monitoring its implementation.
Author details
Brynley Hull Deepika Mahajan Aditi Dey Rob Menzies Peter McIntyre
National Centre for Immunisation Research and Surveillance of Vaccine Preventable Diseases, The Children’s Hospital at Westmead and University of Sydney, Westmead New South Wales
Corresponding author: Mr Brynley Hull, National Centre for Immunisation Research and Surveillance of Vaccine Preventable Diseases, The Children’s Hospital at Westmead and University of Sydney, Locked Bag 4001, Westmead, NSW 2145.
References
1. Hull B, Lawrence G, MacIntyre CR, McIntyre P. Immunisation coverage: Australia 2001. Canberra: Australian Government Department of Health and Ageing, 2002.
2. Hull BP, McIntyre PB, Heath TC, Sayer GP. Measuring immunisation coverage in Australia. A review of the Australian Childhood Immunisation Register. Aust Fam Physician 1999;28(1):55–60.
3. Hull BP, Lawrence GL, MacIntyre CR, McIntyre PB. Immunisation coverage in Australia corrected for under-reporting to the Australian Childhood Immunisation Register. Aust N Z J Public Health 2003;27(5):533–538.
4. Hull BP, McIntyre PB. Immunisation coverage repor ting through the Australian Childhood Immunisation Register – an evaluation of the third-dose assumption. Aust N Z J Public Health 2000;24(1):17–21.
5. Hull BP, Lawrence GL, MacIntyre CR, McIntyre PB. Estimating immunisation coverage: is the ‘third dose assumption’ still valid? Commun Dis Intell 2003;27(3):357–361.
6. H u l l B P, M c I n t y r e P B . Time l i n e s s o f childhood immunisation in Australia. Vaccine 2006;24(20):4403–4408.
7. Hull BP, McIntyre PB. What do we know about 7vPCV coverage in Aboriginal and Torres Strait Islander children? Commun Dis Intell 2004;28(2):238–243.
8. Hull BP, McIntyre PB, Couzos S. Evaluation of immunisation coverage for Aboriginal and Torres Strait Islander children using the Australian Childhood Immunisation Register. Aust N Z J Public Health 2004;28(1):47–52.
9. Hull BP, Lawrence GL, MacIntyre CR, McIntyre PB. Is low immunisation coverage in inner urban areas of Australia due to low uptake or poor notification? Aust Fam Physician 2003;32(12):1041–1043.
10. Hull BP, McIntyre PB, Sayer GP. Factors associated with low uptake of measles and pertussis vaccines – an ecologic study based on the Australian Childhood Immunisation Register. Aust N Z J Public Health 2001;25(5):405–410.
258 CDI Vol 34 No 3 2010
Annual reports Immunisation coverage, 2008
11. Hull BP, Deeks S, Menzies R, McIntyre PB. What do we know about 7vPCV coverage in Aboriginal and Torres Strait islander children? A 2007 update. Commun Dis Intell 2008;32(2):257–260.
12. Lawrence GL, MacIntyre CR, Hull BP, McIntyre PB. Effectiveness of the linkage of child care and maternity payments to childhood immunisation. Vaccine 2004;22(17–18):2345–2350.
13. Lawrence GL, Hull BP, MacIntyre CR, McIntyre PB. Reasons for incomplete immunisation among Australian children. A national survey of parents. Aust Fam Physician 2004;33(7):568–571.
14. Hull B, Deeks S, Menzies R, McIntyre P. Immunisation coverage annual report, 2007. Commun Dis Intell 2009;33(2):170–187.
15. Australian Government Department of Health and Ageing. Communicable Diseases Surveillance – additional repor ts: Australian childhood immunisation coverage. Commun Dis Intell 2008;32(3):357–359.
16. Australian Government Department of Health and Ageing, Medicare Australia. General Practice Immunisation Incentives Scheme, 2007. Accessed on 18 December 2007. Available from: http://www.medicare.gov.au/provider/incentives/gpii/index.jsp#N100D3
17. National Health and Medical Research Council. The Australian Immunisation Handbook 9th edn. Canberra, Australia: Australian Government Department of Health and Ageing; 2008.
18. O’Brien ED, Sam GA, Mead C. Methodology for measuring Australia’s childhood immunisation coverage. Commun Dis Intell 1998;22(3):36–37.
19. Australian Government Department of Health and Aged Care. Measuring Remoteness: Accessibility/Remoteness Index of Australia . Occasional Papers, New Series No. 14. Canberra: Department of Health and Aged Care, 2001.
20. Rank C, Menzies RI. How reliable are Australian Childhood Immunisation Register coverage estimates for indigenous children? An assessment of data quality and coverage. Commun Dis Intell 2007;31(3):283–287.
21. Australian Bureau of Statistics. Australian Standard Geographical Classification, 2001. Cat. no. 1216.0. Canberra: Australian Bureau of Statistics, 2001.
22. MapInfo version 10.0 [computer program]. Version 7. New York: MapInfo Corporation, 2009.
23. Australian Bureau of Statistics. Statistical Subdivision from Postal Area 2006 Concordance. Canberra: Australian Bureau of Statistics, 2007. Accessed on 6 December 2008. Available from: http://www.abs.gov.au/AUSSTATS/[email protected]/39433889d406eeb9ca2570610019e9a5/5942283858e38743ca25730c00009f2e!OpenDocument
24. Australian Government Department of Health and Ageing. Communicable Diseases Surveillance – Tables: National Notifiable Diseases Surveillance System. Commun Dis Intell 2009;33(1):63–69.
25. Menzies R, Turnour C, Chiu C, McIntyre P. Vaccine Preventable Diseases and Vaccination Coverage in Aboriginal and Torres Strait Islander People, Australia 2003 to 2006. Commun Dis Intell 2008;32(Suppl):S2–S67.
26. Plotkin S, Orenstein W, Offit P. Vaccines. 5th edn. Elsevier, 2008.
27. World Health Organization. Reported estimates of DTP3 coverage. 2009. Accessed on 6 November 2009. Available from: ht tp://www.who.int/immunization_monitoring/en/globalsummary/timeseries/tscoveragedtp3.htm
28. Centers for Disease Control and Prevention. National, state, and local area vaccination coverage among children aged 19–35 months—United States, 2008. MMWR Morb Mortal Wkly Rep 2009;58(33):921–926.
29. Health Protection Agency. NHS Immunisation Statistics, England 2008–09 Report. The Health and Social Care Information Centre, 2009. Accessed on 6 November 2009.
CDI Vol 34 No 3 2010 259
Adverse events following immunisation, 2009 Annual reports
Adverse events following immunisation, 2009
ANNUAL REPORT: SURVEILLANCE OF ADVERSE EVENTS FOLLOWING IMMUNISATION IN AUSTRALIA, 2009 Deepika Mahajan, Ilnaz Roomiani, Michael S Gold, Glenda L Lawrence, Peter B McIntyre, Rob I Menzies
Introduction
Th e aim of passive post-licensure surveillance of adverse events following immunisation (AEFI) is to monitor vaccine and immunisation program safety. An ‘adverse event following immunisation’ is generally regarded as any serious or unexpected adverse event that occurs after a vaccine has been given, which may be related to the vaccine itself or to its handling or administration. An AEFI can be coincidentally associated with the timing of immunisation without necessarily being caused by the vaccine or the immunisation process. Analys-ing trends in passive reports can identify signals that are unexpected adverse events that have not been detected in pre-licensure vaccine trials. 1,2 Passive surveillance is unable to determine the causal relationship between an event and vaccina-tion. Hence, a signal may require the generation of a hypothesis and appropriate epidemiological studies to investigate causality.
Several important changes to vaccine funding and availability occurred in 2008 and 2009 that impact on the AEFI surveillance data presented in this report.
• Th e most signifi cant change during 2009 was the introduction of pandemic H1N1 2009 infl uenza (pH1N1) vaccine (Panvax®), which was rolled out across Australia on 30 September 2009 for people aged ≥10 years. In December 2009, the pandemic vaccine was made available to children aged 6 months to 10 years.
• Th e Northern Territory commenced using a new 10-valent pneumococcal vaccine (Synfl orix®) from October 2009 at 2, 4, 6 and 12 months of age instead of the 3-dose 7-valent pneumococcal schedule (Prevenar®). At the same time they also ceased using the 23-valent pneumococcal polysaccharide booster for Indigenous children at 18 months of age.
• By late 2009, all states and territories were using the single hexavalent DTPa-IPV-HepB-Hib (Infanrix hexa® vaccine for all children at 2, 4 and 6 months of age,3–5 due to an
Abstract
This report summarises Australian passive surveil-lance data for adverse events following immuni-sation (AEFI) reported to the Therapeutic Goods Administration (TGA) for 2009, and describes reporting trends over the 10-year period 2000 to 2009. There were 2,396 AEFI records for vaccines administered in 2009, the highest number reported, a 46% increase over the 1,638 in 2008. The increase was almost entirely due to reports related to the introduction of pandemic H1N1 (pH1N1) 2009 influenza vaccine from September 2009 (n=1,312) largely from the members of the public. The pH1N1 AEFI reporting rate for people aged ≥18 years was 34.2 per 100,000 administered doses compared with 2.8 for seasonal influenza vaccine. The rates in ≥65 year-olds were 28.0, 1.6 and 13.3 for pH1N1, seasonal influenza and polysaccharide pneumococcal, respectively. The high reporting rate for pH1N1 vaccine is likely to be at least partly due to enhanced reporting seen for all new vaccines and greater levels of report-ing from members of the public in response to the implementation of strategies to encourage report-ing, as part of the pH1N1 program. For children <7 years, AEFI reporting rates in 2009 (14.1 per 100,000 administered doses) were similar to previous years. There were 193 (8%) AEFI reports classified as serious; 6 deaths temporally associ-ated with immunisation were reported but none were judged to have a causal association. As in previous years, the most commonly reported reac-tions were allergic reaction, injection site reaction, fever, headache, malaise, nausea and myalgia. The most commonly reported reactions following pH1N1 influenza vaccine were allergic reaction (n=381), headache (n=289), fever (n=235), pain (n=186), nausea (n=180) and injection site reaction (n=178). The data within the limitation of passive surveillance provide a reference point for ongoing reporting of trends in AEFI by age group, severity and vaccine type and illustrate the value of the national TGA database as a surveillance tool for monitoring AEFI nationally. Commun Dis Intell 2010;34(3):259–276.
Keywords: AEFI, adverse events, vaccines, surveillance, immunisation, vaccine safety
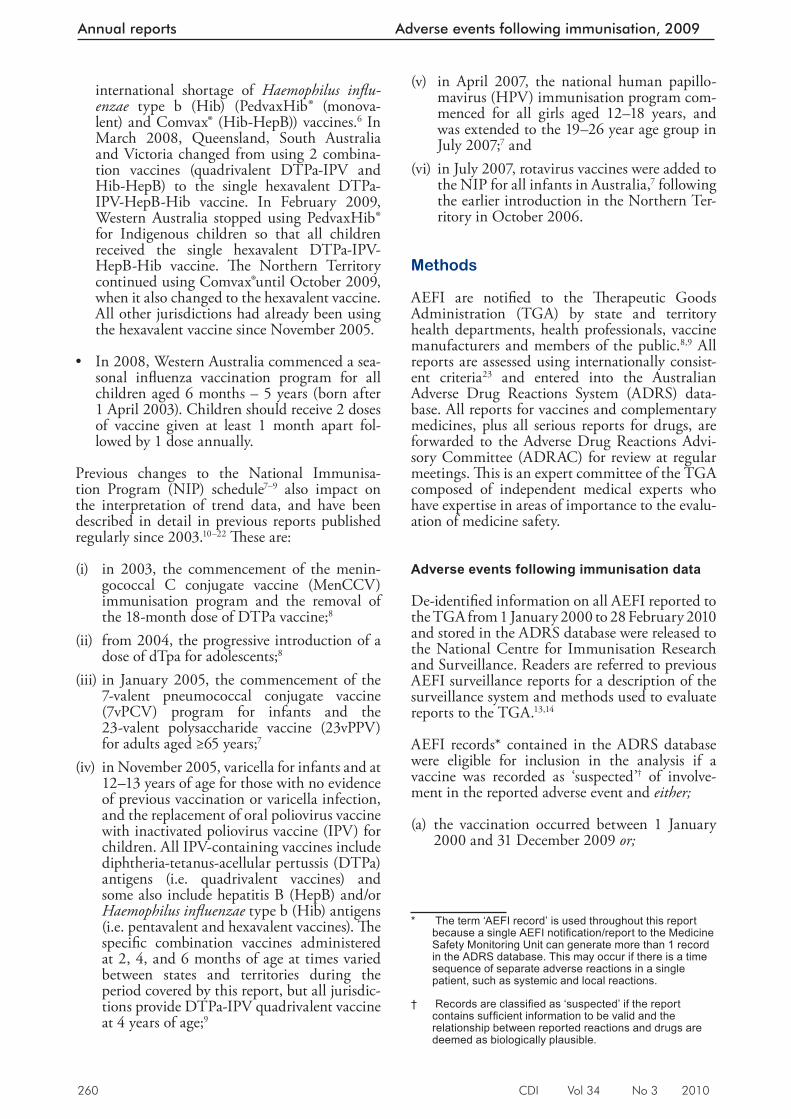
260 CDI Vol 34 No 3 2010
Annual reports Adverse events following immunisation, 2009
international shortage of Haemophilus infl u-enzae type b (Hib) (PedvaxHib® (monova-lent) and Comvax® (Hib-HepB)) vaccines.6 In March 2008, Queensland, South Australia and Victoria changed from using 2 combina-tion vaccines (quadrivalent DTPa-IPV and Hib-HepB) to the single hexavalent DTPa-IPV-HepB-Hib vaccine. In February 2009, Western Australia stopped using PedvaxHib®
for Indigenous children so that all children received the single hexavalent DTPa-IPV-HepB-Hib vaccine. Th e Northern Territory continued using Comvax®until October 2009, when it also changed to the hexavalent vaccine. All other jurisdictions had already been using the hexavalent vaccine since November 2005.
• In 2008, Western Australia commenced a sea-sonal infl uenza vaccination program for all children aged 6 months – 5 years (born after 1 April 2003). Children should receive 2 doses of vaccine given at least 1 month apart fol-lowed by 1 dose annually.
Previous changes to the National Immunisa-tion Program (NIP) schedule 7–9 also impact on the interpretation of trend data, and have been described in detail in previous reports published regularly since 2003. 10–22 Th ese are:
(i) in 2003, the commencement of the menin-gococcal C conjugate vaccine (MenCCV) immunisation program and the removal of the 18-month dose of DTPa vaccine;8
(ii) from 2004, the progressive introduction of a dose of dTpa for adolescents;8
(iii) in January 2005, the commencement of the 7-valent pneumococcal conjugate vaccine (7vPCV) program for infants and the 23-valent polysaccharide vaccine (23vPPV) for adults aged ≥65 years;7
(iv) in November 2005, varicella for infants and at 12–13 years of age for those with no evidence of previous vaccination or varicella infection, and the replacement of oral poliovirus vaccine with inactivated poliovirus vaccine (IPV) for children. All IPV-containing vaccines include diphtheria-tetanus-acellular pertussis (DTPa) antigens (i.e. quadrivalent vaccines) and some also include hepatitis B (HepB) and/or Haemo philus infl uenzae type b (Hib) antigens (i.e. pentavalent and hexavalent vaccines). Th e specifi c combination vaccines administered at 2, 4, and 6 months of age at times varied between states and territories during the period covered by this report, but all jurisdic-tions provide DTPa-IPV quadrivalent vaccine at 4 years of age;9
(v) in April 2007, the national human papillo-mavirus (HPV) immunisation program com-menced for all girls aged 12–18 years, and was extended to the 19–26 year age group in July 2007;7 and
(vi) in July 2007, rotavirus vaccines were added to the NIP for all infants in Australia,7 following the earlier introduction in the Northern Ter-ritory in October 2006.
Methods
AEFI are notifi ed to the Th erapeutic Goods Administration (TGA) by state and territory health departments, health professionals, vaccine manufacturers and members of the public. 8,9 All reports are assessed using internationally consist-ent criteria 23 and entered into the Australian Adverse Drug Reactions System (ADRS) data-base. All reports for vaccines and complementary medicines, plus all serious reports for drugs, are forwarded to the Adverse Drug Reactions Advi-sory Committee (ADRAC) for review at regular meetings. Th is is an expert committee of the TGA composed of independent medical experts who have expertise in areas of importance to the evalu-ation of medicine safety.
Adverse events following immunisation data
De-identifi ed information on all AEFI reported to the TGA from 1 January 2000 to 28 February 2010 and stored in the ADRS database were released to the National Centre for Immunisation Research and Surveillance. Readers are referred to previous AEFI surveillance reports for a description of the surveillance system and methods used to evaluate reports to the TGA. 13,14
AEFI records* contained in the ADRS database were eligible for inclusion in the analysis if a vaccine was recorded as ‘suspected’ † of involve-ment in the reported adverse event and either;
(a) the vaccination occurred between 1 January 2000 and 31 December 2009 or;
* The term ‘AEFI record’ is used throughout this report because a single AEFI notifi cation/report to the Medicine Safety Monitoring Unit can generate more than 1 record in the ADRS database. This may occur if there is a time sequence of separate adverse reactions in a single patient, such as systemic and local reactions.
† Records are classifi ed as ‘suspected’ if the report contains suffi cient information to be valid and the relationship between reported reactions and drugs are deemed as biologically plausible.
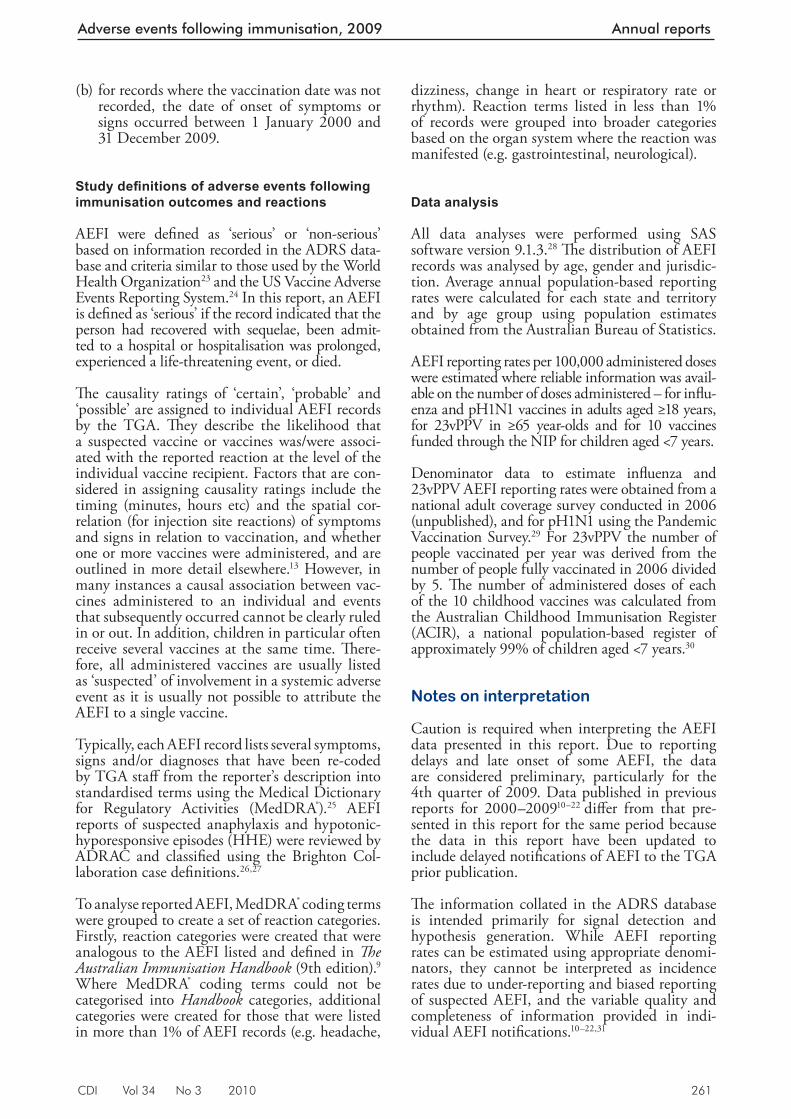
CDI Vol 34 No 3 2010 261
Adverse events following immunisation, 2009 Annual reports
(b) for records where the vaccination date was not recorded, the date of onset of symptoms or signs occurred between 1 January 2000 and 31 December 2009.
Study defi nitions of adverse events following immunisation outcomes and reactions
AEFI were defi ned as ‘serious’ or ‘non-serious’ based on information recorded in the ADRS data-base and criteria similar to those used by the World Health Organization 23 and the US Vaccine Adverse Events Reporting System. 24 In this report, an AEFI is defi ned as ‘serious’ if the record indicated that the person had recovered with sequelae, been admit-ted to a hospital or hospitalisation was prolonged, experienced a life-threatening event, or died.
Th e causality ratings of ‘certain’, ‘probable’ and ‘possible’ are assigned to individual AEFI records by the TGA. Th ey describe the likelihood that a suspected vaccine or vaccines was/were associ-ated with the reported reaction at the level of the individual vaccine recipient. Factors that are con-sidered in assigning causality ratings include the timing (minutes, hours etc) and the spatial cor-relation (for injection site reactions) of symptoms and signs in relation to vaccination, and whether one or more vaccines were administered, and are outlined in more detail elsewhere. 13 However, in many instances a causal association between vac-cines administered to an individual and events that subsequently occurred cannot be clearly ruled in or out. In addition, children in particular often receive several vaccines at the same time. Th ere-fore, all administered vaccines are usually listed as ‘suspected’ of involvement in a systemic adverse event as it is usually not possible to attribute the AEFI to a single vaccine.
Typically, each AEFI record lists several symptoms, signs and/or diagnoses that have been re-coded by TGA staff from the reporter’s description into standardised terms using the Medical Dictionary for Regulatory Activities (MedDRA ® ). 25 AEFI reports of suspected anaphylaxis and hypotonic-hyporesponsive episodes (HHE) were reviewed by ADRAC and classifi ed using the Brighton Col-laboration case defi nitions. 26,27
To analyse reported AEFI, MedDRA ® coding terms were grouped to create a set of reaction categories. Firstly, reaction categories were created that were analogous to the AEFI listed and defi ned in Th e Australian Immunisation Handbook (9th edition). 9 Where MedDRA ® coding terms could not be categorised into Handbook categories, additional categories were created for those that were listed in more than 1% of AEFI records (e.g. headache,
dizziness, change in heart or respiratory rate or rhythm). Reaction terms listed in less than 1% of records were grouped into broader categories based on the organ system where the reaction was manifested (e.g. gastrointestinal, neurological).
Data analysis
All data analyses were performed using SAS software version 9.1.3. 28 Th e distribution of AEFI records was analysed by age, gender and jurisdic-tion. Average annual population-based reporting rates were calculated for each state and territory and by age group using population estimates obtained from the Australian Bureau of Statistics.
AEFI reporting rates per 100,000 administered doses were estimated where reliable information was avail-able on the number of doses administered – for infl u-enza and pH1N1 vaccines in adults aged ≥18 years, for 23vPPV in ≥65 year-olds and for 10 vaccines funded through the NIP for children aged <7 years.
Denominator data to estimate infl uenza and 23vPPV AEFI reporting rates were obtained from a national adult coverage survey conducted in 2006 (unpublished), and for pH1N1 using the Pandemic Vaccination Survey.29 For 23vPPV the number of people vaccinated per year was derived from the number of people fully vaccinated in 2006 divided by 5. Th e number of administered doses of each of the 10 childhood vaccines was calculated from the Australian Childhood Immunisation Register (ACIR), a national population-based register of approximately 99% of children aged <7 years. 30
Notes on interpretation
Caution is required when interpreting the AEFI data presented in this report. Due to reporting delays and late onset of some AEFI, the data are considered preliminary, particularly for the 4th quarter of 2009. Data published in previous reports for 2000–2009 10–22 diff er from that pre-sented in this report for the same period because the data in this report have been updated to include delayed notifi cations of AEFI to the TGA prior publication.
Th e information collated in the ADRS database is intended primarily for signal detection and hypothesis generation. While AEFI reporting rates can be estimated using appropriate denomi-nators, they cannot be interpreted as incidence rates due to under-reporting and biased reporting of suspected AEFI, and the variable quality and completeness of information provided in indi-vidual AEFI notifi cations. 10–22,31
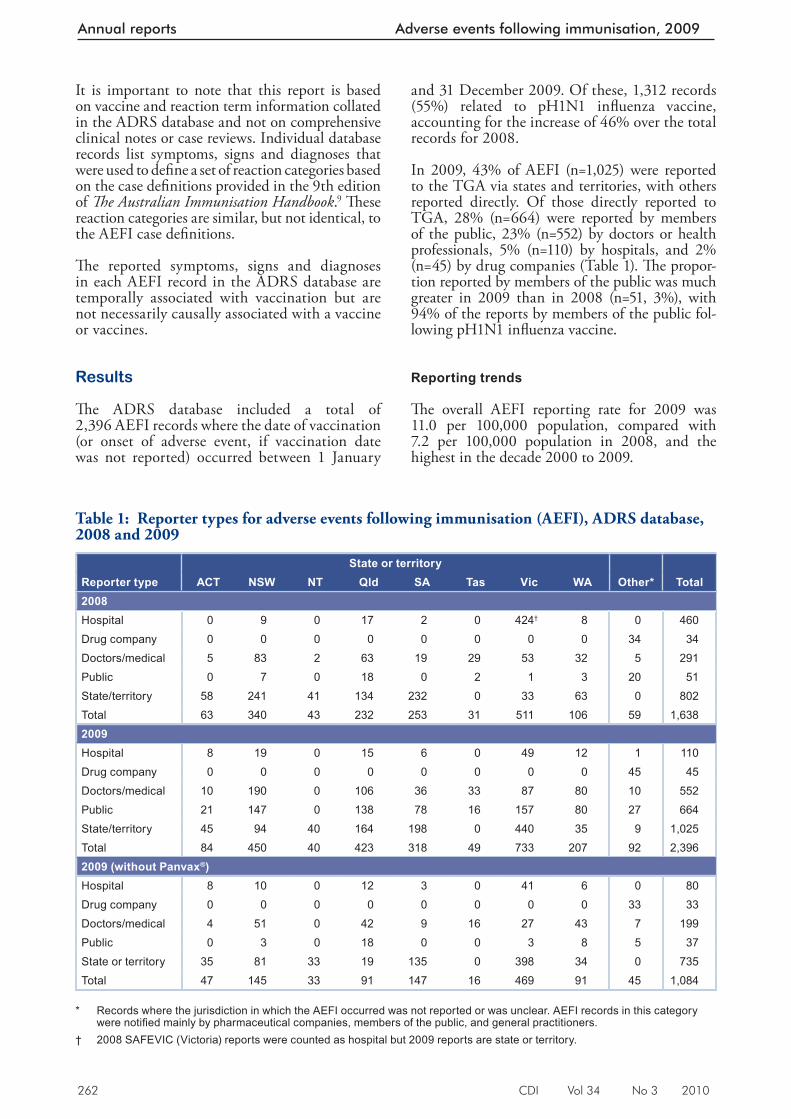
262 CDI Vol 34 No 3 2010
Annual reports Adverse events following immunisation, 2009
It is important to note that this report is based on vaccine and reaction term information collated in the ADRS database and not on comprehensive clinical notes or case reviews. Individual database records list symptoms, signs and diagnoses that were used to defi ne a set of reaction categories based on the case defi nitions provided in the 9th edition of Th e Australian Immunisation Handbook . 9 Th ese reaction categories are similar, but not identical, to the AEFI case defi nitions.
Th e reported symptoms, signs and diagnoses in each AEFI record in the ADRS database are temporally associated with vaccination but are not necessarily causally associated with a vaccine or vaccines.
Results
Th e ADRS database included a total of 2,396 AEFI records where the date of vaccination (or onset of adverse event, if vaccination date was not reported) occurred between 1 January
and 31 December 2009. Of these, 1,312 records (55%) related to pH1N1 infl uenza vaccine, accounting for the increase of 46% over the total records for 2008.
In 2009, 43% of AEFI (n=1,025) were reported to the TGA via states and territories, with others reported directly. Of those directly reported to TGA, 28% (n=664) were reported by members of the public, 23% (n=552) by doctors or health professionals, 5% (n=110) by hospitals, and 2% (n=45) by drug companies (Table 1). Th e propor-tion reported by members of the public was much greater in 2009 than in 2008 (n=51, 3%), with 94% of the reports by members of the public fol-lowing pH1N1 infl uenza vaccine.
Reporting trends
Th e overall AEFI reporting rate for 2009 was 11.0 per 100,000 population, compared with 7.2 per 100,000 population in 2008, and the highest in the decade 2000 to 2009.
Table 1: Reporter types for adverse events following immunisation (AEFI), ADRS database, 2008 and 2009
State or territoryReporter type ACT NSW NT Qld SA Tas Vic WA Other* Total2008Hospital 0 9 0 17 2 0 424† 8 0 460Drug company 0 0 0 0 0 0 0 0 34 34Doctors/medical 5 83 2 63 19 29 53 32 5 291Public 0 7 0 18 0 2 1 3 20 51State/territory 58 241 41 134 232 0 33 63 0 802Total 63 340 43 232 253 31 511 106 59 1,6382009Hospital 8 19 0 15 6 0 49 12 1 110Drug company 0 0 0 0 0 0 0 0 45 45Doctors/medical 10 190 0 106 36 33 87 80 10 552Public 21 147 0 138 78 16 157 80 27 664State/territory 45 94 40 164 198 0 440 35 9 1,025Total 84 450 40 423 318 49 733 207 92 2,3962009 (without Panvax®)Hospital 8 10 0 12 3 0 41 6 0 80Drug company 0 0 0 0 0 0 0 0 33 33Doctors/medical 4 51 0 42 9 16 27 43 7 199Public 0 3 0 18 0 0 3 8 5 37State or territory 35 81 33 19 135 0 398 34 0 735Total 47 145 33 91 147 16 469 91 45 1,084
* Records where the jurisdiction in which the AEFI occurred was not reported or was unclear. AEFI records in this category
were notifi ed mainly by pharmaceutical companies, members of the public, and general practitioners. † 2008 SAFEVIC (Victoria) reports were counted as hospital but 2009 reports are state or territory.
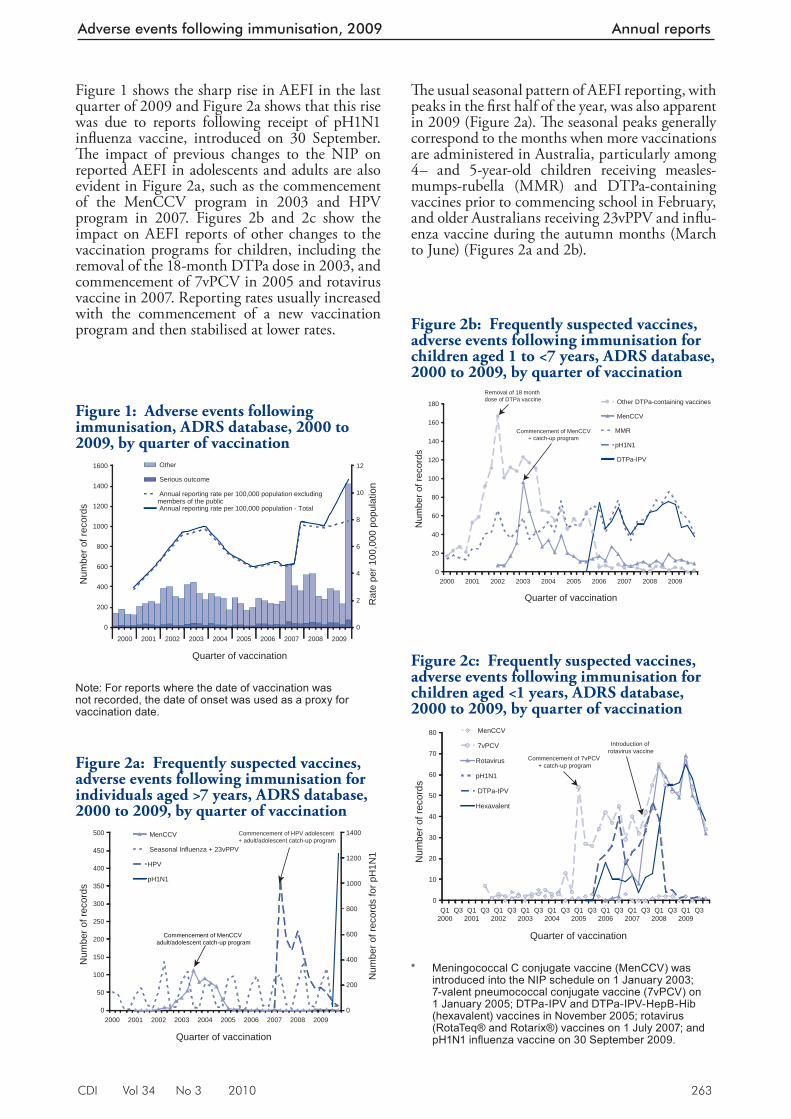
CDI Vol 34 No 3 2010 263
Adverse events following immunisation, 2009 Annual reports
Figure 1 shows the sharp rise in AEFI in the last quarter of 2009 and Figure 2a shows that this rise was due to reports following receipt of pH1N1 infl uenza vaccine, introduced on 30 September. Th e impact of previous changes to the NIP on reported AEFI in adolescents and adults are also evident in Figure 2a, such as the commencement of the MenCCV program in 2003 and HPV program in 2007. Figures 2b and 2c show the impact on AEFI reports of other changes to the vaccination programs for children, including the removal of the 18-month DTPa dose in 2003, and commencement of 7vPCV in 2005 and rotavirus vaccine in 2007. Reporting rates usually increased with the commencement of a new vaccination program and then stabilised at lower rates.
Th e usual seasonal pattern of AEFI reporting, with peaks in the fi rst half of the year, was also apparent in 2009 (Figure 2a). Th e seasonal peaks generally correspond to the months when more vaccinations are administered in Australia, particularly among 4– and 5-year-old children receiving measles-mumps-rubella (MMR) and DTPa-containing vaccines prior to commencing school in February, and older Australians receiving 23vPPV and infl u-enza vaccine during the autumn months (March to June) (Figures 2a and 2b).
Figure 1: Adverse events following immunisation, ADRS database, 2000 to 2009, by quarter of vaccination
0
200
400
600
800
1000
1200
1400
1600
2000 2001 2002 2003 2004 2005 2006 2007 2008 2009
Quarter of vaccination
Num
ber o
f rec
ords
0
2
4
6
8
10
12
Rat
e pe
r 100
,000
pop
ulat
ion
Other
Serious outcome
Annual reporting rate per 100,000 population excludingmembers of the public Annual reporting rate per 100,000 population - Total
Note: For reports where the date of vaccination was not recorded, the date of onset was used as a proxy for vaccination date.
Figure 2a: Frequently suspected vaccines, adverse events following immunisation for individuals aged >7 years, ADRS database, 2000 to 2009, by quarter of vaccination
0
50
100
150
200
250
300
350
400
450
500
2000 2001 2002 2003 2004 2005 2006 2007 2008 2009
Quarter of vaccination
Num
ber o
f rec
ords
0
200
400
600
800
1000
1200
1400
Num
ber o
f rec
ords
for p
H1N
1
MenCCV
Seasonal Influenza + 23vPPV
HPV
pH1N1
Commencement of MenCCV adult/adolescent catch-up program
Commencement of HPV adolescent + adult/adolescent catch-up program
Figure 2b: Frequently suspected vaccines, adverse events following immunisation for children aged 1 to <7 years, ADRS database, 2000 to 2009, by quarter of vaccination
0
20
40
60
80
100
120
140
160
180
2000 2001 2002 2003 2004 2005 2006 2007 2008 2009
Quarter of vaccination
Num
ber o
f rec
ords
Other DTPa-containing vaccines
MenCCV
MMR
pH1N1
DTPa-IPV
Removal of 18 month dose of DTPa vaccine
Commencement of MenCCV+ catch-up program
Figure 2c: Frequently suspected vaccines, adverse events following immunisation for children aged <1 years, ADRS database, 2000 to 2009, by quarter of vaccination
0
10
20
30
40
50
60
70
80
Q12000
Q3 Q12001
Q3 Q12002
Q3 Q12003
Q3 Q12004
Q3 Q12005
Q3 Q12006
Q3 Q12007
Q3 Q12008
Q3 Q12009
Q3
Quarter of vaccination
Num
ber o
f rec
ords
MenCCV
7vPCV
Rotavirus
pH1N1
DTPa-IPV
Hexavalent
Commencement of 7vPCV + catch-up program
Introduction of rotavirus vaccine
* Meningococcal C conjugate vaccine (MenCCV) was
introduced into the NIP schedule on 1 January 2003; 7-valent pneumococcal conjugate vaccine (7vPCV) on 1 January 2005; DTPa-IPV and DTPa-IPV-HepB-Hib (hexavalent) vaccines in November 2005; rotavirus (RotaTeq® and Rotarix®) vaccines on 1 July 2007; and pH1N1 infl uenza vaccine on 30 September 2009.
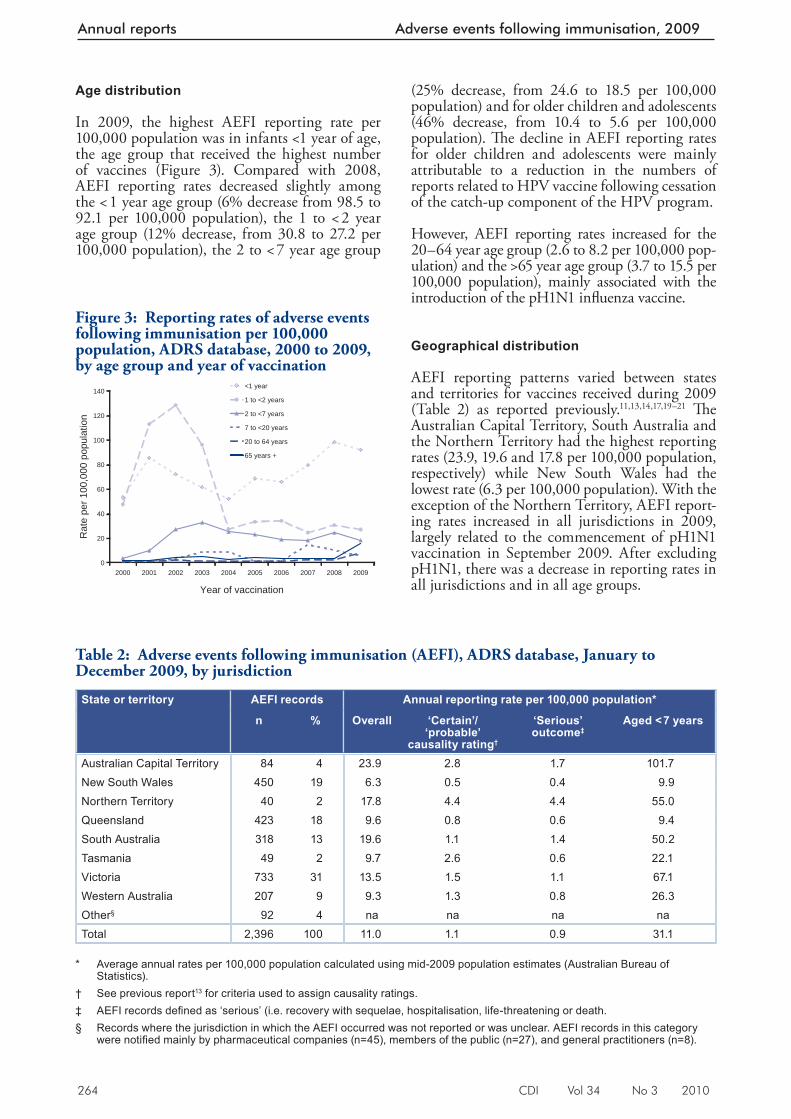
264 CDI Vol 34 No 3 2010
Annual reports Adverse events following immunisation, 2009
Age distribution
In 2009, the highest AEFI reporting rate per 100,000 population was in infants <1 year of age, the age group that received the highest number of vaccines (Figure 3). Compared with 2008, AEFI reporting rates decreased slightly among the < 1 year age group (6% decrease from 98.5 to 92.1 per 100,000 population), the 1 to < 2 year age group (12% decrease, from 30.8 to 27.2 per 100,000 population), the 2 to < 7 year age group
(25% decrease, from 24.6 to 18.5 per 100,000 population) and for older children and adolescents (46% decrease, from 10.4 to 5.6 per 100,000 population). Th e decline in AEFI reporting rates for older children and adolescents were mainly attributable to a reduction in the numbers of reports related to HPV vaccine following cessation of the catch-up component of the HPV program.
However, AEFI reporting rates increased for the 20–64 year age group (2.6 to 8.2 per 100,000 pop-ulation) and the >65 year age group (3.7 to 15.5 per 100,000 population), mainly associated with the introduction of the pH1N1 infl uenza vaccine.
Geographical distribution
AEFI reporting patterns varied between states and territories for vaccines received during 2009 (Table 2) as reported previously. 11,13,14,17,19–21 Th e Australian Capital Territory, South Australia and the Northern Territory had the highest reporting rates (23.9, 19.6 and 17.8 per 100,000 population, respectively) while New South Wales had the lowest rate (6.3 per 100,000 population). With the exception of the Northern Territory, AEFI report-ing rates increased in all jurisdictions in 2009, largely related to the commencement of pH1N1 vaccination in September 2009. After excluding pH1N1, there was a decrease in reporting rates in all jurisdictions and in all age groups.
Table 2: Adverse events following immunisation (AEFI), ADRS database, January to December 2009, by jurisdiction
State or territory AEFI records Annual reporting rate per 100,000 population*
n % Overall ‘Certain’/ ‘probable’
causality rating†
‘Serious’ outcome‡
Aged < 7 years
Australian Capital Territory 84 4 23.9 2.8 1.7 101.7New South Wales 450 19 6.3 0.5 0.4 9.9Northern Territory 40 2 17.8 4.4 4.4 55.0Queensland 423 18 9.6 0.8 0.6 9.4South Australia 318 13 19.6 1.1 1.4 50.2Tasmania 49 2 9.7 2.6 0.6 22.1Victoria 733 31 13.5 1.5 1.1 67.1Western Australia 207 9 9.3 1.3 0.8 26.3Other§ 92 4 na na na naTotal 2,396 100 11.0 1.1 0.9 31.1
* Average annual rates per 100,000 population calculated using mid-2009 population estimates (Australian Bureau of
Statistics). † See previous report 13 for criteria used to assign causality ratings. ‡ AEFI records defi ned as ‘serious’ (i.e. recovery with sequelae, hospitalisation, life-threatening or death. § Records where the jurisdiction in which the AEFI occurred was not reported or was unclear. AEFI records in this category
were notifi ed mainly by pharmaceutical companies (n=45), members of the public (n=27), and general practitioners (n=8).
Figure 3: Reporting rates of adverse events following immunisation per 100,000 population, ADRS database, 2000 to 2009, by age group and year of vaccination
0
20
40
60
80
100
120
140
2000 2001 2002 2003 2004 2005 2006 2007 2008 2009
Year of vaccination
Rat
e pe
r 100
,000
pop
ulat
ion
<1 year
1 to <2 years
2 to <7 years
7 to <20 years
20 to 64 years
65 years +
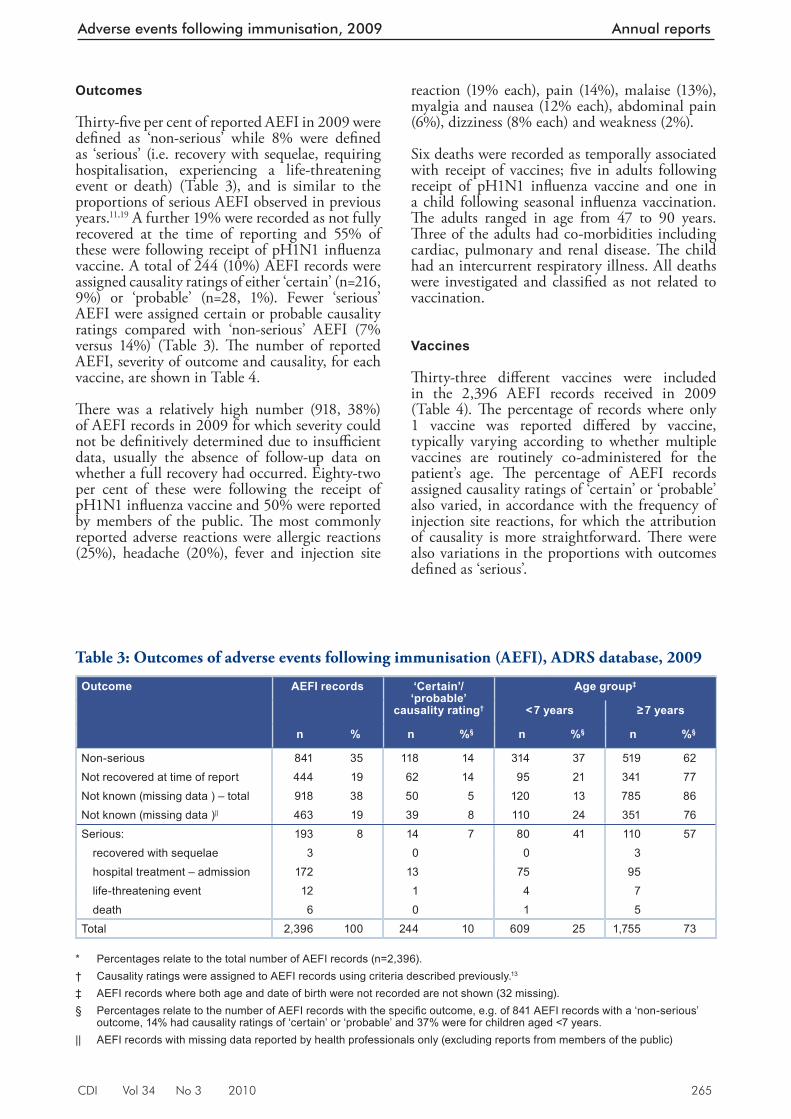
CDI Vol 34 No 3 2010 265
Adverse events following immunisation, 2009 Annual reports
Outcomes
Th irty-fi ve per cent of reported AEFI in 2009 were defi ned as ‘non-serious’ while 8% were defi ned as ‘serious’ (i.e. recovery with sequelae, requiring hospitalisation, experiencing a life-threatening event or death) (Table 3), and is similar to the proportions of serious AEFI observed in previous years. 11,19 A further 19% were recorded as not fully recovered at the time of reporting and 55% of these were following receipt of pH1N1 infl uenza vaccine. A total of 244 (10%) AEFI records were assigned causality ratings of either ‘certain’ (n=216, 9%) or ‘probable’ (n=28, 1%). Fewer ‘serious’ AEFI were assigned certain or probable causality ratings compared with ‘non-serious’ AEFI (7% versus 14%) (Table 3). Th e number of reported AEFI, severity of outcome and causality, for each vaccine, are shown in Table 4.
Th ere was a relatively high number (918, 38%) of AEFI records in 2009 for which severity could not be defi nitively determined due to insuffi cient data, usually the absence of follow-up data on whether a full recovery had occurred. Eighty-two per cent of these were following the receipt of pH1N1 infl uenza vaccine and 50% were reported by members of the public. Th e most commonly reported adverse reactions were allergic reactions (25%), headache (20%), fever and injection site
reaction (19% each), pain (14%), malaise (13%), myalgia and nausea (12% each), abdominal pain (6%), dizziness (8% each) and weakness (2%).
Six deaths were recorded as temporally associated with receipt of vaccines; fi ve in adults following receipt of pH1N1 infl uenza vaccine and one in a child following seasonal infl uenza vaccination. Th e adults ranged in age from 47 to 90 years. Th ree of the adults had co-morbidities including cardiac, pulmonary and renal disease. Th e child had an intercurrent respiratory illness. All deaths were investigated and classifi ed as not related to vaccination.
Vaccines
Th irty-three diff erent vaccines were included in the 2,396 AEFI records received in 2009 (Table 4). Th e percentage of records where only 1 vaccine was reported diff ered by vaccine, typically varying according to whether multiple vaccines are routinely co-administered for the patient’s age. Th e percentage of AEFI records assigned causality ratings of ‘certain’ or ‘probable’ also varied, in accordance with the frequency of injection site reactions, for which the attribution of causality is more straightforward. Th ere were also variations in the proportions with outcomes defi ned as ‘serious’.
Table 3: Outcomes of adverse events following immunisation (AEFI), ADRS database, 2009
Outcome AEFI records ‘Certain’/ ‘probable’
causality rating†
Age group‡
< 7 years ≥ 7 years
n % n %§ n %§ n %§
Non-serious 841 35 118 14 314 37 519 62Not recovered at time of report 444 19 62 14 95 21 341 77Not known (missing data ) – total 918 38 50 5 120 13 785 86Not known (missing data )|| 463 19 39 8 110 24 351 76Serious: 193 8 14 7 80 41 110 57
recovered with sequelae 3 0 0 3hospital treatment – admission 172 13 75 95life-threatening event 12 1 4 7death 6 0 1 5
Total 2,396 100 244 10 609 25 1,755 73 * Percentages relate to the total number of AEFI records (n=2,396). † Causality ratings were assigned to AEFI records using criteria described previously. 13
‡ AEFI records where both age and date of birth were not recorded are not shown (32 missing). § Percentages relate to the number of AEFI records with the specifi c outcome, e.g. of 841 AEFI records with a ‘non-serious’
outcome, 14% had causality ratings of ‘certain’ or ‘probable’ and 37% were for children aged <7 years. || AEFI records with missing data reported by health professionals only (excluding reports from members of the public)
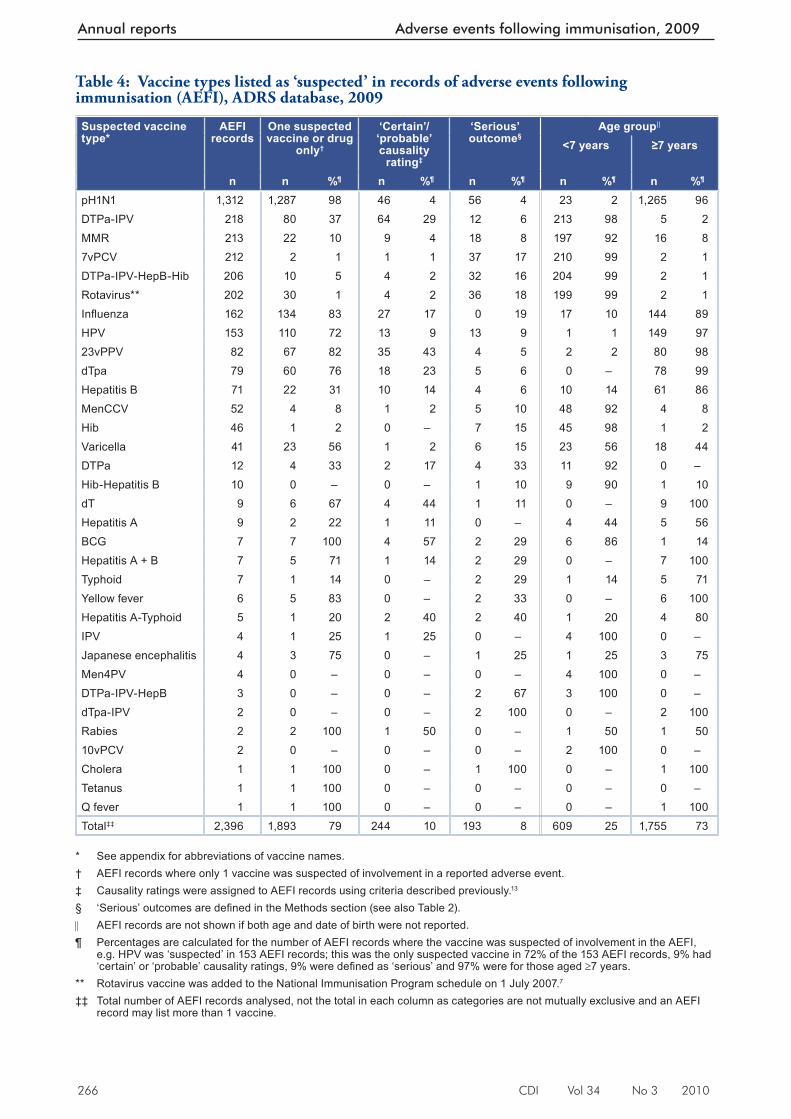
266 CDI Vol 34 No 3 2010
Annual reports Adverse events following immunisation, 2009
Table 4: Vaccine types listed as ‘suspected’ in records of adverse events following immunisation (AEFI), ADRS database, 2009
Suspected vaccine type*
AEFI records
One suspected vaccine or drug
only†
‘Certain’/ ‘probable’ causality
rating‡
‘Serious’ outcome§
Age group||
<7 years ≥7 years
n n %¶ n %¶ n %¶ n %¶ n %¶
pH1N1 1,312 1,287 98 46 4 56 4 23 2 1,265 96DTPa-IPV 218 80 37 64 29 12 6 213 98 5 2MMR 213 22 10 9 4 18 8 197 92 16 87vPCV 212 2 1 1 1 37 17 210 99 2 1DTPa-IPV-HepB-Hib 206 10 5 4 2 32 16 204 99 2 1Rotavirus** 202 30 1 4 2 36 18 199 99 2 1Infl uenza 162 134 83 27 17 0 19 17 10 144 89HPV 153 110 72 13 9 13 9 1 1 149 9723vPPV 82 67 82 35 43 4 5 2 2 80 98dTpa 79 60 76 18 23 5 6 0 – 78 99Hepatitis B 71 22 31 10 14 4 6 10 14 61 86MenCCV 52 4 8 1 2 5 10 48 92 4 8Hib 46 1 2 0 – 7 15 45 98 1 2Varicella 41 23 56 1 2 6 15 23 56 18 44DTPa 12 4 33 2 17 4 33 11 92 0 –Hib-Hepatitis B 10 0 – 0 – 1 10 9 90 1 10dT 9 6 67 4 44 1 11 0 – 9 100Hepatitis A 9 2 22 1 11 0 – 4 44 5 56BCG 7 7 100 4 57 2 29 6 86 1 14Hepatitis A + B 7 5 71 1 14 2 29 0 – 7 100Typhoid 7 1 14 0 – 2 29 1 14 5 71Yellow fever 6 5 83 0 – 2 33 0 – 6 100Hepatitis A-Typhoid 5 1 20 2 40 2 40 1 20 4 80IPV 4 1 25 1 25 0 – 4 100 0 –Japanese encephalitis 4 3 75 0 – 1 25 1 25 3 75Men4PV 4 0 – 0 – 0 – 4 100 0 –DTPa-IPV-HepB 3 0 – 0 – 2 67 3 100 0 –dTpa-IPV 2 0 – 0 – 2 100 0 – 2 100Rabies 2 2 100 1 50 0 – 1 50 1 5010vPCV 2 0 – 0 – 0 – 2 100 0 –Cholera 1 1 100 0 – 1 100 0 – 1 100Tetanus 1 1 100 0 – 0 – 0 – 0 –Q fever 1 1 100 0 – 0 – 0 – 1 100Total‡‡ 2,396 1,893 79 244 10 193 8 609 25 1,755 73
* See appendix for abbreviations of vaccine names. † AEFI records where only 1 vaccine was suspected of involvement in a reported adverse event. ‡ Causality ratings were assigned to AEFI records using criteria described previously. 13
§ ‘Serious’ outcomes are defi ned in the Methods section (see also Table 2). AEFI records are not shown if both age and date of birth were not reported. ¶ Percentages are calculated for the number of AEFI records where the vaccine was suspected of involvement in the AEFI,
e.g. HPV was ‘suspected’ in 153 AEFI records; this was the only suspected vaccine in 72% of the 153 AEFI records, 9% had ‘certain’ or ‘probable’ causality ratings, 9% were defi ned as ‘serious’ and 97% were for those aged 7 years.
** Rotavirus vaccine was added to the National Immunisation Program schedule on 1 July 2007. 7
‡‡ Total number of AEFI records analysed, not the total in each column as categories are not mutually exclusive and an AEFI record may list more than 1 vaccine.
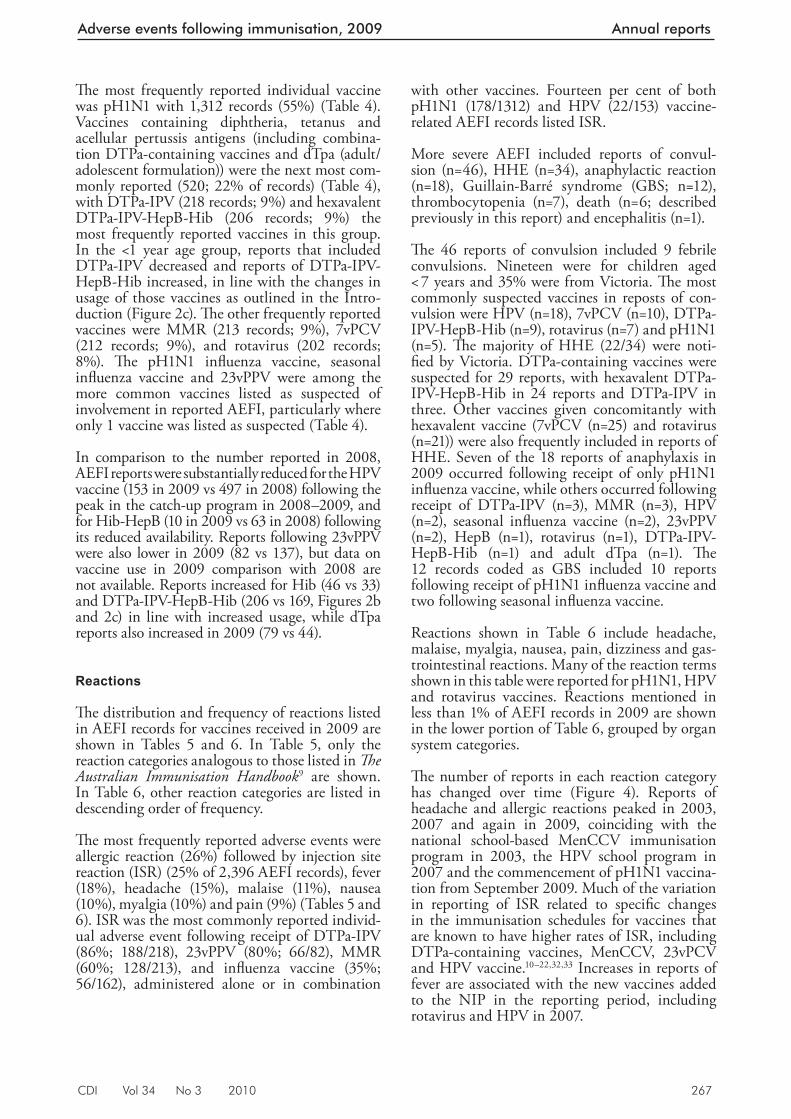
CDI Vol 34 No 3 2010 267
Adverse events following immunisation, 2009 Annual reports
Th e most frequently reported individual vaccine was pH1N1 with 1,312 records (55%) (Table 4). Vaccines containing diphtheria, tetanus and acellular pertussis antigens (including combina-tion DTPa-containing vaccines and dTpa (adult/adolescent formulation)) were the next most com-monly reported (520; 22% of records) (Table 4), with DTPa-IPV (218 records; 9%) and hexavalent DTPa-IPV-HepB-Hib (206 records; 9%) the most frequently reported vaccines in this group. In the <1 year age group, reports that included DTPa-IPV decreased and reports of DTPa-IPV-HepB-Hib increased, in line with the changes in usage of those vaccines as outlined in the Intro-duction (Figure 2c). Th e other frequently reported vaccines were MMR (213 records; 9%), 7vPCV (212 records; 9%), and rotavirus (202 records; 8%). Th e pH1N1 infl uenza vaccine, seasonal infl uenza vaccine and 23vPPV were among the more common vaccines listed as suspected of involvement in reported AEFI, particularly where only 1 vaccine was listed as suspected (Table 4).
In comparison to the number reported in 2008, AEFI reports were substantially reduced for the HPV vaccine (153 in 2009 vs 497 in 2008) following the peak in the catch-up program in 2008–2009, and for Hib-HepB (10 in 2009 vs 63 in 2008) following its reduced availability. Reports following 23vPPV were also lower in 2009 (82 vs 137), but data on vaccine use in 2009 comparison with 2008 are not available. Reports increased for Hib (46 vs 33) and DTPa-IPV-HepB-Hib (206 vs 169, Figures 2b and 2c) in line with increased usage, while dTpa reports also increased in 2009 (79 vs 44).
Reactions
Th e distribution and frequency of reactions listed in AEFI records for vaccines received in 2009 are shown in Tables 5 and 6. In Table 5, only the reaction categories analogous to those listed in Th e Australian Immunisation Handbook 9 are shown. In Table 6, other reaction categories are listed in descending order of frequency.
Th e most frequently reported adverse events were allergic reaction (26%) followed by injection site reaction (ISR) (25% of 2,396 AEFI records), fever (18%), headache (15%), malaise (11%), nausea (10%), myalgia (10%) and pain (9%) (Tables 5 and 6). ISR was the most commonly reported individ-ual adverse event following receipt of DTPa-IPV (86%; 188/218), 23vPPV (80%; 66/82), MMR (60%; 128/213), and infl uenza vaccine (35%; 56/162), administered alone or in combination
with other vaccines. Fourteen per cent of both pH1N1 (178/1312) and HPV (22/153) vaccine-related AEFI records listed ISR.
More severe AEFI included reports of convul-sion (n=46), HHE (n=34), anaphylactic reaction (n=18), Guillain-Barré syndrome (GBS; n=12), thrombocytopenia (n=7), death (n=6; described previously in this report) and encephalitis (n=1).
Th e 46 reports of convulsion included 9 febrile convulsions. Nineteen were for children aged < 7 years and 35% were from Victoria. Th e most commonly suspected vaccines in reposts of con-vulsion were HPV (n=18), 7vPCV (n=10), DTPa-IPV-HepB-Hib (n=9), rotavirus (n=7) and pH1N1 (n=5). Th e majority of HHE (22/34) were noti-fi ed by Victoria. DTPa-containing vaccines were suspected for 29 reports, with hexavalent DTPa-IPV-HepB-Hib in 24 reports and DTPa-IPV in three. Other vaccines given concomitantly with hexavalent vaccine (7vPCV (n=25) and rotavirus (n=21)) were also frequently included in reports of HHE. Seven of the 18 reports of anaphylaxis in 2009 occurred following receipt of only pH1N1 infl uenza vaccine, while others occurred following receipt of DTPa-IPV (n=3), MMR (n=3), HPV (n=2), seasonal infl uenza vaccine (n=2), 23vPPV (n=2), HepB (n=1), rotavirus (n=1), DTPa-IPV-HepB-Hib (n=1) and adult dTpa (n=1). Th e 12 records coded as GBS included 10 reports following receipt of pH1N1 infl uenza vaccine and two following seasonal infl uenza vaccine.
Reactions shown in Table 6 include headache, malaise, myalgia, nausea, pain, dizziness and gas-trointestinal reactions. Many of the reaction terms shown in this table were reported for pH1N1, HPV and rotavirus vaccines. Reactions mentioned in less than 1% of AEFI records in 2009 are shown in the lower portion of Table 6, grouped by organ system categories.
Th e number of reports in each reaction category has changed over time (Figure 4). Reports of headache and allergic reactions peaked in 2003, 2007 and again in 2009, coinciding with the national school-based MenCCV immunisation program in 2003, the HPV school program in 2007 and the commencement of pH1N1 vaccina-tion from September 2009. Much of the variation in reporting of ISR related to specifi c changes in the immunisation schedules for vaccines that are known to have higher rates of ISR, including DTPa-containing vaccines, MenCCV, 23vPCV and HPV vaccine. 10–22,32,33 Increases in reports of fever are associated with the new vaccines added to the NIP in the reporting period, including rotavirus and HPV in 2007.
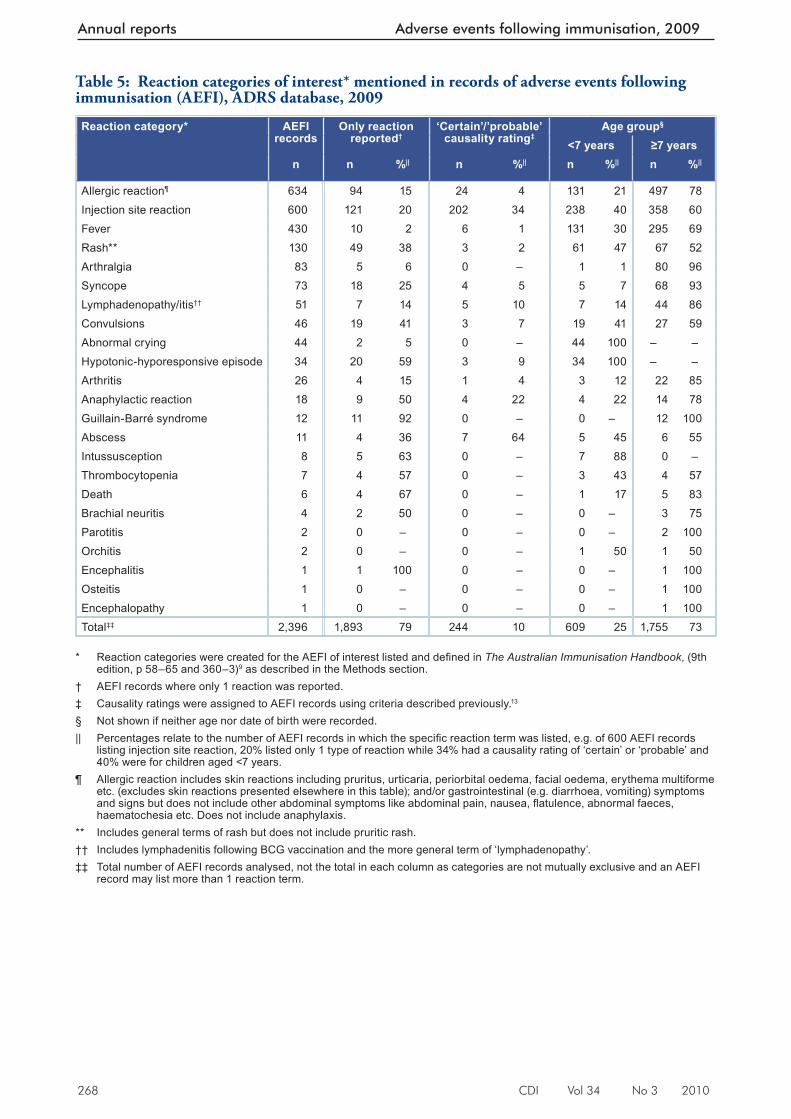
268 CDI Vol 34 No 3 2010
Annual reports Adverse events following immunisation, 2009
Table 5: Reaction categories of interest* mentioned in records of adverse events following immunisation (AEFI), ADRS database, 2009
Reaction category* AEFI records
Only reaction reported†
‘Certain’/’probable’ causality rating‡
Age group§
<7 years ≥7 yearsn n %|| n %|| n %|| n %||
Allergic reaction¶ 634 94 15 24 4 131 21 497 78Injection site reaction 600 121 20 202 34 238 40 358 60Fever 430 10 2 6 1 131 30 295 69Rash** 130 49 38 3 2 61 47 67 52Arthralgia 83 5 6 0 – 1 1 80 96Syncope 73 18 25 4 5 5 7 68 93Lymphadenopathy/itis†† 51 7 14 5 10 7 14 44 86Convulsions 46 19 41 3 7 19 41 27 59Abnormal crying 44 2 5 0 – 44 100 – –Hypotonic-hyporesponsive episode 34 20 59 3 9 34 100 – –Arthritis 26 4 15 1 4 3 12 22 85Anaphylactic reaction 18 9 50 4 22 4 22 14 78Guillain-Barré syndrome 12 11 92 0 – 0 – 12 100Abscess 11 4 36 7 64 5 45 6 55Intussusception 8 5 63 0 – 7 88 0 –Thrombocytopenia 7 4 57 0 – 3 43 4 57Death 6 4 67 0 – 1 17 5 83Brachial neuritis 4 2 50 0 – 0 – 3 75Parotitis 2 0 – 0 – 0 – 2 100Orchitis 2 0 – 0 – 1 50 1 50Encephalitis 1 1 100 0 – 0 – 1 100Osteitis 1 0 – 0 – 0 – 1 100Encephalopathy 1 0 – 0 – 0 – 1 100Total‡‡ 2,396 1,893 79 244 10 609 25 1,755 73
* Reaction categories were created for the AEFI of interest listed and defi ned in The Australian Immunisation Handbook , (9th
edition, p 58–65 and 360–3) 9 as described in the Methods section. † AEFI records where only 1 reaction was reported. ‡ Causality ratings were assigned to AEFI records using criteria described previously. 13
§ Not shown if neither age nor date of birth were recorded. || Percentages relate to the number of AEFI records in which the specifi c reaction term was listed, e.g. of 600 AEFI records
listing injection site reaction, 20% listed only 1 type of reaction while 34% had a causality rating of ‘certain’ or ‘probable’ and 40% were for children aged <7 years.
¶ Allergic reaction includes skin reactions including pruritus, urticaria, periorbital oedema, facial oedema, erythema multiforme etc. (excludes skin reactions presented elsewhere in this table); and/or gastrointestinal (e.g. diarrhoea, vomiting) symptoms and signs but does not include other abdominal symptoms like abdominal pain, nausea, fl atulence, abnormal faeces, haematochesia etc. Does not include anaphylaxis.
** Includes general terms of rash but does not include pruritic rash. †† Includes lymphadenitis following BCG vaccination and the more general term of ‘lymphadenopathy’. ‡‡ Total number of AEFI records analysed, not the total in each column as categories are not mutually exclusive and an AEFI
record may list more than 1 reaction term.
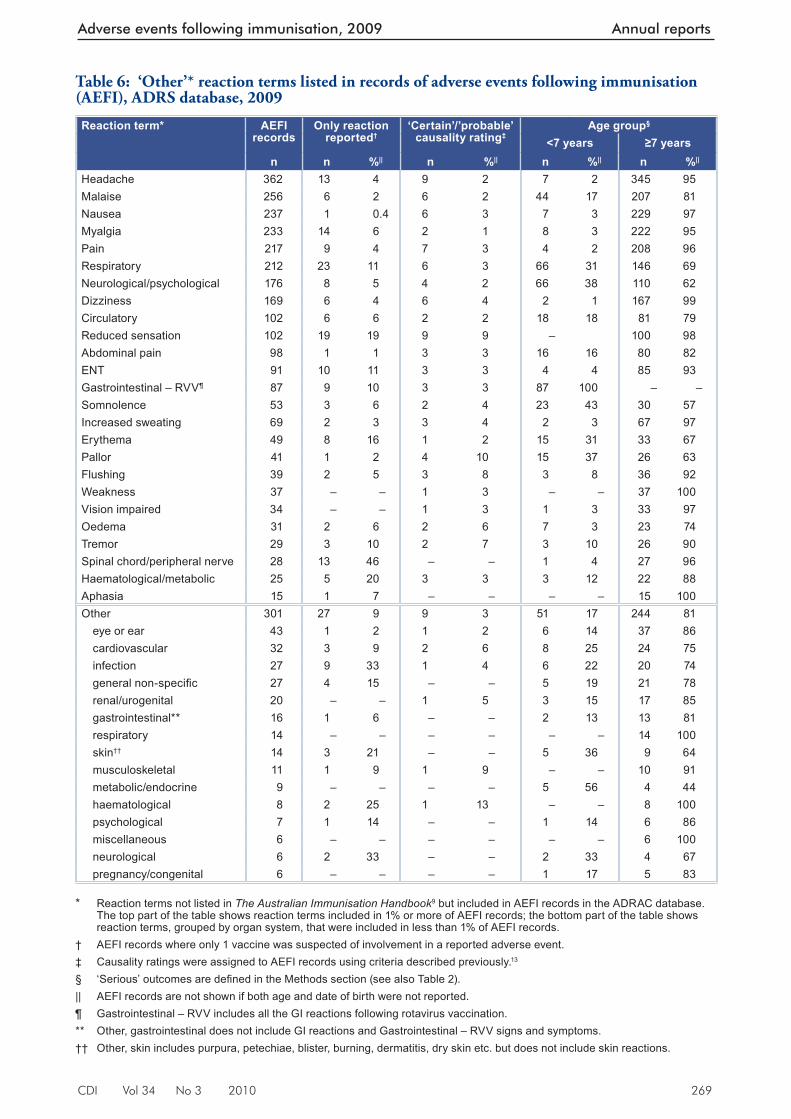
CDI Vol 34 No 3 2010 269
Adverse events following immunisation, 2009 Annual reports
Table 6: ‘Other’* reaction terms listed in records of adverse events following immunisation (AEFI), ADRS database, 2009
Reaction term* AEFI records
Only reaction reported†
‘Certain’/’probable’ causality rating‡
Age group§
<7 years ≥7 yearsn n %|| n %|| n %|| n %||
Headache 362 13 4 9 2 7 2 345 95Malaise 256 6 2 6 2 44 17 207 81Nausea 237 1 0.4 6 3 7 3 229 97Myalgia 233 14 6 2 1 8 3 222 95Pain 217 9 4 7 3 4 2 208 96Respiratory 212 23 11 6 3 66 31 146 69Neurological/psychological 176 8 5 4 2 66 38 110 62Dizziness 169 6 4 6 4 2 1 167 99Circulatory 102 6 6 2 2 18 18 81 79Reduced sensation 102 19 19 9 9 – 100 98Abdominal pain 98 1 1 3 3 16 16 80 82ENT 91 10 11 3 3 4 4 85 93Gastrointestinal – RVV¶ 87 9 10 3 3 87 100 – –Somnolence 53 3 6 2 4 23 43 30 57Increased sweating 69 2 3 3 4 2 3 67 97Erythema 49 8 16 1 2 15 31 33 67Pallor 41 1 2 4 10 15 37 26 63Flushing 39 2 5 3 8 3 8 36 92Weakness 37 – – 1 3 – – 37 100Vision impaired 34 – – 1 3 1 3 33 97Oedema 31 2 6 2 6 7 3 23 74Tremor 29 3 10 2 7 3 10 26 90Spinal chord/peripheral nerve 28 13 46 – – 1 4 27 96Haematological/metabolic 25 5 20 3 3 3 12 22 88Aphasia 15 1 7 – – – – 15 100Other 301 27 9 9 3 51 17 244 81
eye or ear 43 1 2 1 2 6 14 37 86cardiovascular 32 3 9 2 6 8 25 24 75infection 27 9 33 1 4 6 22 20 74general non-specifi c 27 4 15 – – 5 19 21 78renal/urogenital 20 – – 1 5 3 15 17 85gastrointestinal** 16 1 6 – – 2 13 13 81respiratory 14 – – – – – – 14 100skin†† 14 3 21 – – 5 36 9 64musculoskeletal 11 1 9 1 9 – – 10 91metabolic/endocrine 9 – – – – 5 56 4 44haematological 8 2 25 1 13 – – 8 100psychological 7 1 14 – – 1 14 6 86miscellaneous 6 – – – – – – 6 100neurological 6 2 33 – – 2 33 4 67pregnancy/congenital 6 – – – – 1 17 5 83
* Reaction terms not listed in The Australian Immunisation Handbook 9 but included in AEFI records in the ADRAC database.
The top part of the table shows reaction terms included in 1% or more of AEFI records; the bottom part of the table shows reaction terms, grouped by organ system, that were included in less than 1% of AEFI records.
† AEFI records where only 1 vaccine was suspected of involvement in a reported adverse event. ‡ Causality ratings were assigned to AEFI records using criteria described previously. 13
§ ‘Serious’ outcomes are defi ned in the Methods section (see also Table 2). || AEFI records are not shown if both age and date of birth were not reported. ¶ Gastrointestinal – RVV includes all the GI reactions following rotavirus vaccination. ** Other, gastrointestinal does not include GI reactions and Gastrointestinal – RVV signs and symptoms. †† Other, skin includes purpura, petechiae, blister, burning, dermatitis, dry skin etc. but does not include skin reactions.
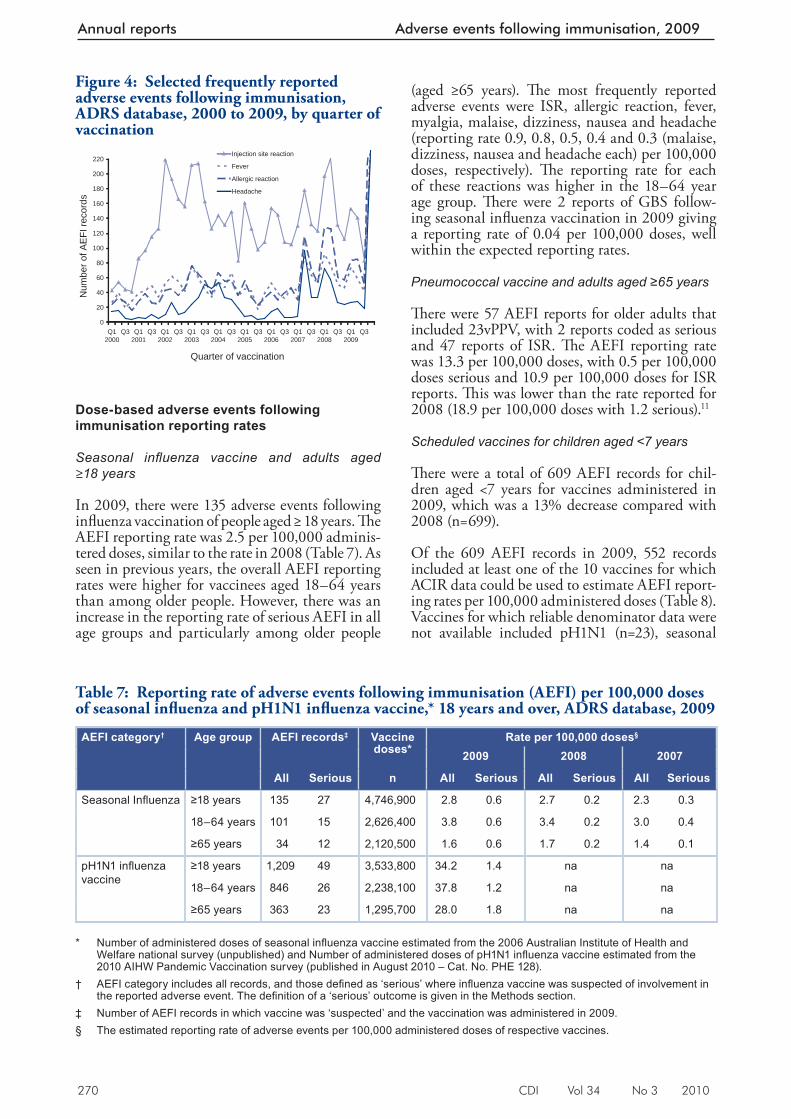
270 CDI Vol 34 No 3 2010
Annual reports Adverse events following immunisation, 2009
Dose-based adverse events following immunisation reporting rates
Seasonal infl uenza vaccine and adults aged ≥ 18 years
In 2009, there were 135 adverse events following infl uenza vaccination of people aged ≥ 18 years. Th e AEFI reporting rate was 2.5 per 100,000 adminis-tered doses, similar to the rate in 2008 (Table 7). As seen in previous years, the overall AEFI reporting rates were higher for vaccinees aged 18–64 years than among older people. However, there was an increase in the reporting rate of serious AEFI in all age groups and particularly among older people
(aged ≥65 years). Th e most frequently reported adverse events were ISR, allergic reaction, fever, myalgia, malaise, dizziness, nausea and headache (reporting rate 0.9, 0.8, 0.5, 0.4 and 0.3 (malaise, dizziness, nausea and headache each) per 100,000 doses, respectively). Th e reporting rate for each of these reactions was higher in the 18–64 year age group. Th ere were 2 reports of GBS follow-ing seasonal infl uenza vaccination in 2009 giving a reporting rate of 0.04 per 100,000 doses, well within the expected reporting rates.
Pneumococcal vaccine and adults aged ≥65 years
Th ere were 57 AEFI reports for older adults that included 23vPPV, with 2 reports coded as serious and 47 reports of ISR. Th e AEFI reporting rate was 13.3 per 100,000 doses, with 0.5 per 100,000 doses serious and 10.9 per 100,000 doses for ISR reports. Th is was lower than the rate reported for 2008 (18.9 per 100,000 doses with 1.2 serious). 11
Scheduled vaccines for children aged <7 years
Th ere were a total of 609 AEFI records for chil-dren aged <7 years for vaccines administered in 2009, which was a 13% decrease compared with 2008 (n=699).
Of the 609 AEFI records in 2009, 552 records included at least one of the 10 vaccines for which ACIR data could be used to estimate AEFI report-ing rates per 100,000 administered doses (Table 8). Vaccines for which reliable denominator data were not available included pH1N1 (n=23), seasonal
Table 7: Reporting rate of adverse events following immunisation (AEFI) per 100,000 doses of seasonal infl uenza and pH1N1 infl uenza vaccine,* 18 years and over, ADRS database, 2009
AEFI category† Age group AEFI records‡ Vaccine doses*
Rate per 100,000 doses§
2009 2008 2007
All Serious n All Serious All Serious All Serious
Seasonal Infl uenza ≥18 years 135 27 4,746,900 2.8 0.6 2.7 0.2 2.3 0.3
18–64 years 101 15 2,626,400 3.8 0.6 3.4 0.2 3.0 0.4
≥65 years 34 12 2,120,500 1.6 0.6 1.7 0.2 1.4 0.1
pH1N1 infl uenza vaccine
≥18 years 1,209 49 3,533,800 34.2 1.4 na na
18–64 years 846 26 2,238,100 37.8 1.2 na na
≥65 years 363 23 1,295,700 28.0 1.8 na na * Number of administered doses of seasonal infl uenza vaccine estimated from the 2006 Australian Institute of Health and
Welfare national survey (unpublished) and Number of administered doses of pH1N1 infl uenza vaccine estimated from the 2010 AIHW Pandemic Vaccination survey (published in August 2010 – Cat. No. PHE 128).
† AEFI category includes all records, and those defi ned as ‘serious’ where infl uenza vaccine was suspected of involvement in the reported adverse event. The defi nition of a ‘serious’ outcome is given in the Methods section.
‡ Number of AEFI records in which vaccine was ‘suspected’ and the vaccination was administered in 2009. § The estimated reporting rate of adverse events per 100,000 administered doses of respective vaccines.
Figure 4: Selected frequently reported adverse events following immunisation, ADRS database, 2000 to 2009, by quarter of vaccination
0
20
40
60
80
100
120
140
160
180
200
220
Q12000
Q3 Q12001
Q3 Q12002
Q3 Q12003
Q3 Q12004
Q3 Q12005
Q3 Q12006
Q3 Q12007
Q3 Q12008
Q3 Q12009
Q3
Quarter of vaccination
Num
ber o
f AE
FI re
cord
s
Injection site reaction
Fever
Allergic reaction
Headache
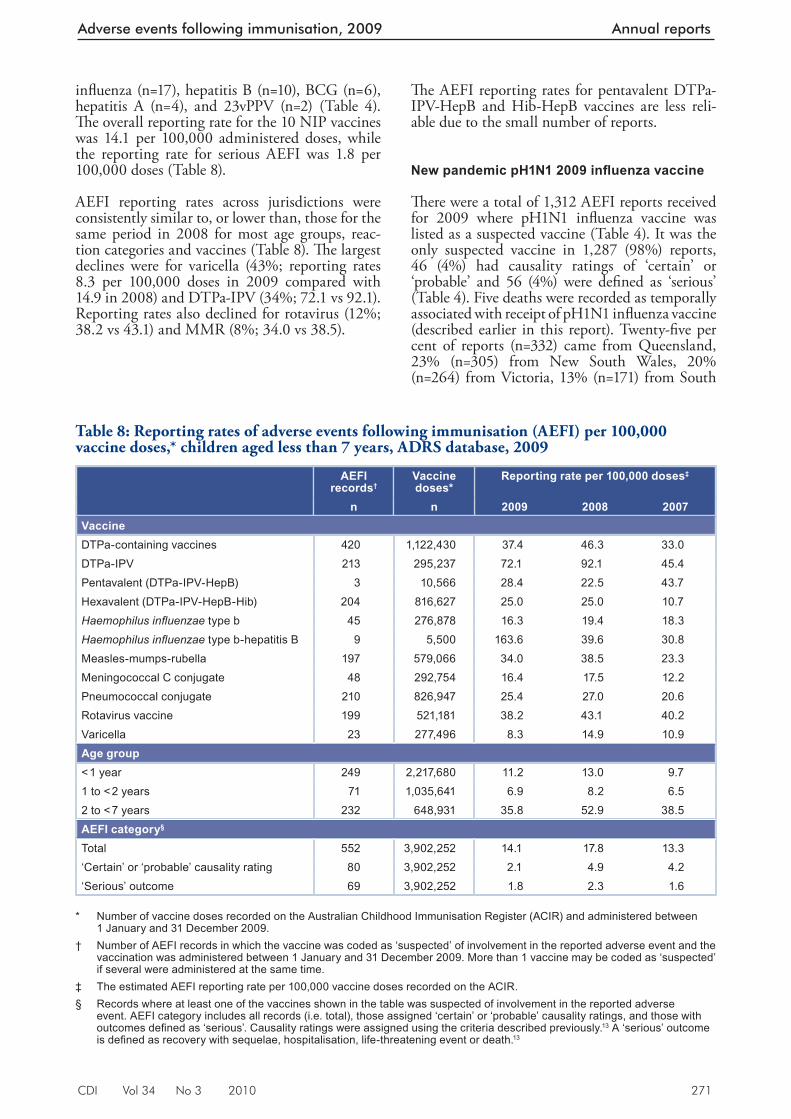
CDI Vol 34 No 3 2010 271
Adverse events following immunisation, 2009 Annual reports
infl uenza (n=17), hepatitis B (n=10), BCG (n=6), hepatitis A (n=4), and 23vPPV (n=2) (Table 4). Th e overall reporting rate for the 10 NIP vaccines was 14.1 per 100,000 administered doses, while the reporting rate for serious AEFI was 1.8 per 100,000 doses (Table 8).
AEFI reporting rates across jurisdictions were consistently similar to, or lower than, those for the same period in 2008 for most age groups, reac-tion categories and vaccines (Table 8). Th e largest declines were for varicella (43%; reporting rates 8.3 per 100,000 doses in 2009 compared with 14.9 in 2008) and DTPa-IPV (34%; 72.1 vs 92.1). Reporting rates also declined for rotavirus (12%; 38.2 vs 43.1) and MMR (8%; 34.0 vs 38.5).
Th e AEFI reporting rates for pentavalent DTPa-IPV-HepB and Hib-HepB vaccines are less reli-able due to the small number of reports.
New pandemic pH1N1 2009 infl uenza vaccine
Th ere were a total of 1,312 AEFI reports received for 2009 where pH1N1 infl uenza vaccine was listed as a suspected vaccine (Table 4). It was the only suspected vaccine in 1,287 (98%) reports, 46 (4%) had causality ratings of ‘certain’ or ‘probable’ and 56 (4%) were defi ned as ‘serious’ (Table 4). Five deaths were recorded as temporally associated with receipt of pH1N1 infl uenza vaccine (described earlier in this report). Twenty-fi ve per cent of reports (n=332) came from Queensland, 23% (n=305) from New South Wales, 20% (n=264) from Victoria, 13% (n=171) from South
Table 8: Reporting rates of adverse events following immunisation (AEFI) per 100,000 vaccine doses,* children aged less than 7 years, ADRS database, 2009
AEFI records†
Vaccine doses*
Reporting rate per 100,000 doses‡
n n 2009 2008 2007VaccineDTPa-containing vaccines 420 1,122,430 37.4 46.3 33.0DTPa-IPV 213 295,237 72.1 92.1 45.4Pentavalent (DTPa-IPV-HepB) 3 10,566 28.4 22.5 43.7Hexavalent (DTPa-IPV-HepB-Hib) 204 816,627 25.0 25.0 10.7Haemophilus infl uenzae type b 45 276,878 16.3 19.4 18.3Haemophilus infl uenzae type b-hepatitis B 9 5,500 163.6 39.6 30.8Measles-mumps-rubella 197 579,066 34.0 38.5 23.3Meningococcal C conjugate 48 292,754 16.4 17.5 12.2Pneumococcal conjugate 210 826,947 25.4 27.0 20.6Rotavirus vaccine 199 521,181 38.2 43.1 40.2Varicella 23 277,496 8.3 14.9 10.9Age group< 1 year 249 2,217,680 11.2 13.0 9.71 to < 2 years 71 1,035,641 6.9 8.2 6.52 to < 7 years 232 648,931 35.8 52.9 38.5AEFI category§
Total 552 3,902,252 14.1 17.8 13.3‘Certain’ or ‘probable’ causality rating 80 3,902,252 2.1 4.9 4.2‘Serious’ outcome 69 3,902,252 1.8 2.3 1.6
* Number of vaccine doses recorded on the Australian Childhood Immunisation Register (ACIR) and administered between
1 January and 31 December 2009. † Number of AEFI records in which the vaccine was coded as ‘suspected’ of involvement in the reported adverse event and the
vaccination was administered between 1 January and 31 December 2009. More than 1 vaccine may be coded as ‘suspected’ if several were administered at the same time.
‡ The estimated AEFI reporting rate per 100,000 vaccine doses recorded on the ACIR. § Records where at least one of the vaccines shown in the table was suspected of involvement in the reported adverse
event. AEFI category includes all records (i.e. total), those assigned ‘certain’ or ‘probable’ causality ratings, and those with outcomes defi ned as ‘serious’. Causality ratings were assigned using the criteria described previously. 13 A ‘serious’ outcome is defi ned as recovery with sequelae, hospitalisation, life-threatening event or death. 13
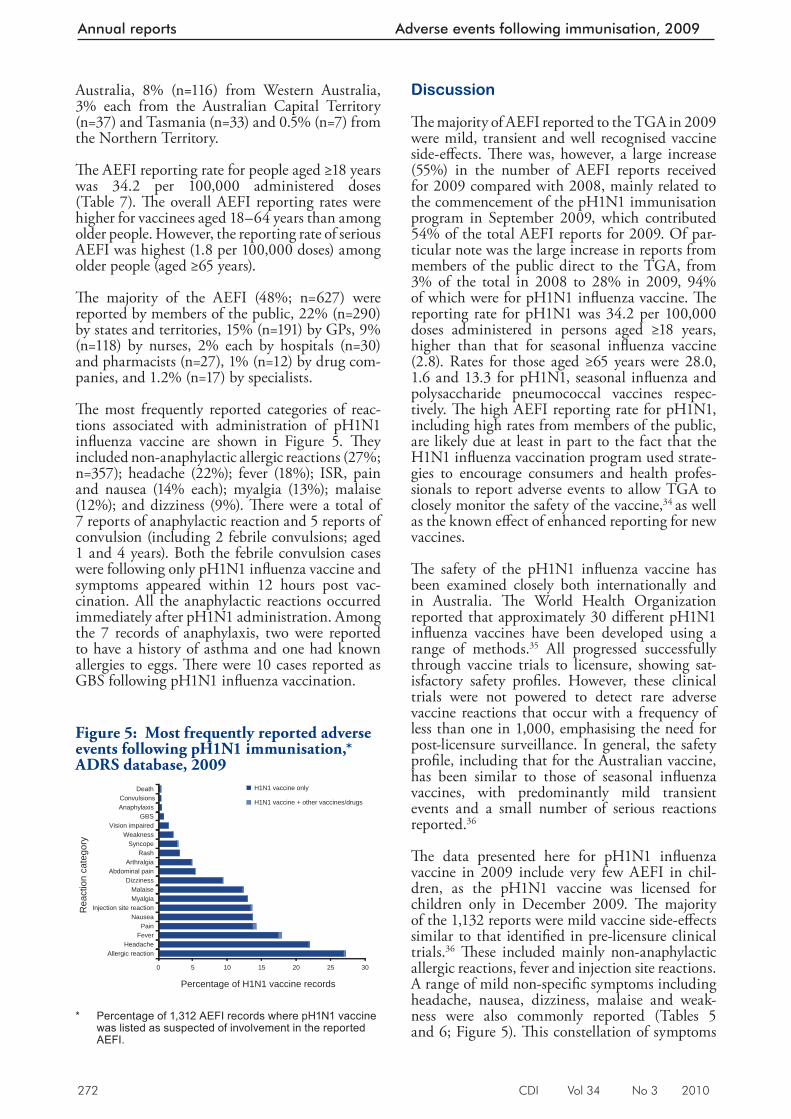
272 CDI Vol 34 No 3 2010
Annual reports Adverse events following immunisation, 2009
Australia, 8% (n=116) from Western Australia, 3% each from the Australian Capital Territory (n=37) and Tasmania (n=33) and 0.5% (n=7) from the Northern Territory.
Th e AEFI reporting rate for people aged ≥18 years was 34.2 per 100,000 administered doses (Table 7). Th e overall AEFI reporting rates were higher for vaccinees aged 18–64 years than among older people. However, the reporting rate of serious AEFI was highest (1.8 per 100,000 doses) among older people (aged ≥65 years).
Th e majority of the AEFI (48%; n=627) were reported by members of the public, 22% (n=290) by states and territories, 15% (n=191) by GPs, 9% (n=118) by nurses, 2% each by hospitals (n=30) and pharmacists (n=27), 1% (n=12) by drug com-panies, and 1.2% (n=17) by specialists.
Th e most frequently reported categories of reac-tions associated with administration of pH1N1 infl uenza vaccine are shown in Figure 5. Th ey included non-anaphylactic allergic reactions (27%; n=357); headache (22%); fever (18%); ISR, pain and nausea (14% each); myalgia (13%); malaise (12%); and dizziness (9%). Th ere were a total of 7 reports of anaphylactic reaction and 5 reports of convulsion (including 2 febrile convulsions; aged 1 and 4 years). Both the febrile convulsion cases were following only pH1N1 infl uenza vaccine and symptoms appeared within 12 hours post vac-cination. All the anaphylactic reactions occurred immediately after pH1N1 administration. Among the 7 records of anaphylaxis, two were reported to have a history of asthma and one had known allergies to eggs. Th ere were 10 cases reported as GBS following pH1N1 infl uenza vaccination.
Discussion
Th e majority of AEFI reported to the TGA in 2009 were mild, transient and well recognised vaccine side-eff ects. Th ere was, however, a large increase (55%) in the number of AEFI reports received for 2009 compared with 2008, mainly related to the commencement of the pH1N1 immunisation program in September 2009, which contributed 54% of the total AEFI reports for 2009. Of par-ticular note was the large increase in reports from members of the public direct to the TGA, from 3% of the total in 2008 to 28% in 2009, 94% of which were for pH1N1 infl uenza vaccine. Th e reporting rate for pH1N1 was 34.2 per 100,000 doses administered in persons aged ≥18 years, higher than that for seasonal infl uenza vaccine (2.8). Rates for those aged ≥65 years were 28.0, 1.6 and 13.3 for pH1N1, seasonal infl uenza and polysaccharide pneumococcal vaccines respec-tively. Th e high AEFI reporting rate for pH1N1, including high rates from members of the public, are likely due at least in part to the fact that the H1N1 infl uenza vaccination program used strate-gies to encourage consumers and health profes-sionals to report adverse events to allow TGA to closely monitor the safety of the vaccine, 34 as well as the known eff ect of enhanced reporting for new vaccines.
Th e safety of the pH1N1 infl uenza vaccine has been examined closely both internationally and in Australia. Th e World Health Organization reported that approximately 30 diff erent pH1N1 infl uenza vaccines have been developed using a range of methods. 35 All progressed successfully through vaccine trials to licensure, showing sat-isfactory safety profi les. However, these clinical trials were not powered to detect rare adverse vaccine reactions that occur with a frequency of less than one in 1,000, emphasising the need for post-licensure surveillance. In general, the safety profi le, including that for the Australian vaccine, has been similar to those of seasonal infl uenza vaccines, with predominantly mild transient events and a small number of serious reactions reported. 36
Th e data presented here for pH1N1 infl uenza vaccine in 2009 include very few AEFI in chil-dren, as the pH1N1 vaccine was licensed for children only in December 2009. Th e majority of the 1,132 reports were mild vaccine side-eff ects similar to that identifi ed in pre-licensure clinical trials. 36 Th ese included mainly non-anaphylactic allergic reactions, fever and injection site reactions. A range of mild non-specifi c symptoms including headache, nausea, dizziness, malaise and weak-ness were also commonly reported (Tables 5 and 6; Figure 5). Th is constellation of symptoms
Figure 5: Most frequently reported adverse events following pH1N1 immunisation,* ADRS database, 2009
0 5 10 15 20 25 30
Allergic reactionHeadache
FeverPain
NauseaInjection site reaction
MyalgiaMalaise
DizzinessAbdominal pain
ArthralgiaRash
SyncopeWeakness
Vision impairedGBS
AnaphylaxisConvulsions
Death
Rea
ctio
n ca
tego
ry
Percentage of H1N1 vaccine records
H1N1 vaccine only
H1N1 vaccine + other vaccines/drugs
* Percentage of 1,312 AEFI records where pH1N1 vaccine
was listed as suspected of involvement in the reported AEFI.
CDI Vol 34 No 3 2010 273
Adverse events following immunisation, 2009 Annual reports
is known to be associated with any new event of vaccination rather than any specifi c vaccine; data presented here are consistent with this experi-ence. While GBS was associated with a previous swine infl uenza vaccine in 1976, 37 international assessment of the current pH1N1 vaccines has found either no association, 34 or a slightly higher rate of GBS in vaccinees up to one per million vaccine doses, which is consistent with estimates for seasonal infl uenza vaccine. 38 Initial national analysis by the TGA has shown no indication of an increased rate of GBS, or anaphylaxis, another serious reaction of concern, associated with pH1N1 infl uenza vaccine in Australia. 39 None of the 5 deaths reported following receipt of pH1N1 infl uenza vaccine were regarded as likely to be causally associated with the vaccine.
After excluding reports for pH1N1, there was a 30% reduction in the number of AEFI reported to the TGA in 2009 compared with 2008 (Table 1). Th e majority of these (68%) were reported by states and territories and only 3% were reported by members of the public. Decreases were seen in all jurisdictions and in all age groups. Th e decreases were greater in adolescents, associated with the tapering off of the HPV catch-up campaign and possibly reduced reporting associated with greater familiarity with that vaccine. Decreases among children aged <7 years are likely to be a combina-tion of a stable vaccination schedule during 2008 and 2009, and reporting delay, which usually results in an underestimation of reports in the latest year of approximately 5%.
Conclusion
Th ere was a substantial increase in AEFI reported in 2009 associated with the introduction of the new pH1N1 infl uenza vaccine in September. A large number of reports were received from members of the public. However, the majority of AEFI reports were of mild, transient and well-recognised vaccine side-eff ects.
Th e regular analysis and publication of national AEFI surveillance data collated in the ADRAC database remains an important aspect of Aus-tralia’s immunisation program.
Acknowledgements
We thank Kristine Macartney for reviewing the manuscript and Brynley Hull and Donna Armstrong, National Centre for Immunisation Research and Surveillance of Vaccine Preventable Diseases, for assisting in the preparation of this report.
Th e National Centre for Immunisation Research and Surveillance of Vaccine Preventable Diseases is supported by the Australian Government Depart-ment of Health and Ageing, the New South Wales Department of Health and Th e Children’s Hospi-tal at Westmead, New South Wales.
Author details
Deepika Mahajan 1
Ilnaz Roomiani 2
Michael S Gold 3
Glenda L Lawrence 1,4
Peter B McIntyre 1
Rob I Menzies 1
1. National Centre for Immunisation Research and Surveillance of Vaccine Preventable Diseases, University of Sydney and The Children’s Hospital at Westmead, Sydney, New South Wales
2. Office of Product Review, Therapeutic Goods Administration, Canberra, Australian Capital Territory
3. Adverse Drug Reactions Advisory Committee and the University of Adelaide, Women’s and Children’s Hospital, Adelaide, South Australia
4. School of Public Health and Community Medicine, University of New South Wales, Sydney, New South Wales
Corresponding author: Dr Deepika Mahajan, National Centre for Immunisation Research and Surveillance, Locked Bag 4001, Westmead NSW 2145. Telephone: +61 2 9845 1433. Facsimile: +61 2 9845 1418. Email: [email protected]
References
1. Chen RT, DeStefano F, Pless R, Mootrey G, Kramarz P, Hibbs B. Challenges and controversies in immunization safety. Infect Dis Clin North Am 2001;15(1):21–39.
2. Duclos P. A global perspective on vaccine safety. Vaccine 2004;2215–16):2059–2063.
3. Immunisation Section, Communicable Disease Control Branch, South Australian Department of Health. New vaccine schedule from 1st March 2008. Sharp and to the point, Quarterly newsletter 2008;23:1. Accessed on 30 August 2010. Available from: http://www.dh.sa.gov.au/pehs/Immunisation/0803-sharp-point-news.pdf
4. Queensland Health. National Immunisation Program Queensland schedule commencing 1 March 2008. Accessed on 1 September 2010. Available from: http://www.health.sa.gov.au/immunisationcalculator/QldMar2008.pdf
274 CDI Vol 34 No 3 2010
Annual reports Adverse events following immunisation, 2009
5. Immunisation Program, Victorian Department of Human Services. Changed immunisation schedule from 1 March 2008. Immunisation newsletter Issue 32, January 2008. 2008;23:2. Accessed on 1 September 2010. Available from: http://www.health.vic.gov.au/__data/assets/pdf_file/0015/130083/Immunisation-newsletter-issue-32.pdf
6. Centers for Disease Control and Prevention. Continued shortage of Haemophilus influenzae type b (Hib) conjugate vaccines and potential implications for Hib sur veillance—United States, 2008. MMWR Morb Mortal Wkly Rep 2008;57(46):1252–1255.
7. Australian Government Department of Health and Ageing. Timeline of mass immunisation programs and initiatives. 2009. Accessed on 30 August 2010. Available from: http://immunise.health.gov.au/internet/immunise/publishing.nsf/Content/past-immu-prog
8. National Health and Medical Research Council. The Australian Immunisation Handbook. 8th edn. Canberra: Australian Government Department of Health and Ageing, 2003.
9. National Health and Medical Research Council. The Australian Immunisation Handbook. 9th edn. Canberra: Australian Government Department of Health and Ageing, 2008.
10. Mahajan D, Menzies R, Roomiani I, Lawrence GL. Supplementary report: surveillance of adverse events following immunisation among children aged < 7 years in Australia, 1 January to 30 June 2009. Commun Dis Intell 2010;34(1):49–53.
11. Menzies R, Mahajan D, Gold MS, Roomiani I, McInt yre P, Lawrence G. Annual repor t: sur vei l lance of adverse events fol lowing immunisation in Australia, 2008. Commun Dis Intell 2009;33(4):365–381.
12. Lawrence GL, Mahajan D, Roomiani I . Supplementary report: surveillance of adverse even t s fo l low ing immun i sa t ion among children aged less than 7 years in Australia, 1 January to 30 June 2008. Commun Dis Intell 2009;33(1):27–31.
13. Lawrence G, Menzies R, Burgess M, McIntyre P, Wood N, Boyd I, et al. Surveillance of adverse events following immunisation: Australia, 2000–2002. Commun Dis Intell 2003;27(3):307–323.
14. Lawrence G, Boyd I, McIntyre P, Isaacs D. Sur veil lance of adverse events following immunisation: Australia 2002 to 2003. Commun Dis Intell 2004;28(3):324–338.
15. Lawrence G, Boyd I. Surveillance of adverse events following immunisation for children aged less than 7 years, 1 January to 30 June 2004. Commun Dis Intell 2004;28(4):490–492.
16. Lawrence G, Boyd I. Supplementary repor t: sur vei l lance of adverse events fol lowing immunisation among children aged less than 7 years in Australia, 1 January to 30 June 2005. Commun Dis Intell 2005;29(4):413–416.
17. Lawrence G, Boyd I, McIntyre P, Isaacs D. Annual report: surveillance of adverse events following immunisation in Australia, 2005. Commun Dis Intell 2006;30(3):319–333.
18. Lawrence G, Boyd I. Supplementary repor t: sur vei l lance of adverse events fol lowing immunisation among children aged <7 years in Australia, 1 January to 30 June 2006. Commun Dis Intell 2006;30(4):438–442.
19. Lawrence G, Gold MS, Hill R, Deeks S, Glasswell A, McIntyre PB. Annual report: surveillance of adverse events following immunisation in Australia, 2007. Commun Dis Intell 2008;32(4):371–387.
20. Lawrence GL, Boyd I, McIntyre PB, Isaacs D. Annual report: surveillance of adverse events following immunisation in Australia, 2004. Erratum in Commun Dis Intell 2005;29(4):416. Commun Dis Intell 2005;29(3):248–262.
21. Lawrence GL, Aratchige PE, Boyd I, McIntyre PB, Gold MS. Annual report on surveillance of adverse events following immunisation in Australia, 2006. Commun Dis Intell 2007;31(3):269–282.
22. Lawrence GL, Aratchige PE, Hill R. Supplementary report: surveillance of adverse events following immunisation among children aged less than 7 years in Australia, 1 January to 30 June 2007. Commun Dis Intell 2007;31(4):379–382.
23. Uppsala Monitoring Centre. WHO Collaborating Centre for International Drug Monitoring. Accessed on 30 August 2010. Available from: http://www.who-umc.org/
CDI Vol 34 No 3 2010 275
Adverse events following immunisation, 2009 Annual reports
24. Zhou W, Pool V, Iskander JK, English-Bullard R, Ball R, Wise RP, et al. Surveillance for safety af ter immunization: Vaccine Adverse Event Repor ting System (VAERS)—United States, 1991–2001. Erratum in MMWR Morb Mortal Wkly Rep 2003;52(06):113. MMWR Surveill Summ 2003;52(1):1–24.
25. Brown EG, Wood L, Wood S. The medical dictionary for regulatory activities (MedDRA). Drug Saf 1999;20(2):109–117.
26. Bonhoeffer J, Gold MS, Heijbel H, Vermeer P, Blumberg D, Braun M, et al. Hypotonic-hyporesponsive episode (HHE) as an adverse event following immunization: case definition and guidelines for data collection, analysis, and presentation. Vaccine 2004;22(5–6):563–568.
27. Ruggeberg JU, Gold MS, Bayas JM, Blum MD, Bonhoeffer J, Friedlander S, et al. Anaphylaxis: case definition and guidelines for data collection, analysis, and presentation of immunization safety data. Vaccine 2007;25(31):5675–5684.
28. The SAS system for Windows (computer program). Version 9.1.3. Cary, N.C.: SAS Institute Inc, 2005.
29. Australian Institute of Health and Welfare 2010. 2010 Pandemic Vaccination Survey: summary results. Cat no PHE 128 Canberra:AIHW 2010;
30. Australian Government Department of Health and Ageing. Communicable diseases surveillance: Additional reports – Childhood immunisation coverage. Commun Dis Intell 2008;32(2):288–289.
31. Varricchio F, Iskander J, DeStefano F, Ball R, Pless R, Braun MM, et al. Understanding vaccine safety information from the Vaccine Adverse Event Repor ting System. Pediatr Infect Dis J 2004;23(4):287–294.
32. Joura EA, Leodolter S, Hernandez-Avila M, Wheeler CM, Perez G, Koutsky LA, et al. Efficacy of a quadrivalent prophylactic human papillomavirus (types 6, 11, 16, and 18) L1 virus-like-particle vaccine against high-grade vulval and vaginal lesions: a combined analysis of three randomised clinical trials. Lancet 2007;369(9574):1693–1702.
33. Reisinger KS, Block SL, Lazcano-Ponce E, Samakoses R, Esser MT, Erick J, et al. Safety and persistent immunogenicity of a quadrivalent human papillomavirus types 6, 11, 16, 18 L1 virus-like particle vaccine in preadolescents and adolescents: a randomized controlled trial. Pediatr Infect Dis J 2007;2(3)6:201–209.
34. Australian Government Department of Health and Ageing, Therapeutic Goods Administration, Cook J. Medicines Safety Update No.4, 2010. Australian experience with non-adjuvant H1N1 vaccine (Panvax and Panvax Junior). Accessed on 30 August 2010. Available from: http://www.tga.gov.au/adr/msu/msu1008.htm
35. World Health Organization. Safety of pandemic A (H1N1) influenza vaccines. Wkly Epidemiol Rec 2010;85(5):29–36.
36. Nolan T, McVernon J, Skeljo M, Richmond P, Wadia U, Lamber t S. Immunogenicity of a monovalent 2009 influenza A(H1N1) vaccine in infants and children: a randomized trial. JAMA 2010;303(1):37–46.
37. Schonberger LB, Bregman DJ, Sullivan-Bolyai JZ, Keenlyside RA, Ziegler DW, Retailliau HF, et al. Guillain-Barré syndrome following vaccination in the National Influenza Immunization Program, United States, 1976–1977. Am J Epidemiol 1979;110(2):105–123.
38. Centers for Disease Control and Prevention. Preliminary results: surveillance for Guillain-Barré syndrome after receipt of influenza A (H1N1) 2009 monovalent vaccine – United States, 2009–2010. MMWR Morb Mortal Wkly Rep 2010;59(21):657–661.
39. Australian Government Department of Health and Ageing, Therapeutic Goods Administration. Suspected adverse reactions to Panvax ® reported to the TGA 30 September 2009 – 30 April 2010. Accessed on 30 August 2010. Available from: http://www.tga.gov.au/alerts/medicines/h1n1vaccine1.htm
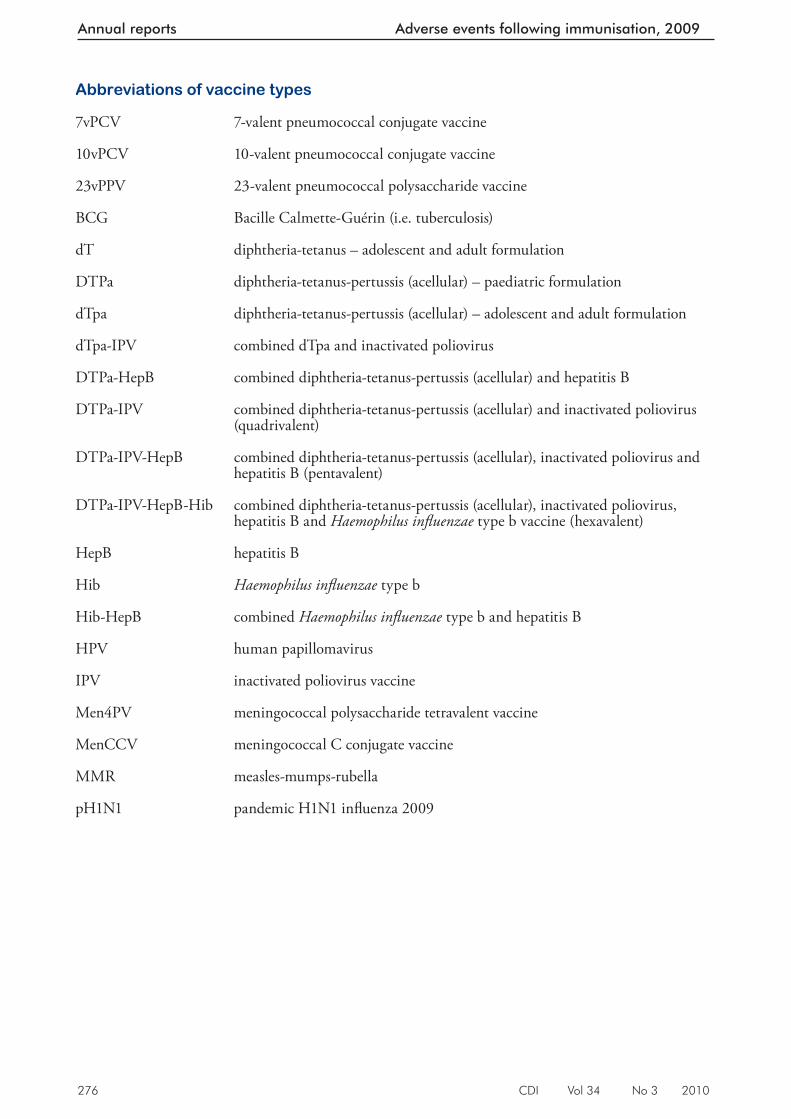
276 CDI Vol 34 No 3 2010
Annual reports Adverse events following immunisation, 2009
Abbreviations of vaccine types
7vPCV 7-valent pneumococcal conjugate vaccine
10vPCV 10-valent pneumococcal conjugate vaccine
23vPPV 23-valent pneumococcal polysaccharide vaccine
BCG Bacille Calmette-Guérin (i.e. tuberculosis)
dT diphtheria-tetanus – adolescent and adult formulation
DTPa diphtheria-tetanus-pertussis (acellular) – paediatric formulation
dTpa diphtheria-tetanus-pertussis (acellular) – adolescent and adult formulation
dTpa-IPV combined dTpa and inactivated poliovirus
DTPa-HepB combined diphtheria-tetanus-pertussis (acellular) and hepatitis B
DTPa-IPV combined diphtheria-tetanus-pertussis (acellular) and inactivated poliovirus (quadrivalent)
DTPa-IPV-HepB combined diphtheria-tetanus-pertussis (acellular), inactivated poliovirus and hepatitis B (pentavalent)
DTPa-IPV-HepB-Hib combined diphtheria-tetanus-pertussis (acellular), inactivated poliovirus, hepatitis B and Haemophilus infl uenzae type b vaccine (hexavalent)
HepB hepatitis B
Hib Haemophilus infl uenzae type b
Hib-HepB combined Haemophilus infl uenzae type b and hepatitis B
HPV human papillomavirus
IPV inactivated poliovirus vaccine
Men4PV meningococcal polysaccharide tetravalent vaccine
MenCCV meningococcal C conjugate vaccine
MMR measles-mumps-rubella
pH1N1 pandemic H1N1 infl uenza 2009
CDI Vol 34 No 3 2010 277
Australian National Poliovirus Reference Laboratory, 2009 Annual reports
Abstract
The Australian National Poliovirus Reference Labo-ratory (NPRL) is accredited by the World Health Organization (WHO) for the testing of faecal specimens from acute flaccid paralysis (AFP) cases and operates as a regional poliovirus reference laboratory for the Western Pacific Region. The NPRL, in collaboration with the Australian Paediat-ric Surveillance Unit, co-ordinates surveillance for cases of AFP in children in Australia, according to criteria recommended by the WHO. Specimens are referred from AFP cases in children and suspected cases of poliomyelitis in persons of any age. The WHO AFP surveillance performance indicator is 1 non-polio AFP case per 100,000 children less than 15 years of age. In 2009, the Polio Expert Committee classified 48 cases as non-polio AFP, a rate of 1.17 cases per 100,000 children less than 15 years of age. An additional WHO AFP surveil-lance performance indicator is that more than 80% of notified AFP cases have 2 faecal samples collected 24 hours apart and within 14 days of onset of paralysis. Adequate faecal samples were received from 16 (33.3%) of the 48 classified cases. A poliovirus was referred via the Enterovirus Reference Laboratory Network of Australia from a non-AFP case and was determined to be Sabin-like. This case most likely represents an importation event, the source of which was not identified, as Australia ceased using Sabin oral polio vaccine in 2005. The last report of a wild poliovirus impor-tation in Australia was from Pakistan in 2007. In 2009, 1,604 wild poliovirus cases were reported in 23 countries with Afghanistan, India, Nigeria and Pakistan remaining endemic for poliomyelitis. Commun Dis Intell 2010;34(3):277–284.
Keywords: poliovirus, acute fl accid paralysis, sur-veillance, enterovirus, poliomyelitis, eradication, vaccination
Introduction
Th e National Polio Reference Laboratory (NPRL) is responsible for the virological testing of faecal specimens from cases with a clinical suspicion of poliomyelitis. Th is includes cases of acute fl accid paralysis (AFP)—a major clinical presentation of poliomyelitis—in children less than 15 years of age and cases of suspected poliomyelitis in patients of
any age. Th e World Health Organization (WHO) recommends that 2 faecal specimens be collected from cases of AFP for virological investigation at least 24 hours apart and within 14 days of the onset of paralysis. It is a requirement of the WHO polio eradication program that the specimens are tested in a WHO accredited laboratory, which for Australia is the NPRL at the Victorian Infec-tious Diseases Reference Laboratory (VIDRL). Laboratory testing may exclude poliovirus as the causative agent of AFP. Enteroviruses other than poliovirus have been associated with AFP.
From November 2005, inactivated poliomyelitis vaccine (IPV) replaced oral poliomyelitis vaccine (OPV) in the National Immunisation Program. 1 IPV is administered to children at 2, 4 and 6 months of age, with a booster dose at 4 years of age. With the removal of OPV, containing ‘live’ attenuated virus, from the immunisation schedule, any poliovirus identifi ed by Australian virology lab-oratories requires further investigation to determine its origin, as it represents an importation event.
It is important that Australia maintains high levels of polio vaccine coverage to avoid a resur-gence of poliomyelitis in the event of a wild poliovirus importation. Reinforcement of this recommendation is evidenced by the large type 1 wild poliovirus outbreak in Tajikistan in 2010, a country with reportedly similar polio vaccination coverage (87% in 2008) and AFP surveillance performance as Australia (non-polio AFP rate of 1.4 in 2009). 2 As of 12 July 2010 there have been 413 confi rmed cases of poliomyelitis with 19 deaths in Tajikistan. 3 People travelling to polio endemic countries and countries with recent wild poliovirus importations should receive a booster polio vaccine prior to departure, or a full course of vaccination if they are unsure of their vaccination history. Individuals who are at continuing risk of infection, 4 such as health care workers, are rec-ommended to have a booster polio vaccine every 10 years. 5 Th e WHO provides a searchable data-base of global case counts and surveillance data at http://apps.who.int/immunization_monitoring/en/diseases/poliomyelitis/case_count.cfm
Th e Australian NPRL is also the National Poliovi-rus Reference Laboratory for Brunei Darussalam, Papua New Guinea and the Pacifi c Island coun-tries, and is a regional reference laboratory for the
ANNUAL REPORT OF THE AUSTRALIAN NATIONAL POLIOVIRUS REFERENCE LABORATORY, 2009 Jason A Roberts, Linda Hobday, Sophie Polychronopoulos, Aishah Ibrahim, Bruce R Thorley
Australian National Poliovirus Reference Laboratory, 2009
278 CDI Vol 34 No 3 2010
Annual reports Australian National Poliovirus Reference Laboratory, 2009
WHO Western Pacifi c Region. Specimens and isolates are referred to the laboratory from national laboratories throughout the region in accordance with requirements determined by the WHO.
Methods
AFP surveillance was initiated by the Australian Government in 1995 in collaboration with the Australian Paediatric Surveillance Unit (APSU) as part of Australia’s commitment to the WHO poli-omyelitis eradication program. Since 2000, AFP surveillance has been co-ordinated by VIDRL in collaboration with the APSU.
Th e strategy adopted for AFP surveillance is as follows:
• Paediatricians reviewing a patient less than 15 years of age and presenting with AFP, or a cli-nician reviewing a patient of any age suspected of poliomyelitis, are requested to notify the NPRL (telephone 03-9342 2607, email [email protected]). Notifi cation of the case is also included on the paediatrician’s monthly report card to the APSU (http://www.apsu.org.au/).
• Two faecal specimens should be collected 24 to 48 hours apart and within 14 days of onset of paralysis. Collection of specimens within these time frames will enable them to be classifi ed as adequate by WHO.
• Th e faecal specimens are referred free of charge for testing by the NPRL, which is accredited by WHO for this purpose.
• Upon notifi cation of an AFP case, clinicians are forwarded a clinical questionnaire for completion.
• Th e Polio Expert Committee (PEC), convened by the Department of Health and Ageing (DoHA), reviews the clinical and laboratory data for all notifi ed cases of AFP, irrespective of whether they are an eligible or ineligible case. An eligible case is: an Australian child under 15 years of age with AFP (including Guillain-Barré syndrome) or an Australian of any age with paralytic illness if polio is suspected. Examples of ineligible cases are if the patient is aged 15 years or older, an overseas resident and cases notifi ed in error or later determined to be non-AFP.
• Th e PEC classifi es cases of AFP as: • poliomyelitis due to wild poliovirus, vac-
cine-derived poliovirus (VDPV) or vaccine associated paralytic poliomyelitis (VAPP);
• non-polio AFP or; • non-AFP.
• A follow-up questionnaire is sent to notifying clinicians if the PEC requires more informa-tion regarding the AFP case before a fi nal clas-sifi cation can be made.
• After each PEC meeting the Australian AFP data are forwarded to WHO for inclusion in the global AFP surveillance data published in the Weekly Epidemiological Record (available from http://www.who.int/wer/en/). Ineligible cases are not reported to WHO.
• Th e WHO AFP surveillance performance indicator for a polio non-endemic country is 1 non-polio AFP case per 100,000 children aged less than 15 years. For Australia in 2009, this equated to 41 cases per year, based on the Australian Bureau of Statistics data released in December 2008. An AFP surveillance scheme that satisfi es the surveillance performance indi-cator is deemed suffi ciently sensitive to detect a wild poliovirus importation in children of that country.
• Th e WHO surveillance performance indica-tor for laboratory testing is that at least 80% of notifi ed AFP cases have adequate faecal speci-mens collected and tested in a WHO accred-ited laboratory.
• At the end of each calendar year, a number of AFP notifi cations remained unclassifi ed as insuffi cient clinical and laboratory data were available to enable the PEC to review the cases. In 2008, after consulting with WHO, the PEC resolved to classify pending cases as ‘polio com-patible–zero evidence’.
Upon receipt at the NPRL, faecal specimens are treated with Minimum Essential Medium con-taining Hank’s salts, chloroform (9.1% v/v) and foetal bovine serum (2%). Th e suspension is clari-fi ed and the supernatant inoculated onto a series of mammalian cell lines. Two WHO recommended cell lines are used for the isolation of poliovirus; L20B (a transgenic mouse epithelial cell line expressing the human poliovirus receptor, CD155) and RD-A (human rhabdomyosarcoma). 6,7 Th e NPRL utilises 2 additional cell lines for the iso-lation of poliovirus and non-polio enteroviruses: BGMK (buff alo green monkey kidney) and HEL (human embryonic lung). Diagnostic laboratories in Australia are encouraged to refer enteroviruses of unknown serotype to the NPRL for further characterisation as poliovirus infection can lead to clinical presentations without paralysis such as aseptic meningitis.
A series of tests known as intratypic diff erentia-tion (ITD) are performed on poliovirus isolates to determine whether the virus is a wild poliovirus strain, OPV strain (Sabin-like) or a VDPV. In 2009, the WHO introduced diagnostic poliovirus
CDI Vol 34 No 3 2010 279
Australian National Poliovirus Reference Laboratory, 2009 Annual reports
real time reverse transcriptase polymerase chain reaction (rRT-PCR), developed by the US Centers for Disease Control and Prevention (CDC), Atlanta, as the primary ITD method. 8 Th e Aus-tralian NPRL sequences the complete poliovirus VP1 genomic region, which contains a major neu-tralising antibody binding site. Th e VP1 genomic sequence provides valuable biological informa-tion, including the number of mutations within a signifi cant region of the OPV virus strain and it enables phylogenetic analysis of wild poliovirus to rapidly determine the likely source of the virus, as utilised in the 2007 importation. 9
Results
Notifi cation of acute fl accid paralysis cases
A total of 61 notifi cations of AFP cases were received in 2009 (Table 1). Two AFP cases were already notifi ed by other clinicians and so were regarded as duplicate notifi cations.
(i) Eligible AFP cases
Suffi cient information was available for the PEC to review 48 cases of AFP involving children less than 15 years of age with onset of paralysis in 2009. All cases were classifi ed as non-polio AFP by the PEC. Th e 48 cases equates to a non-polio AFP rate of 1.2 cases per 100,000 children less than 15 years of age. Th is result meets the WHO AFP surveillance performance criterion for a polio-free country of 1 case of non-polio AFP per 100,000 children less than 15 years of age (Figure).
(ii) Ineligible cases
Eight cases did not meet the criteria for an eligible case. Four were later reported as non-AFP and the other four involved patients aged over 14 years; one with onset of paralysis in 2008. Th e cases involving patients over 14 years of age were all classifi ed by the PEC as non-polio AFP but were not reported to the WHO since the organisation focuses on the onset of AFP in children less than 15 years of age.
Notifi cation of acute fl accid paralysis cases by state and territory
In 2009, AFP cases were notifi ed from all jurisdic-tions in Australia except for the Northern Territory (Table 2). After excluding duplicate notifi cations and ineligible cases, the non-polio AFP rates per
Figure: Non-polio acute fl accid paralysis rate after fi nal classifi cation of cases by the Polio Expert Committee
0
0.5
1
1.5
1995 1996 1997 1998 1999 2000 2001 2002 2003 2004 2005 2006 2007 2008 2009
Year
Rat
e
Rate
Expected rate
WHO AFP Surveillance Performance Indicator = 1 non-polio AFP case per 100,000 population <15 years
Table 1: Surveillance for acute fl accid paralysis (AFP) cases in children less than 15 years of age, Australia, 2009, compared with the World Health Organization (WHO) AFP surveillance performance indicators
WHO surveillance performance indicator for AFP cases in children less than 15 years*
Australia’s surveillance for AFP cases in children with onset of paralysis in 2009
Australia’s AFP surveillance performance in 2009
Non-polio AFP case rate of 1.0 per 100,000 children (41 cases for Australia in 2009).
60 unique cases of AFP notifi ed AFP notifi cation rate:1.46 per 100,000 children.
48 cases classifi ed by the Polio Expert Committee as non-polio AFP
Non-polio AFP case rate:1.17 per 100,000 children.
More than 80% of classifi ed AFP cases with 2 adequate faecal specimens collected at least 24 hours apart and within 14 days of onset of paralysis.
16 AFP cases with 2 or more adequate specimens
Referral of adequate specimens from AFP cases: 33.3% (16 of 48) of the eligible cases.
* Based on data supplied by the Australian Bureau of Statistics, estimated population, preliminary – 30 June 2008. ABS
publication 3201.0.
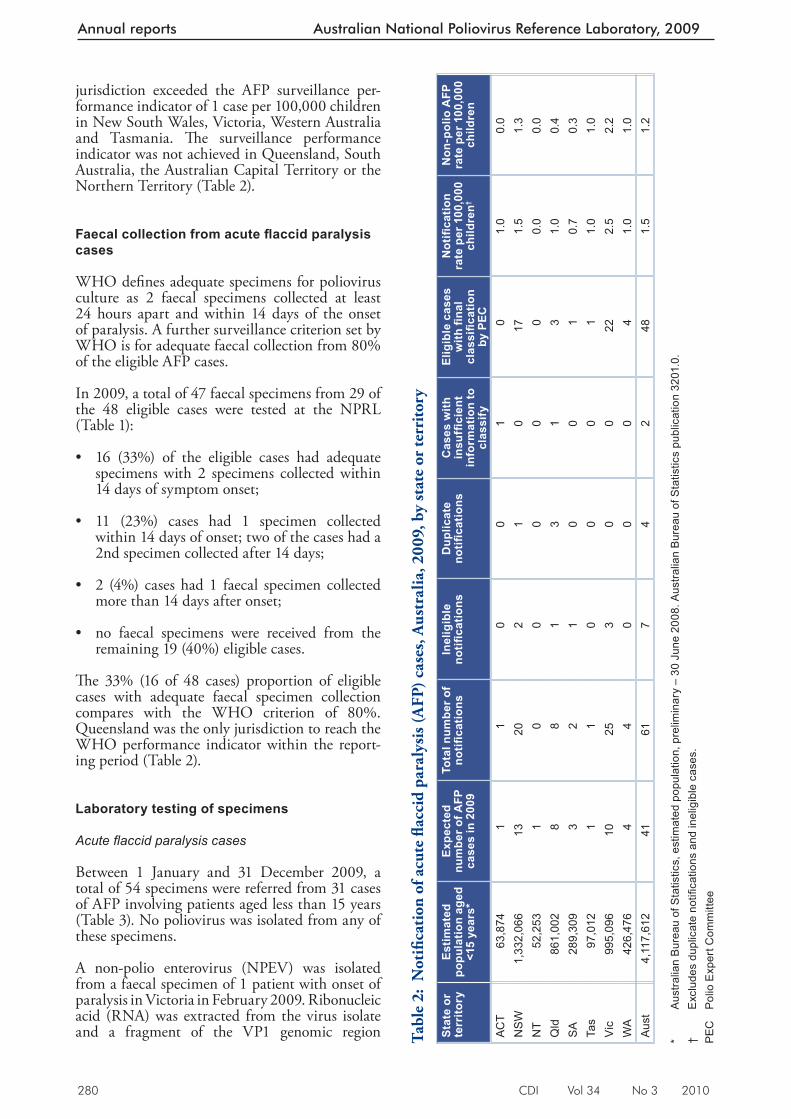
280 CDI Vol 34 No 3 2010
Annual reports Australian National Poliovirus Reference Laboratory, 2009
jurisdiction exceeded the AFP surveillance per-formance indicator of 1 case per 100,000 children in New South Wales, Victoria, Western Australia and Tasmania. Th e surveillance performance indicator was not achieved in Queensland, South Australia, the Australian Capital Territory or the Northern Territory (Table 2).
Faecal collection from acute fl accid paralysis cases
WHO defi nes adequate specimens for poliovirus culture as 2 faecal specimens collected at least 24 hours apart and within 14 days of the onset of paralysis. A further surveillance criterion set by WHO is for adequate faecal collection from 80% of the eligible AFP cases.
In 2009, a total of 47 faecal specimens from 29 of the 48 eligible cases were tested at the NPRL (Table 1):
• 16 (33%) of the eligible cases had adequate specimens with 2 specimens collected within 14 days of symptom onset;
• 11 (23%) cases had 1 specimen collected within 14 days of onset; two of the cases had a 2nd specimen collected after 14 days;
• 2 (4%) cases had 1 faecal specimen collected more than 14 days after onset;
• no faecal specimens were received from the remaining 19 (40%) eligible cases.
Th e 33% (16 of 48 cases) proportion of eligible cases with adequate faecal specimen collection compares with the WHO criterion of 80%. Queensland was the only jurisdiction to reach the WHO performance indicator within the report-ing period (Table 2).
Laboratory testing of specimens
Acute fl accid paralysis cases
Between 1 January and 31 December 2009, a total of 54 specimens were referred from 31 cases of AFP involving patients aged less than 15 years (Table 3). No poliovirus was isolated from any of these specimens.
A non-polio enterovirus (NPEV) was isolated from a faecal specimen of 1 patient with onset of paralysis in Victoria in February 2009. Ribonucleic acid (RNA) was extracted from the virus isolate and a fragment of the VP1 genomic region Ta
ble
2: N
otifi
cati
on o
f acu
te fl
acci
d pa
raly
sis (
AFP
) cas
es, A
ustr
alia
, 200
9, b
y st
ate
or te
rrito
ry
Stat
e or
te
rrito
ryEs
timat
ed
popu
latio
n ag
ed
<15
year
s*
Expe
cted
nu
mbe
r of A
FP
case
s in
200
9
Tota
l num
ber o
f no
tifi c
atio
nsIn
elig
ible
no
tifi c
atio
nsD
uplic
ate
notifi
cat
ions
Cas
es w
ith
insu
ffi ci
ent
info
rmat
ion
to
clas
sify
Elig
ible
cas
es
with
fi na
l cl
assifi c
atio
n by
PEC
Not
ifi ca
tion
rate
per
100
,000
ch
ildre
n†
Non
-pol
io A
FP
rate
per
100
,000
ch
ildre
n
ACT
63,8
741
10
01
01.
00.
0N
SW
1,33
2,06
613
202
10
171.
51.
3N
T52
,253
10
00
00
0.0
0.0
Qld
861,
002
88
13
13
1.0
0.4
SA
289,
309
32
10
01
0.7
0.3
Tas
97,0
121
10
00
11.
01.
0V
ic99
5,09
610
253
00
222.
52.
2W
A42
6,47
64
40
00
41.
01.
0A
ust
4,11
7,61
241
617
42
481.
51.
2 *
Aus
tralia
n B
urea
u of
Sta
tistic
s, e
stim
ated
pop
ulat
ion,
pre
limin
ary
– 30
Jun
e 20
08. A
ustra
lian
Bur
eau
of S
tatis
tics
publ
icat
ion
3201
.0.
† E
xclu
des
dupl
icat
e no
tifi c
atio
ns a
nd in
elig
ible
cas
es.
PEC
P
olio
Exp
ert C
omm
ittee
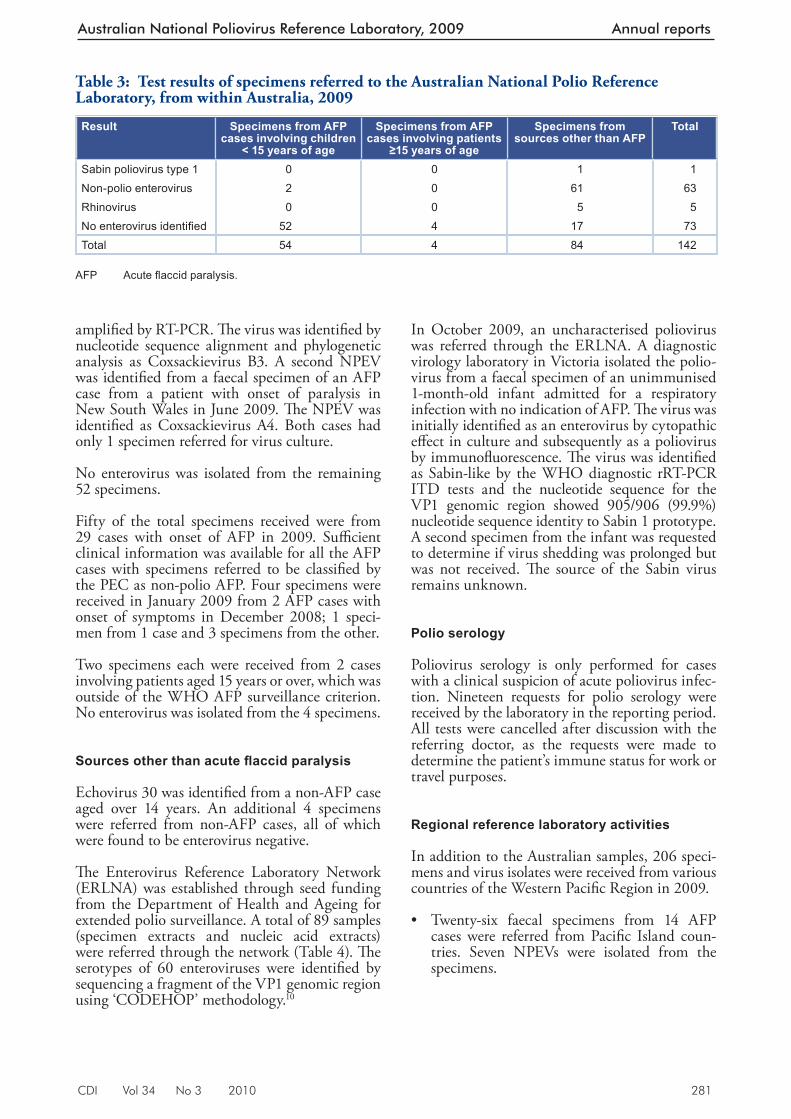
CDI Vol 34 No 3 2010 281
Australian National Poliovirus Reference Laboratory, 2009 Annual reports
amplifi ed by RT-PCR. Th e virus was identifi ed by nucleotide sequence alignment and phylogenetic analysis as Coxsackievirus B3. A second NPEV was identifi ed from a faecal specimen of an AFP case from a patient with onset of paralysis in New South Wales in June 2009. Th e NPEV was identifi ed as Coxsackievirus A4. Both cases had only 1 specimen referred for virus culture.
No enterovirus was isolated from the remaining 52 specimens.
Fifty of the total specimens received were from 29 cases with onset of AFP in 2009. Suffi cient clinical information was available for all the AFP cases with specimens referred to be classifi ed by the PEC as non-polio AFP. Four specimens were received in January 2009 from 2 AFP cases with onset of symptoms in December 2008; 1 speci-men from 1 case and 3 specimens from the other.
Two specimens each were received from 2 cases involving patients aged 15 years or over, which was outside of the WHO AFP surveillance criterion. No enterovirus was isolated from the 4 specimens.
Sources other than acute fl accid paralysis
Echovirus 30 was identifi ed from a non-AFP case aged over 14 years. An additional 4 specimens were referred from non-AFP cases, all of which were found to be enterovirus negative.
Th e Enterovirus Reference Laboratory Network (ERLNA) was established through seed funding from the Department of Health and Ageing for extended polio surveillance. A total of 89 samples (specimen extracts and nucleic acid extracts) were referred through the network (Table 4). Th e serotypes of 60 enteroviruses were identifi ed by sequencing a fragment of the VP1 genomic region using ‘CODEHOP’ methodology. 10
In October 2009, an uncharacterised poliovirus was referred through the ERLNA. A diagnostic virology laboratory in Victoria isolated the polio-virus from a faecal specimen of an unimmunised 1-month-old infant admitted for a respiratory infection with no indication of AFP. Th e virus was initially identifi ed as an enterovirus by cytopathic eff ect in culture and subsequently as a poliovirus by immunofl uorescence. Th e virus was identifi ed as Sabin-like by the WHO diagnostic rRT-PCR ITD tests and the nucleotide sequence for the VP1 genomic region showed 905/906 (99.9%) nucleotide sequence identity to Sabin 1 prototype. A second specimen from the infant was requested to determine if virus shedding was prolonged but was not received. Th e source of the Sabin virus remains unknown.
Polio serology
Poliovirus serology is only performed for cases with a clinical suspicion of acute poliovirus infec-tion. Nineteen requests for polio serology were received by the laboratory in the reporting period. All tests were cancelled after discussion with the referring doctor, as the requests were made to determine the patient’s immune status for work or travel purposes.
Regional reference laboratory activities
In addition to the Australian samples, 206 speci-mens and virus isolates were received from various countries of the Western Pacifi c Region in 2009.
• Twenty-six faecal specimens from 14 AFP cases were referred from Pacifi c Island coun-tries. Seven NPEVs were isolated from the specimens.
Table 3: Test results of specimens referred to the Australian National Polio Reference Laboratory, from within Australia, 2009
Result Specimens from AFP cases involving children
< 15 years of age
Specimens from AFP cases involving patients
≥15 years of age
Specimens from sources other than AFP
Total
Sabin poliovirus type 1 0 0 1 1Non-polio enterovirus 2 0 61 63Rhinovirus 0 0 5 5No enterovirus identifi ed 52 4 17 73Total 54 4 84 142
AFP Acute fl accid paralysis.
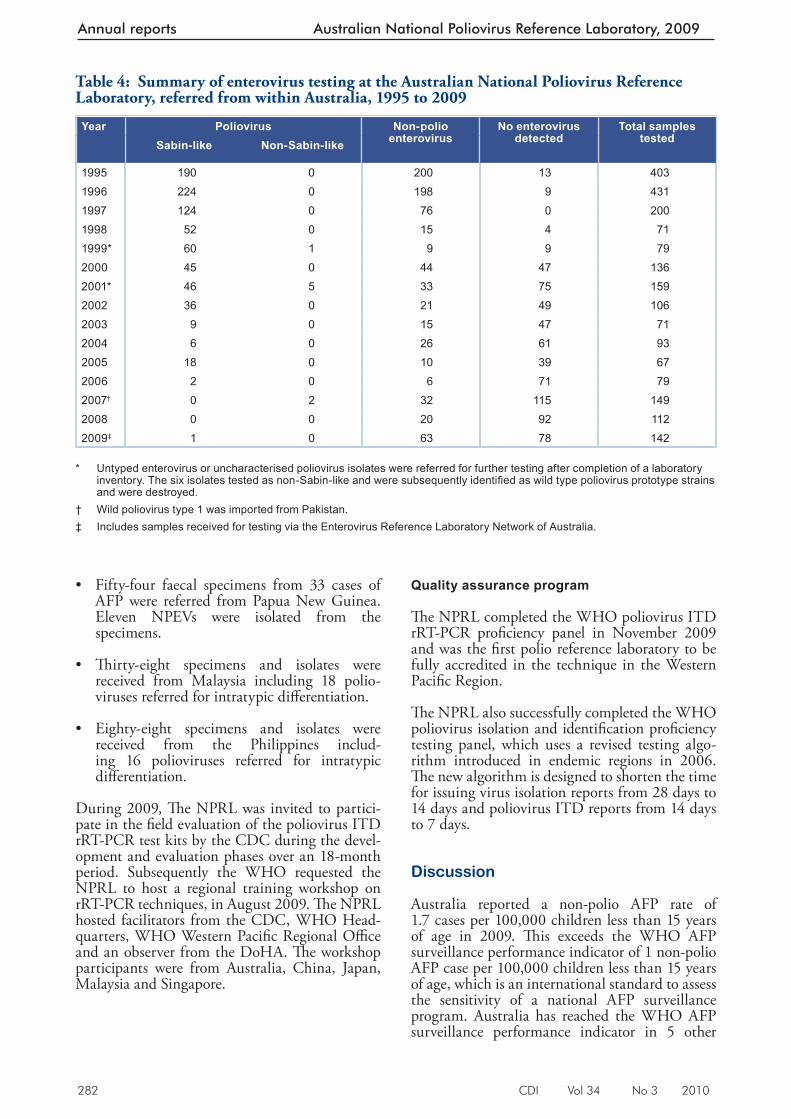
282 CDI Vol 34 No 3 2010
Annual reports Australian National Poliovirus Reference Laboratory, 2009
• Fifty-four faecal specimens from 33 cases of AFP were referred from Papua New Guinea. Eleven NPEVs were isolated from the specimens.
• Th irty-eight specimens and isolates were received from Malaysia including 18 polio-viruses referred for intratypic diff erentiation.
• Eighty-eight specimens and isolates were received from the Philippines includ-ing 16 polioviruses referred for intratypic diff erentiation.
During 2009, Th e NPRL was invited to partici-pate in the fi eld evaluation of the poliovirus ITD rRT-PCR test kits by the CDC during the devel-opment and evaluation phases over an 18-month period. Subsequently the WHO requested the NPRL to host a regional training workshop on rRT-PCR techniques, in August 2009. Th e NPRL hosted facilitators from the CDC, WHO Head-quarters, WHO Western Pacifi c Regional Offi ce and an observer from the DoHA. Th e workshop participants were from Australia, China, Japan, Malaysia and Singapore.
Quality assurance program
Th e NPRL completed the WHO poliovirus ITD rRT-PCR profi ciency panel in November 2009 and was the fi rst polio reference laboratory to be fully accredited in the technique in the Western Pacifi c Region.
Th e NPRL also successfully completed the WHO poliovirus isolation and identifi cation profi ciency testing panel, which uses a revised testing algo-rithm introduced in endemic regions in 2006. Th e new algorithm is designed to shorten the time for issuing virus isolation reports from 28 days to 14 days and poliovirus ITD reports from 14 days to 7 days.
Discussion
Australia reported a non-polio AFP rate of 1.7 cases per 100,000 children less than 15 years of age in 2009. Th is exceeds the WHO AFP surveillance performance indicator of 1 non-polio AFP case per 100,000 children less than 15 years of age, which is an international standard to assess the sensitivity of a national AFP surveillance program. Australia has reached the WHO AFP surveillance performance indicator in 5 other
Table 4: Summary of enterovirus testing at the Australian National Poliovirus Reference Laboratory, referred from within Australia, 1995 to 2009
Year Poliovirus Non-polio enterovirus
No enterovirus detected
Total samples testedSabin-like Non-Sabin-like
1995 190 0 200 13 4031996 224 0 198 9 4311997 124 0 76 0 2001998 52 0 15 4 711999* 60 1 9 9 792000 45 0 44 47 1362001* 46 5 33 75 1592002 36 0 21 49 1062003 9 0 15 47 712004 6 0 26 61 932005 18 0 10 39 672006 2 0 6 71 792007† 0 2 32 115 1492008 0 0 20 92 1122009‡ 1 0 63 78 142
* Untyped enterovirus or uncharacterised poliovirus isolates were referred for further testing after completion of a laboratory
inventory. The six isolates tested as non-Sabin-like and were subsequently identifi ed as wild type poliovirus prototype strains and were destroyed.
† Wild poliovirus type 1 was imported from Pakistan. ‡ Includes samples received for testing via the Enterovirus Reference Laboratory Network of Australia.
CDI Vol 34 No 3 2010 283
Australian National Poliovirus Reference Laboratory, 2009 Annual reports
years since the program was established in 1995: 2000, 2001, 2004, 2006 and 2008. It should be noted, however, that while the national AFP surveillance scheme targets an age group at high risk of poliovirus infection, persons of any age are a potential source of a wild poliovirus importation, as evidenced by the 2007 importation involving a 22-year-old student from Pakistan. 9
Four states (New South Wales, Tasmania, Vic-toria and Western Australia) achieved the AFP surveillance performance indicator rate in 2009. Victoria reported 2.2 non-polio AFP cases per 100,000 children less than 15 years of age, one of the highest rates ever reported for any juris-diction in Australia and a vast turnaround from the consistent under-reporting for many years by that state. Th e introduction of the Paediatric Active Enhanced Disease Surveillance (PAEDS) scheme at a sentinel hospital in Victoria was a decisive factor in this result, with 21 of the 22 cases notifi ed via the PAEDS system. 11
Queensland and the 2 territories, the Australian Capital Territory and the Northern Territory, did not reach the non-polio AFP indicator rate in 2009. Queensland is the only jurisdiction in Australia where AFP in children is a notifi able condition.
Despite the introduction of the PAEDS scheme in 2007, with hospital-based nurses to ascertain AFP cases and arrange for the referral of specimens to the NPRL, Australia has still never reached the WHO AFP surveillance performance indicator for the collection of adequate faecal specimens from 80% of AFP cases. One of the diffi culties in achieving this target is the strict defi nition of adequate specimens: 2 faecal specimens collected more than 24 hours apart and within 14 days of the onset of paralysis. In 2009, 16 cases (33%) had adequate faecal collections, while a further 11 cases (23%) had only 1 adequate specimen collected, making a total of 56% of cases with at least 1 specimen collected within 14 days of the onset of symptoms.
No poliovirus was isolated from the specimens referred to the NPRL from AFP cases. A NPEV was isolated from each of the faecal specimens referred from 2 AFP cases: a coxsackievirus B3 was isolated from 1 case and a coxsackievirus A4 from the other. Th e establishment of the ERLNA by the NPRL provides another means of surveil-lance for poliovirus: virological surveillance rather than clinical surveillance for cases of AFP. Th e referral of an uncharacterised poliovirus from an unimmunised infant admitted to hospital with a respiratory infection through the ERLNA in
October 2009, was a signifi cant result under-scoring the usefulness of the reference network. Laboratories interested in collaborating with the ERLNA are encouraged to contact the NPRL for details.
Australia, along with the other countries of the Western Pacifi c Region, was declared free of indigenous wild poliovirus in 2000 and ceased usage of the Sabin ‘live’, attenuated oral polio vaccine in November 2005. Th e virus from the infant was typed as a Sabin type 1 poliovirus with a single mutation in the VP1 genomic region. Th e 99.9% sequence identity of the iso-lated virus to Sabin 1 prototype sequence indi-cates the virus was likely to have originated from a recent immunisation event, since poliovirus accumulates ~1% nucleotide mutations per year of replication. 12 Th e source of the Sabin polio-virus was never established but is likely to have been an importation from a country using OPV. Th e result demonstrates the ongoing risk faced by Australia of poliovirus importation, both wild and vaccine strains, since more than 90% of poliovirus infections are asymptomatic.
Th e introduction of the WHO poliovirus diagnostic real time RT-PCR at the NPRL will enable faster characterisation of untyped polio-viruses compared with the previous end-point RT-PCR methodology. Th e real time RT-PCR assay includes an additional protocol to screen for vaccine derived polioviruses; Sabin strains with greater than 1% mutations compared with prototype sequence that is indicative of long-term viral replication and potentially person-to-person transmission. Th e NPRL will continue to sequence the full VP1 genomic region of all polioviruses referred to the laboratory, no matter what their source, as an additional precaution to further characterise all polioviruses. Laboratories identifying poliovirus from any patient of any age within Australia are requested to immediately contact the NPRL to arrange further identifi ca-tion of the virus.
Globally in 2009, a total of 1,604 cases of AFP were reported with 1,256 cases occurring within endemic countries. A total of 348 cases of AFP were reported in 23 non-endemic countries with Chad, Sudan and Guinea reporting 64, 45 and 42 cases respectively. Th ese cases were related to the importation of wild poliovirus from Nigeria, which reported 388 cases in 2009. 13 Signifi cant progress has been made in Nigeria in 2010 with only 6 cases of AFP reported as of 18 June com-pared with 346 cases reported during the same period in 2009. Th e Tajikistan outbreak in 2010, with 413 reported cases of AFP and 19 deaths
284 CDI Vol 34 No 3 2010
Annual reports Australian National Poliovirus Reference Laboratory, 2009
due to wild poliovirus, 3 is a salient reminder of the need for continued surveillance and vaccine coverage.
Author details
Mr Jason A Roberts, Senior Medical Scientist Ms Linda Hobday Medical Scientist Ms Sophie Polychronopoulos Medical Scientist Mrs Aishah Ibrahim Medical Scientist Dr Bruce R Thorley, Senior Medical Scientist, Laboratory Head
National Poliovirus Reference Laboratory, Victorian Infectious Diseases Reference Laboratory, North Melbourne, Victoria
Corresponding author: Mr Jason Roberts, Victorian Infectious Diseases Reference Laboratory, Locked Bag 815, CARLTON SOUTH, VIC 3053. Telephone: +61 3 9342 2607. Facsimile: +61 3 9342 2665. Email: [email protected]
References
1. National Health and Medical Research Council. The Australian Immunisation Handbook 9th edn. Canberra, Australia: Australian Government Depar tment of Health and Ageing; 2008; pp. 251–256.
2. United Nations Children’s Fund. Immunization Summary, a Statistical Reference Containing Data through 2008. Geneva: United Nations Children’s Fund and the World Health Organization, January 2010.
3. Mar t in, R . Tajik is tan polio outbreak and regional response. WHO Epidemiological Brief; 19 July 2010. Available from: http://www.euro.who.int/__data/assets/pdf_file/0019/118342/EPI_TJK_Issue3.pdf
4. World Health Organization. International Travel and Health; Situation as at 1 January 2010. Geneva: World Health Organization; 2010.
5. Wood DJ, Hull B. L20B cells simplify culture of polioviruses from clinical samples. J Med Virol 1999,58(2):188–192.
6. World Health Organization. Polio Laboratory Manual. Department of Immunization, Vaccines and Biologicals 2004. WHO/IVB/04.10.
7. Kilpatrick DR, Yang CF, Ching K, Vincent A, Iber J, Campagnoli R, et al. Rapid group–, serotype–, and vaccine strain-specific identification of poliovirus isolates by real-time reverse transcription PCR using degenerate primers and probes containing deoxyinosine residues. J Clin Microbiol 2009;47(6):1939–1941.
8. Carnie JA, Lester R, Moran R, Brown L, Meagher J, Rober ts JA, et al. Public health response to imported case of poliomyelitis, Australia. Emerg Infect Dis 2009 15(11): 1733–1737.
9. Nix WA, Oberste MS, Pallansch MA. Sensitive, seminested PCR amplification of VP1 sequences for direct identification of all enterovirus serotypes from original clinical specimens. J Clin Microbiol 2006;44(8):2698–2704.
10. Pym M, Adams J, Booy R, Buttery J, Elia S, Elliott E, et al. The development and trial of paediatric active enhanced disease surveillance (PAEDS): a new surveillance mechanism for Australia. J Paed Child Health 2008;44:A16.
11. Kew O, Sutter RW, de Gourville EM, Dowdle WR, Pallansch MA. Vaccine-derived polioviruses and the endgame strategy for global polio eradication. Annu Rev Microbiol 2005;59:587–635.
12. World Health Organization. Global Polio Eradication Initiative. Wild poliovirus weekly update. wild poliovirus list 2000–2010. Available from: http://www.polioeradication.org/casecount.asp
CDI Vol 34 No 3 2010 285
Australian Paediatric Surveillance Unit coverage, 2008 and 2009 Annual reports
AUSTRALIAN PAEDIATRIC SURVEILLANCE UNIT ANNUAL REPORT, 2008 AND 2009 Yvonne Zurynski, Elizabeth Davey, Elizabeth J Elliott
• severe complications of varicella: a range of rare but serious complications; genotyping of samples will inform future vaccine and policy development; 8 and
• severe complications of infl uenza infection: complications such as pneumonia, encephali-tis, myocarditis, rhabdomyolysis, disseminated coagulopathy, transverse myelitis, polyneuritis and Guillain-Barré syndrome have a signifi -cant burden among children aged less than 15 years.9
Methods
Th e APSU study protocols are developed with collaborating investigators and/or institutions that have expertise in each of the conditions studied. Detailed protocols including case defi nitions for each condition under surveillance and contact details of the expert investigators for each condition are available at www.apsu.org.au Th e APSU sends monthly report cards listing the conditions under surveillance to approximately 1,300 paediatri-cians and child health clinicians around Australia. Report cards are returned whether the clinician has a case to report or not, and the rate of returned report cards provides a measure of participation. In 2009 approximately 80% of clinicians chose to receive and respond to the APSU report card via e-mail. All reported cases are followed-up by a questionnaire requesting de-identifi ed data on the child’s clinical presentation, treatment and short-term outcome. Clinicians were asked to return all questionnaires by fax as soon as children who met criteria for severe complications of infl uenza were identifi ed during 2008 surveillance for seasonal infl uenza and during 2009 surveillance for sea-sonal and pandemic infl uenza.
Th e APSU aims to provide epidemiological infor-mation that is representative of the Australian child population and maximal case ascertainment is a high priority. Despite a representative mailing list (92% of all paediatricians in active clinical practice in Australia participate in monthly surveil-lance) and high response rates (average 96% per annum since 2000), complete case ascertainment is unlikely. 10 Th is is particularly relevant in remote communities where children have limited access to paediatricians or when hospital admission is brief.
Background
National active surveillance of rare diseases of childhood, including infectious and vaccine preventable diseases, genetic disorders, childhood injuries and mental health conditions is con-ducted by the Australian Paediatric Surveillance Unit (APSU). Th e study of communicable and vaccine-preventable diseases is supported in part by the Department of Health and Ageing through its communicable diseases program. In 2008 and 2009, APSU conducted national surveillance for the following infectious diseases or vaccine pre-ventable conditions:
• acute fl accid paralysis (AFP): a major clinical presentation of poliomyelitis;1
• acute rheumatic fever (ARF): occurs due to group A streptococcal (GAS) infection and repeat GAS infections, if not treated, may lead to heart valve damage and rheumatic heart disease;2
• congenital cytomegalovirus infection: a leading cause of congenital abnormality in Australia; 3
• congenital rubella: an extremely rare condi-tion leading to birth defects;4
• perinatal exposure to HIV: the most fre-quently reported source of HIV infection in Australian children; 5
• neonatal herpes simplex virus (HSV) infec-tion: a very rare, but serious infection that may cause chorioretinitis, intracerebral calci-fi cation and birth defects;
• neonatal group B streptococcus (GBS) infec-tion: the most common cause of life threaten-ing infections in neonates;
• intussusception: the most common cause of bowel obstruction in infants and young chil-dren that has been associated with rotavirus infection and previous rotavirus vaccines; 6,7
• congenital and neonatal varicella: a rare infec-tion that may result in birth defects. 8
Australian Paediatric Surveillance Unit coverage, 2008 and 2009
286 CDI Vol 34 No 3 2010
Annual reports Australian Paediatric Surveillance Unit coverage, 2008 and 2009
However, for most conditions studied by the APSU no alternative national data are available to allow an estimate of completeness of ascertainment. Th e APSU encourages the use of complementary data sources where available and reporting by a range of specialists to maximise case identifi cation. 10,11 Reported rates for conditions ascertained through the APSU therefore represent a minimum estimate of the incidence of these conditions in the relevant Australian child populations.
To further enhance surveillance for childhood conditions where hospital stays are minimal; where biological samples are required; and where a detailed history might be needed from parents or caregivers, the APSU, in collaboration with the National Centre for Immunisation Research and Surveillance of Vaccine Preventable Diseases, initiated and coordinates the Paediatric Active Enhanced Disease Surveillance (PAEDS) system. 12 Th is is a hospital-based surveillance system reliant on active case ascertainment by specialist surveil-lance nurses. Since August 2007, PAEDS has oper-ated in 4 tertiary paediatric hospitals in 4 states: New South Wales, Victoria, South Australia, and Western Australia (www.apsu.org.au)
All data are provided after review by the expert investigators responsible for each surveillance study and are accurate as at May 2010. However, it is possible that some notifi cations may be reclas-sifi ed at a later date as additional clinical data for existing notifi cations, or additional notifi cations, are received.
Results
In 2008 and 2009, 1,318 and 1,340 clinicians respectively participated in the monthly surveil-lance of the 11 communicable or vaccine prevent-able diseases under surveillance. Consistent with previously reported high rates of participation by paediatricians, 10 the report card return rate was 94% in 2008 and 91% in 2009. Enhanced data on diagnosis, clinical management and short-term outcome were available for more than 85% of all cases notifi ed. Th e Table shows the number of confi rmed cases ascertained in 2008 and 2009 and for the whole study period, and the reported rate per 100,000 of child population for each condition.
Acute fl accid paralysis
Australia reported a non-polio AFP rate of 1.5 per 100,000 children aged less than 15 years in 2008 and 1.2 per 100,000 in 2009, exceeding the World Health Organization (WHO) AFP
surveillance target of 1 case per 100,000. Th is is due to additional cases reported via the PAEDS system developed jointly by the APSU and the National Centre for Immunisation Research and Surveillance. Th e most common diagnosis of non-polio AFP was Guillain-Barré syndrome (39% in 2008 and 34% in 2009). Adequate faecal specimens (2 within 14 days of onset of paralysis) were obtained for 31% of cases, which was well below the 80% WHO target. Th e importation of a type 1 wild poliovirus in an adult into Australia in 2007 14 and the continued detection of cases of wild polio internationally, highlight the need for continued national surveillance.
Acute rheumatic fever
Between October 2007 and December 2009 cases of ARF were reported in all states and territories of Australia, except for Tasmania, suggesting the need for a national approach to the control of ARF and rheumatic heart disease. Almost all children were born in Australia (98%); 1 child was born in New Zealand and one in Papua New Guinea. Th e majority of children with ARF were Aboriginal or Torres Strait Islander, however, a small number of Caucasian children were reported from 5 states (New South Wales, Victoria, South Australia, Western Australia, and Queensland). Th ese include the southern states where ARF is not recognised as a priority. Approximately 70% of all children reported resided in small rural towns or remote areas, with approximately 30% residing in urban or suburban areas.
Congenital cytomegalovirus infection
Congenital cytomegalovirus (cCMV) is the most common infectious cause of congenital malforma-tions in Australia. APSU data show that cCMV infection is not associated with maternal illness in approximately one-third of cases, and should be considered regardless of maternal history. 15 cCMV remains under-diagnosed. Although most cases are diagnosed by urine culture, use of polymerase chain reaction for urinary screening for CMV may increase diagnostic yield. Universal neonatal hearing screening programs may also help identify new cases. Th e total of 159 cases confi rmed by the end of 2009 includes 6 cases that were notifi ed between 2004 and 2007, but only confi rmed recently.
Congenital rubella (with defects)
In 2008 there were three notifi cations, of which one was confi rmed as a case. Th is was a child born to an immigrant woman from India whose
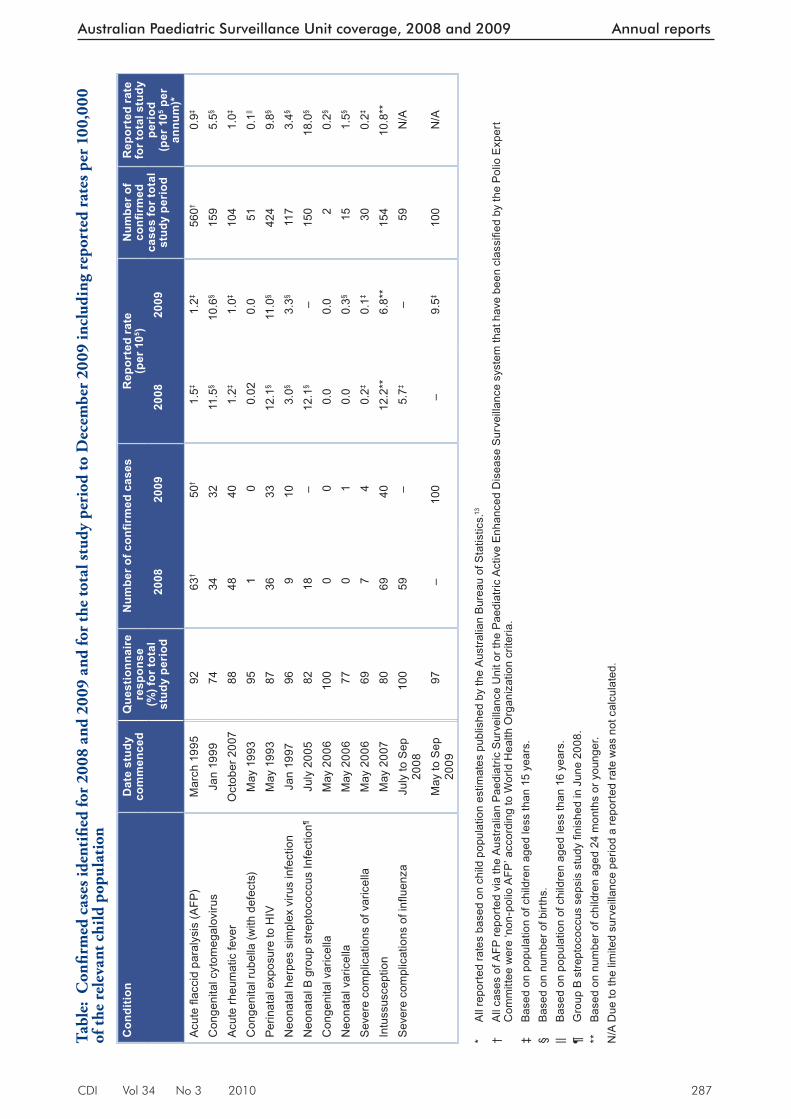
CDI Vol 34 No 3 2010 287
Australian Paediatric Surveillance Unit coverage, 2008 and 2009 Annual reports
Tabl
e: C
onfi r
med
cas
es id
enti
fi ed
for
2008
and
200
9 an
d fo
r th
e to
tal s
tudy
per
iod
to D
ecem
ber
2009
incl
udin
g re
port
ed r
ates
per
100
,000
of
the
rele
vant
chi
ld p
opul
atio
n
Con
ditio
nD
ate
stud
y co
mm
ence
dQ
uest
ionn
aire
re
spon
se(%
) for
tota
l st
udy
peri
od
Num
ber o
f confi r
med
cas
esR
epor
ted
rate
(per
105 )
Num
ber o
f co
nfi r
med
ca
ses
for t
otal
st
udy
peri
od
Rep
orte
d ra
te
for t
otal
stu
dy
peri
od(p
er 1
05 per
an
num
)*20
0820
0920
0820
09
Acu
te fl
acci
d pa
raly
sis
(AFP
)M
arch
199
592
63†
50†
1.5‡
1.2‡
560†
0.9‡
Con
geni
tal c
ytom
egal
oviru
sJa
n 19
9974
3432
11.5
§10
.6§
159
5.5§
Acu
te rh
eum
atic
feve
rO
ctob
er 2
007
8848
401.
2‡1.
0‡10
41.
0‡
Con
geni
tal r
ubel
la (w
ith d
efec
ts)
May
199
395
10
0.02
0.0
510.
1||
Perin
atal
exp
osur
e to
HIV
May
199
387
3633
12.1
§11
.0§
424
9.8§
Neo
nata
l her
pes
sim
plex
viru
s in
fect
ion
Jan
1997
969
103.
0§3.
3§11
73.
4§
Neo
nata
l B g
roup
stre
ptoc
occu
s In
fect
ion¶
July
200
582
18–
12.1
§–
150
18.0
§
Con
geni
tal v
aric
ella
May
200
610
00
00.
00.
02
0.2§
Neo
nata
l var
icel
laM
ay 2
006
770
10.
00.
3§15
1.5§
Sev
ere
com
plic
atio
ns o
f var
icel
laM
ay 2
006
697
40.
2‡0.
1‡30
0.2‡
Intu
ssus
cept
ion
May
200
780
6940
12.2
**6.
8**
154
10.8
**S
ever
e co
mpl
icat
ions
of i
nfl u
enza
July
to S
ep
2008
100
59–
5.7‡
–59
N/A
May
to S
ep
2009
97–
100
–9.
5‡10
0N
/A
* A
ll re
porte
d ra
tes
base
d on
chi
ld p
opul
atio
n es
timat
es p
ublis
hed
by th
e A
ustra
lian
Bur
eau
of S
tatis
tics.
13
† A
ll ca
ses
of A
FP re
porte
d vi
a th
e A
ustra
lian
Pae
diat
ric S
urve
illan
ce U
nit o
r the
Pae
diat
ric A
ctiv
e E
nhan
ced
Dis
ease
Sur
veill
ance
sys
tem
that
hav
e be
en c
lass
ifi ed
by
the
Pol
io E
xper
t C
omm
ittee
wer
e ‘n
on-p
olio
AFP
’ acc
ordi
ng to
Wor
ld H
ealth
Org
aniz
atio
n cr
iteria
. ‡
Bas
ed o
n po
pula
tion
of c
hild
ren
aged
less
than
15
year
s. §
Bas
ed o
n nu
mbe
r of b
irths
. ||
Bas
ed o
n po
pula
tion
of c
hild
ren
aged
less
than
16
year
s. ¶
Gro
up B
stre
ptoc
occu
s se
psis
stu
dy fi
nish
ed in
Jun
e 20
08.
**
Bas
ed o
n nu
mbe
r of c
hild
ren
aged
24
mon
ths
or y
oung
er.
N/A
Due
to th
e lim
ited
surv
eilla
nce
perio
d a
repo
rted
rate
was
not
cal
cula
ted.
288 CDI Vol 34 No 3 2010
Annual reports Australian Paediatric Surveillance Unit coverage, 2008 and 2009
vaccination history could not be confi rmed. Sero-logical testing was not performed. In 2009 there were no notifi cations. Th e risk of congenital rubella remains, particularly among immigrant women born in countries with poorly developed vaccina-tion programs, justifying continued surveillance. 4
Such women should have serological testing for rubella after arrival in Australia, and vaccination when appropriate. For women with no prior rubella immunity, travel to rubella-endemic countries in the fi rst trimester poses a risk of congenital rubella to the foetus. Perinatal exposure to HIV and HIV infection
In 2008 there were 36 perinatal exposures to HIV in Australia, and 33 in 2009. Antenatal diagnosis of the mother’s HIV infection and use of inter-ventions including antiretroviral treatment during pregnancy, caesarean delivery and avoidance of breastfeeding, continues to minimise the risk of mother-to-child HIV transmission. 5
Neonatal herpes simplex virus infection
A signifi cant number of cases of neonatal herpes simplex virus (HSV) infection continue to be con-fi rmed, with a preponderance in females. Presen-tation with skin, eye and mouth disease occurred in half of confi rmed cases, whereas disseminated HSV infection occurred in a quarter of confi rmed cases. Among cases with disseminated infection, more than half were diagnosed with encephalitis and a third with pneumonitis. More than 20% of confi rmed cases had died before notifi cation, with almost half of these diagnosed at post-mortem examination.
Intussusception
Th e small number of cases ascertained suggests under-reporting and the APSU data will be greatly supplemented by cases identifi ed by PAEDS. Th ere was a small number of cases of intussuscep-tion observed in infants who received a rotavirus vaccine but a temporal association between either Rotarix® or RotaTeq® vaccines and intussusception could not be confi rmed using APSU data alone. Accepting the limitation of under-reporting of intussusception and limited vaccination data on confi rmed cases, ongoing intussusception surveil-lance is better justifi ed through the PAEDS system rather than the APSU, to further explore in detail any possible relationship between the number of observed intussusception cases, the age at vaccina-tion, dose and vaccine given.
Neonatal and infant Streptococcus agalactiae (group B streptococcus) sepsis
Th e number of notifi cations received over the total study period are consistent with other available data. Over half (59%) of the confi rmed cases of Streptococcus agalactiae group B (GBS) sepsis had early onset disease (EOD: at younger than 8 days of age). Pre-term birth was more common in mothers of infants with late onset disease (LOD: at 8 days of age or older) than in mothers of infants with EOD (58% versus 28%). Infant death was more common in those with LOD than in those with EOD (8% versus 4%). A detailed fi nal report is in preparation for peer review publication by the investigators for this study.
Severe complications of varicella infection
In 2008, 7 children hospitalised with severe com-plications of varicella were reported, compared with 4 cases in 2009. Th e complications in 2008 included septic arthritis, focal purulent collection, osteomyelitis, and ataxia, while in 2009 there were 3 cases of ataxia and one of bacteraemia. Median stay in hospital was 12.5 days in 2008 compared with 3.5 days in 2009. All of the reported children were unvaccinated and family members were the infecting contacts.
Congenital and neonatal varicella
Th ere were no cases of neonatal varicella reported in 2008 and only 1 case in 2009. Th is was an infant born to a woman who experienced symptoms of varicella infection 1 day after delivery. Th e infect-ing contact was identifi ed as the woman’s husband who had been told that the illness he was experienc-ing was not chicken pox. No cases of congenital varicella were reported in 2008 and 2009.
Severe complications of infl uenza
In 2008, infl uenza B was the dominant infl uenza type among the 59 children hospitalised with severe complications of infl uenza and reported to APSU. In 2009, the dominant strain was pan-demic infl uenza H1N1 2009 among 100 children reported to APSU. A range of complications were reported with x-ray-confi rmed pneumonia the most common during both years. However, in 2009 serious complications such as encephalitis and rhabdomyolysis were more common than in 2008. Admission to paediatric intensive care was more common in 2009 (38%) compared with 2008 (29%) and 7 (7%) of the reported children died in 2009 compared with only 1 child (2%)
CDI Vol 34 No 3 2010 289
Australian Paediatric Surveillance Unit coverage, 2008 and 2009 Annual reports
in 2008. Vaccination for seasonal infl uenza was uncommon during both 2008 and 2009, even among children with pre-existing chronic disor-ders who were eligible for vaccination according to current recommendations.
Conclusions and future directions
APSU data contribute signifi cantly to the national surveillance eff ort, providing valuable informa-tion for clinicians, policymakers and the com-munity. 10,11,16 Th e APSU is often the only source of national data that includes clinical and/or laboratory details, and data on both inpatients and outpatients. 10,11
After demonstrating the feasibility of the APSU to respond rapidly to an outbreak of infl uenza in 2007, it has conducted surveillance for seasonal infl uenza in 2008 and surveillance for both seasonal and pandemic infl uenza in 2009. Th e APSU will again conduct surveillance for the severe complications of infl uenza from June to September in 2010.
A surveillance study of juvenile respiratory pap-illomatosis is planned for late 2010. Respiratory papillomatosis is a rare but devastating condition in children aged less than 12 years, and is thought to be perinatally transmitted. 17 Juvenile respira-tory papillomatosis is diffi cult to treat, recurrences are common and may lead to airway obstruction. Th e human papillomavirus (HPV) vaccine, which protects against HPV6 and HPV11, is currently nationally recommended and it is hoped that the rates of juvenile papillomatosis among young chil-dren will reduce with increased vaccination rates.
Th e APSU continues to provide useful data and clinical and public health insights relating to infec-tious diseases in Australian children. Ongoing surveillance through the PAEDS system will continue to complement the work of the APSU, and both APSU and PAEDS provide a platform for the rapid response to potential emerging infec-tious diseases threatening Australian children.
Acknowledgements
Th e APSU wishes to acknowledge the expertise of the chief investigators for each of the conditions studied: Dr Bruce Th orley, Victorian Infectious Diseases Reference Laboratory; Prof William Rawlinson, Virology Division, Department of Microbiology, Prince of Wales Hospital, Sydney; A/Prof Cheryl Jones, Th e Children’s Hospital at Westmead and Discipline of Paediatrics and Child Health, University of Sydney; Ms Ann McDon-ald, National Centre in HIV Epidemiology and
Clinical Research; Prof Lyn Gilbert, Centre for Infectious Diseases and Microbiology, Institute for Clinical Pathology and Medical Research, Westmead Hospital, Westmead NSW; Prof Robert Booy, National Centre for Immunisation Research and Surveillance of Vaccine Preventable Diseases, Th e Children’s Hospital at Westmead, NSW; Professor Julie Bines, Department of Gastroenterology, Royal Children’s Hospital, Melbourne.
We acknowledge the important continued contri-bution of all paediatricians and other child health professionals who participate in surveillance studies conducted by the APSU.
APSU activities are supported by the Australian Government Department of Health and Ageing; the National Health and Medical Research Council (Enabling Grant No: 402784 and Practitioner Fellowship No: 457084, E Elliott); the Creswick Foundation (Fellowship: Y Zurynski), the Discipline of Paediatrics and Child Health and Sydney Medical School, Th e University of Sydney; Th e Children’s Hospital at Westmead, and the Royal Australasian College of Physicians. Th anks go to Ms Nicole McKay for management of APSU data and to Dr Greta Ridley for data analysis.
Author details
Yvonne Zurynski 1,2
Elizabeth Davey 1,2
Elizabeth J Elliott 1,2,3
1. Australian Paediatric Surveillance Unit, The Children’s Hospital at Westmead, Westmead, New South Wales
2. Discipline of Paediatrics and Child Health, The University of Sydney, New South Wales
3. The Children’s Hospital at Westmead, Westmead, New South Wales
Corresponding author: Dr Yvonne Zurynski, Assistant Director, Australian Paediatric Surveillance Unit, The Children’s Hospital at Westmead, Locked Bag 4001, WESTMEAD NSW 2145. Telephone: +61 2 9845 1202/3005. Facsimile: +61 2 9845 3082. Email: [email protected]
References
1. R o b e r t s J A , G r a n t K A , Yo o n Y K , Polychronopoulos S, Ibrahim A, Thorley BR. Annual report of the Australian National Poliovirus Reference Laboratory, 2008. Commun Dis Intell 2009;33(3):291–297.
290 CDI Vol 34 No 3 2010
Annual reports Australian Paediatric Surveillance Unit coverage, 2008 and 2009
2. Carapetis JR, Steer AC, Mulholland EK, Weber M. The global burden of group A streptococcal diseases. Lancet Infect Dis 2005;5(11):685–694.
3. Rawlinson WD, Hall B, Jones CA, Jeffery HE, Arbuckle SM, Graf N, et al. Viruses and other infections in stillbir th: what is the evidence and what should we be doing? Pathology 2008;40(2):149–160.
4. Gidding HF, Young M, Pugh R, Burgess M. Rubella in Australia: can we explain two recent cases of congenital rubella syndrome? Commun Dis Intell 2003;27(4):537–540.
5. McDonald AM, Zurynski YA, Wand HC, Giles ML, Elliott EJ, Ziegler JB, et al. Perinatal exposure to HIV among children born in Australia, 1982–2006. Med J Aust 2009;190(8):416–420.
6. Bines JE, Patel M, Parashar U. Assessment of postlicensure safety of rotavirus vaccines, with emphasis on intussusception. J Infect Dis 2009;200(Suppl 1):S282–S290.
7. Haber P, Patel M, Izur ieta HS, Baggs J, Gargiullo P, Weintraub E, et al. Postlicensure m o n i t o r i n g o f i n t u s s u s c e p t i o n a f t e r RotaTeq vaccination in the United States, 1 February 2006, to 25 September 2007. Pediatrics 2008;121(6):1206–1212.
8. Peadon E, Burgner D, Nissen M, But tery J, Zurynski Y, Elliott E, et al. Case for varicella surveillance in Australia. J Paediatr Child Health 2006;42(11):663–664.
9. Zurynski YA, Lester-Smith D, Festa MS, Kesson AM, Booy R, Elliott EJ. Enhanced surveillance for serious complications of influenza in children: role of the Australian Paediatric Surveillance Unit. Commun Dis Intell 2008;32(1):71–76.
10. He S, Zurynski YA, Elliott EJ. Evaluation of a national resource to identify and study rare diseases: The Australian Paediatric Surveillance Unit. J Paediatr Child Health 2009;45(9):498–504.
11. Zurynski YA, Peadon E, Bower C, Elliot t E. Impacts of national surveillance for uncommon conditions in childhood. J Paediatr Child Health 2007;43(11):724–731.
12. Pym M, Adams J, Booy R, Buttery J, Elia S, Elliott E, et al. The development and trial of paediatric active enhanced disease surveillance (PAEDS): A new surveillance mechanism for Australia. J Paediatr Child Health 2008;44:A16.
13. Australian Bureau of Statis tics. Australian Demographic Statistics. September quarter 2009. Canberra: Australian Bureau of Statistics; 2010. Catalogue no: 3101.0
14. Carnie JA, Lester R, Moran R, Brown L, Meagher J, Roberts JA, et al. Public health response to imported case of poliomyelitis, Australia, 2007. Emerg Infect Dis 2009;15(11):1733–1737.
15. Howard J, Hall B, Brennan LE, Arbuckle S, Craig ME, Graf N, et al. Utility of newborn screening cards for detecting CMV infection in cases of stillbirth. J Clin Virol 2009;44(3):215–218.
16. Grenier D, Elliott EJ, Zurynski YA, Pereira RR, Preece M, Lynn R, et al. Beyond counting numbers: Public health impacts of national paediatric surveillance units. Arch Dis Child 2007;92(6):527–533.
17. Schaffer A, Brotherton J, Booy R. Do human papillomavirus vaccines have any role in newborns and the prevention of recurrent respiratory papillomatosis in children? J Paediatr Child Health 2007;43(9):579–580.
CDI Vol 34 No 3 2010 291
Australian Meningococcal Surveillance Programme, 2009 Annual reports
Abstract
In 2009 there were 233 laboratory-confirmed cases of invasive meningococcal disease (IMD) analysed by the National Neisseria Network, Australia, a nationwide network of reference laboratories. One hundred and thirty–five isolates of Neisseria meningitidis from invasive cases of meningococcal disease were available for which the phenotypes (serogroup, serotype and serosub-type) and/or genotype and antibiotic susceptibility were determined. An additional 98 cases were confirmed by non-culture-based methods (92 by nucleic acid amplification testing (NAAT) and six by serology) , and where possible serotyping was determined. Nationally, 194 (83%) laboratory-con-firmed cases where a serogroup was determined were infected with serogroup B and 13 (5.6%) serogroup C meningococci. The national total of confirmed cases has remained relatively stable since 2006, but the number of cases may vary between jurisdictions each year. New South Wales had the highest number of recorded cases in 2009. Typical primary and secondary disease peaks were observed in those aged 4 years or less and in adolescents and young adults respectively. Serogroup B cases predominated in all age groups and jurisdictions. The common phenotypes circu-lating in Australia continue to be B:15:P1.7 and B:4:P1.4. Although serogroup C cases were low, phenotype C:2a:P1.5 again predominated in this group. No evidence of meningococcal capsular ‘switching’ was detected. Approximately two-thirds of all isolates showed decreased susceptibility to the penicillin group of antibiotics (MIC 0.06 to 0.5 mg/L). All isolates remained susceptible to ceftriaxone. Four isolates had reduced susceptibility to ciprofloxacin, and none to rifampicin. Commun Dis Intell 2010;34(3):291–302.
Keywords: disease surveillance; meningococcal disease; Neisseria meningitidis
Introduction
Th e National Neisseria Network (NNN) is a long-term collaborative program for the laboratory
surveillance of the pathogenic Neisseria species, Neisseria meningitidis and N. gonorrhoeae . Since 1994 the NNN has operated through a network of reference laboratories in each state and territory to provide a national laboratory-based program for the examination of N. meningitidis from cases of invasive meningococcal disease (IMD). 1 Th e NNN supplies data on the phenotype and/or the genotype of invasive meningococci, and their antibiotic susceptibility, supplementing clinical notifi cation data from the National Notifi able Diseases Surveillance System (NNDSS). Th e NNN receives samples for analysis from about 90% (range 85%–92% 2004–2009) of IMD cases notifi ed to NNDSS. Th e NNN annual reports are published in Communicable Diseases Intelligence . 2
Th e characteristics of the meningococci responsible for IMD are important both for individual patient management, and to tailor the public health response for outbreaks or case clusters locally and nationally. Th e introduction of publicly funded conjugate serogroup C meningococcal vaccine onto the National Immunisation Program in 2003 (with a catch up program for 1–19-year-olds that ran until May 2007) saw a signifi cant and sustained reduc-tion in the number of cases of IMD evident after 2004. However, IMD remains an issue of public health concern in Australia. Th e success of any further vaccine initiatives in Australia is dependent upon detailed analysis of the N. meningitidis isolates circulating locally. Th is report provides relevant details of cases of IMD confi rmed by laboratory testing in Australia in 2009.
Methods
Isolate based invasive meningococcal disease cases
Case confi rmation
Case confi rmation was based upon isolation of, or positive nucleic acid amplifi cation testing for N. meningitidis from a normally sterile site or by
ANNUAL REPORT OF THE AUSTRALIAN MENINGOCOCCAL SURVEILLANCE PROGRAMME, 2009 The Australian Meningococcal Surveillance Programme
Australian Meningococcal Surveillance Programme, 2009
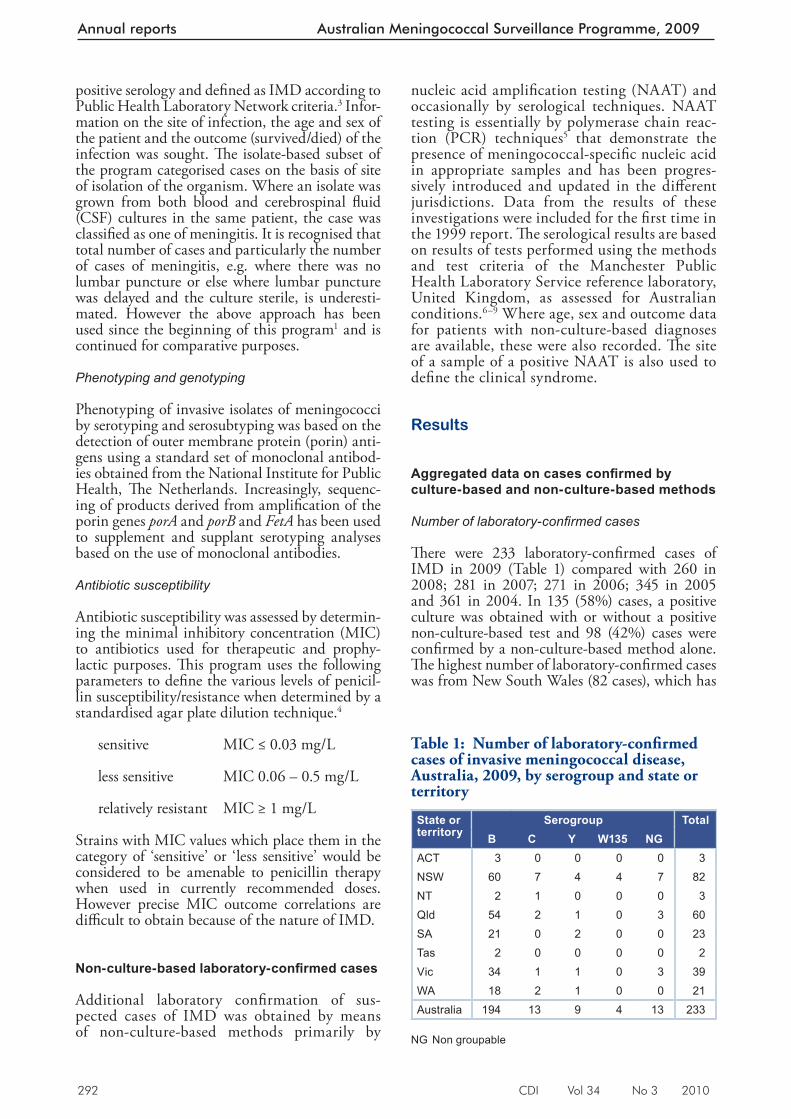
292 CDI Vol 34 No 3 2010
Annual reports Australian Meningococcal Surveillance Programme, 2009
positive serology and defi ned as IMD according to Public Health Laboratory Network criteria. 3 Infor-mation on the site of infection, the age and sex of the patient and the outcome (survived/died) of the infection was sought. Th e isolate-based subset of the program categorised cases on the basis of site of isolation of the organism. Where an isolate was grown from both blood and cerebrospinal fl uid (CSF) cultures in the same patient, the case was classifi ed as one of meningitis. It is recognised that total number of cases and particularly the number of cases of meningitis, e.g. where there was no lumbar puncture or else where lumbar puncture was delayed and the culture sterile, is underesti-mated. However the above approach has been used since the beginning of this program 1 and is continued for comparative purposes.
Phenotyping and genotyping
Phenotyping of invasive isolates of meningococci by serotyping and serosubtyping was based on the detection of outer membrane protein (porin) anti-gens using a standard set of monoclonal antibod-ies obtained from the National Institute for Public Health, Th e Netherlands. Increasingly, sequenc-ing of products derived from amplifi cation of the porin genes porA and porB and FetA has been used to supplement and supplant serotyping analyses based on the use of monoclonal antibodies.
Antibiotic susceptibility
Antibiotic susceptibility was assessed by determin-ing the minimal inhibitory concentration (MIC) to antibiotics used for therapeutic and prophy-lactic purposes. Th is program uses the following parameters to defi ne the various levels of penicil-lin susceptibility/resistance when determined by a standardised agar plate dilution technique. 4
sensitive MIC ≤ 0.03 mg/L
less sensitive MIC 0.06 – 0.5 mg/L
relatively resistant MIC ≥ 1 mg/L
Strains with MIC values which place them in the category of ‘sensitive’ or ‘less sensitive’ would be considered to be amenable to penicillin therapy when used in currently recommended doses. However precise MIC outcome correlations are diffi cult to obtain because of the nature of IMD.
Non-culture-based laboratory-confi rmed cases
Additional laboratory confi rmation of sus-pected cases of IMD was obtained by means of non-culture-based methods primarily by
nucleic acid amplifi cation testing (NAAT) and occasionally by serological techniques. NAAT testing is essentially by polymerase chain reac-tion (PCR) techniques 5 that demonstrate the presence of meningococcal-specifi c nucleic acid in appropriate samples and has been progres-sively introduced and updated in the diff erent jurisdictions. Data from the results of these investigations were included for the fi rst time in the 1999 report. Th e serological results are based on results of tests performed using the methods and test criteria of the Manchester Public Health Laboratory Service reference laboratory, United Kingdom, as assessed for Australian conditions. 6–9 Where age, sex and outcome data for patients with non-culture-based diagnoses are available, these were also recorded. Th e site of a sample of a positive NAAT is also used to defi ne the clinical syndrome.
Results
Aggregated data on cases confi rmed by culture-based and non-culture-based methods
Number of laboratory-confi rmed cases
Th ere were 233 laboratory-confi rmed cases of IMD in 2009 (Table 1) compared with 260 in 2008; 281 in 2007; 271 in 2006; 345 in 2005 and 361 in 2004. In 135 (58%) cases, a positive culture was obtained with or without a positive non-culture-based test and 98 (42%) cases were confi rmed by a non-culture-based method alone. Th e highest number of laboratory-confi rmed cases was from New South Wales (82 cases), which has
Table 1: Number of laboratory-confi rmed cases of invasive meningococcal disease, Australia, 2009, by serogroup and state or territory
State or territory
Serogroup TotalB C Y W135 NG
ACT 3 0 0 0 0 3NSW 60 7 4 4 7 82NT 2 1 0 0 0 3Qld 54 2 1 0 3 60SA 21 0 2 0 0 23Tas 2 0 0 0 0 2Vic 34 1 1 0 3 39WA 18 2 1 0 0 21Australia 194 13 9 4 13 233
NG Non groupable
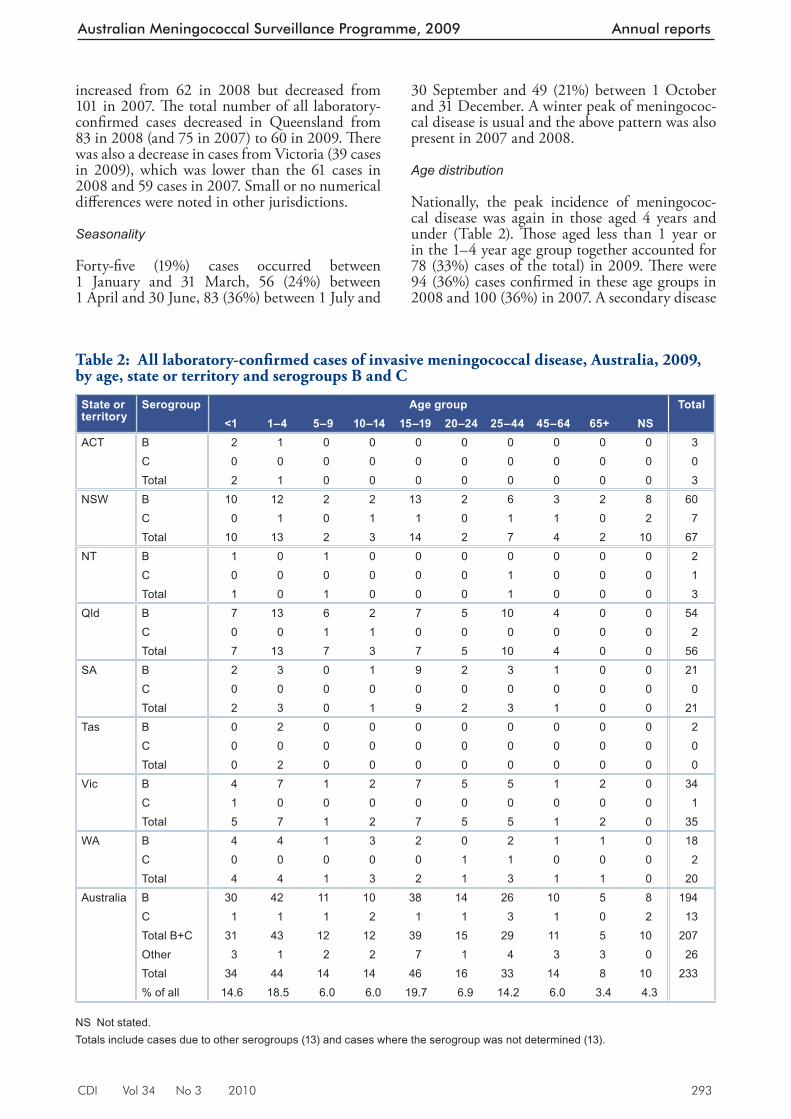
CDI Vol 34 No 3 2010 293
Australian Meningococcal Surveillance Programme, 2009 Annual reports
increased from 62 in 2008 but decreased from 101 in 2007. Th e total number of all laboratory-confi rmed cases decreased in Queensland from 83 in 2008 (and 75 in 2007) to 60 in 2009. Th ere was also a decrease in cases from Victoria (39 cases in 2009), which was lower than the 61 cases in 2008 and 59 cases in 2007. Small or no numerical diff erences were noted in other jurisdictions.
Seasonality
Forty-fi ve (19%) cases occurred between 1 January and 31 March, 56 (24%) between 1 April and 30 June, 83 (36%) between 1 July and
30 September and 49 (21%) between 1 October and 31 December. A winter peak of meningococ-cal disease is usual and the above pattern was also present in 2007 and 2008.
Age distribution
Nationally, the peak incidence of meningococ-cal disease was again in those aged 4 years and under (Table 2). Th ose aged less than 1 year or in the 1–4 year age group together accounted for 78 (33%) cases of the total) in 2009. Th ere were 94 (36%) cases confi rmed in these age groups in 2008 and 100 (36%) in 2007. A secondary disease
Table 2: All laboratory-confi rmed cases of invasive meningococcal disease, Australia, 2009, by age, state or territory and serogroups B and C
State or territory
Serogroup Age group Total<1 1–4 5–9 10–14 15–19 20–24 25–44 45–64 65+ NS
ACT B 2 1 0 0 0 0 0 0 0 0 3C 0 0 0 0 0 0 0 0 0 0 0Total 2 1 0 0 0 0 0 0 0 0 3
NSW B 10 12 2 2 13 2 6 3 2 8 60C 0 1 0 1 1 0 1 1 0 2 7Total 10 13 2 3 14 2 7 4 2 10 67
NT B 1 0 1 0 0 0 0 0 0 0 2C 0 0 0 0 0 0 1 0 0 0 1Total 1 0 1 0 0 0 1 0 0 0 3
Qld B 7 13 6 2 7 5 10 4 0 0 54C 0 0 1 1 0 0 0 0 0 0 2Total 7 13 7 3 7 5 10 4 0 0 56
SA B 2 3 0 1 9 2 3 1 0 0 21C 0 0 0 0 0 0 0 0 0 0 0Total 2 3 0 1 9 2 3 1 0 0 21
Tas B 0 2 0 0 0 0 0 0 0 0 2C 0 0 0 0 0 0 0 0 0 0 0Total 0 2 0 0 0 0 0 0 0 0 0
Vic B 4 7 1 2 7 5 5 1 2 0 34C 1 0 0 0 0 0 0 0 0 0 1Total 5 7 1 2 7 5 5 1 2 0 35
WA B 4 4 1 3 2 0 2 1 1 0 18C 0 0 0 0 0 1 1 0 0 0 2Total 4 4 1 3 2 1 3 1 1 0 20
Australia B 30 42 11 10 38 14 26 10 5 8 194C 1 1 1 2 1 1 3 1 0 2 13Total B+C 31 43 12 12 39 15 29 11 5 10 207Other 3 1 2 2 7 1 4 3 3 0 26Total 34 44 14 14 46 16 33 14 8 10 233% of all 14.6 18.5 6.0 6.0 19.7 6.9 14.2 6.0 3.4 4.3
NS Not stated. Totals include cases due to other serogroups (13) and cases where the serogroup was not determined (13).
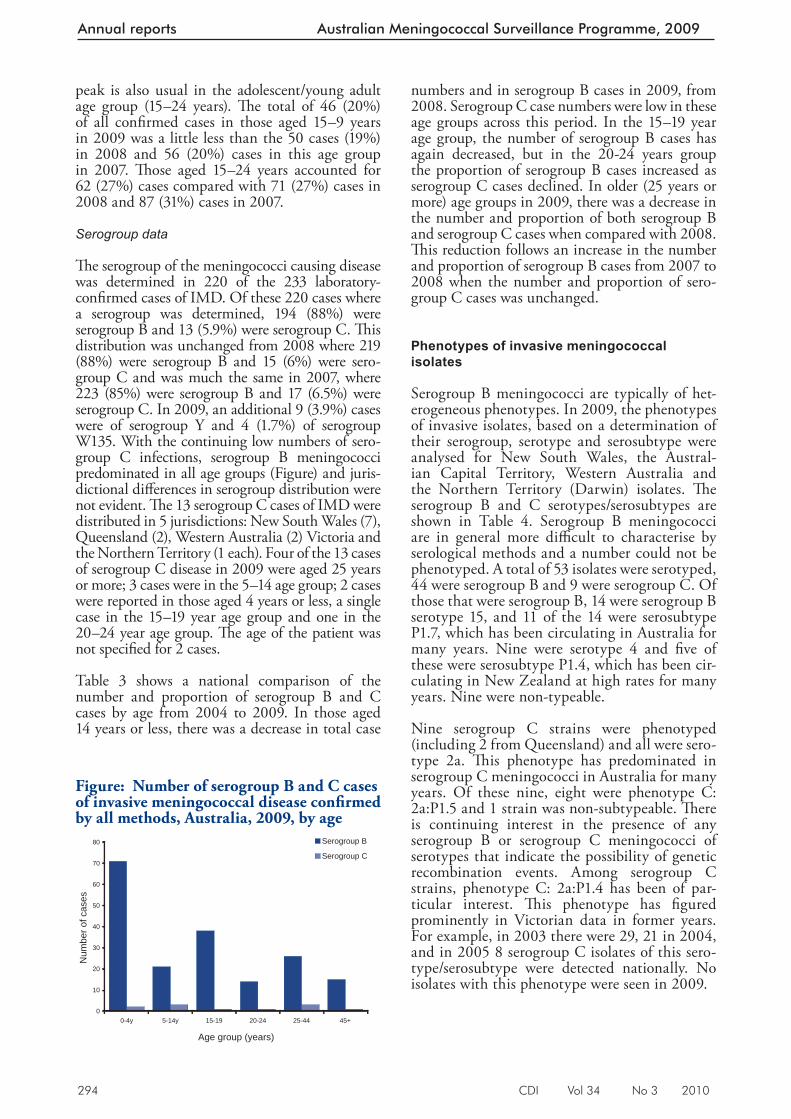
294 CDI Vol 34 No 3 2010
Annual reports Australian Meningococcal Surveillance Programme, 2009
peak is also usual in the adolescent/young adult age group (15–24 years). Th e total of 46 (20%) of all confi rmed cases in those aged 15–9 years in 2009 was a little less than the 50 cases (19%) in 2008 and 56 (20%) cases in this age group in 2007. Th ose aged 15–24 years accounted for 62 (27%) cases compared with 71 (27%) cases in 2008 and 87 (31%) cases in 2007.
Serogroup data
Th e serogroup of the meningococci causing disease was determined in 220 of the 233 laboratory-confi rmed cases of IMD. Of these 220 cases where a serogroup was determined, 194 (88%) were serogroup B and 13 (5.9%) were serogroup C. Th is distribution was unchanged from 2008 where 219 (88%) were serogroup B and 15 (6%) were sero-group C and was much the same in 2007, where 223 (85%) were serogroup B and 17 (6.5%) were serogroup C. In 2009, an additional 9 (3.9%) cases were of serogroup Y and 4 (1.7%) of serogroup W135. With the continuing low numbers of sero-group C infections, serogroup B meningococci predominated in all age groups (Figure) and juris-dictional diff erences in serogroup distribution were not evident. Th e 13 serogroup C cases of IMD were distributed in 5 jurisdictions: New South Wales (7), Queensland (2), Western Australia (2) Victoria and the Northern Territory (1 each). Four of the 13 cases of serogroup C disease in 2009 were aged 25 years or more; 3 cases were in the 5–14 age group; 2 cases were reported in those aged 4 years or less, a single case in the 15–19 year age group and one in the 20–24 year age group. Th e age of the patient was not specifi ed for 2 cases.
Table 3 shows a national comparison of the number and proportion of serogroup B and C cases by age from 2004 to 2009. In those aged 14 years or less, there was a decrease in total case
numbers and in serogroup B cases in 2009, from 2008. Serogroup C case numbers were low in these age groups across this period. In the 15–19 year age group, the number of serogroup B cases has again decreased, but in the 20-24 years group the proportion of serogroup B cases increased as serogroup C cases declined. In older (25 years or more) age groups in 2009, there was a decrease in the number and proportion of both serogroup B and serogroup C cases when compared with 2008. Th is reduction follows an increase in the number and proportion of serogroup B cases from 2007 to 2008 when the number and proportion of sero-group C cases was unchanged.
Phenotypes of invasive meningococcal isolates
Serogroup B meningococci are typically of het-erogeneous phenotypes. In 2009, the phenotypes of invasive isolates, based on a determination of their serogroup, serotype and serosubtype were analysed for New South Wales, the Austral-ian Capital Territory, Western Australia and the Northern Territory (Darwin) isolates. Th e serogroup B and C serotypes/serosubtypes are shown in Table 4. Serogroup B meningococci are in general more diffi cult to characterise by serological methods and a number could not be phenotyped. A total of 53 isolates were serotyped, 44 were serogroup B and 9 were serogroup C. Of those that were serogroup B, 14 were serogroup B serotype 15, and 11 of the 14 were serosubtype P1.7, which has been circulating in Australia for many years. Nine were serotype 4 and fi ve of these were serosubtype P1.4, which has been cir-culating in New Zealand at high rates for many years. Nine were non-typeable.
Nine serogroup C strains were phenotyped (including 2 from Queensland) and all were sero-type 2a. Th is phenotype has predominated in serogroup C meningococci in Australia for many years. Of these nine, eight were phenotype C: 2a:P1.5 and 1 strain was non-subtypeable. Th ere is continuing interest in the presence of any serogroup B or serogroup C meningococci of serotypes that indicate the possibility of genetic recombination events. Among serogroup C strains, phenotype C: 2a:P1.4 has been of par-ticular interest. Th is phenotype has fi gured prominently in Victorian data in former years. For example, in 2003 there were 29, 21 in 2004, and in 2005 8 serogroup C isolates of this sero-type/serosubtype were detected nationally. No isolates with this phenotype were seen in 2009.
Figure: Number of serogroup B and C cases of invasive meningococcal disease confi rmed by all methods, Australia, 2009, by age
0
10
20
30
40
50
60
70
80
0-4y 5-14y 15-19 20-24 25-44 45+
Age group (years)
Num
ber o
f cas
es
Serogroup B
Serogroup C
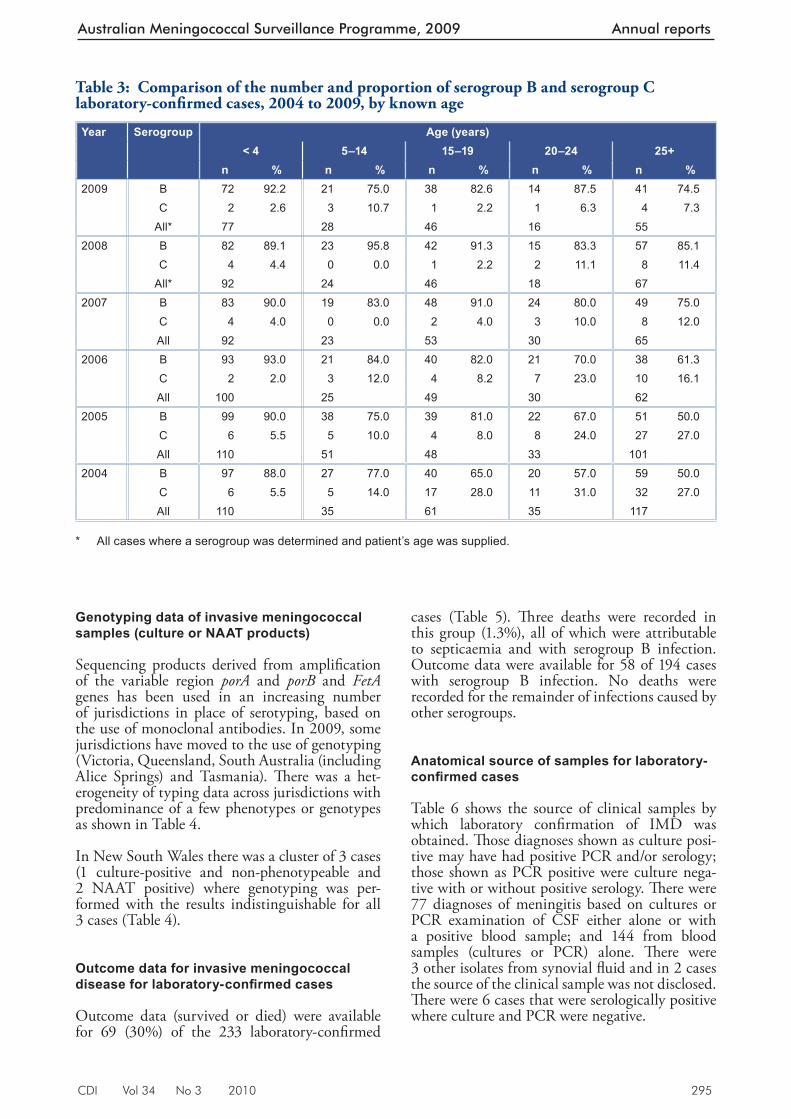
CDI Vol 34 No 3 2010 295
Australian Meningococcal Surveillance Programme, 2009 Annual reports
Table 3: Comparison of the number and proportion of serogroup B and serogroup C laboratory-confi rmed cases, 2004 to 2009, by known age
Year Serogroup Age (years)< 4 5–14 15–19 20–24 25+
n % n % n % n % n %2009 B 72 92.2 21 75.0 38 82.6 14 87.5 41 74.5
C 2 2.6 3 10.7 1 2.2 1 6.3 4 7.3All* 77 28 46 16 55
2008 B 82 89.1 23 95.8 42 91.3 15 83.3 57 85.1C 4 4.4 0 0.0 1 2.2 2 11.1 8 11.4
All* 92 24 46 18 672007 B 83 90.0 19 83.0 48 91.0 24 80.0 49 75.0
C 4 4.0 0 0.0 2 4.0 3 10.0 8 12.0All 92 23 53 30 65
2006 B 93 93.0 21 84.0 40 82.0 21 70.0 38 61.3C 2 2.0 3 12.0 4 8.2 7 23.0 10 16.1All 100 25 49 30 62
2005 B 99 90.0 38 75.0 39 81.0 22 67.0 51 50.0C 6 5.5 5 10.0 4 8.0 8 24.0 27 27.0All 110 51 48 33 101
2004 B 97 88.0 27 77.0 40 65.0 20 57.0 59 50.0C 6 5.5 5 14.0 17 28.0 11 31.0 32 27.0All 110 35 61 35 117
* All cases where a serogroup was determined and patient’s age was supplied.
Genotyping data of invasive meningococcal samples (culture or NAAT products)
Sequencing products derived from amplifi cation of the variable region porA and porB and FetA genes has been used in an increasing number of jurisdictions in place of serotyping, based on the use of monoclonal antibodies. In 2009, some jurisdictions have moved to the use of genotyping (Victoria, Queensland, South Australia (including Alice Springs) and Tasmania). Th ere was a het-erogeneity of typing data across jurisdictions with predominance of a few phenotypes or genotypes as shown in Table 4.
In New South Wales there was a cluster of 3 cases (1 culture-positive and non-phenotypeable and 2 NAAT positive) where genotyping was per-formed with the results indistinguishable for all 3 cases (Table 4).
Outcome data for invasive meningococcal disease for laboratory-confi rmed cases
Outcome data (survived or died) were available for 69 (30%) of the 233 laboratory-confi rmed
cases (Table 5). Th ree deaths were recorded in this group (1.3%), all of which were attributable to septicaemia and with serogroup B infection. Outcome data were available for 58 of 194 cases with serogroup B infection. No deaths were recorded for the remainder of infections caused by other serogroups.
Anatomical source of samples for laboratory-confi rmed cases
Table 6 shows the source of clinical samples by which laboratory confi rmation of IMD was obtained. Th ose diagnoses shown as culture posi-tive may have had positive PCR and/or serology; those shown as PCR positive were culture nega-tive with or without positive serology. Th ere were 77 diagnoses of meningitis based on cultures or PCR examination of CSF either alone or with a positive blood sample; and 144 from blood samples (cultures or PCR) alone. Th ere were 3 other isolates from synovial fl uid and in 2 cases the source of the clinical sample was not disclosed. Th ere were 6 cases that were serologically positive where culture and PCR were negative.
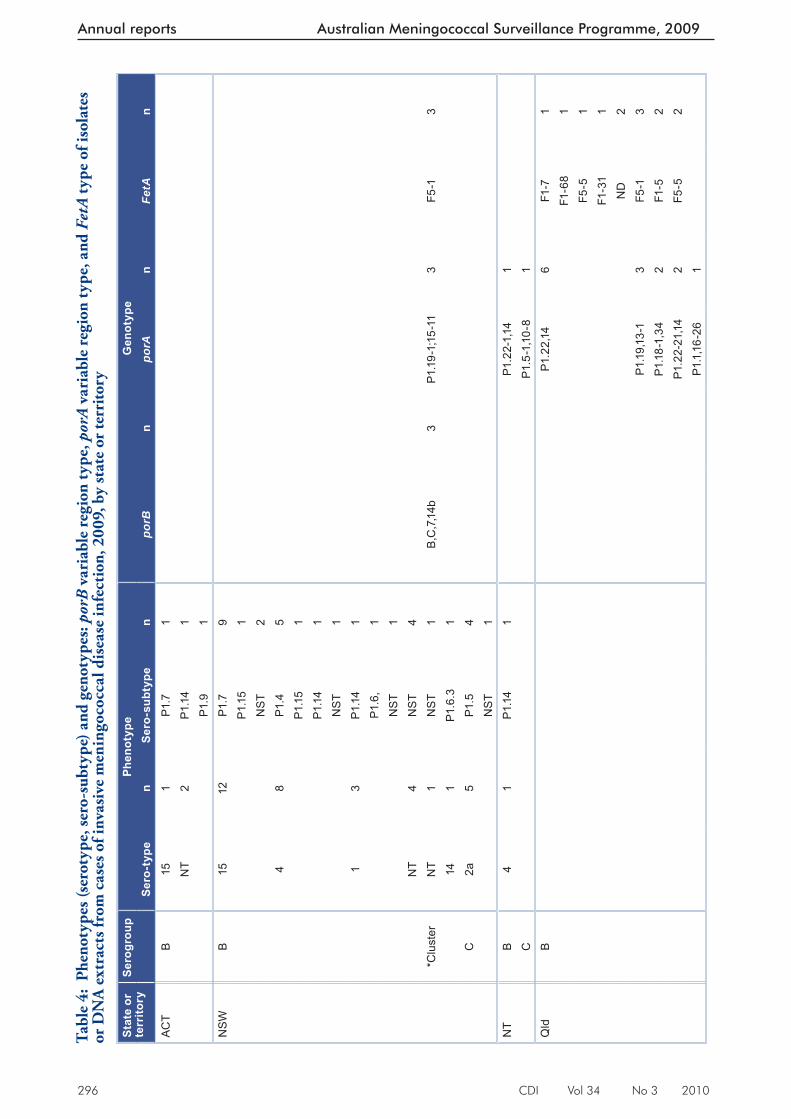
296 CDI Vol 34 No 3 2010
Annual reports Australian Meningococcal Surveillance Programme, 2009
Tabl
e 4:
Phe
noty
pes (
sero
type
, ser
o-su
btyp
e) a
nd g
enot
ypes
: por
B v
aria
ble
regi
on ty
pe, p
orA
var
iabl
e re
gion
type
, and
Fet
A ty
pe o
f iso
late
s or
DN
A e
xtra
cts f
rom
cas
es o
f inv
asiv
e m
enin
goco
ccal
dis
ease
infe
ctio
n, 2
009,
by
stat
e or
terr
itory
Stat
e or
te
rrito
rySe
rogr
oup
Phen
otyp
eG
enot
ype
Sero
-typ
en
Sero
-sub
type
npo
rBn
porA
nFe
tAn
ACT
B15
1P1
.71
NT
2P1
.14
1
P1.9
1N
SW
B15
12P1
.79
P1.1
51
NS
T2
48
P1.4
5P1
.15
1P1
.14
1N
ST
11
3P1
.14
1P1
.6,
1
N
ST
1N
T4
NS
T4
*Clu
ster
NT
1N
ST
1B
,C,7
,14b
3P1
.19-
1;15
-11
3F5
-13
141
P1.6
.31
C2a
5P1
.54
NS
T1
NT
B4
1P1
.14
1P1
.22-
1,14
1C
P1.5
-1,1
0-8
1Q
ldB
P1.2
2,14
6F1
-71
F1-6
81
F5-5
1F1
-31
1N
D2
P1.1
9,13
-13
F5-1
3P1
.18-
1,34
2F1
-52
P1.2
2-21
,14
2F5
-52
P1.1
,16-
261
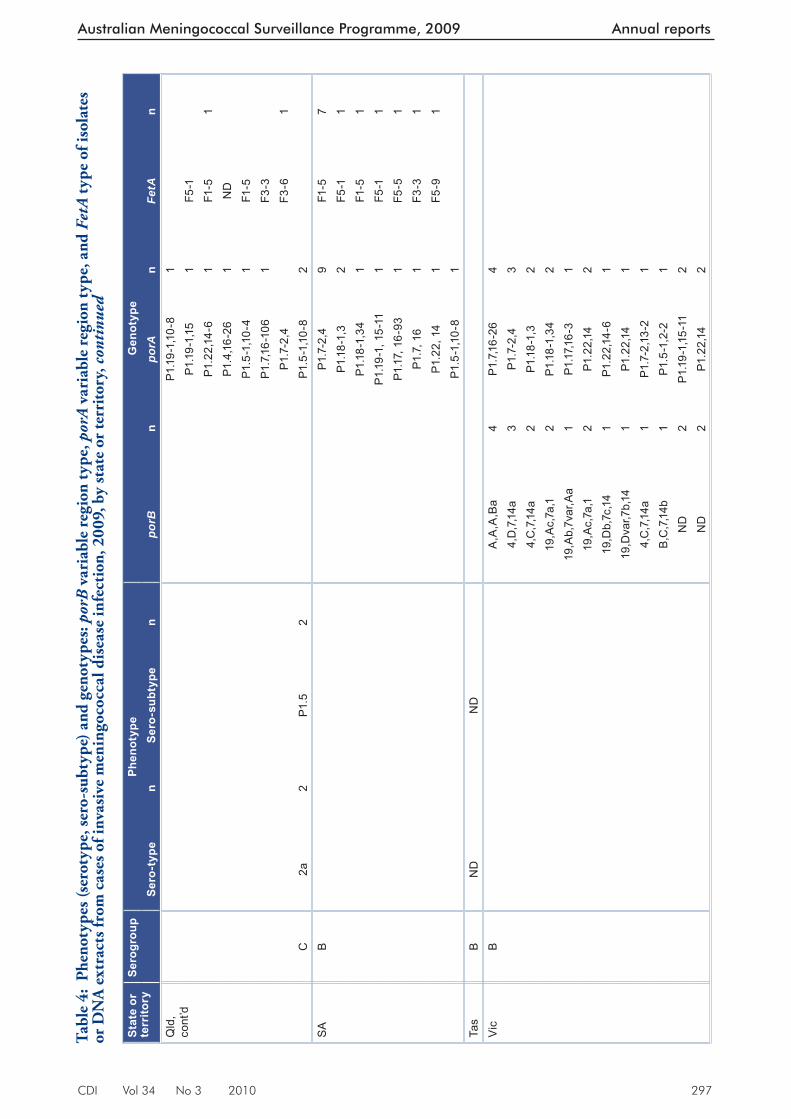
CDI Vol 34 No 3 2010 297
Australian Meningococcal Surveillance Programme, 2009 Annual reports
Stat
e or
te
rrito
rySe
rogr
oup
Phen
otyp
eG
enot
ype
Sero
-typ
en
Sero
-sub
type
npo
rBn
porA
nFe
tAn
Qld
, co
nt’d
P1
.19-
1,10
-81
P1.1
9-1,
151
F5-1
P1
.22,
14-6
1F1
-51
P1
.4,1
6-26
1N
D
P1.5
-1,1
0-4
1F1
-5
P1.7
,16-
106
1F3
-3P1
.7-2
,4F3
-61
C2a
2P1
.52
P1.5
-1,1
0-8
2S
AB
P1.7
-2,4
9F1
-57
P1.1
8-1,
32
F5-1
1P1
.18-
1,34
1F1
-51
P1.1
9-1,
15-
111
F5-1
1P1
.17,
16-
931
F5-5
1P1
.7, 1
6 1
F3-3
1P1
.22,
14
1F5
-91
P1
.5-1
,10-
81
Ta
sB
ND
ND
Vic
BA
,A,A
,Ba
4P1
.7,1
6-26
44,
D,7
,14a
3P1
.7-2
,43
4,C
,7,1
4a2
P1.1
8-1,
32
19,A
c,7a
,12
P1.1
8-1,
342
19,A
b,7v
ar,A
a1
P1.1
7,16-
31
19,A
c,7a
,12
P1.2
2,14
219
,Db,
7c,1
41
P1.2
2,14
-61
19,D
var,7
b,14
1P1
.22,
141
4,C
,7,1
4a1
P1.7
-2,1
3-2
1B
,C,7
,14b
1P1
.5-1
,2-2
1N
D2
P1.1
9-1,
15-1
12
ND
2P1
.22,
142
Tabl
e 4:
Phe
noty
pes (
sero
type
, ser
o-su
btyp
e) a
nd g
enot
ypes
: por
B v
aria
ble
regi
on ty
pe, p
orA
var
iabl
e re
gion
type
, and
Fet
A ty
pe o
f iso
late
s or
DN
A e
xtra
cts f
rom
cas
es o
f inv
asiv
e m
enin
goco
ccal
dis
ease
infe
ctio
n, 2
009,
by
stat
e or
terr
itory
, con
tinu
ed
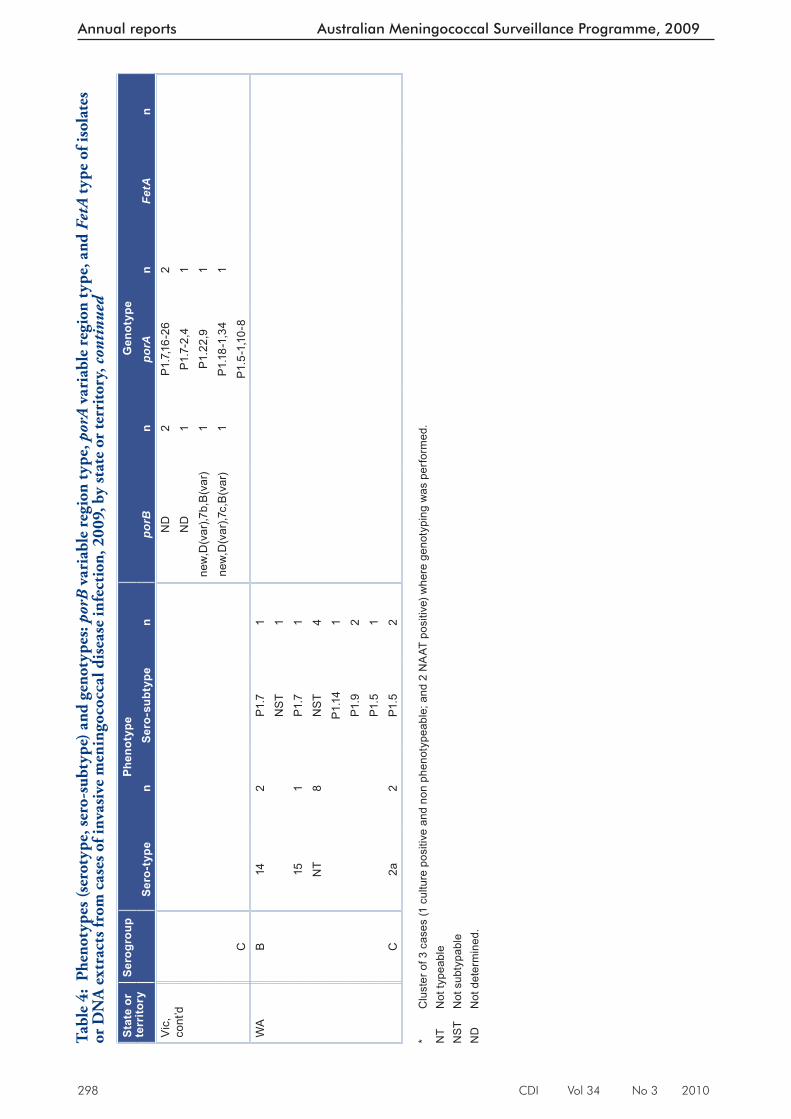
298 CDI Vol 34 No 3 2010
Annual reports Australian Meningococcal Surveillance Programme, 2009
Stat
e or
te
rrito
rySe
rogr
oup
Phen
otyp
eG
enot
ype
Sero
-typ
en
Sero
-sub
type
npo
rBn
porA
nFe
tAn
Vic
, co
nt’d
ND
2P1
.7,1
6-26
2N
D1
P1.7
-2,4
1ne
w,D
(var
),7b,
B(v
ar)
1P1
.22,
91
new
,D(v
ar),7
c,B
(var
)1
P1.1
8-1,
341
CP1
.5-1
,10-
8W
AB
142
P1.7
1N
ST
115
1P1
.71
NT
8N
ST
4P1
.14
1P1
.92
P1.5
1C
2a2
P1.5
2 *
Clu
ster
of 3
cas
es (1
cul
ture
pos
itive
and
non
phe
noty
peab
le; a
nd 2
NA
AT p
ositi
ve) w
here
gen
otyp
ing
was
per
form
ed.
NT
Not
type
able
NS
T N
ot s
ubty
pabl
e N
D
Not
det
erm
ined
.
Tabl
e 4:
Phe
noty
pes (
sero
type
, ser
o-su
btyp
e) a
nd g
enot
ypes
: por
B v
aria
ble
regi
on ty
pe, p
orA
var
iabl
e re
gion
type
, and
Fet
A ty
pe o
f iso
late
s or
DN
A e
xtra
cts f
rom
cas
es o
f inv
asiv
e m
enin
goco
ccal
dis
ease
infe
ctio
n, 2
009,
by
stat
e or
terr
itory
, con
tinu
ed
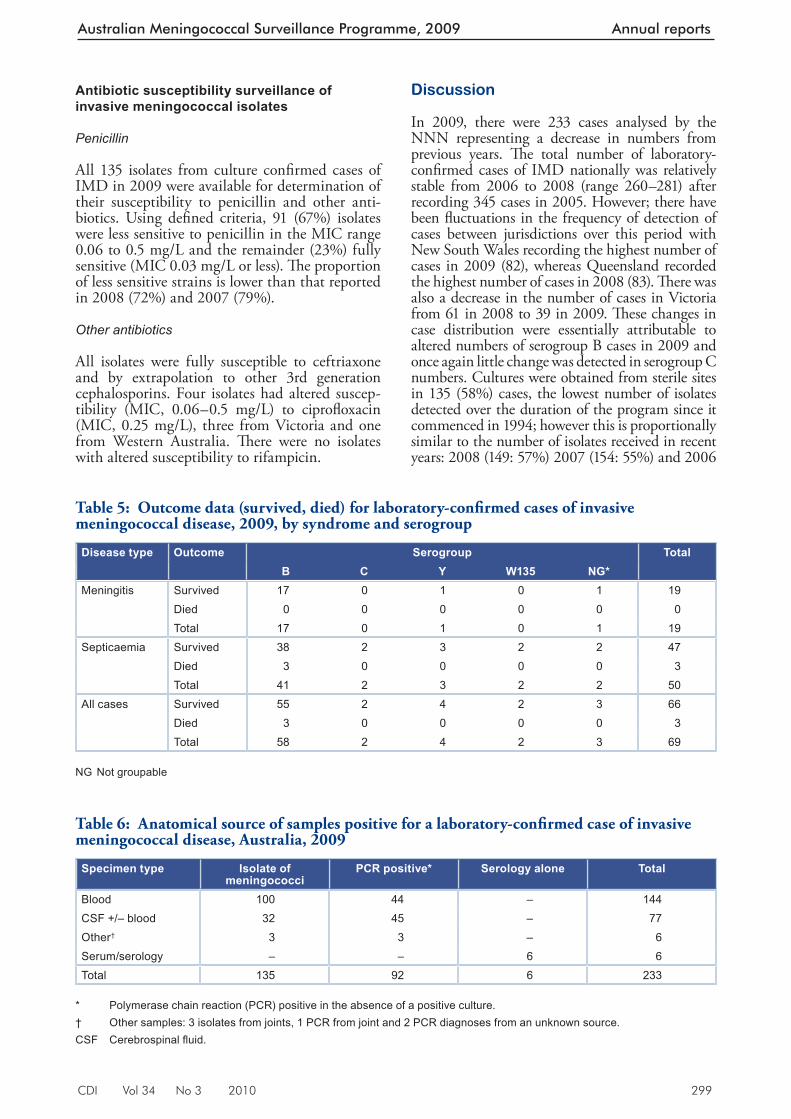
CDI Vol 34 No 3 2010 299
Australian Meningococcal Surveillance Programme, 2009 Annual reports
Antibiotic susceptibility surveillance of invasive meningococcal isolates
Penicillin
All 135 isolates from culture confi rmed cases of IMD in 2009 were available for determination of their susceptibility to penicillin and other anti-biotics. Using defi ned criteria, 91 (67%) isolates were less sensitive to penicillin in the MIC range 0.06 to 0.5 mg/L and the remainder (23%) fully sensitive (MIC 0.03 mg/L or less). Th e proportion of less sensitive strains is lower than that reported in 2008 (72%) and 2007 (79%).
Other antibiotics
All isolates were fully susceptible to ceftriaxone and by extrapolation to other 3rd generation cephalosporins. Four isolates had altered suscep-tibility (MIC, 0.06–0.5 mg/L) to ciprofl oxacin (MIC, 0.25 mg/L), three from Victoria and one from Western Australia. Th ere were no isolates with altered susceptibility to rifampicin.
Discussion
In 2009, there were 233 cases analysed by the NNN representing a decrease in numbers from previous years. Th e total number of laboratory-confi rmed cases of IMD nationally was relatively stable from 2006 to 2008 (range 260–281) after recording 345 cases in 2005. However; there have been fl uctuations in the frequency of detection of cases between jurisdictions over this period with New South Wales recording the highest number of cases in 2009 (82), whereas Queensland recorded the highest number of cases in 2008 (83). Th ere was also a decrease in the number of cases in Victoria from 61 in 2008 to 39 in 2009. Th ese changes in case distribution were essentially attributable to altered numbers of serogroup B cases in 2009 and once again little change was detected in serogroup C numbers. Cultures were obtained from sterile sites in 135 (58%) cases, the lowest number of isolates detected over the duration of the program since it commenced in 1994; however this is proportionally similar to the number of isolates received in recent years: 2008 (149: 57%) 2007 (154: 55%) and 2006
Table 5: Outcome data (survived, died) for laboratory-confi rmed cases of invasive meningococcal disease, 2009, by syndrome and serogroup
Disease type Outcome Serogroup TotalB C Y W135 NG*
Meningitis Survived 17 0 1 0 1 19Died 0 0 0 0 0 0Total 17 0 1 0 1 19
Septicaemia Survived 38 2 3 2 2 47Died 3 0 0 0 0 3Total 41 2 3 2 2 50
All cases Survived 55 2 4 2 3 66Died 3 0 0 0 0 3Total 58 2 4 2 3 69
NG Not groupable
Table 6: Anatomical source of samples positive for a laboratory-confi rmed case of invasive meningococcal disease, Australia, 2009
Specimen type Isolate of meningococci
PCR positive* Serology alone Total
Blood 100 44 – 144CSF +/– blood 32 45 – 77Other† 3 3 – 6Serum/serology – – 6 6Total 135 92 6 233
* Polymerase chain reaction (PCR) positive in the absence of a positive culture. † Other samples: 3 isolates from joints, 1 PCR from joint and 2 PCR diagnoses from an unknown source. CSF Cerebrospinal fl uid.

300 CDI Vol 34 No 3 2010
Annual reports Australian Meningococcal Surveillance Programme, 2009
(166: 61%). Non-culture-based diagnoses were used to confi rm a further 91 (39%) cases of IMD in 2009, compared with 111 (43%) in 2008 and 127 (45%) in 2007. Attention is specifi cally drawn to earlier Australian Meningococcal Surveillance Programme (AMSP) reports that explain diff er-ences between the numbers of clinically notifi ed cases and laboratory-confi rmed cases. 10 It should also be noted that surveillance systems rarely capture all cases in any given period so that small diff erences in numbers of cases should be expected.
Only 13 serogroup C infections were identifi ed nationally in 2009 so that serogroup B disease accounted for 88% of all infections where a serogroup was determined. No serogroup C cases were identifi ed in South Australia, the Austral-ian Capital Territory or Tasmania while there were 7 cases in New South Wales and small numbers present in the other jurisdictions. Only low numbers of infections due to serogroups Y and W135 were encountered, which is usual for Australia. A primary peak in IMD infection rates was again evident in younger age groups, with a secondary peak in adolescents and young adults. Th e distribution of serogroup C disease was low across all age groups in 2009. As in previous years, there was a small number of serogroup C cases in those aged 25 years or more (Table 3), which may refl ect the secondary benefi t of herd immu-nity accruing to the wider community following vaccination of those age groups where disease was formerly highly concentrated. 11
Phenotypic and genotypic data again found no evidence of substantial numbers of cases of IMD caused by N. meningitidis that have under-gone genetic recombination, although sporadic instances of this occurrence have been detected in Australia. Th ere were some concerns expressed that the documented capacity for genetic recon-fi guration within meningococci may lead to the emergence of new and invasive subtypes following extensive vaccine use. 11 Analysis of meningococcal subtypes and any evidence of the expansion of ‘new’ subtypes will continue as part of the NNN Programme. Mortality data were assessable in only a low proportion of cases and must be interpreted with caution. All of the small number of fatal cases of IMD were associated with serogroup B infections. Th e NNN does not attempt collection of morbidity data associated with IMD.
Th e distribution of penicillin MIC values from invasive isolates in 2009 showed that the pro-portion with decreased susceptibility to penicil-lins was 67%, a little less than that observed in 2008 (72%) and 2007 (79%). It is emphasised that this decreased susceptibility does not aff ect clinical outcomes and penicillins remain a suitable
treatment for IMD in Australia. All isolates were susceptible to the 3rd generation cephalosporins and to the ‘clearance’ antibiotics rifampicin and ciprofl oxacin with the exception of 4 isolates with decreased susceptibility ciprofl oxacin: three from Queensland and one from Western Australia. Th e group of strains with decreased susceptibility to quinolone antibiotics is the subject of on-going international interest following their fi rst descrip-tion from the AMSP group in 2000. 12–15 Th ere were 2 isolates in AMSP data with decreased susceptibility to quinolone antibiotics detected in 2008, and one in 2007.
Acknowledgements
Isolates were received in the reference centres from many laboratories throughout Australia. Th e considerable time and eff ort involved in forward-ing these strains is recognised and these eff orts are greatly appreciated. Th ese data could not have been provided without this assistance and the help of clinical colleagues and public health personnel.
Australian Meningococcal Surveillance members, 2009: John Bates, Denise Murphy, Helen Smith, Public Health Microbiology, Queens-land Health Scientifi c Services, Coopers Plains, Queensland, Athena Limnios, Sanghamitra Ray, Tiff any Hogan, Anne Lam, Monica Lahra and John Tapsall, Department of Microbiology, Th e Prince of Wales Hospital, Randwick, New South Wales; Joanne Mercer and Robert Porritt, Department of Microbiology and Infectious Diseases, SSWPS, Liverpool, New South Wales; Geoff Hogg, Angelo Zaia and Kerrie Stevens, Th e Microbiological Diagnostic Unit (PHL, Department of Microbiology and Immunology, University of Melbourne, Parkville, Victoria); Andrew Lawrence, Microbiology and Infectious Diseases Department, SA Pathology at Women’s and Children’s Hospital, North Adelaide SA, South Australia; Peter Campbell, David Atlas and Tony Keil, Department of Microbiol-ogy, Princess Margaret Hospital for Children, Subiaco, Western Australia; Mark Gardam and Belinda Chamley, (Department of Microbiology and Infectious Diseases, Royal Hobart Hospital, Hobart, Tasmania); Paul Southwell and Micro-biology Staff , (Microbiology Laboratory, Royal Darwin Hospital, Casuarina, Northern Terri-tory;) Susan Bradbury, Angelique Clyde-Smith and Peter Collignon, (Microbiology Depart-ment, Canberra Hospital, Garran, Australian Capital Territory).
Th e Australian Government Department of Health and Ageing provided a grant for the National Neisseria Network.
CDI Vol 34 No 3 2010 301
Australian Meningococcal Surveillance Programme, 2009 Annual reports
Participants in the 2009 Australian Meningococ-cal Surveillance Programme (to whom isolates and samples should be referred and enquiries directed) are listed below.
Australian Capital Territory
P Collignon/S BradburyMicrobiology DepartmentTh e Canberra HospitalPO Box 11Garran ACT 2606Telephone: +61 2 6244 2510Email: [email protected]
New South Wales
J Tapsall/M. Lahra/ A Limnios/T HoganMicrobiology DepartmentSEALSTh e Prince of Wales HospitalRandwick NSW 2031Telephone: +61 2 9382 9079Facsimile: +61 2 9398 4275Email: [email protected]
J Mercer/R PorrittDepartment of Microbiology and Infectious DiseasesSSWPSLocked Mail Bag 90Liverpool BC NSW 1871Telephone: +61 2 9828 5124Facsimile: +61 2 9828 5129Email: [email protected]@sswsahs.nsw.gov.au
Northern Territory
P Southwell and staff Microbiology Laboratory, NTGPS Royal Darwin Hospital Campus Tiwi NT 0810 Telephone: +61 8 8922 8004 Facsimile: +61 8 89227788 Email: [email protected]
Queensland
J Bates/H SmithPublic Health MicrobiologyQueensland Health Scientifi c Services39 Kessels RoadCoopers Plains Qld 4108Telephone: +61 7 3274 9101Facsimile : +61 073274 9175Email: [email protected]
South Australia
A LawrenceMicrobiology and Infectious Diseases Department SA Pathology at Women’s and Children’s Hospital72 King William RoadNorth Adelaide SA 5006 Telephone: +61 8 8161 6376Facsimile: +61 8 8161 6051Email: [email protected]
Tasmania
A McGregor/ M Gardam/ B ChamleyDepartment of Microbiology and Infectious DiseasesRoyal Hobart HospitalGPO Box 1061LHobart Tasmania 7001Telephone: +61 36222 8656Email: [email protected]
Victoria
G Hogg/ A Zaia/ K StevensMicrobiological Diagnostic Unit Public Health Laboratory (MDU PHL)Department of Microbiology and ImmunologyTh e University of MelbourneParkville Victoria 3052Telephone: +61 3 8344 5701Facsimile: +61 3 8344 7833 Email: [email protected]
Western Australia
P Campbell /D Atlas/ AD KeilDepartment of MicrobiologyPrincess Margaret Hospital for Children1 Th omas StreetSubiaco WA 6008Telephone: +61 8 9340 8273Facsimile: +61 8 9380 4474Email: [email protected]; [email protected]
Author details
Corresponding author: Dr Monica Lahra, Department of Microbiology, SEALS, The Prince of Wales Hospital, High Street, RANDWICK NSW 2031. Telephone: +61 2 9382 9079. Facsimile: +61 2 9398 4275. Email: [email protected]
302 CDI Vol 34 No 3 2010
Annual reports Australian Meningococcal Surveillance Programme, 2009
References
1. National Neisseria Network. Meningococcal isolate surveillance Australia, 1994. Commun Dis Intell 1995:19:286–289.
2. The Australian Meningococcal Surveillance Programme. Annual report of the Australian Meningococcal Surveillance Programme, 2006. Commun Dis Intell 2007;31(2):185–194.
3. Public Health Laboratory Network. Meningococcal long case definition. Available from: http://www.health.gov.au/internet/main/publishing.nsf/Content/cda-phlncd-mening.htm
4. Tapsall J and members of the National Neisseria Network of Australia. Antimicrobial testing and applications in the pathogenic Neisseria. In: Merlino J, ed. Antimicrobial susceptibility testing: methods and practices with an Australian perspective. Australian Society for Microbiology, Sydney, 2004. pp 175–188.
5. Porritt RJ, Mercer JL, Munro R. Detection and serogroup determination of Neisseria meningitidis in CSF by polymerase chain reaction (PCR). Pathology 2000;32(1):42–45.
6. Aus t ra l ian Meningococcal Sur ve i l lance Programme. Annual report of the Australian Meningococcal Surveillance Programme, 1999. Commun Dis Intell 2000;24(7):181–189.
7. Gray SJ, Borrow R, Kaczmarski EB. Meningococcal serology. In: Pollard AJ, Mar tin MCJ, eds. Meningococcal disease methods and protocols. Humana Press, Totawa, New Jersey, 2001 pp. 61–87.
8. Robertson PW, Reinbott P, Duffy Y, Binotto E, Tapsa l l J W. Con f i r ma t ion o f i nva s i ve meningococcal d isease by s ingle poin t estimation of IgM antibody to outer membrane protein of Neisseria meningitidis. Pathology 2001:33(3):375–378.
9. Lahra MM, Robertson PW, Whybin R, Tapsall JW. Enhanced serological diagnosis of invasive meningococcal disease by determining anti-group C capsule IgM antibody by EIA. Pathology 2005;37(3):239–241.
10. The Australian Meningococcal Surveillance Programme. Annual report of the Australian Meningococcal Surveillance Programme 2002. Commun Dis Intell 2003;27(2):196–208.
11. Maiden MCJ, Ibarr z-Pavon AB, Urwin R, Gray SJ, Andrews NJ, Clarke SC, et al. Impact of meningococcal serogroup C cojugate vaccines on carriage and herd immunity. J Infect Dis 2008;197(5):737–743.
12. Shultz TR, Tapsall JW, White PA, Newton PJ. An invasive isolate of Neisseria meningitidis showing decreased susceptibility to quinolones. Antimicrob Agents Chemother 2000;44:1116.
13. Singhal S, Purnapatre KP, Kalia V, Dube S, Nair D, Deb M, et al. Ciprofloxacin-resistant Neisseria meningitidis, Delhi, India. Emerg Infect Dis 2007;13(10):1614–1616.
14. Centers fro Disease Control and Prevention. Emergence of fluoroquinolone-resistant Neisseria meningitidis —Minnesota and North Dakota, 2007–2008. MMWR Morb Mortal Wkly Rep 2008;57(7):173–175.
15. Shultz TR, White PA, Tapsall JW. An in-vitro as sessment of the fur ther potent ia l for development of quinolone resistance in Neisseria meningiditis . Antimicrob Agent Chemother 2005;49(5):1753–1760.
CDI Vol 34 No 3 2010 303
Peer-reviewed articles
Peer-reviewed articles ANTIVIRAL DISTRIBUTION DATA – A POTENTIAL SYNDROMIC SURVEILLANCE SYSTEM TO ASSIST PANDEMIC HEALTH SERVICE OPERATIONAL PLANNING
Andrew SC Way, David N Durrheim, Tony Merritt, Hassan Vally
Abstract
A pilot study was conducted in rural northern New South Wales from 15 July to 28 August 2009, during Australia’s Protect Phase response to the Influenza A H1N1 California 7/09 pandemic. This study explored the feasibility of using administrative data, generated from the distribution of stockpiled antivirals, as a syndromic surveillance system. The purpose was to identify recently affected towns or those with increasing influenza-like illness activity to assist in rural health service operational plan-ning. Analysis of antiviral distribution data was restricted to 113 general practices in rural parts of the Hunter New England Area Health Service. By 2 September 2009 a total of 6,670 courses of antivirals for adults, of which 455 courses were replacement orders, had been distributed to these general practices. Distribution of replacement antivirals were mapped to local government areas on a weekly basis. The syndromic surveillance system delivered timely data on antiviral distribu-tion; used readily available software to generate visual activity maps in less than 30 minutes; proved adaptable; was of low cost; and was well received by health service planners. Full evaluation of the system’s utility was limited by the relatively large initial distribution of antivirals and the brief nature of Australia’s first pandemic wave. The pilot study demonstrated that a syndromic surveillance system based on distribution of supplies, such as treat-ment or vaccines, can support local health service operational planning during health emergencies. Commun Dis Intell 2010;34(3):303–309.
Keywords: pandemic influenza, antiviral, syndromic surveillance, health service planning
Introduction
Th e World Health Organization global pandemic alert level was raised to Phase 6 on 11 June 2009, 1 indicating a global pandemic was underway
and that it was considered no longer possible to contain the novel pandemic Infl uenza A H1N1 California 7/09 (pH1N1) virus within a par-ticular geographical area. On 17 June 2009, the Australian Government announced a change in its pandemic response from the Contain Phase to the Protect Phase. 2 Th e newly developed Protect Phase focused on treating and caring for individu-als who were more vulnerable to a severe outcome from pH1N1.
Antiviral medication was distributed from State and Commonwealth medical stockpiles during the Contain and Protect phases. Antiviral usage in the Contain Phase targeted the treatment of suspected pH1N1 cases and prophylaxis of individuals in close contact with suspected cases. In New South Wales, antivirals were mostly dispensed from hospital emergency departments with authorisation from public health units. In contrast, antiviral usage in the Protect Phase aimed to reduce disease impact through treat-ment of individuals with infl uenza-like illness (ILI) who were classifi ed as being in defi ned vulnerable groups. During this phase in New South Wales, antivirals were dispensed through both hospitals and primary health care providers (PHCPs), including general practices and Abo-riginal Medical Services. 3
A pilot study was conducted during the Protect Phase in the Hunter New England (HNE) region of northern New South Wales to explore the feasibility of using data generated from the distribution of stockpiled antivirals for syndromic surveillance. Replacement orders of antivirals were only distributed to PHCPs once a line-list of patients who had received antivirals was provided. Th us replacement orders could be used to measure antiviral usage and serve as a proxy for local ILI activity. It was assumed that PHCPs adhered to the vulnerable group criteria, as defi ned in the Protect Phase plan, for dispens-ing antivirals and that they were experienced in ILI diagnosis.
304 CDI Vol 34 No 3 2010
Peer-reviewed articles
Th is system aimed to assist rural HNE health services operationally plan their response to pH1N1 through early identifi cation of towns recently aff ected via rapidly mapping increases in antiviral distribution. If successful, it could permit public health investigation and surging of area health service (AHS) and divisions of general practice resources in a timely manner.
Methods
Distribution of stockpiled antivirals in New South Wales during the pandemic response in 2009
Th e distribution of antiviral medication by the NSW Department of Health (NSW Health) occurred through the State Vaccine Centre (SVC), a well established system used for routine vaccine distribution throughout New South Wales. Th e antiviral distribution data were stratifi ed by each quantity distributed to a PHCP and circulated daily as a Microsoft Excel spreadsheet from the SVC to NSW Health and from NSW Health to each AHS. All New South Wales PHCPs which ordered antivirals received an initial antiviral pack of 50 adult courses of oseltamivir (Tamifl u®) and 5 adult courses of zanamivir (Relenza®), regardless of the initial amount of antivirals ordered. Th us each initial antiviral pack contained 55 adult courses.
Data analysis
In HNE, a total of 261 PHCPs received an initial antiviral pack, including 249 general practices, 8 HNE Aboriginal Medical Services, 3 HNE Student Health Services and 1 HNE Nursing Home. Analysis of antiviral distribution data was restricted to 113 general practices in rural areas of HNE. Patients in urban areas of Newcastle and Lake Macquarie had ready access to 4 large public hospitals, community pharmacies and PHCPs, to obtain antivirals. Th is level of access was not available in rural HNE and therefore the distribu-tion of antivirals to PHCPs was more likely to be representative of pH1N1 activity.
Th e number of full-time equivalent (FTE) General Practitioners (GPs) working in each general prac-tice was obtained from the 4 divisions of general practice serving rural HNE. Due to privacy concerns certain divisions provided FTE data by geographical area (e.g. at the town level), rather than for a specifi c practice. Where this occurred the FTEs were allocated on a proportional basis to each practice in that geographic area. Th is allowed
comparison of replacement antiviral distribution by general practice, town or Local Government Areas (LGA).
LGAs are a commonly used geospatial area in Australia. It was assumed that the demographic characteristics within an LGA were similar and that most residents would seek medical services from within that LGA. Th is allowed identifi ca-tion of diff erences in replacement antiviral rates between LGAs and between individual towns within a single LGA, thus alerting health planners to recent changes in ILI activity at a local level.
Using the statistical software SAS, 4 a program was developed that managed data for rural HNE general practices, removed duplicate entries, and assigned the number of FTE GPs to each general practice. Two outputs were generated from the program: a) the cumulative total of replacement antivirals distributed to each general practice, until 2 weeks prior to analysis; and b) the total replacement antivirals distributed to each general practice during the 2 weeks preceding analysis.
MapInfo 5 was used to display the surveillance system results. Geospatial data for HNE LGAs were combined with the SAS outputs to produce the following two data displays:
• Th e town replacement antiviral rate was dis-played as town indicator using relative size and shaded classifi cations (Map 1). Th is refl ected the average number of replacement antivirals per FTE GP distributed to that town during the 2 weeks preceding analysis. Th e same rate categories used for the LGA classifi cations were applied to allow comparison.
• Th e LGA replacement antiviral rate was dis-played by shaded classifi cation of LGAs (Map 2). Th is refl ected the total number of replacement antivirals per FTE GP distributed to general practices in that LGA, until 2 weeks prior to analysis. MapInfo used 1 stand-ard deviation increments bounded by the minimum and maximum values of the sample to determine the rate categories.
Th e mapping output was presented to the Area Health Service Pandemic Incident Controller and Divisions of general practice at regular operational planning meetings.
Results
Th e distribution of antivirals to rural HNE general practices (Figure 1) commenced on 22 June 2009 and by 2 July 2009, 9 working days later,
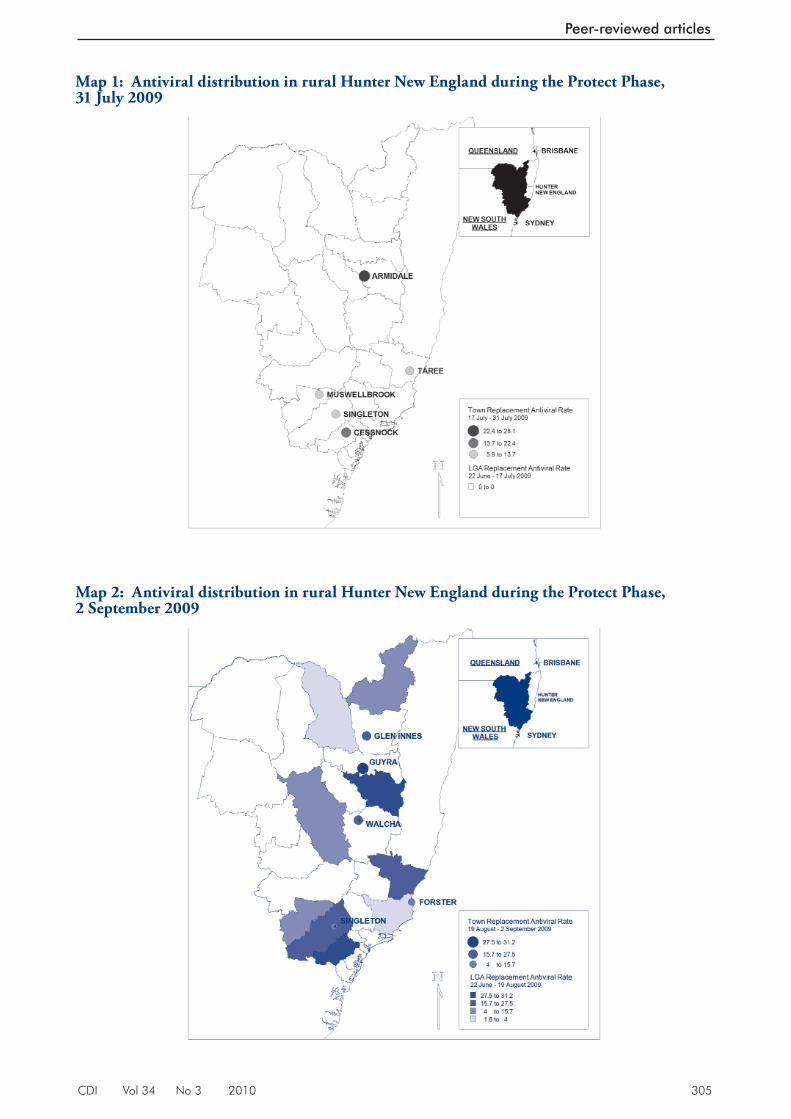
CDI Vol 34 No 3 2010 305
Peer-reviewed articles
Ma p 1: Antiviral distribution in rural Hunter New England during the Protect Phase, 31 July 2009
Ma p 2: Antiviral distribution in rural Hunter New England during the Protect Phase, 2 September 2009
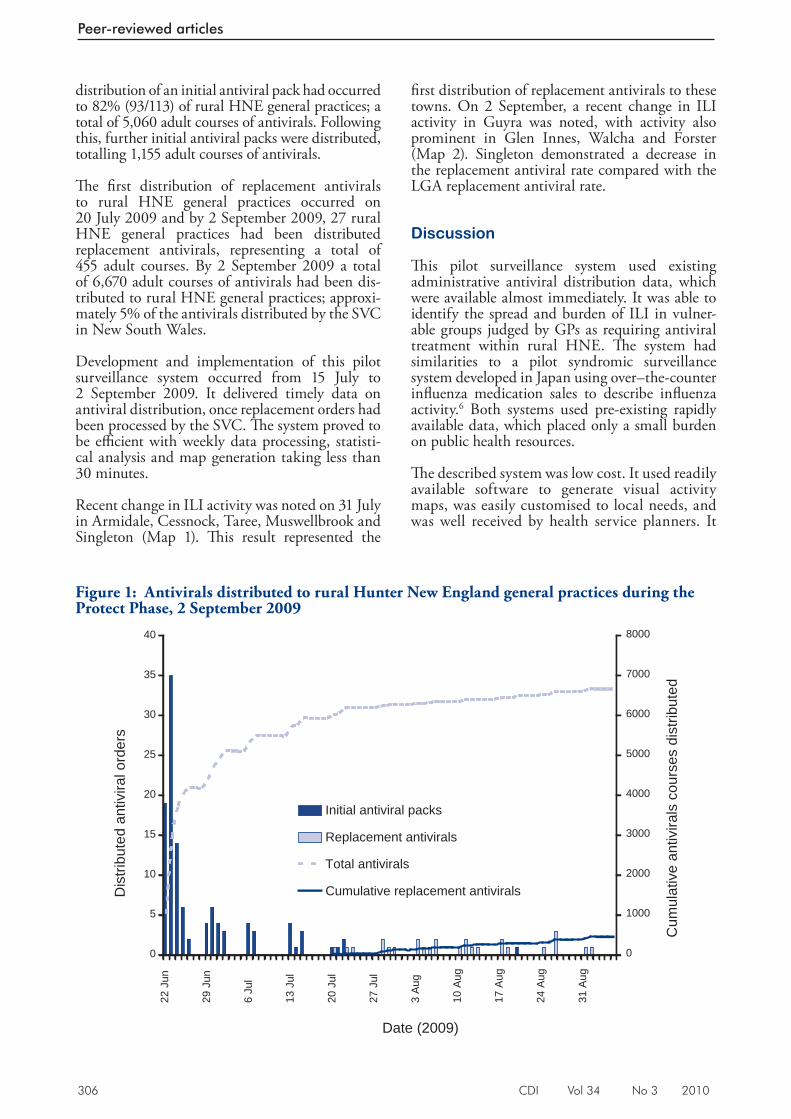
306 CDI Vol 34 No 3 2010
Peer-reviewed articles
distribution of an initial antiviral pack had occurred to 82% (93/113) of rural HNE general practices; a total of 5,060 adult courses of antivirals. Following this, further initial antiviral packs were distributed, totalling 1,155 adult courses of antivirals.
Th e fi rst distribution of replacement antivirals to rural HNE general practices occurred on 20 July 2009 and by 2 September 2009, 27 rural HNE general practices had been distributed replacement antivirals, representing a total of 455 adult courses. By 2 September 2009 a total of 6,670 adult courses of antivirals had been dis-tributed to rural HNE general practices; approxi-mately 5% of the antivirals distributed by the SVC in New South Wales.
Development and implementation of this pilot surveillance system occurred from 15 July to 2 September 2009. It delivered timely data on antiviral distribution, once replacement orders had been processed by the SVC. Th e system proved to be effi cient with weekly data processing, statisti-cal analysis and map generation taking less than 30 minutes.
Recent change in ILI activity was noted on 31 July in Armidale, Cessnock, Taree, Muswellbrook and Singleton (Map 1). Th is result represented the
fi rst distribution of replacement antivirals to these towns. On 2 September, a recent change in ILI activity in Guyra was noted, with activity also prominent in Glen Innes, Walcha and Forster (Map 2). Singleton demonstrated a decrease in the replacement antiviral rate compared with the LGA replacement antiviral rate.
Discussion
Th is pilot surveillance system used existing administrative antiviral distribution data, which were available almost immediately. It was able to identify the spread and burden of ILI in vulner-able groups judged by GPs as requiring antiviral treatment within rural HNE. Th e system had similarities to a pilot syndromic surveillance system developed in Japan using over–the-counter infl uenza medication sales to describe infl uenza activity. 6 Both systems used pre-existing rapidly available data, which placed only a small burden on public health resources.
Th e described system was low cost. It used readily available software to generate visual activity maps, was easily customised to local needs, and was well received by health service planners. It
Fi gure 1: Antivirals distributed to rural Hunter New England general practices during the Protect Phase, 2 September 2009
0
5
10
15
20
25
30
35
40
22
Jun
29
Jun
6 J
ul
13
Jul
20
Jul
27
Jul
3 A
ug
10
Aug
17
Aug
24
Aug
31
Aug
Date (2009)
Dis
tribu
ted
antiv
iral o
rder
s
0
1000
2000
3000
4000
5000
6000
7000
8000
Cum
ulat
ive
antiv
irals
cou
rses
dis
tribu
ted
Initial antiviral packs
Replacement antivirals
Total antivirals
Cumulative replacement antivirals
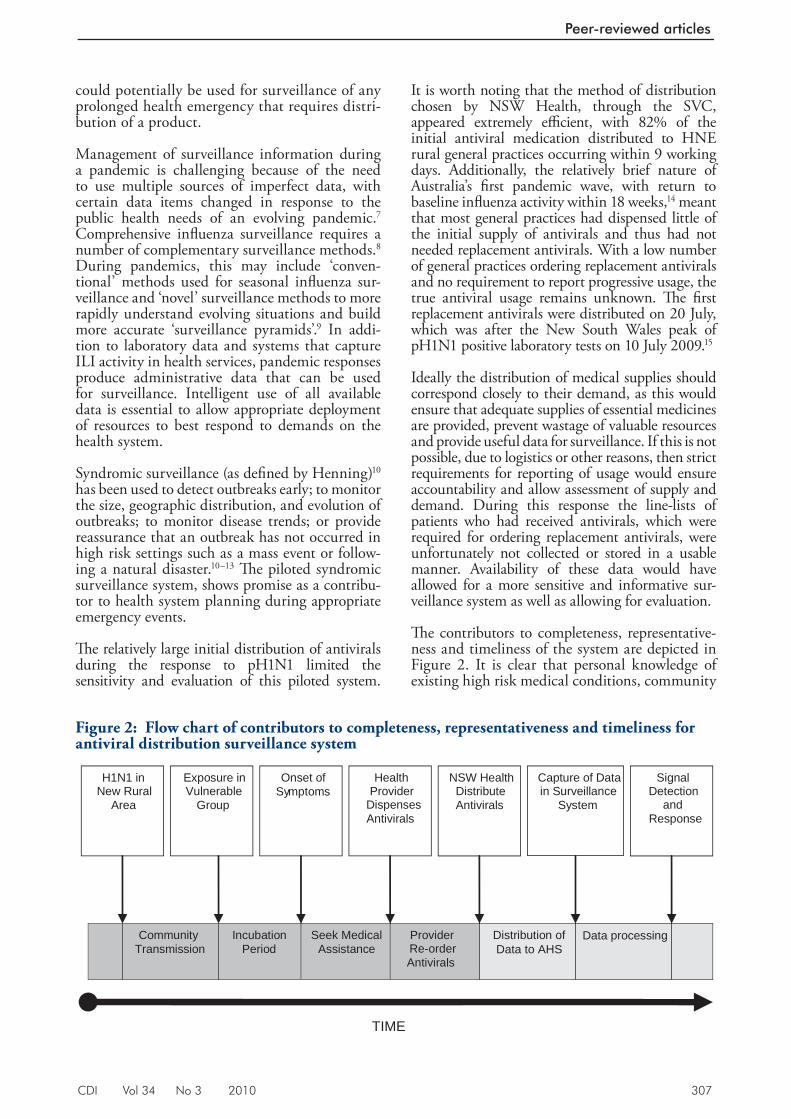
CDI Vol 34 No 3 2010 307
Peer-reviewed articles
could potentially be used for surveillance of any prolonged health emergency that requires distri-bution of a product.
Management of surveillance information during a pandemic is challenging because of the need to use multiple sources of imperfect data, with certain data items changed in response to the public health needs of an evolving pandemic. 7 Comprehensive infl uenza surveillance requires a number of complementary surveillance methods. 8 During pandemics, this may include ‘conven-tional’ methods used for seasonal infl uenza sur-veillance and ‘novel’ surveillance methods to more rapidly understand evolving situations and build more accurate ‘surveillance pyramids’. 9 In addi-tion to laboratory data and systems that capture ILI activity in health services, pandemic responses produce administrative data that can be used for surveillance. Intelligent use of all available data is essential to allow appropriate deployment of resources to best respond to demands on the health system.
Syndromic surveillance (as defi ned by Henning) 10 has been used to detect outbreaks early; to monitor the size, geographic distribution, and evolution of outbreaks; to monitor disease trends; or provide reassurance that an outbreak has not occurred in high risk settings such as a mass event or follow-ing a natural disaster. 10–13 Th e piloted syndromic surveillance system, shows promise as a contribu-tor to health system planning during appropriate emergency events.
Th e relatively large initial distribution of antivirals during the response to pH1N1 limited the sensitivity and evaluation of this piloted system.
It is worth noting that the method of distribution chosen by NSW Health, through the SVC, appeared extremely effi cient, with 82% of the initial antiviral medication distributed to HNE rural general practices occurring within 9 working days. Additionally, the relatively brief nature of Australia’s fi rst pandemic wave, with return to baseline infl uenza activity within 18 weeks, 14 meant that most general practices had dispensed little of the initial supply of antivirals and thus had not needed replacement antivirals. With a low number of general practices ordering replacement antivirals and no requirement to report progressive usage, the true antiviral usage remains unknown. Th e fi rst replacement antivirals were distributed on 20 July, which was after the New South Wales peak of pH1N1 positive laboratory tests on 10 July 2009. 15
Ideally the distribution of medical supplies should correspond closely to their demand, as this would ensure that adequate supplies of essential medicines are provided, prevent wastage of valuable resources and provide useful data for surveillance. If this is not possible, due to logistics or other reasons, then strict requirements for reporting of usage would ensure accountability and allow assessment of supply and demand. During this response the line-lists of patients who had received antivirals, which were required for ordering replacement antivirals, were unfortunately not collected or stored in a usable manner. Availability of these data would have allowed for a more sensitive and informative sur-veillance system as well as allowing for evaluation.
Th e contributors to completeness, representative-ness and timeliness of the system are depicted in Figure 2. It is clear that personal knowledge of existing high risk medical conditions, community
Fi gure 2: Flow chart of contributors to completeness, representativeness and timeliness for antiviral distribution surveillance system
TIME
Provider Re-orderAntivirals
Data processing Seek Medical Assistance
Incubation Period
Exposure in Vulnerable
Group
Onset of Symptoms
H1N1 in New Rural
Area
Health Provider
Dispenses Antivirals
NSW Health Distribute Antivirals
Distribution of Data to AHS
Capture of Data in Surveillance
System
Community Transmission
Signal Detection
and Response
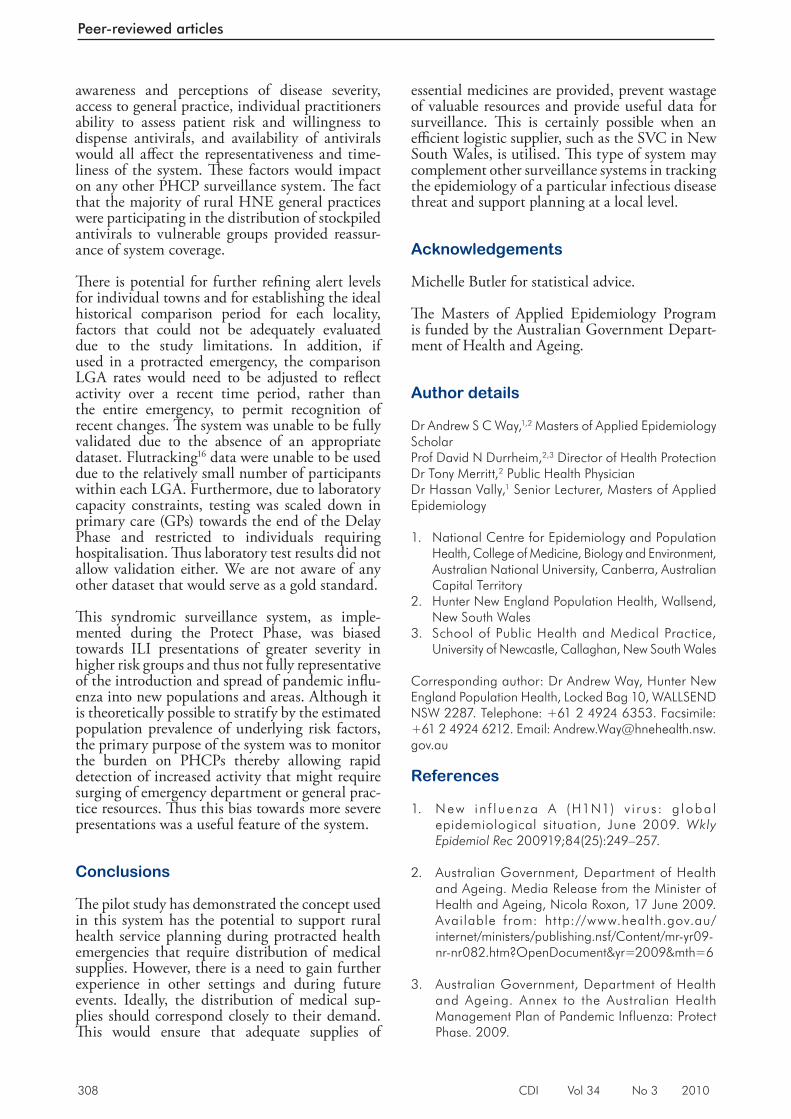
308 CDI Vol 34 No 3 2010
Peer-reviewed articles
awareness and perceptions of disease severity, access to general practice, individual practitioners ability to assess patient risk and willingness to dispense antivirals, and availability of antivirals would all aff ect the representativeness and time-liness of the system. Th ese factors would impact on any other PHCP surveillance system. Th e fact that the majority of rural HNE general practices were participating in the distribution of stockpiled antivirals to vulnerable groups provided reassur-ance of system coverage.
Th ere is potential for further refi ning alert levels for individual towns and for establishing the ideal historical comparison period for each locality, factors that could not be adequately evaluated due to the study limitations. In addition, if used in a protracted emergency, the comparison LGA rates would need to be adjusted to refl ect activity over a recent time period, rather than the entire emergency, to permit recognition of recent changes. Th e system was unable to be fully validated due to the absence of an appropriate dataset. Flutracking 16 data were unable to be used due to the relatively small number of participants within each LGA. Furthermore, due to laboratory capacity constraints, testing was scaled down in primary care (GPs) towards the end of the Delay Phase and restricted to individuals requiring hospitalisation. Th us laboratory test results did not allow validation either. We are not aware of any other dataset that would serve as a gold standard.
Th is syndromic surveillance system, as imple-mented during the Protect Phase, was biased towards ILI presentations of greater severity in higher risk groups and thus not fully representative of the introduction and spread of pandemic infl u-enza into new populations and areas. Although it is theoretically possible to stratify by the estimated population prevalence of underlying risk factors, the primary purpose of the system was to monitor the burden on PHCPs thereby allowing rapid detection of increased activity that might require surging of emergency department or general prac-tice resources. Th us this bias towards more severe presentations was a useful feature of the system.
Conclusions
Th e pilot study has demonstrated the concept used in this system has the potential to support rural health service planning during protracted health emergencies that require distribution of medical supplies. However, there is a need to gain further experience in other settings and during future events. Ideally, the distribution of medical sup-plies should correspond closely to their demand. Th is would ensure that adequate supplies of
essential medicines are provided, prevent wastage of valuable resources and provide useful data for surveillance. Th is is certainly possible when an effi cient logistic supplier, such as the SVC in New South Wales, is utilised. Th is type of system may complement other surveillance systems in tracking the epidemiology of a particular infectious disease threat and support planning at a local level.
Acknowledgements
Michelle Butler for statistical advice.
Th e Masters of Applied Epidemiology Program is funded by the Australian Government Depart-ment of Health and Ageing.
Author details
Dr Andrew S C Way, 1,2 Masters of Applied Epidemiology Scholar Prof David N Durrheim, 2,3 Director of Health Protection Dr Tony Merritt, 2 Public Health Physician Dr Hassan Vally, 1 Senior Lecturer, Masters of Applied Epidemiology
1. National Centre for Epidemiology and Population Health, College of Medicine, Biology and Environment, Australian National University, Canberra, Australian Capital Territory
2. Hunter New England Population Health, Wallsend, New South Wales
3. School of Public Health and Medical Practice, University of Newcastle, Callaghan, New South Wales
Corresponding author: Dr Andrew Way, Hunter New England Population Health, Locked Bag 10, WALLSEND NSW 2287. Telephone: +61 2 4924 6353. Facsimile: +61 2 4924 6212. Email: [email protected]
References
1. New in f luenza A (H1N1) v i r us: g loba l epidemiological situation, June 2009. Wkly Epidemiol Rec 200919;84(25):249–257.
2. Australian Government, Department of Health and Ageing. Media Release from the Minister of Health and Ageing, Nicola Roxon, 17 June 2009. Available from: ht tp://www.health.gov.au/internet/ministers/publishing.nsf/Content/mr-yr09-nr-nr082.htm?OpenDocument&yr=2009&mth=6
3. Australian Government, Department of Health and Ageing. Annex to the Australian Health Management Plan of Pandemic Influenza: Protect Phase. 2009.
CDI Vol 34 No 3 2010 309
Peer-reviewed articles
4. SAS 9.1, SAS Institute Inc., SAS Campus Drive, Cary, North Carolina 27513, USA.
5. MapInfo 10.0, Pitney Bowes Software Inc, One Global View, Troy, New York,12180, USA.
6. Ohkusa Y, Shigematsu M, Taniguchi K, Okabe N. Experimental surveillance using data on sales of over-the-counter medicat ions—Japan, November 2003–April 2004. MMWR Morb Mortal Wkly Rep 2005;54(Suppl):47–52.
7. Muscatello DJ, Cretikos MA, Bar tlet t MJ, Churches T, Carter IW, Eastwood K, et al. Planning for pandemic influenza surveillance in NSW. N S W Public Health Bull 2006;17(9–10):146–149.
8. Parrella A, Dalton CB, Pearce R, Litt JC, Stocks N. ASPREN surveillance system for influenza-like illness – A comparison with FluTracking and the National Notifiable Diseases Surveillance System. Aust Fam Physician 2009;38(11):932–936.
9. Armstrong P, Chant K. Prepar ing for the nex t in f luenza pandemic: a New South Wales perspective. N S W Public Health Bull 2006;17(7–8):114–117.
10. Henning KJ. What is syndromic surveillance? MMWR Morb Mortal Wkly Rep 2004;53(Suppl):5–11.
11. Hope K, Merr it t T, Eastwood K, Main K, Durrheim DN, Muscatello D, et al. The public health value of emergency department syndromic surveillance following a natural disaster. Commun Dis Intell 2008;32(1):92–94.
12. Hope K, Durrheim DN, Muscatello D, Merritt T, Zheng W, Massey P, et al. Identifying pneumonia outbreaks of public health impor tance: can emergency department data assist in earlier ident i f icat ion? Aust N Z J Public Health 2008;32(4):361–363.
13. Hope K, Durrheim DN, d’Espaignet ET, Dalton C. Syndromic Surveillance: is it a useful tool for local outbreak detection? J Epidemiol Community Health 2006;60(5):374–375.
14. Bishop JF, Murnane MP, Owen R. Australia’s winter with the 2009 pandemic influenza A (H1N1) virus. N Engl J Med 2009;361(27):2591–2594.
15. Progression and impact of the first winter wave of the 2009 pandemic H1N1 influenza in New South Wales, Australia. Euro Surveill 2009;14(42). Pii 19365.
16. Dalton C, Durrheim D, Fejsa J, Francis L, Carlson S, d’Espaignet ET, et al. ‘Flutracking: a weekly Australian community online survey of influenza-like illness in 2006, 2007 and 2008.’ Commun Dis Intell 2009;33(3):316–322.
310 CDI Vol 34 No 3 2010
Peer-reviewed articles
EVALUATING THE UTILITY OF EMERGENCY DEPARTMENT SYNDROMIC SURVEILLANCE FOR A REGIONAL PUBLIC HEALTH SERVICE
Kirsty G Hope, Tony D Merritt, David N Durrheim, Peter D Massey, Julie K Kohlhagen, Kerry W Todd, Catherine A D’Este
Syndromic surveillance
Syndromic surveillance generally relies on recog-nising clinical features that are discernible before a diagnosis is confi rmed. Data sources used include ED primary diagnoses, ambulance dispatches and sales of over-the-counter medication. 10 Unlike traditional surveillance systems, which may rely on voluntary passive reports from health practi-tioners, syndromic surveillance systems rely on continual data acquisition generated by routine activities that are generally electronically transmit-ted. 2 While many syndromic surveillance systems are focused on detecting bioterrorism events, it is important that these are integrated into routine health surveillance to ensure staff become familiar with them and know how to interpret signals.
New South Wales real-time public health emergency department surveillance system
In 2003, the Centre for Epidemiology and Research developed a real-time public health emer-gency department surveillance system in response to biosecurity threats associated with the Rugby World Cup. 11 Currently, over 50 EDs provide data to the system; eight are situated within the Hunter New England (HNE) area in northern New South Wales. HNE currently has 38 EDs, ranging from 1 large tertiary referral hospital to small general practitioner-serviced multi-purpose centres. Th e 8 hospitals include the tertiary refer-ral hospital and one of the 2 rural referral hospitals in the region. 12
Th e NSW Department of Health (NSW Health) receives 4 hourly electronic fi le transmission from participating EDs (using HL7 messaging) containing data items including the primary ED diagnoses (ICD-10 codes), which are mapped to one of 39 syndrome categories. 11
Statistical control charts are used to automatically detect increases in syndrome activity (signals) based on the previous 51 weeks’ data. Th e meas-ures used to detect increased activity include:
Abstract
Communicable disease monitoring and response activities must be based upon local public health surveillance systems, even during infectious disease emergence, natural disasters, and during bioterrorism events. The NSW Department of Health has developed an emergency department surveillance system intended to monitor important public health conditions during mass gatherings and to identify outbreaks of importance. An evalu-ation of this system conducted in the Hunter New England region of New South Wales emphasised its usefulness when it was focused on a limited number of syndromes of public health impor-tance and during mass gatherings and public health disaster responses. Commun Dis Intell 2010;34(3):310–318.
Keywords: syndromic surveillance, disease surveillance, public health evaluation
Introduction
During the past 2 decades, biological and other terrorism incidents, have resulted in health author-ities globally investing considerable resources into implementing syndromic surveillance that identi-fi es outbreaks of public health importance earlier than traditional surveillance systems. 1–3 However there is currently limited evidence that syndromic surveillance systems add value to local public health disease surveillance. 4–7
Th e real-time evaluation of an emergency depart-ment (ED) syndromic surveillance system in Taiwan identifi ed peaks in seasonal community-wide illness, such as infl uenza and gastroenteritis. 3 In addition, a syndromic surveillance system devel-oped for the military in French Guiana identifi ed a dengue fever outbreak 3 weeks earlie r than tra-ditional surveillance, permitting early implementa-tion of control measures. 8 However, the ability to detect localised disease clusters remains an elusive goal for many syndromic surveillance systems. 4,5–9
CDI Vol 34 No 3 2010 311
Peer-reviewed articles
1. when a specifi c day’s ED presentations exceed the average number of presentations for that day for the previous 51 weeks, by more than 5 standard deviations;
2. when a specifi c week’s ED presentations exceed the average number of presentations for the previous 51 weeks, by more than 5 standard deviations and
3. when a 15-fold increase occurs in the modi-fi ed cumulative sum. Th is is called the Index of increase.
Th e cumulative sum is calculated by cumulatively summing the diff erence between the previous day’s count and the count 7 days prior. Th e accu-mulated cumulative sum is divided by the mean syndrome count for the available baseline up to a maximum 365 days. Th e mean-standardised cumulative sum is then divided by the standard deviation of its diff erenced values, again using whatever baseline is available up to a maximum of 365 previous days. 11,13
Regional public health services
New South Wales public health units are legally mandated to monitor and respond to infectious disease and other public health threats. 14 Th is is facilitated by notifi cation of specifi c diseases by laboratories, doctors and institutions. 15 To enhance regional surveillance, the ED syndro-mic surveillance system would need to identify these specifi c diseases earlier or more completely than the traditional notifi cation systems, or identify other disease threats not covered by existing surveillance.
Th e regional objectives identifi ed by Hunter New England Population Health (HNEPH) prior to the evaluation were:
a. routine monitoring to identify cases or clus-ters of public health importance requiring a prompt response, without duplicating existing surveillance systems; and
b. during emergency situations or mass gather-ing events, to actively monitor ED presenta-tions for situational awareness.
While the system has met state level surveillance objectives, 11,13,16 the current evaluation aimed to determine the utility of the New South Wales ED syndromic surveillance in a regional public health service.
Methods
Th e US Centers for Disease Control and Preven-tion ‘framework for evaluating public health sur-veillance system for early detection of outbreaks’ was used to guide the evaluation process. 17 Some system attributes, including algorithms, informa-tion technology platform and syndrome group-ings were not assessed during this evaluation. Outbreak detection was assessed prospectively for all syndromes and retrospectively for a subset of syndromes classifi ed as syndromes of public health importance.
Prospective signals produced by the ED surveil-lance system were investigated to determine if they represented an outbreak; while retrospectively, signals were compared against known outbreaks reported through existing surveillance systems. System experience including the usefulness, fl ex-ibility and acceptability of the system was assessed through a stakeholder survey during the prospec-tive evaluation component.
Prospective evaluation
Each weekday (excluding public holidays) between 1 January and 31 December 2008 the ED surveil-lance reports for participating HNE hospitals were accessed and any syndrome signal noted. Th e date of signal; syndrome; type of signal (daily, weekly, index of increase); hospital; threshold level; stand-ard deviation of the signal (i.e. signal strength) and whether it was the fi rst signal for that hospital and syndrome in that week, were systematically docu-mented. In addition, the investigation description, whether an outbreak was confi rmed and the resulting outbreak response, were also recorded.
An investigation hierarchy was used with each progression involving a more in depth public health response. Th e initial investigation was labelled a ‘sub-group’ investigation which involved reviewing age, sex, admission and triage categories of patients that had elicited the signal. If a subgroup investigation showed clustering by age, sex, location or admission status, an ‘internal’ investigation was conducted. An internal investigation involved a public health unit (PHU) staff member reviewing the ED patient database or pathology database to ascertain further information on demographic characteristics, clini-cal assessment and pathology results of patients. If warranted an ‘external’ investigation was then conducted, involving PHU staff contacting ED directors or treating physicians to ascertain further patient-specifi c clinical or epidemiological informa-tion. Th e time taken was also recorded.
312 CDI Vol 34 No 3 2010
Peer-reviewed articles
Syndromes of public health interest
A reference group consisting of surveillance, public health and epidemiology staff reviewed the list of ED syndromes and selected a syndrome subset, classifi ed as syndromes of public health interest, based on: their severity or public health consequence; potential for large outbreaks; limita-tions of traditional surveillance; and local disease epidemiology. Th e syndromes selected were: ‘men-ingitis’, ‘pneumonia’, ‘infl uenza’, ‘gastrointestinal’ and ‘poisoning’. Signals and investigations were however, recorded for all syndromes.
Retrospective evaluation
Standard ED surveillance reports for 2005–2007 were generated for the syndromes; ‘gastrointes-tinal’, ‘infl uenza’, ‘pneumonia’ and ‘meningitis’, and all signals identifi ed. Reports for selected syndromes were also generated by a restricted age grouping (5–65 years) and ‘admission to hospi-tal’ status and all signals identifi ed. Th e signals were compared to known outbreaks recorded in 3 existing surveillance systems; notifi able diseases, OzFoodNet foodborne outbreaks and the institutional gastrointestinal and respiratory outbreak databases.
Stakeholder survey
A questionnaire was sent to local stakeholders including ED directors, PHU and laboratory staff , and senior managers who received NSW Health emails reporting syndrome signals. Participants were asked how often they read these emails, whether they had taken any action in response to an email, the outcome of any action, and their preference for future email alerts. Th is self-administered questionnaire was sent and returned electronically, with prompting by a senior PHU staff member after a month if a response had not been forthcoming.
Results
Prospective evaluation
All syndromes
During 2008, a total of 958 signals occurred across the 8 EDs; 237 daily signals, 467 weekly signals and 254 index of increase signals (Table 1). Elevated counts in 1 syndrome could result in signals over multiple days and across multiple
categories (daily, weekly, index of increase). When repeat signals were ignored, there were 382 initial signals by syndromes.
Overall, 366 (38%) signals were investigated to the sub-group level with an internal investigation necessary for 25 (3%) and an external investiga-tion on 6 occasions (0.6%). Th e remaining signals were not investigated. No HNE outbreaks were detected by the ED surveillance system during 2008, while existing surveillance systems detected 17 gastroenteritis outbreaks and 9 meningococcal cases were notifi ed during this period.
Th e 6 external investigations included four for meningitis and one each for gastrointestinal and pneumonia syndromes. Of the 4 meningitis syn-drome signals that led to an external investigation, 1 viral meningitis cluster was identifi ed by the ED surveillance system with additional information concurrently received through existing surveillance systems. One suspected bacterial meningitis case was identifi ed, which had not been notifi ed through traditional surveillance but was subsequently proven not to be meningococcal disease. None of the 9 meningococcal disease notifi cations were identifi ed by the ED surveillance system but four had a purely septicaemic presentation and would likely not be identifi ed as a meningitis syndrome.
Th e single gastrointestinal and pneumonia signals were investigated externally with no out-break detected. However, the pneumonia signal external investigation resulted in a better under-standing of ED coding practices with only two of the 6 presentations subsequently confi rmed as pneumonia cases.
Of the 3 poisoning signals investigated internally, two were chemical exposures requiring attend-ance by the Fire Department’s Hazardous Mate-rials Response Team but both had already been notifi ed through regular emergency communica-tion channels to the PHU. Th e signals however demonstrate the ED surveillance system’s ability to identify acute events requiring ED presentation due to chemical exposures.
Th e initial signal review took a median time of 15 minutes (range 2–20 minutes). Where further investigation was required, the time required ranged from a 10 minute telephone consultation with a physician to 4 hours checking clinical details and laboratory results.
Fourteen per cent (143 of 958) of signals related to a syndrome of public health interest. All 2008 external investigations related to one of these 5 syndromes.
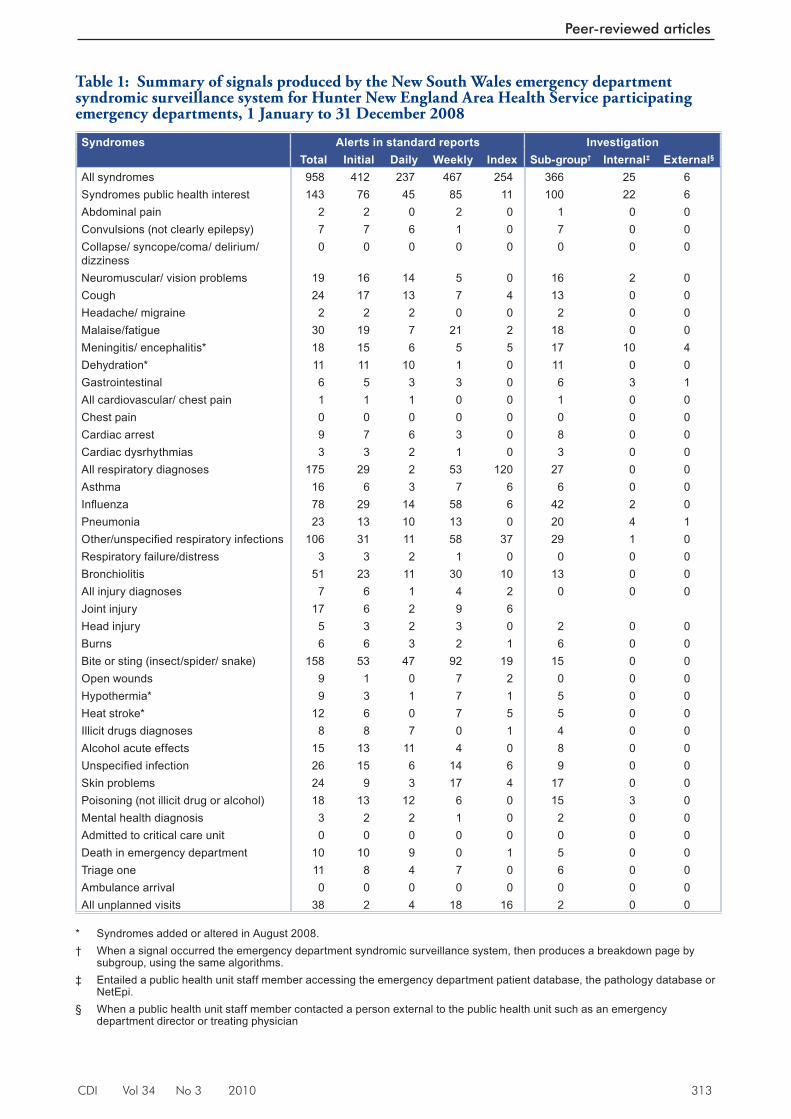
CDI Vol 34 No 3 2010 313
Peer-reviewed articles
Table 1: Summary of signals produced by the New South Wales emergency department syndromic surveillance system for Hunter New England Area Health Service participating emergency departments, 1 January to 31 December 2008
Syndromes Alerts in standard reports InvestigationTotal Initial Daily Weekly Index Sub-group† Internal‡ External§
All syndromes 958 412 237 467 254 366 25 6Syndromes public health interest 143 76 45 85 11 100 22 6Abdominal pain 2 2 0 2 0 1 0 0Convulsions (not clearly epilepsy) 7 7 6 1 0 7 0 0Collapse/ syncope/coma/ delirium/ dizziness
0 0 0 0 0 0 0 0
Neuromuscular/ vision problems 19 16 14 5 0 16 2 0Cough 24 17 13 7 4 13 0 0Headache/ migraine 2 2 2 0 0 2 0 0Malaise/fatigue 30 19 7 21 2 18 0 0Meningitis/ encephalitis* 18 15 6 5 5 17 10 4Dehydration* 11 11 10 1 0 11 0 0Gastrointestinal 6 5 3 3 0 6 3 1All cardiovascular/ chest pain 1 1 1 0 0 1 0 0Chest pain 0 0 0 0 0 0 0 0Cardiac arrest 9 7 6 3 0 8 0 0Cardiac dysrhythmias 3 3 2 1 0 3 0 0All respiratory diagnoses 175 29 2 53 120 27 0 0Asthma 16 6 3 7 6 6 0 0Infl uenza 78 29 14 58 6 42 2 0Pneumonia 23 13 10 13 0 20 4 1Other/unspecifi ed respiratory infections 106 31 11 58 37 29 1 0Respiratory failure/distress 3 3 2 1 0 0 0 0Bronchiolitis 51 23 11 30 10 13 0 0All injury diagnoses 7 6 1 4 2 0 0 0Joint injury 17 6 2 9 6Head injury 5 3 2 3 0 2 0 0Burns 6 6 3 2 1 6 0 0Bite or sting (insect/spider/ snake) 158 53 47 92 19 15 0 0Open wounds 9 1 0 7 2 0 0 0Hypothermia* 9 3 1 7 1 5 0 0Heat stroke* 12 6 0 7 5 5 0 0Illicit drugs diagnoses 8 8 7 0 1 4 0 0Alcohol acute effects 15 13 11 4 0 8 0 0Unspecifi ed infection 26 15 6 14 6 9 0 0Skin problems 24 9 3 17 4 17 0 0Poisoning (not illicit drug or alcohol) 18 13 12 6 0 15 3 0Mental health diagnosis 3 2 2 1 0 2 0 0Admitted to critical care unit 0 0 0 0 0 0 0 0Death in emergency department 10 10 9 0 1 5 0 0Triage one 11 8 4 7 0 6 0 0Ambulance arrival 0 0 0 0 0 0 0 0All unplanned visits 38 2 4 18 16 2 0 0
* Syndromes added or altered in August 2008. † When a signal occurred the emergency department syndromic surveillance system, then produces a breakdown page by
subgroup, using the same algorithms. ‡ Entailed a public health unit staff member accessing the emergency department patient database, the pathology database or
NetEpi. § When a public health unit staff member contacted a person external to the public health unit such as an emergency
department director or treating physician
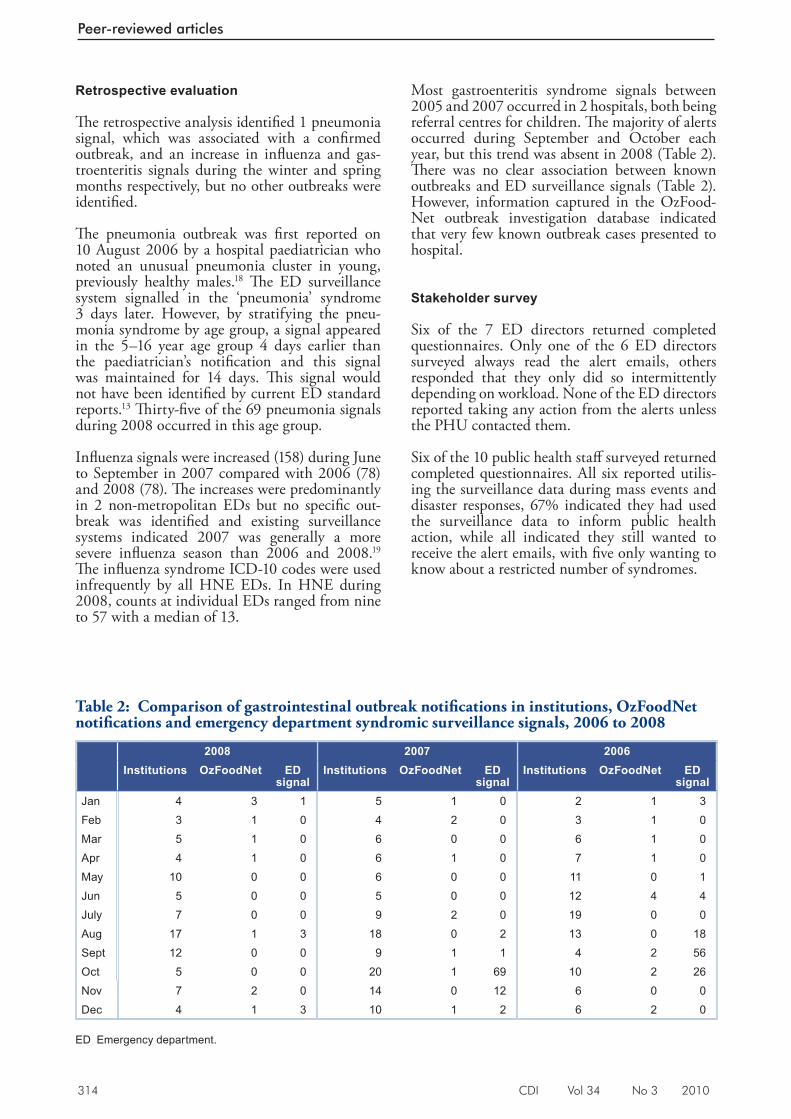
314 CDI Vol 34 No 3 2010
Peer-reviewed articles
Retrospective evaluation
Th e retrospective analysis identifi ed 1 pneumonia signal, which was associated with a confi rmed outbreak, and an increase in infl uenza and gas-troenteritis signals during the winter and spring months respectively, but no other outbreaks were identifi ed.
Th e pneumonia outbreak was fi rst reported on 10 August 2006 by a hospital paediatrician who noted an unusual pneumonia cluster in young, previously healthy males. 18 Th e ED surveillance system signalled in the ‘pneumonia’ syndrome 3 days later. However, by stratifying the pneu-monia syndrome by age group, a signal appeared in the 5–16 year age group 4 days earlier than the paediatrician’s notifi cation and this signal was maintained for 14 days. Th is signal would not have been identifi ed by current ED standard reports. 13 Th irty-fi ve of the 69 pneumonia signals during 2008 occurred in this age group.
Infl uenza signals were increased (158) during June to September in 2007 compared with 2006 (78) and 2008 (78). Th e increases were predominantly in 2 non-metropolitan EDs but no specifi c out-break was identifi ed and existing surveillance systems indicated 2007 was generally a more severe infl uenza season than 2006 and 2008. 19 Th e infl uenza syndrome ICD-10 codes were used infrequently by all HNE EDs. In HNE during 2008, counts at individual EDs ranged from nine to 57 with a median of 13.
Most gastroenteritis syndrome signals between 2005 and 2007 occurred in 2 hospitals, both being referral centres for children. Th e majority of alerts occurred during September and October each year, but this trend was absent in 2008 (Table 2). Th ere was no clear association between known outbreaks and ED surveillance signals (Table 2). However, information captured in the OzFood-Net outbreak investigation database indicated that very few known outbreak cases presented to hospital.
Stakeholder survey
Six of the 7 ED directors returned completed questionnaires. Only one of the 6 ED directors surveyed always read the alert emails, others responded that they only did so intermittently depending on workload. None of the ED directors reported taking any action from the alerts unless the PHU contacted them.
Six of the 10 public health staff surveyed returned completed questionnaires. All six reported utilis-ing the surveillance data during mass events and disaster responses, 67% indicated they had used the surveillance data to inform public health action, while all indicated they still wanted to receive the alert emails, with fi ve only wanting to know about a restricted number of syndromes.
Table 2: Comparison of gastrointestinal outbreak notifi cations in institutions, OzFoodNet notifi cations and emergency department syndromic surveillance signals, 2006 to 2008
2008 2007 2006Institutions OzFoodNet ED
signalInstitutions OzFoodNet ED
signalInstitutions OzFoodNet ED
signalJan 4 3 1 5 1 0 2 1 3Feb 3 1 0 4 2 0 3 1 0Mar 5 1 0 6 0 0 6 1 0Apr 4 1 0 6 1 0 7 1 0May 10 0 0 6 0 0 11 0 1Jun 5 0 0 5 0 0 12 4 4July 7 0 0 9 2 0 19 0 0Aug 17 1 3 18 0 2 13 0 18Sept 12 0 0 9 1 1 4 2 56Oct 5 0 0 20 1 69 10 2 26Nov 7 2 0 14 0 12 6 0 0Dec 4 1 3 10 1 2 6 2 0
ED Emergency department.
CDI Vol 34 No 3 2010 315
Peer-reviewed articles
Additional applications
Acute events surveillance
Severe storms and extensive fl ooding occurred in the Hunter Valley during the June 2007 long weekend (Friday 8 to Monday 11 June) resulting in the region being declared a natural disaster area. 20 No gastroenteritis outbreaks were identifi ed by the ED surveillance system during the recovery phase. Th e system detected increased presentations of respiratory syndromes, which were within seasonally expected levels when compared with data for the previous 5 years. Th e ED data informed response planning, while providing reassurance that there were no large infectious disease outbreaks threatening the health of the disaster aff ected population. 21 Th e surveillance system acquired data on all presentations to EDs, allowing consideration of additional syndromes or conditions not included in the standard surveillance reports. Th is occurred during the 2007 Hunter storms when information was provided on hypothermia presentations to local EDs. Hypothermia was subsequently added to the standard reports in 2008.
Mass gatherings surveillance
Th e Tamworth country music festival is a mass gathering occurring for 2 weeks each January, ending on the Australia Day long weekend, with a doubling of the Tamworth population from 40,000 to over 80,000 people. Temporary camping facilities accommodate the infl ux of people, and many transitory food vendors cater for the crowd. Enhanced ED surveillance through the New South Wales ED syndromic surveillance system has been used during the festival since 2007 with data reported daily to the local disaster emergency management team. Signals have prompted public health investigations, for example clusters of otitis externa and respiratory illness in 2007, informed workforce planning and assisted in prioritising public health activity and media messages.
Discussion
Th e New South Wales real-time emergency department surveillance system was evaluated from the perspective of a regional PHU for its capacity to identify cases or clusters of public health importance requiring a prompt response, without duplicating existing surveillance systems; and for enhanced surveillance during emergency situations or mass gathering events for situational awareness.
Th e ED surveillance system is potentially a useful tool to assist with situational awareness, particularly during natural disasters and mass gathering events. Recent experience in HNE has demonstrated the value of ED syndromic surveillance in both these circumstances. Th e recent H1N1 pandemic also established the value of the ED syndromic surveillance system in monitoring statewide demand on ED services during a prolonged public health emergency. 22 Th e system is fl exible, allowing for adding or adapting syndromes in response to changing situations, and accommodates tight reporting time frames. ED surveillance data have informed health messages for the media and guided response planning. Previous reviews of the use of syndromic surveillance systems during acute events support their effi cacy. 23–25
Th is study identifi ed potential utility for this surveillance system to detect public health threats requiring prompt intervention for a few specifi c syndromes. During 2008, only six of 958 signals across 8 HNE EDs required further public health intervention. Th e prospective evaluation of the 39 syndromes provided empirical support for focusing on only 5 syndromes (gastrointestinal, meningitis, pneumonia, infl uenza and poisoning). If daily monitoring had been restricted to these syndromes then there would have been substantially fewer signals (143 in table versus 958) to investigate. System acceptability and representativeness could be improved by including the second rural referral hospital in HNE and by investigating the specifi c surveillance needs of ED staff .
Outbreaks are relatively rare events and their severity determines whether there are ED presentations. Th ere is no gold standard of outbreak identifi cation to which to compare syndromic surveillance, as existing surveillance systems themselves do not detect all outbreaks even with a delay. Th is complicates the determination of the sensitivity and specifi city of the ED syndromic surveillance system. During the prospective evaluation, 1 viral meningitis cluster was detected by the ED surveillance system, concurrently with existing surveillance systems. In addition, the system did not identify any outbreaks during the Hunter 2007 storms or during mass gathering events in the region, consistent with results from existing surveillance.
Th e single pneumonia outbreak indicated that although the syndrome may not signal earlier than reporting by an astute clinician, a narrower age-band excluding the ‘noise’ generated by the very young and old, may be a more sensitive measure of unusual respiratory outbreak activ-ity. For example, during the second wave of an
316 CDI Vol 34 No 3 2010
Peer-reviewed articles
infl uenza pandemic, when diff erent age groups may be hospitalised compared with those usually aff ected by seasonal infl uenza.
Past evaluations of emergency department syn-dromic surveillance systems have found that they can detect community wide outbreaks, such as seasonal infl uenza and gastroenteritis, however their eff ectiveness in identifying smaller clusters of interest to local PHUs has not been established. 4–7 When known gastrointestinal outbreaks investi-gated by OzFoodNet and institutional outbreaks reported to the HNE PHU were compared to the gastrointestinal syndrome signals, no known outbreaks were identifi ed by the ED surveillance system. Th e OzFoodNet database did indicate that a restricted number of people had presented to EDs, however the high level of ‘background noise’ and fi xed threshold level reduced the likeli-hood of a signal being generated. Similarly, none of the notifi ed cases of meningococcal disease in 2008 resulted in a signal.
While detection of the infl uenza and gastroenteri-tis season commencement has value at a state level for providing information on severity and spread and to inform media releases, such seasonal trends are of less value at the local level where outbreak detection and investigation are the priority.
While local objectives were developed for this evaluation, it is important that specifi c operational objectives are established for the ED surveillance system to guide reporting and investigation of signals. As each syndrome represents a separate disease or condition it may be necessary for each syndrome to have its own surveillance objectives describing local public health relevance (Box). Clear regional objectives may also assist in engag-ing EDs in the reporting process, as the benefi t of investing time may become more evident. ED sur-veillance objectives should complement existing surveillance systems rather than duplicate eff orts.
Limitations
During the evaluation, the ED standard reports were generally only monitored on weekdays; reports from Fridays and Saturdays were not reviewed until Monday, except during the declared disaster and mass event monitoring. Th is could have lead to delays in event detection. Th e retrospective reproduction of the ED standard reports may diff er slightly to reports that were produced in real time. Th is is due to higher data completeness in the retrospective data compared to the real-time data.
Box: Examples of surveillance objectives
Objectives for pneumonia syndrome
• Identify unusual clusters of pneumonia that require a rapid response, without duplicating exist-ing surveillance systems (e.g. Legionella )
• Identify bioterrorism event
Objectives for meningitis/encephalitis syndrome
• Identify unusual clusters of viral meningitis or encephalitis, to ensure appropriate testing
Objectives for monitoring poisoning syndrome
• Identify chemical exposures requiring response • Identify foodborne poisoning events requiring response
Objectives for gastrointestinal syndrome
• Identify unusual clusters of severe gastrointestinal disease that require an acute and timely response, without duplicating existing surveillance systems
Objectives during acute events/disaster response
• Identify clusters or increasing trends in presentations of public health importance that require a rapid response
CDI Vol 34 No 3 2010 317
Peer-reviewed articles
During this evaluation it was not possible to adequately measure the ‘cost-eff ectiveness’ of the ED syndromic surveillance system. While PHU staff time required to follow-up on signals was recorded, information on the cost of setting up and maintaining the system was not available to the researchers. Th erefore it is not possible to determine whether the costs of providing situ-ational awareness and community reassurance are justifi ed, nor can it prospectively be determined if the system will repay its running costs by averting a major disaster.
Th e stakeholder survey conducted as part of this evaluation only consisted of a small number of participants; which limits the ability to general-ise the fi ndings. When applying these results to other regions it is important to consider that ED patient management systems and coding practices may vary across EDs and regions. Th erefore the performance of specifi c syndromes may diff er between hospitals and regions.
Conclusion
ED syndromic surveillance may inform local public health action or serve as a surveillance safety net for traditional surveillance when focused on pneumonia, meningitis/encephalitis, poisoning and possibly gastrointestinal syndromes. It appears to have specifi c local utility during mass gathering or disaster response surveillance. Clear objectives for each syndrome are needed, emphasising the diff erence between local and state surveillance objectives and variability between syndromes. A handbook of response options may prove valuable in guiding the response to specifi c syndromic surveillance signals.
Acknowledgements
Th e authors acknowledge the Hunter New England Public Health Unit staff for all their input and support during this evaluation and the NSW Health Centre for Epidemiology and Research especially David Muscatello and Wai Zheng for their ongoing support and important work in developing and maintaining the syn-dromic surveillance system. Th e authors also acknowledge the funding support provided by the NSW Department of Health through the Hunter Medical Research Institute.
Author details
Kirsty G Hope 1,2
Tony D Merritt 1,2
David N Durrheim 1,2
Peter D Massey 1,2
Julie K Kohlhagen 1
Kerry W Todd 1
Catherine A D’Este 2
1. Hunter New England Population Health Unit, Wallsend, New South Wales
2. University of Newcastle, Newcastle, New South Wales
Corresponding author: Ms Kirsty Hope, Hunter New England Population Health, Locked Bag 10, WALLSEND NSW 2287. Telephone: +61 2 4924 6496. Facsimile: +612 4924 6408. Email: [email protected]
References
1. Reis B, Mandl K. Syndromic surveillance: the effects of syndrome grouping on model accuracy and outbreak detec tion. Ann Emerg Med 2004;44(3):235–241.
2. Mandl K, Overhage J, Wagner M, Lober W, Sebastiani P, Mastashari F, et al. Implementing syndromic surveillance; a practical guide informed by the early experience. J Am Med Inform Assoc 2004;11(2):141–150.
3. Wu T, Shih F, Yen M, Wu J, Lu S, Chang K, et al. Establishing a nationwide emergency department-based syndromic surveillance system for better public health responses in Taiwan. BMC Public Health 2008;8:18.
4. Hope K, Durrheim D, D’Espaignet ET, Dalton C. Syndromic surveillance: is it a useful tool for local outbreak detection? J Epidemiol Community Health 2006;60(5):374–375.
5. Bravata DM, McDonald KM, Smith WM, Rydzak C, Szeto H, Buckeridge DL, et al. Systematic review: surveillance systems for early detection of bioterrorism-related diseases. Ann Intern Med 2004;140(11):910–922.
6. McLeod M, Mason K, White P, Read D. The 2005 Wellington inf luenza outbreak: syndromic surveillance of Wellington Hospital Emergency Depar tment activit y may have provided early warning. Aust N Z J Public Health 2009;33(3):289–294.
318 CDI Vol 34 No 3 2010
Peer-reviewed articles
7. Wallace DJ, Arquilla B, Heffernan R, Kramer M, Anderson T, Bernstein D, et al. A tes t of syndromic surveillance using a severe acute respiratory syndrome model. Am J Emerg Med 2009;27(4):419–423.
8. Meyard J, Chaudet H, Texier G, Ardillon V, Ravachol F, Deparis X, et al. Value of syndromic surveillance within the armed forces for early warning during a dengue fever outbreak in French Guiana in 2006. BMC Med Informatics Decision Making 2008;8:29–38.
9. Buckeridge D. Outbreak detection through automated sur vei l lance: a review of the determinants of detection. J Biomedical Informatics 2007;40:370–379.
10. Centers for Disease Control and Prevention. Syndromic Surveillance: reports from a national conference, 2004. MMWR Morb Mortal Wkly Rep 2005;54(Suppl):1–180.
11. Muscatello D, Churches T, Kaldor J, Zheng W, Chiu C, Correll P, et al. An automated, broad-based, near real-time public health surveillance system using presentations to hospital Emergency Departments in New South Wales, Australia. BMC Public Health 2005;5:141–152.
13. Hunter New England Area Health Service. HNE ser vices and facili t ies . Accessed on 10 February 2010. Available from: http://www.hnehealth.nsw.gov.au/services_and_facilities
14. Hope K, Durrheim D, Muscatello D, Merritt T, Zheng W, Massey P, et al. Identifying pneumonia outbreaks of public health impor tance: can emergency department data assist in earlier ident i f icat ion? Aust N Z J Public Health 2008;32(4):361–363.
15. New South Wales Government. NSW Public Health Act 1991 . Accessed on 10 February 2010. Available from: http://www.austlii.edu.au/au/legis/nsw/consol_act/pha1991126/
16. NSW Depar tment of Health. Notification of Infectious Diseases under the Public Health Act 1991 . 2006. Policy directive PD2006_014. Accessed on 10 February 2010. Available from: http://www.health.nsw.gov.au/policies/pd/2006/pdf/PD2006_014.pdf
17. Zheng W, Aitken R, Muscatello DJ, Churches T. Potential for early warning of viral influenza activity in the community by monitoring clinical diagnoses of influenza in hospital emergency departments. BMC Public Health 2007;7:250.
18. Buehler J, Hopkins R, Overhage J, Sosin D, Tong V, CDC Working Group. Framework for evaluating public health surveillance systems for early detection of outbreaks: recommendations from the CDC working group. MMWR Recomm Rep 2004;53(RR–5):1–11.
19. Cashman P, Massey P, Durrheim D, Islam F, Merritt T, Eastwood K. Pneumonia cluster in a boarding school – implications for influenza control. Commun Dis Intell 2007;31(3):296–298.
20. Dalton C, Durrheim D, Fejsa J, Francis L, Carlson S, d’Espaignet ET, et al. Flutracking: A weekly Australian community online survey of influenza-like illness in 2006, 2007 and 2008, Commun Dis Intell 2009;33(3):316–322.
21. Cretikos MA, Merritt TD, Main K, Eastwood K, Winn L, Moran L, et al. Mitigating the health impacts of a natural disaster— the June 2007 long-weekend storm in the Hunter region of New South Wales. Med J Aust 2007;187(11–12):670–673.
22. Hope K, Merritt T, Eastwood K, Main K, Durrheim D, Muscatello D, et al. The public health value of emergency department syndromic surveillance following a natural disaster, Commun Dis Intell 2008;32(1):92–94.
23. Churches T, Conaty SJ, Gilmour RE, Muscatello DJ. Reflections on public health surveillance of pandemic (H1N1) 2009 influenza in NSW. N S W Public Health Bull 2010;21(1–2):19–25.
24. Toprani A, Ratard R, Straif-Bourgeois S, Sokol T, Averhoff F, Brady J, et al. Surveillance in hurricane evacuation centers—Louisiana, September–October 2005. MMWR Morb Mortal Wkly Rep 2006;55(2):32–35.
25. Steiner-Sichel L, Greenko J, Heffernan R, Layton M, Weiss D. Field investigations of emergency department syndromic surveillance signals—New York City. MMWR Morb Mortal Wkly Rep 2004; 3(Suppl):184–189.
26. Carrico R, Goss L. Syndromic surveillance: hospital emergency department participation during the Kentucky Derby Festival. Disaster Manag Response 2005;3(3):73–79.
CDI Vol 34 No 3 2010 319
Peer-reviewed articles
Abstract
The Australian Collaboration for Chlamydia Enhanced Sentinel Surveillance (ACCESS) was established with funding from the Department of Health and Ageing to trial the monitoring of the uptake and outcome of chlamydia testing in Australia. ACCESS involved 6 separate networks; 5 clinical networks involving sexual health services, family planning clinics, general practices, antenatal clinics, Aboriginal community controlled health services, and 1 laboratory network. The program ran from May 2007 to September 2010. An evaluation of ACCESS was undertaken in early 2010, 2 years after the program was funded. At the time of the evaluation, 76 of the 91 participating sites were contributing data. The jurisdictional distribution of the 76 sites generally matched the jurisdictional distribution of the Australian population. In 2008, the chlamydia testing rates in persons aged 16–29 years attending the 26 general practices was 4.2% in males and 7.0% in females. At the 25 sexual health services, the chlamydia testing rates in heterosexuals aged less than 25 years in 2008 was 77% in males and 74% in females. Between 2004 and 2008, the chlamydia positivity rate increased significantly in heterosexual females aged less than 25 years attending the sexual health services, from 11.5% to 14.1% ( P < 0.01). Data completeness was above 85% for all core variables except Aboriginal and/or Torres Strait Islander status and country of birth, which ranged from 68%–100%, and 74%–100%, respectively, per network. There were delays in establishment of the system due to recruitment of 91 sites, multiple ethics applications and establishment of automated extraction programs in 10 different database systems, to transform clinic records into a common, pre-defined surveillance format. ACCESS has considerable potential as a mechanism toward supporting a better understanding of long-term trends in chlamydia notifications and to support policy and program delivery. Commun Dis Intell 2010;34(3):319–328.
Keywords: chlamydia, sentinel surveillance, Australia
Introduction
Th e primary role of public health surveillance is to guide the planning and evaluation of policy and programs, through the collection, analysis and interpretation of statistical information. In Aus-tralia, the main form of chlamydia surveillance is passive reporting of cases to health departments by doctors or laboratories. 1 Passive surveillance has shown Chlamydia trachomatis to be the most commonly notifi ed infection in Australia with rates having risen nearly 4-fold in the past decade. 1
Passive surveillance has a natural appeal, in that it can be established on an ongoing basis, provides full geographic coverage and does not involve substantial programmatic expense. On the other hand, passive surveillance may be biased by testing patterns, as indicated by the strong correlation between the number of diagnoses and number of tests. 2–4 Also, notifi cation data do not routinely include information on characteristics such as gender of sex partner and in several jurisdictions are far from complete with regard to indigenous status. 5
A supplementary approach to surveillance is the use of selected clinical sites to collect systematic data on uptake and the outcome of chlamydia testing. Such data can be used to evaluate clinic-based initiatives, broader prevention programs and help interpret trends in passive surveillance. 6,7
In May 2007 the Australian Government Depart-ment of Health and Ageing (DoHA) funded the trialling of a new national sentinel surveillance system, entitled the Australian Collaboration for Chlamydia Enhanced Sentinel Surveillance (ACCESS) (www.access-study.org), based on 5 networks of clinical sites and a laboratory network. Th is paper reports on an evaluation of this new system.
A NEW NATIONAL CHLAMYDIA SENTINEL SURVEILLANCE SYSTEM IN AUSTRALIA: EVALUATION OF THE FIRST STAGE OF IMPLEMENTATION
Rebecca J Guy, Fabian Kong, Jane Goller, Neil Franklin, Isabel Bergeri, Wayne Dimech, Nicole Reilly, Elizabeth Sullivan, James Ward, John M Kaldor, Margaret Hellard, Basil Donovan, on behalf of the ACCESS collaboration
320 CDI Vol 34 No 3 2010
Peer-reviewed articles
Methods
Th is evaluation of ACCESS was conducted from 1 January to 31 March 2010 by project staff , using the framework promulgated by the US Centers for Disease Control and Prevention. 8 Specifi c goals were to:
1. assess the simplicity, fl exibility, acceptability, timeliness, stability, validity, usefulness and representativeness of ACCESS;
2. assess the data quality of the system by exami-nation of the fi rst 12 months of data collection; and
3. make recommendations to improve the system.
For each ACCESS variable, completeness was the proportion of entries that were not missing or unknown. To determine representativeness, the proportion of ACCESS sites per jurisdiction was compared with the proportion of the population in the jurisdiction. Th e ratio of metropolitan and non-metropolitan ACCESS sites was also compared with this ratio for the Australian population. Population data were accessed from the 2006 Australian Bureau of Statistics data. 9 Other surveillance attributes were assessed qualitatively through feedback from other ACCESS members and select partners, ACCESS meeting Minutes and quarterly progress reports submitted to DoHA.
Results
Description of ACCESS
ACCESS was established as a collaboration between the National Centre in HIV Epidemiology and Clinical Research (NCHECR) and the Perinatal and Reproductive Epidemiology and Research Unit at the University of New South Wales (UNSW), the Burnet Institute’s Centre for Population Health, and the National Serology Reference Laboratory (NRL). UNSW (via NCHECR) and the Burnet Institute are jointly responsible for ACCESS. Other partners are the participating sentinel sites (Appendix), the National Aboriginal Community Controlled Health Organisation (NACCHO) and its state and territory based affi liates; and DoHA as funding agency.
Th e overall aim of ACCESS is to establish a sentinel surveillance system to evaluate the impact of interventions to control genital chlamydia infection. Specifi c objectives were to:
1. establish 6 separate surveillance networks, each providing unique information on chlamydia testing;
2. enhance the data management systems of sentinel sites with a view to routinely sending chlamydia surveillance data to a central location;
3. monitor the extent of chlamydia testing at these sites;
4. determine the chlamydia positivity in priority populations; including young heterosexuals (< 25 years), men who have sex with men (MSM), Aboriginal and/or Torres Strait Islander people, pregnant women and sex workers; and
5. interpret trends determined by other chlamy-dia surveillance mechanisms.
ACCESS involves 5 clinical networks made up of sexual health services, family planning clinics, general practices, antenatal clinics and Aboriginal community controlled health services, and a laboratory network. Each network involves multiple sites, chosen under the following criteria (which varied by network):
1. a specifi ed minimum number of chlamydia tests per year;
2. geographic representation; and
3. a minimum number of tests in priority popula-tions specifi ed by the National Sexually Trans-missible Infections Strategy 2005–2008, 10 as defi ned in Table 1.
On a quarterly or 6-monthly basis, a core set of data in de-identifi ed line-record format were extracted from sites (apart from the antenatal clinic network) and include patient demographic and chlamydia testing information. Additional information was collected from some specifi c networks; ‘gender of sexual partners’, ‘current sex work’, ‘sex overseas in the last 12 months’, ‘traveller or migrant status’ (sexual health service network), ‘parity’ (antenatal clinic network) and specimen type (laboratory network). Extraction programs were developed to transform these records into a common, pre-defi ned format.
Analyses were conducted of the proportion of patients tested for chlamydia and the proportion of those tested found to have infection (chlamydia positivity). Both were restricted to new or unique patients (those attending the clinic or tested for the fi rst time in the surveillance period). Analyses
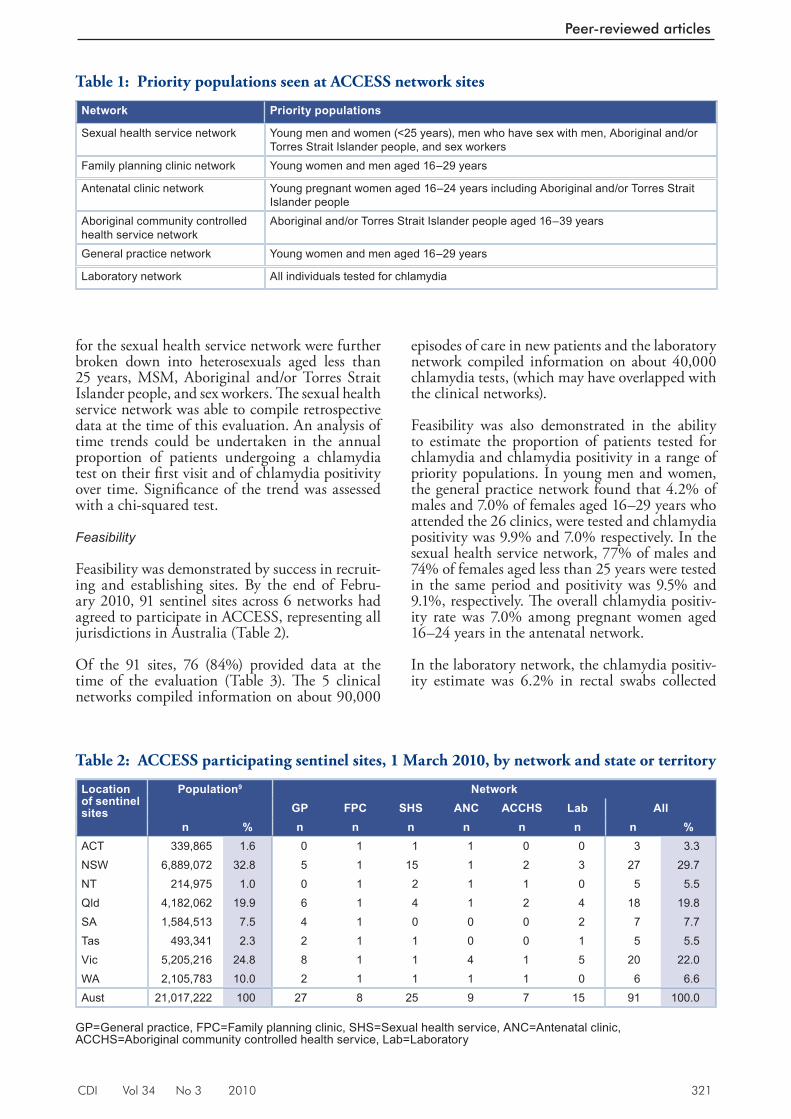
CDI Vol 34 No 3 2010 321
Peer-reviewed articles
for the sexual health service network were further broken down into heterosexuals aged less than 25 years, MSM, Aboriginal and/or Torres Strait Islander people, and sex workers. Th e sexual health service network was able to compile retrospective data at the time of this evaluation. An analysis of time trends could be undertaken in the annual proportion of patients undergoing a chlamydia test on their fi rst visit and of chlamydia positivity over time. Signifi cance of the trend was assessed with a chi-squared test.
Feasibility
Feasibility was demonstrated by success in recruit-ing and establishing sites. By the end of Febru-ary 2010, 91 sentinel sites across 6 networks had agreed to participate in ACCESS, representing all jurisdictions in Australia (Table 2).
Of the 91 sites, 76 (84%) provided data at the time of the evaluation (Table 3). Th e 5 clinical networks compiled information on about 90,000
episodes of care in new patients and the laboratory network compiled information on about 40,000 chlamydia tests, (which may have overlapped with the clinical networks).
Feasibility was also demonstrated in the ability to estimate the proportion of patients tested for chlamydia and chlamydia positivity in a range of priority populations. In young men and women, the general practice network found that 4.2% of males and 7.0% of females aged 16–29 years who attended the 26 clinics, were tested and chlamydia positivity was 9.9% and 7.0% respectively. In the sexual health service network, 77% of males and 74% of females aged less than 25 years were tested in the same period and positivity was 9.5% and 9.1%, respectively. Th e overall chlamydia positiv-ity rate was 7.0% among pregnant women aged 16–24 years in the antenatal network.
In the laboratory network, the chlamydia positiv-ity estimate was 6.2% in rectal swabs collected
Table 1: Priority populations seen at ACCESS network sites
Network Priority populations
Sexual health service network Young men and women (<25 years), men who have sex with men, Aboriginal and/or Torres Strait Islander people, and sex workers
Family planning clinic network Young women and men aged 16–29 years
Antenatal clinic network Young pregnant women aged 16–24 years including Aboriginal and/or Torres Strait Islander people
Aboriginal community controlled health service network
Aboriginal and/or Torres Strait Islander people aged 16–39 years
General practice network Young women and men aged 16–29 years
Laboratory network All individuals tested for chlamydia
Table 2: ACCESS participating sentinel sites, 1 March 2010, by network and state or territory
Location of sentinel sites
Population9 NetworkGP FPC SHS ANC ACCHS Lab All
n % n n n n n n n %ACT 339,865 1.6 0 1 1 1 0 0 3 3.3 NSW 6,889,072 32.8 5 1 15 1 2 3 27 29.7NT 214,975 1.0 0 1 2 1 1 0 5 5.5Qld 4,182,062 19.9 6 1 4 1 2 4 18 19.8SA 1,584,513 7.5 4 1 0 0 0 2 7 7.7Tas 493,341 2.3 2 1 1 0 0 1 5 5.5Vic 5,205,216 24.8 8 1 1 4 1 5 20 22.0WA 2,105,783 10.0 2 1 1 1 1 0 6 6.6Aust 21,017,222 100 27 8 25 9 7 15 91 100.0
GP=General practice, FPC=Family planning clinic, SHS=Sexual health service, ANC=Antenatal clinic, ACCHS=Aboriginal community controlled health service, Lab=Laboratory
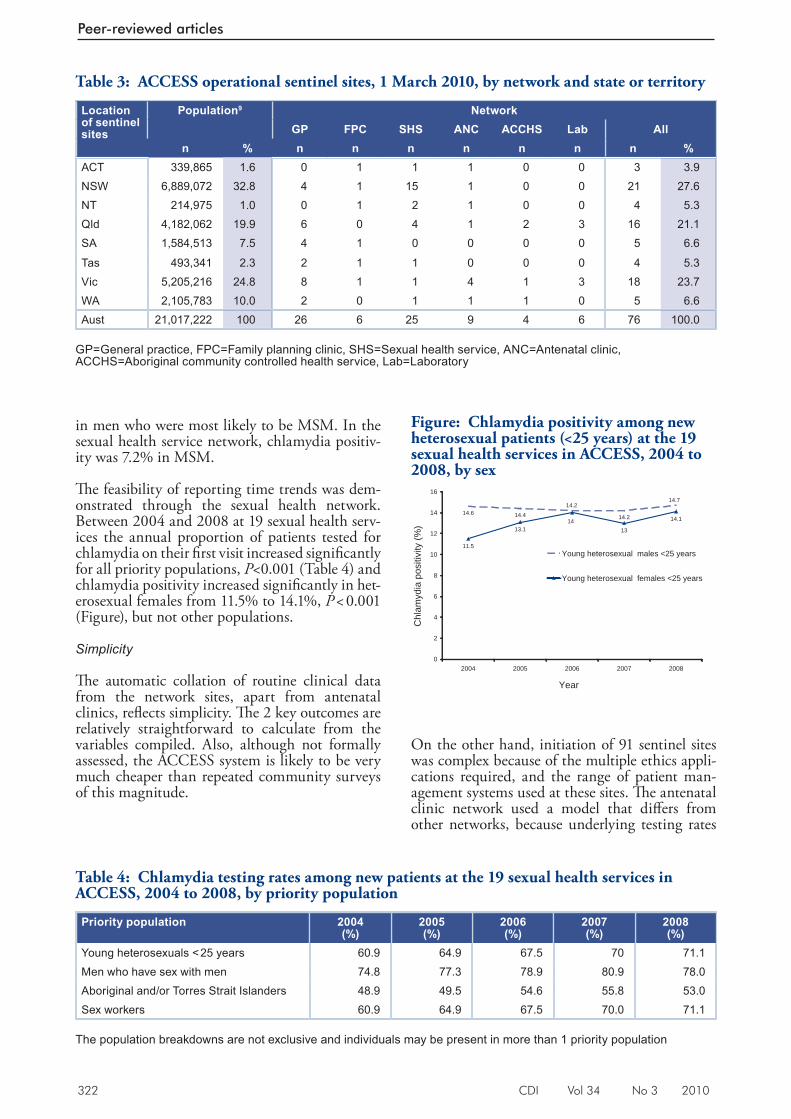
322 CDI Vol 34 No 3 2010
Peer-reviewed articles
in men who were most likely to be MSM. In the sexual health service network, chlamydia positiv-ity was 7.2% in MSM.
Th e feasibility of reporting time trends was dem-onstrated through the sexual health network. Between 2004 and 2008 at 19 sexual health serv-ices the annual proportion of patients tested for chlamydia on their fi rst visit increased signifi cantly for all priority populations, P <0.001 (Table 4) and chlamydia positivity increased signifi cantly in het-erosexual females from 11.5% to 14.1%, P < 0.001 (Figure), but not other populations.
Simplicity
Th e automatic collation of routine clinical data from the network sites, apart from antenatal clinics, refl ects simplicity. Th e 2 key outcomes are relatively straightforward to calculate from the variables compiled. Also, although not formally assessed, the ACCESS system is likely to be very much cheaper than repeated community surveys of this magnitude.
On the other hand, initiation of 91 sentinel sites was complex because of the multiple ethics appli-cations required, and the range of patient man-agement systems used at these sites. Th e antenatal clinic network used a model that diff ers from other networks, because underlying testing rates
Table 3: ACCESS operational sentinel sites, 1 March 2010, by network and state or territory
Location of sentinel sites
Population9 NetworkGP FPC SHS ANC ACCHS Lab All
n % n n n n n n n %ACT 339,865 1.6 0 1 1 1 0 0 3 3.9N SW 6,889,072 32.8 4 1 15 1 0 0 21 27.6NT 214,975 1.0 0 1 2 1 0 0 4 5.3Qld 4,182,062 19.9 6 0 4 1 2 3 16 21.1SA 1,584,513 7.5 4 1 0 0 0 0 5 6.6
Tas 493,341 2.3 2 1 1 0 0 0 4 5.3Vic 5,205,216 24.8 8 1 1 4 1 3 18 23.7WA 2,105,783 10.0 2 0 1 1 1 0 5 6.6Aust 21,017,222 100 26 6 25 9 4 6 76 100.0
GP=General practice, FPC=Family planning clinic, SHS=Sexual health service, ANC=Antenatal clinic, ACCHS=Aboriginal community controlled health service, Lab=Laboratory
Table 4: Chlamydia testing rates among new patients at the 19 sexual health services in ACCESS, 2004 to 2008, by priority population
Priority population 2004(%)
2005(%)
2006(%)
2007(%)
2008(%)
Young heterosexuals < 25 years 60.9 64.9 67.5 70 71.1Men who have sex with men 74.8 77.3 78.9 80.9 78.0Aboriginal and/or Torres Strait Islanders 48.9 49.5 54.6 55.8 53.0Sex workers 60.9 64.9 67.5 70.0 71.1
The population breakdowns are not exclusive and individuals may be present in more than 1 priority population
Figure: Chlamydia positivity among new heterosexual patients (<25 years) at the 19 sexual health services in ACCESS, 2004 to 2008, by sex
14.6 14.4 14.2
11.5
13.1 13
14.1
14.714.2
14
0
2
4
6
8
10
12
14
16
2004 2005 2006 2007 2008
Year
Chl
amyd
ia p
ositi
vity
(%)
Young heterosexual males <25 years
Young heterosexual females <25 years
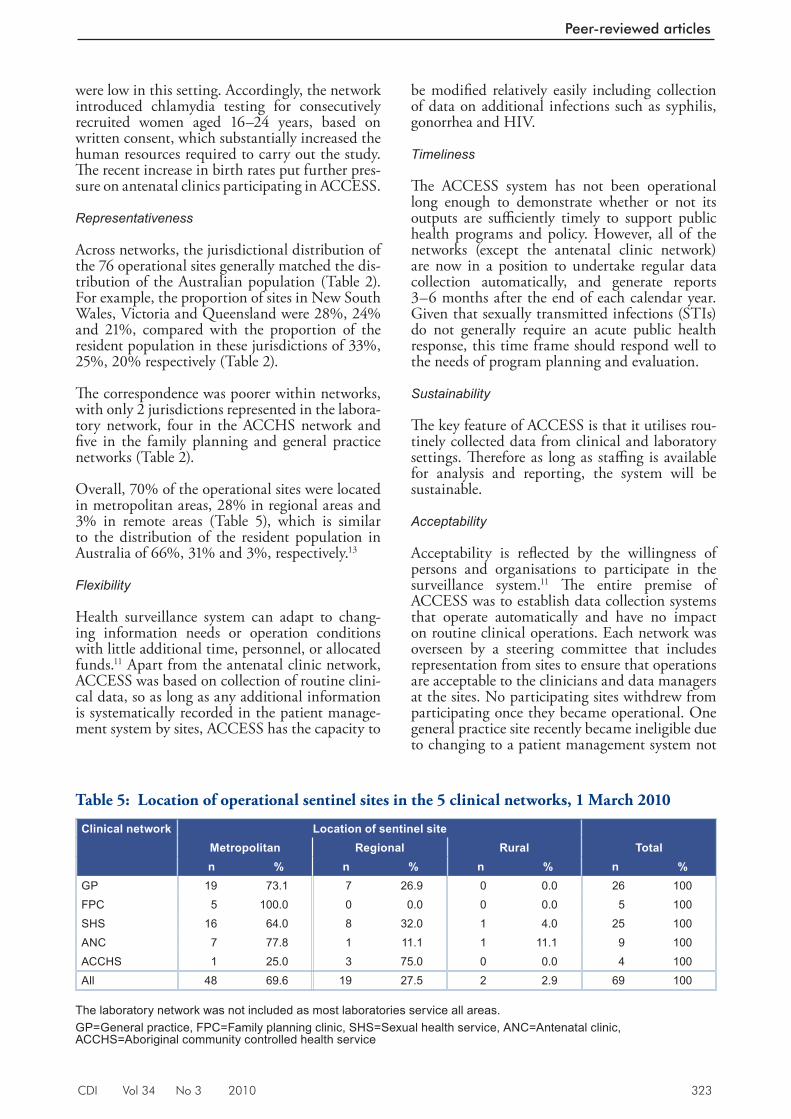
CDI Vol 34 No 3 2010 323
Peer-reviewed articles
were low in this setting. Accordingly, the network introduced chlamydia testing for consecutively recruited women aged 16–24 years, based on written consent, which substantially increased the human resources required to carry out the study. Th e recent increase in birth rates put further pres-sure on antenatal clinics participating in ACCESS.
Representativeness
Across networks, the jurisdictional distribution of the 76 operational sites generally matched the dis-tribution of the Australian population (Table 2). For example, the proportion of sites in New South Wales, Victoria and Queensland were 28%, 24% and 21%, compared with the proportion of the resident population in these jurisdictions of 33%, 25%, 20% respectively (Table 2).
Th e correspondence was poorer within networks, with only 2 jurisdictions represented in the labora-tory network, four in the ACCHS network and fi ve in the family planning and general practice networks (Table 2).
Overall, 70% of the operational sites were located in metropolitan areas, 28% in regional areas and 3% in remote areas (Table 5), which is similar to the distribution of the resident population in Australia of 66%, 31% and 3%, respectively. 13
Flexibility
Health surveillance system can adapt to chang-ing information needs or operation conditions with little additional time, personnel, or allocated funds. 11 Apart from the antenatal clinic network, ACCESS was based on collection of routine clini-cal data, so as long as any additional information is systematically recorded in the patient manage-ment system by sites, ACCESS has the capacity to
be modifi ed relatively easily including collection of data on additional infections such as syphilis, gonorrhea and HIV.
Timeliness
Th e ACCESS system has not been operational long enough to demonstrate whether or not its outputs are suffi ciently timely to support public health programs and policy. However, all of the networks (except the antenatal clinic network) are now in a position to undertake regular data collection automatically, and generate reports 3–6 months after the end of each calendar year. Given that sexually transmitted infections (STIs) do not generally require an acute public health response, this time frame should respond well to the needs of program planning and evaluation.
Sustainability
Th e key feature of ACCESS is that it utilises rou-tinely collected data from clinical and laboratory settings. Th erefore as long as staffi ng is available for analysis and reporting, the system will be sustainable.
Acceptability
Acceptability is refl ected by the willingness of persons and organisations to participate in the surveillance system. 11 Th e entire premise of ACCESS was to establish data collection systems that operate automatically and have no impact on routine clinical operations. Each network was overseen by a steering committee that includes representation from sites to ensure that operations are acceptable to the clinicians and data managers at the sites. No participating sites withdrew from participating once they became operational. One general practice site recently became ineligible due to changing to a patient management system not
Ta ble 5: Location of operational sentinel sites in the 5 clinical networks, 1 March 2010
Clinical network Location of sentinel siteMetropolitan Regional Rural Totaln % n % n % n %
GP 19 73.1 7 26.9 0 0.0 26 100FPC 5 100.0 0 0.0 0 0.0 5 100SHS 16 64.0 8 32.0 1 4.0 25 100ANC 7 77.8 1 11.1 1 11.1 9 100ACCHS 1 25.0 3 75.0 0 0.0 4 100All 48 69.6 19 27.5 2 2.9 69 100
The laboratory network was not included as most laboratories service all areas. GP=General practice, FPC=Family planning clinic, SHS=Sexual health service, ANC=Antenatal clinic, ACCHS=Aboriginal community controlled health service
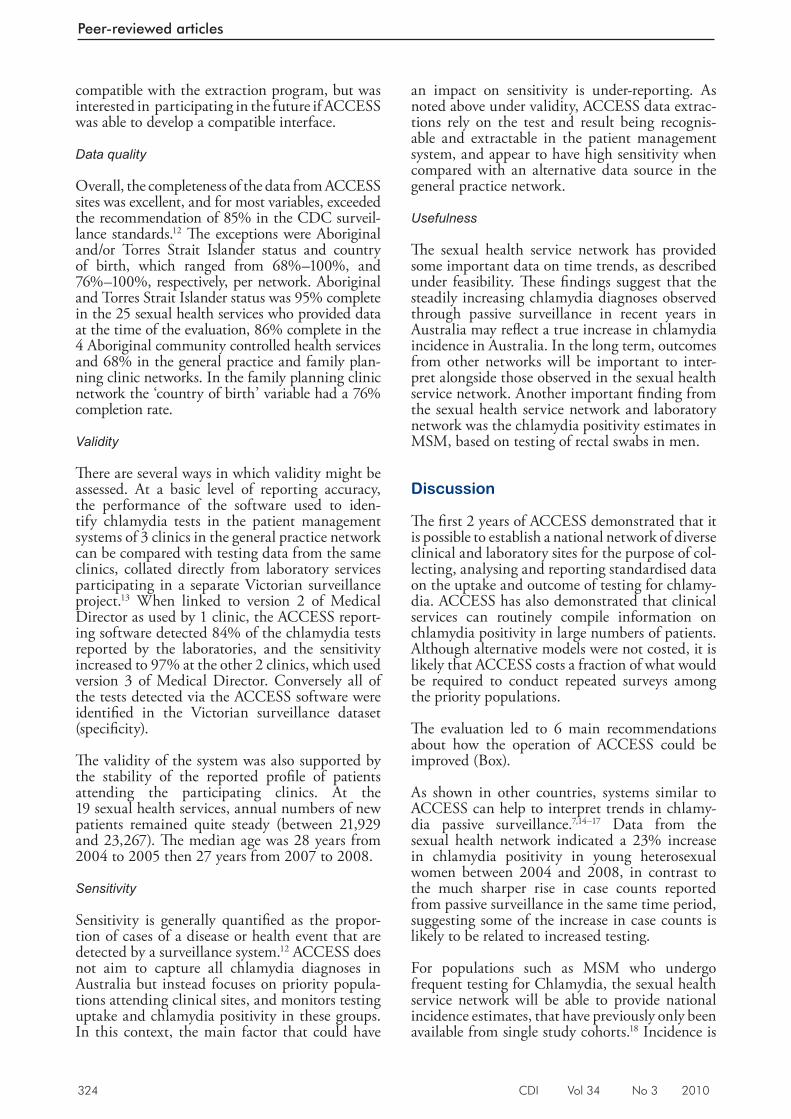
324 CDI Vol 34 No 3 2010
Peer-reviewed articles
compatible with the extraction program, but was interested in participating in the future if ACCESS was able to develop a compatible interface.
Data quality
Overall, the completeness of the data from ACCESS sites was excellent, and for most variables, exceeded the recommendation of 85% in the CDC surveil-lance standards. 12 Th e exceptions were Aboriginal and/or Torres Strait Islander status and country of birth, which ranged from 68%–100%, and 76%–100%, respectively, per network. Aboriginal and Torres Strait Islander status was 95% complete in the 25 sexual health services who provided data at the time of the evaluation, 86% complete in the 4 Aboriginal community controlled health services and 68% in the general practice and family plan-ning clinic networks. In the family planning clinic network the ‘country of birth’ variable had a 76% completion rate.
Validity
Th ere are several ways in which validity might be assessed. At a basic level of reporting accuracy, the performance of the software used to iden-tify chlamydia tests in the patient management systems of 3 clinics in the general practice network can be compared with testing data from the same clinics, collated directly from laboratory services participating in a separate Victorian surveillance project. 13 When linked to version 2 of Medical Director as used by 1 clinic, the ACCESS report-ing software detected 84% of the chlamydia tests reported by the laboratories, and the sensitivity increased to 97% at the other 2 clinics, which used version 3 of Medical Director. Conversely all of the tests detected via the ACCESS software were identifi ed in the Victorian surveillance dataset (specifi city).
Th e validity of the system was also supported by the stability of the reported profi le of patients attending the participating clinics. At the 19 sexual health services, annual numbers of new patients remained quite steady (between 21,929 and 23,267). Th e median age was 28 years from 2004 to 2005 then 27 years from 2007 to 2008.
Sensitivity
Sensitivity is generally quantifi ed as the propor-tion of cases of a disease or health event that are detected by a surveillance system. 12 ACCESS does not aim to capture all chlamydia diagnoses in Australia but instead focuses on priority popula-tions attending clinical sites, and monitors testing uptake and chlamydia positivity in these groups. In this context, the main factor that could have
an impact on sensitivity is under-reporting. As noted above under validity, ACCESS data extrac-tions rely on the test and result being recognis-able and extractable in the patient management system, and appear to have high sensitivity when compared with an alternative data source in the general practice network.
Usefulness
Th e sexual health service network has provided some important data on time trends, as described under feasibility. Th ese fi ndings suggest that the steadily increasing chlamydia diagnoses observed through passive surveillance in recent years in Australia may refl ect a true increase in chlamydia incidence in Australia. In the long term, outcomes from other networks will be important to inter-pret alongside those observed in the sexual health service network. Another important fi nding from the sexual health service network and laboratory network was the chlamydia positivity estimates in MSM, based on testing of rectal swabs in men.
Discussion
Th e fi rst 2 years of ACCESS demonstrated that it is possible to establish a national network of diverse clinical and laboratory sites for the purpose of col-lecting, analysing and reporting standardised data on the uptake and outcome of testing for chlamy-dia. ACCESS has also demonstrated that clinical services can routinely compile information on chlamydia positivity in large numbers of patients. Although alternative models were not costed, it is likely that ACCESS costs a fraction of what would be required to conduct repeated surveys among the priority populations.
Th e evaluation led to 6 main recommendations about how the operation of ACCESS could be improved (Box).
As shown in other countries, systems similar to ACCESS can help to interpret trends in chlamy-dia passive surveillance. 7,14–17 Data from the sexual health network indicated a 23% increase in chlamydia positivity in young heterosexual women between 2004 and 2008, in contrast to the much sharper rise in case counts reported from passive surveillance in the same time period, suggesting some of the increase in case counts is likely to be related to increased testing.
For populations such as MSM who undergo frequent testing for Chlamydia, the sexual health service network will be able to provide national incidence estimates, that have previously only been available from single study cohorts. 18 Incidence is
CDI Vol 34 No 3 2010 325
Peer-reviewed articles
the most sensitive indicator of changes in disease transmission, but is very expensive to assess through prospective cohorts. Line-listed records, linked by unique personal identifi ers and informa-tion related to serial consultations can be used to provide incidence data. 19
Although the system has been developed for monitoring chlamydia, its design is such that it could easily be adapted to the monitoring of other treatable bacterial STIs, such as syphilis and gon-orrhea, or viral STIs such as HIV. Th e marginal cost of expanding the surveillance system to other infection would be far less than the cost of start-ing new systems for each of these infections.
ACCESS provided information on some variables not available through national chlamydia passive surveillance, in particular the sex of sexual partner, which allows trends to be analysed separately for MSM and heterosexual populations. As with passive surveillance, completeness in ACCESS was poorest for Aboriginal and Torres Strait Islander status, but ACCESS did achieve somewhat higher completeness rates for this variable than passive surveillance in New South Wales, Queensland, the Australian Capital Territory and Tasmania. 5
Th e evaluation found that ACCESS sites were represented in all jurisdictions. Th e general practice network could be further expanded to increase the capacity of jurisdictions to evaluate local testing initiatives. In the longer term, data collected through ACCESS, particularly the general practice network, would also be able to provide pre– and post-descriptions of clinical populations, as a basis
for evaluating new programs. Another applica-tion of ACCESS data would be the assessment of compliance with clinical testing guidelines. 20 Th e laboratory network also provides a very large sample size to ensure very robust chlamydia positivity rate estimates and in the long term will provide impor-tant population level testing data, covering both the public and private laboratory sectors.
ACCESS would also be able to provide valu-able information about testing and chlamydia positivity rates in Aboriginal and/or Torres Strait Islander people attending a variety of clinical services in urban, regional and remote areas in Australia. Currently, the limited available data about STI testing undertaken by health services in Aboriginal and Torres Strait Island people are biased toward remote and regional settings. 21–23 Also because health departments in New South Wales and Queensland, with substantial Aborigi-nal populations, rely on laboratory notifi cations, the results of passive STI surveillance cannot be used to describe the STI epidemiology in this population. 5 A clearer picture may emerge if there was expansion of the Aboriginal community con-trolled health service network over the long term, particularly in New South Wales and Queensland. Any future directions of this network are subject to community consultation.
Th e antenatal clinic network methodology proved much more expensive and complex to implement because chlamydia testing is not routine in that setting. Nevertheless, this network has netted invaluable data on the prevalence of chlamydia in pregnant women in Australia. It is anticipated
Box: Key evaluation recommendations for the ACCESS system
1. Each network should undertake validity studies along the lines of those conducted by the general practice network;
2. ACCESS fi ndings should be disseminated widely, to ensure that all relevant stakeholders can use them to plan and evaluate interventions related to chlamydia testing;
3. Th e general practice network should be enhanced by the addition of more sites in certain juris-dictions and expanded to a much larger number of clinics over the long-term;
4. Subject to community consultation, the Aboriginal community controlled service network should be expanded to include more sites over the long term, particularly in New South Wales and Queensland.
5. A less resource-intensive surveillance system should be used for antenatal services such as the model used in other networks of ACCESS;
6. Th e collection of information on other sexually transmissible infections such as syphilis and gonorrhoea should be considered.
326 CDI Vol 34 No 3 2010
Peer-reviewed articles
that antenatal chlamydia testing will increase in the future, so the model used in other ACCESS networks could provide a less resource-intensive surveillance system for antenatal services.
Th ere is no perfect surveillance mechanism for monitoring the prevalence of infections such as chlamydia in populations. Surveys of the whole population are inevitably subject to bias because of incomplete participation, and surveys that aim to recruit particular population groups inevitably rely on sampling frames that can not truly replicate the membership of these groups. Th e approach adopted by ACCESS is to monitor chlamydia positivity rates, as a surrogate for prevalence, in patients attending specialised clinical services. Th is approach has similar limitations to the population surveys, in that it is unknown how representative these patients are of any wider group from which they are drawn. Chlamydia positivity rates may be infl uenced by the proportion and nature of the patients being tested. Some groups may undergo testing at particular times in response to campaigns, or clinics may change testing policies resulting in more asymptomatic patients being tested. Th e restriction of the analysis to new patients (or those testing for the fi rst time in the surveillance period) was intended to reduce the impact of this potential bias and provide accurate chlamydia positivity for surveillance purposes.
Passive notifi cation data demonstrated that chlamydia diagnoses have increased sharply over the past decade in Australia. ACCESS has the potential to complement this observation by providing a systematic means of measuring any changes in testing levels by specifi c priority populations and monitoring trends in chlamydia positivity in these groups, thereby enhancing our capacity to respond to and control this infection.
Acknowledgements
We thank all sentinel sites that provided data for ACCESS. Chlamydia positivity data for Victorian hospitals were collected in a separate study funded through the Chlamydia Targeted Grants Program and kindly provided by Marcus Chen. ACCESS was funded by the Australian Government Department of Health and Ageing through the Chlamydia Targeted Grants Program.
Members of ACCESS collaboration are: Dr Jane Hocking, Dr Douglas Boyle, Dr Tony Merritt, Assoc. Prof Helena Britt, Dr Phyllis Lau, Dr Marie Pirotta, Dr Clare Heal, A/Prof Tom Brett, Professor Christopher Fairley, Dr Marcus Chen, Dr Catherine O’Connor, Dr Lewis Marshall, Ms Bridget Dickson, Professor Andrew Grulich,
Dr Caroline Harvey, Ms Lee O’Neil, Dr Lynne Jordan, Dr Anne Stephens, Dr Christine Read, Dr Deborah Wright, Dr Michael Beckmann, Ms Julie MacPhail, Dr Marian Currie, Ms Zena Robinson, Dr Trent Miller, Dr Megan Halliday, Assoc. Prof Paul Goldwater, Dr Mick Adams, Mr Mark Saunders, Dr Jenny Hunt, Mr Peter Waples-Crowe, Ms Francine Eades, Dr David Scrimgeour, Mr Sid Williams, Ms Cheryl Mundy, Dr Ana Herceg, Dr Liz Moore and participating sites (Appendix).
Author details
Rebecca J Guy 1
Fabian Kong 2
Jane Goller 2
Neil Franklin 1
Isabel Bergeri 2
Wayne Dimech 3
Nicole Reilly 4
Elizabeth Sullivan 4
James Ward 1
John M Kaldor 1
Margaret Hellard 2
Basil Donovan 1
1. National Centre in HIV Epidemiology and Clinical Research, University of New South Wales, Sydney, New South Wales
2. Centre for Population Health, Burnet Institute, Melbourne, Victoria
3. National Serology Reference Laboratory Australia, Melbourne, Victoria
4. Perinatal and Reproductive Epidemiology Research Unit, incorporating the National Perinatal Statistics Unit, University of New South Wales, Sydney, New South Wales
Corresponding author: Dr Rebecca Guy, National Centre in HIV Epidemiology and Clinical Research, University of New South Wales, Cliffbrook Campus, 45 Beach Street, COOGEE NSW 2031. Telephone: +61 2 9385 0978. Facsimile: +6 12 9385 0891. Email: [email protected]
References
1. Australian Government Department of Health and Ageing. National Notifiable Diseases Surveillance System data. Number of notifications of chlamydial infections, Australia, 2007 by age group and sex. Accessed on 29 February 2008. Available from: http://www1.health.gov.au/cda/Source/Rpt_5.cfm
2. Chen MY, Fairley CK, Donovan B. Nowhere near the point of diminishing returns: correlations between chlamydia testing and notification rates in New South Wales. Aust N Z J Public Health 2005;29(3):249–253.
CDI Vol 34 No 3 2010 327
Peer-reviewed articles
3. Chen MY, Karvelas M, Sundararajan V, Hocking JS, Fairley CK. Evidence for the effectiveness of a chlamydia awareness campaign: increased population rates of chlamydia testing and detection. Int J STD AIDS 2007;18(4):239–243.
4. Hocking J, Fairley C, Counahan M, Crofts N. The pattern of notification and testing for genital Chlamydia trachomatis infection in Victoria, 1998–2000: an ecological analysis. Aust N Z J Public Health 2003;27(4):405–408.
5. National Centre in HIV Epidemiology and Clinical Research. Bloodborne viral and sexually transmitted infections in Aboriginal and Torres Strait Islander People. Surveillance Report 2007. Sydney, NSW: National Centre in HIV Epidemiology and Clinical Research, The University of New South Wales; 2007.
6. Slater W, Sadler K, Cassell JA, Horner P, Low N. What can be gained from comprehensive disaggregate surveillance? The Avon Surveillance System for Sexually Transmitted Infections. Sex Transm Infect 2007;83(5):411–415.
7. Fine D, Dicker L, Mosure D, Berman S. Increasing chlamydia positivity in women screened in family planning clinics: do we know why? Sex Transm Dis 2008;35(1):47–52.
8. Centers for Disease Control and Prevention. Updated guidelines for evaluating public health surveillance systems: recommendations from the Guidelines Working Group. MMWR Recomm Rep 2001;50(RR13):1–35.
9. Australian Bureau of Statistics. Population by Age and Sex, Australian States and Territories. Canberra: Australian Bureau of Statis tics. Catalogue No: 3201.0 – A. June 2008.
10. Australian Government Department of Health and Ageing. National Sexually Transmissible Infections Strategy 2005–2008. Canberra; 2005. Accessed 6 June 2006. Available from: http://www.health.gov.au/internet/main/publishing.nsf/Content/phd-sti-strategy-cnt.htm/$FILE/sti_strategy.pdf
11. UNAIDS. Guidelines for Second Generation HIV Surveillance. Geneva: UNAIDS; 2000. Report No: WHO/CDS/CSR/EDC/2000.5.
12. Centers for Disease Control and Prevention. Guidelines for national human immunodeficiency virus case surveillance, including monitoring for human immunodeficiency virus infection and acquired immunodeficiency syndrome MMWR Recomm Rep 1999;48(RR–13):1–27, 9–31.
13. Goller J, Guy R, Gold J, et al. Establishing a linked sentinel surveillance system for BBVs and STIs, methods, system attributes and early findings. Sex Health In press.
14. Hiltunen-Back E, Haikala O, Kautiainen H, Paavonen J, Reunala T. A nationwide sentinel clinic survey of Chlamydia trachomatis infection in Finland. Sex Transm Dis 2001;28(5):252–258.
15. Giuliani M, Suligoi B, The STD Surveillance Working Group. Sentinel surveillance of sexually transmitted diseases in Italy. Euro Surveill 1998;3(6):55–58.
16. Defraye A, Sasse A. STI surveillance by a sentinel network of physicians in Belgium. Acta Clin Belg 2005;60(2):70–74.
17. Bachmann LH, Macaluso M, Hook EW 3rd. Demonstration of declining community prevalence of Chlamydia trachomatis infection using sentinel surveillance. Sexy Transm Dis 2003;30(1):20–24.
18. Jin F, Prestage GP, Zablotska I, Rawstorne P, Kippax SC, Donovan B, et al. High rates of sexually transmitted infections in HIV positive homosexual men: data from two community based cohorts. Sex Transm Infect 2007;83(5):397–399.
19. Lee DM, Binger A, Hocking J, Fairley CK. The incidence of sexually transmitted infections among frequently screened sex workers in a decriminalised and regulated system in Melbourne. Sex Transm Infect 2005;81(5):434–436.
20. Guy R, Goller J, Spelman T, El-Hayek C, Gold J, Lim M, et al. Does the frequency of HIV and STI testing among MSM in primary care adhere with Australian guidelines? Sex Transm Infect 2010. PMID: 20460263 [Epub ahead of print].
21. Huang R L , To r z i l lo PJ , Hammond VA , Coul te r ST, K i rby AC. Epidemiology of sexually transmitted infections on the Anangu Pitjantjatjara Yankunytjatjara Lands: results of a comprehensive control program. Med J Aust 2008;189(8):442–445.
22. Latif AS, Smith KS. Sexually transmitted infections in Central Australia – time for concerted action. Public Health Bulletin South Australia. 2006;4:32–34.
23. Su JY, Skov S. An assessment of the effectiveness of the Tiwi Sexual Health Program 2002–2005. Aust N Z J Public Health 2008;32(6):554–558.
328 CDI Vol 34 No 3 2010
Peer-reviewed articles
Appendix: Participating ACCESS sites
Note: some participating sites preferred not to be named in this paper
Sexual health service network
Hunter New England Sexual Health Service; NSW Sydney West Area Health Service – Clinical Sexual Health Services; NSW Illawarra Sexual Health, Wollongong; NSW Royal Prince Alfred Hospital Sexual Health, Camperdown; NSW Holden Street Clinic, Gosford; NSW Lismore/ Tweed Heads Sexual Health & AIDS Services, Lismore; NSW Northern Sydney Sexual Health Service, St Leonards; NSW Greater Southern Area Health Service; NSW Orange Sexual Health Service, Orange; NSW Kirketon Road Centre, Darlinghurst; NSW Sydney Sexual Health Centre, Sydney; NSW Short Street Sexual Health Clinic, NSW St George Hospital, St George; NSW Coffs Harbour Sexual Health Service, Coffs Harbour; NSW Grafton Sexual Health Clinic, Grafton; NSW Gold Coast Sexual Health Clinic, Miami; Qld Cairns Sexual Health Services, Cairns Base Hospital, Cairns; Qld Princess Alexandra Sexual Health, Princess Alexandra Hospital, Woolloongabba, Qld Townsville Sexual Health Service, Townsville, Qld Melbourne Sexual Health Centre, Carlton, Vic Hobart, Devonport and Launceston Sexual Health Service, Tas Fremantle Hospital, Fremantle, WA NT Sexual Health and BBV Unit, NT
Family planning clinic network
Sexual Health and Family Planning, ACT, Newcastle FPNSW Centre, Cooks Hill, NSW Family Planning NT, Coconut Grove, NT Family Planning Queensland, Toowoomba, Qld Shine SA (Sexual Health information networking and education Inc), SA Family Planning Tasmania, Hobart, Tas Family Planning Victoria, (Action Centre), Melbourne, Vic Quarry Health Centre for under 25s, Fremantle, WA
General practice clinic network
Charlestown Family Medical Services, Charlestown, NSW Midway Family Medical Centre, Denistone East, NSW Glendale Medical Centre, Glendale, NSW Young District Medical Centre, Young, NSW Brindabella Family Practice, Queanbeyan, NSW Angaston Medical Centre, Angaston, SA Genesis Medical Centre, Brighton, Vic Footscray Medical Centre, Footscray , Vic Goulburn River Group Practice, Seymour, Vic Wellness Centre Medical Clinic, Malvern East, Vic Brighton Medical Clinic, Brighton, Vic Mooroopna Medical Centre, Mooroopna, Vic Duncraig Medical Centre, Duncraig , WA AK medical/dental Clinic, Kelmscott, WA Chancellor Park Family Medical Practice, Sippy Downs, Qld Nambour Medical Centre, Nambour, Qld Eli Waters Medical Centre, Eli Waters, Qld Yeppoon Family Practice, Yeppoon , Qld Kewarra Family Practice, Kewarra Beach, Qld Turton St Medical Centre, Sunnybank, Qld O’Brien Street Practice, Adelaide, SA Davey Street Medical Centre , Hobart, Tas Newstead Medical, Launceston, Tas Duncraig Medical Centre, Duncraig, WA Brighton Medical Clinic, Brighton, Vic North Sydney Medical Practice, North Sydney, NSW Centre Clinic, St Kilda, Vic
Aboriginal community controlled health service network
Aboriginal Medical Service Western Sydney, Mount Druitt Village, NSW Durri Aboriginal Corporation Medical Service, Kempsey, NSW Victorian Aboriginal Health Service, Fitzroy, Vic Geraldton Regional Aboriginal Medical Service, Geraldton, WA Danila Dilba Health Service, Darwin, NT Carbal Medical Service, Toowoomba, Qld Goondir Health Service, Dalby, Qld
CDI Vol 34 No 3 2010 329
Peer-reviewed articles
Abstract
Eggs are frequently implicated as a source of foodborne salmonellosis. In February 2009 an investigation was commenced following reports of gastrointestinal illness among diners at a Canberra restaurant. The investigation sought to confirm the existence of an outbreak, identify a source and implement public health measures to prevent more cases. Menus and booking lists were obtained from the restaurant and a case-control study was commenced. A suspected case was defined as a person who ate at the restaurant on 13 or 14 February 2009 and subsequently developed diarrhoea and/or vomiting. Twenty cases and 31 controls were enrolled in the study. Eating a tiramisu dessert containing raw egg had a highly statistically significant association with illness (crude odds ratio 130.50, 95% confidence interval 13.54–1605.28). Among the 20 cases, nine of 12 stool samples were positive for Salmonella Typhimurium phage type 170 (STm 170). No microbiological evidence of STm 170 was obtained from the restaurant or during the egg trace-back investigation. This report highlights the risk associated with consumption of foods containing raw or undercooked shell egg. Commun Dis Intell 2010;34(3):329–333.
Keywords: Salmonella Typhimurium; disease outbreak; foodborne disease; Australia; salmonellosis
Introduction
On 20 February 2009, a general practitioner in the Australian Capital Territory notifi ed the Health Protection Service (HPS) at ACT Health of a patient with gastroenteritis. Th e case reported that they had eaten at a local restaurant and that a number of others at the same table were also ill. A laboratory-confi rmed case of salmonellosis was also notifi ed to the Communicable Disease Control Section later that same day. Th is case implicated the same restaurant as a potential source of their illness, also reporting a number of
fellow diners as being unwell. In total, 7 cases of gastroenteritis from 2 separate tables were linked to the restaurant on 13 February. Th e venue was inspected by environmental health offi cers (EHOs) on 20 February to assess kitchen hygiene standards and identify any potential sources of infection. An Acute Response Team meeting was then held and an outbreak investigation launched to confi rm that there was an outbreak associated with the restaurant, to identify the source of the illness and implement public health measures to prevent further illness.
Methods
Case-control study
A case-control study was conducted to test the hypothesis that gastrointestinal illness was associ-ated with consumption of a particular food item at the restaurant. During this study, cases were identifi ed using the following case defi nition.
Confi rmed – a person who has a laboratory-con-fi rmed case of Salmonella and ate at the restaurant on 13 or 14 February 2009.
Suspected – a person who ate at the restaurant on 13 or 14 February 2009 and developed diarrhoea (defi ned as three or more loose stools in a 24-hour period) and/or vomiting with onset of these symp-toms on or after those dates.
A structured questionnaire was developed from the menu provided by the restaurant and was used during telephone interviews with cases and controls. Th e aim of the questionnaire was to obtain information on illness symptoms, onset date and time, and consumption of specifi c food and beverage items at the restaurant. Restaurant reservation lists for 13 and 14 February 2009 were also obtained and used for case ascertainment and to recruit controls for the study.
AN OUTBREAK OF GASTROENTERITIS DUE TO SALMONELLA TYPHIMURIUM PHAGE TYPE 170 ASSOCIATED WITH CONSUMPTION OF A DESSERT CONTAINING RAW EGG Anna Reynolds, Cameron RM Moffatt, Amalie Dyda, Rebecca L Hundy, Andrew L Kaye, Radomir Krsteski, Simon Rockliff, Riemke Kampen, Paul M Kelly, Eddie D O’Brien
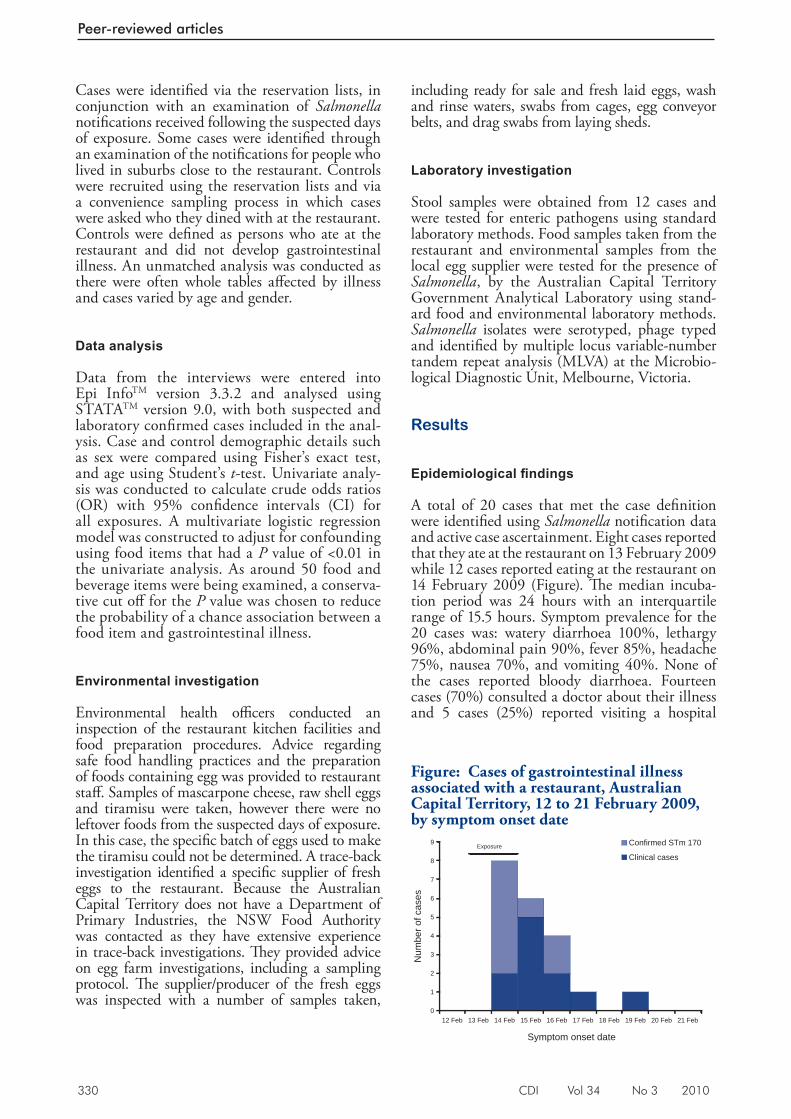
330 CDI Vol 34 No 3 2010
Peer-reviewed articles
Cases were identifi ed via the reservation lists, in conjunction with an examination of Salmonella notifi cations received following the suspected days of exposure. Some cases were identifi ed through an examination of the notifi cations for people who lived in suburbs close to the restaurant. Controls were recruited using the reservation lists and via a convenience sampling process in which cases were asked who they dined with at the restaurant. Controls were defi ned as persons who ate at the restaurant and did not develop gastrointestinal illness. An unmatched analysis was conducted as there were often whole tables aff ected by illness and cases varied by age and gender.
Data analysis
Data from the interviews were entered into Epi Info TM version 3.3.2 and analysed using STATA TM version 9.0, with both suspected and laboratory confi rmed cases included in the anal-ysis. Case and control demographic details such as sex were compared using Fisher’s exact test, and age using Student’s t -test. Univariate analy-sis was conducted to calculate crude odds ratios (OR) with 95% confi dence intervals (CI) for all exposures. A multivariate logistic regression model was constructed to adjust for confounding using food items that had a P value of <0.01 in the univariate analysis. As around 50 food and beverage items were being examined, a conserva-tive cut off for the P value was chosen to reduce the probability of a chance association between a food item and gastrointestinal illness.
Environmental investigation
Environmental health offi cers conducted an inspection of the restaurant kitchen facilities and food preparation procedures. Advice regarding safe food handling practices and the preparation of foods containing egg was provided to restaurant staff . Samples of mascarpone cheese, raw shell eggs and tiramisu were taken, however there were no leftover foods from the suspected days of exposure. In this case, the specifi c batch of eggs used to make the tiramisu could not be determined. A trace-back investigation identifi ed a specifi c supplier of fresh eggs to the restaurant. Because the Australian Capital Territory does not have a Department of Primary Industries, the NSW Food Authority was contacted as they have extensive experience in trace-back investigations. Th ey provided advice on egg farm investigations, including a sampling protocol. Th e supplier/producer of the fresh eggs was inspected with a number of samples taken,
including ready for sale and fresh laid eggs, wash and rinse waters, swabs from cages, egg conveyor belts, and drag swabs from laying sheds.
Laboratory investigation
Stool samples were obtained from 12 cases and were tested for enteric pathogens using standard laboratory methods. Food samples taken from the restaurant and environmental samples from the local egg supplier were tested for the presence of Salmonella , by the Australian Capital Territory Government Analytical Laboratory using stand-ard food and environmental laboratory methods. Salmonella isolates were serotyped, phage typed and identifi ed by multiple locus variable-number tandem repeat analysis (MLVA) at the Microbio-logical Diagnostic Unit, Melbourne, Victoria.
Results
Epidemiological fi ndings
A total of 20 cases that met the case defi nition were identifi ed using Salmonella notifi cation data and active case ascertainment. Eight cases reported that they ate at the restaurant on 13 February 2009 while 12 cases reported eating at the restaurant on 14 February 2009 (Figure). Th e median incuba-tion period was 24 hours with an interquartile range of 15.5 hours. Symptom prevalence for the 20 cases was: watery diarrhoea 100%, lethargy 96%, abdominal pain 90%, fever 85%, headache 75%, nausea 70%, and vomiting 40%. None of the cases reported bloody diarrhoea. Fourteen cases (70%) consulted a doctor about their illness and 5 cases (25%) reported visiting a hospital
Figure: Cases of gastrointestinal illness associated with a restaurant, Australian Capital Territory, 12 to 21 February 2009, by symptom onset date
0
1
2
3
4
5
6
7
8
9
12 Feb 13 Feb 14 Feb 15 Feb 16 Feb 17 Feb 18 Feb 19 Feb 20 Feb 21 Feb
Symptom onset date
Num
ber o
f cas
es
Confirmed STm 170
Clinical casesExposure
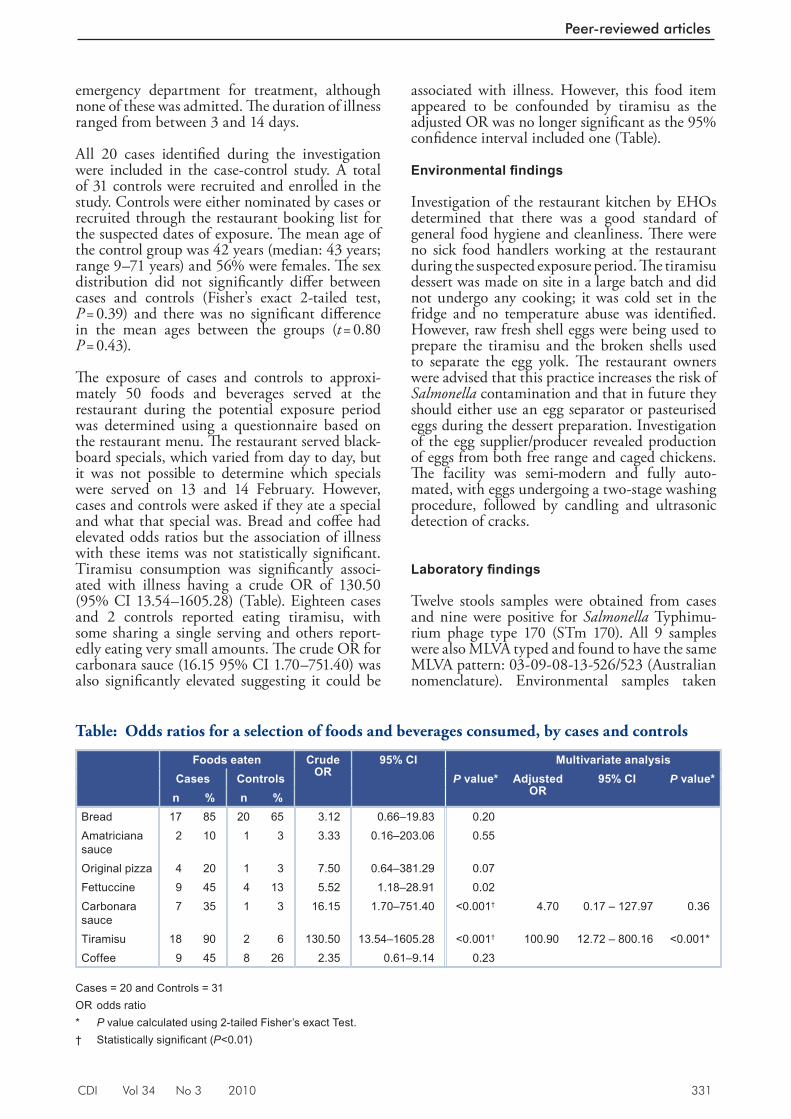
CDI Vol 34 No 3 2010 331
Peer-reviewed articles
emergency department for treatment, although none of these was admitted. Th e duration of illness ranged from between 3 and 14 days.
All 20 cases identifi ed during the investigation were included in the case-control study. A total of 31 controls were recruited and enrolled in the study. Controls were either nominated by cases or recruited through the restaurant booking list for the suspected dates of exposure. Th e mean age of the control group was 42 years (median: 43 years; range 9–71 years) and 56% were females. Th e sex distribution did not signifi cantly diff er between cases and controls (Fisher’s exact 2-tailed test, P = 0.39) and there was no signifi cant diff erence in the mean ages between the groups ( t = 0.80 P = 0.43).
Th e exposure of cases and controls to approxi-mately 50 foods and beverages served at the restaurant during the potential exposure period was determined using a questionnaire based on the restaurant menu. Th e restaurant served black-board specials, which varied from day to day, but it was not possible to determine which specials were served on 13 and 14 February. However, cases and controls were asked if they ate a special and what that special was. Bread and coff ee had elevated odds ratios but the association of illness with these items was not statistically signifi cant. Tiramisu consumption was signifi cantly associ-ated with illness having a crude OR of 130.50 (95% CI 13.54–1605.28) (Table). Eighteen cases and 2 controls reported eating tiramisu, with some sharing a single serving and others report-edly eating very small amounts. Th e crude OR for carbonara sauce (16.15 95% CI 1.70–751.40) was also signifi cantly elevated suggesting it could be
associated with illness. However, this food item appeared to be confounded by tiramisu as the adjusted OR was no longer signifi cant as the 95% confi dence interval included one (Table).
Environmental fi ndings
Investigation of the restaurant kitchen by EHOs determined that there was a good standard of general food hygiene and cleanliness. Th ere were no sick food handlers working at the restaurant during the suspected exposure period. Th e tiramisu dessert was made on site in a large batch and did not undergo any cooking; it was cold set in the fridge and no temperature abuse was identifi ed. However, raw fresh shell eggs were being used to prepare the tiramisu and the broken shells used to separate the egg yolk. Th e restaurant owners were advised that this practice increases the risk of Salmonella contamination and that in future they should either use an egg separator or pasteurised eggs during the dessert preparation. Investigation of the egg supplier/producer revealed production of eggs from both free range and caged chickens. Th e facility was semi-modern and fully auto-mated, with eggs undergoing a two-stage washing procedure, followed by candling and ultrasonic detection of cracks.
Laboratory fi ndings
Twelve stools samples were obtained from cases and nine were positive for Salmonella Typhimu-rium phage type 170 (STm 170). All 9 samples were also MLVA typed and found to have the same MLVA pattern: 03-09-08-13-526/523 (Australian nomenclature). Environmental samples taken
Table: Odds ratios for a selection of foods and beverages consumed, by cases and controls
Foods eaten Crude OR
95% CI Multivariate analysisCases Controls P value* Adjusted
OR95% CI P value*
n % n %Bread 17 85 20 65 3.12 0.66–19.83 0.20Amatriciana sauce
2 10 1 3 3.33 0.16–203.06 0.55
Original pizza 4 20 1 3 7.50 0.64–381.29 0.07Fettuccine 9 45 4 13 5.52 1.18–28.91 0.02Carbonara sauce
7 35 1 3 16.15 1.70–751.40 <0.001† 4.70 0.17 – 127.97 0.36
Tiramisu 18 90 2 6 130.50 13.54–1605.28 <0.001† 100.90 12.72 – 800.16 <0.001*Coffee 9 45 8 26 2.35 0.61–9.14 0.23
Cases = 20 and Controls = 31 OR odds ratio * P value calculated using 2-tailed Fisher’s exact Test. † Statistically signifi cant ( P <0.01)
332 CDI Vol 34 No 3 2010
Peer-reviewed articles
from the restaurant kitchen were all negative for Salmonella , including the raw shell egg samples. A drag swab collected on the supplier/producer’s premises tested positive for both Salmonella Agona and Salmonella Infantis.
Discussion
Th e results of this investigation demonstrate that this was a point source outbreak, with the epidemiological evidence supporting the hypothesis that the source of illness was tiramisu containing raw shell egg. Th e attack rate of the tiramisu was very high (18/20 cases) and the crude odds ratio associating consumption of tiramisu with illness was also high (130.50). Th e crude odds ratios for carbonara sauce (also made using raw shell egg) was also signifi cantly elevated. However, this was likely confounded by tiramisu as all of the people who ate fettuccine with carbonara sauce also ate tiramisu. In this outbreak, the tiramisu was made using raw shell eggs, with the shells used for separation of the yolks. It is therefore possible that one or more of the eggs used was contaminated with STm 170, although cross contamination from another unknown source cannot be excluded. Nevertheless, the authors consider this unlikely. Raw egg containing tiramisu has been implicated in a number of Australian outbreaks caused by various Salmonella Typhimurium phage types. 1–3 STm 170 has previously been isolated in outbreaks associated with foods containing raw or undercooked egg. 4,5 Th e initial public health action taken in response to this outbreak was to provide the restaurant with advice on methods that could reduce the risk of Salmonella transmission, such as the use of an egg separator or pasteurised eggs. In addition, the restaurant voluntarily removed the tiramisu from the menu for a short period of time.
From January 2009, the number of notifi cations of laboratory-confi rmed STm 170 began to increase signifi cantly in a number of states, including New South Wales, Queensland, Victoria and the Australian Capital Territory. Th is prompted a multi-jurisdictional outbreak investigation by OzFoodNet. While analyses of food frequencies identifi ed several foods of interest, none of the hypotheses were tested through a case-control study, due to decreasing case numbers following the declaration of the outbreak (personal communication, Katrina Knope, OzFoodNet). An MLVA profi le of the STm 170 cases in this outbreak was obtained and compared with other recent sporadic cases in the Australian Capital Territory and cases in other jurisdictions. All of the outbreak STm 170 positive cases in the Australian Capital Territory had the same MLVA pattern (03-09-08-13-526/523), suggesting a common source, and
this profi le was the predominant strain circulating in the Australian Capital Territory from January to March 2009.
During this investigation it was not possible to identify the specifi c batch of eggs used in the preparation of the tiramisu. However, the restaurant egg supplier/producer was traced and their facilities inspected for the presence of Salmonella . Th is outbreak highlighted an issue in the Australian Capital Territory regarding who has the authority to inspect food production facilities, as unlike other jurisdictions, the Australian Capital Territory does not have a Department of Primary Industries. Furthermore, inspections of any Australian Capital Territory egg supplier/producer as a direct response to a public health issue had not been previously conducted by the HPS. Th e inspection showed the egg supplier/producer had sophisticated processing facilities and no positive microbiological evidence of the presence of STm 170 was found. Th e investigators did have some diffi culty in readily accessing the facility and obtaining a full quota of samples. Th is was in part due to the fi eld investigators limited experience in egg farm investigation and also as a result of actions on behalf of the supplier/producer who initially refused access. A nationally agreed protocol for a program of auditing and investigation of primary production facilities would be useful for future outbreak investigations. Nevertheless, drag swabs taken from the fl oors of laying sheds were positive for both S. Agona and S. Infantis. Th is suggests that contamination of eggs could potentially occur at the facility and be passed on to consumers through unsafe food hygiene practices.
Th is outbreak investigation shows that despite advice from organisations such as the NSW Food Authority 6 and Food Science Australia 7 regarding the risks associated with eggs, the consumption of foods containing raw or undercooked shell egg continues to be associated with gastrointestinal illness. Th e risk of illness due to raw shell egg con-sumption must continue to be communicated to both the general public and hospitality industry. Improved communication between egg suppliers/producers and health departments, along with routine testing of egg supplier/producer facilities, could have public health benefi ts and may reduce the number of egg-related disease outbreaks.
Acknowledgements
We would like to acknowledge the following for their assistance with the investigation: staff at the Communicable Disease Control section at the Australian Capital Territory HPS, Environmental
CDI Vol 34 No 3 2010 333
Peer-reviewed articles
Health Offi cers at the Australian Capital Territory HPS; Craig Shadbolt at the NSW Food Authority; staff at the Australian Capital Territory Government Analytical Laboratory; Geoff Hogg, Mark Veitch and staff at the Microbiological Diagnostic Unit, Melbourne, Victoria; and OzFoodNet staff , Austral-ian Government Department of Health and Ageing.
Th e Master of Applied Epidemiology program is funded by the Australian Government Depart-ment of Health and Ageing. Paul Kelly’s salary is supported by the National Health and Medical Research Council.
Author details
Anna Reynolds 1,2,3
Cameron RM Moffatt 1
Amalie Dyda 1,2
Rebecca L Hundy 1
Andrew L Kaye 1
Radomir Krsteski 1
Simon Rockliff 1
Riemke Kampen 1
Paul M Kelly 4
Eddie D O’Brien 1
1. Health Protection Service, Australian Capital Territory Health, Canberra, Australian Capital Territory
2. Master of Applied Epidemiology scholar, National Centre for Epidemiology and Population Health, Australian National University, Canberra, Australian Capital Territory
3. Office of Health Protection, Australian Government Department of Health and Ageing, Canberra, Australian Capital Territory
4. National Centre for Epidemiology and Population Health, College of Medicine, Biology and Environment, Australian National University, Canberra, Australian Capital Territory
Corresponding author: Mr Cameron Mof fat t, Communicable Disease Control, Health Protection Service, Locked Bag 5, Weston Creek Australian Capital Territory 2611. Telephone: +61 2 6205 1734. Facsimile: +61 2 6205 1739. Email: [email protected]
References
1. Hall R. Outbreak of gastroenteritis due to Salmonella Typhimurium phage type 135a following consumption of raw egg. Commun Dis Intell 2002;26(2):285–287.
2. OzFoodNet: enhancing foodborne disease surveillance across Australia: quarterly report, July to September 2004. Commun Dis Intell 2004;28(4):485–488.
3. Fullerton K. Monitoring the incidence and causes of diseases potentially transmitted by food in Australia: annual report of the OzFoodNet Network, 2007. Commun Dis Intell 2008;32(4):400–424.
4. OzFoodNet quar ter ly repor t, 1 October to 31 December 2006. Commun Dis Intell 2007;31(1):128–133.
5. OzFoodNet quar ter ly repor t, 1 Januar y to 31 March 2008. Commun Dis Intel l 2008;32(2):267–271.
6. NSW Food Authority. Enjoy eggs safely factsheet. Sydnay, New South Wales. Accessed 15 April 2009. Available from: http://www.foodauthority.nsw.gov.au/_Documents/consumer_pdf/enjoy_eggs_safely.pdf
7. Food Science Australia. Salmonella in food containing raw or undercooked eggs – information for the food service industry. August 2008. Accessed on 14 April 2009. Available from: http://www.foodscience.afisc.csiro.au/issues/salmonella-eggs.htm#6
334 CDI Vol 34 No 3 2010
Peer-reviewed articles
POTENTIAL EXPOSURE TO AUSTRALIAN BAT LYSSAVIRUS IN SOUTH EAST QUEENSLAND: WHAT HAS CHANGED IN 12 YEARS? Megan K Young, Bradley J McCall
Under current guidelines, all potential exposures require treatment (post exposure prophylaxis) with rabies vaccine and usually rabies immu-noglobulin unless the bat involved is proven to be ABLV negative. 6 Th is requires that all available bats involved in potential human exposures are tested for ABLV. Detection of ABLV infection in bats requires examination of fresh brain impres-sion smears.
Considering both human and animal welfare, it is desirable that potential exposure to ABLV is minimised. Th is is the objective of ongoing public health messages aimed at the general public. 7 Peri-odic examinations of notifi cation data provide a measure of eff ect of these messages.
Th e epidemiology of potential exposure to ABLV in south east Queensland, Australia has been previously described. 4,8 Initial data showed that potential exposures were more likely to be the result of contact by people with some professional or volunteer interest in caring for bats than by members of the general public. 4 Between 1999 and 2003, the general public had a higher propor-tion of potential exposure than other groups, but absolute numbers of notifi cations had decreased. 8
As no study had been conducted since 2003, population trends in potential exposure to ABLV reported to the Brisbane Southside Public Health Unit (BSPHU), in South East Queensland, between November 1996 and October 2008 were examined.
Methods
Potential exposure to ABLV is a clinical diagnosis notifi able condition in Queensland. Enhanced surveillance of potential exposure to ABLV com-menced at the BSPHU in November 1996. Since then, BSPHU staff have collected details of all potential human exposures to ABLV through completion of a standard telephone administered questionnaire, and in accordance with national guidelines 6 and Queensland Health policy, all available bats involved in potential human exposure have been tested for ABLV infection at the local reference laboratory. Further details of
Abstract
Public health measures have been targeting poten-tial exposure to Australian bat lyssavirus (ABLV) since the first recognised human cases, more than a decade ago. The effect of these measures on the epidemiology of notifications of potential exposure has not been investigated since 2003. Trends in notifications of potential exposure to ABLV reported to the Brisbane Southside Public Health Unit between November 1996 and October 2008 were examined. During the study period notification rates declined among all population groups and potential exposures were notified more promptly. The proportion of female notifications and the proportion of notifications from volunteer bat carers and their families and professional groups decreased over time. These changes over 12 years may indicate success of public health measures, under-reporting of potential exposure or both. Intentional handling of bats by untrained members of the public continues to be an important source of potential exposure to ABLV and requires a sus-tained public health response. Commun Dis Intell 2010;34(3):334–338.
Keywords: lyssavirus, bats, Chiroptera, disease notification, Queensland, Australia
Background
Australian bat lyssavirus (ABLV) is a member of the Rhabdoviridae family, which also includes European bat lyssavirus, and rabies virus. Classic rabies virus and ABLV possess marked similarity using both serotyping and molecular sequencing. 1 Like rabies, ABLV infection is lethal to humans. Two fatal cases of human ABLV infection have been reported in Australia, one in 1996 and the second in 1998. 2,3
Bats are considered the natural host of ABLV. Natural infections have been recorded in both megachiropteran (fl ying fox) and microchirop-teran (insectivorous bat) species. 4 Th e prevalence of ABLV infection in bats has been reported as <1%–7%. 5 Th erefore, not all bat bites or scratches will result in human exposure to the virus.
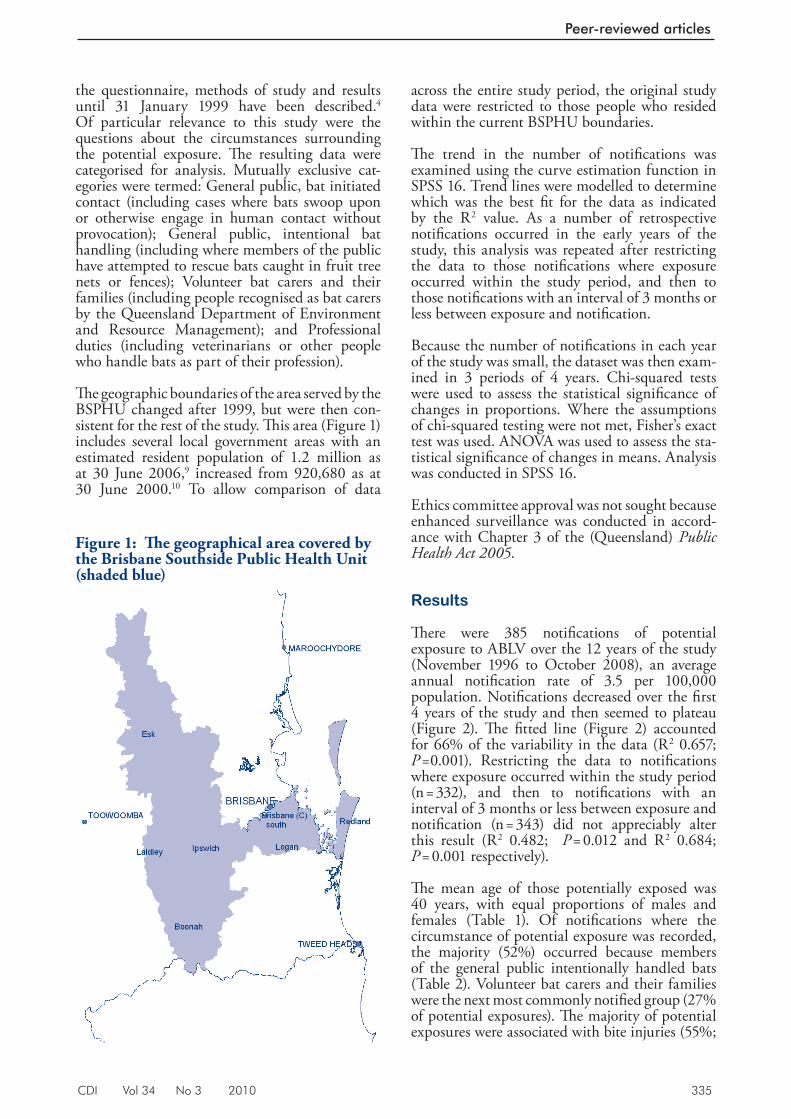
CDI Vol 34 No 3 2010 335
Peer-reviewed articles
the questionnaire, methods of study and results until 31 January 1999 have been described. 4 Of particular relevance to this study were the questions about the circumstances surrounding the potential exposure. Th e resulting data were categorised for analysis. Mutually exclusive cat-egories were termed: General public, bat initiated contact (including cases where bats swoop upon or otherwise engage in human contact without provocation); General public, intentional bat handling (including where members of the public have attempted to rescue bats caught in fruit tree nets or fences); Volunteer bat carers and their families (including people recognised as bat carers by the Queensland Department of Environment and Resource Management); and Professional duties (including veterinarians or other people who handle bats as part of their profession).
Th e geographic boundaries of the area served by the BSPHU changed after 1999, but were then con-sistent for the rest of the study. Th is area (Figure 1) includes several local government areas with an estimated resident population of 1.2 million as at 30 June 2006, 9 increased from 920,680 as at 30 June 2000. 10 To allow comparison of data
across the entire study period, the original study data were restricted to those people who resided within the current BSPHU boundaries.
Th e trend in the number of notifi cations was examined using the curve estimation function in SPSS 16. Trend lines were modelled to determine which was the best fi t for the data as indicated by the R 2 value. As a number of retrospective notifi cations occurred in the early years of the study, this analysis was repeated after restricting the data to those notifi cations where exposure occurred within the study period, and then to those notifi cations with an interval of 3 months or less between exposure and notifi cation.
Because the number of notifi cations in each year of the study was small, the dataset was then exam-ined in 3 periods of 4 years. Chi-squared tests were used to assess the statistical signifi cance of changes in proportions. Where the assumptions of chi-squared testing were not met, Fisher’s exact test was used. ANOVA was used to assess the sta-tistical signifi cance of changes in means. Analysis was conducted in SPSS 16.
Ethics committee approval was not sought because enhanced surveillance was conducted in accord-ance with Chapter 3 of the (Queensland) Public Health Act 2005 .
Results
Th ere were 385 notifi cations of potential exposure to ABLV over the 12 years of the study (November 1996 to October 2008), an average annual notifi cation rate of 3.5 per 100,000 population. Notifi cations decreased over the fi rst 4 years of the study and then seemed to plateau (Figure 2). Th e fi tted line (Figure 2) accounted for 66% of the variability in the data (R 2 0.657; P =0.001). Restricting the data to notifi cations where exposure occurred within the study period (n = 332), and then to notifi cations with an interval of 3 months or less between exposure and notifi cation (n = 343) did not appreciably alter this result (R 2 0.482; P = 0.012 and R 2 0.684; P = 0.001 respectively).
Th e mean age of those potentially exposed was 40 years, with equal proportions of males and females (Table 1). Of notifi cations where the circumstance of potential exposure was recorded, the majority (52%) occurred because members of the general public intentionally handled bats (Table 2). Volunteer bat carers and their families were the next most commonly notifi ed group (27% of potential exposures). Th e majority of potential exposures were associated with bite injuries (55%;
Figure 1: Th e geographical area covered by the Brisbane Southside Public Health Unit (shaded blue)
336 CDI Vol 34 No 3 2010
Peer-reviewed articles
n = 212). Two hundred and seventy-three notifi ca-tions (71%) received post-exposure prophylaxis, although 17 of these notifi cations did not com-plete prophylaxis as the bat tested ABLV-negative.
Th ere were 189 notifi cations of potential exposure to ABLV over the fi rst 4 years of the study (November 1996 to October 2000 – period 1), 98 notifi cations over the second 4 years (November 2000 to October 2004 – period 2) and 98 notifi cations over the last 4 years (November
2004 to October 2008 – period 3). Accounting for population growth, the average annual notifi cation rates were 5.1 per 100,000 (period 1), 2.7 per 100,000 (period 2), and 2.0 per 100,000 (period 3) ( P < 0.001). Th e mean age of those notifi ed was not diff erent across the 3 periods of study ( P = 0.09). Th ere was signifi cant diff erence in the ratio of males to females ( P = 0.018) across the periods of study, with more females being notifi ed in period 1 (58%) and more males being notifi ed in periods 2 and 3 (58% and 55%) (Table 1).
Th e interval between potential exposure and notifi -cation was signifi cantly diff erent across the periods of study, decreasing from a mean of 228 days in period 1 to a mean of 3 days in period 2 and a mean of 22 days in period 3 ( P <0.001). Of those notifi cations where the circumstance of potential exposure was recorded (n = 376), these varied sig-nifi cantly across the periods of study ( P < 0.001) (Table 2), although, in all periods, intentional bat handling by members of the general public was the most common circumstance. Both the number and the proportion of notifi cations from volunteer bat carers and their families showed the largest decline during the study (Table 2). Of female notifi cations, volunteer bat carers and their fami-lies accounted for 52% (n = 56) in period 1; 20% (n = 8) in period 2 and 30% (n = 13) in period 3. Th is was the largest decline in both numbers and proportion of female notifi cations across the study.
Table 2: Th e circumstances of potential exposure to Australian bat lyssavirus of notifi cations to the Brisbane Southside Public Health Unit
Circumstance Nov 96–Oct 00 Nov 00–Oct 04 Nov 04–Oct 08 Entire study period
% n % n % n % nGeneral public, bat initiated contact 5 9 18 17 17 16 11 42General public, intentional bat handling 43 79 64 61 59 57 52 197Volunteer bat carers and families 41 75 11 10 19 18 27 103Professional duties 12 22 7 7 5 5 9 34All circumstances 101* 185 100 95 100 96 99* 376†
* Percentages do not add to 100 due to rounding error. † Nine notifi cations did not have circumstance of exposure recorded and these have been excluded from the calculation of
percentages.
Table 1: Gender of notifi cations of potential exposure to Australian bat lyssavirus to the Brisbane Southside Public Health Unit
Gender Nov 96–Oct 00 Nov 00–Oct 04 Nov 04–Oct 08 Entire study period% n % n % n % n
Male 42 80 58 57 55 54 50 191Female 58 109 42 41 45 44 50 194Total 100 189 100 98 100 98 100 385
Figure 2: Notifi cations of potential exposure to Australian bat lyssavirus to the Brisbane Southside Public Health Unit, November 1996 to October 2008
0
10
20
30
40
50
60
70
80
90
100
Nov
96
- Oct
97
Nov
97
- Oct
98
Nov
98
- Oct
99
Nov
99
- Oct
00
Nov
00
- Oct
01
Nov
01
- Oct
02
Nov
02
- Oct
03
Nov
03
- Oct
04
Nov
04
- Oct
05
Nov
05
- Oct
06
Nov
06
- Oct
07
Nov
07
- Oct
08
Study year
Num
ber o
f not
ifica
tions
CDI Vol 34 No 3 2010 337
Peer-reviewed articles
Th ere was a similar decline in the proportion of volunteer bat carers and their families among the male notifi cations, but the decrease in numbers was not as large (period 1: 24%, n = 19; period 2: 3.6%, n = 2; period 3: 9%, n = 5).
Th e proportion of notifi cations where bats were available for testing varied signifi cantly across the study periods from 32% (n = 60) in period 1, to 51% (n = 50) in period 2, to 42% (n = 41) in period 3 ( P = 0.008). Of notifi cations where bats were available for testing, the proportion with ABLV-positive bats decreased over time (20% (n = 12) in period 1; 6% (n = 3) in period 2; nil in period 3 ( P = 0.002). A total of 6 bats tested positive over the 12 year study; four in period 1 and two in period 2. Fifteen people were exposed to ABLV-positive bats and provided with post exposure prophylaxis (in accordance with public health recommenda-tions 6 ). No new cases of human ABLV infection have been reported to date.
Discussion
Notifi cation rates signifi cantly decreased during the 12 years of enhanced surveillance, seeming to plateau in the latter part of the study. Changes in the distribution of notifi cations in various groups occurred. Notifi cations from the general public increased in proportion, but decreased in absolute numbers across the study period. Th e proportion of females notifi ed decreased across the study period.
Th ese results seem to support continuing eff ective-ness of public health messages about the importance of not handling bats. It is also possible that the observed reduction in notifi cations from the general public is due to a decline in community awareness about the risks associated with potential exposure.
Th e trend in notifi cation numbers and rates was not linear. With only 12 data points, the fi tted line gives a general picture of trend, showing that notifi cations decreased substantially over the fi rst 4 years of the study and then seemed to plateau. Th e change in notifi cation rates across the 3 periods of the study support the same conclusion. Retrospective notifi ca-tions did not infl uence this general trend.
Th e change in gender of notifi cations during the study seems related to a reduction in reporting among volunteer bat carers as this group had the largest decline in numbers and proportion of female notifi cations. Th is conclusion is also supported by the fact that the majority of carers (62/84, 74%) in the largest volunteer bat care group in south east Queensland are female (personal communica-tion R. Larkin, Department of Environment and
Resource Management, 21 April 2010). Concerns remain about the potential for under-reporting of non-bite exposures among this group.
Th e notifi cations included some retrospective potential exposures associated with publicity about human cases during period 1. In recent years, with the exception of 1 delayed report in period 3, the interval between potential exposure and reporting has remained short. Reporting from medical prac-titioners has been consistently prompt. Th e overall improvement in reporting times suggests that those people who sought medical attention for a potential exposure were aware of the importance of prompt medical assessment for a bat related injury, if not the importance of avoiding inten-tional handling. Public health messages should continue to emphasise that members of the public can be of most help to orphaned or injured bats by contacting a trained, vaccinated bat handler.
Th e decline (from period 2 to period 3) in the pro-portion of notifi cations where the bat was available for testing is important because of the resultant increase in the need for post-exposure prophylaxis, especially rabies immunoglobulin, which is in short supply. However, public health messages should continue to reinforce that people should not risk potential exposure (or further potential exposure) in order to detain a bat for testing.
Reported potential and confi rmed exposures to ABLV declined during the study. Further research is required to determine whether this is a genuine reduction in potential exposures, under-reporting, or a combination of the two. Th e plateau of noti-fi cations more recently and the lethality of the infection demand ongoing public health measures to improve and sustain public awareness of the potential for exposure to ABLV.
Acknowledgements
We thank Bruce Harrower, Public Health Virol-ogy, Forensic and Scientifi c Services, Queensland Health, Australia for reviewing the aspects of the database relating to the tested bats.
We thank the Public Health Unit staff , Brisbane Southside Public Health Unit for their commit-ment to eff ective communicable disease control including collecting enhanced surveillance data.
We thank Dr Angus Ng, Senior Lecturer in Biostatistics, Griffi th University for assisting with statistical aspects of the manuscript.
338 CDI Vol 34 No 3 2010
Peer-reviewed articles
Author details
Dr Megan K Young Dr Bradley J McCall
Public Health Medical Officer, Brisbane South Public Health Unit, Queensland Health, Meadowbrook, Queensland
Corresponding author: Dr M Young, School of Medicine, Logan Campus, Griffith University, University Drive, MEADOWBROOK QLD 4131. Telephone: +61 7 3382 1508. Facsimile: +61 7 3382 1338. Email: [email protected]
References
1. Gould AR, Hyatt AD, Lunt R, Kattenbelt JA, Hengstberger S, Blacksell SD. Characterisation of a novel lyssavirus isolated from Pteropid bats in Australia. Virus Res 1998;54(2):165–187.
2. Allworth A, Murray K, Morgan J, A human case of encephalitis due to a lyssavirus recently identified in fruit bats, Commun Dis Intell 1996;20(24):504.
3. Hanna JN, Carney IK, Smith GA, Tannenberg AE, Deverill JE, Botha JA, et al. Australian bat lyssavirus infection: a second human case, with a long incubation period. Med J Aust 2000;172(12):597–599.
4. McCall BJ, Epstein JH, Neill AS, Heel K, Field H, Barrett J, et al. Potential exposure to Australian bat lyssavirus, Queensland, 1996–1999. Emerg Infect Dis 2000;6(3):259–264.
5. Communicable Diseases Network Australia, Australian Government Department of Health and Ageing, Department of Agriculture, Fisheries and Forestry – Australia. Australian Bat Lyssavirus, Hendra Virus and Menangle Virus Information for Veterinary Practitioners . Australian Government Department of Health and Ageing; Canberra, August 2001.
6. National Health and Medical Research Council. The Australian Immunisation Handbook 9th edn. Canberra, Australia: Australian Government Depar tment of Health and Ageing; 2008; pp. 110–119.
7. Scott JG. Australian bat lyssavirus: the public health response to an emerging infection. Med J Aust 2000;172(12):573–574.
8. Young, MK, McCall BJ, Trends in potential exposure to Australian bat lyssavirus in South East Queensland, 1996 to 2003. Commun Dis Intell 2004;28(2):258–260.
9. Australian Bureau of Statistics. Population by Age and Sex, Australia 2006. Catalogue no. 3235.0. Canberra, Australia: Australian Bureau of Statistics, 2007.
10. Australian Bureau of Statistics. 2000 Estimated Resident Population by Statistical Local Area. Cat. no. 3235.3. Canberra, Australia: Australian Bureau of Statistics, 2001.
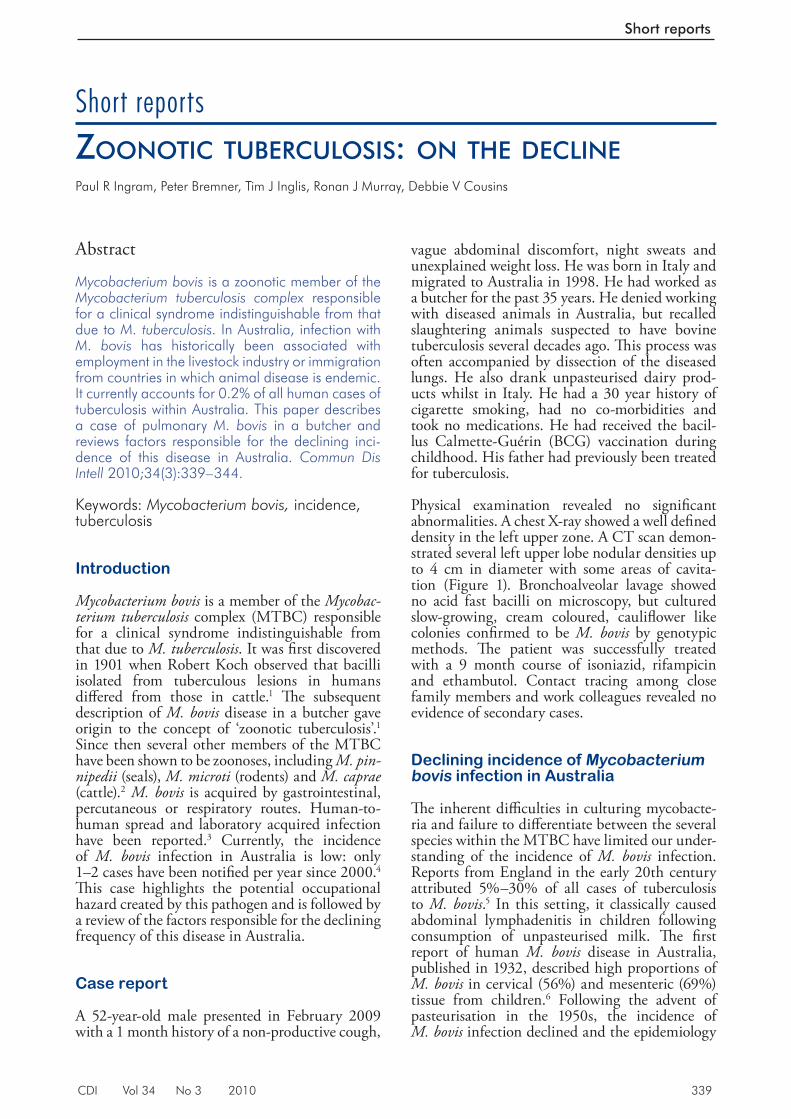
CDI Vol 34 No 3 2010 339
Short reports
Short reportsZOONOTIC TUBERCULOSIS: ON THE DECLINE Paul R Ingram, Peter Bremner, Tim J Inglis, Ronan J Murray, Debbie V Cousins
Abstract
Mycobacterium bovis is a zoonotic member of the Mycobacterium tuberculosis complex responsible for a clinical syndrome indistinguishable from that due to M. tuberculosis . In Australia, infection with M. bovis has historically been associated with employment in the livestock industry or immigration from countries in which animal disease is endemic. It currently accounts for 0.2% of all human cases of tuberculosis within Australia. This paper describes a case of pulmonary M. bovis in a butcher and reviews factors responsible for the declining inci-dence of this disease in Australia. Commun Dis Intell 2010;34(3):339–344.
Keywords: Mycobacterium bovis, incidence, tuberculosis
Introduction
Mycobacterium bovis is a member of the Mycobac-terium tuberculosis complex (MTBC) responsible for a clinical syndrome indistinguishable from that due to M. tuberculosis . It was fi rst discovered in 1901 when Robert Koch observed that bacilli isolated from tuberculous lesions in humans diff ered from those in cattle. 1 Th e subsequent description of M. bovis disease in a butcher gave origin to the concept of ‘zoonotic tuberculosis’. 1 Since then several other members of the MTBC have been shown to be zoonoses, including M. pin-nipedii (seals), M. microti (rodents) and M. caprae (cattle). 2 M. bovis is acquired by gastrointestinal, percutaneous or respiratory routes. Human-to-human spread and laboratory acquired infection have been reported. 3 Currently, the incidence of M. bovis infection in Australia is low: only 1–2 cases have been notifi ed per year since 2000. 4 Th is case highlights the potential occupational hazard created by this pathogen and is followed by a review of the factors responsible for the declining frequency of this disease in Australia.
Case report
A 52-year-old male presented in February 2009 with a 1 month history of a non-productive cough,
vague abdominal discomfort, night sweats and unexplained weight loss. He was born in Italy and migrated to Australia in 1998. He had worked as a butcher for the past 35 years. He denied working with diseased animals in Australia, but recalled slaughtering animals suspected to have bovine tuberculosis several decades ago. Th is process was often accompanied by dissection of the diseased lungs. He also drank unpasteurised dairy prod-ucts whilst in Italy. He had a 30 year history of cigarette smoking, had no co-morbidities and took no medications. He had received the bacil-lus Calmette-Guérin (BCG) vaccination during childhood. His father had previously been treated for tuberculosis.
Physical examination revealed no signifi cant abnormalities. A chest X-ray showed a well defi ned density in the left upper zone. A CT scan demon-strated several left upper lobe nodular densities up to 4 cm in diameter with some areas of cavita-tion (Figure 1). Bronchoalveolar lavage showed no acid fast bacilli on microscopy, but cultured slow-growing, cream coloured, caulifl ower like colonies confi rmed to be M. bovis by genotypic methods. Th e patient was successfully treated with a 9 month course of isoniazid, rifampicin and ethambutol. Contact tracing among close family members and work colleagues revealed no evidence of secondary cases.
Declining incidence of Mycobacterium bovis infection in Australia
Th e inherent diffi culties in culturing mycobacte-ria and failure to diff erentiate between the several species within the MTBC have limited our under-standing of the incidence of M. bovis infection. Reports from England in the early 20th century attributed 5%–30% of all cases of tuberculosis to M. bovis . 5 In this setting, it classically caused abdominal lymphadenitis in children following consumption of unpasteurised milk. Th e fi rst report of human M. bovis disease in Australia, published in 1932, described high proportions of M. bovis in cervical (56%) and mesenteric (69%) tissue from children. 6 Following the advent of pasteurisation in the 1950s, the incidence of M. bovis infection declined and the epidemiology
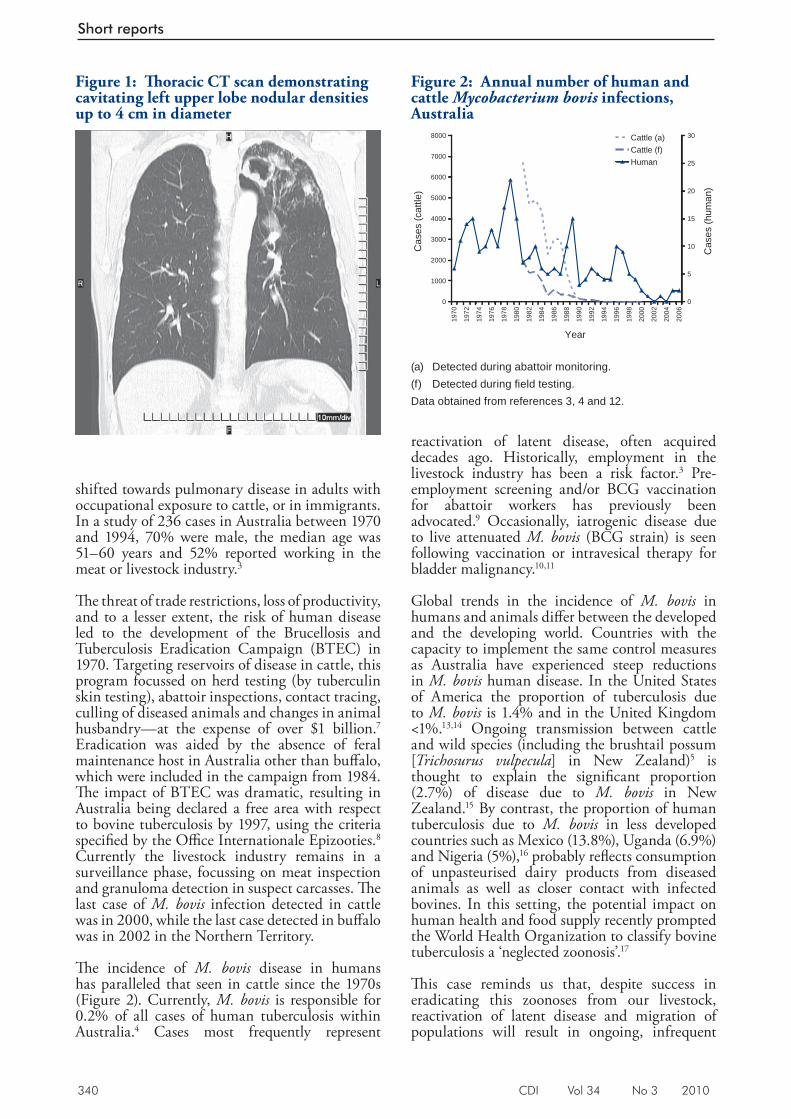
340 CDI Vol 34 No 3 2010
Short reports
shifted towards pulmonary disease in adults with occupational exposure to cattle, or in immigrants. In a study of 236 cases in Australia between 1970 and 1994, 70% were male, the median age was 51–60 years and 52% reported working in the meat or livestock industry. 3
Th e threat of trade restrictions, loss of productivity, and to a lesser extent, the risk of human disease led to the development of the Brucellosis and Tuberculosis Eradication Campaign (BTEC) in 1970. Targeting reservoirs of disease in cattle, this program focussed on herd testing (by tuberculin skin testing), abattoir inspections, contact tracing, culling of diseased animals and changes in animal husbandry—at the expense of over $1 billion. 7 Eradication was aided by the absence of feral maintenance host in Australia other than buff alo, which were included in the campaign from 1984. Th e impact of BTEC was dramatic, resulting in Australia being declared a free area with respect to bovine tuberculosis by 1997, using the criteria specifi ed by the Offi ce Internationale Epizooties. 8 Currently the livestock industry remains in a surveillance phase, focussing on meat inspection and granuloma detection in suspect carcasses. Th e last case of M. bovis infection detected in cattle was in 2000, while the last case detected in buff alo was in 2002 in the Northern Territory.
Th e incidence of M. bovis disease in humans has paralleled that seen in cattle since the 1970s (Figure 2). Currently, M. bovis is responsible for 0.2% of all cases of human tuberculosis within Australia. 4 Cases most frequently represent
reactivation of latent disease, often acquired decades ago. Historically, employment in the livestock industry has been a risk factor. 3 Pre-employment screening and/or BCG vaccination for abattoir workers has previously been advocated. 9 Occasionally, iatrogenic disease due to live attenuated M. bovis (BCG strain) is seen following vaccination or intravesical therapy for bladder malignancy. 10,11
Global trends in the incidence of M. bovis in humans and animals diff er between the developed and the developing world. Countries with the capacity to implement the same control measures as Australia have experienced steep reductions in M. bovis human disease. In the United States of America the proportion of tuberculosis due to M. bovis is 1.4% and in the United Kingdom <1%. 13,14 Ongoing transmission between cattle and wild species (including the brushtail possum [ Trichosurus vulpecula ] in New Zealand) 5 is thought to explain the signifi cant proportion (2.7%) of disease due to M. bovis in New Zealand. 15 By contrast, the proportion of human tuberculosis due to M. bovis in less developed countries such as Mexico (13.8%), Uganda (6.9%) and Nigeria (5%), 16 probably refl ects consumption of unpasteurised dairy products from diseased animals as well as closer contact with infected bovines. In this setting, the potential impact on human health and food supply recently prompted the World Health Organization to classify bovine tuberculosis a ‘neglected zoonosis’. 17
Th is case reminds us that, despite success in eradicating this zoonoses from our livestock, reactivation of latent disease and migration of populations will result in ongoing, infrequent
Figure 2: Annual number of human and cattle Mycobacterium bovis infections, Australia
0
1000
2000
3000
4000
5000
6000
7000
8000
1970
1972
1974
1976
1978
1980
1982
1984
1986
1988
1990
1992
1994
1996
1998
2000
2002
2004
2006
Year
Cas
es (c
attle
)
0
5
10
15
20
25
30
Cas
es (h
uman
)
Cattle (a)Cattle (f)Human
(a) Detected during abattoir monitoring. (f) Detected during fi eld testing. Data obtained from references 3, 4 and 12.
Figure 1: Th oracic CT scan demonstrating cavitating left upper lobe nodular densities up to 4 cm in diameter
CDI Vol 34 No 3 2010 341
Short reports
M. bovis human disease in Australia. Vigilant surveillance and species level identifi cation, applied to both sides of the animal-human interface, remain important control measures for this pathogen.
Author details
Paul R Ingram 1
Peter Bremner 2
Tim J Inglis 1
Ronan J Murray 1
Debbie V Cousins 3
1. Division of Microbiology and Infectious Diseases, PathWest Laboratory, Sir Charles Gairdner Hospital, Western Australia
2. Respiratory Physician, St. John of God HealthCare, Subiaco, Western Australia
3. Director Australian Reference Laboratory for Bovine Tuberculosis, Department of Agriculture and Food, Western Australia
Corresponding author: Dr Paul R Ingram, Microbiology Registrar, Division of Microbiology and Infectious Diseases, PathWest Laboratory, 2nd Floor K Block, Sir Charles Gairdner Hospital, PERTH WA 6009. Telephone: +61 8 9346 3122. Facsimile: +61 8 9346 8046. Email: [email protected]
References
1. Schmiedel A. Development and present state of bovine tuberculosis in man. Bull Int Union Tuberc 1968;40:5–32.
2. Animal Health Australia. Bovine Tuberculosis Case Response Manual, 2007. Primary Industries Ministerial Council, Canberra, ACT; 2007.
3. Cousins DV, Dawson DJ. Tuberculosis due to Mycobacterium bovis in the Australian population: cases recorded during 1970–1994. Int J Tuberc Lung Dis 1999;3(8):715–721.
4. Australian Government Department of Health and Ageing. Tuberculosis notifications in Australia annual reports. Available from: http://www.health.gov.au/internet/main/publishing.nsf/Content/cda-pubs-annlrpt-tbannrep.htm
5. Cousins DV. Mycobacterium bovis infection and control in domestic livestock. Rev Sci Tech 2001;20(1):71–85.
6. Webster R. Tuberculosis in childhood: the incidence of bovine infection in Victoria. Med J Aust 1932;1:315–320.
7. Radunz B. Surveillance and risk management during the latter stages of eradication: experiences from Australia. Vet Microbiol 2006;112(2–4):283–290.
8. McCormick B. StockGuard Cattle: Strategic Assessment– Bovine Tuberculosis. Western Australia Department of Agriculture; 2001 Available from: http://www.agric.wa.gov.au/objtwr/imported_assets/content/pw/ah/dis/cat/bovine_tuberculosis.pdf
9. Rober t s J L , Cousins DV, Mat thews WR, McCormack BS, Radunz BL, Tolson JW. Australia—a free area for bovine tuberculosis. Proceedings of the XX World Association for Buiatrics Congress; 21–25 July 1998; Sydney, Australia.
10. Robinson P, Morris D, Antic R. Mycobacterium bovis as an occupational hazard in abattoir workers. Aust N Z J Med 1988;18(5):701–703.
11. Nuttall JJ, Davies MA, Hussey GD, Eley BS. Bacillus Calmette-Guérin (BCG) vaccine-induced complications in children treated with highly active antiretroviral therapy. Int J Infect Dis 2008;12(6):e99–e105.
12. Coscas R, Arlet JB, Belhomme D, Fabiani JN, Pouchot J. Multiple mycotic aneurysms due to Mycobacterium bovis af ter intravesical bacillus Calmette-Guérin therapy. J Vasc Surg 2009;50(5):1185–1190.
13. Hlavsa MC, Moonan PK, Cowan LS, Navin T, Kammerer JS, Morlock GP, et al. Human tuberculosis due to Mycobacterium bovis in the United States, 1995–2005. Clin Infect Dis 2008;47(2):168–175.
14. Evans JT, Smith EG, Banerjee A, Smith RM, Dale J, Innes JA, et al. Cluster of human tuberculosis caused by Mycobacterium bovis: evidence for person-to-person transmission in the UK. Lancet 2007;369(9569):1270–1276.
15. Baker MG, Lopez LD, Cannon MC, De Lisle GW, Collins DM. Continuing Mycobacterium b o v i s t r a n s m i s s i o n f r o m a n i m a l s t o humans in New Zealand. Epidemiol Infect 2006;134(5):1068–1073.
16. Michel AL, Müller B, van Helden PD. Mycobacterium bovis at the animal-human interface: a problem or not? Vet Microbiol 2010;140(3–4):371–381.
17. World Health Organization. The Control of Neglected Zoonotic Diseases. WHO/SDE/FOS/2006.1. Report of a Joint WHO/DFID-AHP Meeting with the participation of FAO and OIE. Geneva, 20 and 21 September 2005. Available from: ht tp://www.who.int/zoonoses/Repor t_Sept06.pdf
342 CDI Vol 34 No 3 2010
Short reports
PENICILLIN-RESISTANT NEISSERIA MENINGITIDIS BACTERAEMIA, KIMBERLEY REGION, MARCH 2010 Shivanti D Abeysuriya, David J Speers, Jackie Gardiner, Ronan J Murray
0.012 mg/L (susceptible) and chloramphenicol, 1 mg/L (susceptible). Th e isolate was beta-lactamase negative by nitrocefi n testing.
Th e isolate was referred to the National Neisseria Network Reference Laboratory, Prince of Wales Hospital, New South Wales for confi rmatory susceptibility testing. Th e identifi cation of the organism was confi rmed and susceptibility testing for benzylpenicillin was performed using two alternative methods (Calibrated Dichotomous Susceptibility (CDS) disc testing and MIC determination using agar dilution and CLSI breakpoints). Th ere was no zone to the Pen0.5u disc by the CDS method, indicating resistance, which was confi rmed by the MIC method and demonstrated a benzylpenicillin MIC of 1.0 μg/mL (resistant).
Genosubtyping of the N. meningitidis isolate was performed by por A gene variable region (VR) 1 and 2 DNA sequencing as previously described. 2 When the deduced amino acid sequences of VR1 and VR2 were submitted to the N. meningitidis por A VR database (http://neisseria.org/nm/typing/pora), there were only partial matches to VR1 peptides 5–29 (56%) and 21–14 (60%) and VR2 peptides 2–39 (67%) and 16–107 (46%). When compared to a Western Australian database of 81 N. meningitidis isolates strains (including 7 from the Kimberley) collected from 2000–2006 3 this genosubtype had not previously been identifi ed.
Discussion
Highly resistant (benzylpenicillin MIC > 256 mg/L), beta-lactamase producing N. meningitidis isolates have been sporadically reported from Canada, South Africa, and Spain. 4 However, beta-lactamase-negative N. meningitidis strains with increased benzylpenicillin MICs of > 0.06 mg/L have been isolated more commonly from the United Kingdom, Europe, Greece, South America, South Africa, Asia and the United States of America (USA). Th ese relatively resistant N. meningitidis isolates have penicillin MICs ranging from 0.01 mg/L to 1 mg/L. 4 Reduced susceptibility in these isolates is due to decreased binding of benzylpencillin due to altered penicillin- binding proteins (PBP2 and PBP3). 4
Abstract
A 4-year-old fully immunised male presented to a regional hospital in the West Kimberley with fever and lethargy. Blood cultures yielded serogroup B Neisseria meningitidis, resistant to benzylpenicillin (minimum inhibitory concentration (MIC) 1.0 mg/L). The patient was treated with intravenous ceftriaxone and made a complete recovery. Although invasive N. meningitidis isolates with reduced penicillin susceptibility are not uncommon in Australia, this is the first report of a benzylpenicillin-resistant isolate (MIC > 0.5 mg/L) causing invasive disease. As benzylpenicillin is currently recommended as first line empiric and definitive therapy for invasive meningococcal disease, the emergence of penicillin-resistant N. meningitidis disease is of concern and emphasises the importance of ongoing surveillance for antimicrobial resistance. Commun Dis Intell 2010;34(3):324–326.
Keywords: Neisseria meningitidis; penicillin resistant; meningococcus; meningococcal disease
Case report
A 4-year-old fully immunised male presented to a regional hospital in the West Kimberley with fever and lethargy. On examination, he was febrile (T = 39.4°C), tachycardic (pulse rate 160 bpm) and tachypnoeic (respiratory rate 26 per minute), however there was no rash or signs of meningism. Blood cultures yielded serogroup B Neisseria meningitidis . Th e patient was treated with intravenous ceftriaxone 900 mg for 5 days and made a complete recovery. A lumbar puncture performed 72 hours after commencing ceftriaxone was negative for N. meningitidis on culture and by polymerase chain reaction.
Antimicrobial susceptibility testing was performed in the routine microbiology laboratory by Etest® (AB Biodisk, Solna, Sweden) and results interpreted according to Clinical Laboratory Standards Institute (CLSI) breakpoints. 1 Etest® minimum inhibitory concentration (MIC) results were as follows: benzylpenicillin, 0.5 mg/L (resistant); ceftriaxone, 0.004 mg/L (susceptible); ciprofl oxacin, 0.006 mg/L (susceptible); rifampicin
CDI Vol 34 No 3 2010 343
Short reports
In 2008, 108 of 149 (72%) invasive N. men-ingitidis isolates submitted to the Australian National Neisseria Network demonstrated reduced susceptibility to benzylpenicillin (MICs 0.06–0.5 mg/L). 5 To date, this is the fi rst report of an invasive N. meningitidis isolate with a benzylpenicillin MIC > 0.5 mg/L from Australia (personal communication, John Tapsall, National Neisseria Network Reference Laboratory).
Th e clinical signifi cance of reduced penicillin susceptibility in N. meningitidis is unclear. Treat-ment failures and higher rates of complications have been observed, although administration of higher doses of penicillin has been reported as clinically eff ective. 4,6,7,8 Several reports indicate that there is no association between invasive meningococcal disease with decreased suscepti-bility to penicillin and mortality. 6,8 Current Australian guidelines recommend benzylpenicil-lin for the treatment of proven meningococcal meningitis, irrespective of penicillin suscepti-bility. 9 Current USA recommendations for the treatment of bacterial meningitis 10 recommend therapy with third-generation cephalosporins (ceftriaxone or cefotaxime) for meningococcal meningitis until susceptibilities are available, and recommends penicillin or ampicillin for N. meningitidis isolates with penicillin MICs of <0.1 mg/L and third-generation cephalosporins for isolates with MICs of 0.1–1.0 mg/L. 10,11
Decreased susceptibility to benzylpenicillin in invasive N. meningitidis isolates is now common in Australia, 5 but fortunately benzylpencillin resistance appears to be rare. Th is report highlights the importance of culture and susceptibility testing in invasive meningococcal disease, and of ongoing national surveillance for antimicrobial resistance in N. meningitidis.
Acknowledgements
Confi rmatory susceptibility testing was performed at National Neisseria Network Reference Laboratory, Prince of Wales Hospital, New South Wales
Penicillin susceptibility data on Australian isolates of N. meningitidis was kindly provided by Professor John Tapsall, Prince of Wales Hospital, New South Wales.
Author details
Dr Shivanti D Abeysuriya, 1 Microbiology Registrar Dr David J Speers, 1,2,3 Infectious Diseases Physician and Clinical Microbiologist Dr Jackie Gardiner, 5 Paediatric Registrar Dr Ronan J Murray, 1,2,4 Infectious Diseases Physician and Clinical Microbiologist
1. Department of Microbiology, PathWest Laboratory Medicine, Queen Elizabeth II Medical Centre, Nedlands, Western Australia
2. Department of Infectious Diseases, Sir Charles Gairdner Hospital, QEII Medical Centre, Nedlands Western Australia
3. Clinical Senior Lecturer, School of Medicine and Clinical Pharmacology, University of Western Australia, Nedlands Western Australia
4. Clinical Associate Professor, School of Pathology and Laboratory Medicine and School of Biomedical, Biomolecular and Chemical Sciences, University of Western Australia, Crawley Western Australia
5. Derby Regional Hospital, Derby, Western Australia
Corresponding author: Dr Shivanti Abeysuriya, Microbiology Registrar, PathWest Laboratory Medicine WA, Queen Elizabeth Medical Centre, Locked Bag 2009, NEDLANDS 6909 WA. Telephone: +61 8 9346 3122. Facsimile: +61 8 9346 3960. Email: [email protected] or [email protected]
References
1. Cl in ical Laborator y S tandards Ins t i tu te. Per formance s tandards for ant imicrobial susceptibility testing. Twentieth Informational Supplement (CLSI) M100-S20. 2010;30(1):101.
2. Jelfs J, Munro R, Wedege E, Caugant DA. Sequence variation in the por A gene for a clone of Neisseria meningitidis during epidemic spread. Clin Diagn Lab Immunol 2000;7(3):390–395.
3. Pereira L, Harnett G, Chidlow G, Speers D. Prevalence of genosubtypes (porA types ) of invasive meningococcal disease in Western Australia from 2000 to 2006. Pathology 2008;40(7):728–729.
4. Janda WM, Gaydos CA. Neisseria. In: Murray PR, Baron EJ, JH Hoergensen JH, Landry ML, Pfaller MA, eds. Manual of Clinical Microbiology. Washington: ASM press; 2007 pp. 601–620.
344 CDI Vol 34 No 3 2010
Short reports
5. Aus t ra l ian Meningococcal Sur ve i l lance Programme. Annual report of the Australian Meningococcal Surveillance Programme, 2008. Commun Dis Intell 2009;33(3):259–267.
6. Plessis M, Gottberg A, Cohen C, Gouveia L, Klugman K. Neisseia meningitidis intermediately resistant to penicillin and causing invasive disease in South Africa in 2001–2005. J Clin Microbiol 2008;46(10):3208–3214.
7. Hedberg ST, Fredlund H, Nicholas P, Caugant DA, Olcen P, Unemo M. Antibiotic susceptibility and characteristics of Neisseria meningitidis isolates from the African meningitis belt, 2000 to 2006: phenotypic and genotypic perspectives. Antimicrob Agents Chemother 2009;53(4):1561–1566.
8. Brown EM, Fisman DN, Drews SJ, Dolman S, Rawte P, Brown S, et al. Epidemiology of invasive meningococcal disease with decreased susceptibility to penicillin in Ontario, Canada 2000 to 2006. Antimicrob Agents Chemother 2010;54(3):1016–1021.
9. Antibiotic Writing Group. Central nervous system infections. Therapeutic guidelines – Antibiotic. 2006; version 13: pp 55–68.
10. Tunkel AR, Hartman BJ, Kaplan SL, Kaufman BA, Roos KL, Sceld WM, et al. Practice guidelines for the management of bacterial meningitis. Clin Infect Dis 2004;39(9):1267–1284.
11. Apicel la MA . Neisser ia meningi t idis. In: Mandell GL, Bennett JE, Dolin R eds. Mandell, Douglas and Bennett’s. Principles and Practice of Infectious Disease. Elsevier Churchill Livingstone 2010; pp. 2737–2752.
CDI Vol 34 No 3 2010 345
OzFoodNet Quarterly reports
Quarterly reports OZFOODNET QUARTERLY REPORT, 1 APRIL TO 30 JUNE 2010 The OzFoodNet Working Group
Introduction
Th e Australian Government Department of Health and Ageing established OzFoodNet in 2000 to collaborate nationally to investigate foodborne disease. OzFoodNet conducts studies on the burden of illness, coordinates national investigations into outbreaks of foodborne disease, develops nationally standardised protocols and tools for surveillance, identifi es foods or com-modities that may cause human illness and trains people to investigate foodborne illness. Th is quar-terly report documents investigation of outbreaks of gastrointestinal illness and clusters of disease potentially related to food, occurring in Australia from 1 April to 30 June 2010.
Data were received from OzFoodNet epidemi-ologists in all Australian states and territories. Th e data in this report are provisional and subject to change, as the results of outbreak investigations can take months to fi nalise.
During the 2nd quarter of 2010, OzFoodNet sites reported 391 outbreaks of enteric illness, including those transmitted by contaminated food. Outbreaks of gastroenteritis are often not reported to health agencies or the reports may be delayed, meaning that these fi gures under-represent the true burden of enteric illness. In total, these outbreaks aff ected 7,275 people, of whom 154 were hospitalised. Th ere were 24 deaths reported during these outbreaks. Th e majority of outbreaks (84%, n=327) were due to person-to-person transmission (Table 1).
Foodborne and suspected foodborne disease outbreaks
Th ere were 35 outbreaks during this quarter where consumption of contaminated food was suspected or confi rmed as the primary mode of transmission (Table 2). Th ese outbreaks aff ected 771 people and resulted in 58 hospitalisations. Th ere were 8 deaths reported during these outbreaks. Th is compares with 27 foodborne outbreaks for the 2nd quarter in 2009 1 and the 5-year average of 27 between 2005 and 2009, and 45 foodborne outbreaks during the 1st quarter of 2010. 2
Salmonella was the aetiological agent for 10 out-breaks during this quarter, with S. Typhimurium being the most common serotype (n=8). Of the remaining 25 outbreaks, four were due to noro-virus, two each due to Clostridium perfringens , Listeria monocytogenes and Campylobacter , and one due to Cyclospora . For 14 outbreaks, the aetiologi-cal agent was unknown or not specifi ed.
Sixteen outbreaks (46%) reported in this quarter were associated with food prepared in restaurants, six (17%) with aged care facilities, fi ve (14%) with takeaway food outlets, and two (6%) from within the community. Single outbreaks (3%) were asso-ciated with a bakery, a camp, a cruise, a national franchised fast food outlet, a training facility and a commercial caterer.
To investigate these outbreaks, sites conducted 7 cohort studies, 2 case control studies and col-lected descriptive case series data for 23 investiga-tions. Individual patient data were not collected for 3 outbreaks. As evidence for the implicated food vehicle, investigators obtained both microbiologi-cal and analytic evidence for 3 outbreaks, relied on microbiological evidence in 5 outbreaks and analytical evidence alone for 1 outbreak. Descrip-tive evidence alone was obtained in 26 outbreaks.
Th e following jurisdictional summaries describe key outbreaks and public health actions that occurred in this quarter.
OzFoodNet
Table 1: Mode of transmission for outbreaks and clusters of gastrointestinal illness reported by OzFoodNet, 1 April to 30 June 2010
Transmission mode Number of outbreaks
Percentage of total
Foodborne and suspected foodborne
35 9
Person-to-person 327 84Unknown (Salmonella cluster)
8 2
Unknown 21 5Total 391 100
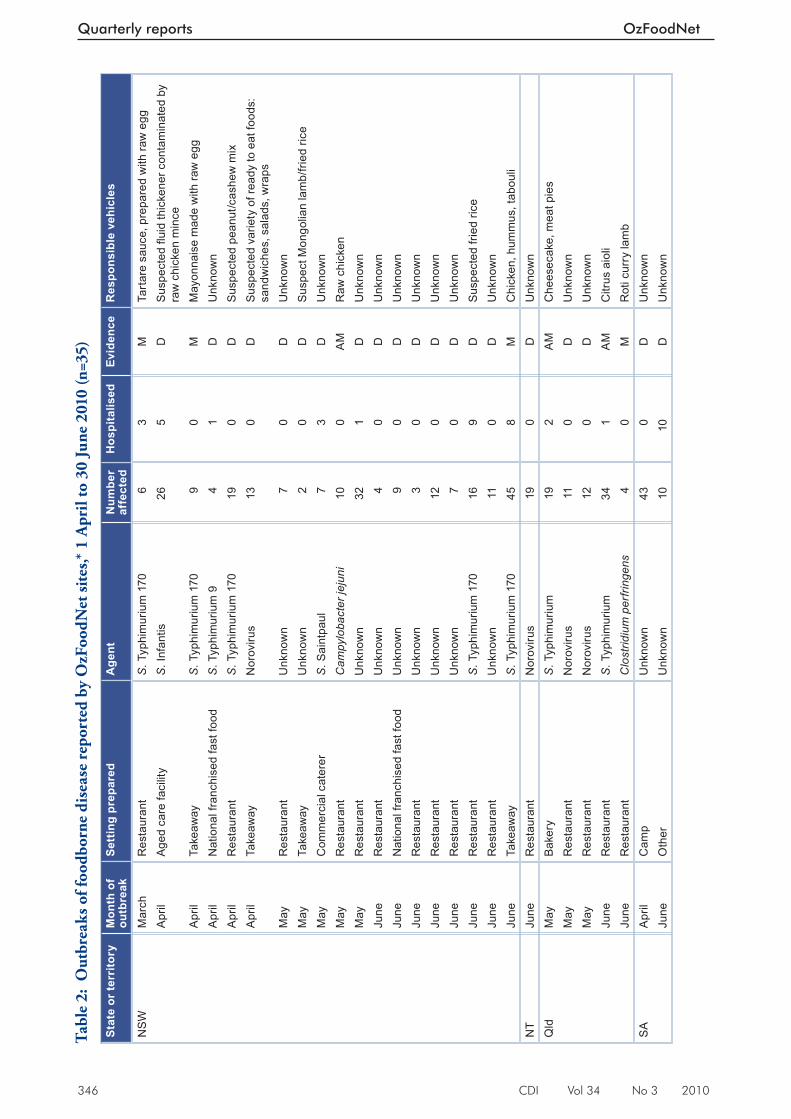
346 CDI Vol 34 No 3 2010
Quarterly reports OzFoodNet
Tabl
e 2:
Out
brea
ks o
f foo
dbor
ne d
isea
se r
epor
ted
by O
zFoo
dNet
site
s,* 1
Apr
il to
30
June
201
0 (n
=35)
Stat
e or
terr
itory
Mon
th o
f ou
tbre
akSe
ttin
g pr
epar
edA
gent
Num
ber
affe
cted
Hos
pita
lised
Evid
ence
Res
pons
ible
veh
icle
s
NS
WM
arch
Res
taur
ant
S. T
yphi
mur
ium
170
63
MTa
rtar
e sa
uce,
pre
pare
d w
ith ra
w e
ggA
pril
Age
d ca
re fa
cilit
yS
. Inf
antis
26
5D
Sus
pect
ed fl
uid
thic
kene
r con
tam
inat
ed b
y ra
w c
hick
en m
ince
Apr
ilTa
keaw
ayS
. Typ
him
uriu
m 1
709
0M
May
onna
ise
mad
e w
ith ra
w e
ggA
pril
Nat
iona
l fra
nchi
sed
fast
food
S. T
yphi
mur
ium
94
1D
Unk
now
nA
pril
Res
taur
ant
S. T
yphi
mur
ium
170
190
DS
uspe
cted
pea
nut/c
ashe
w m
ixA
pril
Take
away
Nor
oviru
s13
0D
Sus
pect
ed v
arie
ty o
f rea
dy to
eat
food
s:
sand
wic
hes,
sal
ads,
wra
psM
ayR
esta
uran
tU
nkno
wn
70
DU
nkno
wn
May
Take
away
Unk
now
n2
0D
Sus
pect
Mon
golia
n la
mb/
fried
rice
May
Com
mer
cial
cat
erer
S. S
aint
paul
73
DU
nkno
wn
May
Res
taur
ant
Cam
pylo
bact
er je
juni
100
AM
Raw
chi
cken
May
Res
taur
ant
Unk
now
n32
1D
Unk
now
nJu
neR
esta
uran
tU
nkno
wn
40
DU
nkno
wn
June
Nat
iona
l fra
nchi
sed
fast
food
Unk
now
n9
0D
Unk
now
nJu
neR
esta
uran
tU
nkno
wn
30
DU
nkno
wn
June
Res
taur
ant
Unk
now
n12
0D
Unk
now
nJu
neR
esta
uran
tU
nkno
wn
70
DU
nkno
wn
June
Res
taur
ant
S. T
yphi
mur
ium
170
169
DS
uspe
cted
frie
d ric
eJu
neR
esta
uran
tU
nkno
wn
110
DU
nkno
wn
June
Take
away
S. T
yphi
mur
ium
170
458
MC
hick
en, h
umm
us, t
abou
liN
TJu
neR
esta
uran
tN
orov
irus
190
DU
nkno
wn
Qld
May
Bak
ery
S. T
yphi
mur
ium
192
AM
Che
esec
ake,
mea
t pie
sM
ayR
esta
uran
tN
orov
irus
110
DU
nkno
wn
May
Res
taur
ant
Nor
oviru
s12
0D
Unk
now
nJu
neR
esta
uran
tS
. Typ
him
uriu
m34
1A
MC
itrus
aio
liJu
neR
esta
uran
tC
lost
ridiu
m p
erfri
ngen
s4
0M
Rot
i cur
ry la
mb
SA
Apr
ilC
amp
Unk
now
n43
0D
Unk
now
nJu
neO
ther
Unk
now
n10
10D
Unk
now
n
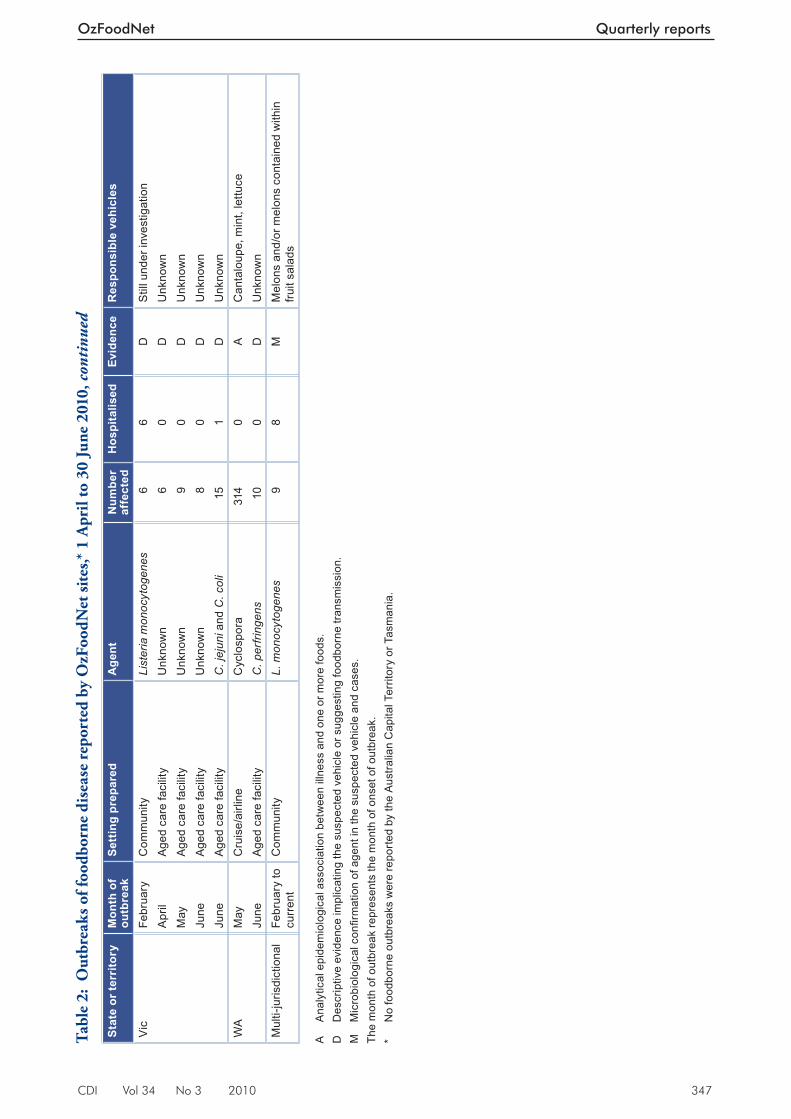
CDI Vol 34 No 3 2010 347
OzFoodNet Quarterly reports
Stat
e or
terr
itory
Mon
th o
f ou
tbre
akSe
ttin
g pr
epar
edA
gent
Num
ber
affe
cted
Hos
pita
lised
Evid
ence
Res
pons
ible
veh
icle
s
Vic
Febr
uary
Com
mun
ityLi
ster
ia m
onoc
ytog
enes
66
DS
till u
nder
inve
stig
atio
nA
pril
Age
d ca
re fa
cilit
yU
nkno
wn
60
DU
nkno
wn
May
Age
d ca
re fa
cilit
yU
nkno
wn
90
DU
nkno
wn
June
Age
d ca
re fa
cilit
yU
nkno
wn
80
DU
nkno
wn
June
Age
d ca
re fa
cilit
yC
. jej
uni a
nd C
. col
i15
1D
Unk
now
nW
AM
ayC
ruis
e/ai
rline
Cyc
losp
ora
314
0A
Can
talo
upe,
min
t, le
ttuce
June
Age
d ca
re fa
cilit
yC
. per
fring
ens
100
DU
nkno
wn
Mul
ti-ju
risdi
ctio
nal
Febr
uary
to
curr
ent
Com
mun
ityL.
mon
ocyt
ogen
es9
8M
Mel
ons
and/
or m
elon
s co
ntai
ned
with
in
fruit
sala
ds A
A
naly
tical
epi
dem
iolo
gica
l ass
ocia
tion
betw
een
illne
ss a
nd o
ne o
r mor
e fo
ods.
D
Des
crip
tive
evid
ence
impl
icat
ing
the
susp
ecte
d ve
hicl
e or
sug
gest
ing
food
born
e tra
nsm
issi
on.
M
Mic
robi
olog
ical
confi r
mat
ion
of a
gent
in th
e su
spec
ted
vehi
cle
and
case
s. Th
e m
onth
of o
utbr
eak
repr
esen
ts th
e m
onth
of o
nset
of o
utbr
eak.
* N
o fo
odbo
rne
outb
reak
s w
ere
repo
rted
by th
e A
ustra
lian
Cap
ital T
errit
ory
or T
asm
ania
.
Tabl
e 2:
Out
brea
ks o
f foo
dbor
ne d
isea
se r
epor
ted
by O
zFoo
dNet
site
s,* 1
Apr
il to
30
June
201
0, c
onti
nued
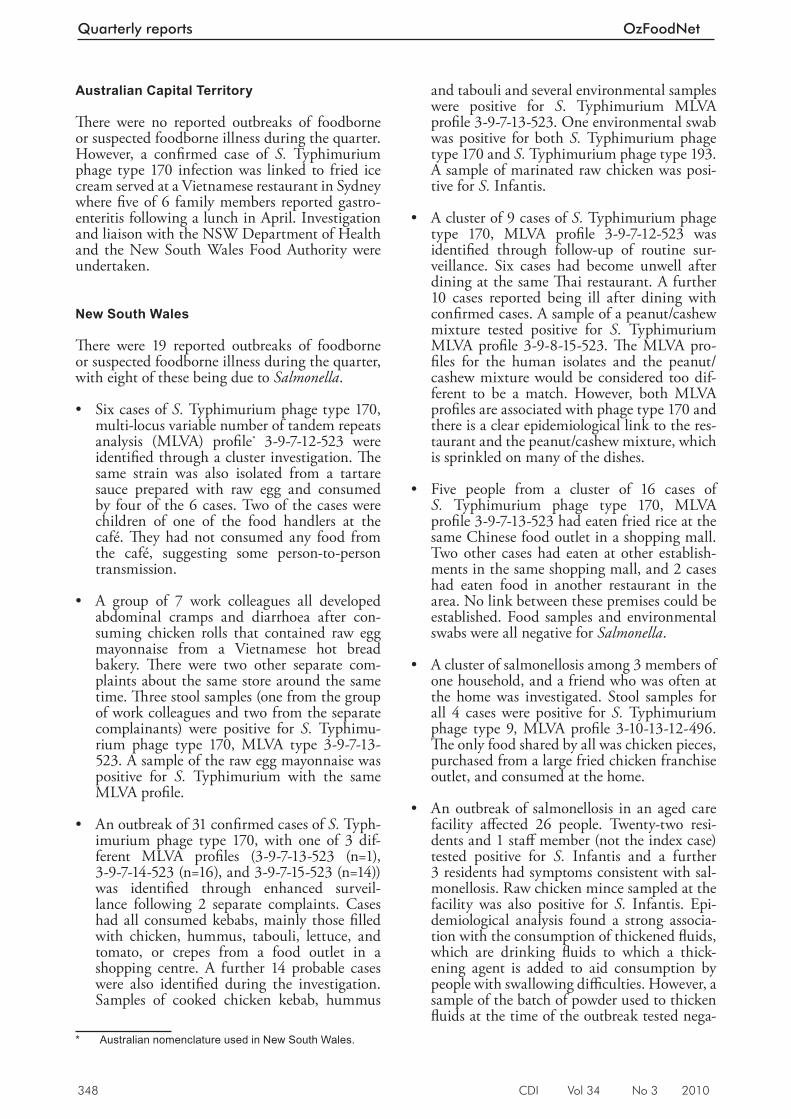
348 CDI Vol 34 No 3 2010
Quarterly reports OzFoodNet
Australian Capital Territory
Th ere were no reported outbreaks of foodborne or suspected foodborne illness during the quarter. However, a confi rmed case of S. Typhimurium phage type 170 infection was linked to fried ice cream served at a Vietnamese restaurant in Sydney where fi ve of 6 family members reported gastro-enteritis following a lunch in April. Investigation and liaison with the NSW Department of Health and the New South Wales Food Authority were undertaken.
New South Wales
Th ere were 19 reported outbreaks of foodborne or suspected foodborne illness during the quarter, with eight of these being due to Salmonella .
• Six cases of S. Typhimurium phage type 170, multi-locus variable number of tandem repeats analysis (MLVA) profi le* 3-9-7-12-523 were identifi ed through a cluster investigation. Th e same strain was also isolated from a tartare sauce prepared with raw egg and consumed by four of the 6 cases. Two of the cases were children of one of the food handlers at the café. Th ey had not consumed any food from the café, suggesting some person-to-person transmission.
• A group of 7 work colleagues all developed abdominal cramps and diarrhoea after con-suming chicken rolls that contained raw egg mayonnaise from a Vietnamese hot bread bakery. Th ere were two other separate com-plaints about the same store around the same time. Th ree stool samples (one from the group of work colleagues and two from the separate complainants) were positive for S. Typhimu-rium phage type 170, MLVA type 3-9-7-13-523. A sample of the raw egg mayonnaise was positive for S. Typhimurium with the same MLVA profi le.
• An outbreak of 31 confi rmed cases of S. Typh-imurium phage type 170, with one of 3 dif-ferent MLVA profi les (3-9-7-13-523 (n=1), 3-9-7-14-523 (n=16), and 3-9-7-15-523 (n=14)) was identifi ed through enhanced surveil-lance following 2 separate complaints. Cases had all consumed kebabs, mainly those fi lled with chicken, hummus, tabouli, lettuce, and tomato, or crepes from a food outlet in a shopping centre. A further 14 probable cases were also identifi ed during the investigation. Samples of cooked chicken kebab, hummus
* Australian nomenclature used in New South Wales.
and tabouli and several environmental samples were positive for S. Typhimurium MLVA profi le 3-9-7-13-523. One environmental swab was positive for both S. Typhimurium phage type 170 and S. Typhimurium phage type 193. A sample of marinated raw chicken was posi-tive for S. Infantis.
• A cluster of 9 cases of S. Typhimurium phage type 170, MLVA profi le 3-9-7-12-523 was identifi ed through follow-up of routine sur-veillance. Six cases had become unwell after dining at the same Th ai restaurant. A further 10 cases reported being ill after dining with confi rmed cases. A sample of a peanut/cashew mixture tested positive for S. Typhimurium MLVA profi le 3-9-8-15-523. Th e MLVA pro-fi les for the human isolates and the peanut/cashew mixture would be considered too dif-ferent to be a match. However, both MLVA profi les are associated with phage type 170 and there is a clear epidemiological link to the res-taurant and the peanut/cashew mixture, which is sprinkled on many of the dishes.
• Five people from a cluster of 16 cases of S. Typhimurium phage type 170, MLVA profi le 3-9-7-13-523 had eaten fried rice at the same Chinese food outlet in a shopping mall. Two other cases had eaten at other establish-ments in the same shopping mall, and 2 cases had eaten food in another restaurant in the area. No link between these premises could be established. Food samples and environmental swabs were all negative for Salmonella.
• A cluster of salmonellosis among 3 members of one household, and a friend who was often at the home was investigated. Stool samples for all 4 cases were positive for S. Typhimurium phage type 9, MLVA profi le 3-10-13-12-496. Th e only food shared by all was chicken pieces, purchased from a large fried chicken franchise outlet, and consumed at the home.
• An outbreak of salmonellosis in an aged care facility aff ected 26 people. Twenty-two resi-dents and 1 staff member (not the index case) tested positive for S. Infantis and a further 3 residents had symptoms consistent with sal-monellosis. Raw chicken mince sampled at the facility was also positive for S. Infantis. Epi-demiological analysis found a strong associa-tion with the consumption of thickened fl uids, which are drinking fl uids to which a thick-ening agent is added to aid consumption by people with swallowing diffi culties. However, a sample of the batch of powder used to thicken fl uids at the time of the outbreak tested nega-
CDI Vol 34 No 3 2010 349
OzFoodNet Quarterly reports
tive for any pathogens. Cross contamination from the chicken mince to the thickened fl uid powder is suspected.
• Seven cases of S. Saintpaul were associated with consumption of salmon steak and pumpkin couscous salad served with a lemon aioli pre-pared with a commercially manufactured may-onnaise at a winery during a food and wine festival in the Hunter vineyards. Investigations were unable to identify how the contamina-tion occurred or what ingredient was the cause of the outbreak. No environmental or food samples were taken.
Th e other foodborne investigations included an investigation of Campylobacter jejuni associ-ated with the consumption of chicken aff ecting 10 people from a group of 16 who shared a buff et meal at a restaurant. Th e only 2 submitted stool specimens were both positive for Campylobacter , which was also detected in a sample of raw chicken. Epidemiological analysis showed a signifi cant association between illness and consumption of the chicken curry (attack rate of 91%, relative risk undefi ned, P = 0.004). Further typing to establish a genetic similarity between the human and food isolates was not possible as the human specimens had been discarded.
A norovirus outbreak aff ecting 13 people in a workplace was found to be associated with com-mercially pre-prepared ready-to-eat foods. Th e symptoms profi le was consistent with norovirus, with the pathogen detected in 1 stool specimen. Th e New South Wales Food Authority conducted an environmental investigation of the premises and identifi ed at least 1 food handler who was symptomatic with gastroenteritis whilst working during the exposure period. Th e New South Wales Food Authority is considering further action.
Th ere were a further 9 reports of suspected food-borne outbreaks during the quarter that were of unknown aetiology. One outbreak aff ected 26 of 60 people attending a wedding, and a further 6 secondary cases who became ill one incubation period (24–48 hours) later. It is suspected that the outbreak was caused by a viral pathogen, most likely norovirus, but it was not possible to ascertain the type of food that was the likely source, nor whether the outbreak was a result of the consumption of food contaminated by a food handler or by an environmental source. Another 6 outbreaks occurred in restaurant settings aff ect-ing 44 people, 1 outbreak was associated with a takeaway outlet aff ecting 2 people, and 1 outbreak was associated with a national fast food outlet aff ecting 9 people.
Northern Territory
Th ere was 1 reported outbreak of foodborne or suspected foodborne illness during the quarter. Th is outbreak occurred amongst 2 diff erent groups of attendees at a hotel restaurant who had eaten from a common menu on the same day. Food was prepared at the hotel. A cohort study was performed but did not identify a particular food vehicle. Of the 19 people aff ected, 1 faecal specimen was tested and was positive for norovi-rus. It is thought that wide-spread contamination of food or the environment at the functions could have occurred from a food handler, a staff member or an attendee of the function.
Queensland
Th ere were 5 reported outbreaks of foodborne or suspected foodborne illness during the quarter. Four females aged between 27 and 41 years became ill with diarrhoea and abdominal cramps following the consumption of lamb curry at a restaurant in June. C. perfringens was cultured in a sample of lamb curry and in 2 faecal specimens. Cooking large volumes in conjunction with tem-perature abuse of food were identifi ed as major contributing factors following the environmental health inspection.
An outbreak of 19 cases of S. Typhimurium was identifi ed among residents in South East Queensland in May. Eighteen of the 19 cases of S. Typhimurium had the same MLVA profi le † (1-1-8-2-9) and 1 case had a closely related MLVA profi le (1-1-9-2-9). A large proportion of cases had reported consuming pies and/or cheesecake from the same bakery franchise within 5 days prior to illness. Extensive environmental sampling was conducted at both the individual franchise store level and a central manufacturing facility but the outbreak strain was not detected in any samples. However, another strain of S. Typhimurium (MLVA profi le: 1-13-19-2-3) was detected from an egg wash sample. Egg wash, used for glazing pies, was supplied to franchises by the central manu-facturing facility. It was concluded that multiple food vehicles were associated with the outbreak and that eggs were the likely source of infection.
A public health unit was alerted to a suspected foodborne outbreak among guests who had attended a wedding function in early June. A retrospective cohort study was conducted with 34 cases of gastroenteritis identifi ed among 77 guests interviewed. Twelve of the 34 cases had faecal samples positive for S. Typhimurium
† Lindstedt nomenclature used in Queensland.
350 CDI Vol 34 No 3 2010
Quarterly reports OzFoodNet
(MLVA profi le 1-5-5-2-3). Th e epidemiological study found that guests who had consumed a barramundi meal served with a citrus aioli sauce were signifi cantly more likely to develop illness compared with persons who had not eaten this meal (RR 4.1, 95% confi dence interval (CI) 1.9 to 8.8). Th e same strain of S. Typhimurium was isolated from a sample of citrus aioli taken from the restaurant kitchen and whole egg samples were positive for S. Anatum, S . Mbandaka and S . Montevideo. Th e investigation identifi ed that there was no heat treatment of the aioli sauce after the addition of raw egg yolk to the mixture. A traceback investigation sourced the eggs to a single egg producer, where several serotypes of Salmonella were detected from sheds and whole cage eggs, including the outbreak strain. A con-sumer level recall of cage eggs produced by the implicated farm was conducted based on these fi ndings and the detection of multiple cartons of cage eggs at the farm and at retail level that con-tained eggs that appeared visibly contaminated with faecal matter. Th e function venue changed to using a commercially produced aioli. Th e egg producer, with the guidance of Safe Food Production Queensland, undertook reforms to their processes to enable the business to meet the Queensland Food Safety Scheme for Eggs and Egg Products.
Following the outbreak described above, commu-nity-acquired cases of the outbreak strain ( S . Typh-imurium MLVA profi le 1-5-5-2-3) and cases of S. Montevideo, S. Anatum, S. Mbandaka and S . Tennessee notifi ed prior to the consumer level recall date were investigated for possible exposure to eggs from the implicated farm. Eleven cases of S. Typhimurium MLVA profi le 1-5-5-2-3 who did not attend the wedding, 2 cases of S. Montevideo and 1 case of S. Tennessee were notifi ed from 1 June 2010. Of these, 4 cases of S. Typhimurium and 1 S. Montevideo case were epidemiologically linked to food businesses known to have been sup-plied eggs from the implicated farm.
Two outbreaks of norovirus genotype II were investigated. Th e 1st aff ected 11 people among 2 separate groups that consumed a meal at a café on diff erent nights in the same week in May. Staff , including 2 waitresses and a chef, also fell ill but their onsets were reportedly on the same night as the patrons. Th e 2nd outbreak aff ected 8 patrons who attended a restaurant in May and 4 staff members. Both outbreaks were suspected viral foodborne outbreaks with person-to-food-to-person transmission, with 1 faecal specimen collected in each outbreak, both of which were positive for norovirus genotype II.
South Australia
Th ere were 2 reported outbreaks of foodborne or suspected foodborne illness during the quarter.
In the 1st outbreak, 43 of 90 attendees reported illness during a church camp held on the Anzac Day long weekend. A cohort study was conducted using an on-line study tool to investigate the cause of the illness. Th e investigation identifi ed rice as the likely food vehicle due to biological plausibil-ity and high attack rate (68.2%). However, an odds ratio could not be calculated as all attendees consumed this food. No left over food was avail-able for testing.
In the 2nd outbreak, 10 of 40 trainers experienced vomiting illness within a very short time frame (20 minutes) after consuming food at a training facility. In addition to 40 trainers, there were 100 trainees at the training facility, however no trainees reported illness. Trainers and trainees did not consume the same foods. A case series was conducted to investigate the illness. Th e epide-miological and laboratory investigations did not identify an infectious cause of the illness.
Tasmania
Th ere were no reported outbreaks of foodborne or suspected foodborne illness during the quarter.
Victoria
Th ere were 5 reported outbreaks of foodborne or suspected foodborne illness during the quarter.
Four outbreaks occurred in aged care facilities, three of which had no food source identifi ed:
• Six residents all had an onset of diarrhoea on the same day. Two faecal specimens were col-lected and one had C. perfringens enterotoxin isolated.
• Eight residents all had an onset of diarrhoea or abdominal pain on the same day, and 1 staff member had an onset the following day. Dura-tion of illness and symptoms were consistent with C. perfringens infection but all 3 faecal specimens collected were negative for bacterial and viral pathogens.
• Five residents and 3 staff members all had onsets of diarrhoea on the same day. Two faecal specimens were collected and were negative for
CDI Vol 34 No 3 2010 351
OzFoodNet Quarterly reports
bacterial and viral pathogens, but clustered onsets, symptoms and duration were consist-ent with C. perfringens.
• Th irteen residents and 2 staff members had onsets of diarrhoea occurring over a 5-day period. Ten residents submitted faecal speci-mens and 3 residents were confi rmed with C. jejuni and three were confi rmed with C. coli. Th e cause of this outbreak was unable to be determined however, it was suspected that the outbreak was either caused by under-cooking of roast meats or through cross contamination of ready-to-eat foods during preparation.
One outbreak of listeriosis was reported with 6 cases with ages ranging from 55 to 86 years. All case isolates shared the same molecular serogroup, binary gene type (BT) and pulsed fi eld gel elec-trophoresis (PFGE) pattern (molecular serogroup: 1a, BT: 155 and University of Melbourne Micro-biological Diagnostic Unit (MDU) designated PFGE: 6:6:6A). Five of the cases spent part of their incubation period as inpatients or outpatients at the same hospital. Potential sources for this cluster are still under investigation at the time of writing this report.
Western Australia
Th ere were 2 reported outbreaks of foodborne or suspected foodborne illness during the quarter.
An outbreak caused by Cyclospora aff ected passen-gers and crew on 2 successive cruises of the same ship that departed from and returned to Western Australia in May and June 2010, and visited South East Asian destinations. Follow-up of laboratory confi rmed cases and passenger enquiries identifi ed 34 ill passengers associated with the 1st cruise, with 26 of these cases laboratory confi rmed. From the 2nd cruise, 232 passengers and 48 crew members were reported to be aff ected, with 46 passengers and 1 crew member laboratory confi rmed cases. Th e duration of illness ranged from 1 to 33 days, with a median of 6.5 days. Th e most common symptom for confi rmed cases was diarrhoea, which was reported by 45 of the 47 cases for whom symptom information was recorded.
A case-control study was conducted among crew members, with questions focusing on fresh produce and water consumed on board, and on shore visits. Th ere were 31 cases and 97 controls recruited into the study. Of the 117 exposure variables included in univariate analysis, nine were signifi cant at a P value of < 0.01, with lettuce having the strongest association with illness (OR = 5.49, 95% CI 1.73–14.1, P = 0.0005). Drinking water on board was not
associated with illness. Variables with P values < 0.1 (25 variables) were included in a backward stepwise logistic regression analysis. Eating in a speciality dining area, eating cantaloupe, mint and lettuce were signifi cant in the logistic regression model ( P < 0.05). It was concluded that illness was most likely related to eating fresh produce items taken on board during the 1st cruise, but the case-control study did not provide enough evidence to defi ni-tively determine which fresh produce item was the likely cause of illness.
In June, nine of 135 residents and 1 staff member of an aged care facility became ill with diarrhoea, with onset of illness over a 4-day period. Th e duration of diarrhoea for most cases was 2 days or less. Th e staff member was also ill with vomit-ing. Of the 9 ill residents, six consumed vitamised food. Two of 5 stool specimens tested positive for C. perfringens , with indistinguishable PFGE pro-fi les, suggesting that infection had come from a common source, suspected to be a common food. Food was prepared on site. Th ere were no remain-ing food samples from the period prior to onset of illness, and more recent food samples were negative for common bacterial pathogens and C. perfringens . An environmental investigation found satisfactory food handling practices and hand hygiene standards.
Multi-jurisdictional outbreak investigation
Listeriosis
OzFoodNet commenced a multi-jurisdictional outbreak investigation of listeriosis in May 2010 after notifi cations exceeded expected levels in the 1st quarter of 2010, with 12 cases per month com-pared with a 3-year average of 5.8 notifi cations per month. Increases were most apparent in New South Wales and Victoria (Figure).
Jurisdictions requested characterisation of all human isolates from cases notifi ed in 2010. Nine cases met the outbreak case defi nition for a confi rmed case: four from Victoria, two from Queensland and three from New South Wales. Seven of these were infected with a particular subtype (molecular serogroup: 1/2b, BT: 158, MDU designated PFGE: 121:119:1 with indistinguishable ribotype and mul-tilocus sequence typing (MLST)), and two with a 2nd outbreak strain (molecular serogroup: not established, BT: 158 and MDU designated PFGE: 122:4N:1). Dates of onset were between 2 Febru-ary and 23 May 2010 (n = 7), while the onset dates for the other 2 cases were unknown, but specimen dates for these cases were in April and May. Th ese strains have not previously been known to have been isolated from human cases in Australia.
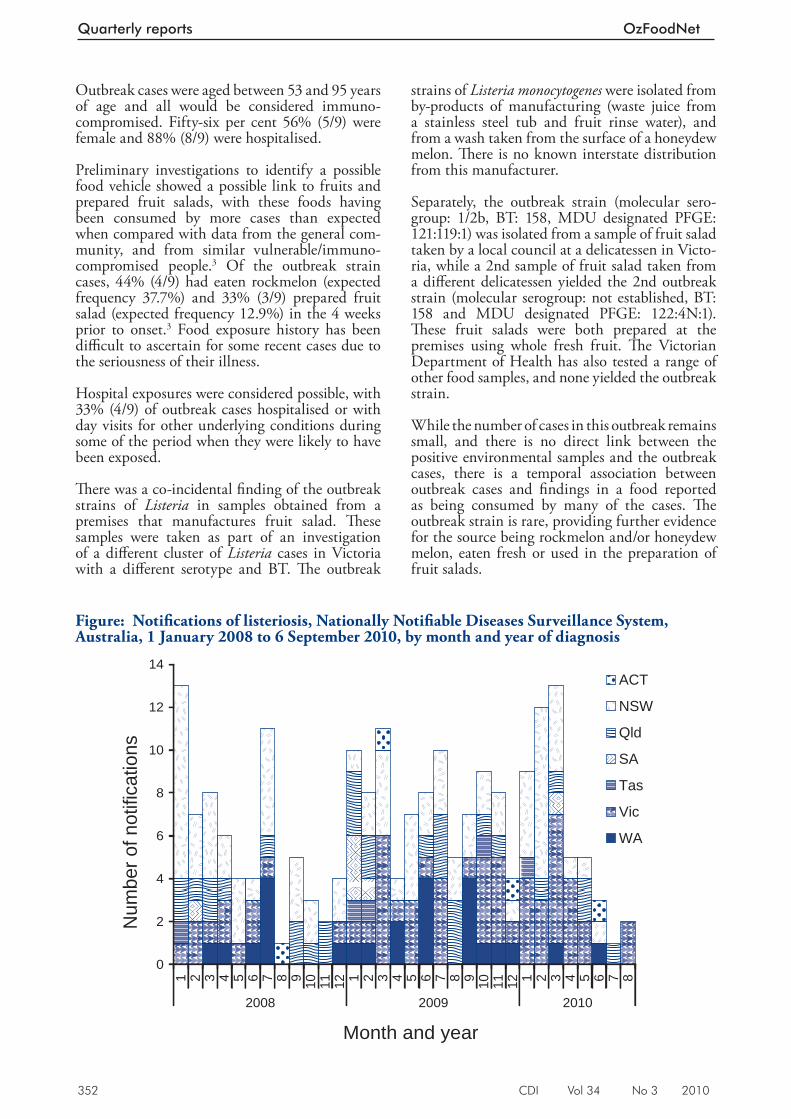
352 CDI Vol 34 No 3 2010
Quarterly reports OzFoodNet
Outbreak cases were aged between 53 and 95 years of age and all would be considered immuno-compromised. Fifty-six per cent 56% (5/9) were female and 88% (8/9) were hospitalised.
Preliminary investigations to identify a possible food vehicle showed a possible link to fruits and prepared fruit salads, with these foods having been consumed by more cases than expected when compared with data from the general com-munity, and from similar vulnerable/immuno-compromised people. 3 Of the outbreak strain cases, 44% (4/9) had eaten rockmelon (expected frequency 37.7%) and 33% (3/9) prepared fruit salad (expected frequency 12.9%) in the 4 weeks prior to onset. 3 Food exposure history has been diffi cult to ascertain for some recent cases due to the seriousness of their illness.
Hospital exposures were considered possible, with 33% (4/9) of outbreak cases hospitalised or with day visits for other underlying conditions during some of the period when they were likely to have been exposed.
Th ere was a co-incidental fi nding of the outbreak strains of Listeria in samples obtained from a premises that manufactures fruit salad. Th ese samples were taken as part of an investigation of a diff erent cluster of Listeria cases in Victoria with a diff erent serotype and BT. Th e outbreak
strains of Listeria monocytogenes were isolated from by-products of manufacturing (waste juice from a stainless steel tub and fruit rinse water), and from a wash taken from the surface of a honeydew melon. Th ere is no known interstate distribution from this manufacturer.
Separately, the outbreak strain (molecular sero-group: 1/2b, BT: 158, MDU designated PFGE: 121:119:1) was isolated from a sample of fruit salad taken by a local council at a delicatessen in Victo-ria, while a 2nd sample of fruit salad taken from a diff erent delicatessen yielded the 2nd outbreak strain (molecular serogroup: not established, BT: 158 and MDU designated PFGE: 122:4N:1). Th ese fruit salads were both prepared at the premises using whole fresh fruit. Th e Victorian Department of Health has also tested a range of other food samples, and none yielded the outbreak strain.
While the number of cases in this outbreak remains small, and there is no direct link between the positive environmental samples and the outbreak cases, there is a temporal association between outbreak cases and fi ndings in a food reported as being consumed by many of the cases. Th e outbreak strain is rare, providing further evidence for the source being rockmelon and/or honeydew melon, eaten fresh or used in the preparation of fruit salads.
Figure: Notifi cations of listeriosis, Nationally Notifi able Diseases Surveillance System, Australia, 1 January 2008 to 6 September 2010, by month and year of diagnosis
ACT
NSW
Qld
SA
Tas
Vic
WA
0
2
4
6
8
10
12
14
1 2 3 4 5 6 7 8 9 10 11 12 1 2 3 4 5 6 7 8 9 10 11 12 1 2 3 4 5 6 7 8
2008 2009 2010
Month and year
Num
ber o
f not
ifica
tions
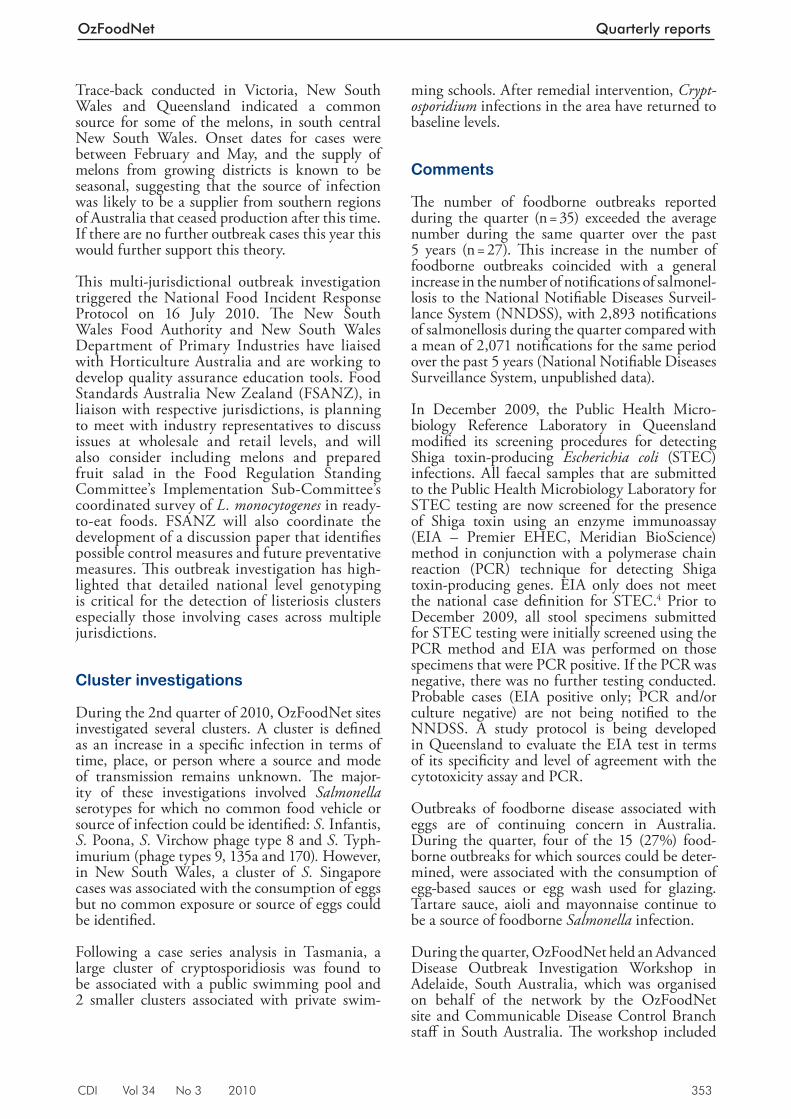
CDI Vol 34 No 3 2010 353
OzFoodNet Quarterly reports
Trace-back conducted in Victoria, New South Wales and Queensland indicated a common source for some of the melons, in south central New South Wales. Onset dates for cases were between February and May, and the supply of melons from growing districts is known to be seasonal, suggesting that the source of infection was likely to be a supplier from southern regions of Australia that ceased production after this time. If there are no further outbreak cases this year this would further support this theory.
Th is multi-jurisdictional outbreak investigation triggered the National Food Incident Response Protocol on 16 July 2010. Th e New South Wales Food Authority and New South Wales Department of Primary Industries have liaised with Horticulture Australia and are working to develop quality assurance education tools. Food Standards Australia New Zealand (FSANZ), in liaison with respective jurisdictions, is planning to meet with industry representatives to discuss issues at wholesale and retail levels, and will also consider including melons and prepared fruit salad in the Food Regulation Standing Committee’s Implementation Sub-Committee’s coordinated survey of L. monocytogenes in ready-to-eat foods. FSANZ will also coordinate the development of a discussion paper that identifi es possible control measures and future preventative measures. Th is outbreak investigation has high-lighted that detailed national level genotyping is critical for the detection of listeriosis clusters especially those involving cases across multiple jurisdictions.
Cluster investigations
During the 2nd quarter of 2010, OzFoodNet sites investigated several clusters. A cluster is defi ned as an increase in a specifi c infection in terms of time, place, or person where a source and mode of transmission remains unknown. Th e major-ity of these investigations involved Salmonella serotypes for which no common food vehicle or source of infection could be identifi ed: S. Infantis, S. Poona, S. Virchow phage type 8 and S. Typh-imurium (phage types 9, 135a and 170) . However, in New South Wales, a cluster of S. Singapore cases was associated with the consumption of eggs but no common exposure or source of eggs could be identifi ed.
Following a case series analysis in Tasmania, a large cluster of cryptosporidiosis was found to be associated with a public swimming pool and 2 smaller clusters associated with private swim-
ming schools. After remedial intervention, Crypt-osporidium infections in the area have returned to baseline levels.
Comments
Th e number of foodborne outbreaks reported during the quarter (n = 35) exceeded the average number during the same quarter over the past 5 years (n = 27). Th is increase in the number of foodborne outbreaks coincided with a general increase in the number of notifi cations of salmonel-losis to the National Notifi able Diseases Surveil-lance System (NNDSS), with 2,893 notifi cations of salmonellosis during the quarter compared with a mean of 2,071 notifi cations for the same period over the past 5 years (National Notifi able Diseases Surveillance System, unpublished data).
In December 2009, the Public Health Micro-biology Reference Laboratory in Queensland modifi ed its screening procedures for detecting Shiga toxin-producing Escherichia coli (STEC) infections. All faecal samples that are submitted to the Public Health Microbiology Laboratory for STEC testing are now screened for the presence of Shiga toxin using an enzyme immunoassay (EIA – Premier EHEC, Meridian BioScience) method in conjunction with a polymerase chain reaction (PCR) technique for detecting Shiga toxin-producing genes. EIA only does not meet the national case defi nition for STEC. 4 Prior to December 2009, all stool specimens submitted for STEC testing were initially screened using the PCR method and EIA was performed on those specimens that were PCR positive. If the PCR was negative, there was no further testing conducted. Probable cases (EIA positive only; PCR and/or culture negative) are not being notifi ed to the NNDSS. A study protocol is being developed in Queensland to evaluate the EIA test in terms of its specifi city and level of agreement with the cytotoxicity assay and PCR.
Outbreaks of foodborne disease associated with eggs are of continuing concern in Australia. During the quarter, four of the 15 (27%) food-borne outbreaks for which sources could be deter-mined, were associated with the consumption of egg-based sauces or egg wash used for glazing. Tartare sauce, aioli and mayonnaise continue to be a source of foodborne Salmonella infection.
During the quarter, OzFoodNet held an Advanced Disease Outbreak Investigation Workshop in Adelaide, South Australia, which was organised on behalf of the network by the OzFoodNet site and Communicable Disease Control Branch staff in South Australia. Th e workshop included
354 CDI Vol 34 No 3 2010
Quarterly reports OzFoodNet
presentations by invited speakers from the Centers for Disease Control and Prevention, United States of America and Taranaki Public Health Service, New Zealand. Th e 2-day workshop covered the early stages of an outbreak investigation, descrip-tive analysis, analytical studies, risk assessment, environmental factors, novel vehicles of infection, laboratory issues including pathogen typing to improve outbreak detection and investigation, communication and media issues, and multi-jurisdictional outbreak investigations.
A limitation of the outbreak data provided by OzFoodNet sites for this report was the potential for variation in categorisation of the features of outbreaks depending on circumstances and inves-tigator interpretation. Changes in the number of foodborne outbreaks reported should be inter-preted with caution due to the small number each quarter.
Acknowledgements
OzFoodNet thanks the investigators in the public health units and state and territory departments of health, as well as public health laboratories and local government environmental health offi cers who provided data used in this report. We would also like to thank laboratories conducting serotyping, molecular typing and phage typing of Salmonella and other pathogens for their continuing work during this quarter.
OzFoodNet contributors to this report include (in alphabetical order) : Robert Bell (Qld), Amy Bright (DoHA), Barry Combs (WA), Amalie Dyda (SA), Neil Franklin (NSW), Robyn Gibbs (WA), Joy Gregory (Vic), Michelle Harlock (NT), Cherie Heilbronn (Hunter New England), Katina Kardamanidis (NSW), Martyn Kirk (DoHA),
Katrina Knope (DoHA), Karin Lalor (Vic), Char-lotte McKercher (Tas), Cameron Moff att (ACT), Sally Munnoch (Hunter New England), Nevada Pingault (WA), Jane Raupach (SA), Frances Sheehan (Qld), and Russell Staff ord (Qld).
Author details
Correspondence: Ms Robyn Leader, OzFoodNet Project Officer, Office of Health Protection, Australian Government Department of Health and Ageing, GPO Box 9848, MDP 14, CANBERRA ACT 2601. Telephone: +61 2 6289 2750. Facsimile: +61 2 6289 2500. Email: [email protected]
References
1. OzFoodNet Working Group. OzFoodNet quarterly report, 1 April to 30 June 2009. Commun Dis Intell 2009;33(3)341–347.
2. OzFoodNet Working Group. OzFoodNet quarterly report, 1 January to 31 March 2010. Commun Dis Intell 2010;34(2)127–136.
3. Dalton CB, Merritt TD, Unicomb LE, Kirk MD, Stafford RJ, Lalor K and the OzFoodNet Working Group. A national case-control study of risk factors for listeriosis in Australia. Epidemiol Infect 2010;30:1–9. [Epub ahead of print]
4. Communicable Diseases Network Australia. Shiga toxin-producing/vero toxin-producing Escherichia coli —STEC/VTEC case definition Accessed on 18 August 2010. Available from: http://www.health.gov.au/internet/main/publishing.nsf/Content/cda-surveil-nndss-casedefs-cd_stec.htm
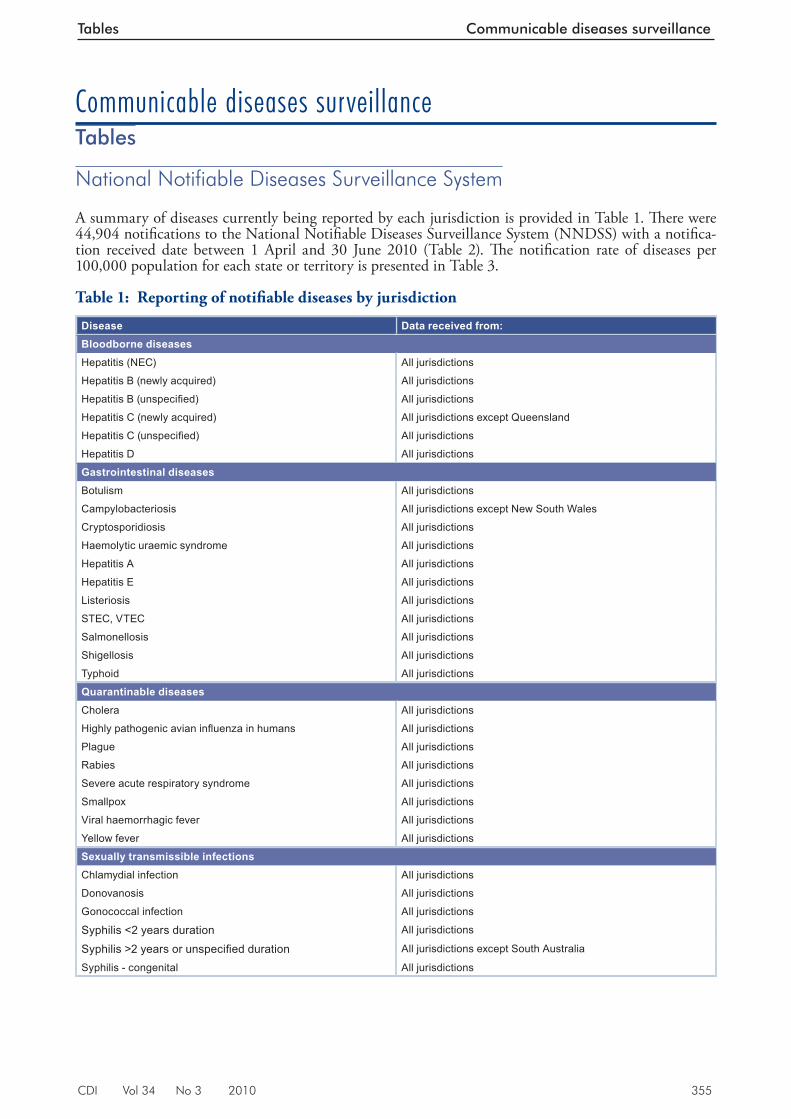
CDI Vol 34 No 3 2010 355
Tables Communicable diseases surveillance
Communicable diseases surveillance Tables
National Notifiable Diseases Surveillance System
A summary of diseases currently being reported by each jurisdiction is provided in Table 1. Th ere were 44,904 notifi cations to the National Notifi able Diseases Surveillance System (NNDSS) with a notifi ca-tion received date between 1 April and 30 June 2010 (Table 2). Th e notifi cation rate of diseases per 100,000 population for each state or territory is presented in Table 3.
Table 1: Reporting of notifi able diseases by jurisdiction
Disease Data received from:Bloodborne diseasesHepatitis (NEC) All jurisdictions
Hepatitis B (newly acquired) All jurisdictions
Hepatitis B (unspecifi ed) All jurisdictions
Hepatitis C (newly acquired) All jurisdictions except Queensland
Hepatitis C (unspecifi ed) All jurisdictions
Hepatitis D All jurisdictions
Gastrointestinal diseasesBotulism All jurisdictions
Campylobacteriosis All jurisdictions except New South Wales
Cryptosporidiosis All jurisdictions
Haemolytic uraemic syndrome All jurisdictions
Hepatitis A All jurisdictions
Hepatitis E All jurisdictions
Listeriosis All jurisdictions
STEC, VTEC All jurisdictions
Salmonellosis All jurisdictions
Shigellosis All jurisdictions
Typhoid All jurisdictions
Quarantinable diseasesCholera All jurisdictions
Highly pathogenic avian infl uenza in humans All jurisdictions
Plague All jurisdictions
Rabies All jurisdictions
Severe acute respiratory syndrome All jurisdictions
Smallpox All jurisdictions
Viral haemorrhagic fever All jurisdictions
Yellow fever All jurisdictions
Sexually transmissible infectionsChlamydial infection All jurisdictions
Donovanosis All jurisdictions
Gonococcal infection All jurisdictions
Syphilis <2 years duration All jurisdictions
Syphilis >2 years or unspecifi ed duration All jurisdictions except South Australia
Syphilis - congenital All jurisdictions
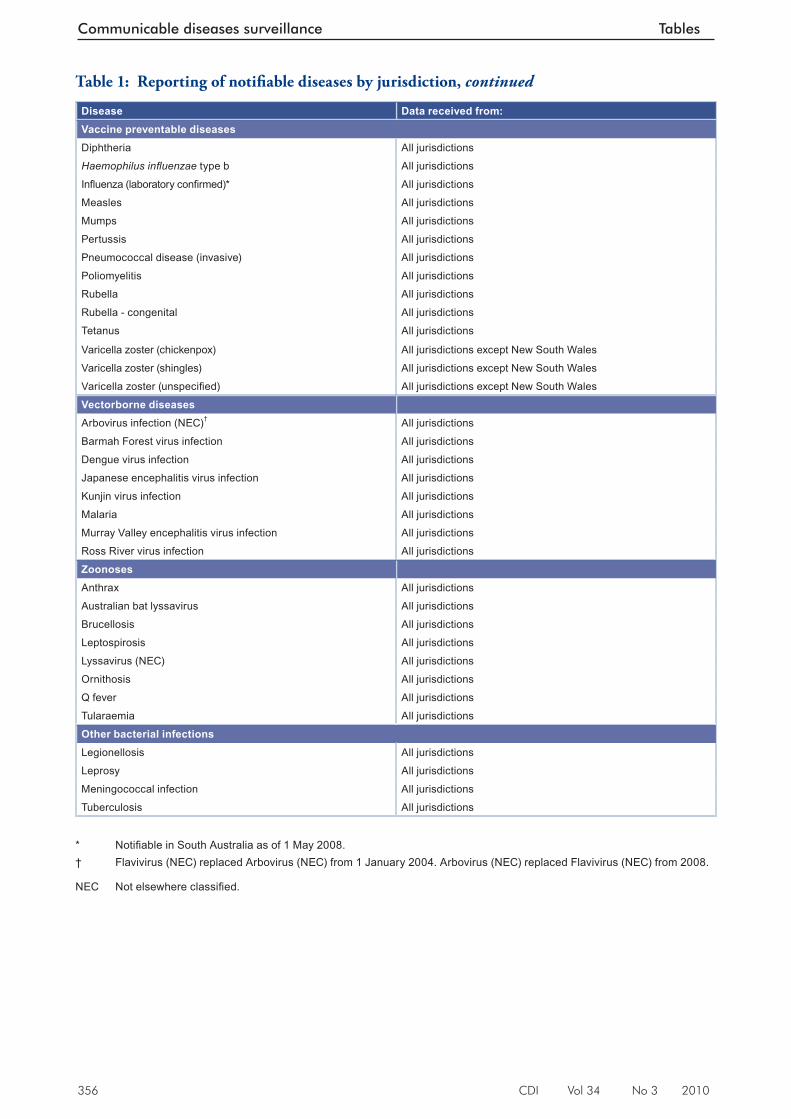
356 CDI Vol 34 No 3 2010
Communicable diseases surveillance Tables
Disease Data received from:Vaccine preventable diseasesDiphtheria All jurisdictions
Haemophilus infl uenzae type b All jurisdictions
Infl uenza (laboratory confi rmed)* All jurisdictions
Measles All jurisdictions
Mumps All jurisdictions
Pertussis All jurisdictions
Pneumococcal disease (invasive) All jurisdictions
Poliomyelitis All jurisdictions
Rubella All jurisdictions
Rubella - congenital All jurisdictions
Tetanus All jurisdictions
Varicella zoster (chickenpox) All jurisdictions except New South Wales
Varicella zoster (shingles) All jurisdictions except New South Wales
Varicella zoster (unspecifi ed) All jurisdictions except New South Wales
Vectorborne diseasesArbovirus infection (NEC)† All jurisdictions
Barmah Forest virus infection All jurisdictions
Dengue virus infection All jurisdictions
Japanese encephalitis virus infection All jurisdictions
Kunjin virus infection All jurisdictions
Malaria All jurisdictions
Murray Valley encephalitis virus infection All jurisdictions
Ross River virus infection All jurisdictions
ZoonosesAnthrax All jurisdictions
Australian bat lyssavirus All jurisdictions
Brucellosis All jurisdictions
Leptospirosis All jurisdictions
Lyssavirus (NEC) All jurisdictions
Ornithosis All jurisdictions
Q fever All jurisdictions
Tularaemia All jurisdictions
Other bacterial infectionsLegionellosis All jurisdictions
Leprosy All jurisdictions
Meningococcal infection All jurisdictions
Tuberculosis All jurisdictions
* Notifi able in South Australia as of 1 May 2008. † Flavivirus (NEC) replaced Arbovirus (NEC) from 1 January 2004. Arbovirus (NEC) replaced Flavivirus (NEC) from 2008.
NEC Not elsewhere classifi ed.
Table 1: Reporting of notifi able diseases by jurisdiction, continued
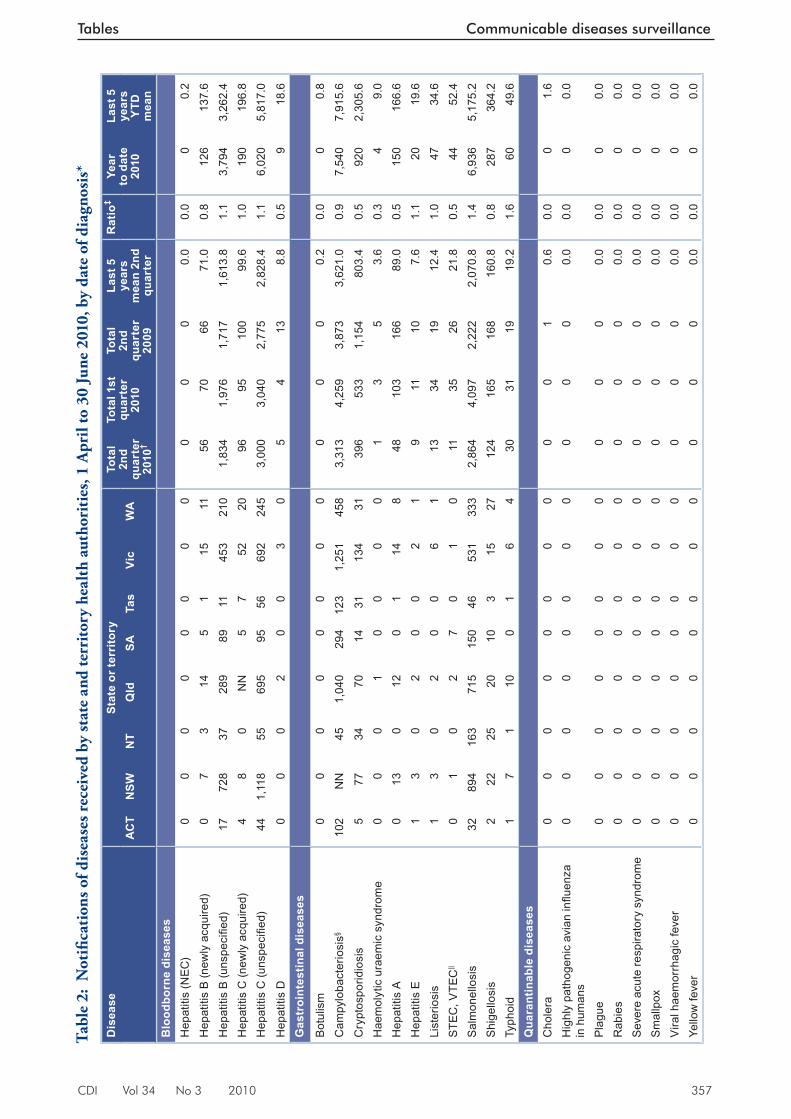
CDI Vol 34 No 3 2010 357
Tables Communicable diseases surveillance
Tabl
e 2:
Not
ifi ca
tion
s of d
isea
ses r
ecei
ved
by st
ate
and
terr
itory
hea
lth
auth
orit
ies,
1 A
pril
to 3
0 Ju
ne 2
010,
by
date
of d
iagn
osis
*
Dis
ease
Stat
e or
terr
itory
Tota
l 2n
d qu
arte
r 20
10†
Tota
l 1st
qu
arte
r 20
10
Tota
l 2n
d qu
arte
r 20
09
Last
5
year
s m
ean
2nd
quar
ter
Rat
io‡
Year
to
dat
e 20
10
Last
5
year
s Y
TD
mea
nA
CT
NSW
NT
Qld
SATa
sVi
cW
A
Blo
odbo
rne
dise
ases
Hep
atiti
s (N
EC)
00
00
00
00
00
00.
00.
00
0.2
Hep
atiti
s B
(new
ly a
cqui
red)
07
314
51
1511
5670
6671
.00.
812
613
7.6
Hep
atiti
s B
(uns
pecifi e
d)17
728
3728
989
1145
321
01,
834
1,97
61,
717
1,61
3.8
1.1
3,79
43,
262.
4H
epat
itis
C (n
ewly
acq
uire
d)4
80
NN
57
5220
9695
100
99.6
1.0
190
196.
8H
epat
itis
C (u
nspe
cifi e
d)44
1,11
855
695
9556
692
245
3,00
03,
040
2,77
52,
828.
41.
16,
020
5,81
7.0
Hep
atiti
s D
00
02
00
30
54
138.
80.
59
18.6
Gas
troi
ntes
tinal
dis
ease
s
Bot
ulis
m0
00
00
00
00
00
0.2
0.0
00.
8
Cam
pylo
bact
erio
sis§
102
NN
451,
040
294
123
1,25
145
83,
313
4,25
93,
873
3,62
1.0
0.9
7,54
07,
915.
6
Cry
ptos
porid
iosi
s5
7734
7014
3113
431
396
533
1,15
480
3.4
0.5
920
2,30
5.6
Hae
mol
ytic
ura
emic
syn
drom
e0
00
10
00
01
35
3.6
0.3
49.
0H
epat
itis
A0
130
120
114
848
103
166
89.0
0.5
150
166.
6H
epat
itis
E1
30
20
02
19
1110
7.6
1.1
2019
.6Li
ster
iosi
s1
30
20
06
113
3419
12.4
1.0
4734
.6S
TEC
, VTE
C||
01
02
70
10
1135
2621
.80.
544
52.4
Sal
mon
ello
sis
3289
416
371
515
046
531
333
2,86
44,
097
2,22
22,
070.
81.
46,
936
5,17
5.2
Shi
gello
sis
222
2520
103
1527
124
165
168
160.
80.
828
736
4.2
Typh
oid
17
110
01
64
3031
1919
.21.
660
49.6
Qua
rant
inab
le d
isea
ses
Cho
lera
00
00
00
00
00
10.
60.
00
1.6
Hig
hly
path
ogen
ic a
vian
infl u
enza
in
hum
ans
00
00
00
00
00
00.
00.
00
0.0
Pla
gue
00
00
00
00
00
00.
00.
00
0.0
Rab
ies
00
00
00
00
00
00.
00.
00
0.0
Sev
ere
acut
e re
spira
tory
syn
drom
e0
00
00
00
00
00
0.0
0.0
00.
0S
mal
lpox
00
00
00
00
00
00.
00.
00
0.0
Vira
l hae
mor
rhag
ic fe
ver
00
00
00
00
00
00.
00.
00
0.0
Yello
w fe
ver
00
00
00
00
00
00.
00.
00
0.0
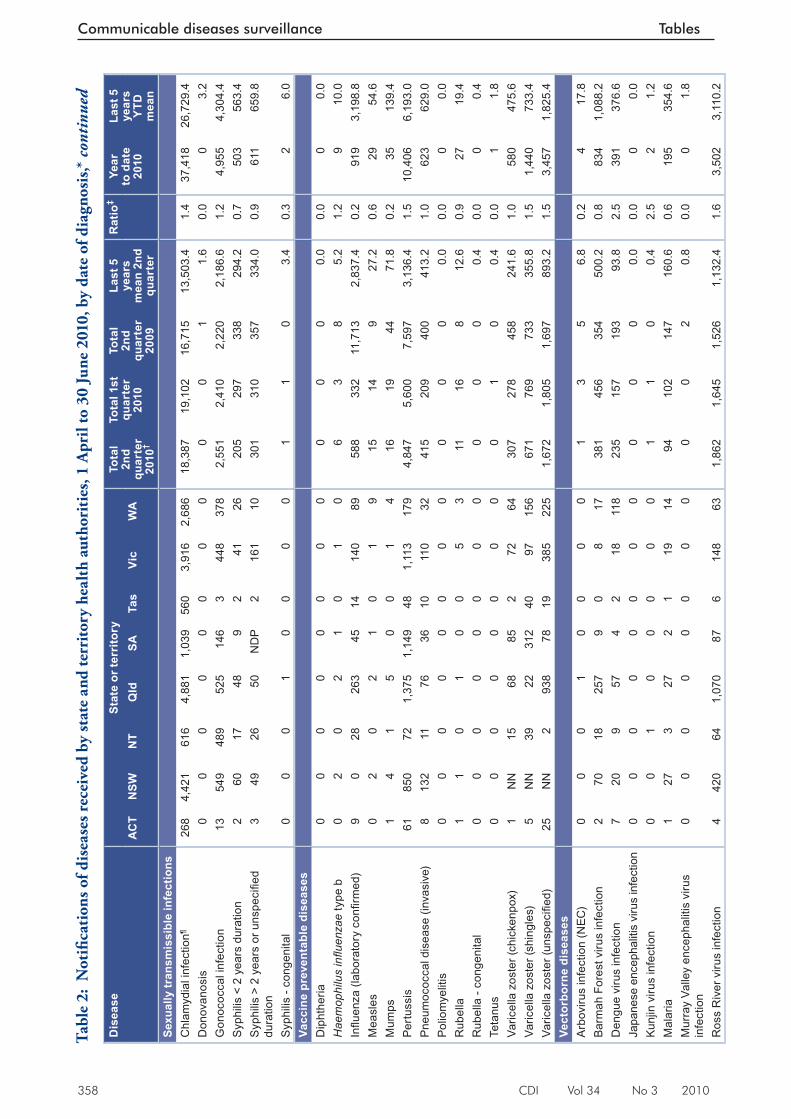
358 CDI Vol 34 No 3 2010
Communicable diseases surveillance Tables
Dis
ease
Stat
e or
terr
itory
Tota
l 2n
d qu
arte
r 20
10†
Tota
l 1st
qu
arte
r 20
10
Tota
l 2n
d qu
arte
r 20
09
Last
5
year
s m
ean
2nd
quar
ter
Rat
io‡
Year
to
dat
e 20
10
Last
5
year
s Y
TD
mea
nA
CT
NSW
NT
Qld
SATa
sVi
cW
A
Sexu
ally
tran
smis
sibl
e in
fect
ions
Chl
amyd
ial i
nfec
tion¶
268
4,42
161
64,
881
1,03
956
03,
916
2,68
618
,387
19,1
0216
,715
13,5
03.4
1.4
37,4
1826
,729
.4D
onov
anos
is0
00
00
00
00
01
1.6
0.0
03.
2G
onoc
occa
l inf
ectio
n13
549
489
525
146
344
837
82,
551
2,41
02,
220
2,18
6.6
1.2
4,95
54,
304.
4S
yphi
lis <
2 y
ears
dur
atio
n2
6017
489
241
2620
529
733
829
4.2
0.7
503
563.
4S
yphi
lis >
2 y
ears
or u
nspe
cifi e
d du
ratio
n3
4926
50N
DP
216
110
301
310
357
334.
00.
961
165
9.8
Syp
hilis
- co
ngen
ital
00
01
00
00
11
03.
40.
32
6.0
Vacc
ine
prev
enta
ble
dise
ases
Dip
hthe
ria0
00
00
00
00
00
0.0
0.0
00.
0H
aem
ophi
lus
infl u
enza
e ty
pe b
02
02
10
10
63
85.
21.
29
10.0
Infl u
enza
(lab
orat
ory
confi
rmed
)9
028
263
4514
140
8958
833
211
,713
2,83
7.4
0.2
919
3,19
8.8
Mea
sles
02
02
10
19
1514
927
.20.
629
54.6
Mum
ps1
41
50
01
416
1944
71.8
0.2
3513
9.4
Pertu
ssis
6185
072
1,37
51,
149
481,
113
179
4,84
75,
600
7,59
73,
136.
41.
510
,406
6,19
3.0
Pne
umoc
occa
l dis
ease
(inv
asiv
e)8
132
1176
3610
110
3241
520
940
041
3.2
1.0
623
629.
0P
olio
mye
litis
00
00
00
00
00
00.
00.
00
0.0
Rub
ella
11
01
00
53
1116
812
.60.
927
19.4
Rub
ella
- co
ngen
ital
00
00
00
00
00
00.
40.
00
0.4
Teta
nus
00
00
00
00
01
00.
40.
01
1.8
Varic
ella
zos
ter (
chic
kenp
ox)
1N
N15
6885
272
6430
727
845
824
1.6
1.0
580
475.
6Va
ricel
la z
oste
r (sh
ingl
es)
5N
N39
2231
240
9715
667
176
973
335
5.8
1.5
1,44
073
3.4
Varic
ella
zos
ter (
unsp
ecifi
ed)
25N
N2
938
7819
385
225
1,67
21,
805
1,69
789
3.2
1.5
3,45
71,
825.
4Ve
ctor
born
e di
seas
esA
rbov
irus
infe
ctio
n (N
EC)
00
01
00
00
13
56.
80.
24
17.8
Bar
mah
For
est v
irus
infe
ctio
n2
7018
257
90
817
381
456
354
500.
20.
883
41,
088.
2D
engu
e vi
rus
infe
ctio
n7
209
574
218
118
235
157
193
93.8
2.5
391
376.
6Ja
pane
se e
ncep
halit
is v
irus
infe
ctio
n0
00
00
00
00
00
0.0
0.0
00.
0K
unjin
viru
s in
fect
ion
00
10
00
00
11
00.
42.
52
1.2
Mal
aria
127
327
21
1914
9410
214
716
0.6
0.6
195
354.
6M
urra
y Va
lley
ence
phal
itis
viru
s in
fect
ion
00
00
00
00
00
20.
80.
00
1.8
Ros
s R
iver
viru
s in
fect
ion
442
064
1,07
087
614
863
1,86
21,
645
1,52
61,
132.
41.
63,
502
3,11
0.2
Tabl
e 2:
Not
ifi ca
tion
s of d
isea
ses r
ecei
ved
by st
ate
and
terr
itory
hea
lth
auth
orit
ies,
1 A
pril
to 3
0 Ju
ne 2
010,
by
date
of d
iagn
osis
,* c
onti
nued
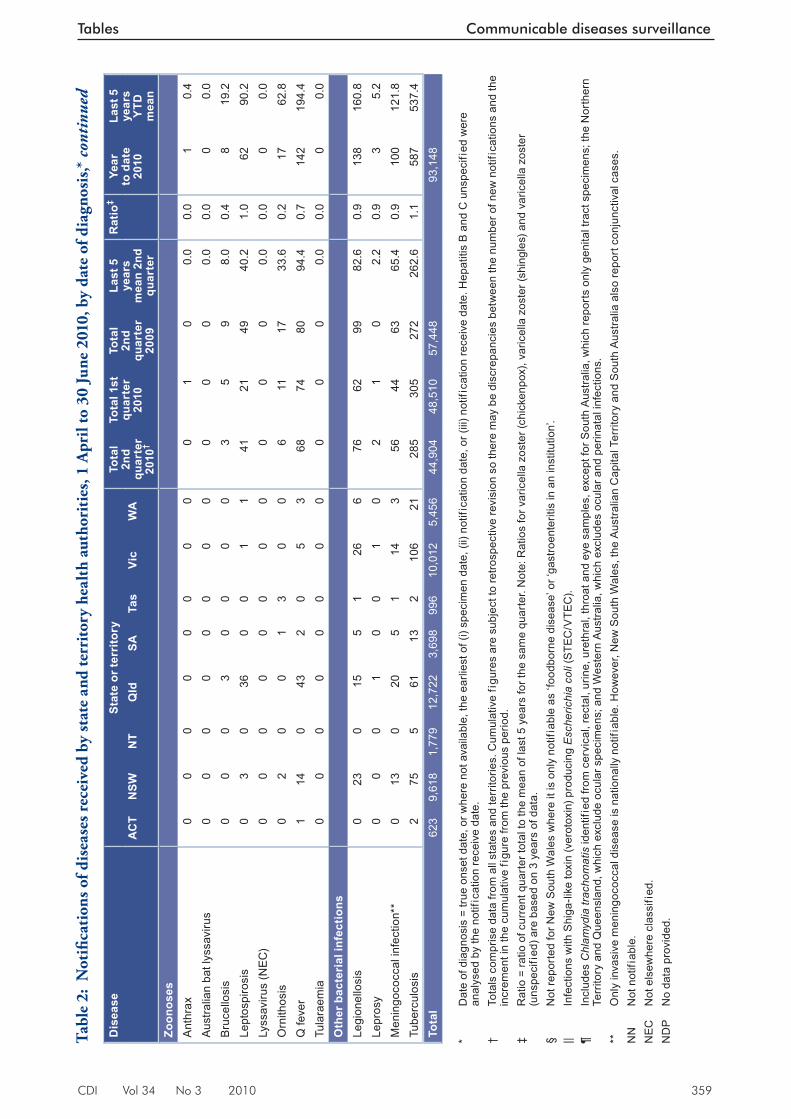
CDI Vol 34 No 3 2010 359
Tables Communicable diseases surveillance
Dis
ease
Stat
e or
terr
itory
Tota
l 2n
d qu
arte
r 20
10†
Tota
l 1st
qu
arte
r 20
10
Tota
l 2n
d qu
arte
r 20
09
Last
5
year
s m
ean
2nd
quar
ter
Rat
io‡
Year
to
dat
e 20
10
Last
5
year
s Y
TD
mea
nA
CT
NSW
NT
Qld
SATa
sVi
cW
A
Zoon
oses
Ant
hrax
00
00
00
00
01
00.
00.
01
0.4
Aus
tralia
n ba
t lys
savi
rus
00
00
00
00
00
00.
00.
00
0.0
Bru
cello
sis
00
03
00
00
35
98.
00.
48
19.2
Lept
ospi
rosi
s0
30
360
01
141
2149
40.2
1.0
6290
.2Ly
ssav
irus
(NEC
)0
00
00
00
00
00
0.0
0.0
00.
0O
rnith
osis
02
00
13
00
611
1733
.60.
217
62.8
Q fe
ver
114
043
20
53
6874
8094
.40.
714
219
4.4
Tula
raem
ia0
00
00
00
00
00
0.0
0.0
00.
0O
ther
bac
teri
al in
fect
ions
Legi
onel
losi
s0
230
155
126
676
6299
82.6
0.9
138
160.
8Le
pros
y0
00
10
01
02
10
2.2
0.9
35.
2M
enin
goco
ccal
infe
ctio
n**
013
020
51
143
5644
6365
.40.
910
012
1.8
Tube
rcul
osis
275
561
132
106
2128
530
527
226
2.6
1.1
587
537.
4To
tal
623
9,61
81,
779
12,7
223,
698
996
10,0
125,
456
44,9
0448
,510
57,4
4893
,148
* D
ate
of d
iagn
osis
= tr
ue o
nset
dat
e, o
r whe
re n
ot a
vaila
ble,
the
earli
est o
f (i)
spec
imen
dat
e, (i
i) no
tific
atio
n da
te, o
r (iii
) not
ifica
tion
rece
ive
date
. Hep
atiti
s B
and
C u
nspe
cifi
ed w
ere
anal
ysed
by
the
notif
icat
ion
rece
ive
date
. †
Tota
ls c
ompr
ise
data
from
all
stat
es a
nd te
rrito
ries.
Cum
ulat
ive
figu
res
are
subj
ect t
o re
trosp
ectiv
e re
visi
on s
o th
ere
may
be
disc
repa
ncie
s be
twee
n th
e nu
mbe
r of n
ew n
otifi
catio
ns a
nd th
e in
crem
ent i
n th
e cu
mul
ativ
e fi
gure
from
the
prev
ious
per
iod.
‡ R
atio
= ra
tio o
f cur
rent
qua
rter t
otal
to th
e m
ean
of la
st 5
yea
rs fo
r the
sam
e qu
arte
r. N
ote:
Rat
ios
for v
aric
ella
zos
ter (
chic
kenp
ox),
varic
ella
zos
ter (
shin
gles
) and
var
icel
la z
oste
r (u
nspe
cifi
ed) a
re b
ased
on
3 ye
ars
of d
ata.
§ N
ot re
porte
d fo
r New
Sou
th W
ales
whe
re it
is o
nly
notif
iabl
e as
‘foo
dbor
ne d
isea
se’ o
r ‘ga
stro
ente
ritis
in a
n in
stitu
tion’
. ||
Infe
ctio
ns w
ith S
higa
-like
toxi
n (v
erot
oxin
) pro
duci
ng E
sche
richi
a co
li (S
TEC
/VTE
C).
¶ In
clud
es C
hlam
ydia
trac
hom
atis
iden
tifie
d fro
m c
ervi
cal,
rect
al, u
rine,
ure
thra
l, th
roat
and
eye
sam
ples
, exc
ept f
or S
outh
Aus
tralia
, whi
ch re
port
s on
ly g
enita
l tra
ct s
peci
men
s; th
e N
orth
ern
Terr
itory
and
Que
ensl
and,
whi
ch e
xclu
de o
cula
r spe
cim
ens;
and
Wes
tern
Aus
tralia
, whi
ch e
xclu
des
ocul
ar a
nd p
erin
atal
infe
ctio
ns.
**
Onl
y in
vasi
ve m
enin
goco
ccal
dis
ease
is n
atio
nally
not
ifiab
le. H
owev
er, N
ew S
outh
Wal
es, t
he A
ustra
lian
Cap
ital T
errit
ory
and
Sou
th A
ustra
lia a
lso
repo
rt co
njun
ctiv
al c
ases
. N
N
Not
not
ifiab
le.
NEC
N
ot e
lsew
here
cla
ssifi
ed.
ND
P
No
data
pro
vide
d.
Tabl
e 2:
Not
ifi ca
tion
s of d
isea
ses r
ecei
ved
by st
ate
and
terr
itory
hea
lth
auth
orit
ies,
1 A
pril
to 3
0 Ju
ne 2
010,
by
date
of d
iagn
osis
,* c
onti
nued
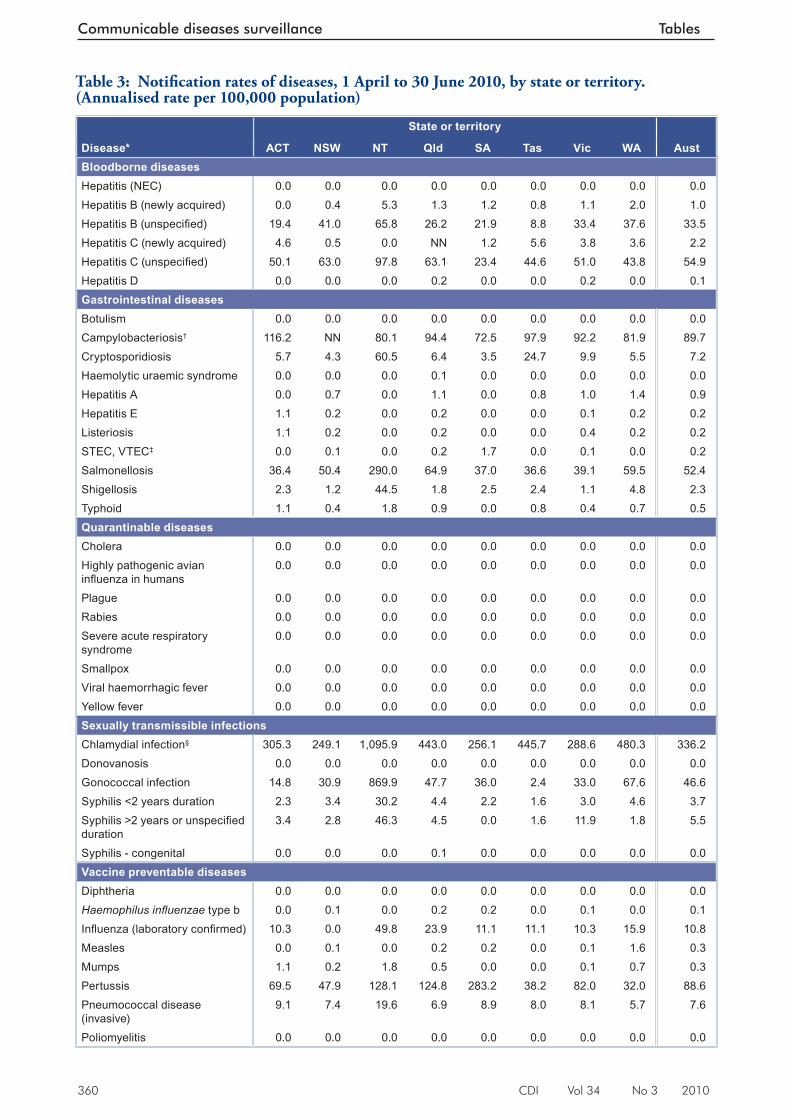
360 CDI Vol 34 No 3 2010
Communicable diseases surveillance Tables
Table 3: Notifi cation rates of diseases, 1 April to 30 June 2010, by state or territory. (Annualised rate per 100,000 population)
State or territory
Disease* ACT NSW NT Qld SA Tas Vic WA AustBloodborne diseasesHepatitis (NEC) 0.0 0.0 0.0 0.0 0.0 0.0 0.0 0.0 0.0Hepatitis B (newly acquired) 0.0 0.4 5.3 1.3 1.2 0.8 1.1 2.0 1.0Hepatitis B (unspecifi ed) 19.4 41.0 65.8 26.2 21.9 8.8 33.4 37.6 33.5Hepatitis C (newly acquired) 4.6 0.5 0.0 NN 1.2 5.6 3.8 3.6 2.2Hepatitis C (unspecifi ed) 50.1 63.0 97.8 63.1 23.4 44.6 51.0 43.8 54.9Hepatitis D 0.0 0.0 0.0 0.2 0.0 0.0 0.2 0.0 0.1Gastrointestinal diseasesBotulism 0.0 0.0 0.0 0.0 0.0 0.0 0.0 0.0 0.0Campylobacteriosis† 116.2 NN 80.1 94.4 72.5 97.9 92.2 81.9 89.7Cryptosporidiosis 5.7 4.3 60.5 6.4 3.5 24.7 9.9 5.5 7.2Haemolytic uraemic syndrome 0.0 0.0 0.0 0.1 0.0 0.0 0.0 0.0 0.0Hepatitis A 0.0 0.7 0.0 1.1 0.0 0.8 1.0 1.4 0.9Hepatitis E 1.1 0.2 0.0 0.2 0.0 0.0 0.1 0.2 0.2Listeriosis 1.1 0.2 0.0 0.2 0.0 0.0 0.4 0.2 0.2STEC, VTEC‡ 0.0 0.1 0.0 0.2 1.7 0.0 0.1 0.0 0.2Salmonellosis 36.4 50.4 290.0 64.9 37.0 36.6 39.1 59.5 52.4Shigellosis 2.3 1.2 44.5 1.8 2.5 2.4 1.1 4.8 2.3Typhoid 1.1 0.4 1.8 0.9 0.0 0.8 0.4 0.7 0.5Quarantinable diseasesCholera 0.0 0.0 0.0 0.0 0.0 0.0 0.0 0.0 0.0Highly pathogenic avian infl uenza in humans
0.0 0.0 0.0 0.0 0.0 0.0 0.0 0.0 0.0
Plague 0.0 0.0 0.0 0.0 0.0 0.0 0.0 0.0 0.0Rabies 0.0 0.0 0.0 0.0 0.0 0.0 0.0 0.0 0.0Severe acute respiratory syndrome
0.0 0.0 0.0 0.0 0.0 0.0 0.0 0.0 0.0
Smallpox 0.0 0.0 0.0 0.0 0.0 0.0 0.0 0.0 0.0Viral haemorrhagic fever 0.0 0.0 0.0 0.0 0.0 0.0 0.0 0.0 0.0Yellow fever 0.0 0.0 0.0 0.0 0.0 0.0 0.0 0.0 0.0Sexually transmissible infectionsChlamydial infection§ 305.3 249.1 1,095.9 443.0 256.1 445.7 288.6 480.3 336.2Donovanosis 0.0 0.0 0.0 0.0 0.0 0.0 0.0 0.0 0.0Gonococcal infection 14.8 30.9 869.9 47.7 36.0 2.4 33.0 67.6 46.6Syphilis <2 years duration 2.3 3.4 30.2 4.4 2.2 1.6 3.0 4.6 3.7Syphilis >2 years or unspecifi ed duration
3.4 2.8 46.3 4.5 0.0 1.6 11.9 1.8 5.5
Syphilis - congenital 0.0 0.0 0.0 0.1 0.0 0.0 0.0 0.0 0.0Vaccine preventable diseasesDiphtheria 0.0 0.0 0.0 0.0 0.0 0.0 0.0 0.0 0.0Haemophilus infl uenzae type b 0.0 0.1 0.0 0.2 0.2 0.0 0.1 0.0 0.1Infl uenza (laboratory confi rmed) 10.3 0.0 49.8 23.9 11.1 11.1 10.3 15.9 10.8Measles 0.0 0.1 0.0 0.2 0.2 0.0 0.1 1.6 0.3Mumps 1.1 0.2 1.8 0.5 0.0 0.0 0.1 0.7 0.3Pertussis 69.5 47.9 128.1 124.8 283.2 38.2 82.0 32.0 88.6Pneumococcal disease (invasive)
9.1 7.4 19.6 6.9 8.9 8.0 8.1 5.7 7.6
Poliomyelitis 0.0 0.0 0.0 0.0 0.0 0.0 0.0 0.0 0.0
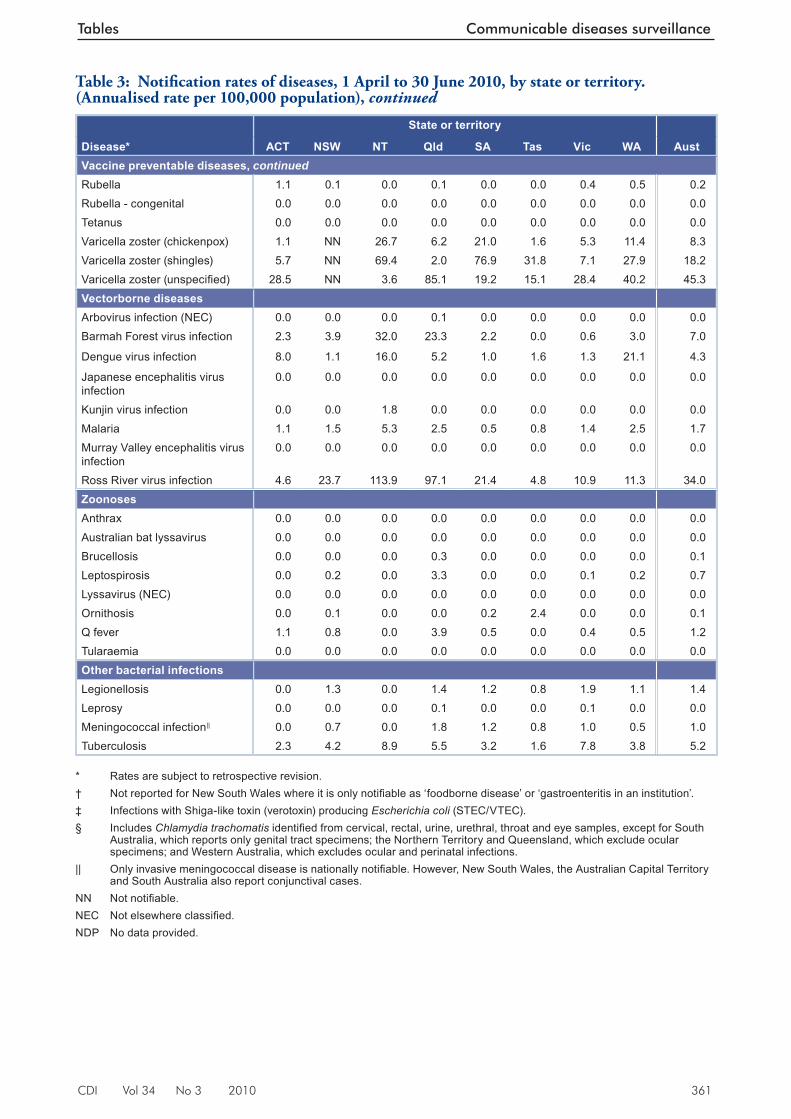
CDI Vol 34 No 3 2010 361
Tables Communicable diseases surveillance
State or territory
Disease* ACT NSW NT Qld SA Tas Vic WA AustVaccine preventable diseases, continuedRubella 1.1 0.1 0.0 0.1 0.0 0.0 0.4 0.5 0.2Rubella - congenital 0.0 0.0 0.0 0.0 0.0 0.0 0.0 0.0 0.0Tetanus 0.0 0.0 0.0 0.0 0.0 0.0 0.0 0.0 0.0Varicella zoster (chickenpox) 1.1 NN 26.7 6.2 21.0 1.6 5.3 11.4 8.3Varicella zoster (shingles) 5.7 NN 69.4 2.0 76.9 31.8 7.1 27.9 18.2Varicella zoster (unspecifi ed) 28.5 NN 3.6 85.1 19.2 15.1 28.4 40.2 45.3Vectorborne diseasesArbovirus infection (NEC) 0.0 0.0 0.0 0.1 0.0 0.0 0.0 0.0 0.0Barmah Forest virus infection 2.3 3.9 32.0 23.3 2.2 0.0 0.6 3.0 7.0
Dengue virus infection 8.0 1.1 16.0 5.2 1.0 1.6 1.3 21.1 4.3
Japanese encephalitis virus infection
0.0 0.0 0.0 0.0 0.0 0.0 0.0 0.0 0.0
Kunjin virus infection 0.0 0.0 1.8 0.0 0.0 0.0 0.0 0.0 0.0Malaria 1.1 1.5 5.3 2.5 0.5 0.8 1.4 2.5 1.7Murray Valley encephalitis virus infection
0.0 0.0 0.0 0.0 0.0 0.0 0.0 0.0 0.0
Ross River virus infection 4.6 23.7 113.9 97.1 21.4 4.8 10.9 11.3 34.0ZoonosesAnthrax 0.0 0.0 0.0 0.0 0.0 0.0 0.0 0.0 0.0
Australian bat lyssavirus 0.0 0.0 0.0 0.0 0.0 0.0 0.0 0.0 0.0Brucellosis 0.0 0.0 0.0 0.3 0.0 0.0 0.0 0.0 0.1Leptospirosis 0.0 0.2 0.0 3.3 0.0 0.0 0.1 0.2 0.7Lyssavirus (NEC) 0.0 0.0 0.0 0.0 0.0 0.0 0.0 0.0 0.0Ornithosis 0.0 0.1 0.0 0.0 0.2 2.4 0.0 0.0 0.1Q fever 1.1 0.8 0.0 3.9 0.5 0.0 0.4 0.5 1.2Tularaemia 0.0 0.0 0.0 0.0 0.0 0.0 0.0 0.0 0.0Other bacterial infectionsLegionellosis 0.0 1.3 0.0 1.4 1.2 0.8 1.9 1.1 1.4Leprosy 0.0 0.0 0.0 0.1 0.0 0.0 0.1 0.0 0.0Meningococcal infection|| 0.0 0.7 0.0 1.8 1.2 0.8 1.0 0.5 1.0Tuberculosis 2.3 4.2 8.9 5.5 3.2 1.6 7.8 3.8 5.2
* Rates are subject to retrospective revision. † Not reported for New South Wales where it is only notifi able as ‘foodborne disease’ or ‘gastroenteritis in an institution’. ‡ Infections with Shiga-like toxin (verotoxin) producing Escherichia coli (STEC/VTEC). § Includes Chlamydia trachomatis identifi ed from cervical, rectal, urine, urethral, throat and eye samples, except for South
Australia, which reports only genital tract specimens; the Northern Territory and Queensland, which exclude ocular specimens; and Western Australia, which excludes ocular and perinatal infections.
|| Only invasive meningococcal disease is nationally notifi able. However, New South Wales, the Australian Capital Territory and South Australia also report conjunctival cases.
NN Not notifi able. NEC Not elsewhere classifi ed. NDP No data provided.
Table 3: Notifi cation rates of diseases, 1 April to 30 June 2010, by state or territory. (Annualised rate per 100,000 population), continued
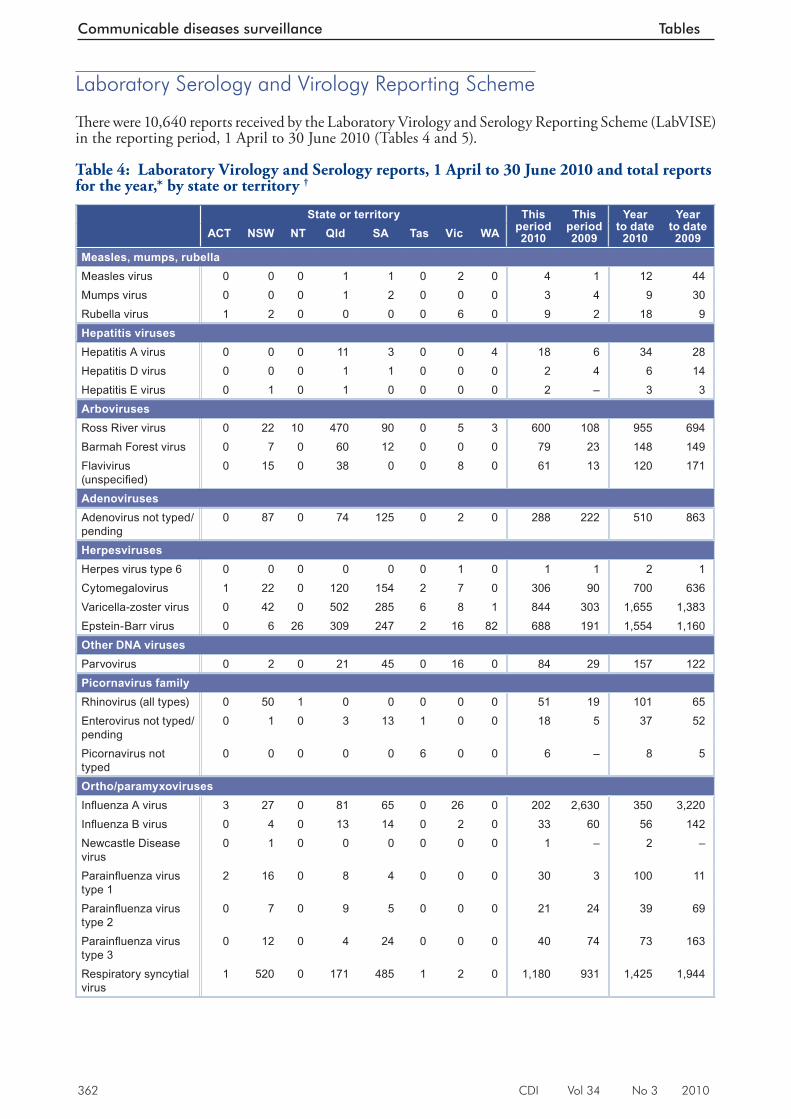
362 CDI Vol 34 No 3 2010
Communicable diseases surveillance Tables
Laboratory Serology and Virology Reporting Scheme
Th ere were 10,640 reports received by the Laboratory Virology and Serology Reporting Scheme (LabVISE) in the reporting period, 1 April to 30 June 2010 (Tables 4 and 5).
Table 4: Laboratory Virology and Serology reports, 1 April to 30 June 2010 and total reports for the year,* by state or territory †
State or territory This period 2010
This period 2009
Year to date
2010
Year to date 2009ACT NSW NT Qld SA Tas Vic WA
Measles, mumps, rubellaMeasles virus 0 0 0 1 1 0 2 0 4 1 12 44Mumps virus 0 0 0 1 2 0 0 0 3 4 9 30Rubella virus 1 2 0 0 0 0 6 0 9 2 18 9Hepatitis virusesHepatitis A virus 0 0 0 11 3 0 0 4 18 6 34 28Hepatitis D virus 0 0 0 1 1 0 0 0 2 4 6 14Hepatitis E virus 0 1 0 1 0 0 0 0 2 – 3 3ArbovirusesRoss River virus 0 22 10 470 90 0 5 3 600 108 955 694Barmah Forest virus 0 7 0 60 12 0 0 0 79 23 148 149Flavivirus (unspecifi ed)
0 15 0 38 0 0 8 0 61 13 120 171
AdenovirusesAdenovirus not typed/pending
0 87 0 74 125 0 2 0 288 222 510 863
HerpesvirusesHerpes virus type 6 0 0 0 0 0 0 1 0 1 1 2 1Cytomegalovirus 1 22 0 120 154 2 7 0 306 90 700 636Varicella-zoster virus 0 42 0 502 285 6 8 1 844 303 1,655 1,383Epstein-Barr virus 0 6 26 309 247 2 16 82 688 191 1,554 1,160Other DNA virusesParvovirus 0 2 0 21 45 0 16 0 84 29 157 122Picornavirus familyRhinovirus (all types) 0 50 1 0 0 0 0 0 51 19 101 65Enterovirus not typed/pending
0 1 0 3 13 1 0 0 18 5 37 52
Picornavirus not typed
0 0 0 0 0 6 0 0 6 – 8 5
Ortho/paramyxovirusesInfl uenza A virus 3 27 0 81 65 0 26 0 202 2,630 350 3,220Infl uenza B virus 0 4 0 13 14 0 2 0 33 60 56 142Newcastle Disease virus
0 1 0 0 0 0 0 0 1 – 2 –
Parainfl uenza virus type 1
2 16 0 8 4 0 0 0 30 3 100 11
Parainfl uenza virus type 2
0 7 0 9 5 0 0 0 21 24 39 69
Parainfl uenza virus type 3
0 12 0 4 24 0 0 0 40 74 73 163
Respiratory syncytial virus
1 520 0 171 485 1 2 0 1,180 931 1,425 1,944
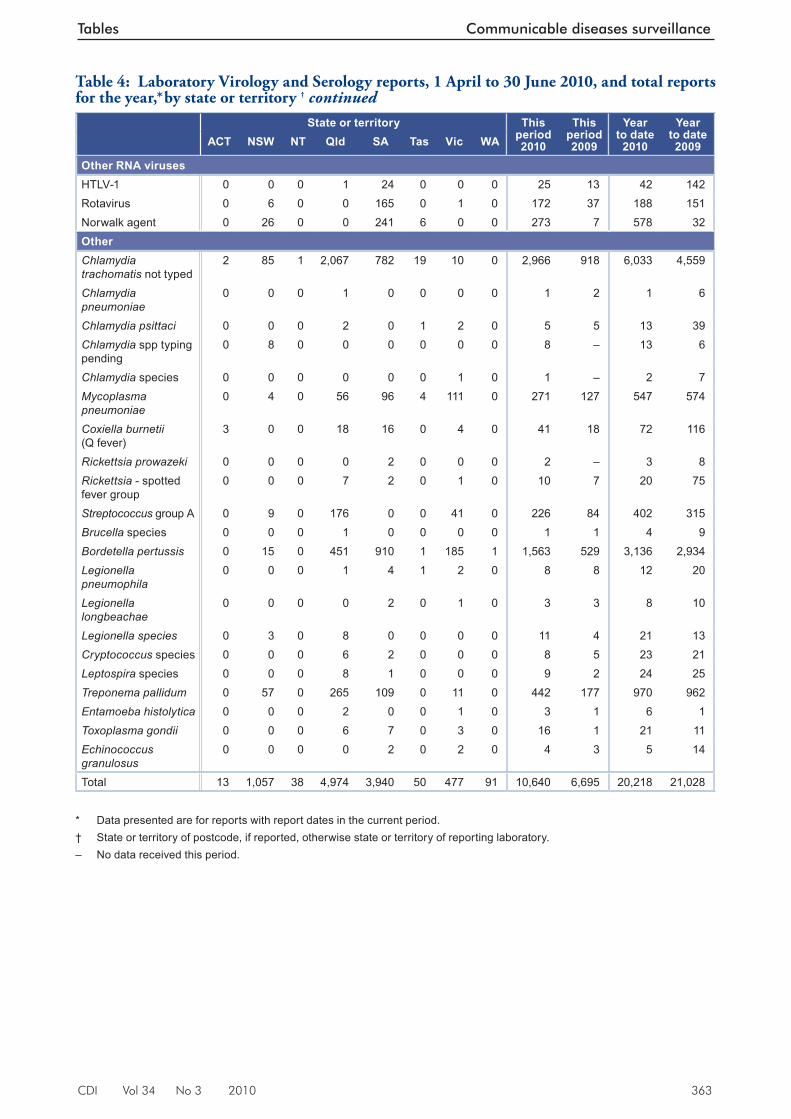
CDI Vol 34 No 3 2010 363
Tables Communicable diseases surveillance
State or territory This period 2010
This period 2009
Year to date
2010
Year to date 2009ACT NSW NT Qld SA Tas Vic WA
Other RNA virusesHTLV-1 0 0 0 1 24 0 0 0 25 13 42 142Rotavirus 0 6 0 0 165 0 1 0 172 37 188 151Norwalk agent 0 26 0 0 241 6 0 0 273 7 578 32OtherChlamydia trachomatis not typed
2 85 1 2,067 782 19 10 0 2,966 918 6,033 4,559
Chlamydia pneumoniae
0 0 0 1 0 0 0 0 1 2 1 6
Chlamydia psittaci 0 0 0 2 0 1 2 0 5 5 13 39Chlamydia spp typing pending
0 8 0 0 0 0 0 0 8 – 13 6
Chlamydia species 0 0 0 0 0 0 1 0 1 – 2 7Mycoplasma pneumoniae
0 4 0 56 96 4 111 0 271 127 547 574
Coxiella burnetii (Q fever)
3 0 0 18 16 0 4 0 41 18 72 116
Rickettsia prowazeki 0 0 0 0 2 0 0 0 2 – 3 8Rickettsia - spotted fever group
0 0 0 7 2 0 1 0 10 7 20 75
Streptococcus group A 0 9 0 176 0 0 41 0 226 84 402 315Brucella species 0 0 0 1 0 0 0 0 1 1 4 9Bordetella pertussis 0 15 0 451 910 1 185 1 1,563 529 3,136 2,934Legionella pneumophila
0 0 0 1 4 1 2 0 8 8 12 20
Legionella longbeachae
0 0 0 0 2 0 1 0 3 3 8 10
Legionella species 0 3 0 8 0 0 0 0 11 4 21 13Cryptococcus species 0 0 0 6 2 0 0 0 8 5 23 21Leptospira species 0 0 0 8 1 0 0 0 9 2 24 25Treponema pallidum 0 57 0 265 109 0 11 0 442 177 970 962Entamoeba histolytica 0 0 0 2 0 0 1 0 3 1 6 1Toxoplasma gondii 0 0 0 6 7 0 3 0 16 1 21 11Echinococcus granulosus
0 0 0 0 2 0 2 0 4 3 5 14
Total 13 1,057 38 4,974 3,940 50 477 91 10,640 6,695 20,218 21,028
* Data presented are for reports with report dates in the current period. † State or territory of postcode, if reported, otherwise state or territory of reporting laboratory. – No data received this period.
Table 4: Laboratory Virology and Serology reports, 1 April to 30 June 2010, and total reports for the year,*. by state or territory † continued
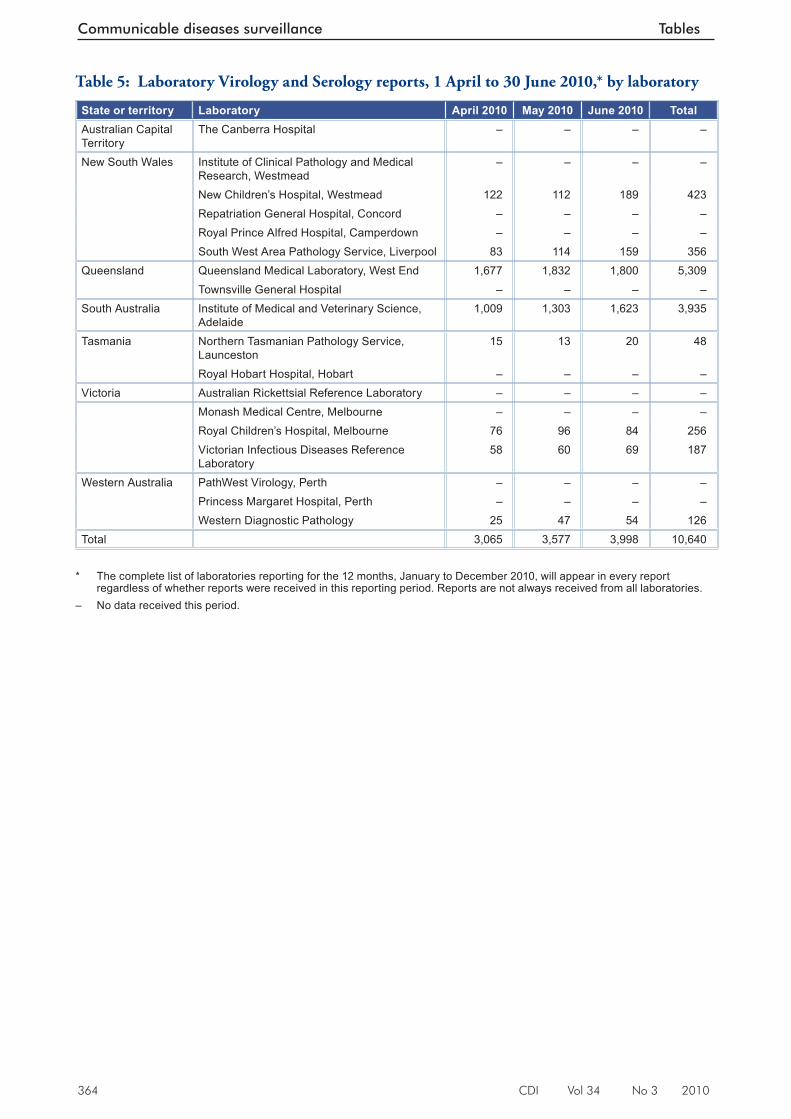
364 CDI Vol 34 No 3 2010
Communicable diseases surveillance Tables
Table 5: Laboratory Virology and Serology reports, 1 April to 30 June 2010,* by laboratory
State or territory Laboratory April 2010 May 2010 June 2010 TotalAustralian Capital Territory
The Canberra Hospital – – – –
New South Wales Institute of Clinical Pathology and Medical Research, Westmead
– – – –
New Children’s Hospital, Westmead 122 112 189 423Repatriation General Hospital, Concord – – – –Royal Prince Alfred Hospital, Camperdown – – – –South West Area Pathology Service, Liverpool 83 114 159 356
Queensland Queensland Medical Laboratory, West End 1,677 1,832 1,800 5,309Townsville General Hospital – – – –
South Australia Institute of Medical and Veterinary Science, Adelaide
1,009 1,303 1,623 3,935
Tasmania Northern Tasmanian Pathology Service, Launceston
15 13 20 48
Royal Hobart Hospital, Hobart – – – –Victoria Australian Rickettsial Reference Laboratory – – – –
Monash Medical Centre, Melbourne – – – –Royal Children’s Hospital, Melbourne 76 96 84 256Victorian Infectious Diseases Reference Laboratory
58 60 69 187
Western Australia PathWest Virology, Perth – – – –Princess Margaret Hospital, Perth – – – –Western Diagnostic Pathology 25 47 54 126
Total 3,065 3,577 3,998 10,640 * The complete list of laboratories reporting for the 12 months, January to December 2010, will appear in every report
regardless of whether reports were received in this reporting period. Reports are not always received from all laboratories. – No data received this period.
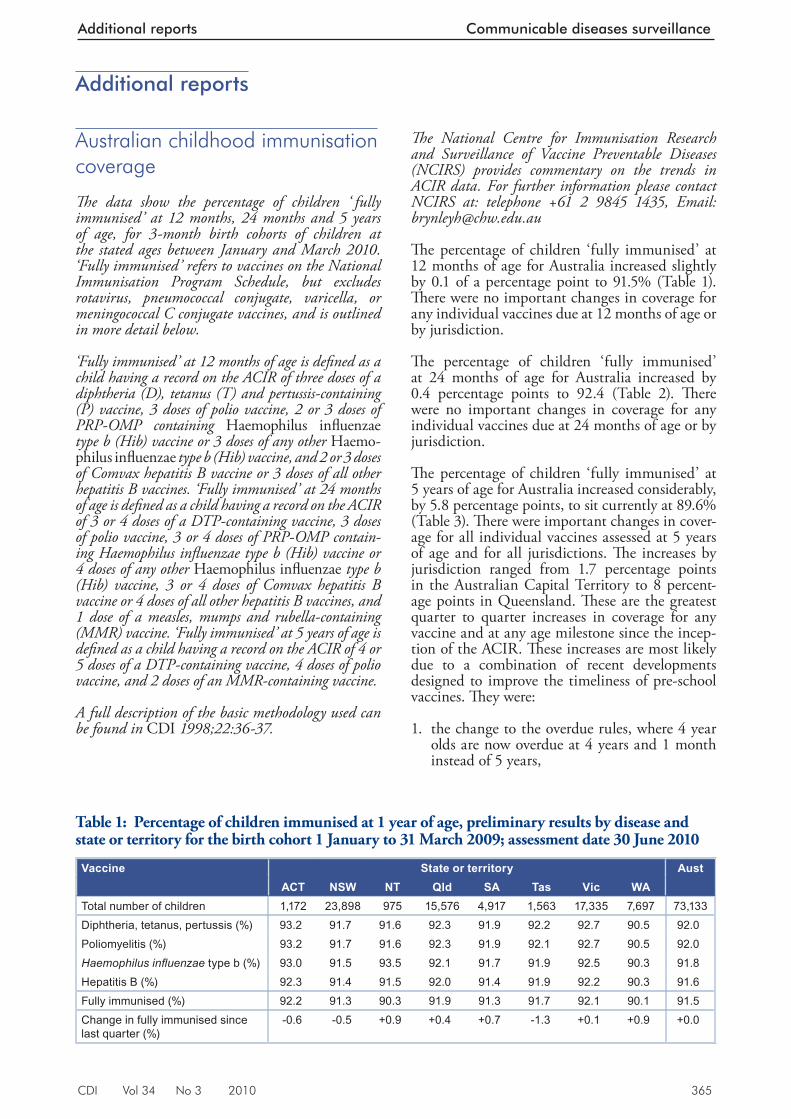
CDI Vol 34 No 3 2010 365
Additional reports Communicable diseases surveillance
Additional reports
Australian childhood immunisation coverage
Th e data show the percentage of children ‘ fully immunised’ at 12 months, 24 months and 5 years of age, for 3-month birth cohorts of children at the stated ages between January and March 2010. ‘Fully immunised’ refers to vaccines on the National Immunisation Program Schedule, but excludes rotavirus, pneumococcal conjugate, varicella, or meningococcal C conjugate vaccines, and is outlined in more detail below.
‘Fully immunised’ at 12 months of age is defi ned as a child having a record on the ACIR of three doses of a diphtheria (D), tetanus (T) and pertussis-containing (P) vaccine, 3 doses of polio vaccine, 2 or 3 doses of PRP-OMP containing Haemophilus infl uenzae type b (Hib) vaccine or 3 doses of any other Haemo-philus infl uenzae type b (Hib) vaccine, and 2 or 3 doses of Comvax hepatitis B vaccine or 3 doses of all other hepatitis B vaccines. ‘Fully immunised’ at 24 months of age is defi ned as a child having a record on the ACIR of 3 or 4 doses of a DTP-containing vaccine, 3 doses of polio vaccine, 3 or 4 doses of PRP-OMP contain-ing Haemophilus infl uenzae type b (Hib) vaccine or 4 doses of any other Haemophilus infl uenzae type b (Hib) vaccine, 3 or 4 doses of Comvax hepatitis B vaccine or 4 doses of all other hepatitis B vaccines, and 1 dose of a measles, mumps and rubella-containing (MMR) vaccine. ‘Fully immunised’ at 5 years of age is defi ned as a child having a record on the ACIR of 4 or 5 doses of a DTP-containing vaccine, 4 doses of polio vaccine, and 2 doses of an MMR-containing vaccine.
A full description of the basic methodology used can be found in CDI 1998;22:36-37.
Th e National Centre for Immunisation Research and Surveillance of Vaccine Preventable Diseases (NCIRS) provides commentary on the trends in ACIR data. For further information please contact NCIRS at: telephone +61 2 9845 1435, Email: [email protected]
Th e percentage of children ‘fully immunised’ at 12 months of age for Australia increased slightly by 0.1 of a percentage point to 91.5% (Table 1). Th ere were no important changes in coverage for any individual vaccines due at 12 months of age or by jurisdiction.
Th e percentage of children ‘fully immunised’ at 24 months of age for Australia increased by 0.4 percentage points to 92.4 (Table 2). Th e re were no important changes in coverage for any individual vaccines due at 24 months of age or by jurisdiction.
Th e percentage of children ‘fully immunised’ at 5 years of age for Australia increased considerably, by 5.8 percentage points, to sit currently at 89.6% (Table 3). Th ere were important changes in cover-age for all individual vaccines assessed at 5 years of age and for all jurisdictions. Th e increases by jurisdiction ranged from 1.7 percentage points in the Australian Capital Territory to 8 percent-age points in Queensland. Th ese are the greatest quarter to quarter increases in coverage for any vaccine and at any age milestone since the incep-tion of the ACIR. Th ese increases are most likely due to a combination of recent developments designed to improve the timeliness of pre-school vaccines. Th ey were:
1. the change to the overdue rules, where 4 year olds are now overdue at 4 years and 1 month instead of 5 years,
Table 1: Percentage of children immunised at 1 year of age, preliminary results by disease and state or territory for the birth cohort 1 January to 31 March 2009; assessment date 30 June 2010
Vaccine State or territory AustACT NSW NT Qld SA Tas Vic WA
Total number of children 1,172 23,898 975 15,576 4,917 1,563 17,335 7,697 73,133Diphtheria, tetanus, pertussis (%) 93.2 91.7 91.6 92.3 91.9 92.2 92.7 90.5 92.0Poliomyelitis (%) 93.2 91.7 91.6 92.3 91.9 92.1 92.7 90.5 92.0Haemophilus infl uenzae type b (%) 93.0 91.5 93.5 92.1 91.7 91.9 92.5 90.3 91.8Hepatitis B (%) 92.3 91.4 91.5 92.0 91.4 91.9 92.2 90.3 91.6Fully immunised (%) 92.2 91.3 90.3 91.9 91.3 91.7 92.1 90.1 91.5Change in fully immunised since last quarter (%)
-0.6 -0.5 +0.9 +0.4 +0.7 -1.3 +0.1 +0.9 +0.0
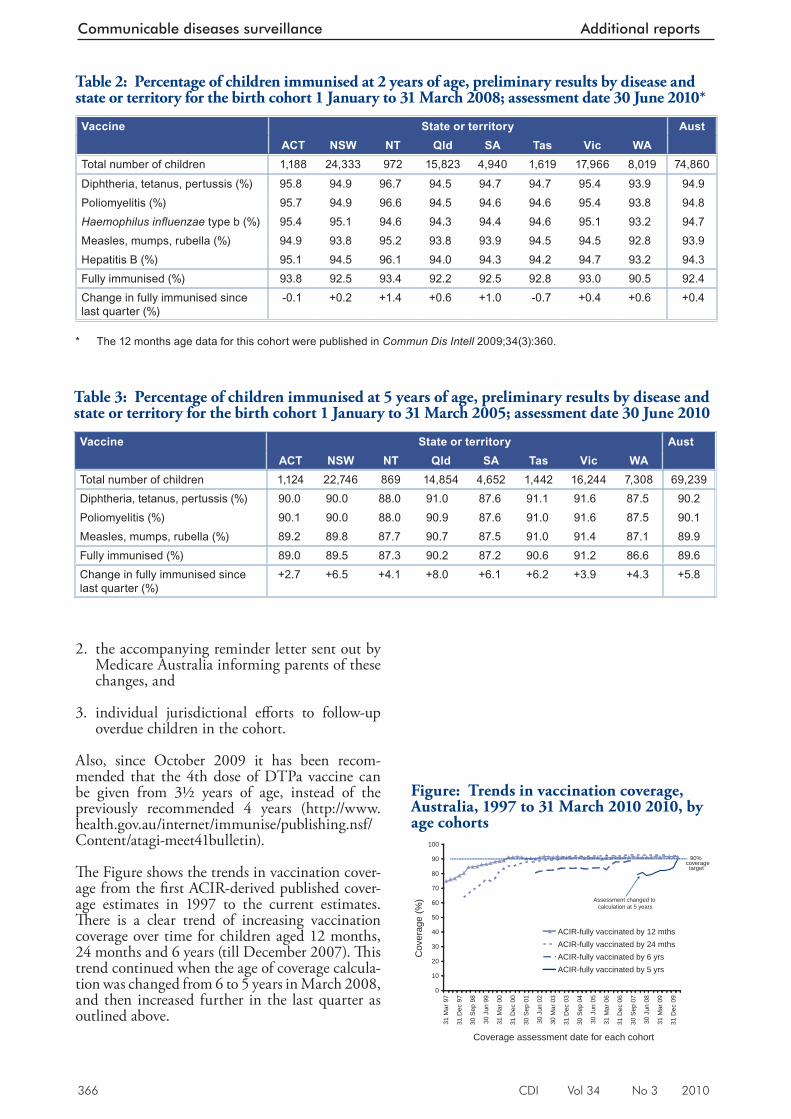
366 CDI Vol 34 No 3 2010
Communicable diseases surveillance Additional reports
2. the accompanying reminder letter sent out by Medicare Australia informing parents of these changes, and
3. individual jurisdictional eff orts to follow-up overdue children in the cohort.
Also, since October 2009 it has been recom-mended that the 4th dose of DTPa vaccine can be given from 3½ years of age, instead of the previously recommended 4 years (http://www.health.gov.au/internet/immunise/publishing.nsf/Content/atagi-meet41bulletin).
Th e Figure shows the trends in vaccination cover-age from the fi rst ACIR-derived published cover-age estimates in 1997 to the current estimates. Th ere is a clear trend of increasing vaccination coverage over time for children aged 12 months, 24 months and 6 years (till December 2007). Th is trend continued when the age of coverage calcula-tion was changed from 6 to 5 years in March 2008, and then increased further in the last quarter as outlined above.
Table 2: Percentage of children immunised at 2 years of age, preliminary results by disease and state or territory for the birth cohort 1 January to 31 March 2008; assessment date 30 June 2010*
Vaccine State or territory AustACT NSW NT Qld SA Tas Vic WA
Total number of children 1,188 24,333 972 15,823 4,940 1,619 17,966 8,019 74,860
Diphtheria, tetanus, pertussis (%) 95.8 94.9 96.7 94.5 94.7 94.7 95.4 93.9 94.9Poliomyelitis (%) 95.7 94.9 96.6 94.5 94.6 94.6 95.4 93.8 94.8Haemophilus infl uenzae type b (%) 95.4 95.1 94.6 94.3 94.4 94.6 95.1 93.2 94.7Measles, mumps, rubella (%) 94.9 93.8 95.2 93.8 93.9 94.5 94.5 92.8 93.9Hepatitis B (%) 95.1 94.5 96.1 94.0 94.3 94.2 94.7 93.2 94.3Fully immunised (%) 93.8 92.5 93.4 92.2 92.5 92.8 93.0 90.5 92.4Change in fully immunised since last quarter (%)
-0.1 +0.2 +1.4 +0.6 +1.0 -0.7 +0.4 +0.6 +0.4
* The 12 months age data for this cohort were published in Commun Dis Intell 2009;34(3):360.
Table 3: Percentage of children immunised at 5 years of age, preliminary results by disease and state or territory for the birth cohort 1 January to 31 March 2005; assessment date 30 June 2010
Vaccine State or territory AustACT NSW NT Qld SA Tas Vic WA
Total number of children 1,124 22,746 869 14,854 4,652 1,442 16,244 7,308 69,239Diphtheria, tetanus, pertussis (%) 90.0 90.0 88.0 91.0 87.6 91.1 91.6 87.5 90.2Poliomyelitis (%) 90.1 90.0 88.0 90.9 87.6 91.0 91.6 87.5 90.1Measles, mumps, rubella (%) 89.2 89.8 87.7 90.7 87.5 91.0 91.4 87.1 89.9Fully immunised (%) 89.0 89.5 87.3 90.2 87.2 90.6 91.2 86.6 89.6Change in fully immunised since last quarter (%)
+2.7 +6.5 +4.1 +8.0 +6.1 +6.2 +3.9 +4.3 +5.8
Figure: Trends in vaccination coverage, Australia, 1997 to 31 March 2010 2010, by age cohorts
0
10
20
30
40
50
60
70
80
90
100
31 M
ar 9
7
31 D
ec 9
7
30 S
ep 9
8
30 J
un 9
9
31 M
ar 0
0
31 D
ec 0
0
30 S
ep 0
1
30 J
un 0
2
30 M
ar 0
3
31 D
ec 0
3
30 S
ep 0
4
30 J
un 0
5
31 M
ar 0
6
31 D
ec 0
6
30 S
ep 0
7
30 J
un 0
8
31 M
ar 0
9
31 D
ec 0
9
Coverage assessment date for each cohort
Cov
erag
e (%
)
ACIR-fully vaccinated by 12 mthsACIR-fully vaccinated by 24 mthsACIR-fully vaccinated by 6 yrsACIR-fully vaccinated by 5 yrs
90%coveragetarget
Assessment changed to calculation at 5 years
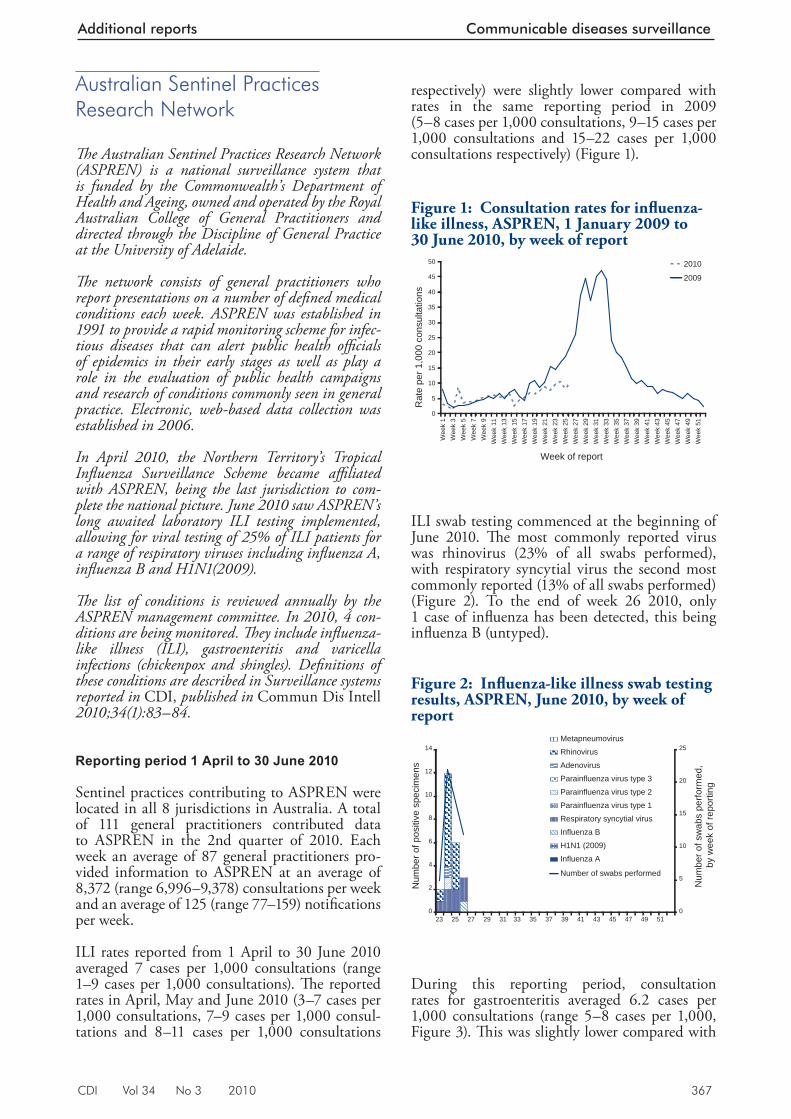
CDI Vol 34 No 3 2010 367
Additional reports Communicable diseases surveillance
Australian Sentinel Practices Research Network
Th e Australian Sentinel Practices Research Network (ASPREN) is a national surveillance system that is funded by the Commonwealth’s Department of Health and Ageing, owned and operated by the Royal Australian College of General Practitioners and directed through the Discipline of General Practice at the University of Adelaide.
Th e network consists of general practitioners who report presentations on a number of defi ned medical conditions each week. ASPREN was established in 1991 to provide a rapid monitoring scheme for infec-tious diseases that can alert public health offi cials of epidemics in their early stages as well as play a role in the evaluation of public health campaigns and research of conditions commonly seen in general practice. Electronic, web-based data collection was established in 2006.
In April 2010, the Northern Territory’s Tropical Infl uenza Surveillance Scheme became affi liated with ASPREN, being the last jurisdiction to com-plete the national picture. June 2010 saw ASPREN’s long awaited laboratory ILI testing implemented, allowing for viral testing of 25% of ILI patients for a range of respiratory viruses including infl uenza A, infl uenza B and H1N1(2009).
Th e list of conditions is reviewed annually by the ASPREN management committee. In 2010, 4 con-ditions are being monitored. Th ey include infl uenza-like illness (ILI), gastroenteritis and varicella infections (chickenpox and shingles). Defi nitions of these conditions are described in Surveillance systems reported in CDI, published in Commun Dis Intell 2010;34(1):83–84.
Reporting period 1 April to 30 June 2010
Sentinel practices contributing to ASPREN were located in all 8 jurisdictions in Australia. A total of 111 general practitioners contributed data to ASPREN in the 2nd quarter of 2010. Each week an average of 87 general practitioners pro-vided information to ASPREN at an average of 8,372 (range 6,996–9,378) consultations per week and an average of 125 (range 77–159) notifi cations per week.
ILI rates reported from 1 April to 30 June 2010 averaged 7 cases per 1,000 consultations (range 1–9 cases per 1,000 consultations). Th e reported rates in April, May and June 2010 (3–7 cases per 1,000 consultations, 7–9 cases per 1,000 consul-tations and 8–11 cases per 1,000 consultations
respectively) were slightly lower compared with rates in the same reporting period in 2009 (5–8 cases per 1,000 consultations, 9–15 cases per 1,000 consultations and 15–22 cases per 1,000 consultations respectively) (Figure 1).
ILI swab testing commenced at the beginning of June 2010. Th e most commonly reported virus was rhinovirus (23% of all swabs performed), with respiratory syncytial virus the second most commonly reported (13% of all swabs performed) (Figure 2). To the end of week 26 2010, only 1 case of infl uenza has been detected, this being infl uenza B (untyped).
During this reporting period, consultation rates for gastroenteritis averaged 6.2 cases per 1,000 consultations (range 5–8 cases per 1,000, Figure 3). Th is was slightly lower compared with
Figure 1: Consultation rates for infl uenza-like illness, ASPREN, 1 January 2009 to 30 June 2010, by week of report
0
5
10
15
20
25
30
35
40
45
50
Wee
k 1
Wee
k 3
Wee
k 5
Wee
k 7
Wee
k 9
Wee
k 11
Wee
k 13
Wee
k 15
Wee
k 17
Wee
k 19
Wee
k 21
Wee
k 23
Wee
k 25
Wee
k 27
Wee
k 29
Wee
k 31
Wee
k 33
Wee
k 35
Wee
k 37
Wee
k 39
Wee
k 41
Wee
k 43
Wee
k 45
Wee
k 47
Wee
k 49
Wee
k 51
Week of report
Rat
e pe
r 1,0
00 c
onsu
ltatio
ns
2010
2009
Figure 2: Infl uenza-like illness swab testing results, ASPREN, June 2010, by week of report
0
2
4
6
8
10
12
14
23 25 27 29 31 33 35 37 39 41 43 45 47 49 51
Num
ber o
f pos
itive
spe
cim
ens
0
5
10
15
20
25
Num
ber o
f sw
abs
perfo
rmed
, by
wee
k of
repo
rting
Metapneumovirus
Rhinovirus
Adenovirus
Parainfluenza virus type 3
Parainfluenza virus type 2
Parainfluenza virus type 1
Respiratory syncytial virus
Influenza B
H1N1 (2009)
Influenza A
Number of swabs performed
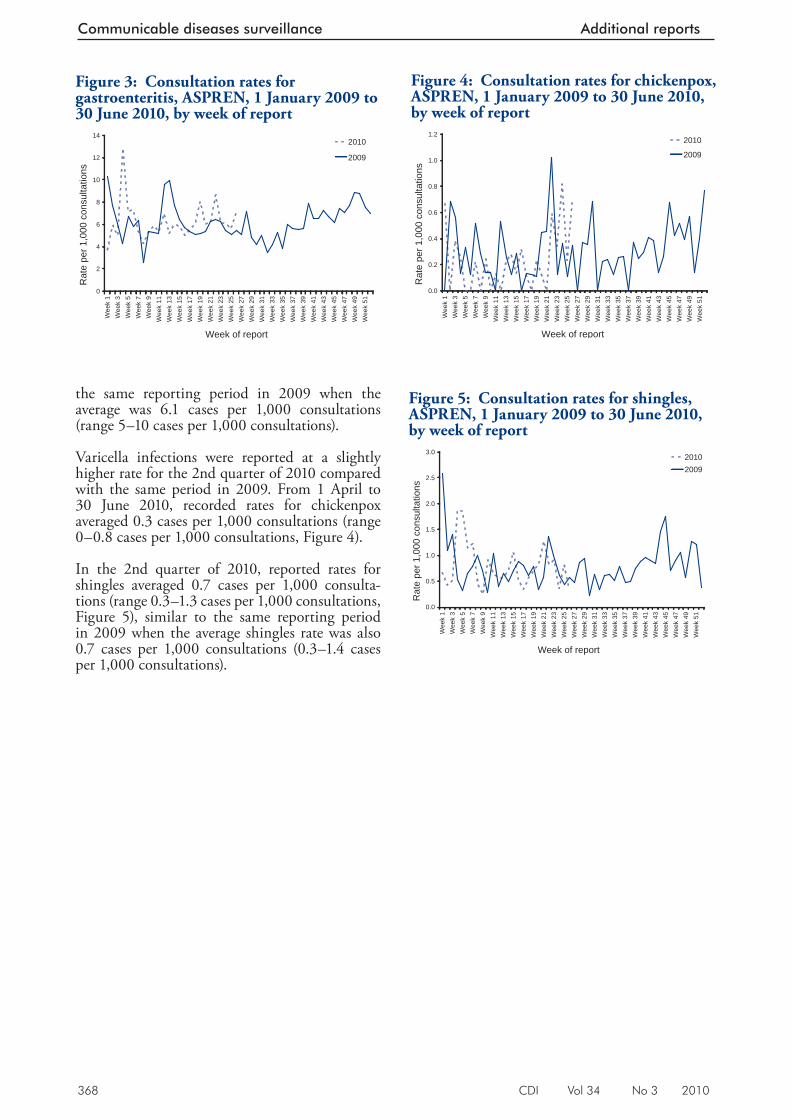
368 CDI Vol 34 No 3 2010
Communicable diseases surveillance Additional reports
the same reporting period in 2009 when the average was 6.1 cases per 1,000 consultations (range 5–10 cases per 1,000 consultations).
Varicella infections were reported at a slightly higher rate for the 2nd quarter of 2010 compared with the same period in 2009. From 1 April to 30 June 2010, recorded rates for chickenpox averaged 0.3 cases per 1,000 consultations (range 0–0.8 cases per 1,000 consultations, Figure 4).
In the 2nd quarter of 2010, reported rates for shingles averaged 0.7 cases per 1,000 consulta-tions (range 0.3–1.3 cases per 1,000 consultations, Figure 5), similar to the same reporting period in 2009 when the average shingles rate was also 0.7 cases per 1,000 consultations (0.3–1.4 cases per 1,000 consultations).
Figure 4: Consultation rates for chickenpox, ASPREN, 1 January 2009 to 30 June 2010, by week of report
0.0
0.2
0.4
0.6
0.8
1.0
1.2
Wee
k 1
Wee
k 3
Wee
k 5
Wee
k 7
Wee
k 9
Wee
k 11
Wee
k 13
Wee
k 15
Wee
k 17
Wee
k 19
Wee
k 21
Wee
k 23
Wee
k 25
Wee
k 27
Wee
k 29
Wee
k 31
Wee
k 33
Wee
k 35
Wee
k 37
Wee
k 39
Wee
k 41
Wee
k 43
Wee
k 45
Wee
k 47
Wee
k 49
Wee
k 51
Week of report
Rat
e pe
r 1,0
00 c
onsu
ltatio
ns
2010
2009
Figure 5: Consultation rates for shingles, ASPREN, 1 January 2009 to 30 June 2010, by week of report
0.0
0.5
1.0
1.5
2.0
2.5
3.0W
eek
1W
eek
3W
eek
5W
eek
7W
eek
9W
eek
11W
eek
13W
eek
15W
eek
17W
eek
19W
eek
21W
eek
23W
eek
25W
eek
27W
eek
29W
eek
31W
eek
33W
eek
35W
eek
37W
eek
39W
eek
41W
eek
43W
eek
45W
eek
47W
eek
49W
eek
51
Week of report
Rat
e pe
r 1,0
00 c
onsu
ltatio
ns
20102009
Figure 3: Consultation rates for gastroenteritis, ASPREN, 1 January 2009 to 30 June 2010, by week of report
0
2
4
6
8
10
12
14
Wee
k 1
Wee
k 3
Wee
k 5
Wee
k 7
Wee
k 9
Wee
k 11
Wee
k 13
Wee
k 15
Wee
k 17
Wee
k 19
Wee
k 21
Wee
k 23
Wee
k 25
Wee
k 27
Wee
k 29
Wee
k 31
Wee
k 33
Wee
k 35
Wee
k 37
Wee
k 39
Wee
k 41
Wee
k 43
Wee
k 45
Wee
k 47
Wee
k 49
Wee
k 51
Week of report
Rat
e pe
r 1,0
00 c
onsu
ltatio
ns
2010
2009
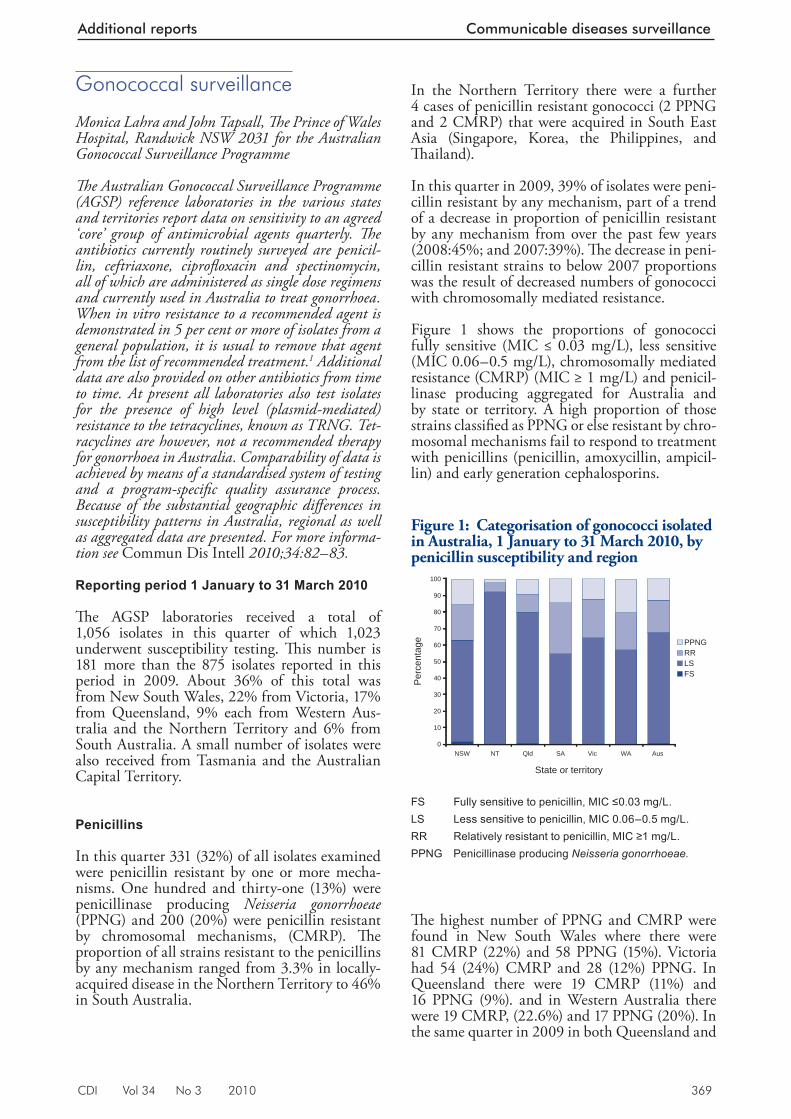
CDI Vol 34 No 3 2010 369
Additional reports Communicable diseases surveillance
Gonococcal surveillance
Monica Lahra and John Tapsall, Th e Prince of Wales Hospital, Randwick NSW 2031 for the Australian Gonococcal Surveillance Programme
Th e Australian Gonococcal Surveillance Programme (AGSP) reference laboratories in the various states and territories report data on sensitivity to an agreed ‘core’ group of antimicrobial agents quarterly. Th e antibiotics currently routinely surveyed are penicil-lin, ceftriaxone, ciprofl oxacin and spectinomycin, all of which are administered as single dose regimens and currently used in Australia to treat gonorrhoea. When in vitro resistance to a recommended agent is demonstrated in 5 per cent or more of isolates from a general population, it is usual to remove that agent from the list of recommended treatment.1 Additional data are also provided on other antibiotics from time to time. At present all laboratories also test isolates for the presence of high level (plasmid-mediated) resistance to the tetracyclines, known as TRNG. Tet-racyclines are however, not a recommended therapy for gonorrhoea in Australia. Comparability of data is achieved by means of a standardised system of testing and a program-specifi c quality assurance process. Because of the substantial geographic diff erences in susceptibility patterns in Australia, regional as well as aggregated data are presented. For more informa-tion see Commun Dis Intell 2010;34:82–83.
Reporting period 1 January to 31 March 2010
Th e AGSP laboratories received a total of 1,056 isolates in this quarter of which 1,023 underwent susceptibility testing. Th is number is 181 more than the 875 isolates reported in this period in 2009. About 36% of this total was from New South Wales, 22% from Victoria, 17% from Queensland, 9% each from Western Aus-tralia and the Northern Territory and 6% from South Australia. A small number of isolates were also received from Tasmania and the Australian Capital Territory.
Penicillins
In this quarter 331 (32%) of all isolates examined were penicillin resistant by one or more mecha-nisms. One hundred and thirty-one (13%) were penicillinase producing Neisseria gonorrhoeae (PPNG) and 200 (20%) were penicillin resistant by chromosomal mechanisms, (CMRP). Th e proportion of all strains resistant to the penicillins by any mechanism ranged from 3.3% in locally-acquired disease in the Northern Territory to 46% in South Australia.
In the Northern Territory there were a further 4 cases of penicillin resistant gonococci (2 PPNG and 2 CMRP) that were acquired in South East Asia (Singapore, Korea, the Philippines, and Th ailand).
In this quarter in 2009, 39% of isolates were peni-cillin resistant by any mechanism, part of a trend of a decrease in proportion of penicillin resistant by any mechanism from over the past few years (2008:45%; and 2007:39%). Th e decrease in peni-cillin resistant strains to below 2007 proportions was the result of decreased numbers of gonococci with chromosomally mediated resistance.
Figure 1 shows the proportions of gonococci fully sensitive (MIC ≤ 0.03 mg/L), less sensitive (MIC 0.06–0.5 mg/L), chromosomally mediated resistance (CMRP) (MIC ≥ 1 mg/L) and penicil-linase producing aggregated for Australia and by state or territory. A high proportion of those strains classifi ed as PPNG or else resistant by chro-mosomal mechanisms fail to respond to treatment with penicillins (penicillin, amoxycillin, ampicil-lin) and early generation cephalosporins.
Th e highest number of PPNG and CMRP were found in New South Wales where there were 81 CMRP (22%) and 58 PPNG (15%). Victoria had 54 (24%) CMRP and 28 (12%) PPNG. In Queensland there were 19 CMRP (11%) and 16 PPNG (9%). and in Western Australia there were 19 CMRP, (22.6%) and 17 PPNG (20%). In the same quarter in 2009 in both Queensland and
Figure 1: Categorisation of gonococci isolated in Australia, 1 January to 31 March 2010, by penicillin susceptibility and region
0
10
20
30
40
50
60
70
80
90
100
NSW NT Qld SA Vic WA Aus
State or territory
Per
cent
age PPNG
RRLSFS
FS Fully sensitive to penicillin, MIC ≤0.03 mg/L. LS Less sensitive to penicillin, MIC 0.06–0.5 mg/L. RR Relatively resistant to penicillin, MIC ≥1 mg/L. PPNG Penicillinase producing Neisseria gonorrhoeae.
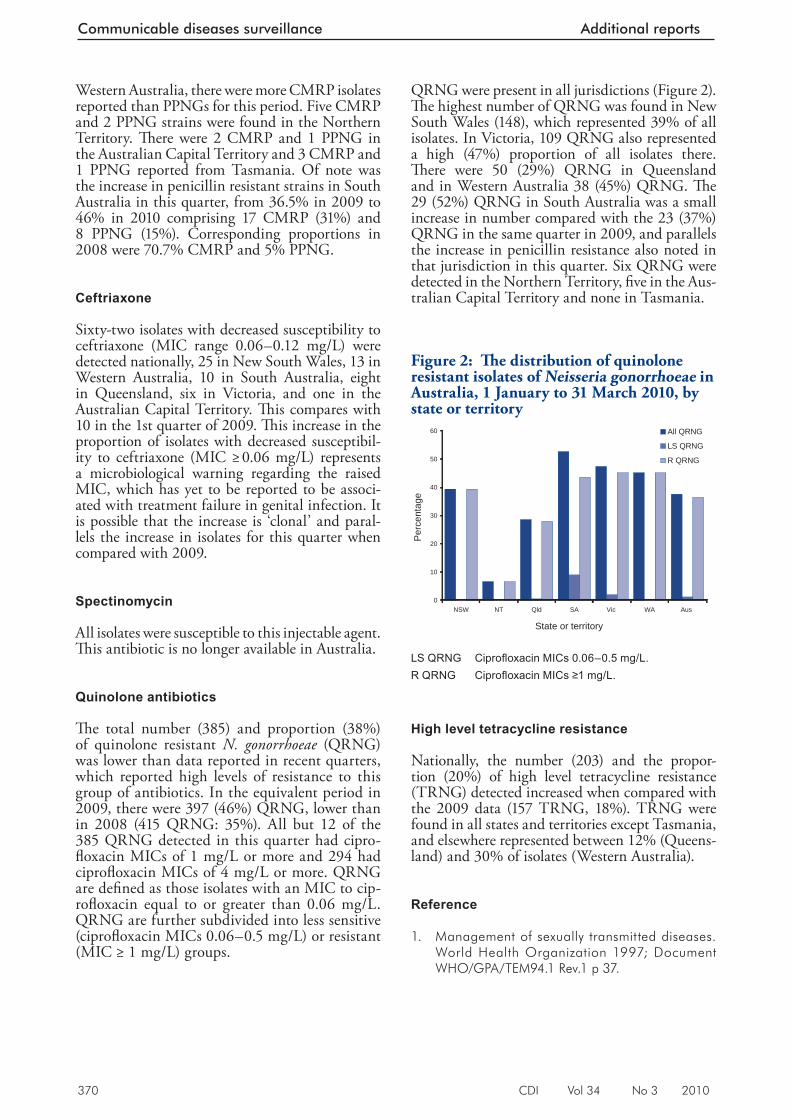
370 CDI Vol 34 No 3 2010
Communicable diseases surveillance Additional reports
QRNG were present in all jurisdictions (Figure 2). Th e highest number of QRNG was found in New South Wales (148), which represented 39% of all isolates. In Victoria, 109 QRNG also represented a high (47%) proportion of all isolates there. Th ere were 50 (29%) QRNG in Queensland and in Western Australia 38 (45%) QRNG. Th e 29 (52%) QRNG in South Australia was a small increase in number compared with the 23 (37%) QRNG in the same quarter in 2009, and parallels the increase in penicillin resistance also noted in that jurisdiction in this quarter. Six QRNG were detected in the Northern Territory, fi ve in the Aus-tralian Capital Territory and none in Tasmania.
High level tetracycline resistance
Nationally, the number (203) and the propor-tion (20%) of high level tetracycline resistance (TRNG) detected increased when compared with the 2009 data (157 TRNG, 18%). TRNG were found in all states and territories except Tasmania, and elsewhere represented between 12% (Queens-land) and 30% of isolates (Western Australia).
Reference
1. Management of sexually transmitted diseases. World Health Organization 1997; Document WHO/GPA/TEM94.1 Rev.1 p 37.
Western Australia, there were more CMRP isolates reported than PPNGs for this period. Five CMRP and 2 PPNG strains were found in the Northern Territory. Th ere were 2 CMRP and 1 PPNG in the Australian Capital Territory and 3 CMRP and 1 PPNG reported from Tasmania. Of note was the increase in penicillin resistant strains in South Australia in this quarter, from 36.5% in 2009 to 46% in 2010 comprising 17 CMRP (31%) and 8 PPNG (15%). Corresponding proportions in 2008 were 70.7% CMRP and 5% PPNG.
Ceftriaxone
Sixty-two isolates with decreased susceptibility to ceftriaxone (MIC range 0.06–0.12 mg/L) were detected nationally, 25 in New South Wales, 13 in Western Australia, 10 in South Australia, eight in Queensland, six in Victoria, and one in the Australian Capital Territory. Th is compares with 10 in the 1st quarter of 2009. Th is increase in the proportion of isolates with decreased susceptibil-ity to ceftriaxone (MIC ≥ 0.06 mg/L) represents a microbiological warning regarding the raised MIC, which has yet to be reported to be associ-ated with treatment failure in genital infection. It is possible that the increase is ‘clonal’ and paral-lels the increase in isolates for this quarter when compared with 2009.
Spectinomycin
All isolates were susceptible to this injectable agent. Th is antibiotic is no longer available in Australia.
Quinolone antibiotics
Th e total number (385) and proportion (38%) of quinolone resistant N. gonorrhoeae (QRNG) was lower than data reported in recent quarters, which reported high levels of resistance to this group of antibiotics. In the equivalent period in 2009, there were 397 (46%) QRNG, lower than in 2008 (415 QRNG: 35%). All but 12 of the 385 QRNG detected in this quarter had cipro-fl oxacin MICs of 1 mg/L or more and 294 had ciprofl oxacin MICs of 4 mg/L or more. QRNG are defi ned as those isolates with an MIC to cip-rofl oxacin equal to or greater than 0.06 mg/L. QRNG are further subdivided into less sensitive (ciprofl oxacin MICs 0.06–0.5 mg/L) or resistant (MIC ≥ 1 mg/L) groups.
Figure 2: Th e distribution of quinolone resistant isolates of Neisseria gonorrhoeae in Australia, 1 January to 31 March 2010, by state or territory
0
10
20
30
40
50
60
NSW NT Qld SA Vic WA Aus
State or territory
Per
cent
age
All QRNG
LS QRNG
R QRNG
LS QRNG Ciprofl oxacin MICs 0.06–0.5 mg/L. R QRNG Ciprofl oxacin MICs ≥1 mg/L.
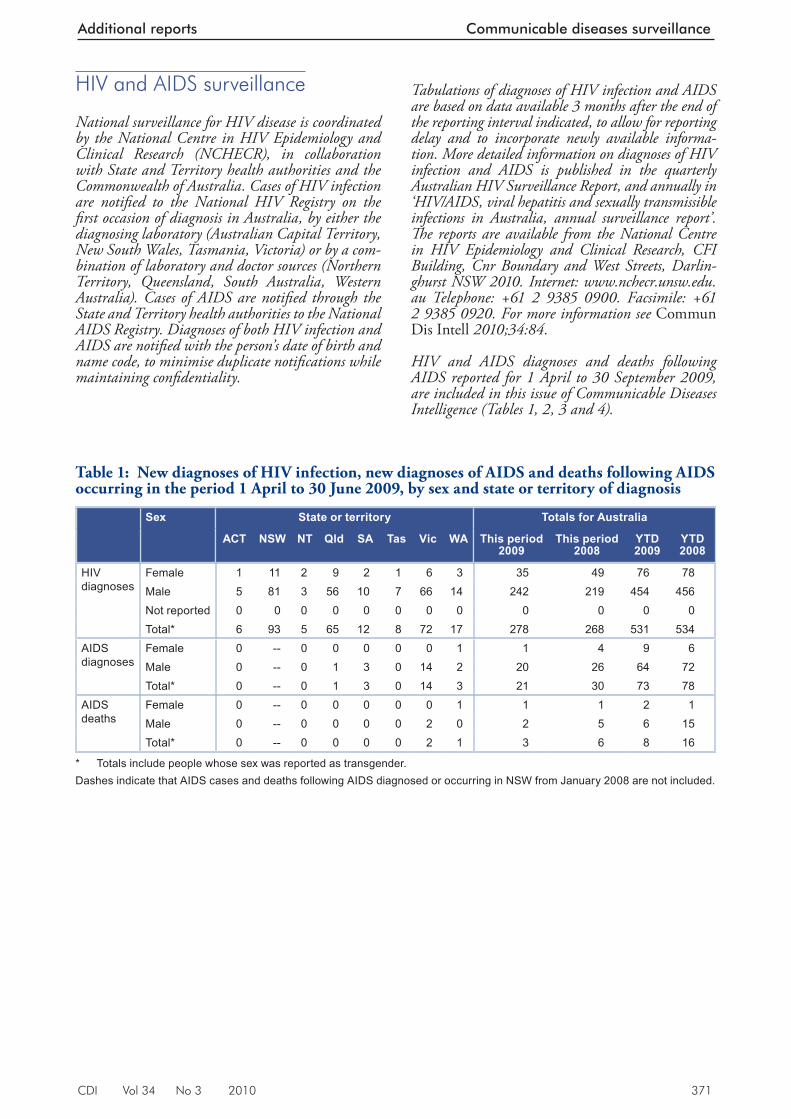
CDI Vol 34 No 3 2010 371
Additional reports Communicable diseases surveillance
Table 1: New diagnoses of HIV infection, new diagnoses of AIDS and deaths following AIDS occurring in the period 1 April to 30 June 2009, by sex and state or territory of diagnosis
Sex State or territory Totals for Australia
ACT NSW NT Qld SA Tas Vic WA This period 2009
This period 2008
YTD 2009
YTD 2008
HIV diagnoses
Female 1 11 2 9 2 1 6 3 35 49 76 78Male 5 81 3 56 10 7 66 14 242 219 454 456Not reported 0 0 0 0 0 0 0 0 0 0 0 0Total* 6 93 5 65 12 8 72 17 278 268 531 534
AIDS diagnoses
Female 0 -- 0 0 0 0 0 1 1 4 9 6Male 0 -- 0 1 3 0 14 2 20 26 64 72Total* 0 -- 0 1 3 0 14 3 21 30 73 78
AIDS deaths
Female 0 -- 0 0 0 0 0 1 1 1 2 1Male 0 -- 0 0 0 0 2 0 2 5 6 15Total* 0 -- 0 0 0 0 2 1 3 6 8 16
* Totals include people whose sex was reported as transgender.Dashes indicate that AIDS cases and deaths following AIDS diagnosed or occurring in NSW from January 2008 are not included.
HIV and AIDS surveillance
National surveillance for HIV disease is coordinated by the National Centre in HIV Epidemiology and Clinical Research (NCHECR), in collaboration with State and Territory health authorities and the Commonwealth of Australia. Cases of HIV infection are notifi ed to the National HIV Registry on the fi rst occasion of diagnosis in Australia, by either the diagnosing laboratory (Australian Capital Territory, New South Wales, Tasmania, Victoria) or by a com-bination of laboratory and doctor sources (Northern Territory, Queensland, South Australia, Western Australia). Cases of AIDS are notifi ed through the State and Territory health authorities to the National AIDS Registry. Diagnoses of both HIV infection and AIDS are notifi ed with the person’s date of birth and name code, to minimise duplicate notifi cations while maintaining confi dentiality.
Tabulations of diagnoses of HIV infection and AIDS are based on data available 3 months after the end of the reporting interval indicated, to allow for reporting delay and to incorporate newly available informa-tion. More detailed information on diagnoses of HIV infection and AIDS is published in the quarterly Australian HIV Surveillance Report, and annually in ‘HIV/AIDS, viral hepatitis and sexually transmissible infections in Australia, annual surveillance report’. Th e reports are available from the National Centre in HIV Epidemiology and Clinical Research, CFI Building, Cnr Boundary and West Streets, Darlin-ghurst NSW 2010. Internet: www.nchecr.unsw.edu.au Telephone: +61 2 9385 0900. Facsimile: +61 2 9385 0920. For more information see Commun Dis Intell 2010;34:84.
HIV and AIDS diagnoses and deaths following AIDS reported for 1 April to 30 September 2009, are included in this issue of Communicable Diseases Intelligence (Tables 1, 2, 3 and 4).
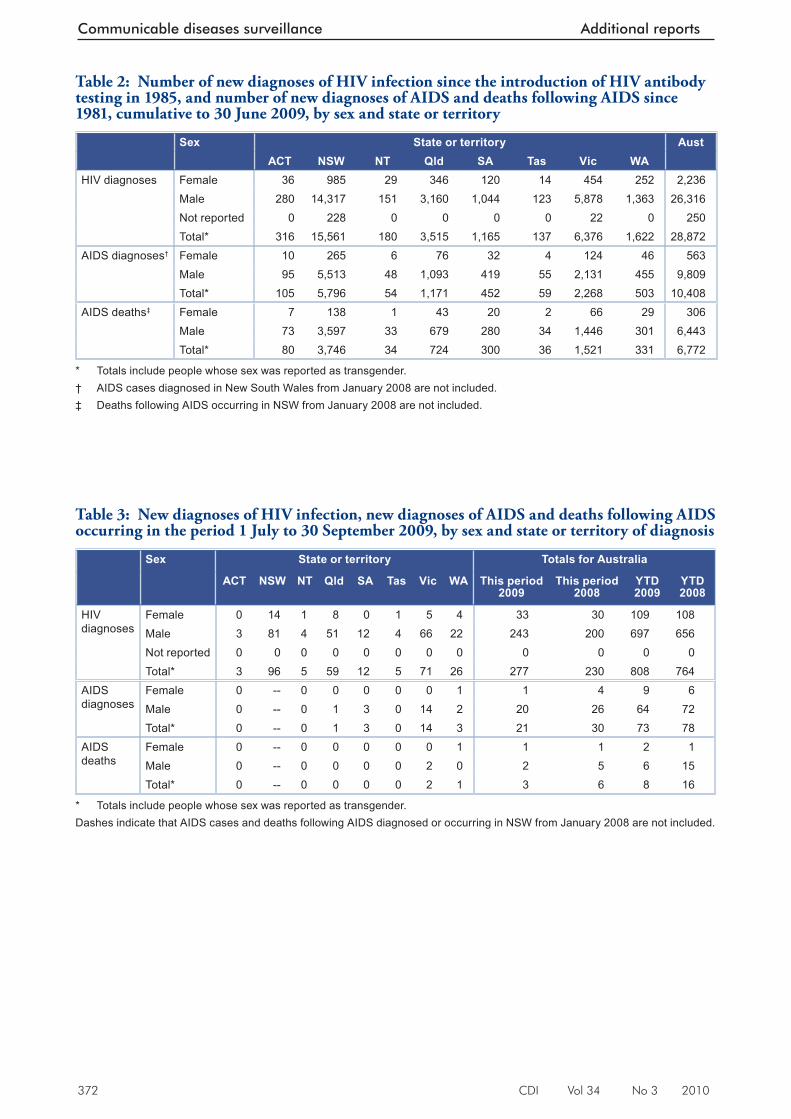
372 CDI Vol 34 No 3 2010
Communicable diseases surveillance Additional reports
Table 3: New diagnoses of HIV infection, new diagnoses of AIDS and deaths following AIDS occurring in the period 1 July to 30 September 2009, by sex and state or territory of diagnosis
Sex State or territory Totals for Australia
ACT NSW NT Qld SA Tas Vic WA This period 2009
This period 2008
YTD 2009
YTD 2008
HIV diagnoses
Female 0 14 1 8 0 1 5 4 33 30 109 108Male 3 81 4 51 12 4 66 22 243 200 697 656Not reported 0 0 0 0 0 0 0 0 0 0 0 0Total* 3 96 5 59 12 5 71 26 277 230 808 764
AIDS diagnoses
Female 0 -- 0 0 0 0 0 1 1 4 9 6Male 0 -- 0 1 3 0 14 2 20 26 64 72Total* 0 -- 0 1 3 0 14 3 21 30 73 78
AIDS deaths
Female 0 -- 0 0 0 0 0 1 1 1 2 1Male 0 -- 0 0 0 0 2 0 2 5 6 15Total* 0 -- 0 0 0 0 2 1 3 6 8 16
* Totals include people whose sex was reported as transgender.Dashes indicate that AIDS cases and deaths following AIDS diagnosed or occurring in NSW from January 2008 are not included.
Table 2: Number of new diagnoses of HIV infection since the introduction of HIV antibody testing in 1985, and number of new diagnoses of AIDS and deaths following AIDS since 1981, cumulative to 30 June 2009, by sex and state or territory
Sex State or territory AustACT NSW NT Qld SA Tas Vic WA
HIV diagnoses Female 36 985 29 346 120 14 454 252 2,236Male 280 14,317 151 3,160 1,044 123 5,878 1,363 26,316Not reported 0 228 0 0 0 0 22 0 250Total* 316 15,561 180 3,515 1,165 137 6,376 1,622 28,872
AIDS diagnoses† Female 10 265 6 76 32 4 124 46 563Male 95 5,513 48 1,093 419 55 2,131 455 9,809Total* 105 5,796 54 1,171 452 59 2,268 503 10,408
AIDS deaths‡ Female 7 138 1 43 20 2 66 29 306Male 73 3,597 33 679 280 34 1,446 301 6,443Total* 80 3,746 34 724 300 36 1,521 331 6,772
* Totals include people whose sex was reported as transgender.† AIDS cases diagnosed in New South Wales from January 2008 are not included.‡ Deaths following AIDS occurring in NSW from January 2008 are not included .
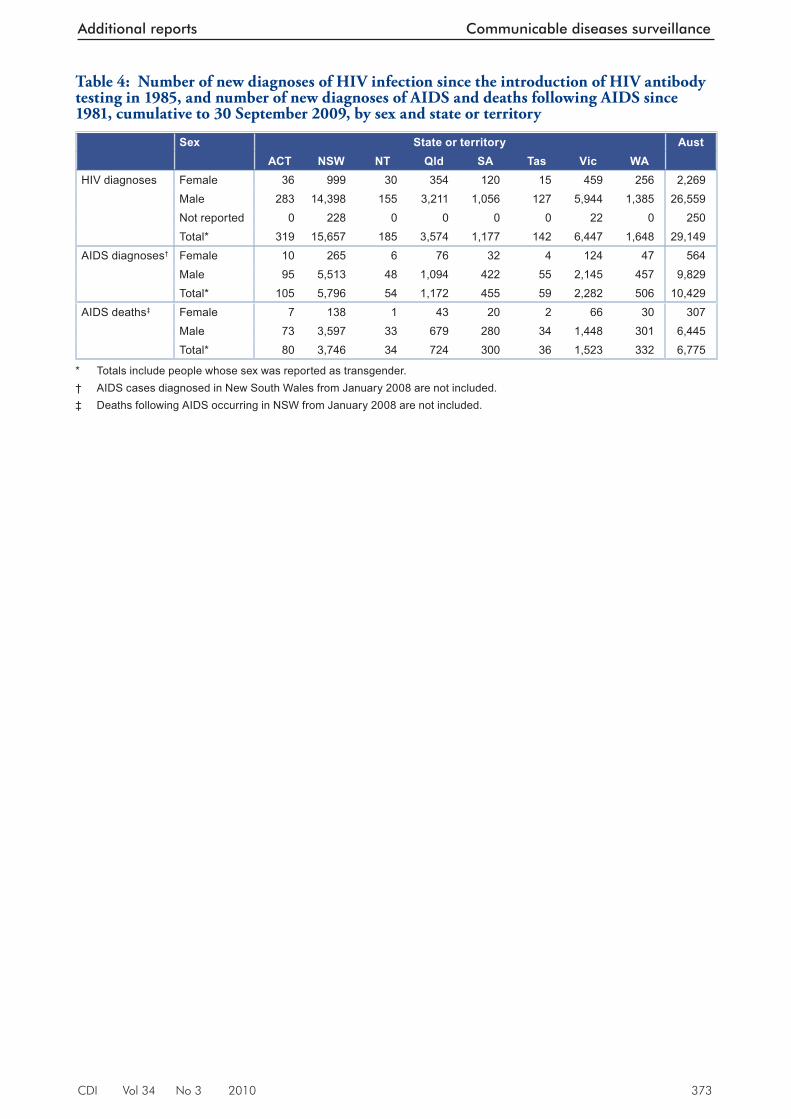
CDI Vol 34 No 3 2010 373
Additional reports Communicable diseases surveillance
Table 4: Number of new diagnoses of HIV infection since the introduction of HIV antibody testing in 1985, and number of new diagnoses of AIDS and deaths following AIDS since 1981, cumulative to 30 September 2009, by sex and state or territory
Sex State or territory AustACT NSW NT Qld SA Tas Vic WA
HIV diagnoses Female 36 999 30 354 120 15 459 256 2,269Male 283 14,398 155 3,211 1,056 127 5,944 1,385 26,559Not reported 0 228 0 0 0 0 22 0 250Total* 319 15,657 185 3,574 1,177 142 6,447 1,648 29,149
AIDS diagnoses† Female 10 265 6 76 32 4 124 47 564Male 95 5,513 48 1,094 422 55 2,145 457 9,829Total* 105 5,796 54 1,172 455 59 2,282 506 10,429
AIDS deaths‡ Female 7 138 1 43 20 2 66 30 307Male 73 3,597 33 679 280 34 1,448 301 6,445Total* 80 3,746 34 724 300 36 1,523 332 6,775
* Totals include people whose sex was reported as transgender.† AIDS cases diagnosed in New South Wales from January 2008 are not included.‡ Deaths following AIDS occurring in NSW from January 2008 are not included.
Related Documents