Year ended 30 June 2008 Represented by: ARSN Commonwealth Income Fund 089 461 343 Commonwealth Balanced Fund 089 465 501 Commonwealth Growth Fund 089 455 210 Commonwealth Australian Share Fund 089 463 865 Commonwealth Share Income Fund 089 455 185 Commonwealth Property Securities Fund 089 463 383 Commonwealth International Share Fund 089 456 431 Commonwealth Bond Fund 089 462 813 Commonwealth Cash Management Trust 089 453 449 Colonial First State Investments Limited ABN 98 002 348 352 AFSL 232468 Commonwealth Investment Funds Financial Report

Welcome message from author
This document is posted to help you gain knowledge. Please leave a comment to let me know what you think about it! Share it to your friends and learn new things together.
Transcript

Year ended 30 June 2008
Represented by: ARSNCommonwealth Income Fund 089 461 343Commonwealth Balanced Fund 089 465 501Commonwealth Growth Fund 089 455 210Commonwealth Australian Share Fund 089 463 865Commonwealth Share Income Fund 089 455 185Commonwealth Property Securities Fund 089 463 383Commonwealth International Share Fund 089 456 431Commonwealth Bond Fund 089 462 813Commonwealth Cash Management Trust 089 453 449
Colonial First State Investments Limited ABN 98 002 348 352 AFSL 232468
Commonwealth Investment Funds
Financial Report


Represented by:ARSN
Commonwealth Income Fund 089 461 343Commonwealth Balanced Fund 089 465 501Commonwealth Growth Fund 089 455 210Commonwealth Australian Share Fund 089 463 865Commonwealth Share Income Fund 089 455 185Commonwealth Property Securities Fund 089 463 383Commonwealth International Share Fund 089 456 431Commonwealth Bond Fund 089 462 813Commonwealth Cash Management Trust 089 453 449
COMMONWEALTH INVESTMENT FUNDS
Year Ended 30 June 2008
Financial Report for the
Responsible Entity of the Funds:
COLONIAL FIRST STATE INVESTMENTS LIMITED
ABN 98 002 348 352
Level 29, 52 Martin PlaceSYDNEY NSW 2000

Page
Directors' Report 1 - 6
Auditor's Independence Declaration 7
Income Statements 8 -10
Balance Sheets 11 - 13
Statements of Changes in Equity 14 - 16
Cash Flow Statements 17 - 19
Notes to the Financial Statements 20 - 74
Directors' Declaration 75
Independent Auditor's Report to the Unitholders 76 - 77
COMMONWEALTH INVESTMENT FUNDS
INDEX

COMMONWEALTH INVESTMENT FUNDS
DIRECTORS' REPORTFOR THE YEAR ENDED 30 JUNE 2008
The Directors of Colonial First State Investments Limited (CFSIL), the Responsible Entity of the CommonwealthInvestment Funds ("the Funds"), present their report together with the financial report of the Funds for the financial yearended 30 June 2008.
Change of Auditors
Ernst & Young resigned as auditors and PricewaterhouseCoopers were appointed as auditors of the Funds on 30 November 2007.
Principal Activities
This financial report consists of nine managed funds belonging to the family of funds known as the CommonwealthInvestment Funds. The funds in this financial report are presented as follows:
Commonwealth Income FundCommonwealth Balanced FundCommonwealth Growth FundCommonwealth Australian Share FundCommonwealth Share Income FundCommonwealth Property Securities FundCommonwealth International Share FundCommonwealth Bond FundCommonwealth Cash Management Trust
The above Funds are closed to new investors. Existing investors in the Funds can, however, make additional lump suminvestments or commence or continue a Regular Savings Plan.
The principal activities of the Funds are to invest in accordance with the investment objectives and guidelines as set outin the Information Memorandum and in accordance with the provisions of the Funds' Constitutions.
Date of Constitution and Registration of Funds
The dates of the Constitutions and registration of the Funds with the Australian Securities & Investments Commissionare 24 May 1988 and 7 October 1999 respectively.
Review of Operations The Commonwealth Investment Funds provide investors access to a broad range of investments including money marketsecurities, fixed interest securities, listed property securities, Australian shares, international shares, global resourcesand diversified investments.
The results of the Funds were as follows:
Page 1

COMMONWEALTH INVESTMENT FUNDS
DIRECTORS' REPORTFOR THE YEAR ENDED 30 JUNE 2008
Review of Operations (continued)
Net Profit Attributable to Unitholders
The following represent the net profit attributable to unitholders for the year ended 30 June 2008, together withcomparative figures as at 30 June 2007.
2008 2007$'000 $'000
Commonwealth Income Fund 6,220 23,170Commonwealth Balanced Fund (37,643) 101,973Commonwealth Growth Fund (32,647) 55,712Commonwealth Australian Share Fund (8,857) 22,353Commonwealth Share Income Fund (29,098) 75,543Commonwealth Property Securities Fund (38,800) 20,322Commonwealth International Share Fund (8,214) 3,486Commonwealth Bond Fund 1,881 1,590Commonwealth Cash Management Trust 154,624 163,488
Income
The income distributions per unit for each of the Funds for the years ended 30 June 2008 and 30 June 2007 are shown inNote 4 to the financial report.
Exit Prices
The exit price is the price at which unitholders realise an entitlement in a Fund and is calculated by deducting apredetermined cost of selling (commonly known as the "sell spread"), if applicable, from the net asset value per unit("NAV unit price") of a Fund. NAV unit price is calculated by taking the total fair value of all of a fund's assets on aparticular day, adjusting for any liabilities and then dividing the net fund value by the total number of units held byunitholders on that day.
The following unit prices represent the ex-distribution exit unit prices as at 30 June 2008, together with comparative unitprices as at 30 June 2007.
2008 2007$ $
Commonwealth Income Fund 1.02 1.06Commonwealth Balanced Fund 1.45 1.63Commonwealth Growth Fund 1.45 1.66Commonwealth Australian Share Fund 1.46 1.81Commonwealth Share Income Fund 1.58 1.96Commonwealth Property Securities Fund 0.82 1.81Commonwealth International Share Fund 1.22 1.55Commonwealth Bond Fund 1.12 1.13Commonwealth Cash Management Trust 1.00 1.00
Page 2

COMMONWEALTH INVESTMENT FUNDS
DIRECTORS' REPORTFOR THE YEAR ENDED 30 JUNE 2008
Review of Operations (continued)
Management Costs and Indirect Cost Ratio (ICR)
Management costs include the investment expenses, custody fees and management fees paid or payable as providedunder the Constitution for a Fund. These costs are not paid directly by the unitholders of a Fund and do not includetransactions costs and additional service fees.
The ICR of a Fund is expressed as a percentage of a Fund's management costs over the Fund's average net assets.
The ICR of the Funds for the year ended 30 June 2008 and 30 June 2007are shown in the following table:
ICR ICR2008 2007
% %Commonwealth Income Fund 1.23 1.22Commonwealth Balanced Fund 1.74 1.73Commonwealth Growth Fund 1.70 1.72Commonwealth Australian Share Fund 1.76 1.77Commonwealth Share Income Fund 1.75 1.77Commonwealth Property Securities Fund 1.74 1.76Commonwealth International Share Fund 1.79 1.74Commonwealth Bond Fund 1.25 1.23Commonwealth Cash Management Trust 0.97 0.93
Performance
The Funds' performances set out below assumes that all distributions of income have been reinvested in additional unitsin the Funds and are net of Responsible Entity fees and ongoing expenses. No allowance has been made for income tax.
1 3 5Year Years Years
% % %Commonwealth Income Fund 1.61 3.62 5.16Commonwealth Balanced Fund (5.85) 3.76 8.66Commonwealth Growth Fund (9.22) 2.11 9.34Commonwealth Australian Share Fund (10.19) 6.04 16.15Commonwealth Share Income Fund (10.29) 6.10 16.11Commonwealth Property Securities Fund (43.89) (17.16) 2.62Commonwealth International Share Fund (20.84) (8.09) 2.99Commonwealth Bond Fund 3.70 3.08 3.50Commonwealth Cash Management Trust 6.49 5.99 5.19
Return % per annum
Page 3

COMMONWEALTH INVESTMENT FUNDS
DIRECTORS' REPORTFOR THE YEAR ENDED 30 JUNE 2008
Responsible Entity and Directors
The Responsible Entity of the Funds is Colonial First State Investments Limited. The ultimate holding company is theCommonwealth Bank of Australia (ABN 48 123 123 124).
The Directors of the Responsible Entity in office during the year and up to the date of the report are:
Grahame Petersen Michael John VenterBrian Vincent BissakerPaul RaysonPeter Robert WinneyJohn Robert Dempsey Resigned 15 January 2008Bradley Brian Massey Appointed 21 February 2008
The Responsible Entity is incorporated and domiciled in Australia and has its registered office at Level 29, 52 Martin Place, Sydney, New South Wales, 2000.
Scheme Information
The Funds are registered managed investment schemes domiciled in Australia and have their principal place of businessat Level 29, 52 Martin Place, Sydney, New South Wales, 2000.
Significant Changes in State of Affairs
There were no significant changes in the nature of the Funds' activities during the year.
Matters Subsequent to the End of the Financial Year
No matters or circumstances have arisen since 30 June 2008 that have significantly affected, or may significantlyaffect:
(i) the operations of the Funds in future financial years, or
(ii) the results of those operations in future financial years, or
(iii) the state of affairs of the Funds in future financial years.
Likely Developments and Expected Results of Operations
The Funds are expected to continue to operate in terms of their Constitutions, and will remain invested in accordancewith their investment objectives and guidelines.
At the time of preparing this report the Responsible Entity is not aware of any likely developments which would impactupon the future operations of the Funds.
Page 4

COMMONWEALTH INVESTMENT FUNDS
DIRECTORS' REPORTFOR THE YEAR ENDED 30 JUNE 2008
Indemnification and Insurance Premiums for Officers and auditors
No insurance premiums are paid for out of the assets of the Fund in relation to insurance cover provided to ColonialFirst State Investments Limited or the auditors of the Fund. So long as the officers of Colonial First State InvestmentsLimited act in accordance with the Constitution and the Corporations Act 2001, the officers remain indemnified out ofthe assets of the Fund against losses incurred while acting on behalf of the Fund. The auditors of the Fund are in noway indemnified out of the assets of the Fund.
The Commonwealth Bank of Australia has paid insurance premiums for the benefit of the officers of the ResponsibleEntity and the Compliance Committee members. Details of the nature of the liabilities covered or the amount of thepremium paid has not been included as such disclosure is prohibited under the terms of the insurance contracts.
Fees Paid to and Interest Held in the Funds by the Responsible Entity or its Associates
Fees paid to the Responsible Entity and its associates out of the Funds' assets during the year are disclosed in the Income Statements.
No fees were paid to the Directors of the Responsible Entity during the year out of the Funds' assets.
There are no interests in the Funds held by the Responsible Entity or its associates at the end of the financial year .
Interests in the Funds
The units issued and redeemed in the Funds during the year and the number of units on issue at the end of the financialyear are set out in Note 6(a) to the financial statements. The value of the Funds' assets at the end of the financial yearare set out in the Balance Sheets.
Environmental Regulation
The Funds' operations are not subject to any particular or significant environmental regulations under a Commonwealth,State or Territory law. There have been no known significant breaches of any other environmental requirements applicableto the Funds.
Rounding of amounts to the nearest thousand dollars
The Fund is a registered scheme of a kind referred to in Class Order 98/0100 (as amended) issued by the AustralianSecurities & Investments Commission relating to the "rounding off" of amounts in the Directors' Report and theFinancial Report. Amounts in the Directors' Report and the Financial Report have been rounded to the nearestthousand dollars in accordance with that Class Order, unless otherwise indicated.
Single Financial Report
The Funds are of the kind referred to in Class Order 06/0441 dated 29 June 2006 and in accordance with that ClassOrder, Funds with a common Responsible Entity can include the financial statements in adjacent columns in a singlefinancial report.
Proceed from redeeming units in Commonwealth Cash Management Trust can be applied to aquire units in all the otherFunds. Proceeds from redeeming units in the other Funds can be applied to acquire units in the Commonwealth CashManagement Trust only.
Page 5

COMMONWEALTH INVESTMENT FUNDS
DIRECTORS' REPORTFOR THE YEAR ENDED 30 JUNE 2008
Auditor's Independence Declaration
A copy of the Auditor's Independence Declaration as required under Section 307C of the Corporations Act 2001 is set outon Page 7.
Signed in accordance with a resolution of the Directors of Colonial First State Investments Limited.
Bradley Brian MasseyDirectorSydney4 September 2008
Page 6


1/7/2007 - 1/7/2006 - 1/7/2007 - 1/7/2006 - 1/7/2007 - 1/7/2006 -30/06/2008 30/06/2007 30/06/2008 30/06/2007 30/06/2008 30/06/2007
$'000 $'000 $'000 $'000 $'000 $'000Notes
Investment income
Interest income 13,627 14,945 436 367 3,238 3,381 Distribution income 6,515 8,032 36,078 67,106 6,269 11,262 Dividend Income 1,426 1,976 - - 5,168 5,676 Changes in fair value of financialinstruments held for trading (11,547) 2,671 (65,481) 44,017 (42,037) 41,489 Other income 10 17 16 28 9 28 Responsible Entity fees rebate 535 636 2,322 2,484 940 1,013 Net foreign exchange (loss)/gain (1) 1 - - - 5
Total investment income/(loss) 10,565 28,278 (26,629) 114,002 (26,413) 62,854
Expenses
Audit fees 10 8 10 8 10 8 Responsible Entity's management fees 8(c) 3,695 4,368 9,889 10,861 5,383 6,095 Registry fees 538 498 1,034 915 540 457 Custody fees 11 13 - - 12 12 Other expenses 46 136 81 245 49 130 Brokerage costs 45 85 - - 240 440
Total operating expenses 4,345 5,108 11,014 12,029 6,234 7,142
Operating profit/(loss)attributable to unitholders 6,220 23,170 (37,643) 101,973 (32,647) 55,712
Distributions to unitholders 4 (18,833) (29,016) (33,341) (104,994) (13,940) (61,579)
Decrease in net assetsattributable to unitholders from operations 6(a) 12,613 5,846 70,984 3,021 46,587 5,867
Profit/(Loss) for the year - - - - - -
The above Income Statements should be read in conjunction with the accompanying notes.
Income Fund Balanced Fund Growth Fund
COMMONWEATLH INVESTMENT FUNDS
INCOME STATEMENTSFOR THE YEAR ENDED 30 JUNE 2008
Commonwealth Commonwealth Commonwealth
Page 8

1/7/2007 - 1/7/2006 - 1/7/2007 - 1/7/2006 - 1/7/2007 - 1/7/2006 -30/06/2008 30/06/2007 30/06/2008 30/06/2007 30/06/2008 30/06/2007
$'000 $'000 $'000 $'000 $'000 $'000Notes
Investment income
Interest income 597 193 2,052 629 58 49 Distribution income 716 1,358 2,336 4,603 - - Dividend Income 2,710 3,197 8,937 10,853 4,135 5,557 Changes in fair value of financialinstruments held for trading (11,249) 19,402 (37,047) 65,555 (41,715) 16,540 Other income 3 6 13 7 26 9 Responsible Entity fees rebate 61 72 200 246 - - Net foreign exchange gain 2 2 8 8 - -
Total investment income/(loss) (7,160) 24,230 (23,501) 81,901 (37,496) 22,155
Expenses
Audit fees 10 8 10 8 10 8 Responsible Entity's management fees 8(c) 1,408 1,530 4,670 5,175 1,136 1,607 Registry fees 135 140 455 465 102 152 Custody fees 6 5 13 14 4 5 Other expenses 17 31 39 104 15 34 Brokerage costs 121 163 410 592 37 27
Total operating expenses 1,697 1,877 5,597 6,358 1,304 1,833
Operating (loss)/profitattributable to unitholders (8,857) 22,353 (29,098) 75,543 (38,800) 20,322
Distributions to unitholders 4 (10,414) (20,152) (35,482) (68,874) (12,037) (16,010)
Decrease/(Increase) in net assets attributable to unitholdersfrom operations 6(a) 19,271 (2,201) 64,580 (6,669) 50,837 (4,312)
Profit/(Loss) for the year - - - - - -
The above Income Statements should be read in conjunction with the accompanying notes.
Australian Share Share Income Fund Property SecuritiesFund Fund
INCOME STATEMENTSFOR THE YEAR ENDED 30 JUNE 2008
Commonwealth Commonwealth Commonwealth
COMMONWEATLH INVESTMENT FUNDS
Page 9

1/7/2007 - 1/7/2006 - 1/7/2007 - 1/7/2006 - 1/7/2007 - 1/7/2006 -30/06/2008 30/06/2007 30/06/2008 30/06/2007 30/06/2008 30/06/2007
$'000 $'000 $'000 $'000 $'000 $'000Notes
Investment income
Interest income 52 48 3,200 3,729 185,480 192,212 Distribution income 469 743 - - - - Changes in fair value of financialinstruments held for trading (8,310) 3,286 (694) (1,390) (6,238) (389) Other income - 1 2 5 - 1 Responsible Entity fees rebate 218 288 - - - -
Total investment income/(loss) (7,571) 4,366 2,508 2,344 179,242 191,824
Expenses
Audit fees 10 7 10 7 10 8 Responsible Entity's management fees 8(c) 562 785 522 650 19,584 23,447 Registry fees 56 71 78 74 4,240 4,116 Custody fees - - 3 3 129 143 Other expenses 15 17 13 20 617 602 Brokerage costs - - 1 - 38 20
Total operating expenses 643 880 627 754 24,618 28,336
Operating (loss)/profitattributable to unitholders (8,214) 3,486 1,881 1,590 154,624 163,488
Distributions to unitholders 4 (188) (177) (2,293) (2,276) (160,179) (163,730)
Decrease/(Increase) in netassets attributable to unitholders from operations 6(a) 8,402 (3,309) 412 686 5,555 242
Profit/(Loss) for the year - - - - - -
The above Income Statements should be read in conjunction with the accompanying notes.
International Share Bond Fund Cash ManagementFund Trust
INCOME STATEMENTS
COMMONWEATLH INVESTMENT FUNDS
FOR THE YEAR ENDED 30 JUNE 2008
Commonwealth Commonwealth Commonwealth
Page 10

30/06/2008 30/06/2007 30/06/2008 30/06/2007 30/06/2008 30/06/2007Assets Notes $'000 $'000 $'000 $'000 $'000 $'000
Cash and cash equivalents 5,152 5,789 5,550 8,778 2,543 6,811 Trade and other receivables: - outstanding sales settlement 6,159 - 5,000 - 3,156 12,185 - application monies 2 3 7 110 4 127 - dividends 168 210 795 1,289 938 3,071 - interests 58 95 26 45 12 54 - others 141 150 296 343 263 242 Financial assets held for trading 5 300,109 389,270 570,729 743,580 296,744 387,488
Total assets 311,789 395,517 582,403 754,145 303,660 409,978
Liabilities
Trade and other payables: - outstanding purchase settlements 281 1,666 - - 1,804 13,371 - redemptions 106 433 271 297 201 99 - others 174 316 650 781 130 106 Distribution payable 4,385 8,432 6,368 56,712 1,924 35,199 Fees due to Responsible Entity 8(c) 840 1,064 2,286 2,771 1,210 1,525 Financial liabilities held for trading: - derivatives 5 84 51 - - - -
Total liabilities (excludingnet assets attributable tounitholders 5,870 11,962 9,575 60,561 5,269 50,300 Net assets attributable to unitholders - liability 6(a) 305,919 383,555 572,828 693,584 298,391 359,678
Represented by:Fair value of outstanding unitsbased on redemption value 306,118 383,983 572,586 693,162 298,376 359,461 Adjustments arising from differentunit pricing and AIFRS valuationprinciples (231) (346) - - (287) (347) Buy and sell spread 153 192 - - 448 540 Adjustments to yearend accruals (121) (274) 242 422 (146) 24 Net assets attributable to unitholders 305,919 383,555 572,828 693,584 298,391 359,678
The above Balance Sheets should be read in conjunction with the accompanying notes.
Growth FundIncome Fund
COMMONWEATLH INVESTMENT FUNDS
BALANCE SHEETSAS AT 30 JUNE 2008
Commonwealth Commonwealth CommonwealthBalanced Fund
Page 11

30/06/2008 30/06/2007 30/06/2008 30/06/2007 30/06/2008 30/06/2007Assets Notes $'000 $'000 $'000 $'000 $'000 $'000
Cash and cash equivalents 4,913 7,165 16,253 23,833 2,367 2,253 Trade and other receivables: - outstanding sales settlement 634 - 2,418 - 129 3,563 - application monies 10 - - 100 13 - - dividends 431 493 1,448 1,622 897 1,500 - interests 24 11 87 59 4 6 - others 158 81 175 214 56 62 Financial assets held for trading 5 70,080 96,897 235,618 323,185 39,716 96,125
Total assets 76,250 104,647 255,999 349,013 43,182 103,509
Liabilities
Trade and other payables: - outstanding purchase settlements 357 638 923 2,120 - 2,169 - redemptions 143 39 - 5 - - - others 145 110 201 283 87 121 Distribution payable 396 10,152 2,184 20,419 3,749 9,990 Fees due to Responsible Entity 8(c) 330 426 1,110 1,416 209 439 Financial liabilities held for trading: - derivatives 2 185 120 702 372 - -
Total liabilities (excludingnet assets attributable tounitholders 1,556 11,485 5,120 24,615 4,045 12,719 Net assets attributable to unitholders - liability 6(a) 74,694 93,162 250,879 324,398 39,137 90,790
Represented by:Fair value of outstanding unitsbased on redemption value 74,597 93,033 250,509 323,988 39,224 90,897 Adjustments arising from differentunit pricing and AIFRS valuationprinciples (203) (172) (449) (573) (150) (325) Buy and sell spread 262 327 880 1,138 98 228 Adjustments to yearend accruals 38 (26) (61) (155) (35) (10) Net assets attributable to unitholders 74,694 93,162 250,879 324,398 39,137 90,790
The above Balance Sheets should be read in conjunction with the accompanying notes.
Australian Share Share Income Fund Property SecuritiesFund Fund
COMMONWEATLH INVESTMENT FUNDS
BALANCE SHEETSAS AT 30 JUNE 2008
Commonwealth Commonwealth Commonwealth
Page 12

30/06/2008 30/06/2007 30/06/2008 30/06/2007 30/06/2008 30/06/2007Assets Notes $'000 $'000 $'000 $'000 $'000 $'000
Cash and cash equivalents 783 907 1,714 457 29,443 49,513 Trade and other receivables: - outstanding sales settlement 68 - - - - - - application monies - - 21 - 5,032 7,916 - interests 5 3 20 1 147 79 - others 19 29 21 27 779 626 Financial assets held for trading 5 27,728 44,340 44,662 55,680 2,219,617 2,682,398
Total assets 28,603 45,279 46,438 56,165 2,255,018 2,740,532
Liabilities
Trade and other payables: - redemptions 15 15 - 4 7,772 7,669 - interest on loans - - - 1 - - - others 47 27 46 40 1,172 1,071 Distribution payable 188 102 577 232 39,125 38,040 Fees due to Responsible Entity 8(c) 79 173 128 160 4,789 5,917 Financial liabilities held for trading: - derivatives 5 - - - - 10 -
Total liabilities (excludingnet assets attributable tounitholders 329 317 751 437 52,868 52,697 Net assets attributable to unitholders - liability 6(a) 28,274 44,962 45,687 55,728 2,202,150 2,687,835
Represented by:Fair value of outstanding unitsbased on redemption value 28,278 44,957 45,753 55,802 2,205,969 2,686,099 Adjustments arising from differentunit pricing and AIFRS valuationprinciples - - (32) (48) (153) (319) Buy and sell spread 14 22 - - - - Adjustments to yearend accruals (18) (17) (34) (26) (3,666) 2,055 Net assets attributable to unitholders 28,274 44,962 45,687 55,728 2,202,150 2,687,835
The above Balance Sheets should be read in conjunction with the accompanying notes.
International Share Bond Fund Cash ManagementFund Trust
COMMONWEATLH INVESTMENT FUNDS
BALANCE SHEETSAS AT 30 JUNE 2008
Commonwealth Commonwealth Commonwealth
Page 13

1/7/2007 - 1/7/2006 - 1/7/2007 - 1/7/2006 - 1/7/2007 - 1/7/2006 -30/06/2008 30/06/2007 30/06/2008 30/06/2007 30/06/2008 30/06/2007
$'000 $'000 $'000 $'000 $'000 $'000Total equity at the beginning ofthe financial year - - - - - -
Profit or loss for the year - - - - - -
Net income/(expense) recogniseddirectly in equity
Total recognised income andexpenses for the year - - - - - -
Transactions with equity holdersin their capacity as equity holders - - - - - -
Total equity at the end ofthe financial year - - - - - -
Under AIRFS, net assets attributale to unitholders are classified as a liability rather than equity. As a result there was no equity at the start or end of the year.
The above Statements of Changes in Equity should be read in conjunction with Note 6(a).
Income Fund Balanced Fund Growth Fund
COMMONWEATLH INVESTMENT FUNDS
STATEMENTS OF CHANGES IN EQUITYFOR THE YEAR ENDED 30 JUNE 2008
Commonwealth Commonwealth Commonwealth
Page 14

1/7/2007 - 1/7/2006 - 1/7/2007 - 1/7/2006 - 1/7/2007 - 1/7/2006 -30/06/2008 30/06/2007 30/06/2008 30/06/2007 30/06/2008 30/06/2007
$'000 $'000 $'000 $'000 $'000 $'000Total equity at the beginning ofthe financial year - - - - - -
Profit or loss for the year - - - - - -
Net income/(expense) recogniseddirectly in equity
Total recognised income andexpenses for the year - - - - - -
Transactions with equity holdersin their capacity as equity holders - - - - - -
Total equity at the end ofthe financial year - - - - - -
Under AIRFS, net assets attributale to unitholders are classified as a liability rather than equity. As a result there was no equity at the start or end of the year.
The above Statements of Changes in Equity should be read in conjunction with Note 6(a).
Australian Share Share Income Fund Property SecuritiesFund Fund
COMMONWEATLH INVESTMENT FUNDS
STATEMENTS OF CHANGES IN EQUITYFOR THE YEAR ENDED 30 JUNE 2008
Commonwealth Commonwealth Commonwealth
Page 15

1/7/2007 - 1/7/2006 - 1/7/2007 - 1/7/2006 - 1/7/2007 - 1/7/2006 -30/06/2008 30/06/2007 30/06/2008 30/06/2007 30/06/2008 30/06/2007
$'000 $'000 $'000 $'000 $'000 $'000Total equity at the beginning ofthe financial year - - - - - -
Profit or loss for the year - - - - - -
Net income/(expense) recogniseddirectly in equity
Total recognised income andexpenses for the year - - - - - -
Transactions with equity holdersin their capacity as equity holders - - - - - -
Total equity at the end ofthe financial year - - - - - -
Under AIRFS, net assets attributale to unitholders are classified as a liability rather than equity. As a result there was no equity at the start or end of the year.
The above Statements of Changes in Equity should be read in conjunction with Note 6(a).
International Share Bond Fund Cash ManagementFund Trust
COMMONWEATLH INVESTMENT FUNDS
STATEMENTS OF CHANGES IN EQUITYFOR THE YEAR ENDED 30 JUNE 2008
Commonwealth Commonwealth Commonwealth
Page 16

1/7/2007 - 1/7/2006 - 1/7/2007 - 1/7/2006 - 1/7/2007 - 1/7/2006 -30/06/2008 30/06/2007 30/06/2008 30/06/2007 30/06/2008 30/06/2007
Cash flows from Note $'000 $'000 $'000 $'000 $'000 $'000operating activitiesProceeds from sale of financialinstruments held for trading 536,276 424,718 205,650 276,855 314,078 380,998 Payments for purchase of financial instruments held fortrading (459,866) (359,677) (70,300) (161,700) (260,021) (315,237) Interest received 14,225 15,493 455 344 3,483 3,330 Dividends received 1,114 1,849 3,590 6,341 5,480 5,950 Other income received 9 16 16 28 8 28 Responsible Entity fee paid (3,375) (3,840) (7,999) (8,241) (4,711) (5,128) Other expenses paid (740) (493) (1,177) (1,107) (549) (691) Payment for brokerage costs (45) (85) - - (240) (440) Net cash fromoperating activities 7(a) 87,598 77,981 130,235 112,520 57,528 68,810
Cash flows from financing activitiesReceipts from issue of units 6,790 9,385 9,113 16,459 8,205 11,632 Payment for redemption of units (83,876) (75,167) (122,380) (114,270) (64,057) (70,862) Distributions paid (11,149) (12,298) (20,196) (17,067) (5,944) (7,231)
Net cash used infinancing activities (88,235) (78,080) (133,463) (114,878) (61,796) (66,461)
Net movement in cash andcash equivalents (637) (99) (3,228) (2,358) (4,268) 2,349
Add opening cash and cash equivalents brought forward 5,789 5,888 8,778 11,136 6,811 4,462 Closing cash and cashequivalents carried forward 5,152 5,789 5,550 8,778 2,543 6,811
See Note 7(b) for non-cash financing activities.
The above Cash Flow Statements should be read in conjunction with the accompanying notes.
Income Fund Balanced Fund Growth Fund
COMMONWEATLH INVESTMENT FUNDS
CASH FLOW STATEMENTSFOR THE YEAR ENDED 30 JUNE 2008
Commonwealth Commonwealth Commonwealth
Page 17

1/7/2007 - 1/7/2006 - 1/7/2007 - 1/7/2006 - 1/7/2007 - 1/7/2006 -30/06/2008 30/06/2007 30/06/2008 30/06/2007 30/06/2008 30/06/2007
Cash flows from Note $'000 $'000 $'000 $'000 $'000 $'000operating activitiesProceeds from sale of financialinstruments held for trading 51,098 76,519 172,601 270,685 30,701 21,438 Payments for purchase of financial instruments held fortrading (34,785) (60,058) (120,195) (200,207) (11,702) (7,839) Interest received 583 192 2,025 605 60 47 Dividends received 1,895 2,793 6,282 9,596 1,699 1,602 Other income received 3 5 13 6 25 7 Responsible Entity fee paid (1,526) (1,437) (4,736) (4,872) (1,360) (1,550) Other expenses paid (149) (200) (576) (526) (113) (214) Payment for brokerage costs (121) (163) (410) (592) (42) (27) Net cash fromoperating activities 7(a) 16,998 17,651 55,004 74,695 19,268 13,464
Cash flows from financing activitiesReceipts from issue of units 1,334 2,402 5,470 5,873 636 2,500 Payment for redemption of units (17,411) (12,079) (45,229) (36,863) (13,093) (10,792) Distributions paid (3,173) (2,650) (22,825) (26,234) (6,697) (3,859)
Net cash used infinancing activities (19,250) (12,327) (62,584) (57,224) (19,154) (12,151)
Net movement in cash andcash equivalents (2,252) 5,324 (7,580) 17,471 114 1,313
Add opening cash and cash equivalents brought forward 7,165 1,841 23,833 6,362 2,253 940 Closing cash and cashequivalents carried forward 4,913 7,165 16,253 23,833 2,367 2,253
See Note 7(b) for non-cash financing activities.
The above Cash Flow Statements should be read in conjunction with the accompanying notes.
Australian Share Share Income Fund Property SecuritiesFund Fund
CASH FLOW STATEMENTSFOR THE YEAR ENDED 30 JUNE 2008
Commonwealth Commonwealth Commonwealth
COMMONWEATLH INVESTMENT FUNDS
Page 18

1/7/2007 - 1/7/2006 - 1/7/2007 - 1/7/2006 - 1/7/2007 - 1/7/2006 -30/06/2008 30/06/2007 30/06/2008 30/06/2007 30/06/2008 30/06/2007
Cash flows from Note $'000 $'000 $'000 $'000 $'000 $'000operating activitiesProceeds from sale of financialinstruments held for trading 8,782 13,650 63,867 84,791 9,335,213 20,479,653 Payments for purchase of financial instruments held fortrading (549) - (53,720) (74,581) (8,869,383) (19,915,468) Interest received 50 50 3,356 3,866 176,136 189,336 Dividends received 469 - - - - - Other income received - 1 1 5 - - Responsible Entity fee paid (429) (520) (547) (678) (20,864) (24,073) Other expenses paid (55) (114) (94) (100) (4,775) (5,173) Payment for brokerage costs - - (1) - (38) (20) Net cash fromoperating activities 7(a) 8,268 13,067 12,862 13,303 616,289 724,255
Cash flows from financing activitiesReceipts from issue of units 627 931 104 191 1,197,055 1,505,848 Payment for redemption of units (8,994) (14,059) (10,446) (11,829) (1,815,512) (2,196,505) Distributions paid (25) (43) (1,263) (1,486) (17,902) (18,363)
Net cash used infinancing activities (8,392) (13,171) (11,605) (13,124) (636,359) (709,020)
Net movement in cash andcash equivalents (124) (104) 1,257 179 (20,070) 15,235
Add opening cash and cash equivalents brought forward 907 1,011 457 278 49,513 34,278 Closing cash and cashequivalents carried forward 783 907 1,714 457 29,443 49,513
See Note 7(b) for non-cash financing activities.
The above Cash Flow Statements should be read in conjunction with the accompanying notes.
International Share Bond Fund Cash ManagementFund Trust
COMMONWEATLH INVESTMENT FUNDS
CASH FLOW STATEMENTSFOR THE YEAR ENDED 30 JUNE 2008
Commonwealth Commonwealth Commonwealth
Page 19

COMMONWEALTH INVESTMENT FUNDS
NOTES TO THE FINANCIAL STATEMENTSFOR THE YEAR ENDED 30 JUNE 2008
1. SUMMARY OF SIGNIFICANT ACCOUNTING POLICIES
(a) Basis of Preparation
The financial report is a general purpose financial report, which has been prepared in accordance with the Funds'Constitutions and the requirements of the Corporations Act 2001, which includes Accounting Standards. Othermandatory professional reporting requirements have also been complied with.
The financial report has been prepared in accordance with the historical cost convention, except for the valuation of certaininvestments in financial assets and liabilities, which have been measured at fair value or amortised cost. These aredescribed in more detail in Note 1(c).
The Balance Sheets are presented on a liquidity basis. Assets and liabilities are presented in decreasing order of liquidityand are not distinguished between current and non-current. All balances are expected to be settled within twelve months,except for financial assets held for trading, loans and net assets attributable to unitholders. The amounts expected to berecovered or settled after more than twelve months in relation to these balances cannot be reliably determined, except asotherwise stated.
The financial report was authorised for issue by the Directors of the Responsible Entity on 29 August 2008.
Both the functional and presentation currency of the Funds is Australian dollars.
(b) Statement of Compliance
The financial report complies with Australian Accounting Standards, which include Australian equivalents to InternationalFinancial Reporting Standards ('AIFRS'). Compliance with AIFRS ensures that the financial report, comprising the financialstatements and notes thereto, complies with International Financial Reporting Standards ('IFRS').
(c) Investments in Financial Assets and Liabilities Held for Trading
Classification
The Funds' investments are classified as held for trading and initially recognised at fair value not including transactioncosts, which are expensed in the income statement.
Recognition/Derecognition
The Funds recognise financial assets and financial liabilities on the date it becomes party to the contractual agreement(trade date) and recognises changes in fair value of the financial assets or financial liabilities from this date.
The derecognition of a financial instrument takes place when the Funds no longer control the contractual rights thatcomprise the financial instrument, which is normally the case when the instrument is sold, or all the cash flowsattributable to the instrument are passed through to an independent third party.
Measurement
After initial recognition, the financial assets held for trading are revalued to fair value at each reporting date.
For financial assets held for trading that are actively traded in organised financial markets, fair value is determined byreference to Exchange quoted market bid prices at the close of business on the balance date.
Share price index (SPI) futures contracts are marked to market according to the bid price on the relevant futuresexchange.
Page 20

COMMONWEALTH INVESTMENT FUNDS
NOTES TO THE FINANCIAL STATEMENTSFOR THE YEAR ENDED 30 JUNE 2008
1. SUMMARY OF SIGNIFICANT ACCOUNTING POLICIES (continued)
(c) Investments in Financial Assets and Liabilities Held for Trading (continued)
Measurement (continued)
Convertible notes have been recognised as fixed interest securities in the Balance Sheet. Upon expiry of the note, if it isconverted to shares, the fair value is recognised as listed equity.
For financial liabilities from the short sales of financial instruments that are actively traded in organised financial markets,fair value is determined by reference to Exchange quoted market ask prices at the close of business on the Balance Sheetdate.
For investments where there is no quoted market price, fair value is determined by reference to the current market value ofanother instrument which is substantively the same or is calculated based on the expected cash flows of the underlyingnet asset base of the investment. The fair value of units in unlisted Managed Investment Schemes is determined byreference to published bid prices at the close of business on the Balance Sheet date being the redemption price asestablished by the underlying Fund's Responsible Entity.
Gains or losses on investments held for trading are recognised in the Income Statements. Investments of the Funds whichare considered to be held for trading are equity securities and derivatives.
(d) Investment Income
Income is recognised to the extent that it is probable that the economic benefits will flow to the Funds and the incomecan be reliably measured. The following specific recognition criteria must also be met before income is recognised:
Dividend and Distribution income
Income is recognised when the right to receive the payment is established.
Interest income
Income is recognised as the interest accrues (using the effective interest rate method, which is the rate that exactlydiscounts estimated future cash receipts through the expected life of the financial instrument) to the net carrying amountof the financial asset.
Changes in the fair value of financial assets and liabilities held for trading
Gains or losses on financial assets and liabilities held for trading are calculated as the difference between the fair value atsale, or during the year/period end, and the fair value at the previous valuation point. This includes both realised andunrealised gains and losses.
(e) Cash and cash equivalents
Cash and cash equivalents in the Balance Sheets comprise cash at bank, deposits at call with futures clearing house andshort-term deposits with an original maturity of three months or less.
For the purposes of the Cash Flow Statements, cash and cash equivalents are as defined above, net of outstanding bankoverdrafts.
Page 21

COMMONWEALTH INVESTMENT FUNDS
NOTES TO THE FINANCIAL STATEMENTSFOR THE YEAR ENDED 30 JUNE 2008
1. SUMMARY OF SIGNIFICANT ACCOUNTING POLICIES (continued)
(f) Trade and Other Receivables
Receivables are recognised and carried at the original invoice amount, less a provision for any uncollectible debts. Anestimate for doubtful debts is made when collection of an amount is no longer probable. Bad debts are written off whenidentified.
Amounts are generally received within 30 days of being recorded as receivables.
(g) Trade and Other Payables
Liabilities for creditors are carried at cost, which is the fair value of the consideration to be paid in the future for goods andservices received, whether or not billed to the Funds.
Payables include outstanding settlements on the purchase of financial assets and liabilities held for trading anddistributions payable. The carrying period is dictated by market conditions and is generally less than 30 days.
(h) Taxation
Under current legislation, the Funds are not subject to income tax provided the unitholders are presently entitled to theincome of the Funds and the Funds fully distribute their taxable income.
(i) Distributions
In accordance with the Funds' Constitutions, the Funds fully distribute their distributable income to unitholders.Distributions are payable at the end of each month, quarter or half-year. Such distributions are determined by reference to the taxable income of the Funds. Distributable income includes capital gains arising from the disposal of financial assets and liabilities held for trading. Unrealised gains and losses on financial assets and liabilities held for trading that arerecognised as income are transferred to net assets attributable to unitholders and are not assessable and distributableuntil realised. Capital losses are not distributed to unitholders but are retained to be offset against any realised capitalgains.
(j) Foreign Currency
Foreign Currency Transactions
Transactions in foreign currencies are initially recorded in the functional currency at the exchange rates ruling at the dateof the transaction. Monetary assets and liabilities denominated in foreign currencies are retranslated at the rate ofexchange ruling at the Balance Sheets date.
Exchange differences arising on the settlement of monetary items or on translating monetary items at rates different fromthose at which they were translated on initial recognition during the period or in a previous financial report, are recognisedin the profit or loss in the period in which they arise.
Foreign Currency Translations
Items included in the Fund's Financial Statements are measured using the currency of the primary economic environmentin which it operates ("the functional currency"). This is the Australian dollar, which reflects the currency of the economyin which the Funds competes for funds and is regulated. The Australian dollar is also the Funds presentation currency.
The Funds does not isolate that portion of gains or losses on securities and derivative financial instruments that aremeasured at fair value through profit and loss and which is due to changes in foreign exchange rates from that which isdue to changes in the market price of securities. Such fluctuations are included with the net gains or losses onfinancial instruments at fair value through profit and loss.
Page 22

COMMONWEALTH INVESTMENT FUNDS
NOTES TO THE FINANCIAL STATEMENTSFOR THE YEAR ENDED 30 JUNE 2008
1. SUMMARY OF SIGNIFICANT ACCOUNTING POLICIES (continued)
(k) Unit Prices
Unit prices are determined in accordance with the Funds' Constitutions and are calculated as the net assets attributableto unitholders, or unitholders' funds of the Fund, less estimated costs, divided by the number of units on issue. Financialassets and liabilities held for trading for unit pricing purposes are valued on a "last sale" price basis.
(l) Terms and Conditions on Units
Each unit issued confers upon the unitholder an equal interest in the Fund, and is of equal value. A unit does not conferany interest in any particular asset or investment of the Fund. Unitholders have various rights under the Constitution andthe Corporations Act 2001, including the right to:
- have their units redeemed;- receive income distributions;- attend and vote at meetings of unitholders; and- participate in the termination and winding up of the Fund.
The rights, obligations and restrictions attached to each unit are identical in all respects.
(m) Net Assets Attributable to Unitholders
Under AASB 132 "Financial Instruments: Disclosure and Presentation", contractual obligations are regarded as liabilities.As unitholders have the ability to redeem units from the Funds, all net assets attributable to unitholders have beenrecognised as liabilities of the Funds, rather than as equity. The classification of net assets attributable to unitholders doesnot alter the underlying economic interest of the unitholders in the net assets and net profit attributable to unitholders of theFunds.
(n) Goods and Services Tax (GST)
Income, expenses and assets, with the exception of receivables and payables, are recognised net of the amount of GSTto the extent that the GST is recoverable from the taxation authority. Where GST is not recoverable, it is recognised aspart of the cost of acquisition of the asset or as part of the expense item as applicable.
Receivables and payables are stated inclusive of GST.
Reduced input tax credits (RITC) recoverable by the Funds from the Australian Taxation Office are recognised asreceivables in the Balance Sheets.
Cash flows are included in the Cash Flow Statements on a gross basis. The GST component of cash flows arising fromfinancing activities, which is recoverable from, or payable to, the taxation authority is classified as operating cash flows.
(o) Expense Recognition
Expenses are recognised in the Income Statements when the Funds have a present obligation (legal or constructive) as aresult of a past event that can be reliably measured. Expenses are recognised in the Income Statements if expendituredoes not produce future economic benefits that qualify for recognition in the Balance Sheets.
Page 23

COMMONWEALTH INVESTMENT FUNDS
NOTES TO THE FINANCIAL STATEMENTSFOR THE YEAR ENDED 30 JUNE 2008
1. SUMMARY OF SIGNIFICANT ACCOUNTING POLICIES (continued)
(p) Use of estimates
The Funds make estimates and assumptions that affect the reported amounts of assets and liabilities within the nextfinancial year. Estimates are continually evaluated and based on historical experience and other factors, includingexpectations of future events that are believed to be reasonable under the circumstances.
For the majority of the Funds' financial instruments, quoted market prices are readily available. However, certain financialinstruments, for example, over-the-counter derivatives or unquoted securities are fair valued using valuation techniques.Where valuation techniques (for example, pricing models) are used to determine fair values, they are validated andperiodically reviewed by experienced personnel of the Responsible Entity, independent of the area that created them.Models are calibrated by back-testing to actual transactions to ensure that outputs are reliable.
Models use observable data, to the extent practicable. However, areas such as credit risk (both own and counterparty),volatilities and correlations require management to make estimates. Changes in assumptions about these factors couldaffect the reported fair value of financial instruments.
(q) New Application of Accounting Standards
Certain new accounting standards and interpretations have been published that are not mandatory for 30 June 2008reporting periods. The impact of these new standards and interpretations is set below:
- AASB 8 "Operating Segments " and AASB 2007-3 "Amendments to Australian Accounting Standards " arising fromAASB 8.
AASB 8 and AASB 2007-3 are effective for annual reporting periods beginning on or after 1 January 2009.The Funds have not adopted these standards early. Application of these standards will not affect any of the amountsrecognised in the financial statements, but may affect the segment disclosures provided in Note 8.
- Revised AASB 101 "Presentation of Financial Statements Revised " and AASB 2007-8 "Amendments to AustralianAccounting Standards " arising from AASB 101.
AASB 101 (Revised) is applicable to annual reporting beginning on or after 1 January 2009. The Fund hasnot adopted this standard early. It requires the presentation of a statement of comprehensive income and makeschanges to the statement of changes in equity will not affect any amounts recognised in the financial statements.If a Fund has made a prior period adjustment or has re-classified items in the financial statement, it will need to disclose a third Balance Sheet, this one being at the beginning of the comparative period.
- AASB 132 Financial Instruments: Presentation and AASB 2008-2 Amendments to Australian Accounting Standards- Puttable Financial Instruments and Obligations Arising on Liquidation (Revised AASB 132).
Revised AASB 132 is applicable for reporting periods beginning on or after 1 January 2009. The Funds have notadopted this standard early. Application of this standard will not affect any of the amounts recognised in the financialstatements as the Funds are obligated to distribute all of its taxable income in accordance with the Fund’sConstitution. Accordingly, there will be no change to classification of unitholders’ funds as a liability and therefore noimpact on profit or loss and equity.
Page 24

COMMONWEALTH INVESTMENT FUNDS
NOTES TO THE FINANCIAL STATEMENTSFOR THE YEAR ENDED 30 JUNE 2008
2. AUDITOR'S REMUNERATION
Auditor's remuneration, as disclosed in the Income Statements, in respect of auditing the financial report are fully borneby the Funds.
Other services provided by the auditors are the audit of the compliance plan of the Funds and tax compliance services.The auditors' non-audit remuneration is not paid by the Funds.
3. INTEREST INCOME
The following tables show the average interest rates earned by the Funds.
The average interest rate for cash and cash equivalents is calculated by dividing the total interest earned for the year bythe average daily balances invested. The average interest rates for money market securities and fixed interest securitiesare calculated by dividing the total interest earned for the year by the average monthly balances invested.
Average Interest Average Average Interest AverageBalance Rate Balance Rate
$'000 $'000 % $'000 $'000 %Cash and cash equivalents 8,544 378 4.42% 3,918 162 4.13%Fixed interest securites 213,482 13,249 6.21% 293,105 14,783 5.04%
222,026 13,627 297,023 14,945
Average Interest Average Average Interest AverageBalance Rate Balance Rate
$'000 $'000 % $'000 $'000 %Cash and cash equivalents 4,567 245 5.36% 4,015 188 4.67%Fixed interest securites 48,117 2,993 6.22% 52,257 3,193 6.11%
52,684 3,238 56,272 3,381
Average Interest Average Average Interest AverageBalance Rate Balance Rate
$'000 $'000 % $'000 $'000 %Cash and cash equivalents 3,071 157 5.11% 1,110 63 5.65%Money market securities - - - 1,009 51 5.08%Fixed interest securites 59,298 3,043 5.13% 70,691 3,615 5.11%
62,369 3,200 72,810 3,729
Average Interest Average Average Interest AverageBalance Rate Balance Rate
$'000 $'000 % $'000 $'000 %Cash and cash equivalents 37,964 1,879 4.95% 37,374 1,757 4.70%Money market securities 2,494,772 183,601 7.36% 2,985,632 190,455 6.38%
2,532,736 185,480 3,023,006 192,212
2008 2007
Commonwealth Cash Management Trust2008 2007
2008 2007
Commonwealth Bond Fund
Commonwealth Income Fund2008 2007
Commonwealth Growth Fund
Page 25

COMMONWEALTH INVESTMENT FUNDS
NOTES TO THE FINANCIAL STATEMENTSFOR THE YEAR ENDED 30 JUNE 2008
4. DISTRIBUTIONS
The Responsible Entity adopts the policy of distributing as a minimum the net income for tax purposes. The amountsshown as "Distribution payable" in the Balance Sheets represent the component of the final distribution for the year whichhad not been paid at balance date.
The amounts distributed or proposed to be distributed to unitholders in cents per unit (cpu) or income rates during the yearwere:
Period ended cpu* $'000 cpu* $'000 cpu* $'000 cpu* $'000- 30 September 1.36 4,946 1.86 7,489 0.77 3,390 1.21 5,405 - 31 December 1.61 5,625 1.91 7,463 4.16 17,813 5.34 23,327 - 31 March 1.11 3,735 1.43 5,477 1.36 5,682 4.46 19,326 - 30 June 1.46 4,527 2.33 8,587 1.62 6,456 13.35 56,936
18,833 29,016 33,341 104,994
Period ended cpu* $'000 cpu* $'000 cpu* $'000 cpu* $'000- 31 December 5.35 11,951 11.05 25,186 18.63 9,996 18.85 9,701 - 30 June 0.94 1,989 16.45 36,393 0.78 418 19.96 10,451
13,940 61,579 10,414 20,152
Period ended cpu* $'000 cpu* $'000 cpu* $'000 cpu* $'000- 30 September 9.98 16,882 9.50 15,740 n/a n/a n/a n/a- 31 December 9.80 16,366 10.63 17,684 15.03 8,052 11.08 5,761 - 31 March - - 8.82 14,763 n/a n/a n/a n/a- 30 June 1.37 2,234 12.41 20,687 7.87 3,985 20.02 10,249
35,482 68,874 12,037 16,010
Period ended cpu* $'000 cpu* $'000 cpu* $'000 cpu* $'000- 30 September n/a n/a n/a n/a 0.88 419 1.30 747 - 31 December - - 0.22 75 1.15 525 1.23 672 - 31 March n/a n/a n/a n/a 1.71 755 1.18 620 - 30 June 0.81 188 0.35 102 1.41 594 0.47 237
188 177 2,293 2,276
* Cents per unit (cpu) is calculated based on the unit days distribution rate multiplied by the number of days in thedistribution period. The amount to be distributed does not include income paid on redemption.
2007 2008 2007
Commonwealth Commonwealth
2008Income Fund Balanced Fund
Commonwealth CommonwealthGrowth Fund Australian Share
Fund2008 2007 2008 2007
Commonwealth CommonwealthShare Income Fund Property Securities
Fund2008 2007 2008 2007
Commonwealth CommonwealthInternational Share Bond Fund
Fund2008 2007 2008 2007
Page 26

COMMONWEALTH INVESTMENT FUNDS
NOTES TO THE FINANCIAL STATEMENTSFOR THE YEAR ENDED 30 JUNE 2008
4. DISTRIBUTIONS (continued)
Period ended Rate*** $'000 Rate*** $'000- 30 September 5.66% 38,743 5.14% 41,676 - 31 December 6.15% 40,847 5.35% 42,077 - 31 March 6.40% 40,213 5.47% 40,736 - 30 June 6.99% 40,376 5.49% 39,241
160,179 163,730
** The Commonwealth Cash Management Trust calculates and accrues income on a daily basis on account balances.Income is distributed at the end of each quarter.*** Annualised rate.
CommonwealthCash Management
Trust**2008 2007
Page 27

COMMONWEALTH INVESTMENT FUNDS
NOTES TO THE FINANCIAL STATEMENTSFOR THE YEAR ENDED 30 JUNE 2008
5. INVESTMENTS IN FINANCIAL ASSETS AND LIABILITIES HELD FOR TRADING
30/06/2008 30/06/2007 30/06/2008 30/06/2007 30/06/2008 30/06/2007$'000 $'000 $'000 $'000 $'000 $'000
Listed Equities - Australian stock exchange 30,718 41,518 - - 120,157 142,965 - International stock exchanges 479 763 - - 2,028 4,987
Total Listed Equities 31,197 42,281 - - 122,185 147,952 Managed Investment Schemes
- Related Managed InvestmentSchemes 89,766 120,914 570,729 743,580 132,699 186,422
Total Managed InvestmentSchemes 89,766 120,914 570,729 743,580 132,699 186,422 Domestic Fixed Interest
- Government Bonds 40,795 20,179 - - 7,979 4,703 - Semi-Govt Bonds 33,229 85,197 - - 12,628 24,350 - Govt Guaranteed Bonds - - - - - - - Debentures 105,122 120,699 - - 21,253 24,061
179,146 226,075 - - 41,860 53,114 Derivatives
- Futures (84) (51) - - - -
(84) (51) - - - - Total Investments in FinancialAssets and Liabilities 300,025 389,219 570,729 743,580 296,744 387,488
30/06/2008 30/06/2007 30/06/2008 30/06/2007 30/06/2008 30/06/2007$'000 $'000 $'000 $'000 $'000 $'000
Listed Equities - Australian stock exchange 64,532 86,826 216,978 289,150 39,716 96,125 - International stock exchanges 1,252 1,991 4,211 6,638 - -
Total Listed Equities 65,784 88,817 221,189 295,788 39,716 96,125 Managed Investment Schemes
- Related Managed InvestmentSchemes 4,296 8,080 14,429 27,397 - -
Total Managed InvestmentSchemes 4,296 8,080 14,429 27,397 - - Derivatives
- Futures (185) (120) (702) (372) - -
(185) (120) (702) (372) - - Total Investments in FinancialAssets and Liabilities 69,895 96,777 234,916 322,813 39,716 96,125
Fund
Commonwealth Commonwealth CommonwealthAustralian Share Share Income Fund Property Securities
Commonwealth Commonwealth CommonwealthIncome Fund Balanced Fund Growth Fund
Total Fixed Interest
Total Derivatives
Total Derivatives
Fund
Page 28

COMMONWEALTH INVESTMENT FUNDS
NOTES TO THE FINANCIAL STATEMENTSFOR THE YEAR ENDED 30 JUNE 2008
5. INVESTMENTS IN FINANCIAL ASSETS AND LIABILITIES HELD FOR TRADING (continued)
30/06/2008 30/06/2007 30/06/2008 30/06/2007 30/06/2008 30/06/2007$'000 $'000 $'000 $'000 $'000 $'000
Managed Investment Schemes- Related Managed Investment
Schemes 27,728 44,340 - - - -
Total Managed InvestmentSchemes 27,728 44,340 - - - -
Money Market Securities- Bank Accepted Bills - - - - 113,684 58,234 - Promissory Notes - - - - 761,072 721,219 - Negotiable Certificate of Deposit - - - - 995,825 1,433,886 - Floating Rate Notes - - - 1,017 349,036 469,014
Total Money Market Securities - - - 1,017 2,219,617 2,682,353
Domestic Fixed Interest- Government Bonds - - 6,233 4,661 - - - Semi-Govt Bonds - - 17,395 23,983 - - - Govt Guaranteed Bonds - - - - - - - Debentures - - 21,032 26,019 - -
- - 44,660 54,663 - -
Derivatives- Futures - - 2 - (10) 45
- - 2 - (10) 45 Total Investments in FinancialAssets and Liabilities 27,728 44,340 44,662 55,680 2,219,607 2,682,398
Trust
Total Fixed Interest
Total Derivatives
CommonwealthInternational Share Bond Fund Cash Management
Commonwealth
Fund
Commonwealth
Page 29

COMMONWEALTH INVESTMENT FUNDS
NOTES TO THE FINANCIAL STATEMENTSFOR THE YEAR ENDED 30 JUNE 2008
6. MOVEMENT IN NUMBER OF UNITS ATTRIBUTABLE TO UNITHOLDERS
As stipulated within the Funds' Constitution, each unit represents a right to an individual share in the Funds and doesnot extend to a right to the underlying assets of the Funds. There are no separate classes of units and each unit hasthe same rights attaching to it as all other units of the Fund.
a) Movements in number of units and net assets attributable to unitholders during the year were as follows:
No.'000 $'000 No.'000 $'000
Opening balance 363,035 383,555 412,576 442,521 Applications 6,468 6,789 8,528 9,363 Redemptions (80,339) (83,543) (70,248) (75,487) Units issued upon reinvestment ofdistributions 11,140 11,731 12,179 13,004 Decrease in net assetsattributable to unitholders from operations - (12,613) - (5,846)
Closing Balance 300,304 305,919 363,035 383,555
No.'000 $'000 No.'000 $'000
Opening balance 426,487 693,584 454,136 744,083 Applications 5,536 9,015 9,256 16,478 Redemptions (77,380) (122,276) (66,729) (114,554) Units issued upon reinvestment ofdistributions 38,904 63,489 29,824 50,598 Decrease in net assetsattributable to unitholders from operations - (70,984) - (3,021)
Closing Balance 393,547 572,828 426,487 693,584
No.'000 $'000 No.'000 $'000
Opening balance 215,985 359,678 228,889 387,777 Applications 5,550 8,087 6,720 11,696 Redemptions (40,606) (64,057) (41,012) (70,482) Units issued upon reinvestment ofdistributions 24,567 41,270 21,388 36,554 Decrease in net assetsattributable to unitholders from operations - (46,587) - (5,867)
Closing Balance 205,496 298,391 215,985 359,678
CommonwealthIncome Fund
CommonwealthGrowth Fund
Balanced Fund
1/7/2007 - 30/06/2008 1/7/2006 - 30/06/2007
Commonwealth
1/7/2007 - 30/06/2008 1/7/2006 - 30/06/2007
1/7/2007 - 30/06/2008 1/7/2006 - 30/06/2007
Page 30

COMMONWEALTH INVESTMENT FUNDS
NOTES TO THE FINANCIAL STATEMENTSFOR THE YEAR ENDED 30 JUNE 2008
6. MOVEMENT IN NUMBER OF UNITS ATTRIBUTABLE TO UNITHOLDERS (continued)
a) Movements in number of units and net assets attributable to unitholders during the year were as follows:(continued)
No.'000 $'000 No.'000 $'000
Opening balance 51,331 93,162 49,763 88,366 Applications 773 1,339 1,263 2,375 Redemptions (10,521) (17,533) (6,633) (12,112) Units issued upon reinvestment ofdistributions 9,571 16,997 6,938 12,332 (Decrease)/Increase in net assetsattributable to unitholders from operations - (19,271) - 2,201
Closing Balance 51,154 74,694 51,331 93,162
No.'000 $'000 No.'000 $'000
Opening balance 165,102 324,398 163,941 315,595 Applications 2,762 5,371 2,987 5,939 Redemptions (24,773) (45,202) (18,845) (36,823) Units issued upon reinvestment ofdistributions 15,873 30,892 17,019 33,018 (Decrease)/Increase in net assetsattributable to unitholders from operations - (64,580) - 6,669
Closing Balance 158,964 250,879 165,102 324,398
No.'000 $'000 No.'000 $'000
Opening balance 50,232 90,790 51,227 88,562 Applications 453 650 1,342 2,499 Redemptions (10,370) (13,046) (5,652) (10,793) Units issued upon reinvestment ofdistributions 7,467 11,580 3,315 6,210 (Decrease)/Increase in net assetsattributable to unitholders from operations - (50,837) - 4,312
Closing Balance 47,782 39,137 50,232 90,790
Commonwealth
1/7/2007 - 30/06/2008 1/7/2006 - 30/06/2007
Property SecuritiesFund
CommonwealthShare Income Fund
1/7/2007 - 30/06/2008 1/7/2006 - 30/06/2007
Commonwealth
1/7/2007 - 30/06/2008 1/7/2006 - 30/06/2007
Australian ShareFund
Page 31

COMMONWEALTH INVESTMENT FUNDS
NOTES TO THE FINANCIAL STATEMENTSFOR THE YEAR ENDED 30 JUNE 2008
6. MOVEMENT IN NUMBER OF UNITS ATTRIBUTABLE TO UNITHOLDERS (continued)+C35
a) Movements in number of units and net assets attributable to unitholders during the year were as follows:(continued)
No.'000 $'000 No.'000 $'000
Opening balance 28,999 44,962 37,515 54,720 Applications 402 629 557 884 Redemptions (6,252) (8,991) (9,158) (14,077) Units issued upon reinvestment ofdistributions 50 76 85 126 (Decrease)/Increase in net assetsattributable to unitholders from operations - (8,402) - 3,309
Closing Balance 23,199 28,274 28,999 44,962
No.'000 $'000 No.'000 $'000
Opening balance 49,457 55,728 58,895 67,195 Applications 109 125 166 193 Redemptions (9,248) (10,439) (10,350) (11,828) Units issued upon reinvestment ofdistributions 602 685 746 854 Decrease in net assetsattributable to unitholders from operations - (412) - (686)
Closing Balance 40,920 45,687 49,457 55,728
No.'000 $'000 No.'000 $'000
Opening balance 2,686,099 2,687,835 3,241,275 3,243,253 Applications 1,194,171 1,194,171 1,501,952 1,501,952 Redemptions (1,815,493) (1,815,493) (2,204,160) (2,204,160) Units issued upon reinvestment ofdistributions 141,192 141,192 147,032 147,032 Decrease in net assetsattributable to unitholders from operations - (5,555) - (242)
Closing Balance 2,205,969 2,202,150 2,686,099 2,687,835
CommonwealthInternational Share
Fund1/7/2007 - 30/06/2008 1/7/2006 - 30/06/2007
CommonwealthBond Fund
1/7/2007 - 30/06/2008 1/7/2006 - 30/06/2007
1/7/2007 - 30/06/2008 1/7/2006 - 30/06/2007
CommonwealthCash Management
Trust
Page 32

COMMONWEALTH INVESTMENT FUNDS
NOTES TO THE FINANCIAL STATEMENTSFOR THE YEAR ENDED 30 JUNE 2008
6. MOVEMENT IN NUMBER OF UNITS ATTRIBUTABLE TO UNITHOLDERS
b) Capital Risk Management
The Funds manage their net assets attributable to unitholders as capital, notwithstanding net assets attributable tounitholders are classified as a liability. The amount of net assets attributable to unitholders can change significantly ona daily basis as the Funds are subject to daily applications and redemptions at the discretion of unitholders.
The Funds monitor the level of daily applications and redemptions relative to the liquid assets in the Funds. Liquidassets include cash and cash equivalents and listed equities.
7. CASH AND CASH EQUIVALENTS
(a) Reconciliation of net profit/(loss) attributable to unitholders to net cash from operating activities
1/7/2007 - 1/7/2006 - 1/7/2007 - 1/7/2006 - 1/7/2007 - 1/7/2006 -30/06/2008 30/06/2007 30/06/2008 30/06/2007 30/06/2008 30/06/2007
$'000 $'000 $'000 $'000 $'000 $'000
Net (loss)/profit attributable to unitholders 6,220 23,170 (37,643) 101,973 (32,647) 55,712 Proceeds from sale of financial instruments held for trading 542,436 402,907 210,650 276,855 305,049 387,933 Purchase of financial instruments held for trading (458,481) (340,302) (70,300) (161,700) (248,454) (320,657) Changes in fair value of financial instruments held for trading 11,547 (2,671) 65,481 (44,017) 42,037 (41,489) Dividend income reinvested (6,869) (8,262) (32,981) (61,259) (8,090) (11,793) Net foreign exchange (loss)/gain 1 (1) - - - (5) Changes in assets andliabilities: Outstanding sales settlements (6,159) 21,811 (5,000) - 9,029 (6,935) Dividends receivable 42 102 493 495 2,133 806 Interest receivable 599 547 19 (22) 244 (51) Other receivables 9 36 47 85 43 16 Outstanding purchase settlements (1,386) (19,376) - - (11,567) 5,420 Other payables (137) 164 (52) 59 62 (85) Responsible Entity fees (224) (144) (479) 51 (311) (62)
Net Cash (Used In)/FromOperating Activities 87,598 77,981 130,235 112,520 57,528 68,810
Commonwealth Commonwealth CommonwealthIncome Fund Balanced Fund Growth Fund
Page 33

COMMONWEALTH INVESTMENT FUNDS
NOTES TO THE FINANCIAL STATEMENTSFOR THE YEAR ENDED 30 JUNE 2008
7. CASH AND CASH EQUIVALENTS (continued)
(a) Reconciliation of net profit/(loss) attributable to unitholders to net cash from operating activities (continued)
1/7/2007 - 1/7/2006 - 1/7/2007 - 1/7/2006 - 1/7/2007 - 1/7/2006 -30/06/2008 30/06/2007 30/06/2008 30/06/2007 30/06/2008 30/06/2007
$'000 $'000 $'000 $'000 $'000 $'000
Net (loss)/profit attributable to unitholders (8,857) 22,353 (29,098) 75,543 (38,800) 20,322 Proceeds from sale of financial instruments held for trading 51,732 76,370 175,019 270,166 27,267 25,001 Purchase of financial instruments held for trading (34,504) (60,397) (118,998) (201,301) (9,533) (9,396) Changes in fair value of financial instruments held for trading 11,249 (19,402) 37,047 (65,555) 41,715 (16,540) Dividend income reinvested (1,593) (1,867) (5,165) (6,324) (3,039) (3,890) Net foreign exchange (loss)/gain (2) (2) (8) (8) - - Changes in assets andliabilities: Outstanding sales settlements (634) 149 (2,418) 520 3,434 (3,563) Dividends receivable 62 106 174 463 603 (66) Interest receivable (14) (2) (27) (23) 2 (2) Other receivables (78) (18) 41 (4) 6 (7) Outstanding purchase settlements (281) 339 (1,197) 1,094 (2,169) 1,557 Other payables 19 (17) (60) 63 12 (16) Responsible Entity fees (101) 39 (306) 61 (230) 64
Net Cash (Used In)/FromOperating Activities 16,998 17,651 55,004 74,695 19,268 13,464
Commonwealth Commonwealth CommonwealthAustralian Share Share Income Fund Property Securities
Fund Fund
Page 34

COMMONWEALTH INVESTMENT FUNDS
NOTES TO THE FINANCIAL STATEMENTSFOR THE YEAR ENDED 30 JUNE 2008
7. CASH AND CASH EQUIVALENTS (continued)
(a) Reconciliation of net profit/(loss) attributable to unitholders to net cash from operating activities (continued)
1/7/2007 - 1/7/2006 - 1/7/2007 - 1/7/2006 - 1/7/2007 - 1/7/2006 -30/06/2008 30/06/2007 30/06/2008 30/06/2007 30/06/2008 30/06/2007
$'000 $'000 $'000 $'000 $'000 $'000
Net (loss)/profit attributable to unitholders (8,214) 3,486 1,881 1,590 154,624 163,488 Proceeds from sale of financial instruments held for trading 8,850 13,650 63,867 80,119 9,335,213 20,479,653 Purchase of financial instruments held for trading (549) - (53,720) (70,213) (8,869,383) (19,915,468) Changes in fair value of financial instruments held for trading 8,310 (3,286) 694 1,390 6,238 389 Dividend income reinvested - (743) - - - - Changes in assets andliabilities: Outstanding sales settlements (68) - - 4,672 - - Dividends receivable - - - - - - Interest receivable (2) 1 156 138 (9,344) (2,876) Other receivables 9 8 7 4 (153) 437 Outstanding purchase settlements - - - (4,369) - - Other payables 27 (18) 9 4 221 (306) Responsible Entity fees (95) (31) (32) (32) (1,127) (1,062)
Net Cash (Used In)/FromOperating Activities 8,268 13,067 12,862 13,303 616,289 724,255
(b) Non-cash financing activities carried out during the year on normal commercial terms and
conditions included:
- Reinvestment of unitholders distributions as disclosed in Statements of Changes in Net Asset Attributable to Unitholders and Note 6(a) under "Units issued upon reinvestment of distributions".
- Participation in dividend reinvestment plans as disclosed in Note 7(a) under "Dividend income reinvested".
(c) Terms and conditions on cash
Cash at bank and in hand, and deposits at call with a futures clearing house, earn interest at floating rateas determined by the financial institutions.
Commonwealth Commonwealth Commonwealth
Fund TrustInternational Share Bond Fund Cash Management
Page 35

COMMONWEALTH INVESTMENT FUNDS
NOTES TO THE FINANCIAL STATEMENTSFOR THE YEAR ENDED 30 JUNE 2008
8. RELATED PARTIES DISCLOSURES
(a) Responsible Entity
The Responsible Entity of the Funds is Colonial First State Investments Limited. The ultimate holding company is theCommonwealth Bank of Australia (the Bank).
The Responsible Entity is incorporated and domiciled in Australia and has its registered office at Level 29, 52 MartinPlace, Sydney, New South Wales, 2000.
(b) Details of Key Management Personnel
(i) Key Management Personnel
The Directors of Colonial First State Investments Limited are considered to be Key Management Personnel. The Directors ofthe Responsible Entity in office during the year and up to the date of the report are:
Grahame Petersen Michael John VenterBrian Vincent BissakerPaul RaysonPeter Robert WinneyJohn Robert Dempsey Resigned 15 January 2008Bradley Brian Massey Appointed 21 February 2008
(ii) Compensation of key management personnel
No amounts are paid by the Funds directly to the Directors of the Responsible Entity of the Funds.
The Directors of the Responsible Entity receive compensation in their capacity as Directors of the Responsible Entity.Directors are employed as executives of the Commonwealth Bank of Australia, and in that capacity, part of their role is toact as a Director of the Responsible Entity. Consequently, no compensation as defined in AASB 124: Related Parties ispaid by the Funds to the Directors as Key Management Personnel.
Page 36

COMMONWEALTH INVESTMENT FUNDS
NOTES TO THE FINANCIAL STATEMENTSFOR THE YEAR ENDED 30 JUNE 2008
8. RELATED PARTIES DISCLOSURES (continued)
(c) Responsible Entity's Management Fees
With the exception of the Commonwealth Cash Management Trust, the Responsible Entity is entitled to receive a monthlymanagement fee which is expressed as a percentage of the total assets of the Fund (i.e. excluding liabilities) under theterms of the Constitution. The fees for the Commonwealth Cash Management Trust are expressed as a percentage of thenet assets of the Trust. The fees are paid on a quarterly basis.
Management fees are paid directly by the Funds. The table below shows the current fees charged. Where monies areinvested into other schemes managed by the Responsible Entity or related entities, the management fees are rebated to theFunds and disclosed as Responsible Entity fees rebate in the Income Statements.
The management fee rates for the Funds are as follows:
2008 2007Management Management
Name of Funds Fees Fees% %
Commonwealth Income Fund 1.00 1.00 Commonwealth Balanced Fund 1.50 1.50 Commonwealth Growth Fund 1.50 1.50 Commonwealth Australian Share Fund 1.50 1.50 Commonwealth Share Income Fund 1.50 1.50 Commonwealth Property Securities Fund 1.50 1.50 Commonwealth International Share Fund 1.50 1.50 Commonwealth Bond Fund 1.00 1.00 Commonwealth Cash Management Trust 0.75 0.75
The net amount of the Responsible Entity's management fees charged after incorporating the rebate received for the yearsended 30 June 2008 and 30 June 2007 are as follows:
Name of Funds Year YearEnded Ended
2008 2007$ $
Commonwealth Income Fund 4,229,992 3,732,866 Commonwealth Balanced Fund 12,211,191 8,377,226 Commonwealth Growth Fund 6,322,861 5,082,290 Commonwealth Australian Share Fund 1,469,196 1,458,162 Commonwealth Share Income Fund 4,870,448 4,929,004 Commonwealth Property Securities Fund 1,135,729 1,607,148 Commonwealth International Share Fund 780,044 497,412 Commonwealth Bond Fund 522,175 650,124 Commonwealth Cash Management Trust 19,583,699 23,446,887
Page 37

COMMONWEALTH INVESTMENT FUNDS
NOTES TO THE FINANCIAL STATEMENTSFOR THE YEAR ENDED 30 JUNE 2008
8. RELATED PARTIES DISCLOSURES (continued)
(c) Responsible Entity's Management Fees (continued)
Fees due to the Responsible Entity as at years ended 30 June 2007 and 30 June 2006 are as follows:
Name of Funds 2008 2007$ $
Commonwealth Income Fund 840,196 1,064,046 Commonwealth Balanced Fund 2,286,067 2,771,009 Commonwealth Growth Fund 1,210,508 1,525,010 Commonwealth Australian Share Fund 329,950 426,665 Commonwealth Share Income Fund 1,109,711 1,416,411 Commonwealth Property Securities Fund 208,861 439,232 Commonwealth International Share Fund 78,915 173,717 Commonwealth Bond Fund 128,485 160,213 Commonwealth Cash Management Trust 4,789,384 5,916,597
In addition, the Responsible Entity is reimbursed for registry fees for the Funds, in accordance with the Product DisclosureStatement and the Funds' Constitutions. During the year ended 30 June 2008 and 30 June 2007, the Responsible Entity wasreimbursed for such costs, which were allocated to the Funds offered in the Product Disclosure Statement in proportion totheir relative size as follows:
2008 2007$ $
Commonwealth Income Fund 537,748 497,807 Commonwealth Balanced Fund 1,033,759 914,554 Commonwealth Growth Fund 540,243 457,249 Commonwealth Australian Share Fund 134,514 139,858 Commonwealth Share Income Fund 454,793 464,929 Commonwealth Property Securities Fund 101,688 151,908 Commonwealth International Share Fund 55,754 70,880 Commonwealth Bond Fund 77,824 74,248 Commonwealth Cash Management Trust 4,240,225 4,115,536
(d) Bank and Deposit Accounts
The bank accounts for the Funds may be held with the Commonwealth Bank of Australia. Fees and expenses arenegotiated on an arm's length basis.
(e) Related Party Transactions
Related parties
All related party transactions are made in arms length transactions on normal commercial terms and conditions.Outstanding balances at year end are unsecured and settlement occurs in cash.
There have been no guarantees provided or received for any related party receivables.
Page 38

COMMONWEALTH INVESTMENT FUNDS
NOTES TO THE FINANCIAL STATEMENTSFOR THE YEAR ENDED 30 JUNE 2008
8. RELATED PARTIES DISCLOSURES (continued)
(f) Investing Activities
The following Commonwealth Investment Funds held investments in the following Funds which were managed by theResponsible Entity and its related entities. Distributions received are immediately reinvested into additional units with theexception of investments as highlighted in italics.
Units Held Value of Interest held Units Units DistributionInvestment Name at Investment in Investment Acquired Disposed of received
Year at Year at Year During DuringEnd End End Year Year
No.('000) $'000 % No.('000) No.('000) $'000
Commonwealth Income Fund
Units held in Colonial First StateWholesale Global Corporate DebtFund
- 2008 64,408 63,158 1.85 3,632 509 3,602 - 2007 61,285 62,468 1.92 3,578 489 3,643
Units held in Colonial First StateWholesale Small Companies Fund - Core
- 2008 1,375 1,649 0.30 192 786 279 - 2007 1,969 3,704 0.39 336 103 628
Units held in Colonial First StateWholesale Cash Fund
- 2008 24,782 24,958 0.46 53,233 82,742 2,635 - 2007 54,291 54,736 1.11 40,364 53,759 3,755
Commonwealth Balanced Fund
Units held in Colonial First StateWholesale Indexed Australian ShareFund
- 2008 128,649 198,196 19.42 13,215 21,926 15,498 - 2007 137,360 262,825 24.70 21,477 37,148 41,038
Units held in Colonial First StateWholesale Indexed Global Share Fund
- 2008 53,812 82,150 3.92 1,034 2,932 1,697 - 2007 55,710 110,183 4.35 2,492 7,401 1,971
Page 39

COMMONWEALTH INVESTMENT FUNDS
NOTES TO THE FINANCIAL STATEMENTSFOR THE YEAR ENDED 30 JUNE 2008
8. RELATED PARTIES DISCLOSURES (continued)
(f) Investing Activities (continued)
Units Held Value of Interest held Units Units DistributionInvestment Name at Investment in Investment Acquired Disposed of received
Year at Year at Year During DuringEnd End End Year Year
No.('000) $'000 % No.('000) No.('000) $'000
Commonwealth Balanced Fund (continued)
Units held in Colonial First StateWholesale Indexed Australian BondFund
- 2008 123,783 114,227 7.73 7,728 43,535 7,187 - 2007 159,590 149,648 9.16 14,690 16,803 7,959
Units held in Colonial First StateWholesale Indexed Global BondFund
- 2008 24,723 27,401 2.46 1,541 11,269 1,731 - 2007 34,451 37,486 3.23 8,417 2,095 4,258
Units held in Commonwealth LifetimeAustralian Index-Linked Bond Fund
- 2008 28,634 28,800 17.08 2,477 10,640 2,541 - 2007 36,797 38,104 16.64 2,604 - 2,768
Units held in Colonial First StateWholesale Property SecuritiesFund
- 2008 1,004 970 0.05 272 2,784 360 - 2007 3,516 6,996 0.20 3,515 - 414
Units held in Colonial First StateWholesale Global PropertySecurities Fund
- 2008 849 988 0.13 203 3,324 277 - 2007 3,970 6,986 0.95 3,970 - 742
Units held in Direct PropertyInvestment Fund - Commercial Sector
- 2008 - - - - - - - 2007 - - - - 63 941
Units held in Direct PropertyInvestment Fund - Industrial Sector
- 2008 - - - - - - - 2007 - - - - 21 93
Units held in Direct PropertyInvestment Fund - Retail Sector
- 2008 14,181 20,556 2.16 - - 1,154 - 2007 14,181 18,173 2.16 - 15,126 1,874
Page 40
COMMONWEALTH INVESTMENT FUNDS
NOTES TO THE FINANCIAL STATEMENTSFOR THE YEAR ENDED 30 JUNE 2008
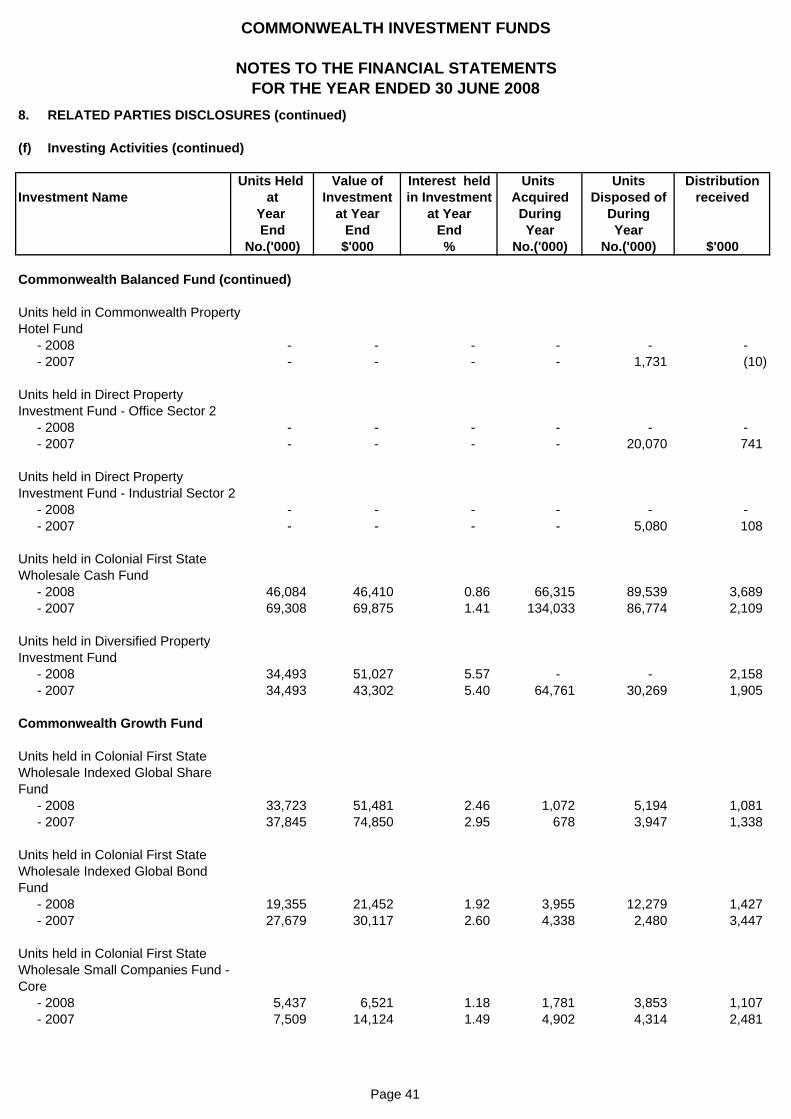
8. RELATED PARTIES DISCLOSURES (continued)
(f) Investing Activities (continued)
Units Held Value of Interest held Units Units DistributionInvestment Name at Investment in Investment Acquired Disposed of received
Year at Year at Year During DuringEnd End End Year Year
No.('000) $'000 % No.('000) No.('000) $'000
Commonwealth Balanced Fund (continued)
Units held in Commonwealth PropertyHotel Fund
- 2008 - - - - - - - 2007 - - - - 1,731 (10)
Units held in Direct PropertyInvestment Fund - Office Sector 2
- 2008 - - - - - - - 2007 - - - - 20,070 741
Units held in Direct PropertyInvestment Fund - Industrial Sector 2
- 2008 - - - - - - - 2007 - - - - 5,080 108
Units held in Colonial First StateWholesale Cash Fund
- 2008 46,084 46,410 0.86 66,315 89,539 3,689 - 2007 69,308 69,875 1.41 134,033 86,774 2,109
Units held in Diversified PropertyInvestment Fund
- 2008 34,493 51,027 5.57 - - 2,158 - 2007 34,493 43,302 5.40 64,761 30,269 1,905
Commonwealth Growth Fund
Units held in Colonial First StateWholesale Indexed Global ShareFund
- 2008 33,723 51,481 2.46 1,072 5,194 1,081 - 2007 37,845 74,850 2.95 678 3,947 1,338
Units held in Colonial First StateWholesale Indexed Global BondFund
- 2008 19,355 21,452 1.92 3,955 12,279 1,427 - 2007 27,679 30,117 2.60 4,338 2,480 3,447
Units held in Colonial First StateWholesale Small Companies Fund - Core
- 2008 5,437 6,521 1.18 1,781 3,853 1,107 - 2007 7,509 14,124 1.49 4,902 4,314 2,481
Page 41

COMMONWEALTH INVESTMENT FUNDS
NOTES TO THE FINANCIAL STATEMENTSFOR THE YEAR ENDED 30 JUNE 2008
8. RELATED PARTIES DISCLOSURES (continued)
(f) Investing Activities (continued)
Units Held Value of Interest held Units Units DistributionInvestment Name at Investment in Investment Acquired Disposed of received
Year at Year at Year During DuringEnd End End Year Year
No.('000) $'000 % No.('000) No.('000) $'000
Commonwealth Growth Fund (continued)
Units held in Colonial First StateWholesale Global Corporate DebtEnhanced Fund
- 2008 3,828 3,608 0.57 175 - 168 - 2007 3,653 3,617 0.83 193 - 193
Units held in Colonial First StateWholesale Global Share Fund
- 2008 17,173 21,514 2.27 15 - 19 - 2007 17,158 25,978 2.10 51 - 77
Units held in Colonial First StateWholesale Property SecuritiesFund
- 2008 5,132 4,961 0.27 945 458 810 - 2007 4,645 9,240 0.27 4,645 - 669
Units held in Colonial First StateWholesale Global PropertySecurities Fund
- 2008 4,324 5,033 0.68 557 1,591 704 - 2007 5,358 9,427 1.28 5,358 - 1,370
Units held in Colonial First StateWholesale Cash Fund
- 2008 5,751 5,792 0.11 50,131 52,806 422 - 2007 8,426 8,495 0.17 70,917 67,276 633
Units held in Direct PropertyInvestment Fund - Commercial Sector
- 2008 - - - - - - - 2007 - - - - 12 220
Units held in Direct PropertyInvestment Fund - Industrial Sector
- 2008 - - - - - - - 2007 - - - - 5 58
Units held in Direct PropertyInvestment Fund - Retail Sector
- 2008 1,949 2,825 0.30 - - 159 - 2007 1,949 2,498 0.30 - 2,079 216
Page 42

COMMONWEALTH INVESTMENT FUNDS
NOTES TO THE FINANCIAL STATEMENTSFOR THE YEAR ENDED 30 JUNE 2008
8. RELATED PARTIES DISCLOSURES (continued)
(f) Investing Activities (continued)
Units Held Value of Interest held Units Units DistributionInvestment Name at Investment in Investment Acquired Disposed of received
Year at Year at Year During DuringEnd End End Year Year
No.('000) $'000 % No.('000) No.('000) $'000
Commonwealth Growth Fund (continued)
Units held in CommonwealthProperty Hotel Fund
- 2008 - - - - - - - 2007 - - - - 1,316 (7)
Units held in Direct PropertyInvestment Fund - Office Sector 2
- 2008 - - - - - - - 2007 - - - - 3,744 142
Units held in Direct PropertyInvestment Fund - Industrial Sector 2
- 2008 - - - - - - - 2007 - - - - 2,086 8
Units held in Diversified PropertyInvestment Fund
- 2008 6,429 9,512 1.04 - - 402 - 2007 6,429 8,072 1.01 12,005 5,576 414
Units held in CommonwealthInfrastructure and Utilities Fund
- 2008 - - - - - - - 2007 - - - - 4,305 -
Commonwealth Australian Share Fund
Units held in Colonial First StateWholesale Small Companies Fund- Core
- 2008 3,582 4,296 0.78 471 1,185 716 - 2007 4,296 8,080 0.85 963 - 1,358
Commonwealth Share Income Fund
Units held in Colonial First StateWholesale Small Companies Fund- Core
- 2008 12,030 14,429 2.62 1,598 4,133 2,336 - 2007 14,565 27,397 2.89 2,941 - 4,603
Page 43

COMMONWEALTH INVESTMENT FUNDS
NOTES TO THE FINANCIAL STATEMENTSFOR THE YEAR ENDED 30 JUNE 2008
8. RELATED PARTIES DISCLOSURES (continued)
(f) Investing Activities (continued)
Units Held Value of Interest held Units Units DistributionInvestment Name at Investment in Investment Acquired Disposed of received
Year at Year at Year During DuringEnd End End Year Year
No.('000) $'000 % No.('000) No.('000) $'000
Commonwealth International Share Fund
Units held in Colonial First StateWholesale Indexed Global Share Fund
- 2008 13,948 21,293 1.02 280 4,864 463 - 2007 18,532 36,652 1.45 363 6,911 716
Units held in Colonial First StateWholesale Global Share Fund
- 2008 5,133 6,431 0.68 59 - 6 - 2007 5,074 7,683 0.62 15 - 23
The following Funds held shares in the Bank and its related parties.
Shares/ Value of Interest Shares/ Shares/ Dividend/Units Held Investment held in Units Units Distribution
Securities name at at Investment acquired disposed of receivedYear End Year End at Year End During During
Year YearNo.('000) $'000 % No.('000) No.('000) $'000
Commonwealth Income Fund
Shares in Commonwealth Bankof Australia
- 2008 44 1,748 0.01 17 12 112 - 2007 39 2,121 0.01 6 40 146
Units held in CFS Retail PropertyTrust
- 2008 28 52 0.01 5 19 4- 2007 42 91 0.01 3 31 5
Unit in Commonwealth ManagedInvestments Limited Perls
- 2008 23 4,455 0.60 - - 256 - 2007 23 4,519 0.60 - - 226
Page 44

COMMONWEALTH INVESTMENT FUNDS
NOTES TO THE FINANCIAL STATEMENTSFOR THE YEAR ENDED 30 JUNE 2008
8. RELATED PARTIES DISCLOSURES (continued)
(f) Investing Activities (continued)
Shares/ Value of Interest Shares/ Shares/ Dividend/Units Held Investment held in Units Units Distribution
Securities name at at Investment acquired disposed of receivedYear End Year End at Year End During During
Year YearNo.('000) $'000 % No.('000) No.('000) $'000
Commonwealth Growth Fund
Shares in Commonwealth Bankof Australia
- 2008 213 8,540 0.02 72 69 512- 2007 210 11,523 0.02 90 207 646
Units held in CFS Retail PropertyTrust
- 2008 166 307 0.01 39 46 20- 2007 173 371 0.01 137 258 19
Commonwealth Australian Share Fund
Shares in Commonwealth Bankof Australia
- 2008 115 4,629 0.01 39 29 286- 2007 105 5,759 0.01 20 60 319
Units held in CommonwealthProperty Office Fund
- 2008 - - - - - - - 2007 - - - - 64 -
Units held in CFS Retail PropertyTrust
- 2008 79 146 0.01 9 11 9- 2007 81 173 0.01 4 53 11
Page 45

COMMONWEALTH INVESTMENT FUNDS
NOTES TO THE FINANCIAL STATEMENTSFOR THE YEAR ENDED 30 JUNE 2008
8. RELATED PARTIES DISCLOSURES (continued)
(f) Investing Activities (continued)
Shares/ Value of Interest Shares/ Shares/ Dividend/Units Held Investment held in Units Units Distribution
Securities name at at Investment acquired disposed of receivedYear End Year End at Year End During During
Year YearNo.('000) $'000 % No.('000) No.('000) $'000
Commonwealth Share Income Fund
Shares in Commonwealth Bankof Australia
- 2008 389 15,599 0.03 140 100 941- 2007 349 19,190 0.03 69 226 1089
Units held in CommonwealthProperty Office Fund
- 2008 - - - - - - - 2007 - - - - 229 -
Units held in CFS Retail PropertyTrust
- 2008 257 476 0.01 35 44 30- 2007 266 573 0.01 14 203 38
Commonwealth PropertySecurities Fund
Units held in CFS Retail PropertyTrust
- 2008 1,472 2,722 0.07 141 395 181 - 2007 1,726 3,711 0.08 111 333 212
The following Funds held fixed interest securities with the Bank and it's related parties:
MarketValue
Counterparty$'000
Commonwealth CashManagement TrustCommonwealth Bank of Australia
- 2008 1,972 - 2007 15,055
Page 46

COMMONWEALTH INVESTMENT FUNDS
NOTES TO THE FINANCIAL STATEMENTSFOR THE YEAR ENDED 30 JUNE 2008
8. RELATED PARTIES DISCLOSURES (continued)
(g) Unitholder Investing Activities
Other funds managed by the Responsible Entity or its affiliates may from time to time purchase or redeem units in the Commonwealth Investment Funds. Such activity is undertaken in the ordinary course of business at entry and exit pricesavailable to all investors at the time of the transaction.
The interest of Colonial First State Investments Limited and its associates in the Funds as at 30 June 2008 is nil (2007 - nil) units.
9. SEGMENT INFORMATION
The Funds operate in one business segment, being investment management. The Funds operate from one geographiclocation being Australia, from where their investing activities are managed. Revenue is derived from dividends,distributions, interest, gains on the sale of investments, and unrealised changes in the value of investments.
Page 47

COMMONWEALTH INVESTMENT FUNDS
NOTES TO THE FINANCIAL STATEMENTSFOR THE YEAR ENDED 30 JUNE 2008
10. FINANCIAL RISK MANAGEMENT
The Funds' activities expose it to a variety of financial risks: market risk (including price risk and interest rate risk),credit risk and liquidity risk.
The Funds' overall risk management programme focuses on ensuring compliance with the Fund's Information Memorandumor Constitutions and seeks to maximise the returns derived for the level of risk to which the Funds are exposed. CertainFunds use derivative financial instruments to alter certain risk exposures. Financial risk management is carried out bythe respective investment management departments (Investment Managers) and regularly monitored by the ComplianceDepartment of the Responsible Entity.
The Funds use different methods to measure different types of risk to which it is exposed. These methods includesensitivity analysis in the case of interest rate, foreign exchange and other price risks and ratings analysis forcredit risk.
(a) Market Risk
(i) Price risk
The Funds' financial assets are either directly or indirectly exposed to price risk. This arises from investmentsheld by the Funds for which prices in the future are uncertain. They are classified on the balance sheet at fairvalue through profit or loss. All securities investments present a risk of loss of capital.
The Investment Managers mitigates this price risk through diversification and a careful selection of securities andother financial instruments within specified limits and guidelines in accordance with the Information Memorandumor Constitutions and are regularly monitored by the Compliance Department of the Responsible Entity.
The table in Note 10(b) summarises the impact of an increase/decrease of the Australian and global Indexes on theFunds' net assets attributable to unitholders at 30 June 2008 and 30 June 2007. The analysis is based on theassumptions that the indexes increased or decreased as tabled below with all other variables held constant and that thefair value of the Funds' which have indirect exposures to equity securities and derivatives moved according to thehistorical correlation with the indexes. The impact mainly arises from the reasonable possible change in the fair value ofthe underlying investment.
Investments options Decrease Increase Decrease Increase% % % %
Australian and Global Shares Options (15) 30 (15) 30 Multi- Sectors options (8) 15 (8) 15
30/06/200730/06/2008
Page 48

COMMONWEALTH INVESTMENT FUNDS
NOTES TO THE FINANCIAL STATEMENTSFOR THE YEAR ENDED 30 JUNE 2008
10. FINANCIAL RISK MANAGEMENT (continued)
(a) Market Risk (continued)
(ii) Interest rate risk
The Funds which have investments in interest bearing financial assets are exposed to the risks associated withthe effects of fluctuations in the prevailing levels of market interest rates on its financial position and cash flows.The risk is measured using sensitivity analysis.
Certain Funds may also enter into derivatives financial instruments to mitigate the risk of future interest ratechanges in accordance with the risk policies and guidelines of the Investment Managers. These transactions areregularly monitored by the Compliance Department of the Responsible Entity.
The table below summarises the Funds' exposure to interest rate risks. It includes the Funds' assets and liabilities atfair values.
Floating Fixed Non-interest Totalinterest rate interest rate bearing
30/06/2008$'000 $'000 $'000 $'000
Financial assetsCash and cash equivalents 5,152 - - 5,152 Receivables - - 6,528 6,528 Financial assets held for trading - 179,146 120,963 300,109 Financial liabilitiesPayables - - (5,786) (5,786) Financial liabilities held for trading - - (84) (84)
5,152 179,146 121,621 305,919 Net increase/(decrease) in exposurefrom interest rate swaps (notional - - - - principal)Net exposure 5,152 179,146 121,621 305,919
CommonwealthIncome Fund
Page 49

COMMONWEALTH INVESTMENT FUNDS
NOTES TO THE FINANCIAL STATEMENTSFOR THE YEAR ENDED 30 JUNE 2008
10. FINANCIAL RISK MANAGEMENT (continued)
(a) Market Risk (continued)
(ii) Interest rate risk (continued)
Floating Fixed Non-interest Totalinterest rate interest rate bearing
30/06/2007$'000 $'000 $'000 $'000
Financial assetsCash and cash equivalents 5,789 - - 5,789 Receivables - - 458 458 Financial assets held for trading - 226,074 163,196 389,270 Financial liabilitiesPayables - - (11,911) (11,911) Financial liabilities held for trading - - (51) (51)
5,789 226,074 151,692 383,555 Net increase/(decrease) in exposurefrom interest rate swaps (notional - - - - principal)Net exposure 5,789 226,074 151,692 383,555
Floating Fixed Non-interest Totalinterest rate interest rate bearing
30/06/2008$'000 $'000 $'000 $'000
Financial assetsCash and cash equivalents 5,550 - - 5,550 Receivables - - 6,124 6,124 Financial assets held for trading - - 570,729 570,729 Financial liabilitiesPayables - - (9,575) (9,575) Financial liabilities held for trading
5,550 - 567,278 572,828 Net increase/(decrease) in exposurefrom interest rate swaps (notional - - - principal)Net exposure 5,550 - 567,278 572,828
CommonwealthBalanced Fund
CommonwealthIncome Fund
Page 50

COMMONWEALTH INVESTMENT FUNDS
NOTES TO THE FINANCIAL STATEMENTSFOR THE YEAR ENDED 30 JUNE 2008
10. FINANCIAL RISK MANAGEMENT (continued)
(a) Market Risk (continued)
(ii) Interest rate risk (continued)
Floating Fixed Non-interest Totalinterest rate interest rate bearing
30/06/2007$'000 $'000 $'000 $'000
Financial assetsCash and cash equivalents 8,778 - - 8,778 Receivables - - 1,787 1,787 Financial assets held for trading - - 743,580 743,580 Financial liabilitiesPayables - - (60,561) (60,561) Financial liabilities held for trading
8,778 - 684,806 693,584 Net increase/(decrease) in exposurefrom interest rate swaps (notional - - - - principal)Net exposure 8,778 - 684,806 693,584
Floating Fixed Non-interest Totalinterest rate interest rate bearing
30/06/2008$'000 $'000 $'000 $'000
Financial assetsCash and cash equivalents 2,543 - - 2,543 Receivables - - 4,373 4,373 Financial assets held for trading - 41,860 254,884 296,744 Financial liabilitiesPayables - - (5,269) (5,269) Financial liabilities held for trading
2,543 41,860 253,988 298,391 Net increase/(decrease) in exposurefrom interest rate swaps (notional - - - - principal)Net exposure 2,543 41,860 253,988 298,391
CommonwealthGrowth Fund
Balanced FundCommonwealth
Page 51

COMMONWEALTH INVESTMENT FUNDS
NOTES TO THE FINANCIAL STATEMENTSFOR THE YEAR ENDED 30 JUNE 2008
10. FINANCIAL RISK MANAGEMENT (continued)
(a) Market Risk (continued)
(ii) Interest rate risk (continued)
Floating Fixed Non-interest Totalinterest rate interest rate bearing
30/06/2007$'000 $'000 $'000 $'000
Financial assetsCash and cash equivalents 6,811 - - 6,811 Receivables - - 13,637 13,637 Financial assets held for trading - 53,113 334,375 387,488 Financial liabilitiesPayables - - (48,258) (48,258) Financial liabilities held for trading
6,811 53,113 299,754 359,678 Net increase/(decrease) in exposurefrom interest rate swaps (notional - - - - principal)Net exposure 6,811 53,113 299,754 359,678
Floating Fixed Non-interest Totalinterest rate interest rate bearing
30/06/2008$'000 $'000 $'000 $'000
Financial assetsCash and cash equivalents 4,913 - - 4,913 Receivables - - 1,257 1,257 Financial assets held for trading - - 70,080 70,080 Financial liabilitiesPayables - - (1,371) (1,371) Financial liabilities held for trading - - (185) (185)
4,913 - 69,781 74,694 Net increase/(decrease) in exposurefrom interest rate swaps (notional - - - - principal)Net exposure 4,913 - 69,781 74,694
Fund
CommonwealthAustralian Share
CommonwealthGrowth Fund
Page 52

COMMONWEALTH INVESTMENT FUNDS
NOTES TO THE FINANCIAL STATEMENTSFOR THE YEAR ENDED 30 JUNE 2008
10. FINANCIAL RISK MANAGEMENT (continued)
(a) Market Risk (continued)
(ii) Interest rate risk (continued)
Floating Fixed Non-interest Totalinterest rate interest rate bearing
30/06/2007$'000 $'000 $'000 $'000
Financial assetsCash and cash equivalents 7,165 - - 7,165 Receivables - - 585 585 Financial assets held for trading - - 96,897 96,897 Financial liabilitiesPayables - - (11,365) (11,365) Financial liabilities held for trading - - (120) (120)
7,165 - 85,997 93,162 Net increase/(decrease) in exposurefrom interest rate swaps (notional - - - - principal)Net exposure 7,165 - 85,997 93,162
Floating Fixed Non-interest Totalinterest rate interest rate bearing
30/06/2008$'000 $'000 $'000 $'000
Financial assetsCash and cash equivalents 16,253 - - 16,253 Receivables - - 4,128 4,128 Financial assets held for trading - - 235,618 235,618 Financial liabilitiesPayables - - (4,418) (4,418) Financial liabilities held for trading - - (702) (702)
16,253 - 234,626 250,879 Net increase/(decrease) in exposurefrom interest rate swaps (notional - - - - principal)Net exposure 16,253 - 234,626 250,879
Commonwealth
CommonwealthShare Income Fund
Australian ShareFund
Page 53

COMMONWEALTH INVESTMENT FUNDS
NOTES TO THE FINANCIAL STATEMENTSFOR THE YEAR ENDED 30 JUNE 2008
10. FINANCIAL RISK MANAGEMENT (continued)
(a) Market Risk (continued)
(ii) Interest rate risk (continued)
Floating Fixed Non-interest Totalinterest rate interest rate bearing
30/06/2007$'000 $'000 $'000 $'000
Financial assetsCash and cash equivalents 23,833 - - 23,833 Receivables - - 1,995 1,995 Financial assets held for trading - - 323,185 323,185 Financial liabilitiesPayables - - (24,243) (24,243) Financial liabilities held for trading - - (372) (372)
23,833 - 300,565 324,398 Net increase/(decrease) in exposurefrom interest rate swaps (notional - - - - principal)Net exposure 23,833 - 300,565 324,398
Floating Fixed Non-interest Totalinterest rate interest rate bearing
30/06/2008$'000 $'000 $'000 $'000
Financial assetsCash and cash equivalents 2,367 - - 2,367 Receivables - - 1,099 1,099 Financial assets held for trading - - 39,716 39,716 Financial liabilitiesPayables - - (4,045) (4,045) Financial liabilities held for trading
2,367 - 36,770 39,137 Net increase/(decrease) in exposurefrom interest rate swaps (notional - - - - principal)Net exposure 2,367 - 36,770 39,137
Fund
CommonwealthProperty Securities
CommonwealthShare Income Fund
Page 54

COMMONWEALTH INVESTMENT FUNDS
NOTES TO THE FINANCIAL STATEMENTSFOR THE YEAR ENDED 30 JUNE 2008
10. FINANCIAL RISK MANAGEMENT (continued)
(a) Market Risk (continued)
(ii) Interest rate risk (continued)
Floating Fixed Non-interest Totalinterest rate interest rate bearing
30/06/2007$'000 $'000 $'000 $'000
Financial assetsCash and cash equivalents 2,253 - - 2,253 Receivables - - 5,131 5,131 Financial assets held for trading - - 96,125 96,125 Financial liabilitiesPayables - - (12,719) (12,719) Financial liabilities held for trading
2,253 - 88,537 90,790 Net increase/(decrease) in exposurefrom interest rate swaps (notional - - - - principal)Net exposure 2,253 - 88,537 90,790
Floating Fixed Non-interest Totalinterest rate interest rate bearing
30/06/2008$'000 $'000 $'000 $'000
Financial assetsCash and cash equivalents 783 - - 783 Receivables - - 92 92 Financial assets held for trading - - 27,728 27,728 Financial liabilitiesPayables - - (329) (329) Financial liabilities held for trading
783 - 27,491 28,274 Net increase/(decrease) in exposurefrom interest rate swaps (notional - - - - principal)Net exposure 783 - 27,491 28,274
CommonwealthInternational Share
Fund
CommonwealthProperty Securities
Fund
Page 55

COMMONWEALTH INVESTMENT FUNDS
NOTES TO THE FINANCIAL STATEMENTSFOR THE YEAR ENDED 30 JUNE 2008
10. FINANCIAL RISK MANAGEMENT (continued)
(a) Market Risk (continued)
(ii) Interest rate risk (continued)
Floating Fixed Non-interest Totalinterest rate interest rate bearing
30/06/2007$'000 $'000 $'000 $'000
Financial assetsCash and cash equivalents 907 - - 907 Receivables - - 32 32 Financial assets held for trading - - 44,340 44,340 Financial liabilitiesPayables - - (317) (317) Financial liabilities held for trading - - - -
907 - 44,055 44,962 Net increase/(decrease) in exposurefrom interest rate swaps (notional - - - - principal)Net exposure 907 - 44,055 44,962
Floating Fixed Non-interest Totalinterest rate interest rate bearing
30/06/2008$'000 $'000 $'000 $'000
Financial assetsCash and cash equivalents 1,714 - - 1,714 Receivables - - 62 62 Financial assets held for trading - 44,660 2 44,662 Financial liabilitiesPayables - - (751) (751) Financial liabilities held for trading - - - -
1,714 44,660 (687) 45,687 Net increase/(decrease) in exposurefrom interest rate swaps (notional - - - - principal)Net exposure 1,714 44,660 (687) 45,687
Bond Fund
Fund
Commonwealth
CommonwealthInternational Share
Page 56

COMMONWEALTH INVESTMENT FUNDS
NOTES TO THE FINANCIAL STATEMENTSFOR THE YEAR ENDED 30 JUNE 2008
10. FINANCIAL RISK MANAGEMENT (continued)
(a) Market Risk (continued)
(ii) Interest rate risk (continued)
Floating Fixed Non-interest Totalinterest rate interest rate bearing
30/06/2007$'000 $'000 $'000 $'000
Financial assetsCash and cash equivalents 457 - - 457 Receivables - - 28 28 Financial assets held for trading 1,017 54,663 - 55,680 Financial liabilitiesPayables - - (437) (437) Financial liabilities held for trading - - - -
1,474 54,663 (409) 55,728 Net increase/(decrease) in exposurefrom interest rate swaps (notional - - - - principal)Net exposure 1,474 54,663 (409) 55,728
Floating Fixed Non-interest Totalinterest rate interest rate bearing
30/06/2008$'000 $'000 $'000 $'000
Financial assetsCash and cash equivalents 29,443 - - 29,443 Receivables - - 5,958 5,958 Financial assets held for trading 349,036 1,870,581 - 2,219,617 Financial liabilitiesPayables - - (52,858) (52,858) Financial liabilities held for trading - - (10) (10)
378,479 1,870,581 (46,910) 2,202,150 Net increase/(decrease) in exposurefrom interest rate swaps (notional - - - - principal)Net exposure 378,479 1,870,581 (46,910) 2,202,150
CommonwealthCash Management
Trust
CommonwealthBond Fund
Page 57

COMMONWEALTH INVESTMENT FUNDS
NOTES TO THE FINANCIAL STATEMENTSFOR THE YEAR ENDED 30 JUNE 2008
10. FINANCIAL RISK MANAGEMENT (continued)
(a) Market Risk (continued)
(ii) Interest rate risk (continued)
Floating Fixed Non-interest Totalinterest rate interest rate bearing
30/06/2007$'000 $'000 $'000 $'000
Financial assetsCash and cash equivalents 49,513 - - 49,513 Receivables - - 8,621 8,621 Financial assets held for trading 469,014 2,213,339 45 2,682,398 Financial liabilitiesPayables - - (52,697) (52,697) Financial liabilities held for trading - - - -
518,527 2,213,339 (44,031) 2,687,835 Net increase/(decrease) in exposurefrom interest rate swaps (notional - - - - principal)Net exposure 518,527 2,213,339 (44,031) 2,687,835
Trust
CommonwealthCash Management
Page 58

COMMONWEALTH INVESTMENT FUNDS
NOTES TO THE FINANCIAL STATEMENTSFOR THE YEAR ENDED 30 JUNE 2008
10. FINANCIAL RISK MANAGEMENT (continued)
(a) Market Risk (continued)
(ii) Interest rate risk (continued)
An analysis of financial liabilities by maturities is provided in paragraph (d) below.
The table in Note 10 (b) summarises the impact of an increase/decrease of interest rates on the Fund's operatingprofit and net assets attributable to unitholders through changes in fair value or changes in future cash flows. Theanalysis is based on the assumption that interest rates changed by +/- 75 basis points (2007 - +/- 75 basis points)from the year end rates with all other variables held constant. The impact mainly arises from changes in the fairvalue of fixed interest securities.
(b) Summarised Sensitivity Analysis
The following table summarises the sensitivity of the Funds' operating profit or loss and net assets attributable tounitholders to interest rate risk, foreign exchange risk and other price risk . The reasonably possible movements inthe risk variables have been determined based on management's best estimate, having regard to a number offactors, including historical levels of changes in interest rates and foreign exchange rates, historical correlation of theFunds' investments with the relevant benchmark and market volatility. However, actual movements in the riskvariables may be greater than anticipated due to a number of factors, including unusually large market shocksresulting from changes in the performance of the economies, markets and securities in which the Funds invest. Asa result, historic variations in risk variables are not a definitive indicator of future variations in the risk variables.
-75 basis 75 basis -10.10% 10.10% -15.00% 30.00%points points$'000 $'000 $'000 $'000 $'000 $'000
30/06/2008 2,164 (2,397) - - (18,132) 36,264
30/06/2007 2,738 (3,032) - - (24,472) 48,944
-75 basis 75 basis -10.10% 10.10% -8.00% 15.00%points points$'000 $'000 $'000 $'000 $'000 $'000
30/06/2008 (42) 42 - - (45,658) 85,609
30/06/2007 (66) 66 - - (59,486) 111,537
Interest rate risk Foreign exchange risk Price Risk
CommonwealthIncome Fund
Interest rate risk Foreign exchange risk Price Risk
Impact on Operating Profit/(Loss) and Net Assets Attributable to Unitholders
CommonwealthBalanced Fund
Impact on Operating Profit/(Loss) and Net Assets Attributable to Unitholders
Page 59

COMMONWEALTH INVESTMENT FUNDS
NOTES TO THE FINANCIAL STATEMENTSFOR THE YEAR ENDED 30 JUNE 2008
10. FINANCIAL RISK MANAGEMENT (continued)
(b) Summarised Sensitivity Analysis (continued)
-75 basis 75 basis -10.10% 10.10% -15.00% 30.00%points points$'000 $'000 $'000 $'000 $'000 $'000
30/06/2008 496 (550) - - (38,233) 76,465
30/06/2007 602 (671) - - (50,156) 100,312
-75 basis 75 basis -10.10% 10.10% -15.00% 30.00%points points$'000 $'000 $'000 $'000 $'000 $'000
30/06/2008 (37) 37 - - (10,484) 20,969
30/06/2007 (54) 54 - - (14,517) 29,033
-75 basis 75 basis -10.10% 10.10% -15.00% 30.00%points points$'000 $'000 $'000 $'000 $'000 $'000
30/06/2008 (122) 122 - - (35,238) 70,475
30/06/2007 (179) 179 - - (48,422) 96,844
Interest rate risk Foreign exchange risk Price Risk
CommonwealthGrowth Fund
Impact on Operating Profit/(Loss) and Net Assets Attributable to Unitholders
CommonwealthAustralian Share
Fund
Impact on Operating Profit/(Loss) and Net Assets Attributable to Unitholders
CommonwealthShare Income Fund
Interest rate risk Foreign exchange risk Price Risk
Interest rate risk Foreign exchange risk Price RiskImpact on Operating Profit/(Loss) and Net Assets Attributable to Unitholders
Page 60

COMMONWEALTH INVESTMENT FUNDS
NOTES TO THE FINANCIAL STATEMENTSFOR THE YEAR ENDED 30 JUNE 2008
10. FINANCIAL RISK MANAGEMENT (continued)
(b) Summarised Sensitivity Analysis (continued)
-75 basis 75 basis -10.10% 10.10% -15.00% 30.00%points points$'000 $'000 $'000 $'000 $'000 $'000
30/06/2008 (18) 18 - - (5,957) 11,915
30/06/2007 (17) 17 - - (14,419) 28,837
-75 basis 75 basis -10.10% 10.10% -15.00% 30.00%points points$'000 $'000 $'000 $'000 $'000 $'000
30/06/2008 (6) 6 - - (4,159) 8,318
30/06/2007 (7) 7 - - (6,651) 13,302
-75 basis 75 basis -10.10% 10.10% -1.20% 1.30%points points$'000 $'000 $'000 $'000 $'000 $'000
30/06/2008 536 (594) - - - -
30/06/2007 661 (732) - - - -
Interest rate risk Foreign exchange risk Price Risk
CommonwealthProperty Securities
Fund
Interest rate risk Foreign exchange risk Price Risk
Impact on Operating Profit/(Loss) and Net Assets Attributable to Unitholders
CommonwealthInternational Share
Fund
Interest rate risk Foreign exchange risk Price Risk
Impact on Operating Profit/(Loss) and Net Assets Attributable to Unitholders
CommonwealthBond Fund
Impact on Operating Profit/(Loss) and Net Assets Attributable to Unitholders
Page 61

COMMONWEALTH INVESTMENT FUNDS
NOTES TO THE FINANCIAL STATEMENTSFOR THE YEAR ENDED 30 JUNE 2008
10. FINANCIAL RISK MANAGEMENT (continued)
(b) Summarised Sensitivity Analysis (continued)
-75 basis 75 basis -10.10% 10.10% -1.20% 1.30%points points$'000 $'000 $'000 $'000 $'000 $'000
30/06/2008 (16,868) 16,868 - - - -
30/06/2007 (20,488) 20,488 - - - -
CommonwealthCash Management
Trust
Impact on Operating Profit/(Loss) and Net Assets Attributable to UnitholdersInterest rate risk Foreign exchange risk Price Risk
Page 62

COMMONWEALTH INVESTMENT FUNDS
NOTES TO THE FINANCIAL STATEMENTSFOR THE YEAR ENDED 30 JUNE 2008
10. FINANCIAL RISK MANAGEMENT (continued)
(c) Credit risk
Credit risk primarily arises from investments in debt securities and derivative products. Other credit risk arises from cashand cash equivalents, deposits with banks and other financial institutions and amounts due from brokers.
Certain Funds invest in debt securities which have an investment grade as rated by the Standard & Poor’s rating agency.For unrated assets a rating is assigned by the Investment Manager using an approach that is consistent with theapproach used by rating agencies.
The Compliance Department of the Responsible Entity regularly monitors the credit risks that arise from holding thesesecurities.
The maximum exposure to credit risk at the reporting date is the carrying amount of the financial assets. An analysis ofdebt securities by rating is set out in the table below for the Funds which have such securities.
30/06/2008 30/06/2007 30/06/2008 30/06/2007 30/06/2008 30/06/2007$'000 $'000 $'000 $'000 $'000 $'000
Total debt securities 179,146 226,074 41,860 53,113 44,660 55,680
RatingAAA 71,766 91,786 5,806 8,020 30,351 36,999 AA+ 3,171 2,894 67 202 482 986 AA 4,568 5,335 197 329 1,836 1,938 AA- 8,957 13,451 527 590 6,485 9,349 A+ 7,829 9,292 707 945 2,296 2,461 A 42,673 41,372 921 834 1,853 2,511 A- 4,246 3,346 142 133 911 963 Others 5,911 7,166 265 260 446 473 Non rated 30,025 51,432 33,228 41,800 - - Total 179,146 226,074 41,860 53,113 44,660 55,680
30/06/2008 30/06/2007$'000 $'000
Total debt securities 2,219,617 2,682,353
RatingAAA 1,384,819 1,630,602 AA+ 460,792 667,906 AA 150,490 216,198 AA- 19,977 20,118 A+ 203,539 147,529
Total 2,219,617 2,682,353
Cash ManagementTrust
Commonwealth Commonwealth CommonwealthIncome Fund Growth Fund Bond Fund
Commonwealth
Page 63

COMMONWEALTH INVESTMENT FUNDS
NOTES TO THE FINANCIAL STATEMENTSFOR THE YEAR ENDED 30 JUNE 2008
10. FINANCIAL RISK MANAGEMENT (continued)
(d) Liquidity Risk
The Funds are exposed to daily cash redemptions of redeemable units. It therefore primarily holds investments that aretraded in an active market and can be readily disposed. Only a limited proportion of its assets are held in investments notactively traded on a stock exchange.
The Funds' listed securities are considered readily realisable, as they are listed on either the Australian Stock Exchangeor other recognised International Stock Exchanges.
Certain Funds may, from time to time, invest in derivative contracts traded over the counter, which are not traded in anorganised market and may be illiquid. As a result, these Funds may not be able to quickly liquidate its investments inthese instruments at an amount close to their fair value to meet its liquidity requirements or to respond to specific eventssuch as deterioration in the creditworthiness of any particular issuer or counterparty. No such investments were held atyear end.
The table below analyses the Funds' financial liabilities excluding gross settled derivative financial liabilities intorelevant maturity groupings based on the remaining period to the contractual maturity date at the year end date. Theamounts in the table are the contractual undiscounted cash flows.
(i) Financial liabilities
Less than 1 - 3 3 - 12 1 - 2 2 - 3 More than30/06/2008 1 month months months years years 3 years
$'000 $'000 $'000 $'000 $'000 $'000
Financial liabilities held fortrading
Net settled derivatives - 84 - - - - Payables 5,786 - - - - - Net assets attributable tounitholders 305,919 - - - - - Total financial liabilities 311,705 84 - - - -
Less than 1 - 3 3 - 12 1 - 2 2 - 3 More than30/06/2007 1 month months months years years 3 years
$'000 $'000 $'000 $'000 $'000 $'000
Financial liabilities held fortrading
Net settled derivatives - 51 - - - - Payables 11,911 - - - - - Net assets attributable tounitholders 383,555 - - - - - Total financial liabilities 395,466 51 - - - -
CommonwealthIncome Fund
CommonwealthIncome Fund
Page 64

COMMONWEALTH INVESTMENT FUNDS
NOTES TO THE FINANCIAL STATEMENTSFOR THE YEAR ENDED 30 JUNE 2008
10. FINANCIAL RISK MANAGEMENT (continued)
(d) Liquidity Risk (continued)
(i) Financial liabilities (continued)
Less than 1 - 3 3 - 12 1 - 2 2 - 3 More than30/06/2008 1 month months months years years 3 years
$'000 $'000 $'000 $'000 $'000 $'000
Payables 9,575 - - - - - Net assets attributable tounitholders 572,828 - - - - - Total financial liabilities 582,403 - - - - -
Less than 1 - 3 3 - 12 1 - 2 2 - 3 More than30/06/2007 1 month months months years years 3 years
$'000 $'000 $'000 $'000 $'000 $'000
Payables 60,560 - - - - - Net assets attributable tounitholders 693,584 - - - - - Total financial liabilities 754,144 - - - - -
Less than 1 - 3 3 - 12 1 - 2 2 - 3 More than30/06/2008 1 month months months years years 3 years
$'000 $'000 $'000 $'000 $'000 $'000
Payables 5,269 - - - - - Net assets attributable tounitholders 298,391 - - - - - Total financial liabilities 303,660 - - - - -
CommonwealthGrowth Fund
CommonwealthBalanced Fund
CommonwealthBalanced Fund
Page 65

COMMONWEALTH INVESTMENT FUNDS
NOTES TO THE FINANCIAL STATEMENTSFOR THE YEAR ENDED 30 JUNE 2008
10. FINANCIAL RISK MANAGEMENT (continued)
(d) Liquidity Risk (continued)
(i) Financial liabilities (continued)
Less than 1 - 3 3 - 12 1 - 2 2 - 3 More than30/06/2007 1 month months months years years 3 years
$'000 $'000 $'000 $'000 $'000 $'000
Payables 48,257 - - - - - Net assets attributable tounitholders 359,678 - - - - - Total financial liabilities 407,935 - - - - -
Less than 1 - 3 3 - 12 1 - 2 2 - 3 More than30/06/2008 1 month months months years years 3 years
$'000 $'000 $'000 $'000 $'000 $'000
Financial liabilities held fortrading
Net settled derivatives - 185 - - - - Payables 1,371 - - - - - Net assets attributable tounitholders 74,694 - - - - - Total financial liabilities 76,065 185 - - - -
Less than 1 - 3 3 - 12 1 - 2 2 - 3 More than30/06/2007 1 month months months years years 3 years
$'000 $'000 $'000 $'000 $'000 $'000
Financial liabilities held fortrading
Net settled derivatives - 120 - - - - Payables 11,365 - - - - - Net assets attributable tounitholders 93,162 - - - - - Total financial liabilities 104,527 120 - - - -
Australian ShareFund
CommonwealthAustralian Share
Fund
Commonwealth
CommonwealthGrowth Fund
Page 66
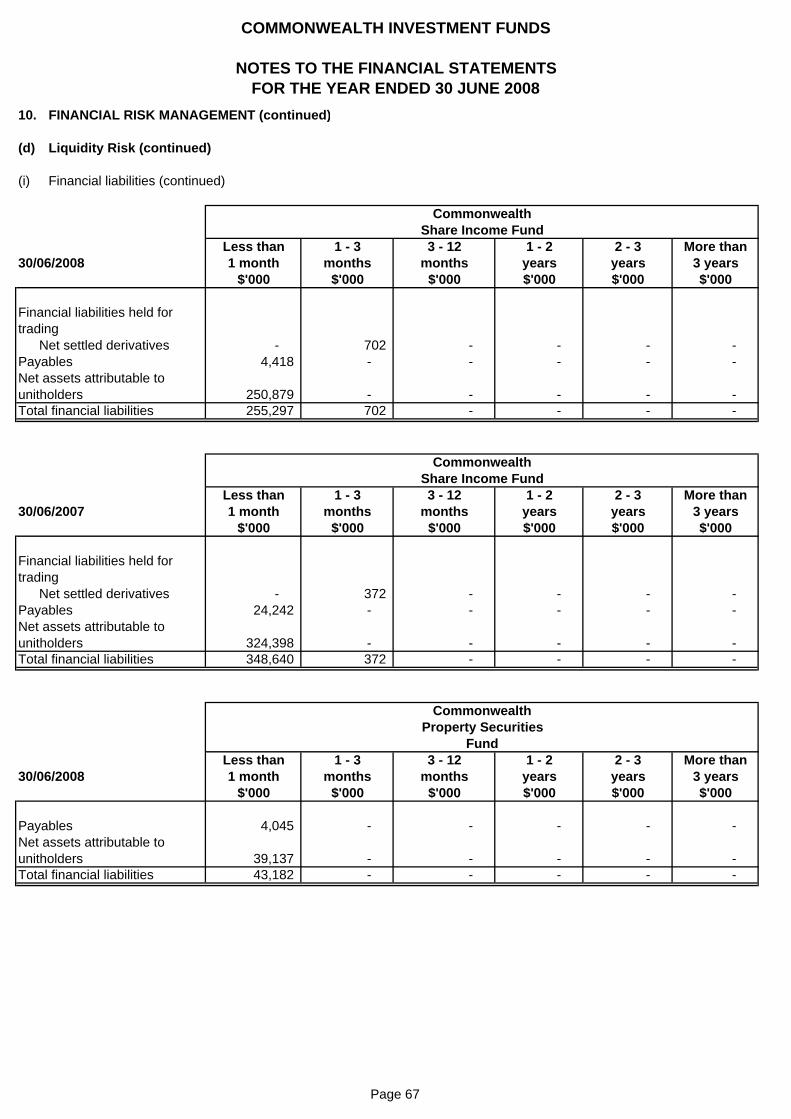
COMMONWEALTH INVESTMENT FUNDS
NOTES TO THE FINANCIAL STATEMENTSFOR THE YEAR ENDED 30 JUNE 2008
10. FINANCIAL RISK MANAGEMENT (continued)
(d) Liquidity Risk (continued)
(i) Financial liabilities (continued)
Less than 1 - 3 3 - 12 1 - 2 2 - 3 More than30/06/2008 1 month months months years years 3 years
$'000 $'000 $'000 $'000 $'000 $'000
Financial liabilities held fortrading
Net settled derivatives - 702 - - - - Payables 4,418 - - - - - Net assets attributable tounitholders 250,879 - - - - - Total financial liabilities 255,297 702 - - - -
Less than 1 - 3 3 - 12 1 - 2 2 - 3 More than30/06/2007 1 month months months years years 3 years
$'000 $'000 $'000 $'000 $'000 $'000
Financial liabilities held fortrading
Net settled derivatives - 372 - - - - Payables 24,242 - - - - - Net assets attributable tounitholders 324,398 - - - - - Total financial liabilities 348,640 372 - - - -
Less than 1 - 3 3 - 12 1 - 2 2 - 3 More than30/06/2008 1 month months months years years 3 years
$'000 $'000 $'000 $'000 $'000 $'000
Payables 4,045 - - - - - Net assets attributable tounitholders 39,137 - - - - - Total financial liabilities 43,182 - - - - -
Fund
CommonwealthShare Income Fund
CommonwealthProperty Securities
CommonwealthShare Income Fund
Page 67

COMMONWEALTH INVESTMENT FUNDS
NOTES TO THE FINANCIAL STATEMENTSFOR THE YEAR ENDED 30 JUNE 2008
10. FINANCIAL RISK MANAGEMENT (continued)
(d) Liquidity Risk (continued)
(i) Financial liabilities (continued)
Less than 1 - 3 3 - 12 1 - 2 2 - 3 More than30/06/2007 1 month months months years years 3 years
$'000 $'000 $'000 $'000 $'000 $'000
Financial liabilities held fortradingPayables 12,717 - - - - - Net assets attributable tounitholders 90,790 - - - - - Total financial liabilities 103,507 - - - - -
Less than 1 - 3 3 - 12 1 - 2 2 - 3 More than30/06/2008 1 month months months years years 3 years
$'000 $'000 $'000 $'000 $'000 $'000
Financial liabilities held fortradingPayables 329 - - - - - Net assets attributable tounitholders 28,274 - - - - - Total financial liabilities 28,603 - - - - -
Less than 1 - 3 3 - 12 1 - 2 2 - 3 More than30/06/2007 1 month months months years years 3 years
$'000 $'000 $'000 $'000 $'000 $'000
Financial liabilities held fortradingPayables 315 - - - - - Net assets attributable tounitholders 44,962 - - - - - Total financial liabilities 45,277 - - - - -
International ShareFund
CommonwealthInternational Share
Fund
Commonwealth
CommonwealthProperty Securities
Fund
Page 68
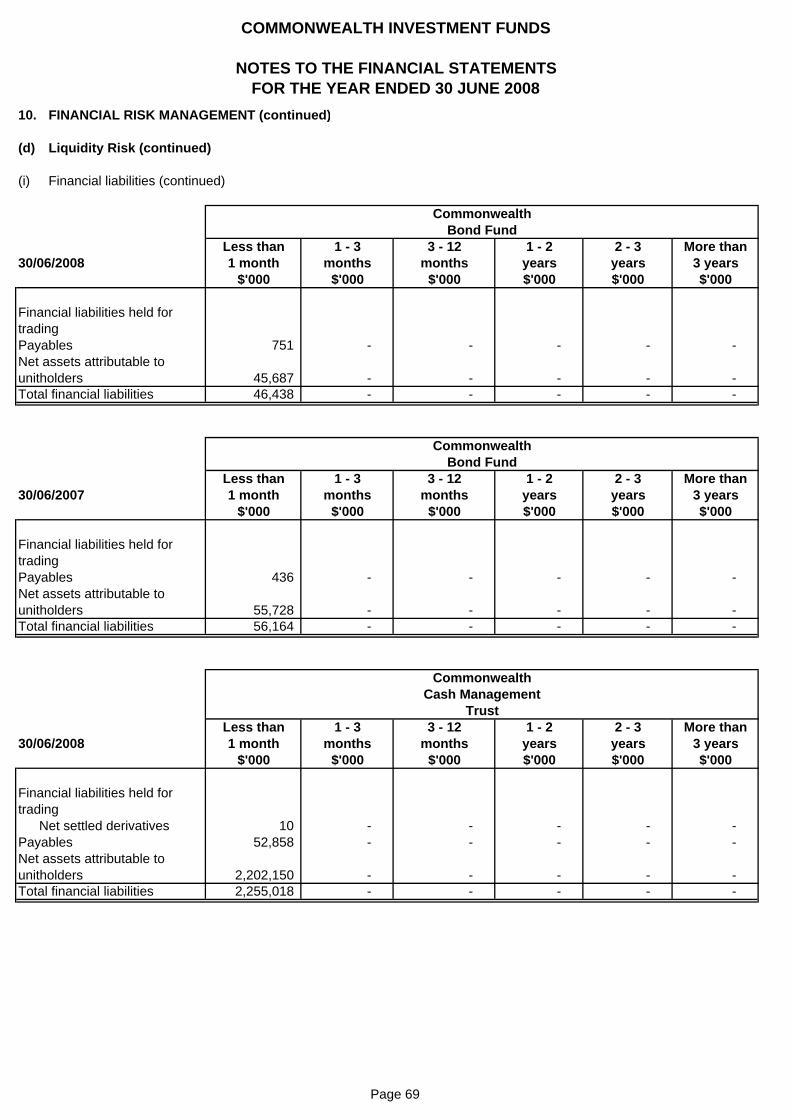
COMMONWEALTH INVESTMENT FUNDS
NOTES TO THE FINANCIAL STATEMENTSFOR THE YEAR ENDED 30 JUNE 2008
10. FINANCIAL RISK MANAGEMENT (continued)
(d) Liquidity Risk (continued)
(i) Financial liabilities (continued)
Less than 1 - 3 3 - 12 1 - 2 2 - 3 More than30/06/2008 1 month months months years years 3 years
$'000 $'000 $'000 $'000 $'000 $'000
Financial liabilities held fortradingPayables 751 - - - - - Net assets attributable tounitholders 45,687 - - - - - Total financial liabilities 46,438 - - - - -
Less than 1 - 3 3 - 12 1 - 2 2 - 3 More than30/06/2007 1 month months months years years 3 years
$'000 $'000 $'000 $'000 $'000 $'000
Financial liabilities held fortradingPayables 436 - - - - - Net assets attributable tounitholders 55,728 - - - - - Total financial liabilities 56,164 - - - - -
Less than 1 - 3 3 - 12 1 - 2 2 - 3 More than30/06/2008 1 month months months years years 3 years
$'000 $'000 $'000 $'000 $'000 $'000
Financial liabilities held fortrading
Net settled derivatives 10 - - - - - Payables 52,858 - - - - - Net assets attributable tounitholders 2,202,150 - - - - - Total financial liabilities 2,255,018 - - - - -
Trust
CommonwealthBond Fund
CommonwealthCash Management
CommonwealthBond Fund
Page 69

COMMONWEALTH INVESTMENT FUNDS
NOTES TO THE FINANCIAL STATEMENTSFOR THE YEAR ENDED 30 JUNE 2008
10. FINANCIAL RISK MANAGEMENT (continued)
(d) Liquidity Risk (continued)
(i) Financial liabilities (continued)
Less than 1 - 3 3 - 12 1 - 2 2 - 3 More than30/06/2007 1 month months months years years 3 years
$'000 $'000 $'000 $'000 $'000 $'000
Financial liabilities held fortrading
Net settled derivatives - 87 - - - - Payables 52,697 - - - - - Net assets attributable tounitholders 2,687,835 - - - - - Total financial liabilities 2,740,532 87 - - - -
CommonwealthCash Management
Trust
Page 70

COMMONWEALTH INVESTMENT FUNDS
NOTES TO THE FINANCIAL STATEMENTSFOR THE YEAR ENDED 30 JUNE 2008
10. FINANCIAL RISK MANAGEMENT (continued)
(e) Fair value estimation
The carrying amounts of the Funds' assets and liabilities at the balance sheet date approximate their fair values.
The fair value of financial instruments traded in active markets (such as publicly traded derivatives and listed securities) isbased on quoted market prices at the reporting date. The quoted market price used for financial assets held by the Fund isthe last bid price. Derivative contracts classified as held for trading are fair valued by comparing the contracted rate to thecurrent market rate for a contract with the same remaining period to maturity.
Investments in unlisted managed investment schemes are recorded at the redemption value per unit as reported by theResponsible Entity of such funds.
The fair value of financial instruments that are not traded in an active market (for example, over-the-counter derivatives andinvestments in unlisted securities) is determined using valuation techniques. These Funds use a variety of methods andmake assumptions that are based on market conditions existing at each balance date. Quoted market prices or dealerquotes for similar instruments are used for long-term debt instruments held. Other techniques, such as estimateddiscounted cash flows, are used to determine the fair value for the remaining financial instruments.
Page 71
COMMONWEALTH INVESTMENT FUNDS
NOTES TO THE FINANCIAL STATEMENTSFOR THE YEAR ENDED 30 JUNE 2008
11. DERIVATIVE FINANCIAL INSTRUMENTS
In the normal course of business certain Funds enters into transactions in various derivative financial instruments withcertain risks. A derivative is a financial instrument or other contract which is settled at a future date and whose valuechanges in response to the change in a specified interest rate, financial instrument price, commodity price, foreignexchange rate, index of prices or rates, credit rating or credit index or other variable.
Derivative financial instruments require no initial net investment or an initial net investment that is smaller than would berequired for other types of contracts that would be expected to have a similar response to changes in market factors.
Derivative transactions include a wide assortment of instruments, such as forwards, futures and options. Derivatives areconsidered to be part of the investment process. The use of derivatives is an essential part of these Funds' portfoliomanagement. Derivatives are not managed in isolation. Consequently, the use of derivatives is multifaceted and includes:
- hedging to protect an asset or liability of these Funds against a fluctuation in market values or to reduce volitility- a substitution for trading of physical securities- adjusting asset exposures within the parameters set in the investment strategy, and adjusting the duration of fixed
interest portfolios or the weighted average maturity of cash portfolios.
While derivatives are used for trading purposes, they are not used to gear (leverage) a portfolio. Gearing a portfolio wouldoccur if the level of exposure to the markets exceeds the underlying value of these Funds.
Certain Funds hold the following derivative instruments:
(a) Futures
Futures are contractual obligations to buy or sell financial instruments on a future date at a specified price established inan organised market. The futures contracts are collateralised by cash or marketable securities. Changes in futurescontracts' values are usually settled net daily with the exchange. Interest rate futures are contractual obligations toreceive or pay a net amount based on changes in interest rates at a future date at a specified price, established in anorganised market.
(b) Options
An option is a contractual agreement under which the seller (writer) grants the purchaser (holder) the right, but not theobligation, either to buy (a call option) or sell (a put option) at or buy a set date or during a set period, a specific amountof securities or a financial instrument at a predetermined price. The seller receives a premium from the purchaser inconsideration for the assumption of future securities price. Options held by certain Funds are exchange-traded. TheseFunds are exposed to credit risk on purchased options to the extent of their carrying amount, which is their fair value.
Page 72

COMMONWEALTH INVESTMENT FUNDS
NOTES TO THE FINANCIAL STATEMENTSFOR THE YEAR ENDED 30 JUNE 2008
11. DERIVATIVE FINANCIAL INSTRUMENTS (continued)
The Funds' derivative financial instruments at year-end are detailed below:
Contract/ Contract/Notional Assets Liabilities Notional Assets Liabilities
$'000 $'000 $'000 $'000 $'000 $'000
- Australian share price index futures 2,077 - (84) 2,668 - (51)
2,077 - (84) 2,668 - (51)
Contract/ Contract/Notional Assets Liabilities Notional Assets Liabilities
$'000 $'000 $'000 $'000 $'000 $'000
- Australian share price index futures 4,544 - (185) 6,905 - (120)
4,544 - (185) 6,905 - (120)
Contract/ Contract/Notional Assets Liabilities Notional Assets Liabilities
$'000 $'000 $'000 $'000 $'000 $'000
- Australian share price index futures 17,267 - (702) 23,225 - (372)
17,267 - (702) 23,225 - (372)
Contract/ Contract/Notional Assets Liabilities Notional Assets Liabilities
$'000 $'000 $'000 $'000 $'000 $'000
- Australian interest rate futures 202 2 - - - -
202 2 - - - -
Fair Values Fair Values
30/06/2008 30/06/2007
CommonwealthBond Fund
Fair Values Fair Values
30/06/2008 30/06/2007
CommonwealthShare Income Fund
Fair Values Fair Values
30/06/2008 30/06/2007
CommonwealthAustralian Share
Fund
CommonwealthIncome Fund
Fair Values Fair Values
30/06/2008 30/06/2007
Page 73
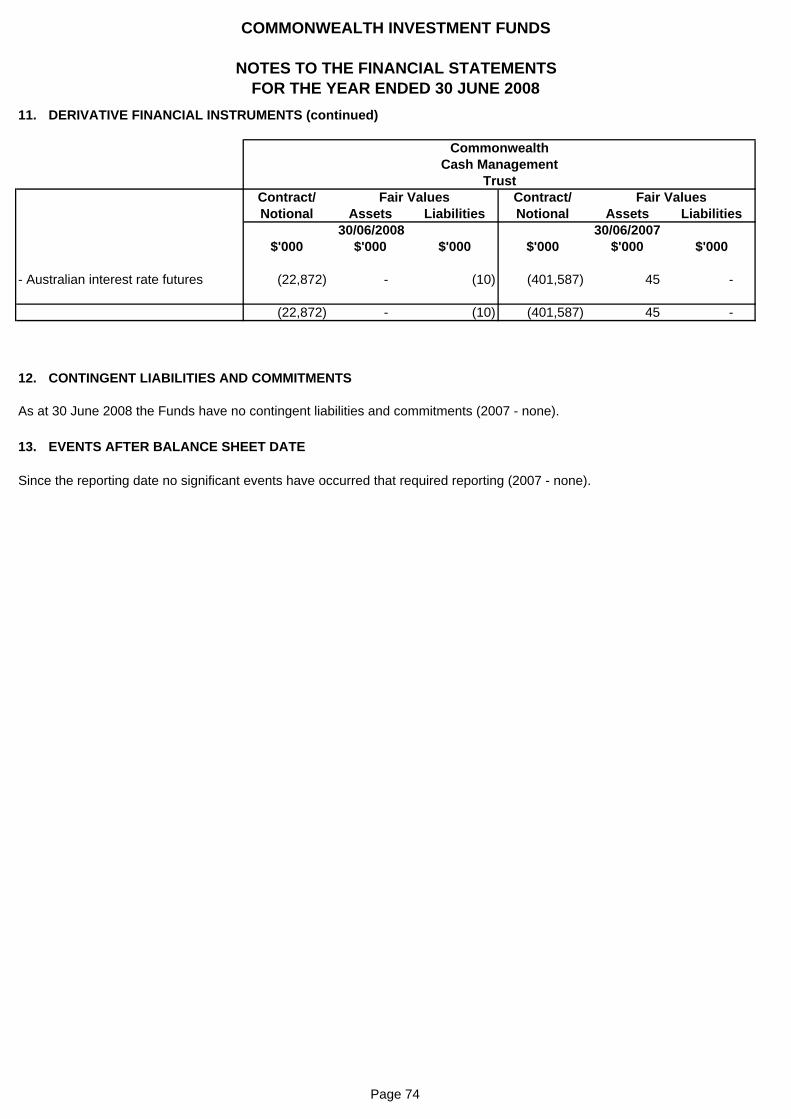
COMMONWEALTH INVESTMENT FUNDS
NOTES TO THE FINANCIAL STATEMENTSFOR THE YEAR ENDED 30 JUNE 2008
11. DERIVATIVE FINANCIAL INSTRUMENTS (continued)
Contract/ Contract/Notional Assets Liabilities Notional Assets Liabilities
$'000 $'000 $'000 $'000 $'000 $'000
- Australian interest rate futures (22,872) - (10) (401,587) 45 -
(22,872) - (10) (401,587) 45 -
12. CONTINGENT LIABILITIES AND COMMITMENTS
As at 30 June 2008 the Funds have no contingent liabilities and commitments (2007 - none).
13. EVENTS AFTER BALANCE SHEET DATE
Since the reporting date no significant events have occurred that required reporting (2007 - none).
Fair Values Fair Values
30/06/2008 30/06/2007
CommonwealthCash Management
Trust
Page 74

COMMONWEALTH INVESTMENT FUNDS
In the opinion of the Directors of Colonial First State Investments Limited:
a) the financial statements and notes to the financial statements of the Commonwealth InvestmentFunds ("the Funds") are in accordance with the Corporations Act 2001, including:
i) giving a true and fair view of the Funds' financial positions as at 30 June 2008and of their performances for the year ended on that date; and
ii) complying with Accounting Standards and the Corporations Regulations 2001and other mandatory professional reporting requirements; and
b) there are reasonable grounds to believe that the Funds will be able to pay their debts asand when they become due and payable;
This declaration is made in accordance with a resolution of the directors.
Bradley Brian MasseyDirectorSydney4 September 2008
DIRECTORS' DECLARATIONFOR THE YEAR ENDED 30 JUNE 2008
Page 75


This page has been left blank intentionally.

13 20158.30 am–6 pm (Sydney time) Monday to Fridaycommbank.com.au

CIF
Ann
ualR
epor
t200
8 0
1009
/124
86
Related Documents