Perelman School of Medicine University of Pennsylvania Alzheimer’s disease gene0cs Common and rare variants that contribute to risk

Welcome message from author
This document is posted to help you gain knowledge. Please leave a comment to let me know what you think about it! Share it to your friends and learn new things together.
Transcript

Perelman School of Medicine University of Pennsylvania
Alzheimer’s disease gene0cs
Common and rare variants that contribute to risk

• Study human disease mechanisms directly in humans
• Prediction
• Mechanism
• Drug targets
Alzheimer’s disease gene0cs goals
Gene Protein Mechanism/ Drug Pathway target

1990 2000 2010
PSEN1 mapped
PSEN2 cloned
PSEN2 mapped
PSEN1 cloned
APP muta0ons
APP cloned
APOE
BACE1 cloned
• Aβ is toxic/causes AD • Increased Aβ is toxic/causes AD • Aggrega0on-‐prone Aβ is toxic/causes AD • PSEN1/2 are Aβ pathway enzymes • BACE1 is an Aβ pathway enzyme

ISEVKM DAEFRHDSGYEVHHQKLVFFAEDVGSNKGAIIGLMVGGVVIA
α-‐secretase β-‐secretase γ-‐secretase
Aβ
β-‐secretase γ-‐secretase
NL 670/671
α-‐secretase
APP
TVIVITLVMLKKQ
T 673

1990 2000 2010
PSEN2 cloned
PSEN2 mapped
PSEN1 cloned
Candidate genes
APP muta0ons
APP cloned
SORL1
BACE1 cloned
PSEN1 mapped
APOE

1990 2000 2010
PSEN2 cloned
PSEN2 mapped
PSEN1 cloned
Candidate genes
APP muta0ons
APP cloned
SORL1
3 loci
1 locus
5 loci
13 loci
GWAS
TREM2
NextGen DNA Sequencing
BACE1 cloned PLD2
PSEN1 mapped
APOE

APOE agonist
1990 2000 2010
PSEN2 cloned
PSEN2 mapped
PSEN1 cloned
APP muta0ons
APP cloned
γ-‐secretase inhibitor BACE1 inhibitor
BACE1 cloned
Aβ immuniza0on mice
Aβ immuniza0on human
Drug development
APOE
PSEN1 mapped

Coronary artery disease PCSK9 2003
ΔPCSK9 2006 3 yrs
Trial Drug? 2011 2014 5 yrs 3 yrs?
Alzheimer’s disease
Gene Trial Drug? 10 yrs 13+ yrs (?)
2006 -‐ PCSK9 null protec0ve allele PCSK9: Proprotein convertase sub0lisin/kexin type 9 Abifadel et al. (2003) Nat. Genet. 34, 154-‐156
Cohen et al (2006) NEJM 354, 1264-‐1272 King (2013) 10,1

Gene target Disorder Drug HMG co-‐A reductase Heart disease staNns NPC1L1 Heart disease Ze0a (eze0mibe) VCAM1 MS natalizumab IL2RA MS daclizumab TNF-‐α RA infliximab
GWAS loci that are drug targets

Gene Protein Mechanism/ Drug Pathway target
Gene discovery leads to valid drug targets

Genome-‐wide associa0on studies – common variants • APOE • AD status as a trait • Biomarkers (CSF) • Neuropathologic markers • Gene-‐gene interac0ons
Rare variants • Rare-‐variant associa0on studies • Sequence analysis
Associa0on studies in non-‐Caucasian popula0ons

Genome-‐wide associa0on studies Late-‐onset AD
• Hypothesis – common alleles contribute to disease risk
• Test all regions of the genome simultaneously
• Genotype 700,000 or more 2-‐allele SNPs
• Imput an addi0onal > 3 million SNPs
• Account for popula0on and study heterogeneity • Stringent criteria for associa0on (P < 5 x 10-‐8)
• Large sample

Cohort Cases Autopsies n (percent) Controls Autopsies:
n (percent)
ADC1 1566 1566 (100%) 515 515 (100%)
ADC2 738 195 (26%) 160 0 (0%)
ADC3 897 527 (59%) 588 4 (1%)
Totals 3,201 2,288 (71%) 1,263 519 (41%)
Alzheimer’s Disease Center
samples
AD cases Controls Consor0um N % women Mean N % women Mean Age
Onset Age at last exam ADGC 10,273 42-‐70 71–86 10,892 37–72 72–84 (13 cohorts)
Alzheimer’s disease centers case-‐control studies Prospec0ve cohort studies family-‐based cohorts

Genome-‐wide associa0on studies – common variants • APOE • AD status as a trait • Biomarkers (CSF) • Neuropathologic markers • Gene-‐gene interac0ons
Rare variants • Rare-‐variant associa0on studies • Sequence analysis
Associa0on studies in non-‐Caucasian popula0ons

ε3
ε2 T (Cys)
ε4 C (Arg)
T (Cys)
T (Cys)
C (Arg)
C (Arg)
Promoter
3937 4075
Exon 1 Exon 2 Exon 3 Exon 4
APOE APOC1 TOMM40
APOE

Odds ratio Control Case Genotype (95% Confidence frequency frequency
interval) (percent) (percent)
ε3/ε3 1.0 (referent) 60.9 36.4
ε2/ε2 0.6 (0.2 – 2.0) 0.8 0.2
ε2/ε3 0.6 (0.5 – 0.8) 12.7 4.8
ε2/ε4 2.6 (1.6 – 4.0) 2.6 2.6
ε3/ε4 3.2 (2.8 – 3.8) 21.3 41.1
ε4/ε4 14.9 (10.8 – 20.6) 1.8 14.8
Farrer et al. JAMA 278, 1349
ε2 ε3 ε4
Control 8.4 77.9 13.7
AD case 3.9 59.4 36.7

CLPTM1
RELB CLASRP GEMIN7 PPP1R37 TRAPPC6A
NKPD1 BLOC1S3
EXOC3L2 CEACAM16
BCL3 CBLC
PVRL2
BCAM
APOC4 APOC1P1
TOMM40 APOC1 APOC2
APOE
195 kb 303 kb
Basic Model Extended model SNP Gene OR (95%CI) P value OR (95%CI) P value rs17643262 NKPD1 1.33 (1.25–1.42) 5.1 x 10-‐14 1.04 (0.97–1.12) 0.30 rs7249082 EXOC3L 1.19 (1.12–1.25) 1.1 x 10-‐9 1.03 (0.97–1.10) 0.28
SNP Gene OR (95% CI) P value rs2965109 CEACAM16 0.81 (0.78-‐0.85) 4.43 x 10-‐21 rs2075650 TOMM40 2.81 (2.66-‐2.97) 1.28 x 10-‐299 rs4420638 APOCI 3.64 (3.42-‐3.87) 1.00 x 10-‐300 rs10415983 EXOC3L2 1.19 (1.13-‐1.26) 5.11 x 10-‐10

• Is APOE such a strong risk factor that other risk loci are obscured?
• Are there APOE dependent or APOE independent risk factors?
Stra0fied GWAS: APOE ε4+ APOE ε4-‐

SNP CH Closest Gene/Region ReplicaNon Meta-‐Analysis
OR (95% CI) OR (95% CI) P
rs2732703 17 KANSL1/LRRC37A 0.71 (0.58-‐0.88) 0.73 (0.65-‐0.81) 5.8x10-‐9
MAPT
MAPT
NSF exons 1-13
NSF exons 1-21
NSF exons 1-21
NSF exons 1-13
H1
Stefansson et al (2005) Nature Genet. 37, 129
H2
KANSL1
KANSL1
MAPT encodes tau – protein in neurofibrillary tangles

-log1
0(P
)
Rec
ombi
natio
n ra
te (c
M/M
b)
17q21.31 (kb)
Condi0on on rs8070723 (H1/H2)
PSP GWAS Results 1 Mb H1/H2 inversion polymorphism

-log1
0(P
)
Rec
ombi
natio
n ra
te (c
M/M
b)
17q21.31 (kb)
Condi0on on rs8070723 (H1/H2)
0 1 2 3 4 9 10 12 13
6 7
MAPT
5 4a
8 11
rs242557 rs8070723 H1/H2 tagging

SNP CH Closest Gene/Region ReplicaNon Meta-‐Analysis
OR (95% CI) OR (95% CI) P
rs2732703 17 KANSL1/LRRC37A 0.71 (0.58-‐0.88) 0.73 (0.65-‐0.81) 5.8x10-‐9

SNP CH Region or Closest Gene
APOE ε4(+) APOE ε4(-‐)
OR (95% CI) P OR (95% CI) P
rs679515 1 CR1 1.22 (1.14 -‐ 1.30) 3.6x10-‐9 1.13 (1.07 -‐ 1.19) 1.6x10-‐5
rs4663105 2 BIN1 1.19 (1.12 -‐ 1.25) 2.5x10-‐9 1.19 (1.13 -‐ 1.24) 1.8x10-‐12
rs9331896 8 CLU 0.84 (0.80 -‐ 0.89) 2.8x10-‐9 0.90 (0.86 -‐ 0.94) 9.6x10-‐6
rs1582763 11 MS4 region 0.92 (0.87 -‐ 0.97) 0.003 0.87 (0.83 -‐ 0.91) 2.2x10-‐9

W Family: onset mean = 52.8 (4.5) n = 5, range = 47 - 58
54 82 57 74 48 3/4 3/3 3/4 3/4
47 3/3
3/3 3/3 2/3 60 52 45
3/3 49
3/4 75
HD Family, onset mean = 59.6 (10.3) , n = 17, range = 46 - 82
72 68 62 3/3 3/3
55 75 55 65 3/3 3/3 3/3 4
HB Family: onset mean = 60.8 (7.1), n = 22, range = 54 - 75
3/3 3/3 2/3 60 52 45
3/3 49
3/4 75
HD Family: onset mean = 59.6 (10.3), n = 17, range = 46 - 82
N141I Presenilin 2 mutaNon Volga Germans

• APOE risk is en0rely due to the ε2/ε3/ε4 variants
• MAPT region is an APOE e4 independent risk locus
• APOE independent pathway → AD?
• MAPT signal for PSP is different from AD signal
• MS4 region is also an APOE independent risk locus
• APOE modifies the Aβ-‐presenilin AD pathway
APOE Conclusions

Genome-‐wide associa0on studies – common variants • APOE • AD status as a trait • Biomarkers (CSF) • Neuropathologic markers • Gene-‐gene interac0ons
Rare variants • Rare-‐variant associa0on studies • Sequence analysis
Associa0on studies in non-‐Caucasian popula0ons

Adam C. Naj, Gyungah Jun, Gary W. Beecham, Li-‐San Wang, Badri Narayan Vardarajan, Jacqueline Buros, Paul J. Gallins, Joseph D. Buxbaum, Gail P. Jarvik, Paul K. Crane, Eric B. Larson, Thomas D. Bird, Bradley F. Boeve, Neill R. Graff-‐Radford, Philip L. De Jager, Denis Evans, Julie A. Schneider, Minerva M. Carrasquillo, Nilufer Ertekin-‐Taner, Steven G. Younkin, Carlos Cruchaga, John S.K. Kauwe, Petra Nowotny, Patricia Kramer, John Hardy, Mavhew J. Huentelman, Amanda J Myers, Michael M. Barmada, F Yesim Demirci, Clinton T. Baldwin, Robert C. Green, Ekaterina Rogaeva, Peter St George-‐Hyslop, Steven E. Arnold, Robert Barber, Thomas Beach, Eileen H. Bigio, James D. Bowen, Adam Boxer, James R. Burke, Nigel J. Cairns, Chris S. Carlson, Regina M. Carney, Steven L. Carroll, Helena C. Chui, David G. Clark, Jason Corneveaux, Carl W. Cotman, Jeffrey L. Cummings, Charles DeCarli, Steven T. DeKosky, Ramon Diaz-‐Arras0a, Malcolm Dick, Dennis W. Dickson, William G. Ellis, Kelley M. Faber, Kenneth B. Fallon, Mar0n R. Farlow, Steven Ferris, Mavhew P. Frosch, Douglas R. Galasko, Mary Ganguli, Marla Gearing, Daniel H. Geschwind, Bernardino Ghew, John R. Gilbert, Sid Gilman, Bruno Giordani, Jonathan D. Glass, John H. Growdon, Ronald L. Hamilton, Lindy E. Harrell, Elizabeth Head, Lawrence S. Honig, Chris0ne M. Huleve, Bradley T. Hyman, Gregory A. Jicha, Lee-‐Way Jin, Nancy Johnson, Jason Karlawish, Anna Karydas, Jeffrey A. Kaye, Ronald Kim, Edward H. Koo, Neil W. Kowall, James J. Lah, Allan I. Levey, Andrew P. Lieberman, Oscar L. Lopez, Wendy J. Mack, Daniel C. Marson, Frank Mar0niuk, Deborah C. Mash, Eliezer Masliah, Wayne C. McCormick, Susan M. McCurry, Andrew N. McDavid, Ann C. McKee, Marsel Mesulam, Bruce L. Miller, Carol A. Miller, Joshua W. Miller, Joseph E. Parisi, Daniel P. Perl, Elaine Peskind, Ronald C. Petersen, Wayne W Poon, Joseph F. Quinn, Ruchita A. Rajbhandary, Murray Raskind, Barry Reisberg, John M. Ringman, Erik D. Roberson, Roger N. Rosenberg, Mary Sano, Lon S. Schneider, William Seeley, Michael L. Shelanski, Michael A. Slifer, Charles D. Smith, Joshua A. Sonnen, Salvatore Spina, Robert A. Stern, Rudolph E. Tanzi, John Q. Trojanowski, Juan C. Troncoso, Vivianna M. Van Deerlin, Harry V. Vinters, Jean Paul Vonsavel, Sandra Weintraub, Kathleen A. Welsh-‐Bohmer, Jennifer Williamson, Randall L. Woltjer, Laura B. Cantwell, Beth A. Dombroski, Duane Beekly, Kathryn L. Luneva, Eden R. Mar0n, M. Ilyas Kamboh, Andrew J. Saykin, Eric M. Reiman, David A. Bennev, John C. Morris, Thomas J. Mon0ne, Alison M. Goate, Deborah Blacker, Debby W. Tsuang, Hakon Hakonarson, Walter A. Kukull, Ta0ana M. Foroud, Jonathan L. Haines, Richard Mayeux, Margaret A. Pericak-‐Vance, Lindsay A. Farrer & Gerard D. Schellenberg
436
Late-‐onset AD

Late-‐onset AD
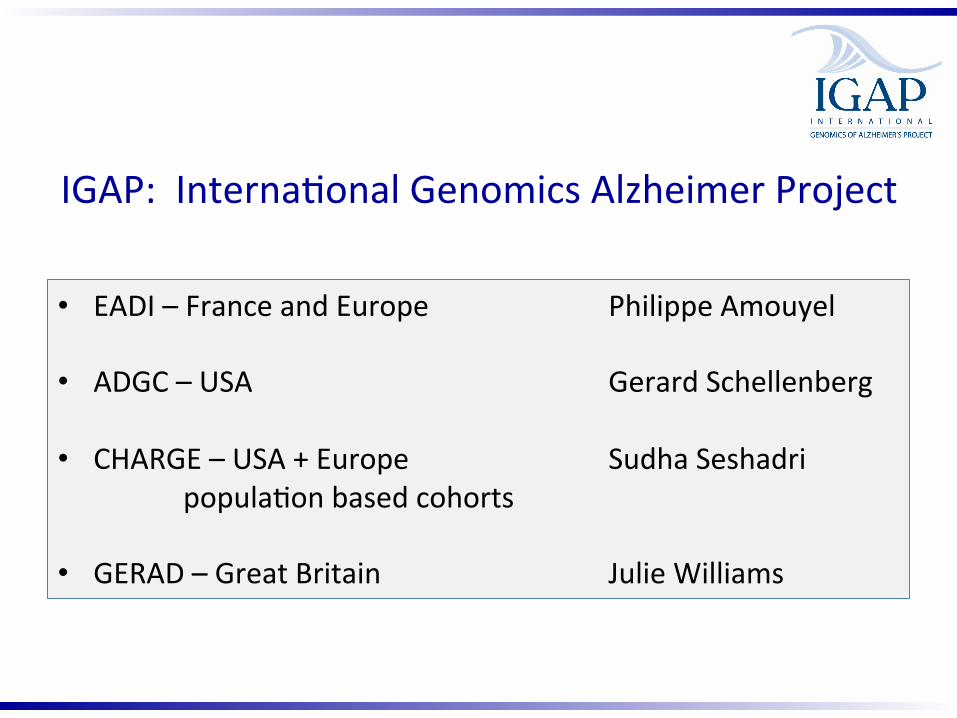
IGAP: Interna0onal Genomics Alzheimer Project
• EADI – France and Europe Philippe Amouyel • ADGC – USA Gerard Schellenberg
• CHARGE – USA + Europe Sudha Seshadri popula0on based cohorts
• GERAD – Great Britain Julie Williams

Stage 1: discovery data set genome-‐wide SNP arrays
Stage 2: custom chip from stage 1 data ~50,000 SNPs p < 0.001
Genotype: 9,282 new cases
11,159 new controls
IGAP Mega-‐meta analysis

CR1
BIN1
CD2AP
EPHA1
CLU
MS4A6A/4E
PICALM
ABCA7
APOE
CD33 HLA-‐DBR5 PTK2B SORL1
SLC24A4 CSS4A

1. APOE 2. SORL1 3. CR1 4. CLU 5. PICALM 6. BIN1 7. CD2AP 8. EPHA1 9. MS4A4A 10. ABCA7 11. HLA-‐DRB5/HLA-‐DRB1 12. PTK2B 13. SLC24A4/RIN3 14. CASS4 15. INPP5D 16. MEF2C 17. NME8 18. ZCWPW1 19. CELF1 20. FERMT2 21. TREM2L 22. GLIS3
Late-‐Onset AD Common variants

Chr 11: SORL1

Chr 6: HLA-‐DRB5/HLA-‐DRB1
~400 kb

Chr 7: ZCWPW1
~500 kb

Chr 11: CELF1
~900 kb

Chr 8 CLU/PTK2B
~350 kb

1. Only 20% of regulatory elements affect the closest gene
2. Mean distance between regulatory elements and gene target is 120 kb
3. Enhancer-‐promoter pairs can be separated by 1.4Mb (or more?)
4. Mul0ple enhancers can affect the same gene
5. Enhancers can affect more than one gene
gene promoter
regulatory element causal variant
GWAS signals: 90-‐95% of causa0ve variants are in non-‐promoter regulatory elements

African American GWAS Chr 5: rs145848414 OR = 2.03 (95% CI 1.69 – 3.09) 6.90 x 10-‐8
Reitz et al. JAMA 309, 1,483, 2013
MSX2 HMP19 rs145848414
137 kb 477 kb
neuron-‐specific protein family member 2 (HMP19) muscle segment homeobox 2 (MSX2)

• Which gene is a gene0c signal associated with
• Does the high risk allele increase expression? reduce levels of gene product /inhibit • Does the high-‐risk allele reduces expression? agonist • PCSK9 – protec0ve allele is a nonsense
muta0on reduce levels with a monoclonal anNbody

Source # subjects Washington University 501 ADNI 394 University of Washington 323 University of Pennsylvania 51
687 cogni0vely normal controls 591 AD cases 1,278 total
CSF markers Tau Ptau Aβ42

Closest Chr SNP MAF Gene tau ptau Aβ42 19 rs2075650 0.213 TOMM40 4.28 × 10-‐16 5.81 × 10-‐16 2.21 × 10-‐39 3 rs9877502 0.386 SNAR-‐I 4.98 × 10-‐9 1.68 × 10-‐7 0.022 9 rs514716 0.136 GLIS3 1.07 × 10-‐8 3.22 × 10-‐9 0.026 6 rs6922617 0.064 NCR2/ 2.55 × 10-‐5 3.58 × 10-‐8 3.69 × 10-‐3
TREM2L

Overall Closest gene MAF OR (95% CI) Meta P value
None 0.169 1.09 (1.05-‐1.13) 3.4 x 10-‐7 HS3ST1 0.300 1.08 (1.05-‐1.11) 6.6 x 10-‐8 SQSTM1 0.016 1.35 (1.20-‐1.52) 7.4 x 10-‐7 TREML2 0.297 0.93 (0.91-‐0.96) 6.3 x 10-‐7 NDUFAF6 0.469 1.07 (1.04-‐1.10) 8.0 x 10-‐8 ECHDC3 0.387 1.07 (1.04-‐1.10) 2.9 x 10-‐7 AP2A2 0.366 0.93 (0.91-‐0.96) 6.3 x 10-‐7 ADAMST20 0.406 1.07 (1.04-‐1.10) 3.0 x 10-‐7 IGH@ 0.103 0.87 (0.83-‐0.92) 2.7 x 10-‐7 SPPL2A 0.339 0.93 (0.91-‐0.96) 3.2 x 10-‐7 TRIP4 0.020 1.29 (1.17-‐1.42) 4.3 x 10-‐7 SCIMP 0.121 1.10 (1.06-‐1.15) 3.7 x 10-‐7 ACE 0.018 1.34 (1.20-‐1.50) 3.1 x 10-‐7
5 x 10-‐8 < P < 1 x 10-‐7 IGAP GWAS

Rare Variants -‐ Alzheimer’s disease
TREM2: triggering receptor expressed on myeloid cells 2
• Whole-‐genome sequencing • Whole-‐exom sequencing
frequency allele cases (n) controls (n) Odds ra0o (95% CI)
R47H 2.0% (1,091) 0.5% (1,105) 4.5 (1.7 – 11.9) R47H 0.63% (110,050) 2.26 (1.71 – 2.98) R47H 0.12% -‐ 0.19 (9,727) 2.83 (1.45 – 5.40)
Guerreiro et al. (2013) NEJM 368, 118 Jonson et al. (2013) NEJM 368, 107

Phospho-‐tau CSF biomarker quan0ta0ve trait Cruchaga et al. Neuron 78, 256 (2013) IGAP GWAS peak
Lambert et al. 2013
TREM2 region

APOE SORL1 TREM2 CR1 ABCA7 (?)
Common variant loci where we: • know the iden0ty of the gene • know at least one causal variants
Coding variants: • Missense • Nonsense • Stop-‐gain • Splicing
Non-‐coding variants: • Promoter • 3’UTR • Intragenic regulatory elements • External regulatory elements
Causal Variants

Cholesterol metabolism APOE, CLU, ABCA7
Immune response – innate and adap0ve
MS4A, CR1, HLA, TREM2 Synap0c dysfunc0on/membrane func0on
PICALM, BIN1, EPHA1 Intracellular protein trafficking – proteostasis
SORL1

Conclusions – AD and Biomarker GWAS
• GWAS signals can be complex
• Complex signals may be mul0ple enhancers ac0ng in the same gene
• Conclusions based on the closest gene can be misleading
• Methods to link enhancers to target genes are mature
• Rare variants iden0fied so far : Effect sizes greater than common variant signals Not fully penetrant

Genome-‐wide associa0on studies – common variants • APOE • AD status as a trait • Biomarkers (CSF) • Neuropathologic markers • Gene-‐gene interac0ons
Rare variants • Rare-‐variant associa0on studies • Sequence analysis
Associa0on studies in non-‐Caucasian popula0ons
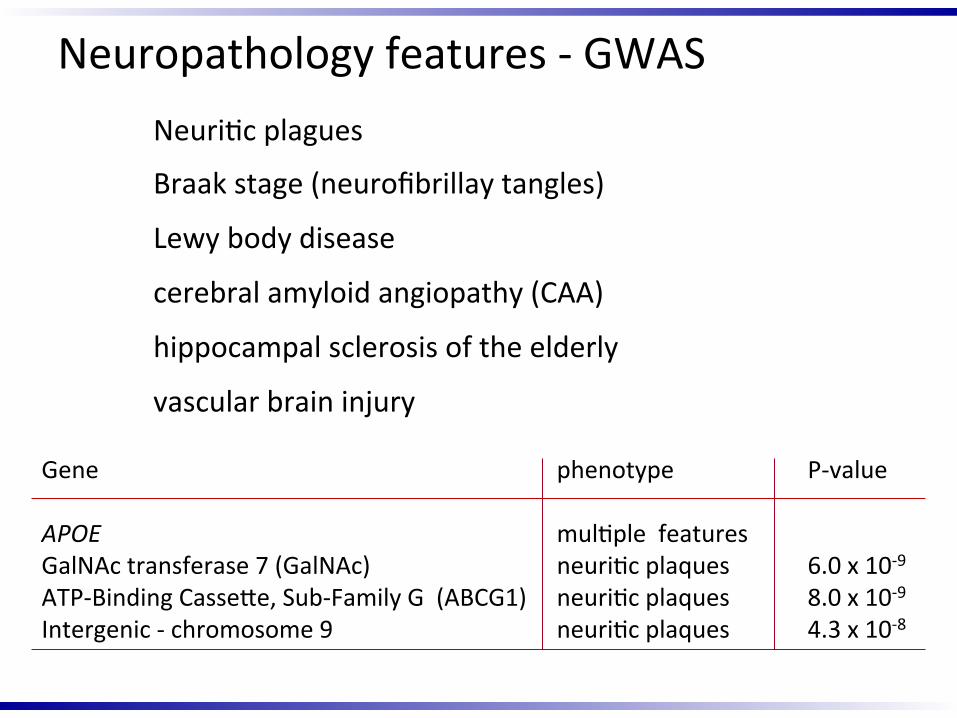
Neuri0c plagues
Braak stage (neurofibrillay tangles)
Lewy body disease
cerebral amyloid angiopathy (CAA)
hippocampal sclerosis of the elderly
vascular brain injury
Neuropathology features -‐ GWAS
Gene phenotype P-‐value APOE mul0ple features GalNAc transferase 7 (GalNAc) neuri0c plaques 6.0 x 10-‐9 ATP-‐Binding Casseve, Sub-‐Family G (ABCG1) neuri0c plaques 8.0 x 10-‐9 Intergenic -‐ chromosome 9 neuri0c plaques 4.3 x 10-‐8

Conclusions: neuropathology GWAS
• Neuropathology phenotypes can reveal loci not found in AD-‐trait studies
• Larger autopsy series are needed
• Quan0ta0ve measures of neuropathology traits are needed

Genome-‐wide associa0on studies – common variants • APOE • AD status as a trait • Biomarkers (CSF) • Neuropathologic markers • Gene-‐gene interac0ons
Rare variants • Rare-‐variant associa0on studies • Sequence analysis
Associa0on studies in non-‐Caucasian popula0ons

NIH Scrambling to Shib $50 Million Into Alzheimer's Research by Jocelyn Kaiser on 8 February 2012
$25 million dollars of “in kind” sequencing
Alzheimer’s Disease Sequencing Project ADSP

2003: ~ $2.7 billon 2011: ~$5,000 2012: ~$2,500 2013: ~$1,000
Human Genome Project Honda Accord (2003)
Your personal

Human Genome Project Honda Accord (2003)
2003: ~ $21,000 2012: ~$0.19 >
Your personal

Alzheimer’s Disease Sequencing Project (ADSP)
Whole exome sequencing: 5,000 unrelated cases 5,000 unrelated elderly controls 1,000 cases – mul0plex families 11,000 total
Whole-‐genome sequencing: 585 subjects from 111 mul0plex families (mul0ple case/family)
~2,500 whole genome sequences from non-‐NIH funding (e.g. ADNI)
hvps://www.niagads.org/node/116

Alzheimer’s Disease Sequencing Project ADSP
Mul0plex family study: 583 subjects from 111 mul0plex families Ra0onale: 1. Families are more likely to have AD variants
2. Can use co-‐segrega0on of sequence variants with AD to iden0fy disease-‐related sequence variants
30X Whole Genome Sequencing

Conclusions: Rare variant analysis
• 3 rare-‐variant genes known (late-‐onset)
• Work in progress

Genome-‐wide associa0on studies – common variants • APOE • AD status as a trait • Biomarkers (CSF) • Neuropathologic markers • Gene-‐gene interac0ons
Rare variants • Rare-‐variant associa0on studies • Sequence analysis
Associa0on studies in non-‐Caucasian popula0ons

Meta-‐analysis of top-‐ranked associa0on results with SORL1 in Japanese, Korean, and Caucasian datasets.
Japanese (Stage 1 + 2) Korean (Stage 3) Caucasian (Stage 4) Meta-‐Analysis SNP MAF OR (95% CI) MAF OR (95% CI) MAF OR (95% CI) OR (95% CI)
P value P value P value P value rs11218343 0.34 0.83 (0.75-‐0.92) 0.31 0.96 (0.79-‐1.17) 0.04 0.75 (0.67-‐0.83) 0.81 (0.75-‐0.87)
3.8 x 10-‐4 0.68 1.0 x 10-‐7 2.2 x 10-‐9 rs3781834 0.23 0.74 (0.66-‐0.84) 0.23 0.94 (0.75-‐1.16) 0.02 0.78 (0.68-‐0.90) 0.78 (0.72-‐0.85)
7.3 x 10-‐7 0.55 7.9 x 10-‐4 9.9 x 10-‐9

African American GWAS: Total Sample
Cases Controls Total
DNA received (ADGC genotyped) 1076 1909 3297
Genotypes contributed to ADGC 1243 2565 3808
Total All 2319 4474 7105

Gene SNP Chr Posi0on OR (95% CI) P Value
ABCA7 rs115550680 19 1,050,420 1.79 (1.47-‐2.12) 2.21 x 10-‐9
HMHA1 rs115553053 19 1,082,844 1.86 (1.49-‐2.32) 3.14 x 10-‐8
GRIN3B rs115882880 19 1,001,777 1.55 (1.32-‐1.81) 6.34 x 10-‐8
– rs145848414 5 174,014,114 2.29 (1.69-‐3.09) 6.90 x 10-‐8
African Americans ABCA7 OR = 1.79 (CI, 1.47 – 2.12), P = 2.21 x 10-‐9
Caucasians ABCA7 OR = 1.11 (CI, 1.11 – 1.19), P = 1.06 x 10-‐15

TREM2 Variants in Alzheimer's Disease Chris0ane Reitz, MD PhD;1,2,3, Richard Mayeux, MD MSc1,2,3,4,5 for the ADGC New Eng. J. Med. 369:1564-‐1570
Top SNP: rs7748513 • A allele: p=0.001, OR=0.86±0.05 • In strong LD (D’ = 0.99) with rs75932628 -‐ R47H
African Americans: 1,970 AD cases 3,932 controls
TREM2 gene-‐based analysis: p = 5.9 x 10 -‐4
Group MAF frequency
African Americans 0.43 European Caucasians <0.05

Conclusions: non-‐Caucasian studies
• Larger pa0ent groups are needed for all non-‐Caucasian groups
• Effect size (importance) are not the same
• Poten0ally reveal loci not seen in Caucasians
• Essen0al to understand mechanisms in all popula0ons – therapies/treatments may differ – predic0on may differ

Future AD gene0cs studies • Iden0fy addi0onal common variants
• Iden0fy genes associated with GWAS signals
• Gene-‐gene interac0ons
• Iden0fy addi0onal rare variants (associa0on analysis)
• Whole exome/whole genome sequencing (rare variants)
• Analyze addi0onal quan0ta0ve phenotypes Neuropathological features Clinical co-‐morbid condi0ons Imaging Environmental factors

Goal: comprehensive understanding of AD gene0cs
Gene Protein Mechanism/ Drug Pathway target

EADI Jean Charles Lambert Philippe Amouyel
GERAD Julie Williams
Paul Hollingworth Denise Harold Peter Holmes
NIA/NIH, Alzheimer’s Associa0on
ADGC Peggy Pericak-‐Vance Jonathan Haines Richard Mayeux Linsday Farrer Gyungah Jun Jacqueline Buros Gary Beecher Adam Naj Eden Mar0n Li-‐San Wang
CHARGE Sudha Seshadri Cornelia van Duijn Lenore Launer Ainta DeStefano

Bernadino Ghew Brad Hyman Denis Evans Eric Larson Paul Crane John Hardy Ilyas Kamboh Eric Reiman Nilifur Taner Julie Schneider Steve Younkin Denis Dickson Charlie DeCarli Douglas Galasko Elaine Peskind Neil Graff-‐Radford Mavhew Frosch John Trojanowski Vivianna Van Deelin John Morris
NACC Bud Kukull Duane Beekly
NCRAD Ta0ana Foroud Kelly Michelle Faber
University of Miami Peggy Pericak-‐Vance Adam Naj Gary Beecher Paul Gallins Eden Mar0n
Boston University Lindsey Farrer Gyungah Jun Jacqueline Buros
Case Western Jonathan Haines
University of Pennsylvania Li-‐San Wang Laura Cantwell Beth Dombroski Sherry Beecher
Familial AD Richard Mayeux Deborah Blacker
Clinical Group John Morris Debbie Tsuang
Neuropathology Group Tom Mon0ne Eric Reiman
Biomarker Group Alison Goate Andy Saykin
ProspecNve Cohort Group David Bennev
NIA/NIH, Alzheimer’s Associa0on


The End

Miami family 911


Cases Controls Cohort N percent Onset age N percent Age at exam Total
female mean (SD) female mean (SD) Japanese-‐1 1,008 72% 73.0 (4.3) 1,016 57% 77.0 (5.9) 2,024 Japanese-‐2 885 63% 74.3 (7.0) 985 63% 73.7 (5.8) 1,870 Korean 339 72% NA 1,129 49% 71.0 (4.9) 1,469 Caucasian 11,840 71% 76.4 (5.2) 10,931 59% 76.8 (3.6) 22,771 Totals 15,963 16,062 32,027
Cases Controls Cohort ε2 ε3 ε4 ε2 ε3 ε4
Japanese-‐1 0.02 0.63 0.33 0.04 0.87 0.09 Japanese-‐2 0.02 0.69 0.29 0.05 0.86 0.09 Korean 0.02 0.69 0.27 0.06 0.83 0.09 Caucasian 0.04 0.61 0.27 0.08 0.78 0.14


Cases Controls ADGC
ADC 2,354 843 ACT 269 983 CHAP 28 186 LOAD 0 164 MAP 136 299 Mayo 288 134 Miami 307 92 MIRAGE 322 12 NCRAD 101 0 ROS 78 210 TARCC 112 9 Vanderbilt 182 23 WHICAP 25 152
CHARGE 830 1919

Alzheimer’s Disease Sequencing Project (ADSP)
Families inves0gator(s) number of families NIA-‐LOAD: Richard Mayeux 18 Caribbean Richard Mayeux 67 Hispanics NCRAD: Ta0ana Foroud 4 Miami: Peggy Pericak-‐Vance 12 Seavle: Raskind/Schellenberg 7 Vanderbilt: Jonathan Haines 1 Erasmus: Cornelia Van Duijn 2 Total: 111
ADGC
CHARGE
501 cases, 84 unaffected, 583 total 553 from the ADGC inves0gators


Whole exome sequencing 5,000 unrelated cases
• selected as cases with the lowest risk explained by APOE and age -‐ young onset, APOE ε2/ε2, ε2/ε3, or ε3/ε3
• 4,220 from the ADGC • 2,430 from ADC’s
5,000 unrelated elderly cogni0vely normal controls • selected as controls least likely to convert to a case, based
on age, APOE, and autopsy data -‐ old, APOE ε2/ε2, ε2/ε3, or ε3/ε3 livle or no AD neuropathology
• 3,240 from the ADGC • 840 from the ADC’s
1,000 cases from mul0plex families – one/family • All from ADGC
hvps://www.niagads.org/node/116

Alzheimer’s Disease Sequencing Project (ADSP)
Replica0on
• 25,000 addi0onal cases • 25,000 addi0onal controls
• Targeted sequencing exons introns intergenic regions
ADGC + CHARGE + IGAP Collaborators
Selected based on results from WES/WGA

U Miami Columbia Seavle U Penn others
Large scale sequencing centers
Baylor Broad WashU
NCRAD
DNA
DNA Sample lists
phenotype data
ADGC CHARGE
Other sites
DNA
BAM VCF
dbGaP

U Miami Columbia Seavle U Penn others
Large scale sequencing centers
Baylor Broad WashU
NCRAD
DNA
DNA Sample lists
phenotype data
ADGC CHARGE
Other sites
DNA
dbGaP
Broad project level VCF Haplotyper -‐ GATK
Baylor project level VCF ATLAS
NIAGADS
Mirror site

phenotype data
phenotype data
ADGC CHARGE
U Miami Columbia Seavle U Penn others
Other sites
NIAGADS
phenotype data
NACC phenotype
data
dbGaP
Cleaned phenotype data
NIAGADS
Mirror site
VCF + phenotype VCF + phenotype
Phenotype Data

Alzheimer’s Disease Sequencing Project (ADSP) Progress
Whole genome sequencing • All samples at the sequence centers • ~400 completed -‐ data freeze – September • All 583 to be completed January, 2014
Whole exome sequencing • All samples are at the sequencing centers • QC completed • Limited sequencing is in progress • Comple0on expected – late 2014

n frequency n APOE Alzheimer’s disease 7,325 0.00007 1 3/3 Elderly controls 8,310 0.00006 1 3/3 Born in Iceland,
83 years old
Onset 89 years
Controls Group 1/OR P-‐value Frequency N Chip N in silico
AD 0.13% 2,199 849 AD vs pop controls 4.24 4.2 X 10-‐5 0.45% 57,174 22,074 AD vs popula0on 5.29 4.78 x 10-‐7 0.62% 7,653 1,350 controls >85 years AD vs cogni0vely intact 7.52 6.92 x 10-‐6 0.79% 827 40.7 controls at 85 year
n frequency n APOE Alzheimer’s disease 7,325 0.00007 1 3/3 Elderly controls 8,310 0.00006 1 3/3 Total 15,635
Born in Iceland, 83 years old
Onset 89 years

Rare Variants -‐ Alzheimer’s disease
PLD3: phospholipase D3 gene Whole-‐exom sequencing
frequency
allele cases (n) controls (n) Odds ra0o (95% CI)
V232M 1.64% (4,916) 0.79% (6,306) 2.10 (1.47–2.99)
2.62% 3.39 (2.14-‐5.39) 5.05 (2.38-‐10.41) 6.72 (2.59-‐17.52)
Cruchaga et al. (2014) Nature 505, 550

Rare Variants
Rare variants with modest effect sizes • Affect small propor0on of the popula0on • Significant informa0on on mechanism
Common variants with small effect sizes
• Many known • Addi0onal loci to iden0fy • Biology remains to be resolved
Next 5 years

Bernadino Ghew Brad Hyman Denis Evans Eric Larson Paul Crane John Hardy Ilyas Kamboh Eric Reiman Nilifur Taner Julie Schneider Steve Younkin Denis Dickson Charlie DeCarli Douglas Galasko Elaine Peskind Neil Graff-‐Radford Mavhew Frosch John Trojanowski Vivianna Van Deelin John Morris
NACC Bud Kukull Duane Beekly
NCRAD Ta0ana Foroud Kelly Michelle Faber
University of Miami Peggy Pericak-‐Vance Adam Naj Gary Beecher Paul Gallins Eden Mar0n
Boston University Lindsey Farrer Gyungah Jun Jacqueline Buros
Case Western Jonathan Haines
University of Pennsylvania Lauren Stutzbach Li-‐San Wang Laura Cantwell Beth Dombroski Sherry Beecher
Familial AD Richard Mayeux Deborah Blacker
Clinical Group John Morris Debbie Tsuang
Neuropathology Group Tom Mon0ne Eric Reiman
Biomarker Group Alison Goate Andy Saykin
ProspecNve Cohort Group David Bennev
NIA/NIH, Alzheimer’s Associa0on

EADI Jean Charles Lambert Philippe Amouyel
GERAD Julie Williams
Paul Hollingworth Denise Harold Peter Holmes
NIA/NIH, Alzheimer’s Associa0on
ADGC Peggy Pericak-‐Vance Jonathan Haines Richard Mayeux Linsday Farrer Gyungah Jun Jacqueline Buros Gary Beecher Adam Naj Eden Mar0n Li-‐San Wang
CHARGE Sudha Seshadri Cornelia van Duijn Lenore Launer Ainta DeStefano

ADSP Project experimental design power calcula0ons – drive design case/control selec0on family selec0on data flow planning database planning exis0ng gene0c data – submit to dbGap phenotype data – submit to dbGaP conference calls: 3-‐4/week, past 18 months DNA samples to sequencing centers
ADSP Project Gary Beecham Li-‐San Wang Amanda Partch Laura Cantwell Richard Mayeux Lindsay Farrer Peggy Pericak-‐Vance Jonathan Haines Wendy Raskind/Tom Bird Ta0ana Foroud Anita De’Stefano Marilyn Miller
ADGC NCRAD NACC NIAGADS

Late-‐onset AD
Genome-‐Wide Associa0on studies

The independent contribu0ons of dosage of the APOE ε4 allele to gene0c burden is roughly 3.1% of AAO varia0on (R2=0.220) while the cumula0ve effect of the nine LOAD risk variants is 0.93% (R2=0.198), together accoun0ng for approximately 4.1% of gene0c varia0on in AAO (R2=0.229). Excluding study-‐specific effects, APOE accounts for 3.9% of the remaining varia0on, the nine LOAD risk variants account for another 1.1%, for a combined contribu0on of 5% of the varia0on of AAO.

from 4,914 brain autopsies to define clinico-‐pathologic AD demen0a or controls, assess core neuropathologic features of AD (neuri0c plaques (NP) and neurofibrillary tangles (NFT)) in cases and controls, and evaluate commonly co-‐morbid neuropathologic changes: cerebral amyloid angiopathy (CAA), Lewy body disease (LBD), hippocampal sclerosis of the elderly (HS), and vascular brain injury (VBI). Genome wide significance was observed for clinco-‐pathologic AD demen0a, NP, NFT, CAA, and LBD with a number of variants in and around the apolipoprotein E gene (APOE); GalNAc transferase 7 (GALNT7), ATP-‐Binding CasseXe, Sub-‐Family G (WHITE), Member 1 (ABCG1), and an intergenic region on chromosome 9 with NP; and Potassium Large Conductance Calcium-‐Ac^vated Channel, Subfamily M, Beta Member 2 (KCNMB2) gene strongly with HS. Twelve of the 21 non-‐APOE gene0c risk loci for clinically-‐defined AD demen0a were confirmed in our clinico-‐pathologic sample: CR1, BIN1, CLU, MS4A6A, PICALM, ABCA7, CD33, PTK2B, SORL1, MEF2C, ZCWPW1, and CASS4 with 9 of these 12 loci showing larger ORs in the clinico-‐pathologic sample. Correla0on of effect sizes for risk of AD demen0a with effect size for NFT or NP were strongly posi0ve and linear, while those VBI showed a moderate nega0ve correla0on.


modifier genes? (e.g. onset age)
Early-‐onset AD APP early onset PSEN1 early-‐onset PSEN2 mixed early and late-‐onset

Genome-‐wide associa0on studies Late-‐onset AD
• Test all regions of the genome simultaneously -‐ genes, intergenic regulatory elements
• Hypothesis – common alleles contribute to disease risk • Genotype 700,000 or more 2-‐allele SNPs
• Account for popula0on and study heterogeneity
• Large sample ( > 3,000 cases)
• Stringent criteria for associa0on (P < 5 x 10-‐8)

Ac0ve Subjects Ac0ve Subjects Ac0ve Subjects on GWAS List with Sample with no sample
Totals 14,784 7,910 6,874
All new subjects

Cohort Cases Autopsies Age-onset (mean + SD)
Age last exam (mean + SD) Controls Autopsies:
n (percent) Age at last exam (mean + SD)
ACT 566 70 (12%) 83.90 (4.8) 84.72 (4.9) 1696 155 (9%) 81.08 (6.0) ADC1 1566 1566 (100%) 72.47 (7.1) 81.61 (7.0) 515 515 (100%) 75.00 (8.0) ADC2 738 195 (26%) 73.19 (7.1) 80.06 (7.2) 160 0 (0%) 75.68 (7.9) ADC3 897 527 (59%) 75.00 (8.5) (8.9) 588 4 (1%) 75.30 (9.8) ADNI 268 0 (0%) 75.30 (7.2) 77.96 (6.5) 173 0 (0%) 78.6 (5.5) GenADA 669 9 (1%) 74.59 (6.2) 80.36 (6.2) 713 0 (0%) 74.21 (7.0) UM/VU/MSSM 1186 409 (34%) 74.06 (7.8) 77.48 (6.9) 1135 136 (12%) 74.00 (8.3) MIRAGE 509 0 (0%) 71.16 (6.5) 75.97 (6.6) 753 0 (0%) 72.04 (7.2) NIA-LOAD 1811 492 (27%) 73.57 (6.7) 82.49 (7.1) 1575 50 (3%) 73.99 (8.5) OHSU 132 132 (100%) 86.10 (5.5) 90.40 (5.2) 153 153 (100%) 83.86 (7.6) TGEN2 864 864 (100%) 74.91 (7.2) 82.00 (7.6) 493 493 (100%) 80.19 (8.7) MAYO 728 221 (30%) ND 73.89 (4.9) 1173 216 (18%) 73.30 (4.4) ROSMAP 296 291 (98%) 85.59 (6.3) 89.83 (5.7) 776 0 (0%) 82.03 (7.0) UP 1271 ? (24%) 72.91 (6.4) 77.38 (6.3) 841 0 (0%) 75.37 (6.1) WU 339 0 (0%) ND 74.24 (8.0) 187 0 (0%) 76.85 (8.4)
Total 11,840 4,776 (40%) -- -- 10,931 1,722 (16%) --
Alzheimer’s Disease Gene0cs Consor0um

Stages 1 and 2 and joint analysis Conditioned on rs8070723 (H1/H2)
-log1
0(P
)
Rec
ombi
natio
n ra
te (c
M/M
b)
17q21.31 (kb)
MAPT
MAPT
NSF exons 1-13
NSF exons 1-21
NSF exons 1-21
NSF exons 1-13
H1
Stefansson et al (2005) Nature Genet. 37, 129
H2

30 ADCs
data
Alzheimer’s Disease Center
Samples
subject lists
Ta0ana Foroud NCRAD
blood DNA 0ssue
gene0c studies publish
NIAGADS Li-‐San Wang
Bud Kukull
DNA
genotypes sequence
phenotype data
ADGC Lindsay Farrer Jonathan Haines Richard Mayeux
Peggy Pericak-‐Vance Jerry Schellenberg
NACC

gene0c studies publish
NIAGADS Li-‐San Wang
genotypes sequence
ADGC Lindsay Farrer Jonathan Haines Richard Mayeux
Peggy Pericak-‐Vance Jerry Schellenberg
30 ADCs
data
Alzheimer’s Disease Center
Samples
subject lists
Ta0ana Foroud NCRAD
blood DNA 0ssue
Bud Kukull
DNA
phenotype data
NACC Other cohorts
phenotype data genotype data
DNA

Cohort Cases Controls
ADC1 1,566 515
ADC2 738 160
ADC3 897 588
ADC4 322 371
ADC5 293 514
ADC6 213 550
Totals 4,029 2,698
Alzheimer’s Disease Center
samples
AD cases Controls Consor0um N % women Mean N % women Mean Age
Onset Age at last exam ADGC 10,273 42-‐70 71–86 10,892 37–72 72–84 (13 cohorts)
ADGC cohorts: Alzheimer’s disease centers case-‐control studies family-‐based cohorts

modifier genes: APOE
other genes?
Early-‐onset AD APP early onset PSEN1 early-‐onset PSEN2 mixed early and late-‐onset

Chr band Gene SNP
Stage 1 Stage 2 Joint
P P OR/CI P
1q25 STX6 rs1411478 1.8 x 10-‐9 1.5 x 10-‐3 0.79 0.74 – 0.85 2.3 x 10-‐10
2p11 EIF2AK3 rs7571971 7.4 x 10-‐7 8.7 x 10-‐8 0.85 0.69 – 0.81 3.2 x 10-‐13
3p22 MOBP rs1768208 1.0 x 10-‐11 1.3 x 10-‐8 0.72 0.67 – 0.78 1.0 x 10-‐16
17q21 MAPT
rs8070723 2.1 x 10-‐51 4.8 x 10-‐67 5.64 4.72 – 6.31 1.5 x 10-‐116
rs242557 2.2 x 10-‐37 5.0 x 10-‐35 0.51 0.47 – 0.55 4.2 x 10-‐70
rs8070723/ rs242557 1.3 x 10-‐11 6.3 x 10-‐8 0.70
0.65 – 0.76 9.5 x 10-‐18
PSP GWAS Results

AD cases Controls
Austria 223 837 Belgium 944 694 Finland 508 611 Germany 486 1,376 Greece 282 282 Hungria 172 127 Italy 1,986 940 Spain 2,202 2,157 Sweden 825 1,543 UK 1,035 1,069 USA 619 1,523
TOTAL 9,282 11,159
UK: 3,012 individuals from UK without clinical informa0on USA: 646 individuals from Honolulu without clinical informa0on
Stage 2 -‐ Replica0on

AD cases Controls Consor0um N % women Mean N % women Mean Age
Onset Age at last exam ADGC 10,273 42-‐70 71–86 10,892 37–72 72–84 (13 cohorts)
CHARGE 1,315 50–75 80–86 21,776 45–62 69–76 (4 cohorts)
EADI 2,243 64.9 68.5 (8.9) 6,017 60.7 74.0 (5.4) GERAD 3,177 64.0 73.0 (8.5) 7,277 51.8 51.0 (11.8) Totals 17,008 45,962
ADGC cohorts: Alzheimer’s disease centers case-‐control studies family-‐based cohorts
CHARGE: Roverdam Study Framingham Age, Gene, Environment Study Cardiovascular Health Study
Stage 1 Subjects
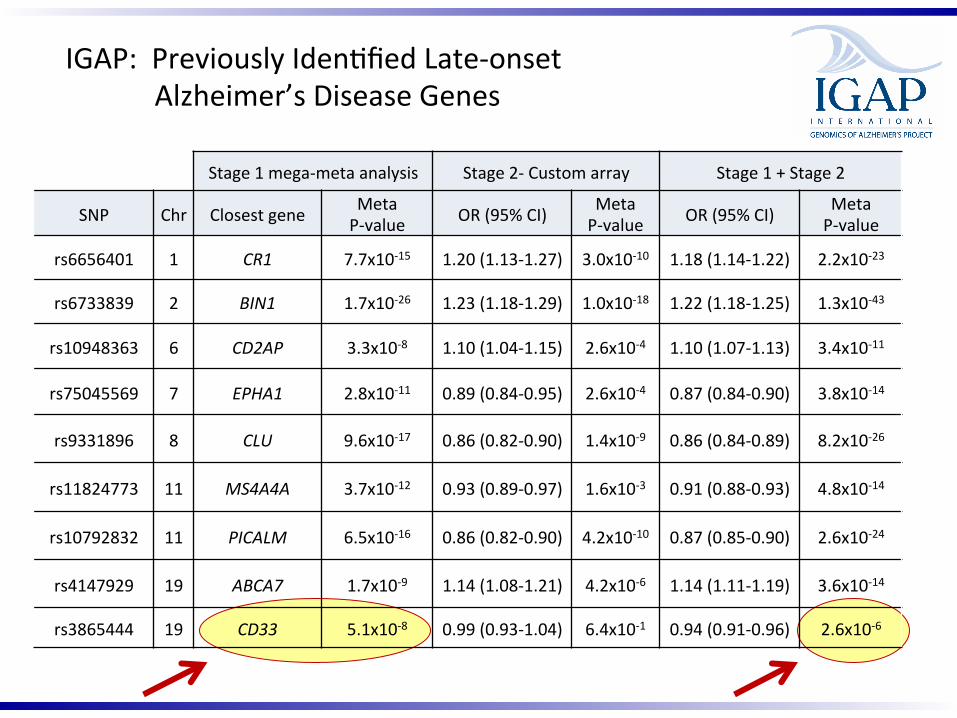
Stage 1 mega-‐meta analysis Stage 2-‐ Custom array Stage 1 + Stage 2
SNP Chr Closest gene Meta P-‐value OR (95% CI) Meta
P-‐value OR (95% CI) Meta P-‐value
rs6656401 1 CR1 7.7x10-‐15 1.20 (1.13-‐1.27) 3.0x10-‐10 1.18 (1.14-‐1.22) 2.2x10-‐23
rs6733839 2 BIN1 1.7x10-‐26 1.23 (1.18-‐1.29) 1.0x10-‐18 1.22 (1.18-‐1.25) 1.3x10-‐43
rs10948363 6 CD2AP 3.3x10-‐8 1.10 (1.04-‐1.15) 2.6x10-‐4 1.10 (1.07-‐1.13) 3.4x10-‐11
rs75045569 7 EPHA1 2.8x10-‐11 0.89 (0.84-‐0.95) 2.6x10-‐4 0.87 (0.84-‐0.90) 3.8x10-‐14
rs9331896 8 CLU 9.6x10-‐17 0.86 (0.82-‐0.90) 1.4x10-‐9 0.86 (0.84-‐0.89) 8.2x10-‐26
rs11824773 11 MS4A4A 3.7x10-‐12 0.93 (0.89-‐0.97) 1.6x10-‐3 0.91 (0.88-‐0.93) 4.8x10-‐14
rs10792832 11 PICALM 6.5x10-‐16 0.86 (0.82-‐0.90) 4.2x10-‐10 0.87 (0.85-‐0.90) 2.6x10-‐24
rs4147929 19 ABCA7 1.7x10-‐9 1.14 (1.08-‐1.21) 4.2x10-‐6 1.14 (1.11-‐1.19) 3.6x10-‐14
rs3865444 19 CD33 5.1x10-‐8 0.99 (0.93-‐1.04) 6.4x10-‐1 0.94 (0.91-‐0.96) 2.6x10-‐6
IGAP: Previously Iden0fied Late-‐onset Alzheimer’s Disease Genes

Stage 1 mega-‐meta analysis Stage 2-‐ Custom array Stage 1 + Stage 2
SNP Chr Closest Gene Meta P-‐value OR (95% CI) Meta
P-‐value OR (95% CI) Meta P-‐value
6:32,578,476 6 HLA-‐DRB5/HLA-‐DRB1 1.7x10-‐8 1.14 (1.08-‐1.20) 6.3x10-‐7 1.12 (1.09-‐1.16) 6.5x10-‐14
rs28834970 8 PTK2B 3.3x10-‐9 1.11 (1.06-‐1.16) 1.5x10-‐5 1.10 (1.07-‐1.13) 2.2x10-‐13
rs11218343 11 SORL1 5.0x10-‐11 0.82 (0.73-‐0.92) 6.6x10-‐4 0.78 (0.73-‐0.83) 1.9x10-‐13
rs10498633 14 SLC24A4/RIN3 1.5x10-‐7 0.92 (0.87-‐0.98) 4.5x10-‐3 0.91 (0.88-‐0.94) 3.1x10-‐9
rs8093731 18 DSG2 4.6x10-‐8 1.03 (0.80-‐1.32) 8.2x10-‐1 0.72 (0.61-‐0.84) 7.5x10-‐5
rs927174 20 CASS4 1.5x10-‐8 0.93 (0.87-‐1.02) 1.2x10-‐1 0.89 (0.85-‐0.92) 1.7x10-‐8
IGAP: Meta-‐analysis Late-‐onset Alzheimer’s Disease Genes Confirmed in Second Stage
HLA-‐DRB1/5 major histocompa^bility complex class II DR beta 1/5 PTK2B protein tyrosine kinase 2 beta SORL1 Sor^lin-‐related protein 1 SLC24A4 solute carrier family 24 (sodium/potassium/calcium exchanger) member 4 RIN3 Ras and Rab interactor 3 CASS4 Cas scaffolding protein family member 4

Stage 1 mega-‐meta analysis Stage 2-‐ Custom array Stage 1 + Stage 2
SNP Chr Closest Gene Meta P-‐value OR (95% CI) Meta
P-‐value OR (95% CI) Meta P-‐value
2 INPP5D 9.6 x 10-‐5 1.10 (1.05 – 1.15) 5.7 x 10-‐5 1.08 (1.05-1.11) 3.2x10⁻⁸
5 MEF2C 2.5 x 10-‐6 0.93 (0.89 – 0.98) 3.4 x 10-‐3 0.93 (0.90-0.95) 3.2x10⁻⁸
7 NME8 1.3 x 10-‐5 0.91 (0.87 – 0.95) 6.3 x 10-‐5 0.93 (0.90-0.95) 4.8x10⁻⁹
7 ZCWPW1 7.4 x 10-‐6 0.89 (0.85 – 0.94) 9.7 x 10-‐6 0.91 (0.89-0.94) 5.6x10⁻¹⁰
11 CELF1 6.7 x 10-‐6 1.09 (1.04 – 1.14) 4.0 x 10-‐4 1.08 (1.05-1.11) 1.1x10⁻⁸
14 FERMT2 1.0 x 10-‐5 1.17 (1.08 – 1.26) 1.6 x 10-‐4 1.14 (1.09-1.19) 7.9x10⁻⁹
IGAP: Meta-‐analysis Late-‐onset Alzheimer’s Disease Genes Confirmed in Second Stage
INPP5D: inositol polyphosphate-‐5-‐phosphatase MEF2C: myocyte enhancer factor 2C NME8: thioredoxin domain containing 3 ZCWPW1: zinc finger, CW type with PWWP domain 1 CELF1; CUGBP, Elav-‐like family member 1 FERMT2; fermi0n family member 2

Iden0fy regulatory element variants
• eQTL analysis
• Use 3C/5C to link to promoter/gene
• Test in enhancer assays
• Alter enhancer in cell-‐based assays
• Alter enhancer in animal models (if conserved)

Model Chr SNP Default +Aβ42 +CDR + APOE
3 rs9877502 1.68 x 10-‐7 5.62 x 10-‐7 2.47 x 10-‐7 4.60 x 10-‐7 9 rs514716 2.99 x 10-‐9 4.14 x 10-‐7 3.76 x 10-‐8 2.00 x 10-‐8 6 rs6922617 3.58 x 10-‐8 2.34 x 10-‐6 3.49 x 10-‐7 1.66 x 10-‐6
Closest Chr SNP MAF Gene tau ptau Aβ42 19 rs2075650 0.213 TOMM40 4.28 × 10-‐16 5.81 × 10-‐16 2.21 × 10-‐39 3 rs9877502 0.386 SNAR-‐I 4.98 × 10-‐9 1.68 × 10-‐7 0.022 9 rs514716 0.136 GLIS3 1.07 × 10-‐8 3.22 × 10-‐9 0.026 6 rs6922617 0.064 NCR2/ 2.55 × 10-‐5 3.58 × 10-‐8 3.69 × 10-‐3
TREM2L
Related Documents